holiday - retirement systems of alabamaoutdoor partners, a limited partnership that purchased...
TRANSCRIPT


The Boards of Control and the RSA staff are pleased to present the Twenty-ninth Annual Report of the Retirement Systems of Alabama (RSA) for the fi scal year ended September 30, 2004.
The RSA currently manages 19 funds with aggregate assets of approximately $26.6 billion. During fi scal year 2004, the annualized return for the fi xed income portfolio and equity portfolio combined was 10.71% for the Teachers’ Retirement System (TRS), 10.06% for the Employees’ Retirement System (ERS), and 11.34% for the Judicial Retirement Fund (JRF), which had the highest equity weighting. TRS assets total $16.7 billion, while ERS assets total $7.7 billion, and JRF assets total $220.0 million. The TRS and ERS plans remain adequately funded at 93.6% and 91.1% per 2003 actuarial reports. The soundness of the RSA is refl ected in the fact that investment earnings net all losses totaled $5.3 billion over the last two fi scal years.
During the fi scal year, the RSA expanded its holdings in the media sector by investing in ACON Outdoor Partners, a limited partnership that purchased Tri-State Outdoor Advertising, now re-named Magic Media. The seventh largest outdoor advertising company in the U.S., Magic Media has 13,000 displays,
The Retirement Systems of Alabama ~ 2004 ANNUAL REPORT

primarily billboards, across the country. In addition to a good rate of return in a solid industry, the RSA will have the right to select up to 50 lighted billboards for use by the RSA, which will be a great addition to our newspaper and television advertising for the improvement of Alabama tourism.
Real estate continued to be an active area for the RSA during the fi scal year. In Mobile, the RSA has helped to fund and advertise the city’s waterfront terminal development. Carnival Cruise Lines is home porting the Holiday at the Mobile terminal and is scheduling 72 three-, four- and fi ve-day cruises per year. The Renaissance Ross Bridge Golf Resort and Spa on the Robert Trent Jones Golf Trail and the golf course in Hoover are scheduled to be completed in the spring and are located next to the Oxmoor Valley courses in Birmingham. The four-star hotel will contain a spa, three-level pool, conference center and clubhouse. In Northwest Alabama, the Shoals project, the ninth site on the Trail, is the newest site with 18 holes now open. The entire 36-hole facility and four-star Marriott Shoals Hotel and Spa, and Conference Center on the Robert Tent Jones Golf Trail is scheduled for completion in the spring.
Finally, after two years of legal dispute, the RSA won a settlement of its lawsuit against the fi nancial advisors of WorldCom, Inc., receiving $111 million, or 90% of the amount it was suing to collect. The normal settlement in such litigation is usually only fi ve to ten cents on the dollar. The RSA has and will continue to be committed to preserving the integrity of the fi nancial markets, including the pursuit of Enron.
The staff will continue to purchase and develop investments that will facilitate the mission of the RSA. Our aim is to serve the interests of our members by preserving the excellent benefi ts and soundness of the Systems while providing these at the least expense to the State of Alabama and all Alabama taxpayers. With the continued cooperative efforts of the Boards of Control, the RSA staff, and the Legislature, this goal will be achieved.
David G. BronnerCHIEF EXECUTIVE OFFICER
Alabama Cruise Terminal The Alabama Cruise Terminal opens in Mobile, with Carnival Cruise Lines’ Holiday in port.
LETTER FROM THE CEO ~ 1

The Retirement Systems of Alabama ~ 2004 ANNUAL REPORT
RSA BATTLEHOUSE TOWER / FOUNDATION POUR, MOBILEThe Battlehouse Tower and Hotel will be completed in 2006.
Cover artwork of the RSA Tower in Montgomery is by artist Barbara Brache Pegues.

Table of ContentsFoundation for the Future ..........................................................................................................................................4Teachers’ and Employees’ Retirement System Boards of Control ...........................................................................8Staff, Advisors, and Medical Board ..........................................................................................................................10Legal & Legislation ...................................................................................................................................................11Communications .......................................................................................................................................................12
INVESTMENTSRSA Overview ............................................................................................................................................................14Teachers’ Retirement System (TRS) Benefi ts Administration .................................................................................16Employees’ Retirement System (ERS) Benefi ts Administration .............................................................................18Judicial Retirement Fund (JRF) Benefi ts Administration ........................................................................................20Public Employees’ Individual Retirement Account Fund (PEIRAF / RSA-1) ...........................................................22Public Education Employees’ Health Insurance Plan (PEEHIP) ...............................................................................24Investment Staff ........................................................................................................................................................25Fixed Income Activity ................................................................................................................................................26Maturity Structure / Quality Evaluation ..................................................................................................................27Equity Strategy ..........................................................................................................................................................28Investment Returns ...................................................................................................................................................29
FINANCIAL STATEMENTSTeachers’ Retirement System ...................................................................................................................................30Employees’ Retirement System ................................................................................................................................32Judicial Retirement Fund ..........................................................................................................................................34
Commissions Paid Report .........................................................................................................................................36
TABLE OF CONTENTS ~ 3
Retirement Systems of Alabama

The Retirement Systems of Alabama ~ 2004 ANNUAL REPORT

RSA / FOUNDATION ~ 5
Retirement Systems of Alabama
ROBERT TRENT JONES GOLF TRAIL / ANNISTON-GADSDEN / SILVER LAKES • HEARTBREAKER, 8th Hole © 2004 Lawrence Michael Clemmer
RSA FOUNDATION
Tourism produces over $6.8 billion in revenue for the state of Alabama compared to $1.8 billion eleven years ago. The Robert Trent Jones Golf Trail is one of the building blocks that helped establish Alabama as a tourist destination.

The Retirement Systems of Alabama ~ 2004 ANNUAL REPORT

RSA / FOR THE FUTURE ~ 7
Retirement Systems of Alabama
ROBERT TRENT JONES GOLF TRAIL / HOOVER / OXMOOR VALLEY • VALLEY COURSE, 16th Hole © 2004 Lawrence Michael Clemmerinsets: Renaissance Ross Bridge Golf Resort and Spa in Hoover and the Marriott Shoals Hotel and Spa in Florence
RSA for the FUTURE
By investing in Alabama, the RSA is setting in motion the foundation for a strong and vibrant state that will continue to grow and strengthen for future generations.

The Retirement Systems of Alabama ~ 2003 ANNUAL REPORT
2004 TEACHERS’ RETIREMENT SYSTEM BOARD OF CONTROL
ROBERT TRENT JONES GOLF TRAIL / ANNISTON-GADSDEN / SILVER LAKES • SHORT COURSE, 8th Hole © 2004 Lawrence Michael Clemmer
The Retirement Systems of Alabama ~ 2004 ANNUAL REPORT
CHAIRMAN
Dr. Paul R. HubbertEXECUTIVE SECRETARYAEA; EX OFFICIO
Dr. Joseph MortonSTATE SUPERINTENDENTOF EDUCATION; EX OFFICIO
Dr. Susan Williams BrownPOSTSECONDARY POSITION
Mrs. Peggy K. LambTEACHER POSITION
Mrs. Sharon P. SaxonSUPPORT PERSONNEL POSITION
Dr. J. Terry JenkinsSUPERINTENDENT POSITION
Mr. Clyde GoodePRINCIPAL POSITION
Mr. Russell J. TwilleySUPPORT PERSONNEL POSITION
Mrs. Judy BellTEACHER POSITION
VICE CHAIRMAN
Mrs. Sarah S. SwindleRETIRED POSITION
Dr. Wayne TeagueRETIRED POSITION
Ms. Judy RigdonTEACHER POSITION
Mr. Jim MainSTATE FINANCE DIRECTOREX OFFICIO
SERVE ON BOTHTHE TRS and ERSBOARDS OF CONTROL

Retirement Systems of Alabama
TRS AND ERS BOARDS OF CONTROL ~ 9
RSA BOARD and STAFF PHOTOGRAPHY © 2004 Tim L. Phillips, CCP
2004 EMPLOYEES’ RETIREMENT SYSTEM BOARD OF CONTROL
Hon. Kay IveySTATE TREASUREREX OFFICIO
Mr. Robert H. PruitGOVERNOR APPOINTEE
Hon. Thomas G. FlowersSTATE PERSONNEL DIRECTOREX OFFICIO
CHAIRMAN
Hon. Bob RileyGOVERNOREX OFFICIO
Ms. Mary Lou FosterRETIRED STATE EMPLOYEE
Ms. Alice ThorntonACTIVE STATE EMPLOYEE
Mr. Clyde A. SellersRETIRED LOCAL EMPLOYEE
Mr. Stephen C. WalkleyACTIVE STATE EMPLOYEE
VICE CHAIRMAN
Mr. John H. Wilkerson, Jr.GOVERNOR APPOINTEE
Mrs. Ann GantACTIVE LOCAL EMPLOYEE
Mr. Ronald MatthewsACTIVE LOCAL EMPLOYEE
Mr. Robert S. MillerGOVERNOR APPOINTEE

CHIEF EXECUTIVE OFFICER
David G. Bronner, Ph.D., J.D.
DEPUTY DIRECTOR
Marcus H. Reynolds, Jr., J.D.
Glenn Yates, M.D.
CHAIRMAN
Neil Stronach, M.D.
The Retirement Systems of Alabama ~ 2004 ANNUAL REPORT
2004 STAFF, ADVISORS and MEDICAL BOARD
THE RETIREMENT SYSTEMS OF ALABAMA
MEDICAL BOARD
ADMINISTRATIVE STAFF
ADVISORS
Malcolm Brown, M.D.
DIRECTOR OF INFORMATION TECHNOLOGY SERVICES
Peggi L. DouglassM.B.A.
CHIEF ACCOUNTANT AND FISCAL OFFICER
Norman D. TurnipseedM.B.A., C.P.A.
GENERAL COUNSEL
William F. Kelley, Jr.J.D.
GENERAL COUNSEL
William T. StephensJ.D.
DIRECTOR OF COMMUNICATIONS
Michael E. PeguesM.A.
TEACHERS’ RETIREMENT EXECUTIVE
Donald L. YanceyM.P.A., J.D.
EMPLOYEES’ & JUDICIALRETIREMENT EXECUTIVE
R. Donald NelsonM.S.DIRECTOR OF PUBLIC EDUCATIONEMPLOYEES’ HEALTH INSURANCE PLAN
Lee M. HayesM.B.A.
CERTIFIED PUBLIC ACCOUNTANTSKPMG
AMSOUTH BANK, N.A.Mr. Brian Sullivan
ATTORNEY GENERAL
Hon. Troy King
CHIEF EXAMINER
Mr. Ronald L. Jones
LEGISLATIVE COUNSEL
Lindy J. BealeJ.D.
MELLON HR&IS
Mr. Edward A. MacDonald
DIRECTOR OF RSA-I
Teresa B. PettusB.S.
ROBERT TRENT JONES GOLF TRAIL / HUNTSVILLE / HAMPTON COVE • SHORT COURSE, 1st Hole © 2004 Lawrence Michael Clemmer

RSA STAFF, ADVISORS, AND MEDICAL BOARD / LEGAL & LEGISLATION ~ 11
Retirement Systems of Alabama
RSA CRIMINAL JUSTICE CENTER / MONTGOMERYThis center opened in 2004 and houses the Department of Public Safety, Corrections, and Pardons and Paroles. © 2004 Tim L. Phillips, CCP
Legal
As RSA’s investments continue to grow and diversify so does RSA’s legal work, with securities litigation and airline issues dominating the year for the legal staff.
To protect RSA’s assets and the integrity of the marketplace, the RSA has continued to actively pursue the perpetrators, aiders and abettors of securities fraud. As an individual plaintiff in state court in the Enron and WorldCom scandals and as lead plaintiff in national class action securities fraud cases in federal court relating to HealthSouth, ICG Communications, and Providian Financial Corporation, we have won major, precedent setting decisions in several of these cases.
The legal staff continued to be involved in issues relating to US Airways, including bankruptcy proceedings and governance of US Airways. Efforts relating to RSA’s other aviation interests include the disposition of aircraft interests, which reverted to the RSA from US Airways and United Airlines.
Several of RSA’s other investments, particularly its developments in Mobile, Hoover, Montgomery and the Shoals, have created a myriad of legal issues and challenges, including some litigation. However, all have been, to date, resolved satisfactorily to facilitate RSA’s investment and development. In addition, the legal staff addressed legal issues which continue to arise on RSA’s mature investment development projects, including the RTJ Golf Trail. Also, there were issues relating to potential development projects and those issues continue to be addressed successfully.
While the RSA again won signifi cant court decisions in benefi ts litigation in state court, the RSA legal staff spent a signifi cant amount of time advising the various RSA divisions on compliance with state and federal laws and regulations. This will help avoid unnecessary litigation and ensure that our members get the benefi ts to which they are entitled while protecting against fraud and abuse. During the past year, the RSA legal staff has provided advice and guidance on numerous issues in the areas of benefi ts, both generally and with respect to specifi c individual accounts, administration, taxation, real estate, contracts, privacy rights, personnel, etc.
LegislationThe 2004 Regular Legislative Session ended on Monday, May
17, 2004. It was a long and contentious session, but ended on a very good note for the Retirement Systems of Alabama. The Governor began the session espousing “accountability” reform, and while he never defi ned this term, it became clear very quickly from the
legislation either introduced or supported by his Administration that it meant that teachers and state employees were the target. His accountability reform included taking away state holidays, longevity pay and a portion of annual and sick leave. As for retirement issues, his Administration wanted to end the DROP program and replace 25-year retirement with either a 30-year retirement or a Rule of 85. Additionally, he wanted to give both teachers and state employees a pay cut by immediately increasing their health insurance costs.
While a long and hard fought session, none of the Governor’s bills were successful. Both the General Fund Budget and the Education Trust Fund Budget passed and the Teachers’ Retirement Systems and the Employees’ Retirement Systems were funded at their actuarial recommended rates. Likewise, PEEHIP was funded at the requested rate. As pertains to the ERS, several more constitutional amendments passed that if approved by the voters, would allow elected offi cials in that county to join the retirement system. These would include Blount County (Act 2004-231), Madison County (Act 2004-543), Clark County (Act 2004-393), Monroe County (Act 2004-240), and Limestone County (Act 2004-389). This would bring the number of counties participating to almost 50 and continues the trend of abolishing supernumerary positions on a county by county basis through the enactment of local constitutional amendments. Also, Act 2004-362 was passed which removed the one-year limitation period authorizing these public offi cials to purchase any prior service credit.
As concerns PEEHIP, Act 2004-539 was passed to establish the Alabama Prescription Cost Initiative Board to negotiate lower prescription costs for state programs.

The Retirement Systems of Alabama ~ 2004 ANNUAL REPORT
CNHI WeekliesCNHI Dailies
RAYCOM Properties
COMMUNICATIONSCOMMUNICATIONS
Both Raycom Media and Community Newspaper Holdings, Inc. are located in Alabama. Raycom owns 31 TV stations and operates 4 others in 19 states and Puerto Rico. CNHI publishes 295 daily, weekly, semi-weekly, and specialty newspapers across the U.S.
RSA-1 Enrollment Packet

COMMUNICATIONS ~ 13
The RSA Web site continues to provide RSA members with valuable information regarding their retirement benefi ts.
Retirement Preparation Seminars continued to be a great success with 1,278 members attending 20 ERS seminars and 1,015 attending 19 TRS seminars.
Agency Seminars for payroll and personnel offi cers were also well attended in 2004 with 307 offi cers at 5 ERS seminars and 309 offi cers at 8 TRS and PEEHIP seminars.
Individual Counseling Sessions were conducted around the state with 18 ERS counseling days for 226 members and 93 TRS counseling days for 1,268 members.
Securing a Better Tomorrow with RSA-1. Enrollment packets provide easy-to-use information for members seeking to enhance their personal savings plans.
ERS and TRS Member Handbooks were updated.
Retirement Systems of AlabamaRetirement Systems of Alabama
ROBERT TRENT JONES GOLF TRAIL / HUNTSVILLE / HAMPTON COVE • RIVER COURSE, 1st Hole © 2004 Lawrence Michael Clemmer
Communications
In an effort to better inform and improve overall access to benefi t information, fi scal year 2004 continued to be as active as the previous year for the RSA’s Communications Division. The highlights show a wide array of avenues the RSA used to communicate with members, agencies and the general public.
Total Assets (1)
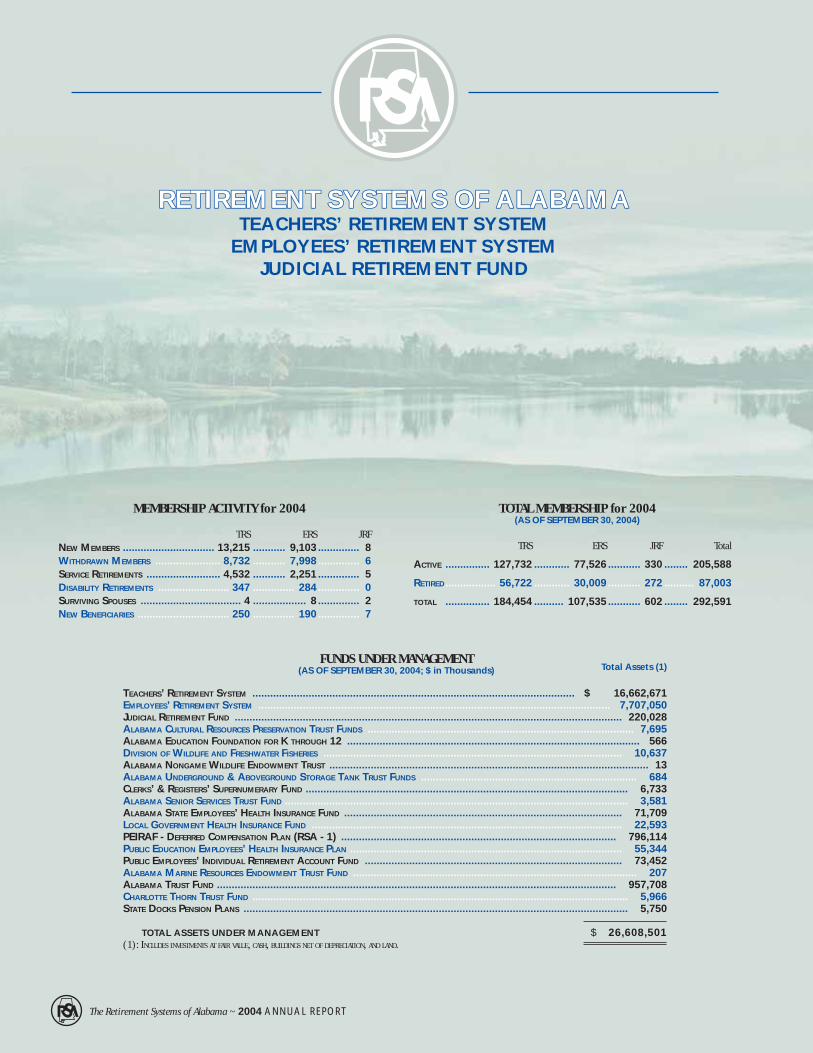
TEACHERS’ RETIREMENT SYSTEM ............................................................................................................. $ 16,662,671 EMPLOYEES’ RETIREMENT SYSTEM ....................................................................................................................... 7,707,050 JUDICIAL RETIREMENT FUND ................................................................................................................................... 220,028 ALABAMA CULTURAL RESOURCES PRESERVATION TRUST FUNDS .......................................................................................... 7,695 ALABAMA EDUCATION FOUNDATION FOR K THROUGH 12 ................................................................................................... 566 DIVISION OF WILDLIFE AND FRESHWATER FISHERIES ..................................................................................................... 10,637 ALABAMA NONGAME WILDLIFE ENDOWMENT TRUST ............................................................................................................ 13 ALABAMA UNDERGROUND & ABOVEGROUND STORAGE TANK TRUST FUNDS ......................................................................... 684 CLERKS’ & REGISTERS’ SUPERNUMERARY FUND ............................................................................................................. 6,733 ALABAMA SENIOR SERVICES TRUST FUND .................................................................................................................... 3,581 ALABAMA STATE EMPLOYEES’ HEALTH INSURANCE FUND .............................................................................................. 71,709 LOCAL GOVERNMENT HEALTH INSURANCE FUND ......................................................................................................... 22,593 PEIRAF - DEFERRED COMPENSATION PLAN (RSA - 1) ............................................................................................. 796,114 PUBLIC EDUCATION EMPLOYEES’ HEALTH INSURANCE PLAN ............................................................................................ 55,344 PUBLIC EMPLOYEES’ INDIVIDUAL RETIREMENT ACCOUNT FUND ....................................................................................... 73,452 ALABAMA MARINE RESOURCES ENDOWMENT TRUST FUND ................................................................................................ 207 ALABAMA TRUST FUND ....................................................................................................................................... 957,708 CHARLOTTE THORN TRUST FUND ............................................................................................................................... 5,966 STATE DOCKS PENSION PLANS .................................................................................................................................. 5,750 TOTAL ASSETS UNDER MANAGEMENT $ 26,608,501 (1): INCLUDES INVESTMENTS AT FAIR VALUE, CASH, BUILDINGS NET OF DEPRECIATION, AND LAND.
TRS ERS JRF NEW MEMBERS ............................... 13,215 ........... 9,103 .............. 8 WITHDRAWN MEMBERS ...................... 8,732 ........... 7,998 .............. 6 SERVICE RETIREMENTS ......................... 4,532 ........... 2,251 .............. 5 DISABILITY RETIREMENTS ........................ 347 .............. 284 .............. 0 SURVIVING SPOUSES .................................. 4 .................. 8 .............. 2 NEW BENEFICIARIES ............................... 250 .............. 190 .............. 7
TRS ERS JRF Total
ACTIVE ............... 127,732 ............ 77,526 ........... 330 ........ 205,588
RETIRED ................. 56,722 ............ 30,009 ........... 272 .......... 87,003
TOTAL ............... 184,454 .......... 107,535 ........... 602 ........ 292,591
FUNDS UNDER MANAGEMENT(AS OF SEPTEMBER 30, 2004; $ in Thousands)
MEMBERSHIP ACTIVITY for 2004 TOTAL MEMBERSHIP for 2004 (AS OF SEPTEMBER 30, 2004)
RETIREMENT SYSTEMS OF ALABAMARETIREMENT SYSTEMS OF ALABAMATEACHERS’ RETIREMENT SYSTEM
EMPLOYEES’ RETIREMENT SYSTEMJUDICIAL RETIREMENT FUND
The Retirement Systems of Alabama ~ 2004 ANNUAL REPORT

2003 2004
MEMBER CONTRIBUTIONS ............... $ 416.7 .................... 424.9
EMPLOYER CONTRIBUTIONS ........................ 398.6 .................... 492.2
INVESTMENT INCOME ............................ 2,964.2 ............... 2,382.0
TOTAL ................................. $ 3,779.5 ............... 3,299.1
5-YEAR HIGHLIGHTS
ASSET ALLOCATION(AS OF SEPTEMBER 30, 2004)
TRS ERS JRF
Asset allocation is a strategic long-term decision in the pension investment management process. The RSA is dedicated to preserving the sound fi nancial position it has established over the years through a diversifi ed investment program. The objective of the RSA is to allocate investments in the most effective way that refl ects policy standards while maximizing returns.
REVENUE SOURCES for TRS, ERS & JRF ($ in Millions)
EMPLOYER CONTRIBUTIONS($ In Millions)
MEMBER CONTRIBUTIONS($ In Millions)
INCREASE / (DECREASE) in INVESTMENTS($ In Millions)
INTEREST and DIVIDEND INCOME($ In Millions)
TRS ERS
REVENUE(Percent)
TRS, ERS, JRF HIGHLIGHTS ~ 15
Retirement Systems of Alabama
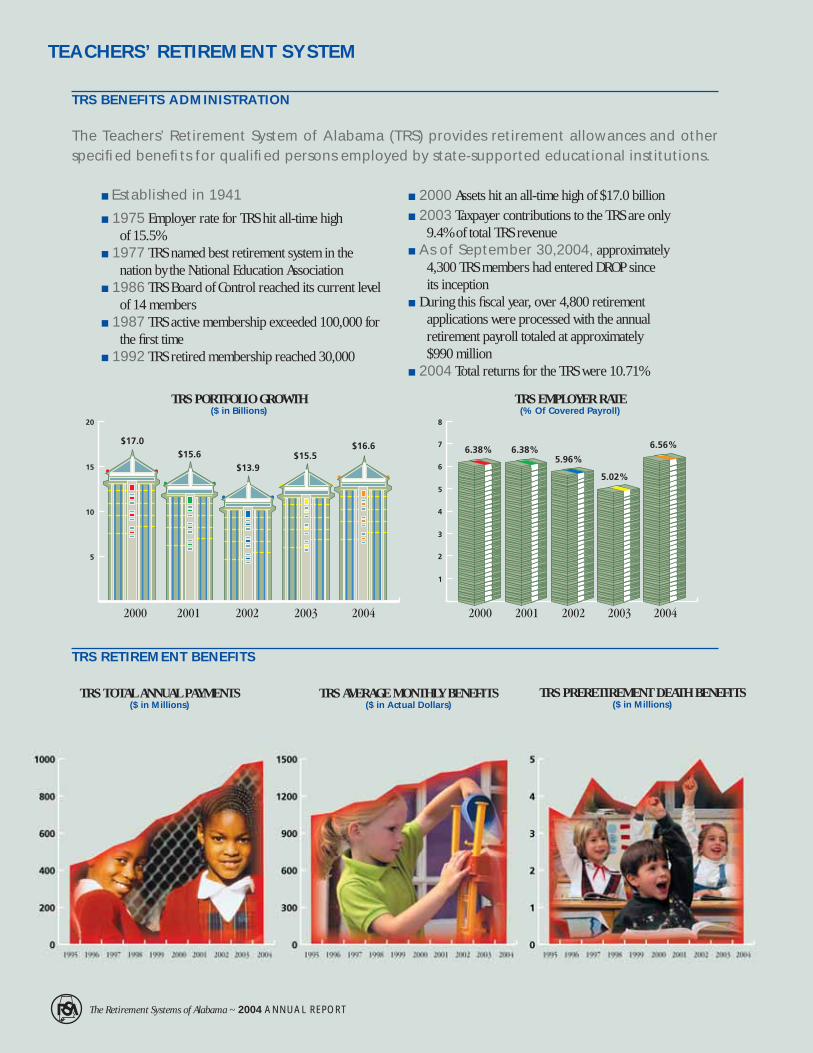
TRS PRERETIREMENT DEATH BENEFITS($ in Millions)
TRS AVERAGE MONTHLY BENEFITS($ in Actual Dollars)
TRS TOTAL ANNUAL PAYMENTS($ in Millions)
The Teachers’ Retirement System of Alabama (TRS) provides retirement allowances and other specifi ed benefi ts for qualifi ed persons employed by state-supported educational institutions.
Established in 1941
1975 Employer rate for TRS hit all-time high of 15.5%
1977 TRS named best retirement system in the nation by the National Education Association
1986 TRS Board of Control reached its current level of 14 members
1987 TRS active membership exceeded 100,000 for the fi rst time
1992 TRS retired membership reached 30,000
2000 Assets hit an all-time high of $17.0 billion 2003 Taxpayer contributions to the TRS are only
9.4% of total TRS revenue As of September 30,2004, approximately
4,300 TRS members had entered DROP since its inception
During this fi scal year, over 4,800 retirement applications were processed with the annual retirement payroll totaled at approximately $990 million
2004 Total returns for the TRS were 10.71%
TEACHERS’ RETIREMENT SYSTEM
TRS BENEFITS ADMINISTRATION
The Retirement Systems of Alabama ~ 2004 ANNUAL REPORT
TRS PORTFOLIO GROWTH($ in Billions)
TRS EMPLOYER RATE(% Of Covered Payroll)
TRS RETIREMENT BENEFITS

TRS MEMBER CONTRIBUTIONS($ in Millions)
TRS EMPLOYER CONTRIBUTIONS($ in Millions)
TRS INVESTMENT INCOME($ in Millions)
TRS TOTAL REVENUES($ in Millions)
TEACHERS’ RETIREMENT SYSTEM ~ 17
TRS REVENUE SOURCES
Retirement Systems of Alabama
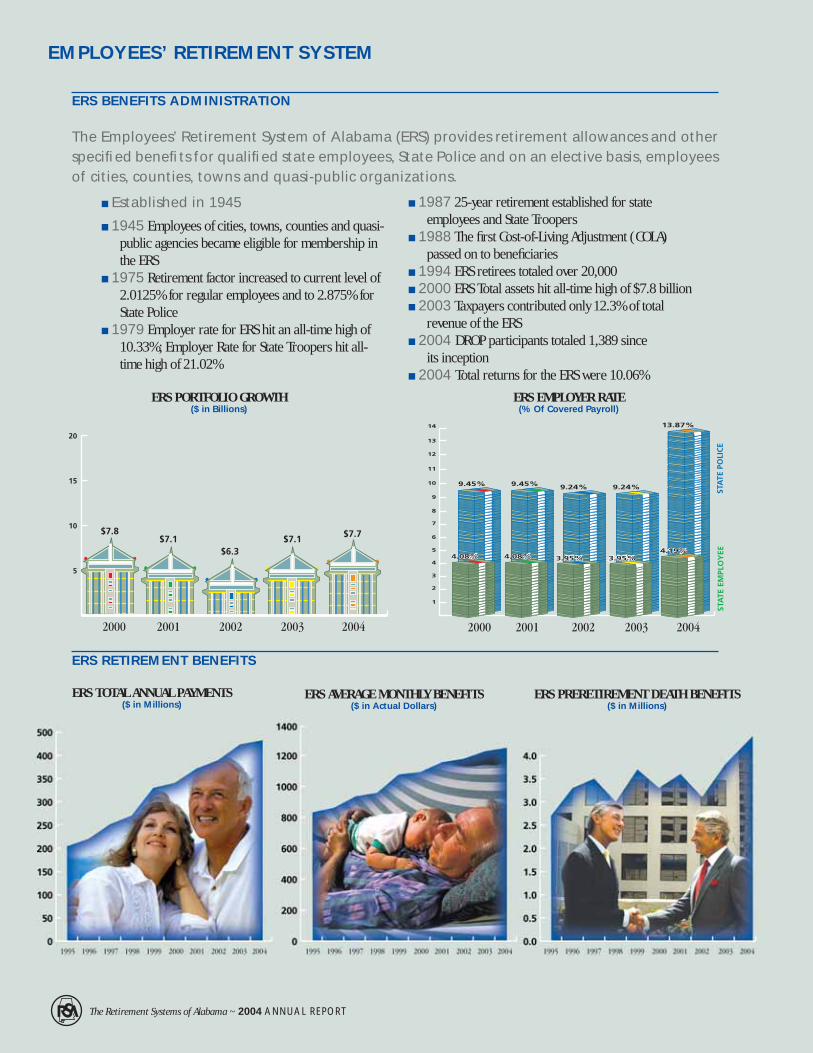
ERS PORTFOLIO GROWTH($ in Billions)
ERS EMPLOYER RATE(% Of Covered Payroll)
ERS PRERETIREMENT DEATH BENEFITS($ in Millions)
ERS AVERAGE MONTHLY BENEFITS($ in Actual Dollars)
ERS TOTAL ANNUAL PAYMENTS($ in Millions)
Established in 1945
1945 Employees of cities, towns, counties and quasi-public agencies became eligible for membership in the ERS
1975 Retirement factor increased to current level of 2.0125% for regular employees and to 2.875% for State Police
1979 Employer rate for ERS hit an all-time high of 10.33%; Employer Rate for State Troopers hit all-time high of 21.02%
1987 25-year retirement established for state employees and State Troopers
1988 The fi rst Cost-of-Living Adjustment (COLA) passed on to benefi ciaries
1994 ERS retirees totaled over 20,000 2000 ERS Total assets hit all-time high of $7.8 billion 2003 Taxpayers contributed only 12.3% of total
revenue of the ERS 2004 DROP participants totaled 1,389 since
its inception 2004 Total returns for the ERS were 10.06%
The Employees’ Retirement System of Alabama (ERS) provides retirement allowances and other specifi ed benefi ts for qualifi ed state employees, State Police and on an elective basis, employees of cities, counties, towns and quasi-public organizations.
EMPLOYEES’ RETIREMENT SYSTEM
ERS BENEFITS ADMINISTRATION
The Retirement Systems of Alabama ~ 2004 ANNUAL REPORT
ERS RETIREMENT BENEFITS

ERS MEMBER CONTRIBUTIONS($ in Millions)
ERS EMPLOYER CONTRIBUTIONS($ in Millions)
ERS INVESTMENT INCOME($ in Millions)
ERS TOTAL REVENUES($ in Millions)
EMPLOYEES’ RETIREMENT SYSTEM ~ 19
ERS REVENUE SOURCES
Retirement Systems of Alabama
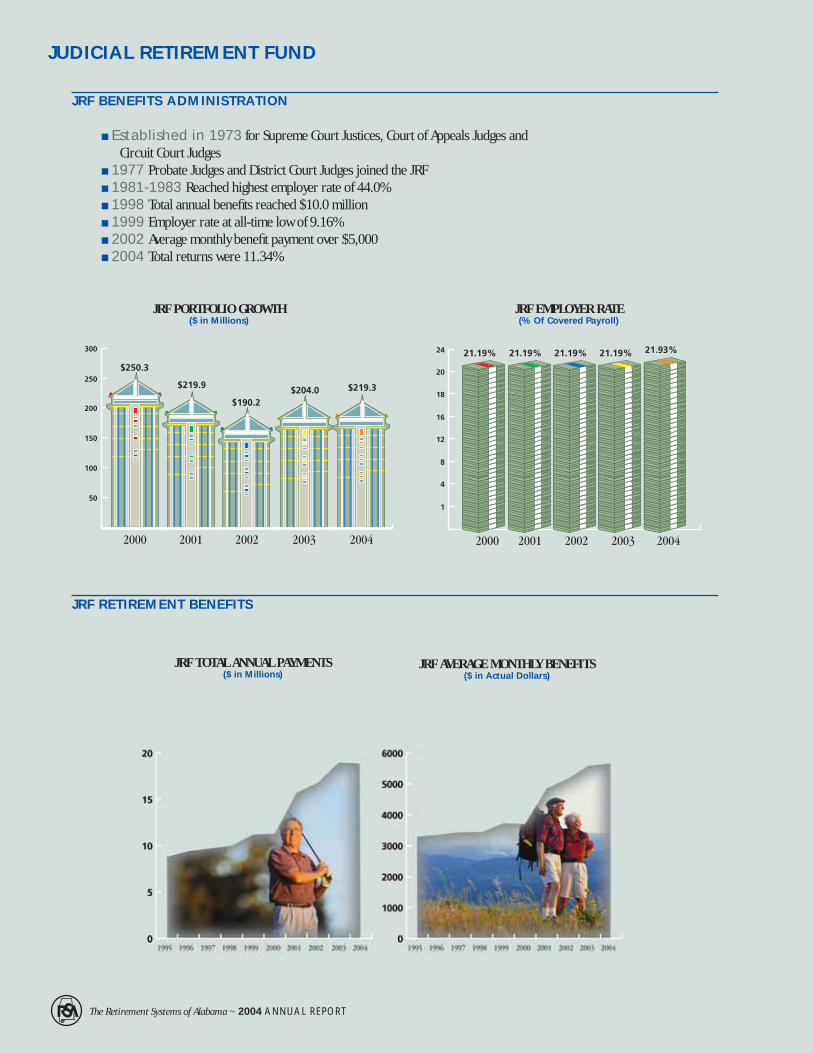
JRF PORTFOLIO GROWTH($ in Millions)
JRF EMPLOYER RATE(% Of Covered Payroll)
JRF AVERAGE MONTHLY BENEFITS($ in Actual Dollars)
JRF TOTAL ANNUAL PAYMENTS($ in Millions)
Established in 1973 for Supreme Court Justices, Court of Appeals Judges and Circuit Court Judges
1977 Probate Judges and District Court Judges joined the JRF 1981-1983 Reached highest employer rate of 44.0% 1998 Total annual benefi ts reached $10.0 million 1999 Employer rate at all-time low of 9.16% 2002 Average monthly benefi t payment over $5,000 2004 Total returns were 11.34%
JUDICIAL RETIREMENT FUND
JRF BENEFITS ADMINISTRATION
The Retirement Systems of Alabama ~ 2004 ANNUAL REPORT
JRF RETIREMENT BENEFITS

JRF MEMBER CONTRIBUTIONS($ in Millions)
JRF EMPLOYER CONTRIBUTIONS($ in Millions)
JRF INVESTMENT INCOME($ in Millions)
JRF TOTAL REVENUES($ in Millions)
JUDICIAL RETIREMENT FUND ~ 21
JRF REVENUE SOURCES
Retirement Systems of Alabama

RSA-1 / DEFERRED COMPENSATION PLAN
The Public Employees’ Individual Retirement Account Fund (PEIRAF) was established to allow public employees to conveniently and economically receive the fullest benefi ts offered by the Economic Recovery Tax Act (ERTA) of 1981 as it relates to individual retirement accounts. PEIRAF has operated as a fi xed income portfolio since its creation in 1982. Funds are invested in fi xed income investments such as corporate bonds, U.S. agency obligations, government national mortgage association securities, and commercial paper.
The Tax Reform Act of 1986 prohibited contributions to deductible voluntary employee contribution plans, such as PEIRAF, for years after 1986. Accordingly, the PEIRAF Board of Control discontinued receiving contributions to this plan after December 31, 1986. However, the PEIRAF continues to reinvest the interest earnings of existing PEIRAF member accounts.
Established in 1986 to allow members of the RSA and certain other eligible public employees to defer receipt of a percentage of their salary, thereby deferring payment of taxes on that income.
12-MONTH PERIOD ENDING INCOME YIELD* MARKET VALUE TOTAL RETURN* TOTAL ASSETS* PARTICIPATING (in %) CHANGE* (in %) (in %) (in $) MEMBERS
SEPTEMBER 30, 1991 ...................................... 11.68 .................................................................. 72,976,574 ........... 7,471
SEPTEMBER 30, 1992 ...................................... 11.41 ................................................................ 106,992,250 ........... 9,269
SEPTEMBER 30, 1993 ...................................... 10.68 ................................................................ 146,812,159 ......... 10,945
SEPTEMBER 30, 1994 ....................................... 9.86 ................................................................ 192,710,264 ......... 12,680
SEPTEMBER 30, 1995 ....................................... 9.35 ................................................................ 247,264,015 ......... 15,054
SEPTEMBER 30, 1996 ....................................... 8.96 ................................................................ 308,584,100 ......... 17,089
SEPTEMBER 30, 1997 ....................................... 8.93 ................................................................ 376,357,423 ......... 19,293
SEPTEMBER 30, 1998 ....................................... 8.90 ................................................................ 451,813,800 ......... 21,166
SEPTEMBER 30, 1999 ....................................... 8.84 ............... 1.55 ............... 10.39 ........ 536,609,859 ......... 23,490
SEPTEMBER 30, 2000 ....................................... 8.43 ............... -3.24 ............... 5.19 ........ 586,876,397 ......... 24,336
SEPTEMBER 30, 2001 (FIXED INVESTMENT OPTION) ...... 8.34 ............... 3.41 ............... 11.75 ........ 614,039,965 ......... 24,938
SEPTEMBER 30, 2001 (STOCK INVESTMENT OPTION) ..... 1.10 ............... -21.09 .............. -19.99 ........ 51,080,583 ......... 5,291
SEPTEMBER 30, 2002 (FIXED INVESTMENT OPTION) ...... 7.39 ............... -5.71 ............... 1.68 ........ 625,407,137 ......... 25,571
SEPTEMBER 30, 2002 (STOCK INVESTMENT OPTION) ..... 1.42 ............... -18.69 .............. -17.27 ........ 47,197,854 ......... 5,599
SEPTEMBER 30, 2003 (FIXED INVESTMENT OPTION) ...... 6.18 ............... -1.36 ............... 4.82 ........ 676,945,292 ......... 25,793
SEPTEMBER 30, 2003 (STOCK INVESTMENT OPTION) ..... 1.87 ................. 20.01 ................ 21.88 ........ 62,452,172 ......... 5,767
SEPTEMBER 30, 2004 (FIXED INVESTMENT OPTION) ...... 5.63 ................ 0.36 ............... 5.99 ........ 709,604,675 ......... 26,057
SEPTEMBER 30, 2004 (STOCK INVESTMENT OPTION) ..... 1.75 ................. 11.30 ................ 13.05 ........ 98,038,346 ......... 8,568
RSA-1 HIGHLIGHTS
* ASSETS ARE VALUED AT COST THROUGH SEPTEMBER 30, 1998, AND AT MARKET THEREAFTER.
The Retirement Systems of Alabama ~ 2004 ANNUAL REPORT
PUBLIC EMPLOYEES’ INDIVIDUAL RETIREMENT ACCOUNT FUND
PEIRAF / DEDUCTABLE EMPLOYEE CONTRIBUTION PLAN

RSA-1 / INVESTMENT ALLOCATION FIXED FUND (MARKET VALUE AS OF SEPTEMBER 30, 2004 • MARKET VALUE AS OF SEPTEMBER 30, 2003)
PEIRAF & RSA-1 ~ 23
RSA-1 / INVESTMENT ALLOCATION STOCK FUND (MARKET VALUE AS OF SEPTEMBER 30, 2004 • MARKET VALUE AS OF SEPTEMBER 30, 2003)
PEIRAF / INVESTMENT ALLOCATION (MARKET VALUE AS OF SEPTEMBER 30, 2004 • MARKET VALUE AS OF SEPTEMBER 30, 2003)
Retirement Systems of Alabama

PEEHIP
The RSA administers the Public Education Employees’ Health Insurance Plan (PEEHIP) for approximately 98,000 active and 47,000 retired public education employees. PEEHIP covers K-12 active employees, one state university’s employees, and all retirees from K through the university level. Over the years, PEEHIP has implemented various cost containment measures such as case management, bill audits, co-payments, deductibles, prescription drug utilization review, second pre-approved hospital admissions, second surgical opinion, discharge and wellness planning, health maintenance organizations and preferred provider organizations. In addition, many benefi t changes have been made over the years to slow the growth in rising costs.
Established in 1983. Southland National Corporation named administrator for supplemental coverages. Blue Cross and Blue Shield named administrator for hospital/medical plan.
1987. The fi rst Health Maintenance Organization offered to PEEHIP members. Added $75.00 co-pay for outpatient surgery and $25.00 co-pay for Urgi-care clinic at an annual savings of $20 million.
1988. Saved $15 million annually by hiring the Alabama Quality Assurance Fund to perform Concurrent Utilization Review.
1990. Because of Precertifi cation and Utilization review, hospital days per thousand decreased for a savings of $20 million over 2 years.
1991. Eliminated coverage for Radial Keratonomy eye procedure saving $2 million annually.
1992. Instituted benefi t changes at an annual savings of over $19 million.
1993. Family Medical Leave Act began.
1994. Implemented new drug formulary which resulted in annual savings of $1.7 million.
1995. PEEHIP implemented HIPPA.
1996. PEEHIP Board lowered reserve level from 20% to 15%, reducing employer premium requirements by $11 million annually.
1997. Reserve level lowered to 12%, reducing employer premium requirements by another $7 million annually.
1998. Discontinued coverage for Viagra medication at an annual savings of $4.5 million.
1999. Reduced reimbursement to participating pharmacies saving $7 million annually.
2000. Increased out-of-pocket premium for active and retired members saving $7 million annually. Added $50 deductible per year for prescription drugs saving $15.6 million annually.
2001. Drug formulary and dental and vision network created savings of $1.0 million annually.
2002. Passage of generic drug bill increased generic utilization.
2003. Increased drug co-payments and added $20 offi ce visit co-pay for Medicare eligible retirees saving $20 million annually. Required university systems to pay for their own retirees which saved $25 million in the K-12 education budget.
2004. PEEHIP Board approved Express Scripts, Inc. to administer the prescription drug benefi t.
The Retirement Systems of Alabama ~ 2004 ANNUAL REPORT
PUBLIC EDUCATION EMPLOYEES’ HEALTH INSURANCE PLAN

FIXED INCOMEANALYST
Joseph G. WalkerM.B.A., C.F.A.
ASSISTANT DIRECTOROF EQUITIES
Steven R. LambdinM.B.A., C.P.A., C.F.A.
DIRECTOR OF FIXED INCOME
Julie S. BarrancoM.B.A., C.F.A.
DIRECTOR OFPRIVATE PLACEMENTS
M. Hunter HarrellM.B.A., C.F.A., J.D.
CHIEF INVESTMENTOFFICER
R. Marc GreenM.B.A., C.F.A.
FIXED INCOMEANALYST
C. Lance LachneyM.B.A., C.F.A.
ASSISTANT DIRECTOROF EQUITIES
Eric J. FoxM.B.A., C.F.A.
EQUITYANALYST
G. Allan Carr, Jr.M.B.A., C.F.A.
CASH MANAGEMENT& OPERATIONS
Ann RothB.S.
EQUITY ANALYST
John R. GivensM.B.A., C.F.A.
Retirement Systems of Alabama
INVESTMENT STAFF ~ 25
EQUITY ANALYST
Kevin W. GambleM.B.A., C.F.A.
CASH MANAGEMENT& OPERATIONS
Nancy H. Sprayberry
2004 INVESTMENT STAFF
ROBERT TRENT JONES GOLF TRAIL / HUNTSVILLE / HAMPTON COVE • RIVER COURSE, 9th Hole © 2004 Lawrence Michael Clemmer

FIXED INCOME ACTIVITY
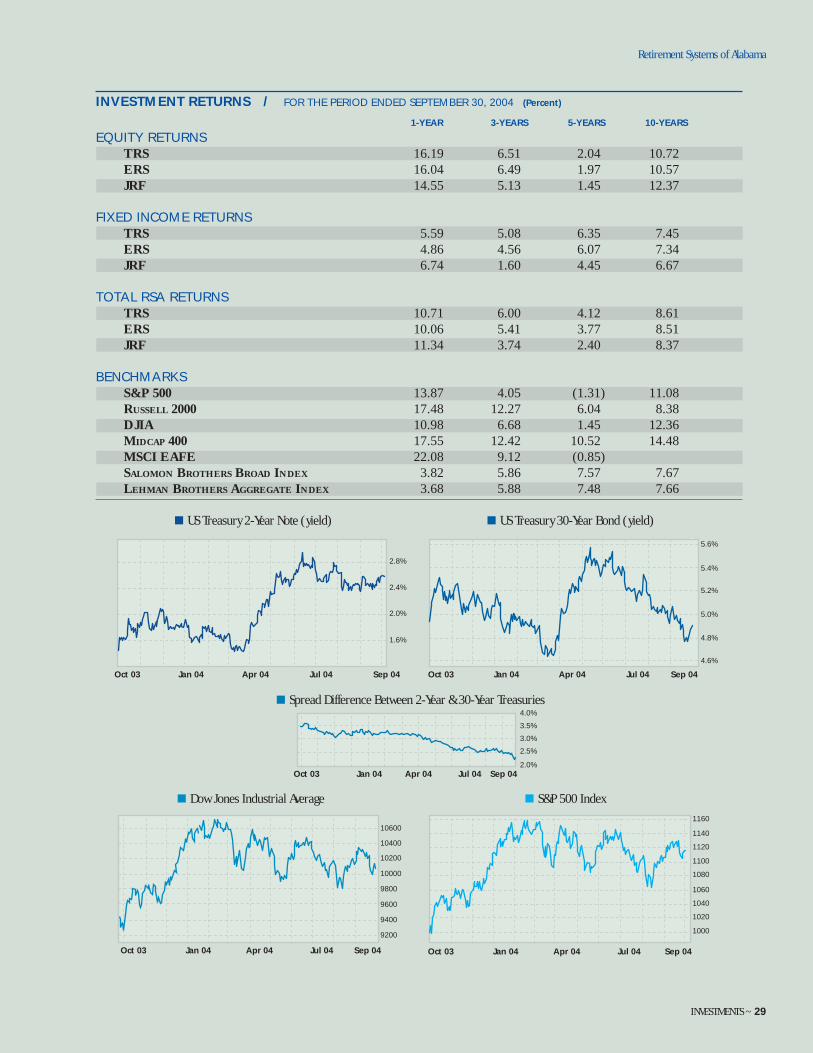
At the beginning of fi scal year 2004, the federal funds rate stood at a 45-year low of 1.00%. With the labor market offering little optimism, Greenspan and the Federal Reserve were fairly reluctant to raise short-term interest rates. Not only was the employment data discouraging, but “the risk of infl ation becoming undesirably low” was still a lingering concern. The yield curve was frighteningly steep from a historical perspective, with the spread between the 2yr and 30yr Treasury hovering around 350 basis points. Expectations for a rate hike at this point had been pushed back into late spring of 2004, with the Fed poised to remain accommodative in their stance towards monetary policy.
Through the early part of the calendar year, interest rates were moving lockstep with reports regarding the economy. However, in March and April, the capital markets fi nally received what it had been long awaiting- favorable payroll numbers. Since this time, investors have continued to see evidence of a somewhat improving labor market and a reduction in the risk of defl ation. The Fed accordingly has raised rates on three separate occasions throughout the end of the fi scal year. They have been reluctant to be aggressive in their decision making in hopes of ensuring a smooth and stable economic recovery. We believe policymakers will continue on this path for the foreseeable future.
During the latter half of the fi scal year, the yield curve has fl attened substantially, with the 2-30yr spread compressing over 125 basis points. This is due to the actions taken by the Fed in terms of monetary policy, coupled with a relatively stable period of infl ation. Even though, oil prices have risen considerably over the last couple of months, it has not been perceived as a major hiccup in the long term. We feel that yield curve still has ample room to fl atten over the immediate term given the economic backdrop.
Believe it or not, high yield securities outperformed corporates and treasuries for the second year in a row. The basic premise in explaining this phenomenon is investors’ eagerness to grab yield in a low interest rate environment. Another explanation is the improvement in overall credit quality as default rates have been nearly cut in half since the beginning of the year. However, a secular development has also evolved, where issuers are encouraged to accept a lower level of credit quality in determining their optimal capital structure. Issuance from investment grade fi rms this year has been rather lackluster compared to high yield companies, which continued to refi nance outstanding debt at lower yield levels. A structural shift in the bond market that has also taken place over the past couple of years is the growth in participation of foreign investors. Offshore investors currently own nearly 25% of US corporate holdings, when one accounts for the inclusion of hedge funds. Going forward, this shift will make the demand for fi xed securities more important and more diffi cult to predict. In fi scal year 2004, the RSA purchased approximately $1.9 billion in additional securities for the fi xed income portfolio. As of September 30, 2004, the RSA’s fi xed income portfolio had a market value of $10.3 billion, of which 13% is in money market securities. For the fi scal year, the total annual returns for the fi xed income portfolios, including alternative investments were 5.59% for the TRS and 4.86% for the ERS and 6.74% for the JRF versus 3.82% for the Salomon Brothers Broad Investment Grade Index (SBBIG). The fi ve-year annualized returns were 6.35% for the TRS and 6.07% for the ERS and 4.45% for the JRF, versus 7.57% for the SBBIG Index. The ten-year annualized returns were 7.45% for the TRS and 7.34% for the ERS and 6.67% for the JRF versus 7.67% for the SBBIG Index.
INVESTMENTS
The Retirement Systems of Alabama ~ 2004 ANNUAL REPORT
LONG-TERM FIXED SECURITIES PURCHASED ($ In Millions)
MONTHS TRS ERS JRF TOTAL
OCTOBER THROUGH MARCH $ 459.2 216.7 8.4 684.3
APRIL THROUGH SEPTEMBER 818.8 360.2 20.8 1,199.8
TOTAL $ 1278.0 576.9 29.2 1,884.1

MATURITY STRUCTURE
The management of maturities for the bond portfolio is an integral part of the RSA’s objective of providing a stable cashfl ow to meet retirement benefi t needs. The RSA has historically structured its purchases in longer-term securities with intermediate call protection or average lives in order to meet its retirement obligations.
QUALITY EVALUATION
The RSA continued its long-standing policy of investing in high quality fi xed income products. Bond ratings, however, provide only a starting point in the evaluation of the relative investment qualities of a bond. Times have changed dramatically over the past decade and few companies today have a rating of AAA to A. Many companies are now rated BAA or lower.
MATURITY DISTRIBUTION (In %)
TRS ERS
Years to Maturity 2004 2003 2002 2004 2003 2002
0 TO <5 17 8 14 17 7 11
5 TO <10 33 26 20 32 25 19
10 TO <15 32 43 39 34 46 43
15 TO <20 4 5 3 3 4 2
20 TO <25 7 12 17 6 10 17
25 TO <30 6 5 6 7 7 7
≥30 1 1 4 1 1 5
Retirement Systems of Alabama
INVESTMENTS ~ 27
QUALITY DISTRIBUTION (In %)
TRS ERS
Rating 2004 2003 2002 2004 2003 2002
AAA 21 14 16 21 14 14
AA 3 2 4 3 3 3
A 8 9 9 8 9 9
BAA 18 14 26 17 14 27
NOT RATED 50 61 45 51 60 47

The Retirement Systems of Alabama ~ 2004 ANNUAL REPORT
INVESTMENTS
EQUITY STRATEGY
After posting an extremely strong fi rst quarter coming out of the gate to the fi scal year, the equity markets basically treaded water for the remainder of the year. Following the huge fi scal and monetary stimuli in place throughout 2003, the fi rst quarter posted returns better than 12% for all major market averages. Going into calendar year 2004, the headwinds started building which kept the market range bound through the end of the fi scal year. To begin, the chatter started to build about the Federal Reserve fi nally going the other way with interest rates. Finally in late June, the Fed began to ratchet up short term rates, and we closed out the fi scal year with the Fed Funds rate moving from 1% up to 1.75%.
Besides the fi ght against higher short term interest rates, earnings momentum also began to slow. After posting astounding numbers throughout 2003, year-over-year comparisons became very tough in the fi rst quarter. While earnings growth remained strong throughout 2004, analyst expectations became too lofty, and the market was fi ghting repeated downward earnings estimate revisions in the June and September quarters. Another factor that pressured the equity markets was the return of infl ation. The biggest headliner here was obviously oil prices. Crude oil opened under $30 at the beginning of the calendar year and closed out in September at a new all time high of nearly $50. Infl ation pressures were not just on the energy side either. The Goldman Sachs Commodity Price Index, which takes a snapshot of 24 commodities, was up over 30% for the fi rst three quarters of the calendar year.
Other factors which were a drag on the equity market during the calendar year were the continued fi ghting in the Middle East and the battle for the White House. Besides all the negative press they generated, the market was very uncertain as to how to access the risk regarding these issues. On top of that, the monthly employment reports were very volatile throughout the year. After posting strong numbers early in the year, the monthly jobs numbers became very weak for a period of time. This begged the question of how sustainable the recovery would be.
In review, the RSA equity allocation began the year at roughly 49%, and closed out fi scal 2004 at roughly 54% of assets. Some new money was added to the active funds, as well as to the international portfolio. Domestic equities account for nearly 43% of the fund, and international equities are now over 11% of the total. Much like 2003, the smaller the market capitalization, the better the performance. The S & P 500 index was up 13.87%, the S & P 400 Midcap index was up 17.55%, and the S & P Smallcap 600 index was up 24.58%. The MSCI EAFE index was up 22.08%, again outperforming the broad domestic equity indices.
For the year, the RSA domestic equity portfolios increased 14.69%, 14.56%, and 14.55% for the TRS, ERS, and JRF funds, respectively. International equity returns fared better, posting 22.59% and 22.43% for TRS and ERS, respectively. The combined total return for the overall equity portfolios were 16.19%, 16.04%, and 14.55% for the TRS, ERS, and JRF, respectively.
Oct 03 Jan 04
US Treasury 2-Year Note (yield)
Apr 04 Jul 04 Sep 04
2.8%
2.4%
2.0%
1.6%
Oct 03 Jan 04 Apr 04 Jul 04 Sep 04
Oct 03 Jan 04 Apr 04 Jul 04 Sep 04
5.6%
5.4%
5.2%
5.0%
4.8%
4.6%
2.0%
2.5%
3.5%
3.0%
4.0%
Dow Jones Industrial Average S&P 500 Index
US Treasury 30-Year Bond (yield)
Spread Difference Between 2-Year & 30-Year Treasuries
Oct 03 Jan 04 Apr 04 Jul 04 Sep 04 Oct 03 Jan 04 Apr 04 Jul 04 Sep 04
9400
9200
9600
9800
10000
10200
10400
106001160
1140
1120
1100
1080
1060
1040
1020
1000
INVESTMENT RETURNS / FOR THE PERIOD ENDED SEPTEMBER 30, 2004 (Percent) 1-YEAR 3-YEARS 5-YEARS 10-YEARS
EQUITY RETURNS TRS 16.19 6.51 2.04 10.72 ERS 16.04 6.49 1.97 10.57 JRF 14.55 5.13 1.45 12.37
FIXED INCOME RETURNS TRS 5.59 5.08 6.35 7.45 ERS 4.86 4.56 6.07 7.34 JRF 6.74 1.60 4.45 6.67
TOTAL RSA RETURNS TRS 10.71 6.00 4.12 8.61 ERS 10.06 5.41 3.77 8.51 JRF 11.34 3.74 2.40 8.37
BENCHMARKS S&P 500 13.87 4.05 (1.31) 11.08 RUSSELL 2000 17.48 12.27 6.04 8.38 DJIA 10.98 6.68 1.45 12.36 MIDCAP 400 17.55 12.42 10.52 14.48 MSCI EAFE 22.08 9.12 (0.85) SALOMON BROTHERS BROAD INDEX 3.82 5.86 7.57 7.67 LEHMAN BROTHERS AGGREGATE INDEX 3.68 5.88 7.48 7.66
Retirement Systems of Alabama
INVESTMENTS ~ 29

FINANCIAL STATEMENTS
TEACHERS’ RETIREMENT SYSTEM / STATEMENT OF PLAN NET ASSETS AS OF SEPTEMBER 30, 2004 AND 2003
2004 ($ In Thousands) 2003
ASSETS
CASH - RESTRICTED FOR ADMINISTRATIVE EXPENSES $ 15,109 $ 15,325
RECEIVABLES
EMPLOYEE CONTRIBUTIONS 19,840 19,362
EMPLOYER CONTRIBUTIONS 26,127 19,541
DIVIDENDS AND INTEREST 147,543 156,398
TOTAL RECEIVABLES 193,510 195,301
INVESTMENTS, AT FAIR VALUE
DOMESTIC EQUITY SECURITIES 7,743,769 6,762,794
DOMESTIC FIXED INCOME SECURITIES 4,980,577 5,509,848
INTERNATIONAL SECURITIES 1,936,147 1,429,102
REAL ESTATE 1,060,523 940,122
SHORT-TERM INVESTMENTS 923,947 833,052
TOTAL INVESTMENTS 16,644,963 15,474,918
INVESTED SECURITIES LENDING COLLATERAL 1,098,881 2,505
PROPERTY AND EQUIPMENT LESS ACCUMULATED DEPRECIATION 2,599 2,763
TOTAL ASSETS 17,955,062 15,690,812
LIABILITIES
ACCOUNTS PAYABLE AND OTHER LIABILITIES 3,032 2,687
SECURITIES LENDING COLLATERAL 1,098,881 2,505
TOTAL LIABILITIES 1,101,913 5,192
NET ASSETS HELD IN TRUST
FOR PENSION BENEFITS $ 16,853,149 $ 15,685,620
The Retirement Systems of Alabama ~ 2004 ANNUAL REPORT
SEPARATELY ISSUED, AUDITED FINANCIAL STATEMENTS ARE AVAILABLE UPON REQUEST.

TEACHERS’ RETIREMENT SYSTEM OF ALABAMA ~ 31
TEACHERS’ RETIREMENT SYSTEM / STATEMENT OF CHANGES IN PLAN NET ASSETS FOR THE YEARS ENDED SEPTEMBER 30, 2004 AND 2003
2004 ($ In Thousands) 2003
ADDITIONS
CONTRIBUTIONS
EMPLOYEE $ 251,714 $ 249,996 EMPLOYER 312,474 235,786 TRANSFERS FROM EMPLOYEES’ RETIREMENT SYSTEM 2,146 2,022 TOTAL CONTRIBUTIONS 566,334 487,804 INVESTMENT INCOME
FROM INVESTMENT ACTIVITIES
NET INCREASE IN FAIR VALUE OF INVESTMENTS 1,055,525 1,412,887 INTEREST AND DIVIDENDS 580,000 592,645
TOTAL INVESTMENT INCOME FROM INVESTING ACTIVITIES 1,635,525 2,005,532 LESS: INVESTMENT EXPENSE 4,079 4,432 NET INVESTMENT INCOME FROM INVESTING ACTIVITIES 1,631,446 2,001,100 FROM SECURITIES LENDING ACTIVITIES
SECURITIES LENDING INCOME 10,704 14,215 SECURITIES LENDING EXPENSES BORROWER REBATES 7,206 10,052 MANAGEMENT FEES 630 832 TOTAL SECURITIES LENDING EXPENSES 7,836 10,884 NET INCOME FROM SECURITIES LENDING ACTIVITIES 2,868 3,331
TOTAL INVESTMENT INCOME 1,634,314 2,004,431
TOTAL ADDITIONS 2,200,648 2,492,235
DEDUCTIONS RETIREMENT ALLOWANCE PAYMENTS 987,761 932,687 RETURN OF CONTRIBUTIONS AND DEATH BENEFITS 35,983 32,084 TRANSFERS TO EMPLOYEES’ RETIREMENT SYSTEM 1,575 2,418 ADMINISTRATIVE EXPENSE 7,361 7,011 DEPRECIATION 439 367 TOTAL DEDUCTIONS 1,033,119 974,567
NET INCREASE 1,167,529 1,517,668
NET ASSETS HELD IN TRUST FOR PENSION BENEFITS BEGINNING OF THE YEAR 15,685,620 14,167,952 END OF THE YEAR $ 16,853,149 $ 15,685,620
Retirement Systems of Alabama

EMPLOYEES’ RETIREMENT SYSTEM / STATEMENT OF PLAN NET ASSETS AS OF SEPTEMBER 30, 2004 AND 2003
2004 ($ In Thousands) 2003
ASSETS
CASH - RESTRICTED FOR ADMINISTRATIVE EXPENSES $ 4,710 $ 2,917
RECEIVABLES
EMPLOYEE CONTRIBUTIONS 9,269 8,989
EMPLOYER CONTRIBUTIONS 11,461 8,337
DIVIDENDS AND INTEREST 69,537 73,249
TOTAL RECEIVABLES 90,267 90,575
INVESTMENTS, AT FAIR VALUE
DOMESTIC EQUITY SECURITIES 3,636,637 3,285,094
DOMESTIC FIXED INCOME SECURITIES 2,317,072 2,514,000
INTERNATIONAL SECURITIES 832,907 635,563
REAL ESTATE 512,355 454,569
SHORT-TERM INVESTMENTS 401,353 239,446
TOTAL INVESTMENTS 7,700,324 7,128,672
INVESTED SECURITIES LENDING COLLATERAL 526,821 0
PROPERTY AND EQUIPMENT LESS ACCUMULATED DEPRECIATION 2,016 2,117
TOTAL ASSETS 8,324,138 7,224,281
LIABILITIES
ACCOUNTS PAYABLE AND OTHER LIABILITIES 1,719 1,469
SECURITIES LENDING COLLATERAL 526,821 0
TOTAL LIABILITIES 528,540 1,469
NET ASSETS HELD IN TRUST
FOR PENSION BENEFITS $ 7,795,598 $ 7,222,812
The Retirement Systems of Alabama ~ 2004 ANNUAL REPORT
FINANCIAL STATEMENTS
SEPARATELY ISSUED, AUDITED FINANCIAL STATEMENTS ARE AVAILABLE UPON REQUEST.
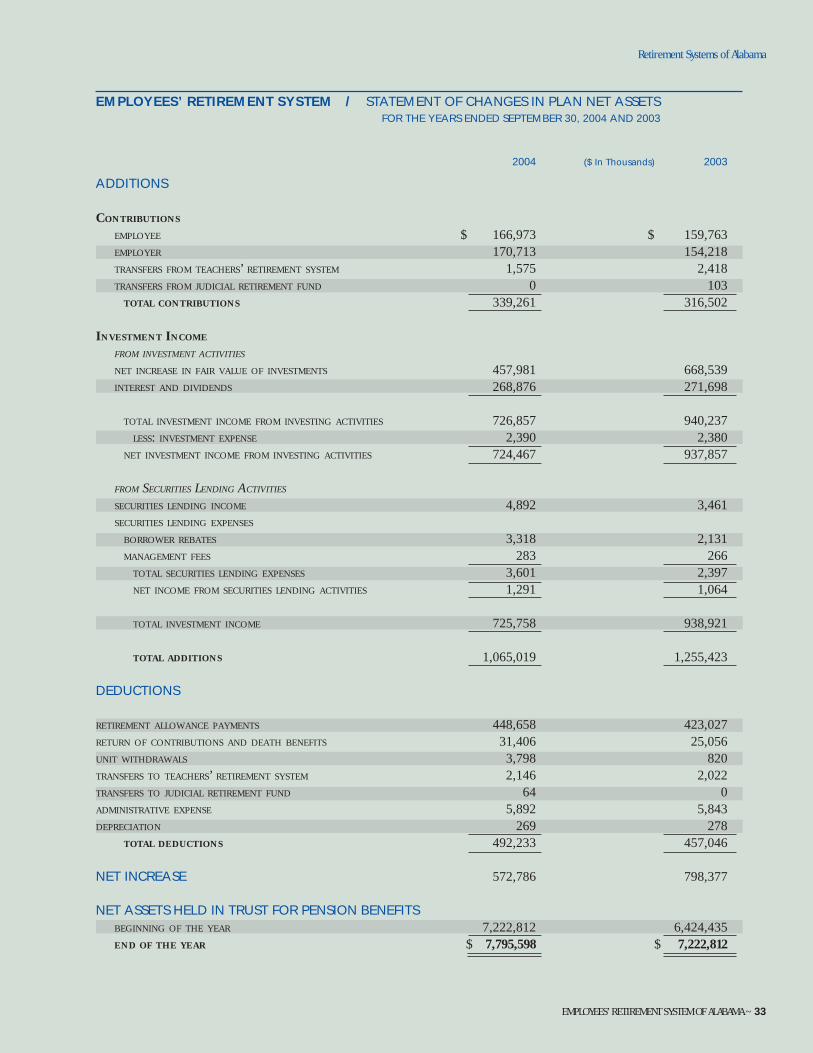
EMPLOYEES’ RETIREMENT SYSTEM / STATEMENT OF CHANGES IN PLAN NET ASSETS FOR THE YEARS ENDED SEPTEMBER 30, 2004 AND 2003
2004 ($ In Thousands) 2003
ADDITIONS
CONTRIBUTIONS
EMPLOYEE $ 166,973 $ 159,763 EMPLOYER 170,713 154,218 TRANSFERS FROM TEACHERS’ RETIREMENT SYSTEM 1,575 2,418 TRANSFERS FROM JUDICIAL RETIREMENT FUND 0 103 TOTAL CONTRIBUTIONS 339,261 316,502 INVESTMENT INCOME FROM INVESTMENT ACTIVITIES
NET INCREASE IN FAIR VALUE OF INVESTMENTS 457,981 668,539 INTEREST AND DIVIDENDS 268,876 271,698 TOTAL INVESTMENT INCOME FROM INVESTING ACTIVITIES 726,857 940,237 LESS: INVESTMENT EXPENSE 2,390 2,380 NET INVESTMENT INCOME FROM INVESTING ACTIVITIES 724,467 937,857 FROM SECURITIES LENDING ACTIVITIES
SECURITIES LENDING INCOME 4,892 3,461 SECURITIES LENDING EXPENSES BORROWER REBATES 3,318 2,131 MANAGEMENT FEES 283 266 TOTAL SECURITIES LENDING EXPENSES 3,601 2,397 NET INCOME FROM SECURITIES LENDING ACTIVITIES 1,291 1,064 TOTAL INVESTMENT INCOME 725,758 938,921 TOTAL ADDITIONS 1,065,019 1,255,423
DEDUCTIONS RETIREMENT ALLOWANCE PAYMENTS 448,658 423,027 RETURN OF CONTRIBUTIONS AND DEATH BENEFITS 31,406 25,056 UNIT WITHDRAWALS 3,798 820 TRANSFERS TO TEACHERS’ RETIREMENT SYSTEM 2,146 2,022 TRANSFERS TO JUDICIAL RETIREMENT FUND 64 0 ADMINISTRATIVE EXPENSE 5,892 5,843 DEPRECIATION 269 278 TOTAL DEDUCTIONS 492,233 457,046
NET INCREASE 572,786 798,377
NET ASSETS HELD IN TRUST FOR PENSION BENEFITS BEGINNING OF THE YEAR 7,222,812 6,424,435 END OF THE YEAR $ 7,795,598 $ 7,222,812
EMPLOYEES’ RETIREMENT SYSTEM OF ALABAMA ~ 33
Retirement Systems of Alabama

JUDICIAL RETIREMENT FUND / STATEMENT OF PLAN NET ASSETS AS OF SEPTEMBER 30, 2004 AND 2003
2004 ($ In Thousands) 2003
ASSETS
CASH - RESTRICTED FOR ADMINISTRATIVE EXPENSES $ 695 $ 647
RECEIVABLES
EMPLOYEE CONTRIBUTIONS 110 111
EMPLOYER CONTRIBUTIONS 308 296
DIVIDENDS AND INTEREST 1,378 1,712
TOTAL RECEIVABLES 1,796 2,119
INVESTMENTS, AT FAIR VALUE
DOMESTIC EQUITY SECURITIES 126,199 107,209
DOMESTIC FIXED INCOME SECURITIES 73,036 84,089
REAL ESTATE 2,429 2,227
SHORT-TERM INVESTMENTS 17,669 10,483
TOTAL INVESTMENTS 219,333 204,008
INVESTED SECURITIES LENDING COLLATERAL 14,783 0
TOTAL ASSETS 236,607 206,774
LIABILITIES
ACCOUNTS PAYABLE AND OTHER LIABILITIES 111 103
SECURITIES LENDING COLLATERAL 14,783 0
TOTAL LIABILITIES 14,894 103
NET ASSETS HELD IN TRUST
FOR PENSION BENEFITS $ 221,713 $ 206,671
SEPARATELY ISSUED, AUDITED FINANCIAL STATEMENTS ARE AVAILABLE UPON REQUEST.
FINANCIAL STATEMENTS
The Retirement Systems of Alabama ~ 2004 ANNUAL REPORT

JUDICIAL RETIREMENT FUND ~ 35
JUDICIAL RETIREMENT FUND / STATEMENT OF CHANGES IN PLAN NET ASSETS FOR THE YEARS ENDED SEPTEMBER 30, 2004 AND 2003
2004 ($ In Thousands) 2003
ADDITIONS
CONTRIBUTIONS
EMPLOYEE $ 2,370 $ 2,342 EMPLOYER 8,994 8,637 TRANSFERS FROM EMPLOYEES’ RETIREMENT SYSTEM 64 0 TOTAL CONTRIBUTIONS 11,428 10,979 INVESTMENT INCOME FROM INVESTMENT ACTIVITIES
NET INCREASE IN FAIR VALUE OF INVESTMENTS 14,736 12,905 INTEREST AND DIVIDENDS 7,218 7,969
TOTAL INVESTMENT INCOME FROM INVESTING ACTIVITIES 21,954 20,874 LESS: INVESTMENT EXPENSE 12 28 NET INVESTMENT INCOME FROM INVESTING ACTIVITIES 21,942 20,846 FROM SECURITIES LENDING ACTIVITIES
SECURITIES LENDING INCOME 109 61 SECURITIES LENDING EXPENSES BORROWER REBATES 83 50 MANAGEMENT FEES 4 2 TOTAL SECURITIES LENDING EXPENSES 87 52 NET INCOME FROM SECURITIES LENDING ACTIVITIES 22 9
TOTAL INVESTMENT INCOME 21,964 20,855
TOTAL ADDITIONS 33,392 31,834
DEDUCTIONS RETIREMENT ALLOWANCE PAYMENTS 17,903 17,964 RETURN OF CONTRIBUTIONS AND DEATH BENEFITS 103 83 TRANSFERS TO EMPLOYEES’ RETIREMENT SYSTEM 0 103 ADMINISTRATIVE EXPENSE 344 322 TOTAL DEDUCTIONS 18,350 18,472
NET INCREASE 15,042 13,362
NET ASSETS HELD IN TRUST FOR PENSION BENEFITS BEGINNING OF THE YEAR 206,671 193,309
END OF THE YEAR $ 221,713 $ 206,671
Retirement Systems of Alabama

The Retirement Systems of Alabama ~ 2004 ANNUAL REPORT
INVESTMENTS Retirement Systems of Alabama
COMMISSIONS PAID REPORT ~ 36
COMMISSIONS PAID REPORT / FISCAL YEAR 2004
VOLUME OF BUSINESS PRIVATE PLACEMENTS COMMISSIONS COMMISSIONS AGENCIES STOCK TRANSACTIONS BOND TRANSACTIONS ($ IN MILLIONS)
ACON PARTNERS $ 60 $ 0 $ 0A. G. EDWARDS 14,490 BANC OF AMERICA 45 224,757 BEAR STEARNS 92 376,030 359,256CENTENNIAL CAPITAL 18,722CITIGROUP 12 481,418 418,432CITIGROUP - MONTGOMERY 10 64,600 14,250CONCORD EQUITY 11,360CREDIT SUISSE FIRST BOSTON 12 247,911 435,279DEUTSCHE BANK 151,684 52,138FIRST DISCOUNT 4,870 GARDNER RICH 22,355 GOLDMAN SACHS 92 188,701 207,988HOWARD WEIL 44,224ISI 121,342JANNEY MONTGOMERY SCOTT 12,450 JP MORGAN CHASE 286,116 200,217KEEFE BRUYETTE 52,017 LAZARD FRERES AND COMPANY 60 82,500LEHMAN BROTHERS, INC 323,260 7,338MCDONALD & COMPANY 70 20,025 108,438MERRILL LYNCH, PIERCE, FENNER & SMITH, INC. 71 390,288 393,267MORGAN KEEGAN 8 52,690 13,250MORGAN STANLEY - MONTGOMERY 4 63,735 5,500MORGAN STANLEY DEAN WITTER 104 422,942 351,485MORGAN STANLEY DEAN WITTER INTERNATIONAL 190,434 NBC SECURITIES, INC. 9 54,995 14,000NBC CAPITAL MARKETS 466 332,706PRUDENTIAL SECURITIES 22,656QUINTUS SECURITIES 11,425RAYMOND JAMES 65 64,700 37,187 ROBERT THOMAS 15,005 SANDLER O’NEIL 53,970 S. C. BERNSTEIN 486,800 SECURITIES CAPITAL 18,750 SIMMONS 37,310SOUTHWEST SECURITIES 14,940 STERNE, AGEE & LEACH - MOBILE 6 39,702 9,500STERNE, AGEE & LEACH - MONTGOMERY 2 35,115 4,000UBS WARBURG 112 132,009 379,156UBS WARBURG - BIRMINGHAM 21,250 UBS WARBURG - MONTGOMERY 13,750 WACHOVIA SECURITIES 8 52,535 13,250
TOTAL $1,308 $4,636,578 $3,663,894

Annual ReportDesign & Realization by:
ROBERT TRENT JONES GOLF TRAIL / HAMPTON COVE • HIGHLAND COURSE, 10th Hole © 2004 Lawrence Michael Clemmer
