horizons project a profile of hispanic elderslatino.si.edu/virtualgallery/growingold/nationwide...1...
TRANSCRIPT

1
HORIZONS Project
A Profile ofHispanic EldersR. Burciaga Valdez, Ph.D.
Carlos Arce, Ph.D.
NuStats
This report was prepared for the Health Care Financing AdministrationHORIZONS Project under a contract with Cutting Edge Communications.
Executive Summary
The Medicare program has largely achieved equal access to medical care services by elderand disabled Americans. The program’s significant contributions to eliminating disparities inaccess to medical care services for low income, black and Hispanic elders are often forgotten.Medicare is often the first and sometimes the only health insurance coverage that Latinoshave ever had in their lives. Medicare provides health insurance coverage to about two mil-lion Latino elderly, about five percent of all elderly in America today. By 2025, the CensusBureau estimates that one in six elderly Americans will be Latino.
Medicare’s almost universal coverage of elders has improved Latino access to medical treat-ment. Yet many Latinos have not taken full advantage of program benefits for a variety ofreasons, including a lack of knowledge about the program, its benefits, and options for caredelivery.
In an effort to better inform Latino elders about Medicare, HCFA is engaged in a set of activi-ties to reach out to Latino beneficiaries to identify the issues they need to know about and tobetter supply them with information they require to use the program. This is the first in aseries of reports using primarily the Current Population Survey of the continental UnitedStates aimed at understanding the target population for these communications efforts.
Latinos reside throughout the United States but are highly concentrated in a few regions andmajor metropolitan areas. For example, almost a quarter of the entire Latino population livesin the Los Angeles metropolitan area. Other major metropolitan areas with high concentra-tions of Latinos include New York, Chicago, San Francisco, Houston, San Antonio, and Miami.The Latino elder population is composed of a diverse group of "national origin" groups includ-ing Mexican, Puerto Rican, Cuban, and Central and South American. In the coming decade anincreasing share of the Latino elder population will be of Mexican origin.

2
Latino elders differ on a number of factors from non-Hispanic white (Anglo) eldersthat affect program participation including:• Latino elders are younger • Latino elders are less well-educated (61 percent have less than eight years of
schooling compared to 18 percent of Anglos)• Latino elders are more likely to live in poverty (21 percent live at or below the
federal poverty level compared to 9 percent of Anglos)• Latino elders are less likely to receive Social Security payments (80 percent
receive Social Security compared to 90 percent of Anglos)
Other demographic differences are likely to affect program participation and infor-mation needs of Latino elders, such as preferred language use and health status.Many Latinos are either Spanish monolingual or English-Spanish bilingual. Weestimate that about one in three Hispanics live in linguistically-isolated households.These are households in which no one over the age of 14 years speaks Englishwell. But given the low education levels among Latino elders, literacy issues inboth Spanish and English affect this community.
Latino elders appear to experience lower death rates and live longer than non-Hispanic white elders do. For example, despite a larger share of Latinos living inpoverty, death rates for all causes appear to be about 1.4 times lower amongLatinos compared to Anglos. Yet Latinos are also more likely to report their healthstatus as poor. About one in three Latino elders reports their health as poor com-pared to about one in four Anglo elders. While Latinos live longer, they may expe-rience higher levels of morbidity requiring on-going medical care.
Medicare participation rates among Latino elders appear considerably lower thanthose for non-Hispanics. Only about four percent of non-Hispanic elders are notenrolled in Medicare, but about ten percent of Hispanic elders are not enrolled.Even among those enrolled, many do not take full advantage of the benefits offeredby the program. For example, about 44 percent of Latino elders received theirinfluenza vaccinations compared to about 57 percent among non-Hispanic elders.The cost sharing associated with Medicare coverage may be a factor affectingaccess to medical services by Latinos because of their very low incomes.
Supplemental coverage through Medi-gap insurance plans offer assistance withthese costs to only about nine percent of Latino elders compared to about 29 per-cent of non-Hispanics. Medicaid serves as the main supplemental source of finan-cial assistance to Latino elders. About 25 percent of Latino elders rely on Medicaidcoverage (compared to about eight percent of non-Hispanics) in addition toMedicare to cover the costs of their care. Clearly, many eligible Latino elders arenot participating in the various programs (QMB/SMBI/QI) designed to help lowincome Medicare beneficiaries meet the costs of their care.
Medicare has played a very important role in increasing access to care for theLatino population. Because Latino elders have low incomes, low levels of formalschooling, and are less likely to speak English well, many face severe challengesnegotiating decisions about health coverage and medical care. Numerous opportu-nities exist to assist Latino elders gain access to high quality medical care throughthe Medicare program.

3
HORIZONS Project
Defining Hispanics
Commonly used terms used to describe the aggregate of Spanish-speaking peoples who originated from Latin America are Hispanic, Latino, Chicano,Spanish-American, Spanish-surnamed, Spanish-origin, and Spanish-speaking.When asked what they call themselves, most respondents use national-originlabels such as Mexican or Mexican-American, Puerto Rican, or Cuban. The second most common form of identification among Mexicans, Puerto Ricans, and Cubans are pan-ethnic terms such as Hispanic or Latino.
In this document we use the terms “Hispanic” and “Latino” interchangeably referring to peoples of Latin American origin living in the United States. Hispanic is the term commonly used within official government circles. TheBureau of the Census adopted this term to classify “a person of Mexican, Puerto Rican, Cuban, Central or South American or other Spanish culture or origin, regardless of race.” With this emphasis on Spanish culture or Westernculture there is rarely acknowledgement of the influence of indigenous societiesof the Americas or cultural contributions of Africans brought as slaves to theCaribbean and other parts of Latin America. Present day Latin American culture isderived from a mix of indigenous, African, and European influences.
Researchers and the federal data sources often use the terms Spanish-origin,Spanish-speaking, and Spanish-surnamed synonymously for Latinos. Theseterms suffer from the same limitations as Hispanic in identifying and classifyingindividuals for the purposes of research and planning.
Defining Hispanics■ Lack of standard for defining Hispanics
■ Historical inconsistencies make poor data trends
■ Inconsistencies in reporting weaken analysis
■ Our approach will vary and depend on data sources

4
HORIZONS Project
Researchers and the federal government use several approaches to finding the mostappropriate and accurate standard or norm and building a classification or typologyfor studying the Hispanic population.
The importance of delineating a population greatly affects research and planningwhen data with a discrete designator are used to describe a group. The implicationscan be profound. For example, one might ask “How comparable socially and demo-graphically are Puerto Ricans living in New York City with Puerto Ricans living onthe island?” Or “Can the findings of a study of Mexicans in Texas be generalized toLatinos across the country?”
Each method of identifying the Hispanic population - surname, language preference,nativity, “national origin” or racial and ethnic identifiers - has strengths and weak-nesses. None offer a completely adequate approach to classifying a very culturallycomplex and heterogeneous population.
Although Latinos are a heterogeneous group, they share numerous common experiences and conditions. For example, Latinos have comparable origins in tribalsocieties; a history of foreign conquest, colonialism, and neocolonialism; share acommon language albeit with regional variations; have similar economic and socialconditions; and have past and present experiences with discrimination.
DefinitionalConcepts■ Surname: proxy with commission and omission errors
■ Language: too much variation and measurement noise
■ Nativity: 40% of Hispanic adults are U.S. born
■ National origin: census solution since 1969
■ Race/ethnicity: the Federal standard

5
HORIZONS Project
Population Estimates
The Census bureau has underestimated the growth of the Hispanic population forseveral decades. Growth of this population is driven by both natural increase -birth minus deaths - and immigration. The average annual growth rate of theLatino population is about three percent, a very high figure for the United States.These growth rates have held fairly steady since the mid-1960s.
One consequence of this growth rate is that the Hispanic population is generallyyoung with a median age of about 26 years. Latinos tend to marry earlier and havelarger families than other Americans. Latino women aged 15 to 44 had an estimat-ed fertility rate of 93.2 births per 1000 in 1990, significantly higher than the 64.4births per 1000 for non-Latino women.
The diversity that exists among Latino groups underscores the history of immigration to the United States. Latinos have always inhabited the border of whatis now the continental United States. The U.S. invasion of Mexico in 1846 endedall claims to Texas, and with the Treaty of Guadalupe-Hidalgo, Mexico ceded to theU.S. almost the entire modern Southwest. The United States acquired Puerto Ricofrom the Spanish as war bounty in 1898. In 1900 the Foraker Act declared PuertoRicans U.S. nationals and in 1917 the Jones Act made Puerto Ricans citizens.Cuba was also acquired after the Spanish-American war but gained independencein 1902. Modern day Cuban immigration came in waves with the largest wavecoming in 1959 when Castro came into power. In 1965, revisions to those lawsgave preference to immigration from Latin America and family reunification provisions will maintain large scale immigration from this region for some time to come.
Themes of theDemographicImperative■ Current estimates always greater than recent projections
■ Differential growth rates steady for 20 years
■ Youthfulness makes growth immutable
■ Trends in more diverse new immigrants
6
HORIZONS Project
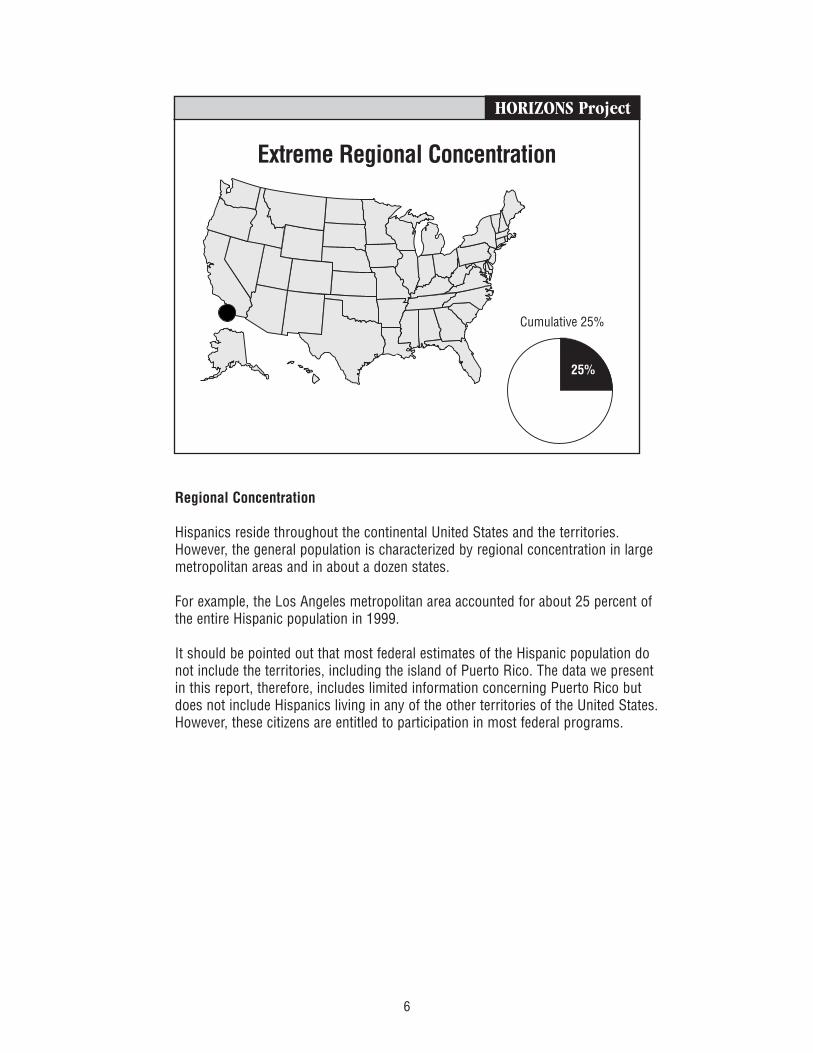
Regional Concentration
Hispanics reside throughout the continental United States and the territories.However, the general population is characterized by regional concentration in largemetropolitan areas and in about a dozen states.
For example, the Los Angeles metropolitan area accounted for about 25 percent ofthe entire Hispanic population in 1999.
It should be pointed out that most federal estimates of the Hispanic population donot include the territories, including the island of Puerto Rico. The data we presentin this report, therefore, includes limited information concerning Puerto Rico butdoes not include Hispanics living in any of the other territories of the United States.However, these citizens are entitled to participation in most federal programs.
Extreme Regional Concentration
25%
Cumulative 25%

7
HORIZONS Project
Hispanics residing in the rest of the State of California account for another ninepercent of Hispanics nationwide. About one in three Hispanics in the UnitedStates live in the State of California.
California’s Latino population reflects a blend of recent immigrants fromthroughout Latin America, but especially from all parts of Mexico and CentralAmerica as well as a long-time established Mexican-American population.
Extreme Regional Concentration
25%
9%
Cumulative 34%

8
HORIZONS Project
More than half of all Hispanics live in just two states, California and Texas.Hispanic Texans account for about 17 percent of the total Hispanic populationnationwide. Amazingly, the Los Angeles metropolitan area accounts for moreHispanics than the whole state of Texas.
These states have been the initial receiving destinations of Hispanic immigrantssince the beginning of the 20th century as well as sites of early settlement dating back to the Spanish exploration of the North American continent. Texas’long border and historical ties with Mexico greatly influence the characteristicsof the Hispanic population in this region. South and West Texas is home tosome of the oldest Hispanic communities in the continental United States.
It is important to remember that until the late 1920s the United States main-tained an open border with Mexico with the free flow of people and goodslargely across the Rio Grande. While California also shares historical ties toMexico, the sizeable growth of the Hispanic population is a relatively recentphenomena dating back to the 1940s. The growing concentration resulted from both immigration and movement of Hispanics from within theUnited States.
Extreme Regional Concentration
25%
9%17%
Cumulative 51%

9
HORIZONS Project
Three other local regional concentrations account for large shares of theHispanic population. The Chicago, Greater New York and Miami metropolitanareas account for about a quarter of the nation’s Hispanic population. As we willdemonstrate, the characteristics of Hispanics in these regions differ significant-ly from those in Texas and California reflecting both immigration and migrationto these parts of the United States since the mid-20th Century.
Thus, three-quarters of the Hispanic populations reside in just two states(California & Texas) plus three metropolitan areas (New York, Miami, andChicago).
Extreme Regional Concentration
25%
9%17%
24%
Cumulative 75%

10
HORIZONS Project
Hispanic communities in the states of Nevada, Arizona, New Mexico, and Coloradocontribute an additional 13 percent to the national Hispanic population. The popu-lations in these communities are a mix of America’s oldest and most recent residents. New Mexico has been the home of Hispanic communities for over 400years and all these states have seen the influx of new immigrants from Mexico.
With the addition of these communities, 88 percent of Hispanics are concentratedin the U.S. Southwestern states, Florida, Illinois, New York and New Jersey.
The remaining 12 percent of the Hispanic community are spread throughout therest of the United States. Additionally, more than three million Hispanics live onthe island of Puerto Rico, a territory of the U.S. About 400,000 elder PuertoRicans live on the island. Elders residing in the Virgin Islands and Guam are estimated at about 19,000.
The Hispanic elderly population is highly concentrated in the states of the U.S.Southwest, Illinois, New York and Florida. A substantial concentration also resideon the island of Puerto Rico.
Extreme Regional Concentration
25%
9%17%
24%
13%
Total Cumulative 88%
Other

11
HORIZONS Project
U.S. Hispanic Population
The United States has one of the largest Hispanic populations in the world. Inabsolute numbers only Mexico, Spain, Colombia, Argentina, and Peru havelarger populations.
The Hispanic population is highly concentrated in the nation’s major metropolitan areas. The nation’s Latino population is largely located in tenmajor markets across the country. As a result, most Latinos live and work inurban environments.
Recent Census estimates, however, also indicate that Hispanic populations areincreasing as a share of America’s rural populations. This trend has beenreferred to as the “Latinization of rural America.”
Hispanic Populationof the United States
MARCH 1999 - NUSTATS INTERNATIONAL ESTIMATES
1
2
3
4
5
6
7
8
9
10
11
12
13
14
20.5%
4.4%
2.4%
6.7%
3.6%
2.7%
2.5%
10.7%
11.1%
4.5%
4.0%
2.0%
6.6%
18.6%
100.0%
20.5%
24.8%
27.2%
33.9%
37.5%
40.2%
42.7%
53.4%
64.4%
68.9%
72.9%
74.8%
81.4%
100.0%
5
10
1
42
8
4
12
230
27
2
13
2
126
2661
3143
6,416,742
1,371,601
744,900
2,095,242
1,122,478
860,067
777,476
3,358,256
3,467,756
1,398,598
1,250,185
614,266
2,059,259
5,840,591
31,377,417
6,416,742
7,788,343
8,533,243
10,628,485
11,750,963
12,611,030
13,388,505
16,746,762
20,214,518
21,613,116
22,863,301
23,477,567
25,536,826
31,377,417
LOS ANGELES
SAN FRANCISCO
SAN DIEGO
REST OF CALIFORNIA
HOUSTON
SAN ANTONIO
DALLAS
REST OF TEXAS
NEW YORK
MIAMI
CHICAGO
PHOENIX
REST OF SOUTHWEST
REST OF U.S.
PLACE# OF
COUNTIESHISPANIC
POPULATION3/99
CUMULATIVEHISPANIC
POPULATION% OF
POPULATION
CUMULATIVE
%

12
HORIZONS Project
Recent Census Bureau projections indicate that the Latino population is expectedto continue to grow at a rapid rate over the next five decades.
The future holds marked increases in the racial and ethic diversity within the elderly population. The 1990 census counted 31.1 million people age 65 years andover. Eighty-seven percent, about 27 million, were non-Hispanic white. If recentdemographic trends continue, the non-Hispanic white elderly population willdecline steadily from 78 percent in 2020 to 67 percent in 2050. The share of elderly who are Hispanic, in contrast, is expected to increase rapidly over the next half century. Hispanic elders numbered about 1.1 million in 1990. They willincrease to nine percent of the total elderly population by 2020 and up to 16 percent by 2050.
If Latino life expectancy increases or the net levels of immigration increase, thenumbers of elderly Hispanics will be even higher.
Hispanic Population 1980-2050100
80
60
40
20
0
1980
100
90
60
40
20
0
Hisp
anic
s in
U.S
. (m
illio
ns)
% o
f U.S
.
1990 2000 2010 2020 2030 2040 2050

13
HORIZONS Project
Hispanic Growth
Overall, the Hispanic population has experienced annual growth in excess ofseven times the rate of growth of the Anglo population for the last decade.
Nationally, the elderly population has experienced about an 11 percent growthduring the 1990s. The Anglo population grew about 7.4 percent whereas theLatino elderly population grew by 60 percent during this decade. Future growthprojections suggest that the annual growth rate of Latino elders will accelerateduring the first decade of the 21st Century.
Annual Rates of Growth forHispanics & Non-Hispanic Whites
4.23.93.63.3
32.72.42.11.81.51.20.90.60.3
0
1990
-91
1991
-92
1992
-93
1993
-94
1994
-95
1995
-96
1996
-97
1997
-98
1998
-99
1999
-00
Hispanic
White, Non-Hisp.

14
HORIZONS Project
The Hispanic population is among the nation’s fastest growing populations in thecountry. Census projections suggest that Hispanics will become the largestnational “minority” population in the first decade of the 21st Century. Hispanicsalready outnumber other racial and ethnic populations in numerous major metropolitan areas of the Southwest, Florida, and New York.
The rapid growth of the Hispanic population nationally can be accounted for bynational increase, lower mortality rates, and high levels of immigration from Latin America.
Hispanic populations, especially the Mexican-American community, have experienced higher fertility rates than any other population group in the nation fordecades. Even after controlling for socioeconomic and intermarriage rates,Mexican-American fertility rates are higher than replacement levels and higherthan Anglo populations.
An epidemiological paradox has received considerable attention in recent yearswith regards to Latino health and longevity. Despite persistently high rates ofpoverty and disability, Latinos live longer than other Americans.
Changes in the immigration laws in 1965 favoring immigration from LatinAmerica and Asia have changed the ethnic composition of immigrants to theUnited States. Immigration laws favoring family reunification have also contributed to substantial increases in the growth of the Latino population.Recent amnesty provisions and increased naturalization of immigrant communities will accelerate increases due to immigration in the near future.
Components ofHispanic Growth■ Fertility: higher relative years have held steady
for 20+ years
■ Fertility: Hispanics higher than non-Hispanicseven after SES and intermarriage data controls
■ Mortality: higher longevity for Hispanics than fortheir previous status
■ Immigration: wild card, but assume steady increases

15
HORIZONS Project
Demographic Resources
With the rapid growth in the Hispanic population and the high concentration ofLatinos in the larger states of the nation, data on the characteristics of theHispanic elderly population has become more readily available. The CensusBureau fields monthly the Current Population Survey (CPS) to estimate variouscharacteristics of the nation’s population. In March of every year the CPS estimates basic demographic characteristics and health insurance coverage.
In this report, we will present recent CPS estimates and projections to discusswhat is known about the general demographic characteristics of Hispanic elders.
We will focus our estimates of the Hispanic population 60 years old and older.We think it is important to include the 60 to 64-year-old cohort in our estimatesbecause they will be new entrants into the Medicare program within a short timeand have not yet established their use of the Medicare program coverage options.Recent changes and increased options legislated by Congress will increase theirneed for information about the program and how best to take advantage of theircoverage options. That is not to say that others already participating in the program would not benefit from better information, but rather that the target population for communications efforts must include those participating and anticipated participants in the program.
DemographicResources onHispanic Elders■ Use of Current Population Survey
– Can capture annual charge from 1990 to 1999– Can be used to project near future
■ We include population 60+– To create the soon-to-be, the recent, the established
Medicare beneficiaries– To provide comparisons to non-Hispanics
16
HORIZONS Project
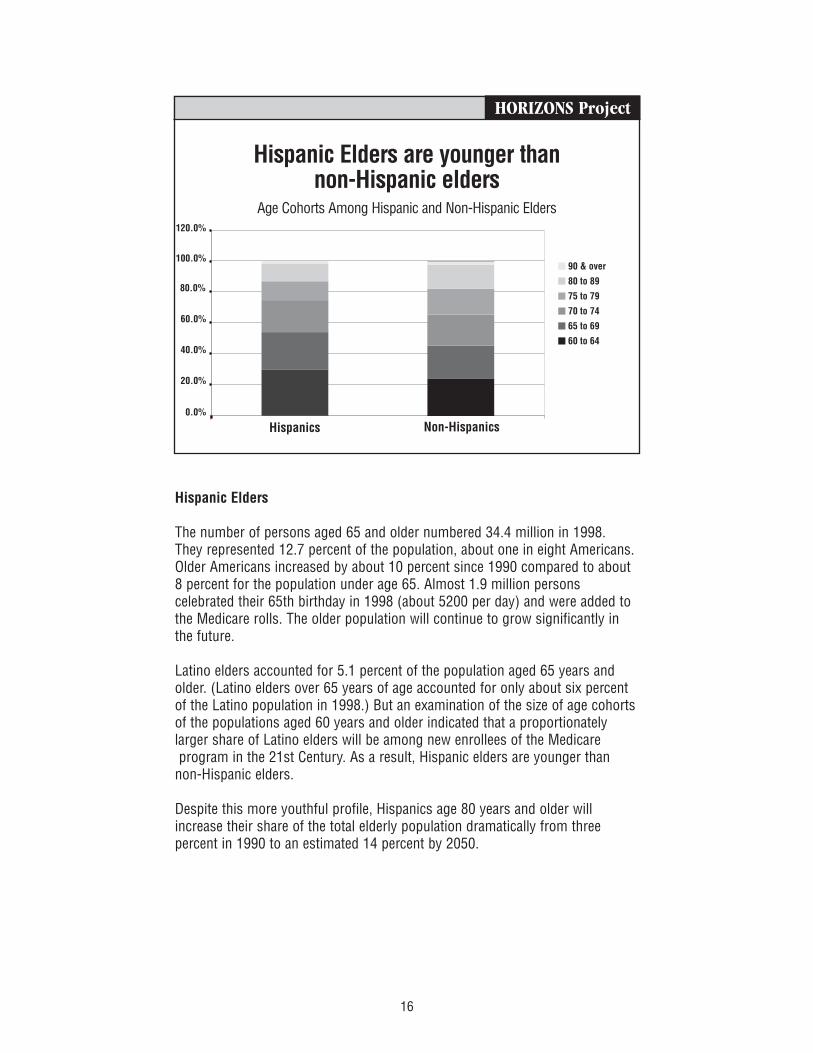
Hispanic Elders
The number of persons aged 65 and older numbered 34.4 million in 1998. They represented 12.7 percent of the population, about one in eight Americans.Older Americans increased by about 10 percent since 1990 compared to about8 percent for the population under age 65. Almost 1.9 million persons celebrated their 65th birthday in 1998 (about 5200 per day) and were added tothe Medicare rolls. The older population will continue to grow significantly inthe future.
Latino elders accounted for 5.1 percent of the population aged 65 years andolder. (Latino elders over 65 years of age accounted for only about six percentof the Latino population in 1998.) But an examination of the size of age cohortsof the populations aged 60 years and older indicated that a proportionately larger share of Latino elders will be among new enrollees of the Medicareprogram in the 21st Century. As a result, Hispanic elders are younger than
non-Hispanic elders.
Despite this more youthful profile, Hispanics age 80 years and older willincrease their share of the total elderly population dramatically from threepercent in 1990 to an estimated 14 percent by 2050.
Hispanic Elders are younger thannon-Hispanic elders
Age Cohorts Among Hispanic and Non-Hispanic Elders120.0%
100.0%
80.0%
60.0%
40.0%
20.0%
0.0%
Hispanics Non-Hispanics
90 & over
80 to 89
75 to 79
70 to 74
65 to 69
60 to 64
17
HORIZONS Project
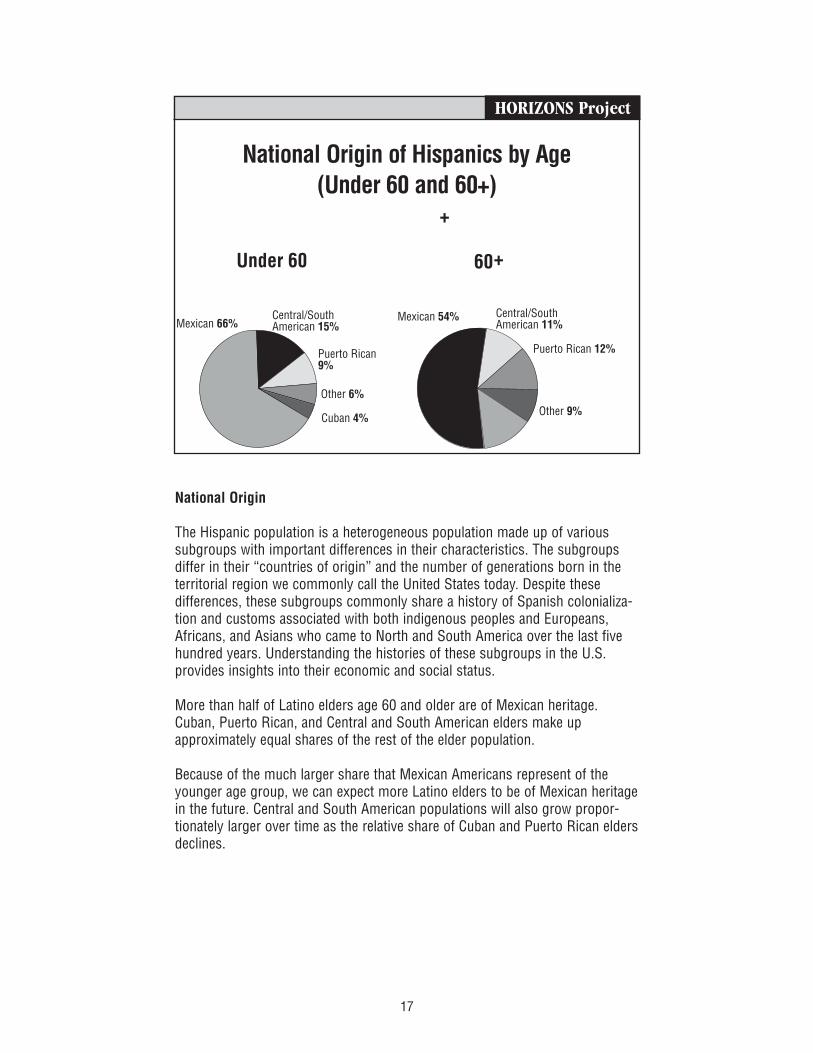
National Origin
The Hispanic population is a heterogeneous population made up of varioussubgroups with important differences in their characteristics. The subgroupsdiffer in their “countries of origin” and the number of generations born in theterritorial region we commonly call the United States today. Despite these differences, these subgroups commonly share a history of Spanish colonializa-tion and customs associated with both indigenous peoples and Europeans,Africans, and Asians who came to North and South America over the last fivehundred years. Understanding the histories of these subgroups in the U.S. provides insights into their economic and social status.
More than half of Latino elders age 60 and older are of Mexican heritage.Cuban, Puerto Rican, and Central and South American elders make up approximately equal shares of the rest of the elder population.
Because of the much larger share that Mexican Americans represent of theyounger age group, we can expect more Latino elders to be of Mexican heritagein the future. Central and South American populations will also grow propor-tionately larger over time as the relative share of Cuban and Puerto Rican eldersdeclines.
National Origin of Hispanics by Age(Under 60 and 60+)
Under 60 60+
Central/SouthAmerican 15%
Puerto Rican9%
Other 6%
Cuban 4%
Mexican 66% Mexican 54% Central/SouthAmerican 11%
Puerto Rican 12%
Other 9%
+

18
HORIZONS Project
Past and future immigration and migration patterns play an important role inboth the rate of growth of the Latino population as well as its mix of native bornand foreign elders. As this data demonstrates, more than 6 out of 10 Mexicanand “Other Hispanic” elders were born in the United States.
Presumably, Puerto Rican respondents who replied “not U.S. born” were referring to being born on the island of Puerto Rico and migrating to the main-land. The island of Puerto Rico has been a territory of the United States sincethe Spanish-American war in 1898, and its inhabitants citizens of the UnitedStates since 1917. Although Puerto Ricans have migrated to metropolitan areasof the northeastern United States since the 19th Century, it was not until 1925that Puerto Rican “colonias” appeared in New York City’s East Harlem.
Similarly, Guam and other territories gained by the United States through theSpanish-American war may identify themselves as Hispanic and not born in theU.S. Some elderly Filipinos continue to hold U.S. citizenship even though thePhilippines gained independence.
Almost all Cuban, Central American, and South American elders were foreignborn. The United States acquired Cuba after the Spanish-American War, butCuba was only occupied for three years before gaining its independence in1902. The newest Latino arrivals have been from Central American countries,particularly El Salvador and Nicaragua. Most of these immigrants were fleeingfrom political violence, war, and poverty in their homelands. Unlike Vietnameseand Cubans, they were denied legally recognized refugee status.
Nationality of Hispanic Elders
Age 60+
Mexcian 56% 44%Puerto Rican 11% 89%Cuban 3% 97%Central/South American 6% 94%Other Spanish 57% 43%
U.S.BORN
NOT U.S.BORN

19
HORIZONS Project
Marital Status
While these statistics on marital status appear quite similar for Hispanic andnon-Hispanic elders, they suggest several issues of concern regarding socialsupport among the elderly population.
Elderly women of all race and ethnic groups are more likely to be widowed.This is particularly true among older cohorts.
Elderly women of all race and ethnic groups who are widowed are more likelythan men to live alone. Hispanic widowed women, however, are less likely tolive alone than are their non-Hispanic counterparts.
Marital Status of Hispanicand Non-Hispanic Elders
Age 60+
Married 56.1 60.8Widowed 24.4 26.6Divorced 10.4 7.8Separated 4.0 1.0Never Married 5.1 4.0
HISPANICNON-
HISPANICS

20
HORIZONS Project
Household Income
The median household income for families headed by persons 65 years and older in1998 was $31,568. Non-Hispanic white households reported median household incomesof $32,398 whereas Hispanic households reported $21,935.
In 1996, the Social Security Administration reported the following sources of income forall older persons: Social Security 91 percent; income from assets 63 percent; public andprivate pensions 43 percent; earnings 21 percent; and public assistance six percent. It isunclear how Latino elders differ from others but Social Security payments may providesome clue. In addition, we know that employment patterns of Latino adults suggest thatfew have private retirement funds or assets to draw upon.
We estimate that today, 90 percent of non-Hispanic elders 65 and over receive incomefrom Social Security but a considerably smaller share of Latino elders receive SocialSecurity payments. This appears to be true even if you include younger elders age 62and older. With the exception of the Central and South American subgroup, about eight in ten Latino elders receive Social Security payments compared to nine in ten non-Hispanics. It appears that one group, primarily Central American seniors, appear mostfinancially vulnerable with only about six in ten receiving Social Security paymentsin old age.
Latino elders also continue in the labor force at levels similar to the Non-Hispanic whitepopulation (65-74 yrs: NHW male 23 percent, H male 17.5 percent, NHW female 15.2percent, H female 11.7 percent; 75 yrs+: NHW male 8.5 percent, H male 5.8 percent;NHW female 3.9 percent, H female 3.2 percent).
In 1998, 21 percent of Latino elders lived in poverty compared to nine percent of Anglos.In fact, two-thirds of Latino elders live on incomes below twice the poverty level.
Social Security Payments Received in 1998by Hispanic Subgroups and Non-Hispanics
Age 62+ and 65+(March 1999)
Mexican 71.7 78.5Puerto Rican 74.9 81.6Cuban 72.8 80.3Central/South American 54.5 61.3Non-Hispanic 84.1 90.2
AGE 62+ AGE 65+

21
HORIZONS Project
Education
In our society the better educated tend to be healthier longer and better off economically. Latino elders are at a distinct disadvantage with regard to educational attainment compared to other elders.
Hispanics 65-74 years old have the highest proportion (61 percent) with someelementary education of any other elder group in this cohort. By comparison,two-thirds of Anglos in this age cohort are high school graduates. Among theHispanic cohort of people age 75 years and older, only 68 percent have someelementary education.
Our best estimate of the the proportion of Hispanic elders who have no formalschooling is about 5.2 percent compared to Anglo elders of about 1.4 percent.
Latino Elders HaveLittle Formal Schooling
8 years or less 61.1% 18.4%High School Graduate 27.3% 66.4%College or more 6.4% 13.8%
LATINO ANGLO

22
HORIZONS Project
Language
Based on estimates available in the last Census, we know that more than oneout of three (36.5 percent) Hispanic elders live in a household in which no oneover the age of 14 speaks English well enough to assist them outside theirhomes. We refer to these households as linguistically isolated for the purposesof outreach and communications purposes. The vast majority of Latino elders,however, live in households in which English is commonly spoken and manylive in household in which English is only spoken.
Most Hispanic elderly speak Spanish or Español (also known in the Spanish-speaking world as Castellano, the language originating from Castile, home ofthe Spanish Crown) at home, but low educational attainment levels mean thatmany cannot read or write well in either English or Spanish language.
Recent immigration from Southern Mexico and Central America has also introduced indigenous language speakers (e.g., Náhuatl, Zoque, Chontal) intotraditional Spanish-speaking communities. Most of these immigrants alsospeak Spanish because they travelled to urban centers from their villages beforemoving northward.
Language provides the framework in which the world view of a culture isshaped, including health beliefs and behaviors. The dearth of Spanish or multilingual health messages, health information, and bilingual health providersposes a major barrier to use of health services and program participation.
Many Hispanics areLinguistically Isolated■ One in three elders live in linguistically
isolated households
■ Most Hispanic elderly speak Spanish at home
■ Literacy levels in both Spanish and English are low

23
HORIZONS Project
Longevity
The Census Bureau estimates that Hispanic men and women can expect to livelong lives. Hispanic men were estimated to live one year longer than Non-Hispanic white men with life expectancies of 74.9 years at birth compared to 73.6years. Perhaps more importantly for the Medicare program, at age 65, Hispanicmen are expected to live almost three years longer than Non-Hispanic white menwith life expectancies of 18.5 years compared to 15.7 years.
Similarly, Hispanic women are expected to outlive Non-Hispanic white womenboth at birth and at age 65. The Census Bureau estimates that Hispanic womenat birth can expect to live 82.2 years and at age 65 they can expect an additional21.8 years. Whereas, Non-Hispanic white women can expect a life of about 80.1years at birth or an additional 19.4 years at age 65.
This longevity of Latino elders can also be seen in figures for death rates from allcauses among persons age 65 years and older. For both Latino men and women,death rates from all causes are about 1.4 times lower than those observed forNon-Hispanic white men and women. For example, among women aged 65 to 74years, we observe a rate of 1,900 per 100,000 deaths among Non-Hispanic whitewomen but only 1,382 per 100,000 deaths among Hispanic women. Similarly,among men of this age group, we find a death rate of 3,123 per 100,000 for Non-Hispanic white men but only a rate of 2,252 per 100,000 for Hispanic men.Death rates are higher for both Hispanic and Non-Hispanic white men thanwomen at all ages.
Latino Elders Are Expected To Have Long Lives
At Birth At Age 65
Projected Life Expectancies for Men
80
70
60
50
40
30
20
10
0
At Birth At Age 65
Projected Life Expectancies for Women
80
70
60
50
40
30
20
10
0
Hispanics
Non-Hispanic White
YEAR
S
YEAR
S
90
Data source: Health 1999, U.S. Departmentof Health and Human Services

24
HORIZONS Project
Health Perceptions
Despite the long lives that Hispanic elderly are expected to live, they also aremore likely to self-rate their health status as “fair” or “poor” than other elders atevery stage of their life. For example, more than a third (35.4 percent) ofHispanic women age 65 years and older rated their overall health as fair orpoor. In comparision, only about a quarter (25.7 percent) of Non-Hispanic whitewomen rated their health as fair or poor. This same finding is also found formen with 34.6 percent of Hispanic men and 26.5 percent of Non-Hispanic whitemen rating their health as “fair” or “poor.”
These findings are important for a number of reasons. Self-reported health status reflects both differences in physiological and physical functioning. Butperhaps, more importantly, it also captures differences due to cultural andsocioeconomic differences in the assessment of health as well as the interpreta-tion of the health status question. Future analysis of Medicare claims data withimproved ethnic identifiers may help provide better insights about these differ-ences and opportunities for interventions.
Many Latino Elders PerceiveTheir Health Status As Poor
Age
Percentage of Men 65 Years and OlderReporting Fair or Poor Health
HispanicsNon-Hispanic White
504540
353025
2015
10
5
0
65y+ 65-74y+ 75-84y+ 85y+ 65y+ 65-74y+ 75-84y+ 85y+
Percentage of Women 65 Years and OlderReporting Fair or Poor Health
Age
60
50
40
30
20
10
0
Perc
enta
ge
Perc
enta
ge
Data source: National HealthInterview Surveys, 1994-96

25
HORIZONS Project
Preventive Services
With the recent addition of several clinical preventive services (e.g., mammogra-phy, influenza vaccination, pneumococcal vaccination) to the standard Medicarebenefit package, the Medicare program has been able to test various approachesto communicating with Medicare beneficiaries about health benefits. One area thatHCFA, in partnership with the Centers for Disease Control and Prevention andother state and local agencies have been actively engaged in is interventions ofadult immunizations.
The need for aggressive outreach to the Latino elder community regardingMedicare benefits and health information can easily be seen in estimates of adultvaccination levels for influenza and pneumococcal.
Using estimates from the National Health Interview Surveys of 1993 through1995, we find that influenza immunizations for elderly Non-Hispanic white popula-tion reached about 57 percent but only 44 percent for Hispanic elders. We find aneven more problematic situation with regards to pneumococcal vaccination. Onlyabout 1 in 3 (31.2 percent) Non-Hispanic white elders and 1 in 6 (15.9 percent)Hispanic elders have received pneumococcal vaccinations.
Latino Elders Lack Appropriate Vaccinations
Hispanics
Non-Hispanic White
60
50
40
30
20
10
0
Influenza Pneumococcal
Perc
enta
ge
Vaccination Type
Data source: National HealthInterview Surveys, 1993-95

26
HORIZONS Project
Medicare Enrollment
Recent estimates of health insurance coverage by Latino elders suggests that more than 90 percent are enrolled in the Medicare program. However, considerable variation exists among the various Latino “national-origin” groups.Participation ranges from a low of 82 percent among the Central and SouthAmerican group to a high of 94 percent among Cuban Americans. But all groupsare less likely to participate in Medicare than non-Hispanic elders.
Hispanic women appear to face serious barriers to Medicare coverage. The best available estimates from 1995 suggest that only 88 percent of Mexican, 77 percent of Puerto Rican, and 86 percent of Cuban American women age 65 and over were covered by Medicare compared with 98 percent of non-Hispanic women.
Many Latinos enter the Medicare program with limited prior experience withhealth insurance in this country. In 1997, about one in three (36 percent) Latinoadults under the age of 65 were uninsured. More than half of Latino immigrantadults under age 65 years were uninsured. Immigration, employment in lowwage, often service sector jobs, without fringe benefits, and work in the “cash”economy leave Latinos largely uninsured.
Enrollment in Medicare for HispanicSubgroups and Non-Hispanics, Age 65+
(March, 1999)
.
Non-Hispanic
Cuban
Puerto Rican
Mexican
Central/South American
96.3%
94.1%
91.1%
89.3%
82.0%
0% 20% 40% 60% 80% 100%

27
HORIZONS Project
Supplemental Insurance
Most Medicare beneficiaries have some form of public or private supplementalinsurance to help pay for benefits not covered by the program or cost sharingrequirements. Latino elders, however, are much less likely than their Anglocounterparts to have private supplemental coverage, either retiree health benefits or individually-purchased Medicare supplemental insurance policies,referred to as “Medigap policies.”
About nine percent of Latinos have Medigap policies compared to 29 percent ofAnglo elders. The costs of Medigap policies in the metropolitan areas whereLatinos live are prohibitively expensive. For example, representative monthlypremiums in the three states with the largest Latino populations – California,New York, Florida – for the limited coverage Plan A Medigap policy (everyinsurance company is required to offer a Plan A Medigap policy which coversthe costs of Parts A and B coinsurance) range from $73 in New York, $109 inFlorida, and $122 in California. More comprehensive plans (e.g., Plans I or J)cost on average three times as much as the limited plan coverage per month.
The most common type of supplemental coverage among Latinos comes fromMedicaid, the state administered health insurance program for low incomeAmericans. More than a quarter of Latinos rely on Medicaid to supplementMedicare. But given their disproportionately low incomes, many more Latinoelders are likely to qualify for Medicaid and other programs designed to assistseniors with the costs associated with the Medicare program (i.e.,QMB/SLMB/QI).
Enrollment in Medicaid for HispanicSubgroups & Non-Hispanic Elders, Age 65+
Cuban 28.9%
Central/South American
Mexican
Puerto Rican
Non-Hispanic
25.6%
25.5%
19.8%
8.1%
0% 20% 40% 60% 80% 100%

Bean, F.D., M. Tienda, The Hispanic population of the United States. New York:Russell Sage Foundation, 1987.
Camarillo, A., “A History of Mexican-Americans in California” in Chicanos inCalifornia, San Francisco: Boyd & Fraser Publishing Co. 1984.
Frey W., R. Farley, Latino, Asian, and Black Segregation in Multi-EthnicMetropolitan Areas, Research Report #278, Ann Arbor, MI: University ofMichigan Population Center. 1993.
Hazuda H.P., P.J. Comeaux, M.P. Stern, S.M., et al., A comparison of three indi-cators for identifying Mexican Americans in epidemiological research. Am JEpidemiol. 1986: 123:96-112.
Hurtado A., D.E. Hayes-Bautista, R.B. Valdez, A.C.R. Hernández, RedefiningCalifornia Latino Social Engagement in a Multicultural Society. Los Angeles:UCLA Chicano Studies Research Center, 1992.
Karoly, L.A., “Anatomy of the U.S. Income Distribution,” Oxford Review ofEconomic Policy, 12(1), pp 77-96.
Lopez, D., “Language Diversity and Assimilation,” in R. Waldinger and M. Boozorgmehr, eds., Ethnic Los Angeles, New York: Russell Sage Foundation,pp 139-163.
McCarthy K.F., R.B. Valdez, Current and future effects of Mexican immigrationin California: Executive Summary. Santa Monica, CA: RAND Corporation. 1985.
McCarthy K.F., G. Vernez, Immigration in a changing economy. Santa Monica,CA: RAND. 1997.
McCoy C.B., D.H. Gonzales. Cuban Immigration and Immmigrants in Floridaand the United States. Miami, FL: Uinversity of Florida, Florida Bureau ofEconomic and Business Research, 1985.
Morales, J. Puerto Rican Poverty and Migration: We Just Had to Try Elsewhere.New York, NY: Praeger Publishers, 1986.
National Research Council, The New Americans: Economic, Demographic, andFiscal Effects of Immigration. Washington, DC: National Academy Press. 1997.
Portes, A., The New Second Generation, New York, NY: Sage Publications.1996.
Rochin R.I., E. Marroquin. Rural Latino Resources. East Lansing, MI: JulianSamora Research Institute. 1997.
28
HORIZONS Project
References

Rodriguez C.E. Puerto Ricans: Born in the USA. Winchester, MA: Unwin Hyman,Inc., 1989.
Rolph, E.S. Immigration Policies: Legacy from the 1980s and Issues for the1990s, R-4184-FF, Santa Monica, CA: RAND. 1993.
Siegal J. Aging in the 21st Century, Washington DC: DHHS. 1996.
Sorensen E., N. Blasberg. The Use of SSI and Other Welfare Programs byImmigrants, Washington, DC: The Urban Institute. 1996.
U.S. Bureau of the Census, The Hispanic Population in the United States: March1999. Current Population Reports. Series P-20. Washington, DC: GPO. 2000.
U.S. Bureau of the Census, Population projections of the United States by Age,Sex, Race, and Hispanic Origin: 1995 to 2050, Current Population Reports,P25, Washington, DC: GPO. 1995.
U.S. Bureau of the Census, Marital Status and Living Arrangements: March1998, Current Population Reports, Series P-20. Washington, DC: GPO 1999.
U.S. Bureau of the Census, Poverty in the United States: 1998, P60,Washington, DC: GPO. 1999.
U.S. Department of Health and Human Services, Health 1999. Washington, DC:GPO 2000.
Vernez, G. “The Current Situation in Mexican Immigration,” Science, 1991: 251,pp. 1189-1193.
Waldinger, R. Still the Promised City? African Americans and New Immigrantsin Post Industrial New York. Cambridge, MA: Harvard University Press. 1996.
Waldinger, R., M. Bozorgmehr. “The Making of a Multicultural Metropolis,”Ethnic Los Angeles, New York, NY: Russell Sage Foundation. 1996.
Wei-Yin, H. “Elderly Immigrants on Welfare,” Focus, 1997: 18(2), pp. 50-53.
29
HORIZONS Project
References

HORIZONS ProjectNationwide Demographic Report
Cutting Edge Communications, Inc.NuStats International
Contract #500-99-0036
TABLE OF CONTENTSA Profile of Hispanic Elders
A Profile of Hispanic Elders . . . . . . . . . . . . . . . . . . . . . . . . . . . . . . . . . . . . . . . . . . . . . . . . . . . . . . . . . . . . . . . . . . . . . 1, 2
Defining Hispanics. . . . . . . . . . . . . . . . . . . . . . . . . . . . . . . . . . . . . . . . . . . . . . . . . . . . . . . . . . . . . . . . . . . . . . . . . . . . . 3
Definitional Concepts. . . . . . . . . . . . . . . . . . . . . . . . . . . . . . . . . . . . . . . . . . . . . . . . . . . . . . . . . . . . . . . . . . . . . . . . . . . 4
Themes of the Demographic Imperative . . . . . . . . . . . . . . . . . . . . . . . . . . . . . . . . . . . . . . . . . . . . . . . . . . . . . . . . . . . . . 5
Extreme Regional Concentration – Cumulative 25% . . . . . . . . . . . . . . . . . . . . . . . . . . . . . . . . . . . . . . . . . . . . . . . . . . . . 6
Extreme Regional Concentration – Cumulative 34% . . . . . . . . . . . . . . . . . . . . . . . . . . . . . . . . . . . . . . . . . . . . . . . . . . . . 7
Extreme Regional Concentration – Cumulative 51% . . . . . . . . . . . . . . . . . . . . . . . . . . . . . . . . . . . . . . . . . . . . . . . . . . . . 8
Extreme Regional Concentration – Cumulative 75% . . . . . . . . . . . . . . . . . . . . . . . . . . . . . . . . . . . . . . . . . . . . . . . . . . . . 9
Extreme Regional Concentration – Cumulative 88% . . . . . . . . . . . . . . . . . . . . . . . . . . . . . . . . . . . . . . . . . . . . . . . . . . . . 10
Hispanic Population of the United States . . . . . . . . . . . . . . . . . . . . . . . . . . . . . . . . . . . . . . . . . . . . . . . . . . . . . . . . . . . . 11
Hispanic Population 1980-2050 . . . . . . . . . . . . . . . . . . . . . . . . . . . . . . . . . . . . . . . . . . . . . . . . . . . . . . . . . . . . . . . . . . . 12
Annual Rates of Growth for Hispanics & Non-Hispanic Whites . . . . . . . . . . . . . . . . . . . . . . . . . . . . . . . . . . . . . . . . . . . . 13
Components of Hispanic Growth . . . . . . . . . . . . . . . . . . . . . . . . . . . . . . . . . . . . . . . . . . . . . . . . . . . . . . . . . . . . . . . . . . 14
Demographic Resources on Hispanic Elders. . . . . . . . . . . . . . . . . . . . . . . . . . . . . . . . . . . . . . . . . . . . . . . . . . . . . . . . . . 15
Hispanic Elders are Younger than Non-Hispanic Elders. . . . . . . . . . . . . . . . . . . . . . . . . . . . . . . . . . . . . . . . . . . . . . . . . . 16
National Origin of Hispanics by Age (Under 60 and 60+) . . . . . . . . . . . . . . . . . . . . . . . . . . . . . . . . . . . . . . . . . . . . . . . . 17
Nationality of Hispanic Elders, Age 60+ . . . . . . . . . . . . . . . . . . . . . . . . . . . . . . . . . . . . . . . . . . . . . . . . . . . . . . . . . . . . . 18
Marital Status of Hispanic and Non-Hispanic Elders, Age 60+ . . . . . . . . . . . . . . . . . . . . . . . . . . . . . . . . . . . . . . . . . . . . . 19
Social Security Payments Received in 1998 by Hispanic Subgroups and Non-Hispanics,
Age 62+ and 65+ (March 1999) . . . . . . . . . . . . . . . . . . . . . . . . . . . . . . . . . . . . . . . . . . . . . . . . . . . . . . . . . . . . . . . . 20
Latino Elders have Little Formal Schooling . . . . . . . . . . . . . . . . . . . . . . . . . . . . . . . . . . . . . . . . . . . . . . . . . . . . . . . . . . . 21
Many Hispanics are Linguistically Isolated . . . . . . . . . . . . . . . . . . . . . . . . . . . . . . . . . . . . . . . . . . . . . . . . . . . . . . . . . . . 22
Latino Elders are Expected to Have Long Lives. . . . . . . . . . . . . . . . . . . . . . . . . . . . . . . . . . . . . . . . . . . . . . . . . . . . . . . . 23
Many Latino Elders Perceive Their Health Status as Poor . . . . . . . . . . . . . . . . . . . . . . . . . . . . . . . . . . . . . . . . . . . . . . . . 24
Latino Elders Lack Appropriate Vaccinations . . . . . . . . . . . . . . . . . . . . . . . . . . . . . . . . . . . . . . . . . . . . . . . . . . . . . . . . . 25
Enrollment in Medicare for Hispanic Subgroups and Non-Hispanics, Age 65+ . . . . . . . . . . . . . . . . . . . . . . . . . . . . . . . . . 26
Enrollment in Medicaid for Hispanic Subgroups and Non-Hispanic Elders, Age 65+ . . . . . . . . . . . . . . . . . . . . . . . . . . . . 27
References . . . . . . . . . . . . . . . . . . . . . . . . . . . . . . . . . . . . . . . . . . . . . . . . . . . . . . . . . . . . . . . . . . . . . . . . . . . . . . . 28, 29

4002 Broadway • San Antonio, Texas 78209 • Phone 210-804-0125 • Fax 210-804-0136 • e-mail [email protected]
HORIZONS ProjectNationwide Demographic Report
FINAL
May 12, 2000
Cutting Edge Communications, Inc.NuStats International
Contract # 500-99-0036

HORIZONS ProjectNationwide Demographic Report