horizontal m&a performance re-visited
TRANSCRIPT

1
HORIZONTAL M&A PERFORMANCE RE-VISITED:
DISENTANGLING EFFICIENCY FROM BARGAINING POWER
VALERIE MOATTI ESCP Europe
79, avenue de la République 75 543 Paris cedex 11, France
Tel: 33 (0)1 49 23 21 08 Fax: 33 (0)1 49 23 21 06
e-mail: [email protected]
PIERRE DUSSAUGE HEC- Paris
1, rue de la Libération 78351 Jouy-en-Josas cedex, France
Tel: 00 33 (0)1 39 67 72 79 e-mail: [email protected]
JAIDEEP ANAND
Ohio State University Fisher College of Business
2100 Neil Avenue Columbus Ohio 43210, USA
Tel: (614) 247 68 51 Fax: (614) 292-7092
e-mail: [email protected]
This study analyzes the impact of horizontal mergers and acquisitions on performance. It focuses on the size effects resulting from such horizontal M&As, namely in terms of operating efficiency on the one hand and bargaining power on the other hand. These two potential benefits created by horizontal M&As correspond to the main theoretical drivers of the size-profitability relationship put forth in the economics and strategy literatures. The relationship between size and performance is an important issue in strategy—most empirical analyses include size as a control variable, but it is poorly understood theoretically. While there has been considerable recent research on M&As, very rarely has this work focused on the size impact of such a strategic move. We test our hypotheses on a sample of 83 firms in the global retail sector over the 1984-2003 period. After controlling for endogeneity, we find little difference in the overall performance of M&As when compared to organic growth, as per previous research. But more interestingly, we find that, when compared to organic growth, M&As primarily enhance performance by increasing bargaining power; conversely, the effect of M&As on operating efficiency is significantly smaller than that of organic growth. We then examine implications of these results for theory as well as for practice.
Abstract

2
The performance of mergers and acquisitions (M&As) has been the subject of much research in strategy, corporate finance, economics as well as organizational behavior for several decades (e.g. Dodd and Ruback, 1977; Haspeslagh & Jemison, 1991; Kitching, 1967; Ranft &, Lord 2002 ; Singh & Montgomery, 1987). This research has helped identify many factors that affect the performance of M&As. Yet, some disagreement and lack of results have persisted, particularly regarding the theoretical origin of this performance. Several meta-analyses (Datta, Pinches and Narayanan 1992; King, Dalton, Daily and Covin 2004; Zollo and Meier 2008) aimed at synthesizing such abundant research, fail at drawing clear conclusions about the nature of post-acquisition performance or preferred methodology to assess it. While results on the value creation of acquisitions remain inconclusive overall, M&As still represent a major growth engine for firms and trillions of dollars have been spent in the acquisition of thousands of firms (Gupta and Gerchak, 2002) over the last few years.
Even though M&As are one of the most commonly used modes of corporate growth, we know remarkably little about how the resulting increase in firm size affects various theoretical drivers of firm performance1
In this study, we try to understand the theoretical drivers of M&A performance that arise from an increase in scale of the firm. We examine horizontal acquisitions, i.e. when a firm acquires a competitor operating in the same industry, in order to focus on scale economies and bargaining power and avoid the confounding effects of diversification. Recognizing that M&As are an alternative to organic growth and that both these modes of expansion are used to enhance the scale of the firm, our research attempts to assess the drivers of M&A performance relative to those of organic growth. If firms self-select into the optimal mode of growth given their positions and constraints, empirical analysis may not detect significant performance differential between these modes after controlling for starting conditions. We suggest, however, that growing through M&As rather than organically may impact performance through distinct mechanisms.
. While it is clear that M&As enhance the size of the firm, little is known about the extent to which M&A performance is based upon either bargaining power with respect to suppliers and customers or scale related efficiency. These two main theoretical drivers of the size and performance relationship are not very well understood due to conceptual as well as methodological reasons. Conceptually, these drivers correspond to different theories of firm performance such as market structure on the one hand and firm capabilities on the other (Porter, 1980; Conner, 1991; Teece, Pisano & Shuen, 1997), while most extant research focuses on one or another specific theory. In terms of methodology, most research on M&A is based on financial stock market data (Datta et al., 1992; King et al., 2004; Seth, 1990) or surveys of managers (Capron, Dussauge & Mitchell, 1998; Capron, Mitchell and Swaminathan, 2004; Datta, 1991). Neither of these approaches lends itself to easily teasing apart the causal effects of different theoretical drivers.
Two major such mechanisms have been theorized as driving the size-performance relationship (Dranove and Shanley, 1995): (i) operating efficiency gains (Anand and Singh, 1997; Barney, 1991; Chatterjee, 1986; Cockburn and Henderson, 2001; Makadok, 1999) and (ii) increased rents produced by enhanced bargaining power2
1 Throughout the paper, we restrict ourselves to horizontal M&A, and therefore do not discuss the issues related to diversification.
(Porter 1980; Katz, 1987; Scherer and Ross 1990). Although these two mechanisms influence firm profitability in the same direction, they have very different implications in terms of our theoretical understanding, managerial actions, competition and strategy. For example, management
2 Bargaining power is related to the concept of market power; the latter being an industry level concept, while the former is a firm level concept. In order to emphasize the firm specific effect of size on profitability, we consistently use the term bargaining power.
3
decisions leading to increased bargaining power concern obtaining more favorable terms from suppliers or customers and differ from those leading to enhanced operating efficiency that result from decisions on optimal utilization of assets or workforce.
We build on prior M&A research and on the size-performance literature to develop our arguments. We start out by reviewing the relevant literature on the main size related benefits and make predictions on the impact of M&As relative to organic growth on each of these components of the size-profitability relationship. We test our hypotheses on a sample of 83 firms from the global retail sector over a 20 year period, using accounting based data. Using such data we develop specific measures of scale related efficiency and firm bargaining power vis a vis its customers and suppliers. Stock market data does not allow for a convenient way to discriminate between efficiency and power based performance gains (Eckbo, 1983). Similarly, managerial surveys may not allow us to measure firm bargaining power, given its negative connotations and anti-trust implications (Pautler, 2003). Our results confirm that after accounting for endogeneity in the choice between M&A and organic growth, we find little impact of mode choice on overall profitability. However, our specific measures reveal that M&A affect operating efficiency and bargaining power in significantly different ways than growing organically. While M&A enhances profitability by increasing bargaining power, organic growth enhances profitability by increasing operating efficiency. Finally, we discuss these results and their implications for future research and practice. BACKGROUND AND PREDICTIONS
The integration of firms through M&A leads to an increase in the size of firms, and a reduction in their number. Researchers in both economics (Katz, 1987; Marshall, 1920; Panzar and Willig, 1981; Ricardo, 1821; Robinson, 1958; Scherer and Ross, 1990; Smith, 1776) and strategy (Baden-Fuller, 1983; Buzzell, Gale and Sultan, 1975; Hall and Howell, 1985; Jacobson and Aaker, 1985; Ross, 1986) have long been interested in the relationship between firm size and profitability. While much work has empirically confirmed the existence of such a positive link (e.g. Buzzell et al. 1975; Hall and Weiss, 1967), many researchers have added further nuance to various aspects of the size-performance relationship (Karnani, 1984; Porter, 1980; Woo, 1987; Whetten, 1987; Makadok, 1999). Nonetheless, in most industries, firms continue to aggressively seek rapid growth, often on the implicit premise that increased size will lead to enhanced profitability (Canals, 2001) and the popular business press continues to assume that “bigger is better” (Smit, Thompson and Viguerie 2005).
Irrespective of the extent to which firm size and firm performance are linked and to the precise direction of such a causal relationship, economics and strategy literatures have long argued that firm growth produces two main size-related benefits: operational efficiency gains resulting from greater scale and increased rents originating in enhanced bargaining power (Gale, 1972, Buzzell et al., 1975; Gale and Branch, 1982; Henderson, 1980; Porter, 1979). Two different schools of thought in Strategy, with their origins in Economics, have emphasized each of these size related benefits. Firm size, firm growth, M&A and performance
Despite the abundance of research on M&As over the past decades (Datta et al., 1992; King et al., 2004; Seth, 1990a), we identified two surprising gaps in the literature to date. First, while it is widely acknowledged that size related benefits are an objective of many horizontal M&As (Capron, 1999; Lubatkin, Schulze, Mainkar and Cotterill, 2001; Seth, 1990b), most studies have not disentangled two conceptually different influences on performance: the direct effect of size on the one hand and the influence of choosing M&A over organic growth to achieve a given size on the other hand. Second, even those studies that have compared the impact of growing through M&A or through organic growth, have paid

4
little attention to the theoretical mechanisms – i.e. scale related operating efficiency vs. bargaining power - that drive the size performance relationship.
Since the middle of the 19th century, industrial organization economists have built on Cournot’s oligopoly pricing model (1838) in arguing that a major impact of size is market power. Traditionally, market power has been defined as the ability by firms in an industry to distort market mechanisms by engaging in monopolistic or collusive behavior in order to restrain output and thus expand the spread between production costs and prices charged to customers (Marshall, 1920; Chamberlain, 1933; Mason, 1939; Bain, 1951; Porter, 1980). Such market power primarily stems from industry concentration which, in turn, is determined by the number of firms competing in the industry and the distribution of market shares among these firms, and is shared by all firms in the industry. Though research on market power has primarily focused on price setting vis-a-vis customers, oligopoly power has also been argued to influence upstream transactions (Scherer & Ross 1990). By controlling a significant share of supplier industries’ output, particularly under significant barriers to exit, firms in highly concentrated industries can push the prices of procurements below normal market prices (Galbraith 1952; Lustgarten 1975; Porter 1974, 1980) and increase their own profit level.
Firm size and bargaining power
While the traditional market power perspective ignores differences among firms, bargaining power in contrast measures the economic clout at the firm level (Porter, 1980; Yan and Gray, 1984; Tyagi, 2001; Chipty and Snyder, 1999; Fernandez and Özler, 1999; Chae and Heidhues, 2004). In other words, while both market power and bargaining power influence profitability, only bargaining power contributes to a firm’s cost/price advantage relative to its competitors and can provide it with a competitive edge. According to Yan and Grey (1994: 1480), “bargaining power refers to a bargainer’s ability to favorably change the “bargaining set” to win accommodations from the other party, and to influence the outcome of a negotiation”. Consistent with the objectives of our study, we focus on the firm-specific rent appropriation ability resulting from size and use the term “bargaining power” to designate such ability.
Recent strategy research has shown that bargaining power is affected by a number of factors that in turn depend on size, such as greater competition among suppliers eager to serve larger customers, the threat of backward integration which is only credible in the case of large buyers that have achieved the minimum efficient scale for production of the considered input, the threat of switching suppliers, the level of profitability of the buyer, and the availability of information on price discrimination between buyers and on suppliers’ costs (Porter, 1974, 1980; Kool and Henderson, 1998; Dobson and Waterson, 1999; Collins, 2002). Increased size, however achieved, will exacerbate competition among suppliers and raise the credibility of the threat to backward integrate, hence increasing bargaining power.
As early as 1776, when analyzing the benefits of division of labor and task specialization, Adam Smith suggested that greater size leads to greater efficiency; Smith primarily attributed this causal relationship to what we would now refer to as “learning”. Ricardo (1821) expanded on, and to some extent challenged, these initial ideas linking size and efficiency by introducing the notions of increasing, but also of decreasing, returns. Over the years, economists such as Marshall (1920) and Robinson (1958) among others suggested additional factors linking size to operating efficiency. The so-called “cube-square” or “two-thirds” rule stipulates that the cost of production assets increases less than proportionally with production capacity (Scherer, 1970; Besanko, Dranove and Shanley, 2000). The notion of “economies of massed reserves” refers to the fact that the inventory of raw materials and finished goods, as well as excess production capacity, needed to adjust to the various kinds of uncertainty (fluctuations in demand, machine downtime, etc.) increase less than proportionally with
Firm size and operating efficiency

5
output (Robinson, 1958); These ideas on “massed reserves” were later expanded to other overhead costs and more generally to all fixed costs thus suggesting one of the main factors assumed to drive the causal relationship between size and operating efficiency. These notions eventually led to some of the earliest models in strategy, notably the so-called “experience curve” which claimed that, because of all the factors mentioned above, increased size produced greater efficiency, and therefore growth and market leadership strategies resulted in superior performance (Gale, 1972, Buzzell et al., 1975, Henderson, 1980).
Much empirical research has investigated the size-profitability link, but few studies have actually succeeded in isolating the size-operating efficiency component of this more general relationship. The few empirical studies that have specifically examined this question have provided somewhat contradictory results. Focusing on the efficiency of R&D in the pharmaceutical industry, Handerson and Cockburn (1996) observe that greater size leads to enhanced research productivity. In contract, Zenger (1994) explained the often observed greater research productivity of smaller firms by suggesting that increased size leads to diseconomies of scale in R&D. Overall, results on the link between size and efficiency appear inconclusive. Interestingly, this discussion mirrors much older debates on the operational efficiency benefits of size: while, by putting forth the notion of decreasing returns, Ricardo posited that the size-efficiency relationship is positive only up to a certain point, Marshall (1920) argued that decreasing rates of return are primarily found in agricultural activities where expanding output entails cultivating less productive land. Marshall suggested, in contrast, that most manufacturing and trade activities which can be located freely benefit from “production on a large scale” (p278-290). Because M&A and organic growth entail varying levels of constraint on the location of activities, these ideas may provide insights into the relative impact of these modes of growth on operational efficiency.
Predictions on the impact of M&As on the benefits derived from size
Most extant research acknowledges that size and the expected subsequent benefits of size are major objectives that firms pursue when carrying out M&As (Capron et al., 2001; Dranove and Shanley, 1995; Lubatkin et al., 2001; Seth, 1990a, 1990b). Indeed, M&As directly result in an increase in firm size; moreover, horizontal M&As (involving firms operating in the same industry) increase the relative size of the firm in its industry. Because of this, horizontal M&As have raised serious concerns related to the potential market and bargaining power they create relative to the operating efficiency gains they produce (Farrell and Shapiro, 2001; Stigler, 1950; Eckbo, 1983).
On the other hand, how M&As affect firm performance has long been a subject of interest and research. However, research on the subject has failed to produce clear and definitive results. In a meta-analytic examination of post-acquisition performance, King et al. (2004) point out that, despite dozens of studies carried out on the subject, the impact of acquisitions on acquiring firm performance remains inconclusive
The impact of M&A on bargaining power As alternative modes of expansion have different impacts on the competitive landscape,
they can be expected to influence market power differently. M&As, unlike organic growth, lead to greater industry concentration by mechanically reducing the number of independent competitors, thus resulting in easier price coordination between incumbent firms (Stigler, 1950; Penrose, 1959; Barton and Sherman, 1984; Scherer & Ross 1990; Bruekner, Dyer and Spiller 1992; Lubatkin et al., 2001). In addition, while organic growth is, by definition, pursued incrementally, M&As result in a quick increase in firm size creating the internal stimulus to redesign pricing conditions (Capron et al., 2001). Further, in contrast to organic growth, M&A do not result in an increase in the total capacity in the industry, which can
6
exacerbate and intensify competition, particularly under conditions of low growth, maturity or decline in the industry (Dutz, 1989).
In addition, when compared to organic growth, M&As will create opportunities to share information (Capron, 1999) between the merging firms (e.g., on price discrimination) and maximize the likelihood of switching all purchases to the lowest bidding supplier or more sales to higher paying customers. M&As have another advantage over organic growth in terms of bargaining power: since they reduce the number of competitors directly, they lend more credibility to the threat of switching suppliers (or reducing options for customers) and therefore, provide more clout.
Finally, M&As are often explicitly justified by the promise of value creation for shareholders; this is often based on an anticipated increase in profits (Healy et al., 1992; Capron, Mitchell and Swaminathan, 2001) which in turn creates increased pressure on managers to achieve cost and price advantages quickly. Appropriation of value from suppliers and customers is often seen as one of the quicker mechanisms for value creation in M&As since they require less internal integration (Chipty and Snyder, 1999; Chae and Heidhues, 2004).
Based on these arguments, we expect M&As to lead to greater bargaining power than organic growth. Hence, the following hypothesis:
Hypothesis 1: Growth through M&As will result in greater bargaining power than that from organic growth.
The impact of M&A on operating efficiency In addition to bargaining power, another potential size-related benefit is operating
efficiency. Our present understanding in strategy takes into account the firm-specific investments in valuable resources that need to be made in order to achieve operating efficiencies (Barney, 1991). Further, both economies and diseconomies also depend on firms’ ability to handle the “complexity of production and marketing challenges” as well as on the ability of firms to manage growth (Scherer & Ross, 1990: 97-106).
We can extend this view to a comparison of modes of growth. A firm chooses where to locate its growth activities more freely – thus creating an optimal array of resources and investments - through organic growth than through M&As, which constrain the location and nature of acquired assets. For example, M&As may not result in the same operating efficiency gains as organic growth for a given level of manufacturing output because manufacturing plants are already in existence, may be located far apart and difficult to coordinate, and may reflect the path dependent resources and capabilities of the two merging firms (Scherer & Ross, 1990; Anand & Singh, 1997). Organic growth, on the contrary, makes it possible to precisely focus geographic expansion, thus optimizing “economies of density” (Caves, Christensen and Tretheway 1984). Similarly, M&As have been said to often result in the acquisition of undesired or indigestible assets (Hennart, 1988), which makes it all the more difficult to achieve the potential efficiency gains. Therefore, because they constrain both the location and nature of resources and growth activities, M&As might impede the realization of some of the efficiency gains theoretically made possible by the size achieved through external growth.
In addition, because M&As create firms with somewhat heterogeneous and potentially incompatible resources, they are unlikely to produce operating efficiency gains commensurate with the total size of the post merger firm. It is unlikely that even a relatively successful post-merger integration can result in an equal or greater level of consistency than what would result from organic growth (Simmonds, 1990). M&As create specific post-merger integration problems which lead to increased costs or reduced efficiency. Past research has shown that M&As lead to greater top-management turnover (Walsh, 1988), higher top-management

7
compensation (Wright, Kroll and Elenkov, 2002) as well as costly and disruptive workforce reductions (Krishnan, Hitt and Park, 2007). In addition, M&As often require a long and difficult process in order to align the organizational structures, systems and cultures of the involved firms (Pablo, 1994). Organic growth, in contrast, leads to a progressive and controlled increase in the factors of production, in line with the growth in volume output. In contrast, M&As result in the addition of the outputs of the involved firms along with the juxtaposition of their existing resources, capabilities and assets. Thus, for efficiency gains to materialize as a result of the M&A, i.e. for resources and assets to be optimized for the combined output volume and for the cost of these resources and assets to be spread over the entire output volume, reorganizations, rationalizations and divestitures must be carried out, which implies additional costs at the inception and some delay (Seth, 1990; Capron et al., 2001). Overall, we expect size related efficiency gains achieved through organic growth to be greater than those achieved through M&As.
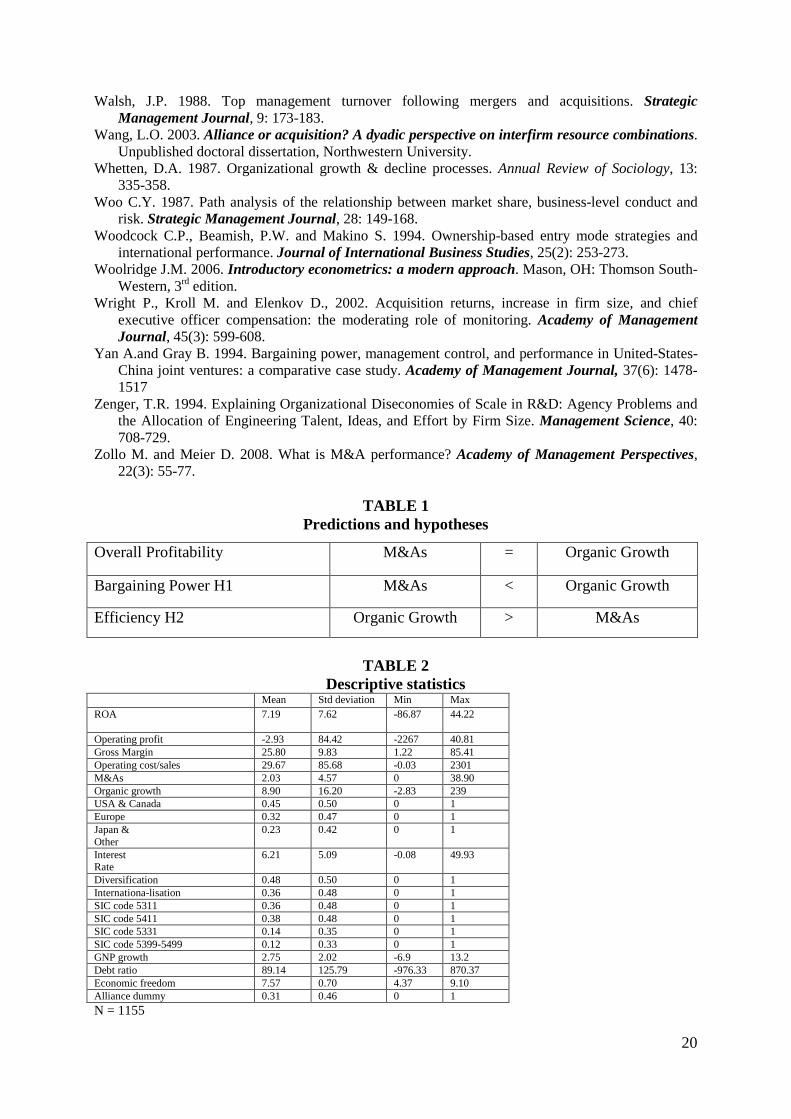
Hypothesis 2: Organic growth generates greater size related efficiency gains than M&As. Our predictions and hypotheses are summarized in figures 1, 2 and 3.
METHODS Empirical Setting
The empirical setting in which we tested our hypotheses is the global retailing industry. We selected this industry because several of its structural features make it particularly suitable for our research. First of all, the pursuit of growth has been a major strategic objective for most players in the industry, which has often been pursued through M&A, as reported by both academics (Akehurst, 1983; Higgins and Kerin, 1983; Pellegrini, 1994) and practitioners (Les Echos, 1999, p62-633). During the last 20 to 30 years, the industry has undergone a dramatic concentration process in response to size related critical success factors (Tucker, 1972; Porter, 1974; Akehurst, 1983; Grant, 1987; Shaw, Nisbet and Dawson, 1989; Pellegrini, 1994)4
Data
. Second, retailing is a particularly relevant industry in which to examine the performance impact of M&As because the concentration process in this industry has resulted from both M&As and organic growth (Kumar, Kerin and Pereira, 1991; Burt and Limmack, 2001). Third, and most importantly, this industry setting provides convenient performance measures on the basis of which we can distinguish between operating efficiency and bargaining power.
The main data sources we used for this study are the Osiris data base for all the information on the size and performance of the firms included in our sample, covering the 1984-2003 period, and the Thomson Mergers data base for the identification of all M&As that occurred in the industry. The Osiris database was selected because it provides data on firms in an international setting over an extended time period and adjusts accounting figures to reconcile some international differences in reporting. Our sample was selected from public firms in the Osiris database using five 4-digit SIC codes corresponding to non-specialized retail sectors: 5311 –department stores, 5331 –variety stores, 5399 –miscellaneous general merchandise, 5411 –grocery stores and 5499 –miscellaneous food stores. We also verified that all firms in our sample were included in the 2003 list of major retail firms in the world compiled by M+M Planet Retail. This resulted in a list of 83 firms, most of which are among the leading publicly traded firms in the industry. Previous studies have used a similar sampling approach (Gulati 1995a, 1995b). The period of study -1984 to 2003, is appropriate given that it is one during which the industry underwent rapid growth and significant 3 D. Bernard, then CEO of Carrefour : “Size is what drives our performance” 4 The size-performance relationship held true in our sample. All performance variables we used are positively and significantly affected by total firm sales.
8
concentration, with many firms growing organically at a rapid pace and also making extensive of M&As. For some companies, information was not available over the full time range, constraining us to use an unbalanced sample. Our resulting unbalanced sample consists of 1284 company-year observations, and includes firms with sales ranging from 42 million US dollars to 256 billion US dollars. Some of the companies in the sample, such as Target or Albertsons, are purely domestic while others, such as Carrefour, Ahold or Metro, are present in more than 20 countries around the world. The cumulated sales of the firms in our sample totaled $1,400 billion in 2003, which, according to Planet Retail, represented almost 30% of the total $5,000 billion sales of the worldwide retail industry. Dependent Variables
Our major objective is to evaluate the impact of M&As on performance and, more specifically, on the two main theoretical drivers of the size-performance relationship. Consequently, we chose accounting, rather than market-based, performance measures and focused on various aspects of profitability. Investor anticipations provide an aggregate measure of expected performance, but do not make it possible to attribute changes in overall performance to either efficiency gains or bargaining power (Eckbo, 1983). In contrast, accounting measures, such as cost of goods sold or operating expenses can be attributed more easily to one or the other of these factors. In addition, while M&As generally produce investor reactions easily visible in stock price, organic growth is not a discrete event for which clear reactions can be observed. Therefore, in line with previous research pursuing similar objectives in a broad range of industries (Lamont and Anderson, 1985; Simmonds, 1990; D’Aveni and Ravenscraft 1994; Wang 2003) or, more specifically, in the retail industry (Akehurst, 1983; Reijnders and Verhallen 1996), we measured profitability using various accounting indicators relative to sales and assets in order to disentangle the various size effects, i.e. evaluate bargaining power on the one hand, operating efficiency gains on the other hand.
First, gross margin, i.e. the spread between the price paid by buyers and the price charged by suppliers (cost of goods sold), serves to evaluate bargaining power. In this industry, firms in a given retail format and in a particular country, sell a relatively similar range of goods. Greater bargaining power should result in lower costs of purchased goods or higher selling price, but should not significantly affect internal operating costs. Gross margin is provided by the Osiris data base for all firms in the sample and is the difference between sales and purchases, divided by sales and is computed according to US GAAP guidelines.
Second, we used operating costs as a percentage of sales to assess operating efficiency gains. As discussed above, operating efficiency gains should primarily affect internal costs rather than the cost of purchased goods and services. Operating costs are also provided in the Osiris data base and include: store costs, including depreciation, headquarter costs, logistics costs, labor and other sales, general and administrative costs.
Finally, we used operating profit on sales and Return on Assets (ROA) in order to measure overall profitability and to compare our results to those from previous studies that have used these measures. Indeed, ROA is a common measure of profitability in strategy research (Goerzen and Beamish 2005), though it is somewhat unreliable as a measure of operating profits since it is effected by the choice of accounting methods and assumptions (Anand & Singh, 1997; Healy et al., 1992; Pautler, 2003). Operating profit as a percentage of sales is another alternative measure of overall profitability, but one that is not contaminated by choice of accounting rules for asset evaluation. Independent Variables
As our research aims at better understanding the influence of M&A on size-related performance effects, we have assessed M&A through its contribution to firm sales rather than through a dummy variable as has often been done in previous research (Brouthers and

9
Brouthers, 2000). Our chosen measure –M&A contribution to sales- represents a more fine-grained approach than previously used dummy variables. More specifically, we first identified for each firm and each year in our time series, whether a major horizontal M&A had been carried out. We included all M&As in which the smaller of the two firms’ sales accounted for at least 5% of the sales of the other. In total, we identified 151 horizontal M&A transactions within our sample. Then, in order to measure the significance of each transaction, we estimated the value of each M&A as the additional sales contributed by the target at the time of the event. This resulted in a continuous variable, accounting for M&A value that was included in the models for as long as the considered acquisition was not divested. We measured the value of organic growth as the difference between total company sales and the previously calculated value of M&As. We considered that the portion of sales which was not acquired via horizontal M&As, was the result of organic growth. Controls
We also included a number of controls in our study. Interest rate. First of all, we controlled for the rate of return on treasury bonds for each
year and each home country of the firms in our sample. We expect these interest rates to reflect the basic opportunity cost in an economy and to affect investor expectations, cost of capital and therefore earnings requirements. In other words, profitability is likely to fluctuate in line with interest rates.
GNP growth. We also control for annual GNP growth as a relevant measure of national economic climate. We expect profitability to vary positively with GNP. It is particularly relevant in our study as retailing is very sensitive to economic fluctuations.
We compiled interest rate and GNP growth data from the IMF International Financial Statistics Yearbooks.
Region. In line with previous research (Delios and Beamish 2001), we recognize that regional factors, might also influence profitability and therefore need to be controlled for. We assigned all firms in our sample to one of the three following zones: North America (US and Canada), Europe and others. In the models, Europe is the baseline category and is therefore excluded from the analysis.
Retail format. Different retail formats (department stores, variety stores, miscellaneous general merchandise stores, grocery stores and miscellaneous food stores) may have different levels of profitability because of their specificities in terms of location, average store size, service levels, competition, etc. We built dummies to account for four categories of retail format present in our sample. We had to group two of our five SIC categories (5399 –miscellaneous general merchandise and 5499 –miscellaneous food stores) because the number of observations in these two categories was too small. In the models, the combined miscellaneous food stores and miscellaneous general merchandise category is the baseline category and is therefore excluded from the analysis.
Internationalization. We suspect the level of internationalization of a retailer will impact its profitability as suggested in the international business literature (Vermeulen and Barkema 2002). A presence in multiple countries will create additional operating costs because of the administrative structure that needs to be set up in each country and will reduce opportunities for bargaining because a significant proportion of referenced products are procured locally. To account for such effects, we have built a dummy variable that takes on the value 1 as soon as a retailer is present in more than two countries.
Diversification. Because the variety and complexity of a retailer’s activities may also affect its performance (Pellegrini, 1994), we accounted for the number of retail formats in which a firm operates. We therefore built a dummy variable that takes on the value 1 when the retailer operates in more than two different retail formats.
10
Concentration ratio. In order to isolate the industry-wide effect of market power and disentangle that from bargaining power, we built a 4-firm concentration ratio (Scherer and Ross 1990), i.e. the cumulated market share of the four major players in the industry.
Use of alliances. We recognize that firms sometimes turn to alliances to achieve some of the objectives that others pursue through M&As (Hennart and Reddy, 1997; Garrette and Dussauge, 2000). It has also been argued that firms may react to M&As carried out by some of their competitors by entering into cooperative agreements with other incumbents (Moatti, 2007). To account for these possible influences on performance, we constructed a dummy variable that captures whether a firm is engaged in an alliance with another industry incumbent during any given year.
Sales growth. Recognizing that firm growth and profitability are linked, with faster growth resulting from aggressive pricing, we controlled for the annual increase in sales measured as a year-over-year percentage. Instruments
In our analysis, we use a two-stage model in order to account for endogeneity (see below). Such an approach requires the use of instrument variables, i.e. variables that are expected to affect the first-stage outcome (in our case, the extent to which a given firm will choose to grow through M&A) but not the second-stage dependent variables (in our case, profitability, gross margin and operating costs). Because our modeling includes two independent variables (M&A contribution to sales and organic growth contribution to sales) and therefore two first-stage equations, we used two such instruments: the economic freedom index and the company debt ratio. These instruments are likely to have an influence on mode choice but are not expected to directly impact profitability. We describe these variables below.
Economic Freedom Index. We used the index of economic freedom developed by the Fraser Institute. This instrument is a proxy for government policy and provides observations for our entire period of study. Hamilton & Nickerson (2003) have argued that government policy is often a relevant instrument variable to use in models that account for endogeneity. In studies of international expansion, the regulatory context has been widely considered as a determinant of market entry mode choice (Singh & Montgomery, 1987; Simmonds 1990; Hennart & Reddy, 1997) and provided it does not significantly limit entry, there is little reason to believe it will drastically alter profitability. Similar arguments could easily be extended to other types of expansion. For instance, horizontal M&As might be limited by stringent anti-trust laws while organic growth is, in some countries, made more difficult by regulations that restrict new store openings.
Debt ratio. We used financial leverage as a factor which may influence firms’decisions to merge and/or acquire (Hitt, Hoskinsson and Kim, 1997) but has little direct incidence on the performance variables we use. Debt levels and the resulting interest payments do not directly affect either gross margins or operating cost and profit. They do, however, impact the risk profile and expected returns to shareholders and, as such, are likely to influence the choice of how to grow.
Methodology Firms can be expected to self-select their relative reliance on either M&As or organic
growth. More precisely, the extent to which firms rely on on either of these two modes of expansion may be influenced by observed and unobserved firm and environment-specific characteristics.
Much prior research has focused on the circumstances that lead firms to opt for a particular mode of expansion (Kogut and Singh, 1988; Balakrishnan and Koza 1993; Eisenhardt and Schoonhoven 1996; Hennart and Reddy 1997; Barkema and Vermeulen, 1998;

11
Villalonga and McGahan, 2005). For instance, very profitable firms can afford M&As more than others (Parkhe, 1993). Similarly, greater international experience leads firms to favor organic growth over M&As for international expansion (Barkema and Vermeulen, 1998). Anecdotal evidence – Carrefour vs. Walmart for instance - suggests that firms facing a similar industry environment differ drastically in their expansion paths. Further, it is likely that many of these firm and environment-specific characteristics that influence the relative use of M&A vs. organic growth, also impact profitability. Thus, the choice to more or less extensively engage in M&As is not random but influenced by observed and unobserved characteristics, which in turn, impact profitability. Put differently, the observed heterogeneity in firm profitability may not only be due to mode of growth decisions, but also to pre-existing features that influenced this choice in the first place. In order to address this issue, we use a two-stage model as described below.
As our sample is an unbalanced panel, we first use cross sectional time series methods that account for both firm heterogeneity and time-related differences for each firm. Cross-sectional time series methods which limit the number of dummies in the model are particularly relevant when the sample includes numerous firms and relatively few years (Kennedy, 2003). Our sample fits those characteristics as it is comprised by 83 firms examined over a 20 year period. Recognizing that disturbances have different variances for each panel and are constant within panel, we first used GLS (Generalized Least Square) regressions applied to panel data and checked that the estimates were significantly different from those obtained with OLS (Ordinary Least Squares) using a Hausman test (Greene 2003). To control for the anticipated endogeneity of our model, we then tested the relationships through a two-stage least square model or instrument variable regression.
GLS regression. As a first step, before using the two stage model, we tested the impact of size and M&A as well as organic growth on profitability by running a single equation GLS regression using different profitability measures as the dependent variables and M&A and organic growth values as independent variables, along with the other previously mentioned controls. The tested relationship is given by the following equation for each firm i, in year t:
Pi, t = β0 + β1Mi, t + β2O i, t + β3Gi, t + β4Rt + β5Yt + β6Ai, t +β7I i, t + β8D i, t + β9S1i + β10 S2i + β11 S3i + β12Ui + β13Ji + β14Ct + εi,t + ηi where P is the profitability of firm i as a percentage of sales, in year t. M is the value of sales resulting from M&As, and O, the value of sales resulting from organic growth. G is the total annual growth in sales, R the interest rate, Y the GNP growth, A, I and D the alliance, international and diversification dummies respectively. S
(1)
1, S2 and S3
Two-stage least square. As firms self-select the degree to which they grow using either M&As or organic growth, we need to correct for the influence of mode choice by using two-stage least square models. We ran these models with fixed effects. Indeed, using fixed effects is a more robust approach when some explanatory variables may be correlated with unobserved effects (ε
are respectively SIC codes 5311, 5411 and 5331. U and J are the geographic region variables, (respectively USA/Canada and Japan/other). Finally, C is the industry concentration level.
i,t
Compared with the previously described GLS model, the two-stage model includes new estimates for the M&A and organic growth dependent variables: revenues attributable to past horizontal M&As and revenues derived from organic growth respectively. As we measure these modes of growth through their contribution to company sales rather than through a
). This is potentially the case when the unobserved effects reflect individual companies’ choices and preferences. More specifically, in panel data in which key explanatory variables are time-varying, fixed effects are more appropriate than random effects (Woolridge 2006, p497-8). We finally ran Hausman tests to check for endogeneity and confirmed that it was indeed necessary to use a two-stage least square method.

12
simple dummy variable our two corresponding variables are re-estimated by the two following models. This leads to a new estimate of the βn coefficients in equation (1).
M i, t = α 0 + α 1Y t + α2 G i, t + α3U i + α4J i + α5R t + α6I i, t + α7D i, t + α8S1 i + α9S2 i + α10 S3 i + α11Ct + α12F t + α14 L i, t + εi,t + ηi (2)O
i, t = δ0 + δ1 Y t + δ2 G i, t + δ3 U i + δ4 J i + δ5 R t + δ6I i, t + δ7D i, t + δ8 S1 i, + δ9 S2
i, + δ10 S3 i, + δ11Ct + δ12 Ft + δ15 L i, t + εi,t + ηi (3)where F is the index of economic freedom, and L is the debt ratio.
RESULTS Descriptive statistics
Table 2 presents descriptive statistics which show that the firms in our sample exhibit significant diversity on all variables. This diversity confirms there is substantial variance within our sample.
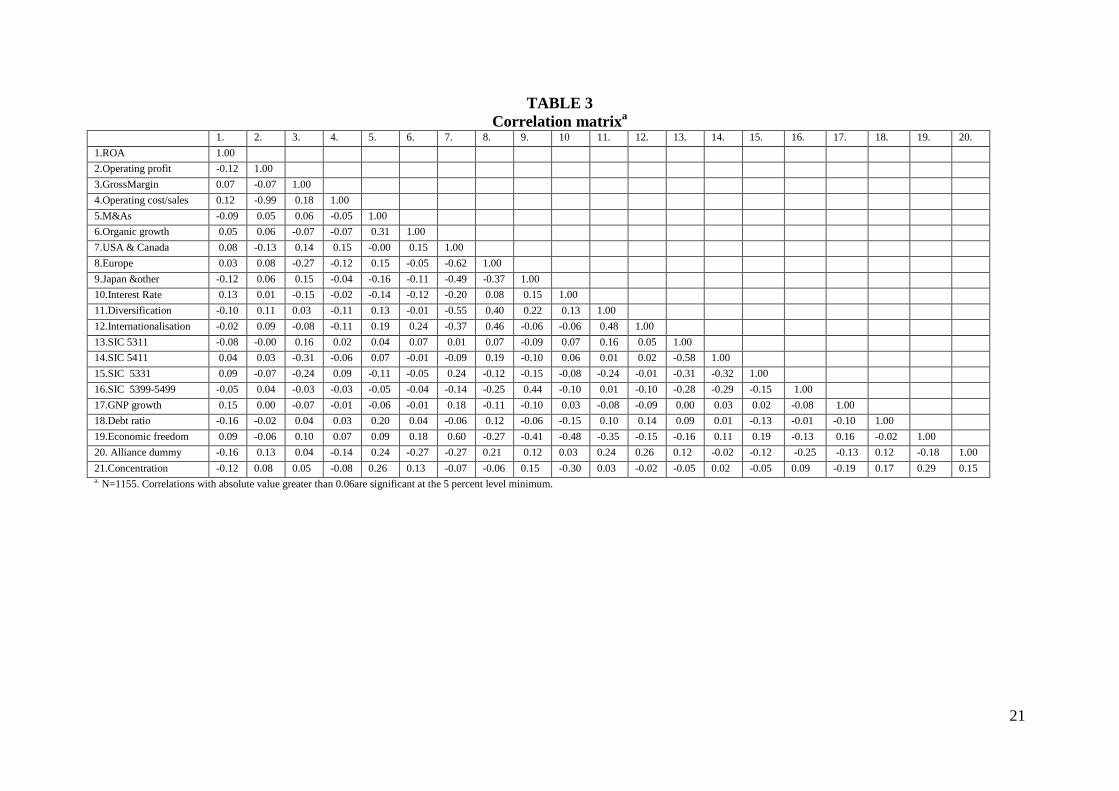
Insert Table 2 about here Table 3 presents the correlation matrix and reveals some significant correlations5
Insert Table 3 about here
. The high negative correlation between “Operating Profit” and “Operating costs on sales” unsurprisingly confirms that operating profit is strongly related to costs. Regarding the independent variables, the fact that M&A and organic growth are positively correlated suggests that rapidly growing companies extensively use both modes simultaneously. Regarding the instruments, they are only very weakly correlated to the profitability measures and thus appear to be relevant. As could be expected, the debt ratio is correlated to M&A intensity. Finally, it is interesting to note that geographic origin is correlated to some firm characteristics: while European firms are present in several geographic regions, and with several distribution formats, US and Canadian retailers are rarely international, and less diversified. This may relate to the size of their home market which forces European retailers to look for new areas of growth outside their region of origin or in new formats. Firms from other regions of the world are at an intermediate level in terms of internationalization.
Results before accounting for endogeneity
We first tried to replicate results from previous studies (e.g., Woodcock et al, 1994) that do not correct for endogeneity. Results from such studies correspond to the popular notion that M&As have a negative effect on profitability whereas organic growth has a more positive effect. As shown in table 4, when endogeneity is not accounted for, the impact of M&As on ROA (overall profitability measure) is negative and that of organic growth is positive, thus confirming the conventional wisdom on the subject (model 3).
Operating profit has often been argued to be a better measure of performance than ROA because it is not affected by accounting issues related to depreciation, goodwill, taxes, etc., and better reflects actual value created (Healy et al, 1992). In the model that uses the operating profit measure (model 4), the positive impact of organic growth is weaker while the negative impact of M&As fades away, thus challenging some of the received ideas on modes of growth. Further, M&As appear to improve gross margin (model 2). Organic growth affects gross margin negatively but also leads to a reduction in operating costs (model 2). Sales growth, interest rates, GNP growth, use of alliances, diversification, geography, SIC codes and concentration all appear to impact most performance measures.
Insert Table 4 about here 5 We confirmed lack of multi-colinearity by running variation inflation factors (VIF) for all models and confirmed that their absolute level was far below the usual acceptable threshold of 10, with a maximum mean at 2.05 and a maximum individual level at 3.74.
13
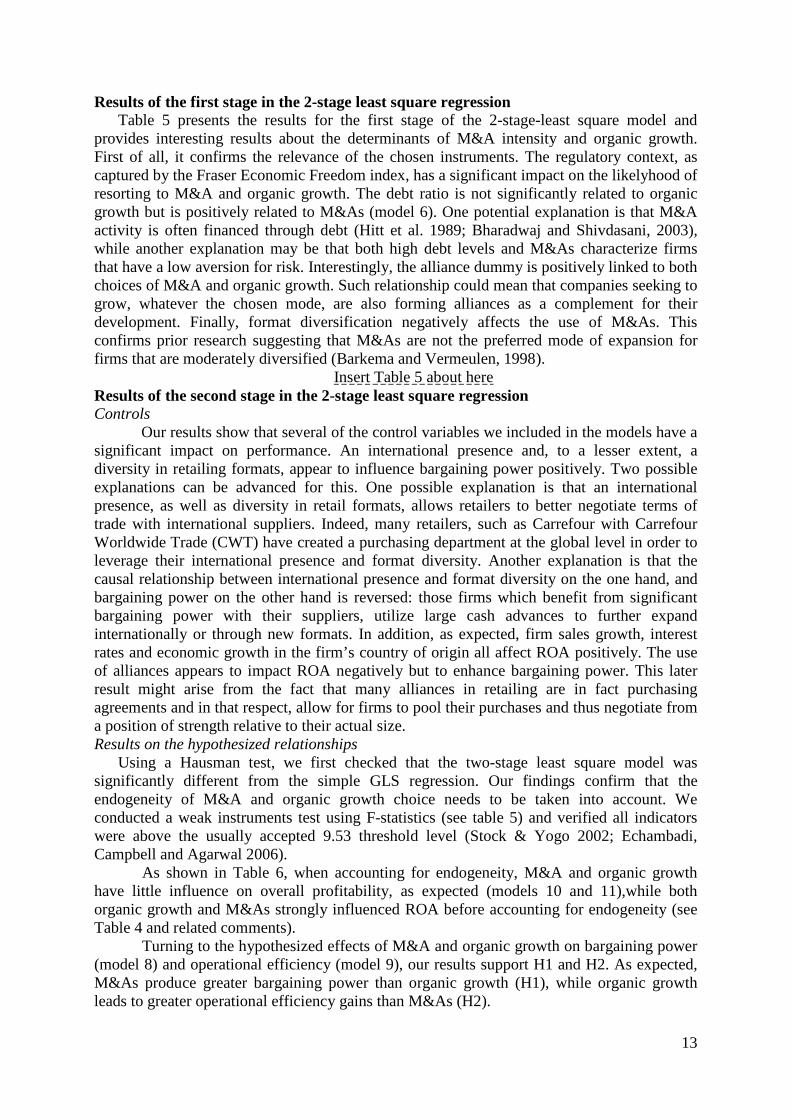
Results of the first stage in the 2-stage least square regression Table 5 presents the results for the first stage of the 2-stage-least square model and
provides interesting results about the determinants of M&A intensity and organic growth. First of all, it confirms the relevance of the chosen instruments. The regulatory context, as captured by the Fraser Economic Freedom index, has a significant impact on the likelyhood of resorting to M&A and organic growth. The debt ratio is not significantly related to organic growth but is positively related to M&As (model 6). One potential explanation is that M&A activity is often financed through debt (Hitt et al. 1989; Bharadwaj and Shivdasani, 2003), while another explanation may be that both high debt levels and M&As characterize firms that have a low aversion for risk. Interestingly, the alliance dummy is positively linked to both choices of M&A and organic growth. Such relationship could mean that companies seeking to grow, whatever the chosen mode, are also forming alliances as a complement for their development. Finally, format diversification negatively affects the use of M&As. This confirms prior research suggesting that M&As are not the preferred mode of expansion for firms that are moderately diversified (Barkema and Vermeulen, 1998).
Insert Table 5 about here Results of the second stage in the 2-stage least square regression Controls
Our results show that several of the control variables we included in the models have a significant impact on performance. An international presence and, to a lesser extent, a diversity in retailing formats, appear to influence bargaining power positively. Two possible explanations can be advanced for this. One possible explanation is that an international presence, as well as diversity in retail formats, allows retailers to better negotiate terms of trade with international suppliers. Indeed, many retailers, such as Carrefour with Carrefour Worldwide Trade (CWT) have created a purchasing department at the global level in order to leverage their international presence and format diversity. Another explanation is that the causal relationship between international presence and format diversity on the one hand, and bargaining power on the other hand is reversed: those firms which benefit from significant bargaining power with their suppliers, utilize large cash advances to further expand internationally or through new formats. In addition, as expected, firm sales growth, interest rates and economic growth in the firm’s country of origin all affect ROA positively. The use of alliances appears to impact ROA negatively but to enhance bargaining power. This later result might arise from the fact that many alliances in retailing are in fact purchasing agreements and in that respect, allow for firms to pool their purchases and thus negotiate from a position of strength relative to their actual size. Results on the hypothesized relationships
Using a Hausman test, we first checked that the two-stage least square model was significantly different from the simple GLS regression. Our findings confirm that the endogeneity of M&A and organic growth choice needs to be taken into account. We conducted a weak instruments test using F-statistics (see table 5) and verified all indicators were above the usually accepted 9.53 threshold level (Stock & Yogo 2002; Echambadi, Campbell and Agarwal 2006).
As shown in Table 6, when accounting for endogeneity, M&A and organic growth have little influence on overall profitability, as expected (models 10 and 11),while both organic growth and M&As strongly influenced ROA before accounting for endogeneity (see Table 4 and related comments).
Turning to the hypothesized effects of M&A and organic growth on bargaining power (model 8) and operational efficiency (model 9), our results support H1 and H2. As expected, M&As produce greater bargaining power than organic growth (H1), while organic growth leads to greater operational efficiency gains than M&As (H2).

14
Insert Table 6 about here Robustness tests It is unclear whether modes of growth should have an immediate or lagged impact on
profitability. Because of this, we also tested for lagged effects. When replacing values of the dependent variables at time ‘t’ by those at t+1 through t+5, the results suggest some interesting insights (see appendix 1). The results on the bargaining power effect of M&As dissipate after only two years, suggesting that external growth provides a one-shot opportunity to re-negotiate terms of trade with suppliers/buyers and that most firms take advantage of such an opportunity shortly after acquisitions occur. On the other hand, efficiency gains following organic growth remain significant over a much longer period of time, suggesting that firms need to continue fine-tuning their operations during several years to reap the full operational benefits of size increases achieved through organic growth. This might be due to the fact that improving operational efficiency is a more complex process than renegotiating supplier contracts. Finally, it is interesting to note that the negative impact of M&As on operational efficiency disappears after only two years, suggesting that the disruption in operations produced by post merger integration is taken care of fairly rapidly by most firms (Homburg and Bucerius, 2006).
To account for the fact that M&As and organic growth do not produce the expected benefits with similar time frames, we also ran models that incorporated different lags for M&A on the one hand and organic growth on the other hand. Within a 3 year time span, the key results remain substantively unchanged. The effects of M&As on gross margin as well as the impact of organic growth on operating efficiency appear to be strongest within a fairly short lag and dissipate rapidly, irrespective of the lags used for the other mode of growth.
DISCUSSION AND CONCLUSIONS
Our results confirm that, when endogeneity is accounted for, the extent to which firms use
a given mode of expansion has little impact on overall profitability consistent with previous work (Brouthers & Brouthers, 2002; Shaver 1998; Hamilton & Nickerson 2003). More importantly, they also show that mode of expansion does have a significant impact on the main underlying drivers of overall profitability. Our study reveals that M&As increase bargaining power more than organic growth or alliances while organic growth enhances efficiency to a greater extent than both M&As and alliances. We have used a more finer-grained measure to capture mode of growth by observing how much of a firm’s business is attributable to each mode, while prior studies relied on a dummy variable to denote whether a firm had chosen one mode over another.
Our results have several major implications for theory. We have shown that firm size impacts profitability through two very distinct mechanisms: bargaining power and operational efficiency. Previous research has not teased apart these variables. Further, even though firm size is one of the most commonly used control variables in empirical Strategy literature, we know little about it in conceptual terms and our study helps to shed light on it. By focusing on bargaining power (a firm-level construct) rather than on market power (an industry level construct), we contribute to a better understanding of how firm growth contributes to a firm’s competitive advantage by enhancing its position relative to competition.
Further, we distinguish between two different aspects of a firm’s advantage, a cost advantage resulting from operational efficiency and a cost/price advantage resulting from favorable bargaining conditions. Finally, we contribute to the literatures on growth and modes of growth (Villalonga and McGahan, 2005) by demonstrating that though firms tend to make the optimal mode of growth choices (i.e. mode of growth per se has no overall performance

15
implications), this choice has significantly different effects in terms of where the costs and benefits arise. Our research demonstrates that, despite the lack of any significant influence of mode of growth on overall profitability (Shaver, 1998), there is a contingency effect of mode of growth choice on which theoretical driver of profitability dominates. Our study also contributes to the literature on modes of growth by simultaneously taking into account all three major modes of expansion and comparing profitability implications of relying more extensively on one mode or on another.
Our study also has implications for practice. It suggests that firms engaging in M&As derive an immediate increase in size but pay a price in terms of operational efficiency. This is consistent with the presence of “diseconomies of time compression” (Dierickx & Cool 1989). Also, it suggests that firms pursuing different growth strategies need to orient their profit enhancing or cost reduction efforts according to the particular mode of growth they are emphasizing: when making acquisitions, managers should focus on obtaining better prices from suppliers or customers; when growing organically, managers should pay close attention to the better use they can make of available resources and assets. Conversely, if we assume out that managers make fully informed choices, our results could suggest that M&As “naturally” produce bargaining benefits while organic growth “naturally” produces operational efficiency gains, and that managers could further increase profitability by specifically targeting cost reductions that usually go untapped in the particular move they are undertaking, i.e. efficiency gains in M&As and bargaining benefits in organic growth.
Despite what we believe are the main contributions of our work for both theory and practice, we recognize it has some limitations. It would be better to have more disaggregated data. With such disaggregated data, perhaps we would have obtained even more significant results since aggregation biases our results conservatively. Also, the timing and pace of growth appear as important factors that impact both the emphasis firms put on one mode over another and the performance impact of any particular mode of growth. These factors call for further investigation (Vermeulen and Barkema 2002).
Despite these limitations, we believe that our study makes a useful contribution. It contributes to a deeper understanding of the size-performance relationship. Further, it contributes to the analysis of the specific impact of expansion mode on performance by extending prior work that took the endogeneity of mode choice into account. We show that, despite not having a significant impact on overall profitability, mode choice does affect the various drivers of profitability –i.e. operational efficiency gains and bargaining power-, in a differential manner. When a firm has made the decision to expand, its decision to achieve such growth primarily through one or the other of the two major modes –M&As or organic growth- is not completely determined by the expected impact on overall profitability but is rather a trade-off between increasing bargaining power and improving operational efficiency. Our results show that M&As are indeed the best way to increase bargaining power and that organic growth is the ideal mode for achieving operating efficiency gains. The choice between M&As and organic growth depends more on the specific objectives or strategy of each firm than on the expected impact on overall profitability.

16
References Akehurst, G. 1983. Concentration in retail distribution: measurement and significance. Service
Industries Journal, 3(2): 161-179. Anand, J. and Singh H. 1997. Asset redeployment, acquisitions and corporate strategy in declining
industries. Strategic Management Journal, Special Issue (18): 99-118. Baden-Fuller, C. 1983. The implications of the learning curve for firm strategy and public policy,
Applied Economics, 15: 541-51. Bain JS.1951. Relation of profit rate to industry concentration: American manufacturing, 1936-1940.
The Quarterly Journal of Economics, 65(3): 293-324. Balakrishnan, S. and Koza, M.P. 1993. Information asymmetry, adverse selection and joint venture.
Journal of Economic Behavior and Organization, 20: 99-117. Barkema, H.G. and Vermeulen, F. 1998. International expansion through start-up or acquisition: a
learning perspective. Academy of Management Journal, 41(1): 7-26. Barney, J. 1991. Firm resources and sustained competitive advantage. Journal of Management, 17:
99-120. Barton, D.M. and Sherman, R. 1984. The price and profit effects of horizontal merger: a case study.
The Journal of Industrial Economics, 33: 165-177. Besanko, D., Dranove, D. and Shanley, M. 2000. Economics of Strategy. John Wiley & Sons Inc. Bharadwaj, A. and Shivdasani, A. 2003. Valuation effects of bank financing in acquisitions. Journal
of Financial Economics, 67(1): 113-148. Brouthers, K.D. and Brouthers, L.E. 2000. Acquisition or Greenfield start-up? Institutional, cultural
and transaction cost influences. Strategic Management Journal, 21: 89-97. Brouthers, K.D. 2002. Institutional, cultural and transaction cost influences on entry mode choice and
peformance. Journal of International Business Studies, 33(2): 203-221. Brueckner J.K., Dyer N.J. and Spiller P.T. 1992. Fare determination in airline hub-and-spoke
networks. Rand Journal of Economics, 23: 309-333 Burt, S. and Limmack, R. 2001. Takeovers and shareholder returns in the retail industry. International
Review of Retail, Distribution and Consumer Research, 11(1): 1-21. Buzzell R.D., Gale B.T. and Sultan R.G.M. 1975. Market share: a key to profitability. Harvard
Business Review, 53(1): 97-106. Capron L. 1999. The long-term performance of horizontal acquisitions. Strategic Management
Journal, 20: 987-1018. Capron, L., P. Dussauge and Mitchell W. 1998. Resource Redeployment Following Horizontal
Acquisitions in Europe and North America, 1988-1992. Strategic Management Journal 19(7): 631.
Capron L., Mitchell W. and Swaminathan A. 2001. Asset divestiture following horizontal acquisitions: a dynamic view. Strategic Management Journal, 22: 817-844.
Caves, D.D., Christensen, L.R. and Tretheway, M.W. 1984. Economies of density versus economies of scale: why trunk and local service airlines costs differ. Rand Journal of Economics, 15(4): 471-489.
Chae S. and Heidhues P., 2004. Buyers’ alliances for bargaining power. Journal of Economics & Management Strategy, 13(4): 731-754.
Chamberlain E.H. 1933. The theory of monopolistic competition. Cambridge, MA: Harvard University Press.
Chatterjee, S. 1986. Types of synergies and economic values: the impact of acquisitions on merging and rival firms, Strategic Management Journal, 7: 119-139.
Chipty T. and Snyder C.M. 1999. The role of firm size in bilateral bargaining: a study of the cable television industry. Review of Economics & Statistics, 81(2): 326-340.
Cockburn I.M. and Henderson R.M., 2001. Scale and scope in drug development: unpacking the advantages of size in pharmaceutical research. Journal of Health Economics, 20(6): 1033-1057.
Collins A. 2002. The determinants of retailers’ margin related bargaining power: evidence from the Irish food manufacturing industry, International Review of Retail, Distribution and Consumer Research, 12(2): 165-189.

17
Conner, K. R. 1991. A Historical Comparison of Resource-Based Theory and Five Schools of Thought Within Industrial Organization Economics: Do We Have a New Theory of the Firm? Journal of Management 17(1): 121.
Cool K. and Henderson J. 1998. Power and firm profitability in supply chains : French manufacturing industry in 1993. Strategic Management Journal, 19: 909-926.
Cournot A.A. 1838. Researches into the mathematical principles of the theory of wealth. English edition of Recherches sur les principes mathématiques de la théorie des richesses, NY: Kelley.
Datta D.K. 1991. Organizational fit and acquisition performance: effects of post-acquisition integration. Strategic Management Journal, 12: 281-297.
Datta D.K., Pinches G.E. and Narayanan V.K. 1992. Factors influencing wealth creation from mergers and acquisitions: a meta-analysis. Strategic Management Journal, 13(1): 64-84.
D’Aveni R.A. and Ravenscraft D.J. 1994. Economies of integration versus bureaucracy costs: does vertical integration improve performance. Academy of Management Journal, 37(5): 1167-1206.
Dierickx, I. and Cool, K. 1989. Asset stock accumulation and sustainability of competitive advantage. Management Science, 35(12): 1504-1511.
Dobson P. and Waterson M. 1999. Retailer power: recent developments and policy implications, Economic Policy, 14(28): 135-164.
Dodd, P. and Ruback, R. 1977. Tender offers and stockholder returns: An empirical analysis, Journal of Financial Economics, 5: 351-373
Dranove, D. and M. Shanley 1995. Cost Reductions or Reputation Enhancement as Motives for Mergers: the Logic of Multihospital Systems. Strategic Management Journal
Dussauge P., Garrette B., and Mitchell, W. 2000. Learning from competing partners: outcomes and durations of scale and link alliances in Europe, North America and Asia. Strategic Management Journal, 21: 99-126.
, 16(1): 55-74.
Dutz M.A., 1989. Horizontal mergers in declining industries. International Journal of Industrial Organization, 7(1): 11-23.
Echambadi R., Campbell B. and Agarwal R. 2006. Encouraging best-practice in quantitative management research: an incomplete list of opportunities. Journal of Management Studies, 43(8): 1801-1820.
Eckbo, E. 1983. Horizontal mergers, collusion, and stockholders wealth Journal of Financial Economics,
Einsenhardt, K.M. and Schoonohven, C.B. 1996. Ressource-based view of strategic alliance formation: strategic and social effects in entrepreneurial firms. Organization Science, 7: 136-150
11(1-4): 241-273.
Farrell J. and Shapiro C., 2001. Scale economies and synergies in horizontal mergers analysis, Antitrust Law Journal, 68(3): 685-711.
Fernandez R. and Özler S., 1999. Debt concentration and bargaining power : large banks, small banks, and secondary market prices. International Economic Review, 40(2): 333-356. Gale, B.T., 1972. Market share and rate of return. Review of Economics and Statistics, 54: 412-423. Gale, B.T. and Branch, B. 1982. Concentration versus market share: which determines
performance and why does it matter? The Antitrust bulletin, 27: 83-106. Galbraith, J.K. 1952. American Capitalism: the concept of countervailing power. Boston: Houghton
Mifflin. Garrette B. and Dussauge P. 2000. Alliances versus acquisitions: choosing the right option. European
Management Journal, 18(1): 63-69. Goerzen A. and Beamish P.W. 2005. The effect of alliance network diversity on multinational
enterprise performance. Strategic Management Journal, 26(4): 333-354. Grant R.M. 1987. Manufacturer – retailer relations: the shifting balance of power. In Gerry Johnson
(Eds).Business Strategy and Retailing: 43-58. NY: John Wiley and Sons. Greene W.H. 2003. Econometric Analysis. (5th
Gulati, R. 1995a. Does familiarity breed trust? The implications of repeated ties for contractual choice in alliances. Academy of Management Journal, 38(1): 85-112.
ed.). Pearson Education: Prentice Hall.
Gulati, R 1995b. Social structure and alliance formation patterns: a longitudinal analysis. Administrative Science Quarterly, 40(4): 619-652.
Gupta D. and Gerchak Y., 2002. Quantifying operational synergies in a merger/acquisition. Management Science, 48(4): 517-533.

18
Hall G. and Howell S. 1985. The experience curve from the economist’s perspective. Strategic Management Journal, 6(3): 197-212.
Hall M. and Weiss L. 1967. Firm size and profitability. Review of Economics and Statistics, 49: 319-331.
Hamilton, B.H. and Nickerson J.A. 2003. Correcting for endogeneity in strategic management research. Strategic Organization, 1(1): 51-78.
Haspeslagh, P. C. and D. B. Jemison 1991. Managing acquisitionsHealy, P.M., Palepu K.G. and Ruback, R.S.1992. Does corporate performance improve after mergers?.
Journal of Financial Economics, 31: 135-175.
. New York, Free Press.
Henderson 1980. in Perspectives on experience, Boston: Boston Consulting Group. Hennart JF. 1988. A transaction costs theory of equity joint venture. Strategic Management Journal,
9: 361-374. Hennart JF. and Reddy S. 1997. The choice between mergers/acquisitions and joint-ventures: the case
of Japanese investors in the United States. Strategic Management Journal, 18: 1-12. Higgins R.C. and Kerin R.A. 1983. Managing the growth-financial policy nexus in retailing. Journal
of Retailing, 59(3): 19-48. Hitt M.A., Hoskisson R.E., Ireland, R.D. and Harrison, J. (1989). Acquisitive growth strategy and
relative R&D intensity: the effects of leverage, diversification, and size. Academy of Management Proceedings: 22-26.
Hitt M.A., Hoskisson R.E. and Kim H. 1997. International diversification: effects on innovation and firm performance in product-diversified firms. Academy of Management Journal, 40: 767-798.
Homburg C. and Bucerius M., 2006. Is speed of integration really a success factor of mergers and acquisitions? An analysis of the role of internal and external relatedness. Strategic Management Journal, 27(4): 347-367.
Jacobson R. and Aaker D. 1985. Is market share all that its cracked up to be. Journal of Marketing, 49: 11-22.
Karnani, A. 1984. Generic competitive strategies – an analytical approach. Strategic Management Journal, 5: 367-380.Kerin R.A. and Varaiya N. 1985. Mergers and Aquisitions in Retailing: a review and critical analysis. Journal of Retailing, 61(1): 9-34.
Katz, M.L. 1987. The welfare effects of third-degree price discrimination in intermediate good markets, American Economic Review, 77: 154-167.
Kitching J., 1967. Why do mergers miscarry? Harvard Business Review, 45(6): 84-101. King, D.R., Dalton D.R., Daily, C.M. and Covin, J.G. 2004. Meta-analyses of post-acquisition
performance: indications of unidentified moderators. Strategic Management Journal, 25: 187-200.
Kogut B. and Singh H. 1988. The effect of national culture on the choice of entry mode. Journal of International Business Studies, 19: 411-432.
Krishnan H.A., Hitt M.A. and Park D., 2007. Acquisition premiums, subsequent workforce reduction and post-acquisition performance. Journal of Management Studies, 44(5): 709-732.
Kumar V., Kerin R.A., and Pereira A. 1991. An empirical assessment of merger and acquisition activity in retailing. Journal of Retailing, 67(3): 321-338.
Lamont B.T. and Anderson C.R. 1985. Mode of corporate diversification and economic performance. Academy of Management Journal, 28(4): 926-934.
Lubatkin, M., Schulze, W.S, Mainkar A. et Cotterill, R.W. 2001. Ecological investigation of firm effects in horizontal mergers. Strategic Management Journal, 22: 335-357.
Lustagarten, S.H. 1975. The impact of buyer concentration in manufacturing industries. The Review of Economics and Statistics, 57: 125-132.
Makadok R. 1999. Interfirm differences in scale economies and the evolution of market share. Strategic Management Journal. 20(10): 935-952.
Marshall A. 1920. Principles of Economics. (8th
Mason E.S. 1939. Price and production policies of large-scale enterprise. The American Economic Review, 29(1), Papers and proceedings of the fifty-first annual meeting of the American Economic Association: 61-74.
ed.). London: Mc Millan & Company Limited.
Moatti V. 2007. Learning to expand or expanding to learn? European Management Journal, 27(1): 36-46

19
Pablo A.L., 1994. Determinants of acquisition integration level: a decision-making perspective. Academy of Management Journal, 37(4): 803-836.
Panzar J.C. and Willig R.D. 1981. Economies of scope. American Economic Review, 71(2): 268-272. Parkhe, A. 1993. Strategic alliance structuring: a game theoretic and transaction cost examination of
interfirm cooperation. Academy of Management Journal, 36(4): 794-829. Pautler, P.A. 2003. Evidence on mergers and acquisitions. The antitrust Bulletin, 2: 119-207. Pellegrini L. 1994. Alternatives for growth and internationalization in retailing. The International
Review of Retail, Distribution and Consumer Research, 4(2): 121-147. Penrose E.T. 1959. The theory of the growth of the firm. London: Basil Blackwell. Porter M.E. 1974. Consumer behavior, retailer power and market performance in consumer goods
industries. The Review of Economics and Statistics, 61(4): 419-436. Porter, M.E. 1979. How competitive forces shape strategy. Harvard Business Review. Porter, M.E. 1980. Competitive Strategy. NY: Free Press. Ranft A.L. and Lord M.D., 2002.Acquiring new technologies and capabilities: a grounded model of
acquisition implementation. Organization Science, 13(4): 420-441. Reijnders W.JM and Verhallen T.M. 1996. Strategic alliances among small retailing firms: empirical
evidence for the Netherlands. Journal of Small Business Management, 34(1): 36-45. Ricardo D. 1821. Principles of Political Economy and Taxation. New edition 1996. Amherst New
York: Prometheus Books. Robinson E.A.G. 1958. The structure of competitive industry: 26-27. Chicago: University of Chicago
Press. Ross D. 1986. Learning to dominate. Journal of Industrial Economics, 34(4): 337-353. Scherer F. and Ross D. 1990. Industrial market structure and economic performance. Boston MA:
Houghton, Mifflin. Seth A. 1990 a. Value creation in acquisitions: a re-examination of performance issues. Strategic
Management Journal, 11: 99-115. Seth, A. 1990 b. Sources of value creation in acquisitions: an empirical investigation, Strategic
Management Journal, 11: 431-446. Shaver, J.M. 1998. Accounting for endogeneity when assessing strategy performance : does entry
mode choice affect FDI survival?. Management Science, 44(4): 571-586. Shaw S.A., Nisbet D.J. and Dawson J.A. Economies of scale in UK supermarkets: some preliminary
findings. International Journal of Retailing, 4(5). Simmonds P.G. 1990. The combined breadth and mode dimensions and the performance of large
diversified firms. Strategic Management Journal, 11: 399-410. Singh H. and Montgomery C. 1987. Corporate acquisition strategies and economic performance.
Strategic Management Journal, 8(4): 377-386. Smit S., Thompson C.M. and Viguerie S.P. 2005. The do-or-die struggle for growth. The McKinsey
Quarterly, 3. Smith A. 1776. On the causes of the wealth of nations. Stigler G.J. 1950. Monopoly and oligopoly by merger. The American Economic Review, 40(2) Papers
and Proceedings of the sixty-second annual Meeting of the American Economic Association: 23-34.
Stock J.H. and Yogo M. 2002. Testing for weak instruments in IV linear regressions. NBER (National Bureau of Economic Research) Working Paper T0284, Cambridge, MA.
Teece D.J., Pisano G. & Shuen A., 1997. Dynamic capabilities and strategic management. Strategic Management Journal, 18(7): 509-533.
Tucker K.A. 1972. Economies of scale in retailing: a note. Journal of industrial economics, 20(3): 291-294.
Tyagi R.K. 2001. Why do suppliers charge larger buyers lower prices? The Journal of Industrial Economics, 49(1): 45-61
Vermeulen, F. and Barkema, H. 2002. Pace, rhythm and scope: process dependence in building a profitable multinational corporation. Strategic Management Journal, 23: 637-653.
Villalonga, B. and McGahan A.M. 2005. The choice among acquisitions, alliances and divestitures. Strategic Management Journal, 26(13): 1183-1208.
20
Walsh, J.P. 1988. Top management turnover following mergers and acquisitions. Strategic Management Journal, 9: 173-183.
Wang, L.O. 2003. Alliance or acquisition? A dyadic perspective on interfirm resource combinations. Unpublished doctoral dissertation, Northwestern University.
Whetten, D.A. 1987. Organizational growth & decline processes. Annual Review of Sociology, 13: 335-358.
Woo C.Y. 1987. Path analysis of the relationship between market share, business-level conduct and risk. Strategic Management Journal, 28: 149-168.
Woodcock C.P., Beamish, P.W. and Makino S. 1994. Ownership-based entry mode strategies and international performance. Journal of International Business Studies, 25(2): 253-273.
Woolridge J.M. 2006. Introductory econometrics: a modern approach. Mason, OH: Thomson South-Western, 3rd
Wright P., Kroll M. and Elenkov D., 2002. Acquisition returns, increase in firm size, and chief executive officer compensation: the moderating role of monitoring. Academy of Management Journal, 45(3): 599-608.
edition.
Yan A.and Gray B. 1994. Bargaining power, management control, and performance in United-States-China joint ventures: a comparative case study. Academy of Management Journal, 37(6): 1478-1517
Zenger, T.R. 1994. Explaining Organizational Diseconomies of Scale in R&D: Agency Problems and the Allocation of Engineering Talent, Ideas, and Effort by Firm Size. Management Science, 40: 708-729.
Zollo M. and Meier D. 2008. What is M&A performance? Academy of Management Perspectives, 22(3): 55-77.
TABLE 1
Predictions and hypotheses
Overall Profitability M&As = Organic Growth
Bargaining Power H1 M&As < Organic Growth
Efficiency H2 Organic Growth > M&As
TABLE 2
Descriptive statistics Mean Std deviation Min Max ROA
7.19 7.62 -86.87 44.22
Operating profit -2.93 84.42 -2267 40.81 Gross Margin 25.80 9.83 1.22 85.41 Operating cost/sales 29.67 85.68 -0.03 2301 M&As 2.03 4.57 0 38.90 Organic growth 8.90 16.20 -2.83 239 USA & Canada 0.45 0.50 0 1 Europe 0.32 0.47 0 1 Japan & Other
0.23 0.42 0 1
Interest Rate
6.21 5.09 -0.08 49.93
Diversification 0.48 0.50 0 1 Internationa-lisation 0.36 0.48 0 1 SIC code 5311 0.36 0.48 0 1 SIC code 5411 0.38 0.48 0 1 SIC code 5331 0.14 0.35 0 1 SIC code 5399-5499 0.12 0.33 0 1 GNP growth 2.75 2.02 -6.9 13.2 Debt ratio 89.14 125.79 -976.33 870.37 Economic freedom 7.57 0.70 4.37 9.10 Alliance dummy 0.31 0.46 0 1 N = 1155
21
TABLE 3 Correlation matrix
a
1. 2. 3. 4. 5. 6. 7. 8. 9. 10 11. 12. 13. 14. 15. 16. 17. 18. 19. 20. 1.ROA 1.00 2.Operating profit -0.12 1.00 3.GrossMargin 0.07 -0.07 1.00 4.Operating cost/sales 0.12 -0.99 0.18 1.00 5.M&As -0.09 0.05 0.06 -0.05 1.00 6.Organic growth 0.05 0.06 -0.07 -0.07 0.31 1.00 7.USA & Canada 0.08 -0.13 0.14 0.15 -0.00 0.15 1.00 8.Europe 0.03 0.08 -0.27 -0.12 0.15 -0.05 -0.62 1.00 9.Japan &other -0.12 0.06 0.15 -0.04 -0.16 -0.11 -0.49 -0.37 1.00 10.Interest Rate 0.13 0.01 -0.15 -0.02 -0.14 -0.12 -0.20 0.08 0.15 1.00 11.Diversification -0.10 0.11 0.03 -0.11 0.13 -0.01 -0.55 0.40 0.22 0.13 1.00 12.Internationalisation -0.02 0.09 -0.08 -0.11 0.19 0.24 -0.37 0.46 -0.06 -0.06 0.48 1.00 13.SIC 5311 -0.08 -0.00 0.16 0.02 0.04 0.07 0.01 0.07 -0.09 0.07 0.16 0.05 1.00 14.SIC 5411 0.04 0.03 -0.31 -0.06 0.07 -0.01 -0.09 0.19 -0.10 0.06 0.01 0.02 -0.58 1.00 15.SIC 5331 0.09 -0.07 -0.24 0.09 -0.11 -0.05 0.24 -0.12 -0.15 -0.08 -0.24 -0.01 -0.31 -0.32 1.00 16.SIC 5399-5499 -0.05 0.04 -0.03 -0.03 -0.05 -0.04 -0.14 -0.25 0.44 -0.10 0.01 -0.10 -0.28 -0.29 -0.15 1.00 17.GNP growth 0.15 0.00 -0.07 -0.01 -0.06 -0.01 0.18 -0.11 -0.10 0.03 -0.08 -0.09 0.00 0.03 0.02 -0.08 1.00 18.Debt ratio -0.16 -0.02 0.04 0.03 0.20 0.04 -0.06 0.12 -0.06 -0.15 0.10 0.14 0.09 0.01 -0.13 -0.01 -0.10 1.00 19.Economic freedom 0.09 -0.06 0.10 0.07 0.09 0.18 0.60 -0.27 -0.41 -0.48 -0.35 -0.15 -0.16 0.11 0.19 -0.13 0.16 -0.02 1.00 20. Alliance dummy -0.16 0.13 0.04 -0.14 0.24 -0.27 -0.27 0.21 0.12 0.03 0.24 0.26 0.12 -0.02 -0.12 -0.25 -0.13 0.12 -0.18 1.00 21.Concentration -0.12 0.08 0.05 -0.08 0.26 0.13 -0.07 -0.06 0.15 -0.30 0.03 -0.02 -0.05 0.02 -0.05 0.09 -0.19 0.17 0.29 0.15 a. N=1155. Correlations with absolute value greater than 0.06are significant at the 5 percent level minimum.

22
TABLE 4
Statistical results before accounting for endogeneity (GLS regression) Model 1 Model 2 Model 3 Model 4 Dependent variable Gross Margin Operating
costs/sales ROA Operating
profit M&A 3.20x10 1.15x10⁻⁷*** -1.66x10⁻⁸ 3.02x10⁻⁷** -7 Org dvt -8.25x10 -2.70x10-8*** 6.51x10⁻⁷** 1.97x10⁻⁸*** -7* Interest rate -0.36 -0.57*** 0.25* 0.38 *** Sales growth 0.46 23.28 3.25*** -23.54*** *** Alliance 0.90 -2.78 -0.87 2.18 * International -1.28 -2.60 * 1.09 -0.00 * Diversification 3.68 -2.98 *** -1.18 6.68* * Concentration ratio -0.26 -2.03 0.08 * 1.92* US and Canada 5.82 18.18*** -0.49 *** -11.67** Japan and other 8.66 11.38*** -2.40* -2.89 *** GNP growth -0.46 *** 0.37 1.17 *** Industry code 5311 7.30 13.67*** -1.79* -7.55 * Industry code 5411 2.11 4.18 * -0.54 -4.02 Industry code 5331 11.92 9.96 *** 1.45 -1.22 Constant 18.96 5.23 *** -1.66x10 15.48 -7** N 1104 955 1123 959 Model significance *** *** *** ***
* p ≤ 0,1 ** p ≤ 0,01 *** p ≤ 0,001

23
TABLE 5 Statistical results of the first stage of our 2-stage least square model (equations 2, 3)
b Model 5 Model 6 Organic development M&As
Sales growth 11.44 6.67 Interest rate -0.69 0.46 GNP growth -2.31 -0.19 International 12.55 8.39 Format diversification -6.80 -25.73*** Japan&other 15.07 26.25 USA&Canada -39.89 3.06 SIC code 5311 74.19 -7.70 SIC code 5411 -68.82 5.71 SIC code 5331 -36.43 -39.76* Alliance dummy 29.62** 11.51*** Concentration 7.50*** 6.16*** Debt ratio 0.01 0.03** Economic Freedom 67.15*** 16.89*** Constant -458*** -145*** N 1062 1062 F-statistics 19.84 10.51 Model significance *** *** * p ≤ 0,1 ** p ≤ 0,01 *** p ≤ 0,001
b. Presented results are the first stage regression for the model with gross margin as the dependent variable. Results for other dependent variable are, however, very similar.
TABLE 6
Statistical results once accounting for endogeneity (two-stage least square)
Model 8 Model 9 Model 10 Model 11 Dependant variable Gross Margin Operating
costs/sales ROA Operating
profit M&A 1.43x10 1.14x10⁻⁶* -2.20x10⁻⁵* -9.74x10⁻⁷ -6 Org dvt -3.10x10 -2.71x10-7 6.18x10-6* 2.42x10-8 -6* Interest rate 0.01 -1.16 0.16 1.26* * Sales growth -0.46 -10.54 2.25 10.38 ** Alliance 2.32 -6.62 ** -1.31 8.09 * International 4.66 -6.78 ** -0.12 10.03 Diversification 5.65 33.97 * -0.14 -28.42 Conc. ratio -0.51 -7.38 0.09 * 6.86* US and Canada -1.78 -13.62 -2.24 11.78 Japan and other -0.15 -13.11 5.44 16.44 GNP growth -0.05 -1.88 0.26 1.88* * Industry code 5311 -1.69 78.26 -0.18 -70.65 Industry code 5411 -5.08 -2.90 2.01 2.63 Industry code 5331 5.09 32.32 0.67 -26.44 constant 26.22 52.96 *** 2.16 -32.44 N 1060 921 1086 925 Model signif *** *** *** Wald test Organic dvt vs
M&A: chi2=3.13*
Organic dvt vs M&A: chi2=2.69*
Organic dvt vs M&A: chi2=4.11*
Organic dvt vs M&A: chi2=2.48
* p ≤ 0,1 ** p ≤ 0,01 *** p ≤ 0,001

1
Two-stage least square regression with lagged variables (second stage results) APPENDIX
Dependant variable
Gross Margin
T+1 T+2 T+3 T+4 T+5 M&A 2.36x10 2.30x10-6* 2.85x10-6* 3.56x10-6 3.19x10⁻⁶ -6 Org dvt -4.64x10 -4.75x10-7 -7.16x10⁻⁷ -9.79x10⁻⁶ -7.73x10⁻⁶ -7 Interest rate -0.05 0.05 0.00 0.10 0.11 Sales growth 0.98 2.08 2.11 0.42 -0.16 Alliance 1.99 2.36 1.04 * 0.78 -0.81 International 0.43 -2.32 -5.34 -13.56 -0.21 Diversification 7.60 9.57* 16.07 * 32.45 6.23 Conc. ratio -1.11 -0.76 -1.38 -1.07 -0.20 US and Canada -0.08 -2.29 - - - Japan and other -1.54 -0.76 -19.13 -13.54 -9.94 GNP growth -0.11 -0.05 0.22 0.06 -0.24 Industry code 1 -1.29 -1.64 -4.11 -4.74 -1.78 Industry code 2 -8.40 -7.66 -9.50 -7.75 -4.04 Industry code 3 7.01 7.15 9.33 10.82 10.61 constant 28.39 29.07*** 30.57*** 25.64*** 27.46*** *** N 1030 944 856 780 710 Model signif *** *** *** *** ***
Dependant variable
Operating costs/sales
T+1 T+2 T+3 T+4 T+5 M&A 2.36x10 1.66x10-5* 9.04x10-5* 1.00x10-6 6.25x10⁻⁵ -6 Org dvt -4.55x10 -3.46x10-6* -2.01x10⁻⁶* -2.21x10⁻⁶* -1.84x10⁻⁶ -6* Interest rate -1.63 -0.80 -0.32 -0.03 0.05 Sales growth -0.21 13.88 7.49 8.67 2.74 Alliance -17.43 -5.25 -2.89 -1.68 2.96 International -34.72 -33.65 -28.24 -46.96 2.87 Diversification 52.52 44.69 39.13 71.38 -28.20 Conc. ratio -13.23 -10.35* -6.16 * -6.03 -2.35 US and Canada -5.53 5.59 - - - Japan and other -23.76 -15.03 -34.27 -9.70 -6.21 GNP growth -3.04 -1.97 * -0.97 -0.76 -0.23 Industry code 1 104.28 75.29 * 38.20 36.55 36.80 Industry code 2 -37.35 -15.95 -5.15 2.83 16.71 Industry code 3 45.54 37.52 20.06 23.54 23.68 constant 69.35 1.66x10 28.94 -5* 6.50 20.60 N 911 841 765 704 655 Model signif *** *** *** *** ***