horizontal segmentation of process performance models · horizontal segmentation of process...
TRANSCRIPT

Michael CampoNeal Mackertich
Raytheon Integrated Defense Systems
NDIA CMMI® Technology Conference and User Group
Denver, CONovember 17, 2010
Horizontal Segmentation of Process Performance Models
Copyright © 2010 Raytheon Company. All rights reserved.Customer Success Is Our Mission is a registered trademark of Raytheon Company.
® CMMI is registered in the US Patent and Trademark Office by Carnegie Mellon University

Page 2
Overview Raytheon Integrated Defense Systems (IDS) introduced its 2nd Generation
of Process Performance Models (2G PPMs) as part of its CMMI high maturity journey– First generation models were developed to address individual lifecycle phase-specific
issues Designing for Quality, CAIV, cost models Relationship to business and project objectives often implicit
– 2G PPMs are used to manage risks related to business and project objectives (cost, schedule, quality) throughout the project lifecycle Relationship of models to goals is explicit and enabled by model-embedded mitigation strategies Supports ongoing, project grass-roots effort to achieve business and project objectives
As 2G PPMs began to proliferate, sociotechnical issues emerged– Variation of individual needs became apparent– PPM questions related to project context manifested themselves as a series of requests
for additional models and features– Caused model development and deployment issues related to model “packaging”
This presentation will review the use of “horizontal segmentation” as a strategy to support deployment of a “model family” that supports Raytheon business goals and model-user needs
11/18/2010

Page 3
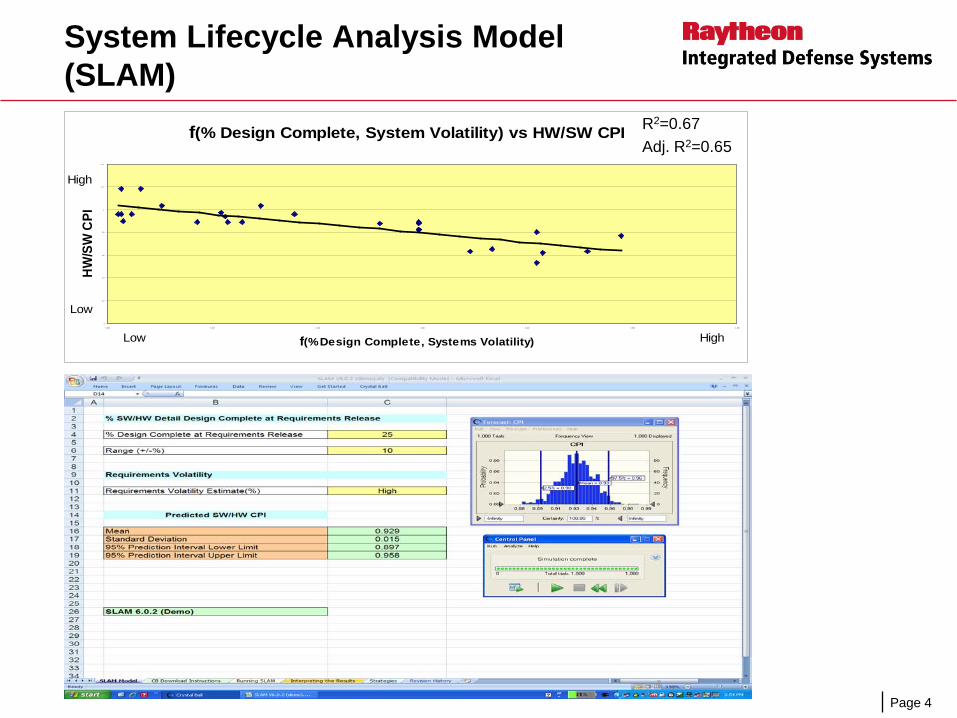
System Lifecycle Analysis Model (SLAM)
Initial 2G Process Performance Model Models influence of requirements volatility and requirements / design
overlap on software / hardware development cost performance– Enables project risk assessment & sensitivity analysis around the likelihood of
achieving performance cost objectives, and the development / deployment of mitigation strategies.
SLAM Model Inputs– Estimated % Design Complete at Systems Requirements Release
• Confidence Range (+/- 5, 10, or 15%)– Requirements Volatility Estimate
• Best estimate based on historical baseline for product line, process tailoring, etc.• Variance estimates built into model based on historical actuals
SLAM Model Outputs– Projected Software / Hardware Cost Performance (CPI)
Mean, Standard Deviation 95% Upper & Lower Prediction Interval Limits
Page 4
f(% Design Complete, System Volatility) vs HW/SW CPI
0
0.2
0.4
0.6
0.8
1
1.2
1.4
0. 000 0. 100 0. 200 0. 300 0. 400 0. 500 0. 600
f(% Design Complete, Systems Volatility)
HW/S
W C
PI
High
High
Low
Low
R2=0.67Adj. R2=0.65
System Lifecycle Analysis Model (SLAM)

Page 5
Post-SLAM Feedback from the SLAM deployment included requests for additional
features– Can we predict requirements volatility?– Can we predict rework?– Can we predict IVV performance?– Can we predict likelihood of meeting schedule?
The Process Performance Models Team began considering how to meet the needs of different users− Build additional features into SLAM?− Create separate models?− Bundle separate models into one supermodel?
Decision made to create a schedule risk model– Used a SLAM-derived, similar look and feel approach– Provided an opportunity for further feedback
11/18/2010

Page 6
Scheduling Analysis of Variability Engine (SAVE)
Can we predict likelihood of meeting schedule? Models influence of individual task cycle time variation on our ability to
deliver on-time against defined scheduling requirements– Enables projects to statistically quantify risk associated in meeting schedule and
perform sensitivity analysis – Enables project identification of process changes that reduce risk (model contains
potential mitigation strategies)– May be used during planning, re-planning, Estimate at Complete (EAC) activity
SAVE Model Inputs– Estimated individual task activity duration (typically defined in terms of their shortest,
most likely and longest cycle time expectations) – Individual task activity predecessors (defines which tasks feed which tasks) – Target overall schedule duration (deadline) – Number of task activities
SAVE Model Outputs– Probability of meeting target duration– Average Duration (Cycle Time)– 95% Upper & Lower Prediction Intervals– % of time each task is on the critical path

Page 7
Scheduling Analysis of Variability Engine (SAVE)

Page 8
Post-SAVE Feedback from the SAVE deployment included requests for further model
refinements– Can we model probability of achieving cost targets?– Can we interface SAVE with Microsoft Project?– Can we integrate cost and schedule probability models?– Can we go below cost and schedule, and model size and productivity?
The answer to all the questions is “yes”, but returns us to the model/supermodel dilemma
Solution: Horizontal Segmentation
11/18/2010

Page 9
Horizontal Segmentation In 1986, Psychophysicist Dr. Howard Moskowitz was hired by Campbell’s
Soup Company to increase market share of Prego spaghetti sauce over arch-rival Ragu.– Prego sales lagged and Campbell’s wanted to change the sauce and improve its
consumer appeal– Through earlier work in the 1970s with Pepsi and Vlasic Pickles, Moskowitz had
suspected that a universal “one sauce fits all” solution was not the answer– The answer instead was in the understanding and leveraging of variability– Moskowitz had 45 different sauces created and taste-tested
Results indicated that consumers had different concepts of the perfect spaghetti sauce that could be segmented into groups
Main preferences: plain, spicy, extra chunky No extra chunky sauce was marketed at the time Campbell’s made $600M over the next 10 years on extra chunky
Moskowitz’ breakthrough approach, knownas Horizontal Segmentation, revolutionized the spaghetti sauce, soft drink and multiple otherconsumer markets
Page 10
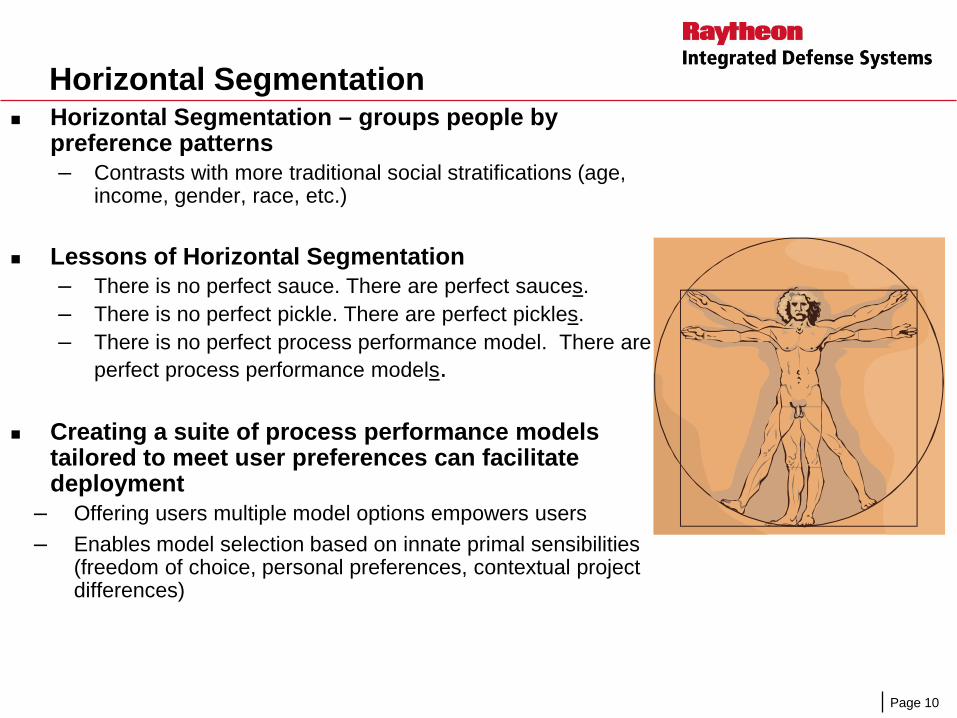
Horizontal Segmentation Horizontal Segmentation – groups people by
preference patterns– Contrasts with more traditional social stratifications (age,
income, gender, race, etc.)
Lessons of Horizontal Segmentation– There is no perfect sauce. There are perfect sauces.– There is no perfect pickle. There are perfect pickles.– There is no perfect process performance model. There are
perfect process performance models.
Creating a suite of process performance models tailored to meet user preferences can facilitate deployment
– Offering users multiple model options empowers users– Enables model selection based on innate primal sensibilities
(freedom of choice, personal preferences, contextual project differences)

Page 11
PPM Horizontal Segmentation
Users of process performance models want options that support personal or project preferences– Combinations of cost, schedule, quality,
integrated with other project tools
Based on feedback and the concept of Horizontal Segmentation, Raytheon IDS has created a cost & schedule model suite derived from SLAM and SAVE
– Supports business goals– Address individual project objectives, risks,
and preferences
SLAM
SAVE
SAVE+ PCM
IPCS PPM3
SAVE SAVE

Page 12
SAVE+ Can we integrate SAVE with Microsoft
Project?– Uses a Crystal Ball interface to MS Project– Similar to Risk+
11/18/2010
SLAM
SAVE
SAVE+ PCM
IPCS PPM3
SAVE SAVE

Page 13
SAVE+

Page 14
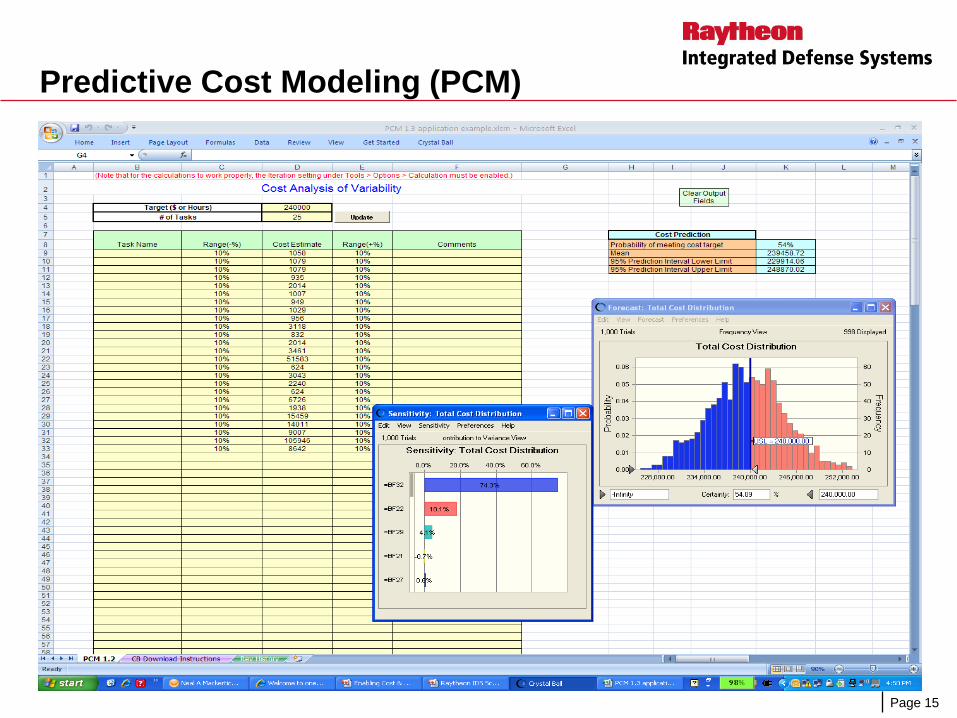
Predictive Cost Modeling (PCM) Can we model probability of achieving cost targets? PCM models the influence of individual cost element variation on our
ability to meet cost targets / budget requirements– Enables projects to statistically quantify risk associated in meeting cost targets / budgets
and perform sensitivity analysis – Enables project identification of process changes that reduce risk– May be used during planning, re-planning, EAC activity
Predictive Cost Model Inputs– Estimated mean cost for each individual cost element – Associated expected range of performance for each individual cost element (min / max
for the default triangular distribution) – Overall cost target
Predictive Cost Model Outputs– Predictive average cost– 95% Upper & Lower Prediction Intervals– Probability of meeting cost target / budgets– Total cost estimate per task
SLAM
SAVE
SAVE+ PCM
IPCS PPM3
SAVE SAVE
Page 15
Predictive Cost Modeling (PCM)

Page 16
Integrated Predictive Cost & Scheduling (IPCS)
Can we integrate cost and schedule probability models? IPCS integrates the Schedule Analysis of Variability Engine (SAVE) and the
Predictive Cost Model (PCM)– Enables projects to statistically quantify risk associated in meeting cost & schedule
targets and perform integrated sensitivity analysis – Enables project identification of process changes that reduce risk– May be used during planning, re-planning, EAC activity
IPCS Cost Model Inputs– Estimated mean cost and duration expectations for each individual element – Individual task activity predecessors (defines which tasks feed which tasks)– Associated expected range of performance for each individual element (min / max for
the default triangular distribution) – Overall cost & schedule targets
IPCS Cost Model Outputs– Probability of meeting cost & schedule targets– Predictive mean expectation for cost & schedule– 95% Upper & Lower Prediction Intervals– % of time each task is on the critical path– Total cost estimate per task
SLAM
SAVE
SAVE+ PCM
IPCS PPM3
SAVE SAVE

Page 17
Integrated Predictive Cost & Scheduling (IPCS)
Page 18
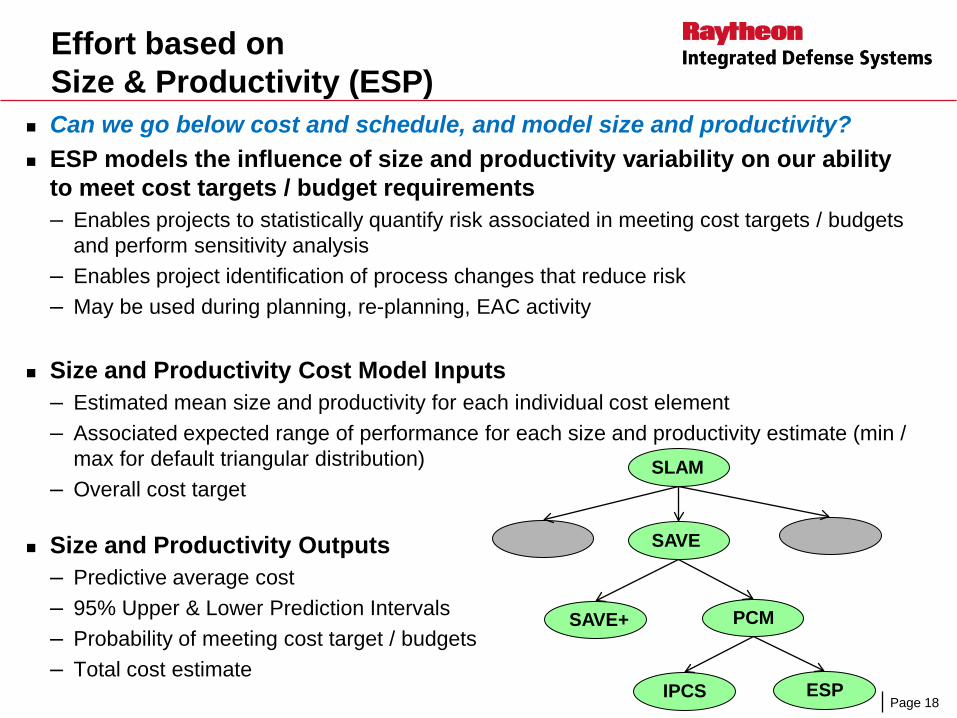
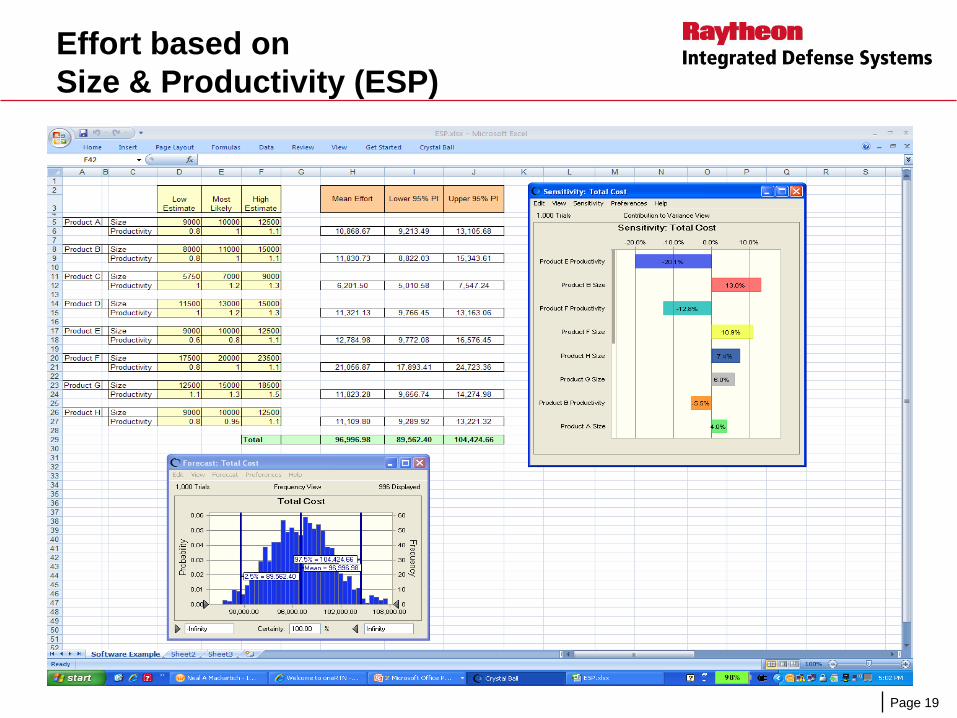
Effort based onSize & Productivity (ESP)
Can we go below cost and schedule, and model size and productivity? ESP models the influence of size and productivity variability on our ability
to meet cost targets / budget requirements– Enables projects to statistically quantify risk associated in meeting cost targets / budgets
and perform sensitivity analysis – Enables project identification of process changes that reduce risk– May be used during planning, re-planning, EAC activity
Size and Productivity Cost Model Inputs– Estimated mean size and productivity for each individual cost element – Associated expected range of performance for each size and productivity estimate (min /
max for default triangular distribution) – Overall cost target
Size and Productivity Outputs– Predictive average cost– 95% Upper & Lower Prediction Intervals– Probability of meeting cost target / budgets– Total cost estimate
SLAM
SAVE
SAVE+ PCM
IPCS ESP
SAVE SAVE
Page 19
Effort based onSize & Productivity (ESP)

Page 20
Results & Benefits Stakeholder groups and projects have found the family of developed 2G PPMs
both easy to use and conceptually aligned with project issues.
Projects have identified and implemented specific improvements as a direct result of the integrated deployment of 2G PPMs that have enabled their execution. Resulting improvement efforts include: – Increased up-front investment in integrated Engineering planning & analysis– Process Performance trade studies – Process redesign– Enhanced peer reviews– Resource reallocation and conflict resolution
In addition to deployed projects, 2G PPMs have been used up-front during the bid & proposal phase and are utilized by Engineering Management during schedule negotiations with program management.
Significant qualitative benefits from integrated deployment of these models cannot be underestimated as projects leads / teams are clearly thinking and behaving differently with respect to their analysis of risk & opportunity.

Page 21
Summary Oddly enough, while project practitioners may tend to overestimate
contextual differences (your model does not apply to me because my project is different!), analysts may tend to underestimate contextual differences and preferences in search of universal solutions that may or may not exist.
Leveraging the concept of Horizontal Segmentation enables our development and deployment of Cost & Schedule Risk Analysis Models by– Sharpening our focus on understanding and serving our projects– Enabling our understanding of contextual differences between differing
product types, project challenges and personal preferences– Increasing project team understanding of the benefits of statistical modeling
and igniting their passion for more…– Reinforcing the need for data stratification– Challenging and reinventing our existing proposal / project management
measurement & analysis processes and tools
“There is no perfect Process Performance Model. There are perfect Process Performance Models.”

Page 2211/18/2010
References1. Mackertich, Campo, Beitz, “System Lifecycle Analysis Model (SLAM)”, 2nd SEI
High Maturity Measurement and Analysis Workshop, November 2008.2. Mackertich, Campo, “Scheduling Analysis of Variability Engine(SAVE)”, 3rd SEI
High Maturity Measurement and Analysis Workshop, March 2009.3. Campo, Mackertich, “Goal Question Model”, NDIA CMMI Technology Conference
and User Group, November 2009.4. Malcolm Gladwell on spaghetti sauce,
http://www.ted.com/talks/lang/eng/malcolm_gladwell_on_spaghetti_sauce.html

Page 2311/18/2010
Contact Information
Michael CampoEmail: [email protected]: 978-858-5939Raytheon Integrated Defense Systems
Neal MackertichEmail: [email protected]: 781-440-2629Raytheon Integrated Defense Systems