hourly analysis program quick reference guide · hap quick reference guide 1 preface about this...
TRANSCRIPT

COPYRIGHT 1998-2016 CARRIER CORPORATION
HOURLY ANALYSIS PROGRAM
QUICK REFERENCE GUIDE

[This page has been left blank intentionally]

Copyright 1998-2016 Carrier Corporation
HAP Quick Reference Guide
Software Systems Network
Carrier Corporation
10th Edition……..(HAP v5.00)……..4/2016

[This page has been left blank intentionally]
HAP Quick Reference Guide 1
Preface
ABOUT THIS REFERENCE GUIDE
The HAP Quick Reference Guide provides instructional information for users of Carrier’s HourlyAnalysis Program (HAP). It describes how to use key features of the user interface, and how to use theprogram to design HVAC systems and estimate annual energy costs. This Guide also contains programtutorials, example problems and discussions of common applications. The Guide serves as a supplementto the program's help system which provides additional information including descriptions of all inputitems, program reports and program calculation procedures.
ABOUT HAP
Carrier’s Hourly Analysis Program (HAP) is a computer tool which assists engineers in designing HVACsystems for commercial buildings. HAP is two tools in one. First it is a tool for estimating loads anddesigning systems. Second, it is a tool for simulating building energy use and calculating energy costs.In this capacity it is useful for LEED®, schematic design and detailed design energy cost evaluations.HAP uses the ASHRAE transfer function method for load calculations and detailed 8,760 hour-by-hoursimulation techniques for the energy analysis.
This program is released as two separate, but similar products. The “HAP System Design Load”program provides system design and load estimating features. The full “HAP” program provides thesame system design capabilities plus energy analysis features. This Quick Reference Guide deals withboth programs.
WHAT THIS REFERENCE GUIDE CONTAINS
The HAP Quick Reference Guide is divided into six chapters and four appendices:
Chapter 1 (Getting Started) discusses basic program concepts - how to use HAP to design systemsand run energy analyses, how to operate the program, how to work with projects and performcommon tasks.
Chapter 2 (HAP Tutorials) provides step-by-step instructions for using the program to designsystems and run energy analyses. These tutorials are designed for readers who are already familiarwith HAP terminology and concepts.
Chapters 3 & 4 (Example Problems) contain two simple example problems illustrating how thesoftware is used to design an HVAC system and how it is used to run an energy analysis.
Chapters 5 & 6 (“Applications”) provide a series of short discussions on how to use HAP to designcommon types of HVAC systems and how to run energy analyses for common equipment types.
Appendix A (“Performing Common Tasks with HAP”) contains step-by-step procedures forperforming common tasks in HAP such as entering data, editing data and generating reports.
Appendix B (“Performing Common Project Management Tasks”) provides short descriptions ofprocedures used to work with project data.
Appendix C (“Index”) contains an index for this manual.
All information in this Guide is also available in the HAP on-line help system. The on-line help systemalso includes extensive information about program inputs, reports and calculation procedures.
LEED® is a registered trademark of the US Green Building Council.
Table of Contents
2 HAP Quick Reference Guide
Chapter 1 Getting Started
1.1 Welcome to the Hourly Analysis Program ...........................................................................................................1-11.2 Using HAP to Design Systems and Plants............................................................................................................1-21.3 Using HAP to Estimate Energy Use and Cost ......................................................................................................1-31.4 Working with the HAP Main Program Window...................................................................................................1-71.5 Working with HAP Input Windows....................................................................................................................1-101.6 Performing Common Tasks with HAP ...............................................................................................................1-121.7 Working with Projects ........................................................................................................................................1-121.8 Using Documentation Resources in HAP...........................................................................................................1-14
Chapter 2 HAP Tutorials
2.1 HAP System Design Tutorial ...............................................................................................................................2-12.2 HAP Energy Analysis Tutorial - Preliminary Design ...........................................................................................2-32.3 HAP Energy Analysis Tutorial - Detailed Design ................................................................................................2-4
Chapter 3 System Design Example Problem
3.1 Overview for the Example Problem .....................................................................................................................3-13.2 Defining the Problem............................................................................................................................................3-13.3 Gathering Data......................................................................................................................................................3-23.4 Entering Data........................................................................................................................................................3-63.5 Generating System Design Reports ......................................................................................................................3-83.6 Selecting Equipment.............................................................................................................................................3-8
Chapter 4 Energy Analysis Example Problem
4.1 Overview for the Example Problem .....................................................................................................................4-14.2 Defining the Problem............................................................................................................................................4-14.3 Gathering Data......................................................................................................................................................4-24.4 Entering Data........................................................................................................................................................4-44.5 Generating Simulation Reports.............................................................................................................................4-8
Chapter 5 Design Applications
5.1 Application Information Overview.......................................................................................................................5-15.2 Applications Involving Single-Zone HVAC Units ...............................................................................................5-15.3 Applications Involving Terminal Units ................................................................................................................5-25.4 Applications Involving Multiple-Zone HVAC Systems .......................................................................................5-35.5 Applications Involving Cooling and Heating Plants.............................................................................................5-45.6 Troubleshooting Strategies ...................................................................................................................................5-6
Chapter 6 Energy Analysis Applications
6.1 Application Information Overview.......................................................................................................................6-16.2 Energy Analysis Strategies ...................................................................................................................................6-16.3 Troubleshooting Strategies ...................................................................................................................................6-36.4 Simulating Packaged Rooftop Units .....................................................................................................................6-56.5 Simulating Vertical Packaged Units .....................................................................................................................6-56.6 Simulating Split DX Air Handling Units ..............................................................................................................6-66.7 Simulating Chilled Water Air Handling Units......................................................................................................6-66.8 Simulating Packaged or Split DX Fan Coil Units.................................................................................................6-76.9 Simulating Hydronic Fan Coil Units ....................................................................................................................6-8
Table of Contents
HAP Quick Reference Guide 3
Chapter 6 (continued)
6.10 Simulating Induction Beam and Chilled Beam Systems.....................................................................................6-96.11 Simulating Water Source Heat Pump Systems .................................................................................................6-106.12 Simulating Ground Water and Ground Source Heat Pump Systems ................................................................6-106.13 Simulating Chilled Water Plants.......................................................................................................................6-116.14 Simulating Hot Water and Steam Plants...........................................................................................................6-116.15 Simulating Heat Recovery Plants .....................................................................................................................6-126.16 Modeling Utility Rate Structures ......................................................................................................................6-13
Appendix A Performing Common Tasks with HAP
A.1 Basic Procedures for Common Tasks .................................................................................................................A-1A.2 Creating a New Item ...........................................................................................................................................A-2A.3 Editing an Existing Item .....................................................................................................................................A-3A.4 Using the On-Line Calculator to Enter Data.......................................................................................................A-4A.5 Duplicating an Existing Item ..............................................................................................................................A-5A.6 Duplicating a Building (with Spaces and HVAC Equipment) ............................................................................A-6A.7 Copying Items.....................................................................................................................................................A-6A.8 Replacing Space Data .........................................................................................................................................A-6A.9 Rotating Spaces ..................................................................................................................................................A-7A.10 Performing LEED (90.1 PRM) Rotations.........................................................................................................A-8A.11 Deleting Items...................................................................................................................................................A-8A.12 Generating Input Data Reports .........................................................................................................................A-9A.13 Generating System Design Reports.................................................................................................................A-10A.14 Generating Plant Design Reports....................................................................................................................A-10A.15 Generating System Simulation Reports ..........................................................................................................A-11A.16 Generating Plant Simulation Reports..............................................................................................................A-11A.17 Generating Building Simulation Reports ........................................................................................................A-12A.18 Using the Report Viewer ................................................................................................................................A-12A.19 Changing the List View Format ......................................................................................................................A-14A.20 Setting User Preferences.................................................................................................................................A-15
Appendix B Performing Common Project Management Tasks
B.1 Creating a New Project .......................................................................................................................................B-1B.2 Opening an Existing Project ...............................................................................................................................B-1B.3 Saving a Project ..................................................................................................................................................B-1B.4 Saving a Project as a New Project ......................................................................................................................B-2B.5 Deleting a Project ...............................................................................................................................................B-2B.6 Editing Project Properties ...................................................................................................................................B-2B.7 Archiving a Project .............................................................................................................................................B-3B.8 Retrieving a Project ............................................................................................................................................B-3B.9 Converting Data From Previous Versions...........................................................................................................B-4B.10 Publishing Equipment Sizing Requirements for Use in ECAT.........................................................................B-6B.11 E-Mailing Project Data to Your Carrier Sales Engineer ...................................................................................B-8B.12 Exporting Results to Engineering Economic Analysis......................................................................................B-9B.13 Importing Data From Another Project ..............................................................................................................B-9B.14 Importing Data From CAD and BIM Software...............................................................................................B-12B.15 Importing Data from a Building System Optimizer Project ............................................................................B-15
Appendix C Index

[This page has been left blank intentionally]
HAP Quick Reference Guide 1-1
Chapter 1 Getting Started
This chapter explains what Carrier’s Hourly Analysis Program does, how to use the software to designHVAC systems and estimate annual energy costs, and how to operate the software. We encourage you toread this chapter before using HAP.
1.1 WELCOME TO THE HOURLY ANALYSIS PROGRAM
Welcome to HAP. Welcome to Carrier’s Hourly Analysis Program (HAP). HAP is a computer toolwhich assists engineers in designing HVAC systems for commercial buildings. HAP is two tools in one.First it is a tool for estimating loads and designing systems. Second, it is a tool for simulating energy useand calculating energy costs. In this capacity it is useful for LEED®, schematic design and detaileddesign energy cost evaluations. HAP uses the ASHRAE-endorsed transfer function method for loadcalculations and detailed 8,760 hour-by-hour energy simulation techniques for the energy analysis.
This program is released as two similar, but separate products. The “HAP System Design Load”program provides the system design and load estimating features. The full “HAP” program provides thesame system design capabilities plus energy analysis features. This Quick Reference Guide deals withboth programs.
HAP System Design Features. HAP estimates design cooling and heating loads for commercialbuildings in order to determine required sizes for HVAC system components. Ultimately, the programprovides information needed for selecting and specifying equipment. Specifically, the program performsthe following tasks:
Calculates design cooling and heating loads for spaces, zones, and coils in the HVAC system. Determines required airflow rates for spaces, zones and the system. Sizes cooling and heating coils. Sizes air circulation fans. Sizes chillers and boilers.
HAP Energy Analysis Features. HAP estimates annual energy use and energy costs for HVAC andnon-HVAC energy consuming systems in a building by simulating building operation for each of the8,760 hours in a year. Results of the energy analysis are used to compare the energy use and energy costsof alternate HVAC system designs so the best design can be chosen. Specifically, HAP performs thefollowing tasks during an energy analysis:
Simulates hour-by-hour operation of all heating and air conditioning systems in the building. Simulates hour-by-hour operation of all plant equipment in the building. Simulates hour-by-hour operation of non-HVAC systems including lighting and appliances. Uses results of the hour-by-hour simulations to calculate total annual energy use and energy costs.
Costs are calculated using actual utility rate features such as stepped, time-of-day and demandcharges, if specified.
Generates tabular and graphical reports of hourly, daily, monthly and annual data.
If you have questions about the program: In the United States or Canada, please [email protected]. In other countries, please contact your local Carrier sales office orlocal Carrier distributor.
Chapter 1 Getting Started
1-2 HAP Quick Reference Guide
1.2 USING HAP TO DESIGN SYSTEMS AND PLANTS
This section briefly describes, in conceptual terms, how to use HAP to design systems and plants.Application of these concepts will be demonstrated both in the HAP tutorial in Chapter 2 and in theexample problem in Chapter 3. All design work requires the same general five step procedure:
1. Define the Problem. First define the scope and objectives of the design analysis. For example,what type of building is involved? What type of systems and equipment are required? What specialrequirements will influence system features?
2. Gather Data. Before design calculations can be performed, information about the building, itsenvironment and its HVAC equipment must be gathered. This step involves extracting data frombuilding plans, evaluating building usage and studying HVAC system needs. Specific types ofinformation needed include:
Climate data for the building site. Construction material data for walls, roofs, windows, doors, exterior shading devices and floors,
and for interior partitions between conditioned and non-conditioned regions. Building size and layout data including wall, roof, window, door and floor areas, exposure
orientations and external shading features. Internal load characteristics determined by levels and schedules for occupancy, lighting systems,
office equipment, appliances and machinery within the building. Data concerning HVAC equipment, controls and components to be used.
3. Enter Data Into HAP. Next, use HAP to enter climate, building and HVAC equipment data. Whenusing HAP, your base of operation is the main program window (described in greater detail inSection 1.4). From the main program window, first create a new project or open an existing project.Then define the following types of data which are needed for system design work:
a. Enter Weather Data. Weather data defines the temperature, humidity and solar radiationconditions the building encounters during the course of a year. These conditions play animportant role in influencing loads and system operation. To define weather data, a city can bechosen from the program's weather database, or weather parameters can be directly entered.Weather data is entered using the weather input window.
b. Enter Space Data. A space is a region of the building comprised of one or more heat flowelements and served by one or more air distribution terminals. Usually a space represents asingle room. However, the definition of a space is flexible. For some applications, it is moreefficient for a space to represent a group of rooms or even an entire building.
To define a space, all elements which affect heat flow in the space must be described. Elementsinclude walls, windows, doors, roofs, skylights, floors, occupants, lighting, electrical equipment,miscellaneous heat sources, infiltration, and partitions.
While defining a space, information about the construction of walls, roofs, windows, doors andexternal shading devices is needed, as well as information about the hourly schedules for internalheat gains. This construction and schedule data can be specified directly from the space inputwindow (via links to the construction and schedule windows), or alternately can be defined priorto entering space data.
Space information is stored in the project database and is later linked to zones in an air system.
c. Enter Air System Data. An Air System is the equipment and controls used to provide coolingand heating to a region of a building. An air system serves one or more zones. Zones are groupsof spaces having a single thermostatic control. Examples of systems include central station airhandlers, packaged rooftop units, packaged vertical units, split systems, packaged DX fan coils,hydronic fan coils and water source heat pumps. In all cases, the air system also includesassociated ductwork, supply terminals and controls.
To define an air system, the components, controls and zones associated with the system must bedefined as well as the system sizing criteria. This data is entered on the air system input window.
Getting Started Chapter 1
HAP Quick Reference Guide 1-3
d. Enter Plant Data. A Plant is the equipment and controls used to provide cooling or heating tocoils in one or more air systems. Examples include chiller, changeover, hot water, service hotwater and steam boiler plants.
This step is optional; it is only required if you are sizing the plants. To define a plant for designpurposes, the type of plant and the air systems it serves must be defined. This data is entered onthe plant input window.
4. Use HAP to Generate Design Reports. Once weather, space, air system and plant data has beenentered, HAP can be used to generate system and plant design reports.
To generate design reports, go to the main program window and select the desired air systems orplants. Next choose the “Print/View Design Results” menu bar option, toolbar button, or pop-upmenu option. For systems this displays the System Design Reports window; for plants this displaysthe Plant Design Reports window. Select the desired report options on this window. If calculationsare needed to supply data for these reports, the program will automatically run the calculations beforegenerating the reports. If all the data needed for the reports already exists, reports are generatedimmediately.
5. Select Equipment. Finally, use data from the reports you generated to select the appropriate coolingand heating equipment from product catalogs or electronic catalog software. System and plantdesign reports provide information necessary to select all the components of your HVAC systemincluding air handlers, packaged equipment, supply terminals, duct systems, piping systems and plantequipment.
Carrier can provide a wide variety of electronic catalog computer programs to make selectingequipment quick and easy. Please contact your local Carrier sales office or Carrier distributor fordetails.
1.3 USING HAP TO ESTIMATE ENERGY USE AND COST
This section briefly describes, in conceptual terms, how to use HAP to estimate annual energy use andenergy costs for a building. HAP is designed with features to help you efficiently compare energy costsof HVAC design alternatives both in the preliminary design phase of a project and in the detailed designphase of a project:
1. In the Preliminary or Schematic Design Phase of a project a variety of HVAC designs andequipment types may be under consideration. The goal of energy analysis in this phase of a project isto quickly compare the energy cost performance of many design alternatives to identify a small groupof designs with the best performance for further, more detailed study. Simplification andapproximation may be appropriate here both because of limited information about the building andbecause speed is important in evaluating the alternatives. The HAP Wizard interface is designed tohelp you quickly perform these types of energy analysis. See 1.3.1 for details.
2. In the Detailed Design Phase of a project one or a small set of HVAC designs is underconsideration. The goal of energy analysis in this phase of a project is to carefully analyze andoptimize the design. The goals here may also include generating documentation for LEED Energyand Atmosphere Credit 1. Given these goals, more detailed definition of the building and its HVACequipment is typically needed. The HAP detailed design interface is designed to help you performthese types of energy analysis. See 1.3.2 for details.
1.3.1 HAP Energy Analysis for Preliminary Design
This sub-section describes in conceptual terms how to use HAP to perform an energy analysis in thepreliminary or schematic design phase of a project where simplification and approximation areappropriate. Application of these concepts will be demonstrated in the HAP tutorial in Chapter 2.Analysis work requires a general five step procedure:
Chapter 1 Getting Started
1-4 HAP Quick Reference Guide
1. Define the Problem. First define the scope and objectives of the energy analysis. For example,what type of building is involved? What type of systems and equipment are required? Whatalternate designs or energy conservation measures are being compared in the analysis?
2. Gather Data. Before energy simulations can be run, general information about the building, itsenvironment, the types of HVAC and non-HVAC equipment, and its energy prices must be gathered.This step involves extracting data from building plans, evaluating building usage, studying HVACsystem needs and acquiring utility rate schedules. Specific types of information needed include:
Climate data for the building site. General information about building size, shape, layout and number of floors. General information about the type of wall, window and roof envelope construction to be used. General information about the space usage in the building which will affect occupant density and
lighting and equipment usage levels. General information about the type of air-side systems, equipment and components to be
considered. General information about prices for electric service and any fuel sources used in the building.
3. Enter Data Into HAP. Next, use HAP to enter data for the analysis. When using HAP, your base ofoperation is the main program window. From the main program window, first create a new project oropen an existing project. Then use the "Full Wizard Session" feature to rapidly enter all your datafor the analysis.
From the main program window choose the "Full Wizard Session" option on the Wizards menu, orclick the "Full Wizard Session" button on the toolbar. The Full Wizard Session window providesaccess to all of the HAP Wizards:
The Weather Wizard - Used to quickly configure weather data for the building site. The Building Wizard - Used to rapidly define the size, shape, layout, envelope and internal
loads for the building spaces. The Equipment Wizard - Used to easily create HVAC design alternatives. The Utility Rate Wizard - Used to quickly assemble electric and fuel pricing data.
After entering data on the Wizard input screens, press the Finish button in the lower left of the FullWizard Session window. HAP converts your Wizard data into a full set of detailed HAP inputs anddisplays them in the HAP main window.
4. Use HAP to Generate Simulation Reports. Once all input data has been entered, HAP can be usedto generate reports showing energy cost results.
To generate building simulation reports, go to the main program window and select the buildingsrepresenting your set of HVAC design alternatives. Next choose the “Print/View SimulationResults” option on the Reports Menu. This displays the Building Simulation Reports Selectionwindow. Choose the desired reports. Then press Preview to display the reports or press Print todirectly print the reports. HAP will automatically run any necessary calculations first beforegenerating the reports.
When comparing annual energy cost for a preliminary design type of analysis, the Annual CostSummary and Annual Energy & Emission Summary reports are most frequently used. These reportscompare energy cost or energy use for the design alternatives side by side on a single page.
Simulation reports for individual air systems and plants included in your analysis can also begenerated. Use the same procedure but select air system or plant items instead. System and plantsimulation reports provide more detailed performance information for individual pieces ofequipment. These reports are often useful for learning about equipment performance and fortroubleshooting unexpected results.
5. Evaluate Results. Finally, use data from the simulation reports you generated to draw conclusionsabout the most favorable design alternatives.
Getting Started Chapter 1
HAP Quick Reference Guide 1-5
1.3.2 HAP Energy Analysis for Detailed Design
This sub-section describes in conceptual terms how to use HAP to perform an energy analysis in thedetailed design phase of a project. Application of these concepts will be demonstrated in the HAPtutorial in Chapter 2 and in the example problem in Chapter 4. Analysis work requires a general five stepprocedure.
Note that certain steps below are identical or similar to those used for system design. If a system designhas already been performed for a building, all of the data entered for design can be reused for the energyanalysis, and this significantly reduces the effort needed to complete the energy analysis.
1. Define the Problem. First define the scope and objectives of the energy analysis. For example,what type of building is involved? What type of systems and equipment are required? Whatalternate designs or energy conservation measures are being compared in the analysis?
2. Gather Data. Before energy simulations can be run, information about the building, itsenvironment, HVAC and non-HVAC equipment, and its energy prices must be gathered. This stepinvolves extracting data from building plans, evaluating building usage, studying HVAC systemneeds and acquiring utility rate schedules. Specific types of information needed include:
Climate data for the building site. Construction material data for walls, roofs, windows, doors, exterior shading devices and floors,
and for interior partitions between conditioned and non-conditioned regions. Building size and layout data including wall, roof, window, door and floor areas, exposure
orientations and external shading features. Internal load characteristics determined by levels and schedules for occupancy, lighting systems,
office equipment, appliances and machinery within the building. Data for HVAC equipment, controls and components to be used. Data for chilled water, hot water and/or steam plants, if applicable. Data for non-HVAC energy-consuming equipment. Utility rate information for electric service and any fuel sources used in the building.
3. Enter Data Into HAP. Next, use HAP to enter data for the analysis. When using HAP, your base ofoperation is the main program window (described in greater detail in Section 1.4). From the mainprogram window, first create a new project or open an existing project. Then define the followingtypes of data which are needed for energy analysis work:
a. Enter Weather Data. Weather data defines the temperature, humidity and solar radiationconditions the building encounters during the course of a year. These conditions play animportant role in influencing loads and system operation throughout the year. Both design andsimulation weather data are needed. To define design weather data, a city can be chosen fromthe program's weather database, or weather parameters can be directly entered. Simulationweather is selected by loading a simulation weather file from the library provided with theprogram or importing data from an external source. This step is also used to define the calendarfor your simulation year. All three types of data are entered using the weather propertieswindow.
b. Enter Space Data. A space is a region of the building comprised of one or more heat flowelements and served by one or more air distribution terminals. Usually a space represents asingle room. However, the definition of a space is flexible. For some applications, it is moreefficient for a space to represent a group of rooms or even an entire building.
To define a space, all elements which affect heat flow in the space must be described. Elementsinclude walls, windows, doors, roofs, skylights, floors, occupants, lighting, electrical equipment,miscellaneous heat sources, infiltration, and partitions.
While defining a space, information about the construction of walls, roofs, windows, doors andexternal shading devices is needed, as well as information about the hourly schedules for internalheat gains. This construction and schedule data can be specified directly from the space inputwindow (via links to the construction and schedule windows), or alternately can be defined priorto entering space data.
Chapter 1 Getting Started
1-6 HAP Quick Reference Guide
Space information is stored in the project database and is later linked to zones in an air system.
c. Enter Air System Data. An Air System is the equipment and controls used to provide coolingand heating to a region of a building. An air system serves one or more zones. Zones are groupsof spaces having a single thermostatic control. Examples of systems include central station airhandlers, packaged rooftop units, packaged vertical units, split systems, packaged DX fan coils,hydronic fan coils and water source heat pumps. In all cases, the air system also includesassociated ductwork, supply terminals and controls. In the case of packaged DX, split DX,electric resistance heating and combustion heating equipment, the system also encompasses thisDX or heating equipment. For example, when dealing with a gas/electric packaged rooftop unit,the "air system" includes the DX cooling equipment and the gas heating equipment.
To define an air system, the components, controls and zones associated with the system must bedefined as well as the system sizing criteria. For energy analyses, performance informationabout DX cooling equipment and electric and combustion heating equipment must also bedefined. All of this data is entered on the air system input window.
d. Enter Plant Data. A Plant is the equipment and controls used to provide cooling via chilledwater or heating via hot water or steam to coils in one or more air systems. Examples includechiller, changeover, hot water, service hot water, steam boiler, and remote source cooling andheating plants.
This step is optional; it is only required if chilled water, hot water or steam plants are used inyour building. To define a plant for energy analysis purposes, the type of plant and the airsystems it serves must be defined along with its configuration, controls and distribution systeminformation. This data is entered on the plant input window.
e. Enter Utility Rate Data. Utility rate data defines the pricing rules for electrical energy use andfuel use. An electric rate structure must be defined for all energy studies. One fuel rate for eachnon-electric fuel source must also be defined. Electric rate data is entered using the electric ratewindow. Fuel rate data is entered using the fuel rate window.
f. Enter Building Data. A Building is simply the container for all energy-consuming equipmentincluded in a single energy analysis case. One Building is created for each design alternativebeing considered in the study. Building data consists of lists of plants and systems included inthe building, utility rates used to determine energy costs and data for non-HVAC energy or fueluse. Data is entered using the building window.
4. Use HAP to Generate Simulation Reports. Once all input data has been entered, HAP can be usedto generate simulation reports.
To generate building simulation reports, go to the main program window and select the desiredbuildings. If data for a single building is being evaluated, select only one building. If energy use andcosts for a number of alternatives is being compared, select a group of buildings. Next choose the“Print/View Simulation Results” option on the Reports Menu. This displays the Building SimulationReports Selection window. Choose the desired reports. Then press Preview to display the reports orpress Print to directly print the reports. If system, plant or building calculations are needed to supplydata for your reports, HAP will automatically run these calculations first. Otherwise, if nocalculations are needed the reports will be generated immediately.
Simulation reports for individual air systems and plants included in your analysis can also begenerated. Use the same procedure but select air system or plant items instead. System and plantsimulation reports provide more detailed performance information for individual pieces ofequipment. They are often useful for learning about equipment performance and for troubleshootingunexpected results.
5. Evaluate Results. Finally, use data from the simulation reports you generated to draw conclusionsabout the most favorable design alternative. In many cases energy use and energy cost data will beused for further study of lifecycle economics.
Getting Started Chapter 1
HAP Quick Reference Guide 1-7
1.4 WORKING WITH THE HAP MAIN PROGRAM WINDOW
This section discusses HAP’s main program window which appears when you start the program. Muchof the work you will perform entering data and generating reports is done using features of the mainprogram window. Key elements and features of the main program window are discussed below.Appendix A explains how to use these features in greater detail. The HAP tutorials in Chapter 2 and theexample problems in Chapters 3 and 4 also illustrate how features are used when designing systems andsimulating energy use.
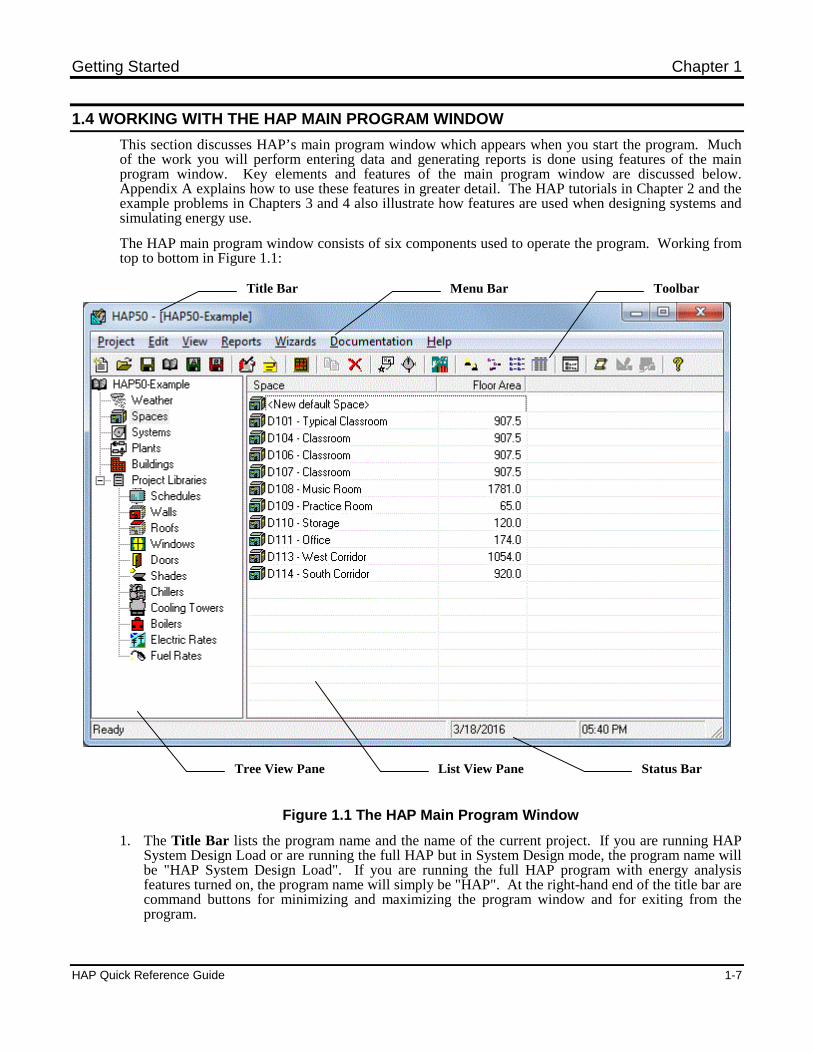
The HAP main program window consists of six components used to operate the program. Working fromtop to bottom in Figure 1.1:
Figure 1.1 The HAP Main Program Window
1. The Title Bar lists the program name and the name of the current project. If you are running HAPSystem Design Load or are running the full HAP but in System Design mode, the program name willbe "HAP System Design Load". If you are running the full HAP program with energy analysisfeatures turned on, the program name will simply be "HAP". At the right-hand end of the title bar arecommand buttons for minimizing and maximizing the program window and for exiting from theprogram.
ToolbarMenu BarTitle Bar
Status BarList View PaneTree View Pane
Chapter 1 Getting Started
1-8 HAP Quick Reference Guide
2. The Menu Bar lies immediately below the title bar. The menu bar contains seven pull-down menusused to perform common program tasks. To use menu options, first click on the menu name to “pull-down” its list of options. Then click on the name of the desired option. The seven pull down menusare as follows:
The Project Menu provides options for manipulating project data. This includes tasks such ascreating, opening, saving, deleting, archiving and retrieving projects. Section 1.7 and AppendixB discuss projects in greater detail.
The Edit Menu contains options used to work with individual data items such as spaces,systems, walls, roofs, etc… Appendix A provides more information about how options on theEdit Menu are used to perform specific tasks.
The View Menu offers options used to change the appearance of the main program window.This includes changing the format of data shown in the list view, turning on or off the toolbarand status bar, and setting user preferences such as units of measure. For HAP users, an option isalso provided for switching between full HAP and HAP System Design Load modes of programoperation. This feature is used for projects which only require system design. In these cases, itis sometimes useful to simplify program operation by temporarily turning off the energy analysisfeatures.
The Reports Menu provides options for generating reports containing input data, design resultsand energy simulation results (HAP users only). Appendix A describes how these menu optionsare used in greater detail.
The Wizards Menu contains options for running the Weather, Building, Equipment or UtilityRate Wizards separately, and for running a "Full Wizard Session" which integrates all fourWizards so you can rapidly generate data for a cost comparison study all at one time.
The Documentation Menu contains resource material to aid in learning about the program.Options on this menu display the program quick reference manual, documents describingcompliance with industry standards, and a tutorial for applying HAP in LEED® projects.Section 1.8 discusses these resources in more detail.
The Help Menu contains options for technical assistance with the program. This includesoptions for displaying the help system, contact information for Carrier software support, andlinks to web-based support materials and software training class information. Section 1.8discusses these resources in more detail.
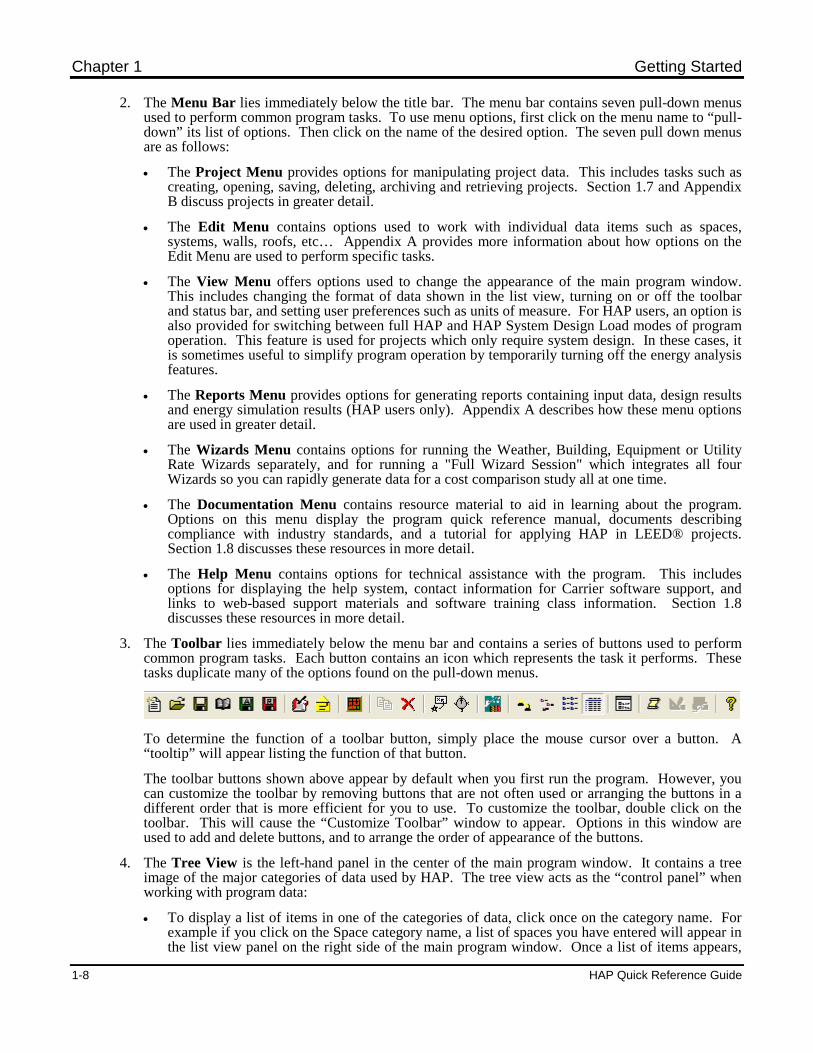
3. The Toolbar lies immediately below the menu bar and contains a series of buttons used to performcommon program tasks. Each button contains an icon which represents the task it performs. Thesetasks duplicate many of the options found on the pull-down menus.
To determine the function of a toolbar button, simply place the mouse cursor over a button. A“tooltip” will appear listing the function of that button.
The toolbar buttons shown above appear by default when you first run the program. However, youcan customize the toolbar by removing buttons that are not often used or arranging the buttons in adifferent order that is more efficient for you to use. To customize the toolbar, double click on thetoolbar. This will cause the “Customize Toolbar” window to appear. Options in this window areused to add and delete buttons, and to arrange the order of appearance of the buttons.
4. The Tree View is the left-hand panel in the center of the main program window. It contains a treeimage of the major categories of data used by HAP. The tree view acts as the “control panel” whenworking with program data:
To display a list of items in one of the categories of data, click once on the category name. Forexample if you click on the Space category name, a list of spaces you have entered will appear inthe list view panel on the right side of the main program window. Once a list of items appears,
Getting Started Chapter 1
HAP Quick Reference Guide 1-9
you can click on items in the list view to perform such tasks as creating new data, editing dataand generating reports.
To display a pop-up menu of options for the category, right-click on the category name. The“category pop-up menu” will appear. Options on this menu will perform tasks on all items in agiven category. For example, if you right-click on the System category name, the Systemcategory pop-up menu will appear. If you select the Print Input Data option, input data for allsystems in your project will be printed. Because options on the category pop-up menu operate onall items in a category, you should be careful using these options.
To display a summary of project contents, click once on the Project category name. A list of themajor data categories (weather, spaces, systems, plants) will appear. If the “details” format isused for the list view, the quantity of items you have defined for each category will also beshown. For example, the summary shows the number of spaces and systems which have beendefined.
To display a summary of project library contents, click once on the Project Libraries categoryname. A list of the library categories (schedules, walls, roofs, windows, doors, shades) willappear. If the “details” format is used for the list view, the quantity of items you have defined ineach category will be shown. For example, the summary shows the number of wall and roofassemblies you have defined.
5. The List View is the right-hand panel in the center of the main program window. It contains a list ofdata items in alphabetical order for one of the categories of data in your project. For example, whenthe space category is selected, the list view shows a list of spaces you have entered. The list viewacts as the second part of the “control panel” when working with program data. By selecting items inthe list view you can:
Create new items. Example: Creating a new schedule. Edit existing items. Example: Editing a wall assembly you previously defined. Duplicate an existing item. Example: Creating a new space using defaults from an existing
space. Duplicate a building with all its spaces and HVAC equipment. This is often useful in LEED®
EA Prerequisite 1 and EA Credit 1 analyses when making a copy of a Proposed Design buildingand all its spaces, systems, plants, chillers, towers and boilers to serve as the basis for assemblingthe Baseline Building.
Delete existing items. Example: Deleting three systems you previously entered. Searching and replacing existing space data. Example: Change lighting W/sqft from 2.0 to 1.8
for 40 spaces all at one time. Rotating the orientation of existing spaces. Example: Rotate the orientation of 35 spaces by 45
degrees clockwise all at one time. Performing LEED (90.1 PRM) Rotations. This is used in a LEED® EA Prerequisite 1 and EA
Credit 1 analyses to take a Baseline Building and make three copies of it, with spaces rotated 90deg, 180 deg and 270 deg respectively.
View or print input data. Example: Printing input data for four window assemblies youpreviously entered.
View or print design reports. Example: Viewing design reports for two air systems you defined. View or print energy simulation reports (HAP users only). Example: Printing a building
simulation report listing annual energy use and energy costs.
There are usually at least two or three ways of performing each task. For example, after selectingitems in the list view, an option on the Edit or Report Menu can be selected, or a button on theToolbar can be pressed, or an item pop-up menu can be displayed by right-clicking on the selecteditems. Appendix A provides specific procedures for performing all these common operating tasks.
6. The Status Bar is the final component of the main program window and appears at the bottom of thewindow. The current date and time appear at the right-hand end of the status bar. Pertinentmessages appear at the left-hand end of the status bar.
Chapter 1 Getting Started
1-10 HAP Quick Reference Guide
Further information on program operation can be found in separate sections of this guide dealing withinput windows and project management. Appendix A also provides detailed information on using mainprogram window features to enter data and generate reports.
1.5 WORKING WITH HAP INPUT WINDOWS
This section discusses the basic operating principles of HAP’s input windows. While much of your workwith the program is done on the main program window, the actual entry of data is done using inputwinidows. An input window appears when you choose to create a new item or edit an existing item. Aseparate input window is provided for each category of HAP data.
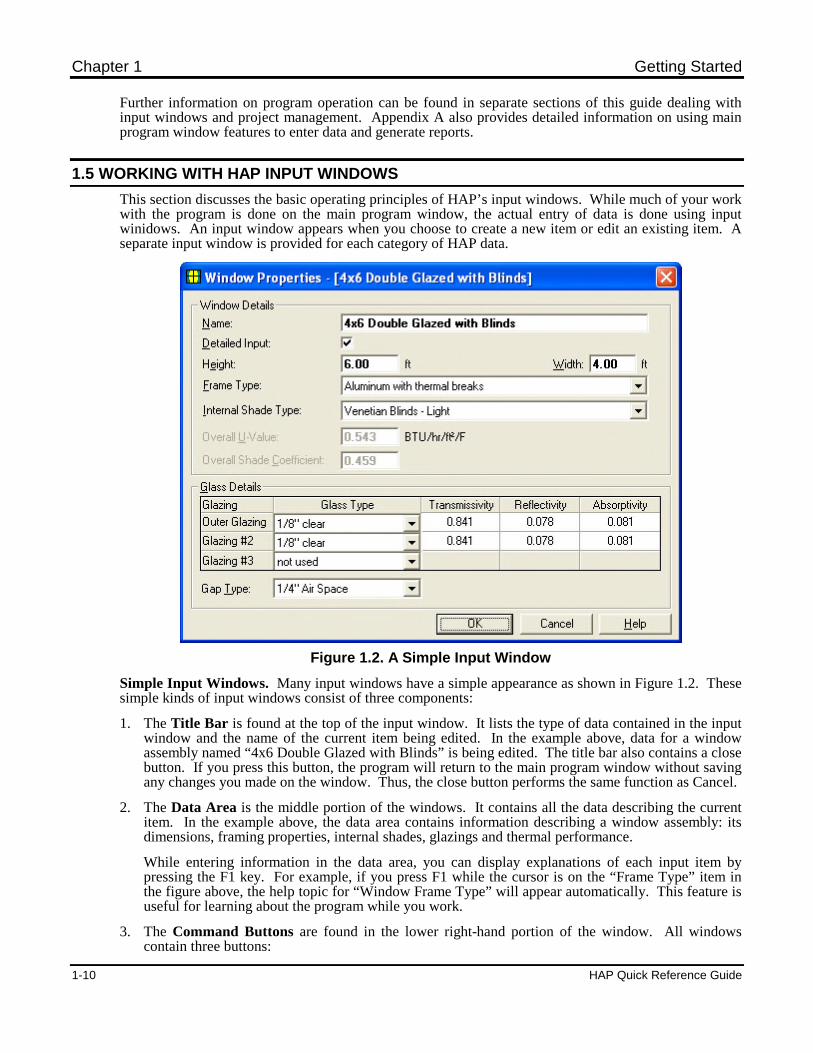
Figure 1.2. A Simple Input Window
Simple Input Windows. Many input windows have a simple appearance as shown in Figure 1.2. Thesesimple kinds of input windows consist of three components:
1. The Title Bar is found at the top of the input window. It lists the type of data contained in the inputwindow and the name of the current item being edited. In the example above, data for a windowassembly named “4x6 Double Glazed with Blinds” is being edited. The title bar also contains a closebutton. If you press this button, the program will return to the main program window without savingany changes you made on the window. Thus, the close button performs the same function as Cancel.
2. The Data Area is the middle portion of the windows. It contains all the data describing the currentitem. In the example above, the data area contains information describing a window assembly: itsdimensions, framing properties, internal shades, glazings and thermal performance.
While entering information in the data area, you can display explanations of each input item bypressing the F1 key. For example, if you press F1 while the cursor is on the “Frame Type” item inthe figure above, the help topic for “Window Frame Type” will appear automatically. This feature isuseful for learning about the program while you work.
3. The Command Buttons are found in the lower right-hand portion of the window. All windowscontain three buttons:
Getting Started Chapter 1
HAP Quick Reference Guide 1-11
Press the OK button to return to the main program window after saving any changes you made onthe input window.
Press the Cancel button to return to the main program window without saving any changes youmade on the input window. The Cancel button performs the same function as the close button inthe title bar.
Press the Help button to display an overview of the current input window. This overviewdescribes how the input window is organized and how to use it. It also contains links to helptopics for the individual input items on the window.
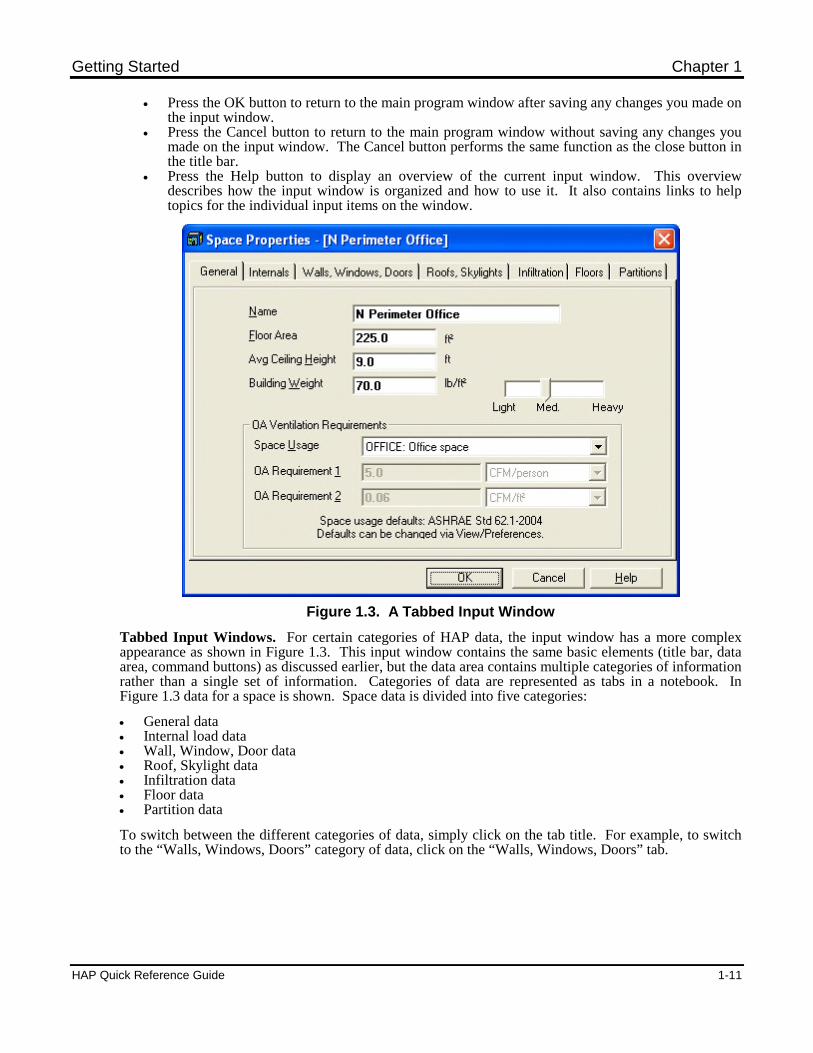
Figure 1.3. A Tabbed Input Window
Tabbed Input Windows. For certain categories of HAP data, the input window has a more complexappearance as shown in Figure 1.3. This input window contains the same basic elements (title bar, dataarea, command buttons) as discussed earlier, but the data area contains multiple categories of informationrather than a single set of information. Categories of data are represented as tabs in a notebook. InFigure 1.3 data for a space is shown. Space data is divided into five categories:
General data Internal load data Wall, Window, Door data Roof, Skylight data Infiltration data Floor data Partition data
To switch between the different categories of data, simply click on the tab title. For example, to switchto the “Walls, Windows, Doors” category of data, click on the “Walls, Windows, Doors” tab.
Chapter 1 Getting Started
1-12 HAP Quick Reference Guide
1.6. PERFORMING COMMON TASKS WITH HAP
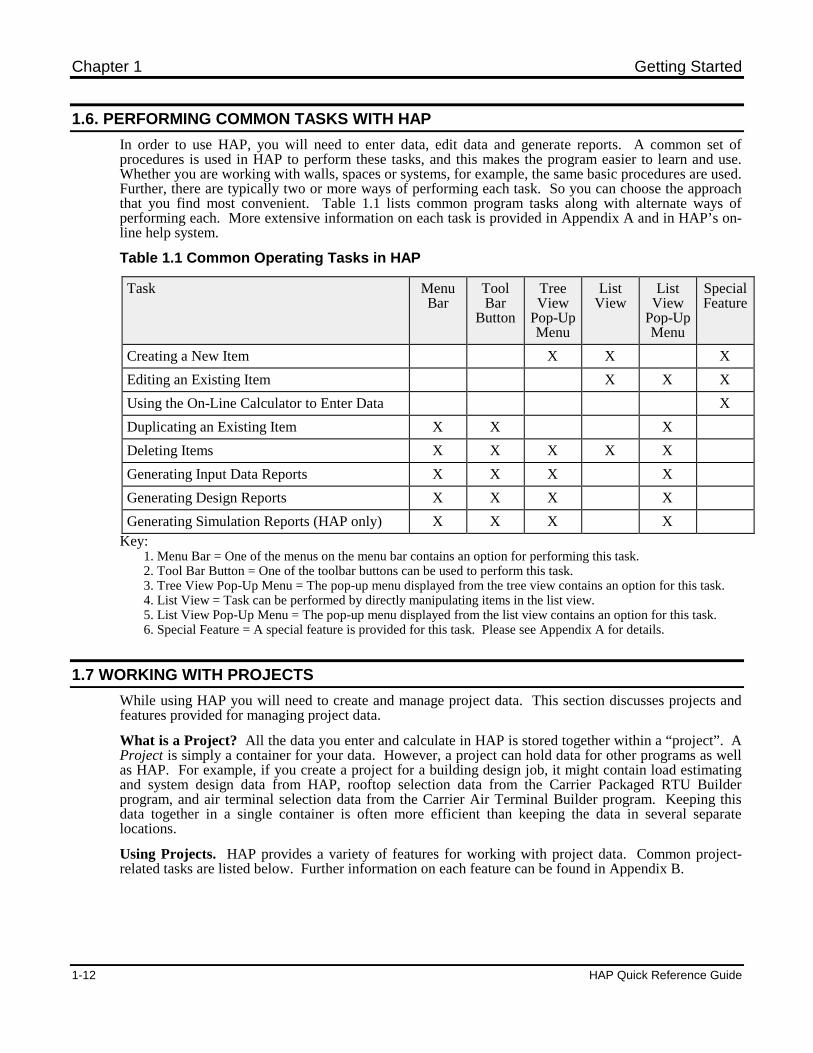
In order to use HAP, you will need to enter data, edit data and generate reports. A common set ofprocedures is used in HAP to perform these tasks, and this makes the program easier to learn and use.Whether you are working with walls, spaces or systems, for example, the same basic procedures are used.Further, there are typically two or more ways of performing each task. So you can choose the approachthat you find most convenient. Table 1.1 lists common program tasks along with alternate ways ofperforming each. More extensive information on each task is provided in Appendix A and in HAP’s on-line help system.
Table 1.1 Common Operating Tasks in HAP
Task MenuBar
ToolBar
Button
TreeView
Pop-UpMenu
ListView
ListView
Pop-UpMenu
SpecialFeature
Creating a New Item X X X
Editing an Existing Item X X X
Using the On-Line Calculator to Enter Data X
Duplicating an Existing Item X X X
Deleting Items X X X X X
Generating Input Data Reports X X X X
Generating Design Reports X X X X
Generating Simulation Reports (HAP only) X X X X
Key:1. Menu Bar = One of the menus on the menu bar contains an option for performing this task.2. Tool Bar Button = One of the toolbar buttons can be used to perform this task.3. Tree View Pop-Up Menu = The pop-up menu displayed from the tree view contains an option for this task.4. List View = Task can be performed by directly manipulating items in the list view.5. List View Pop-Up Menu = The pop-up menu displayed from the list view contains an option for this task.6. Special Feature = A special feature is provided for this task. Please see Appendix A for details.
1.7 WORKING WITH PROJECTS
While using HAP you will need to create and manage project data. This section discusses projects andfeatures provided for managing project data.
What is a Project? All the data you enter and calculate in HAP is stored together within a “project”. AProject is simply a container for your data. However, a project can hold data for other programs as wellas HAP. For example, if you create a project for a building design job, it might contain load estimatingand system design data from HAP, rooftop selection data from the Carrier Packaged RTU Builderprogram, and air terminal selection data from the Carrier Air Terminal Builder program. Keeping thisdata together in a single container is often more efficient than keeping the data in several separatelocations.
Using Projects. HAP provides a variety of features for working with project data. Common project-related tasks are listed below. Further information on each feature can be found in Appendix B.
Getting Started Chapter 1
HAP Quick Reference Guide 1-13
Create a new project. Edit data in an existing project. Save changes in a project. Save changes to a new project. Delete an existing project. Edit descriptive data for the project. Archive project data for safe keeping. Retrieve data that you earlier archived. Convert data from a previous version of HAP. Publish equipment sizing requirements so the data can be used in Carrier Electronic Catalog to make
equipment selections. E-mail project data to your Carrier sales engineer for assistance with equipment selections. Export results to the Engineering Economic Analysis program for use in lifecycle cost studies. Import data from another project into the current project. Import data from Computer Aided Design (CAD) or Building Information Modeling (BIM) software. Import data from a Building System Optimizer project.
How Project Data is Stored. When a new project is saved for the first time, you designate the folderwhich will hold the project files (either by accepting the default folder \E20-II\Projects\ProjectName orby specifying a folder yourself). This folder is the permanent storage location of project data. When youopen the project to work with its data, temporary copies of the project’s data files are made. As you enterdata, make changes and perform calculations, all this data is stored in the temporary copy of the datafiles. Only when you use the Save option on the Project Menu are the changes you’ve made copied topermanent storage. Therefore, if you ever need to undo changes you’ve made to a project, simplyre-open the project without saving the changes you’ve made. When you re-open the project, the changesstored in the temporary copy of the data files are discarded, and data from your last project/save isrestored.
Recommended Project Management Practices. Project data represents an important investment ofyour time and effort. And, as the saying goes, ‘time is money’. Therefore it is important to safeguardyour investment in project data. We recommend adopting the following practices when working withprojects:
Create a separate project for each job you work on. It is usually more efficient to keep data forseparate jobs in separate projects. It is also safer to store data in smaller, focused units. If you keepdata for all jobs in a single project, and this project becomes damaged, your data loss will be greaterthan if you keep data for separate jobs in separate projects.
Use a descriptive name for the project so you can quickly recognize what it contains, both now andwhen you need to refer to the project in the future. Because the selection list for projects is arrangedalphabetically it is useful to use a consistent naming convention. Many firms begin the project namewith their internal project number followed by descriptive text (e.g., P2003-47 Lincoln School).
Save early and often. While entering data, changing data and generating reports, save the projectperiodically. This practice is useful in the event that you make a mistake and need to undo changes.If the last time you saved the project was 15 minutes ago, undoing your mistake will only cause youto lose 15 minutes of work. On the other hand, if the last time you saved the data was 4 hours ago,undoing a mistake may cause you to lose 4 hours worth of work.
Archive your data periodically for safekeeping. These days data on hard disks is relatively safe.However, it is still possible for hard disk drives to become damaged, or for files on the hard disk tobe damaged or erased. Therefore it is a good practice to periodically archive your project data. Datacan be archived to a separate location on your hard disk, to a different hard disk drive or toremovable media such as a zip drive or floppy disks. For example, if you archive data for a largeproject at the end of each day and your hard disk drive fails, at most you will have lost one day’sworth of work. On the other hand, if data for the same large project was never archived and yourhard disk drive fails, all the project data would be lost.
Further Information. Further information on procedures used to manage project data is found inAppendix B and the program’s on-line help system.
Chapter 1 Getting Started
1-14 HAP Quick Reference Guide
1.8 USING DOCUMENTATION RESOURCES IN HAP
HAP provides extensive resources to help users learn about, understand and use the software. Theseresources are found on the Documentation and Help Menus.
Options on the Help Menu include:
1. The Help System. The "Contents and Index" menu option launches the help system. The helpsystem contains introductory information, tutorials, examples, application information, and completeexplanations of all program input screens and reports and calculation documentation. In addition toyou can launch the help system by pressing [F1] at any point during program operation or by pressingany of the Help buttons that appear on program input screens.
2. Telephone and E-mail Support. The "Contact Software Support" menu option displays telephoneand e-mail contact information you can use to contact Carrier software support for assistance withthe program.
3. Self-Directed Help on the Web. The "eDesign Support Web Site" menu option links you to theeDesign Application Support web page. This page provides self-service support materials such asfrequently asked questions and "eHelps", which are short articles on common program topics ofinterest.
4. Software Newsletter. The "eDesign Newsletter" menu option links you to the EXchange softwarenewsletter web page from which you can subscribe to this quarterly electronic newsletter containinginformation about HAP and other Carrier eDesign tools.
5. Program Updates. The "Check for Program Updates" menu option links you to the eDesignDownloads web page where you can check to see if patch updates or major updates for the programhave been released.
6. Software Training Information. The " eDesign Software Training" menu option links you to theeDesign Software Training web page which contains class descriptions, a schedule of class dates andlocations, and on-line class registration.
7. Current Program Version Information. The "About HAP" menu option displays the currentprogram version. This option is useful if you are unsure if you have the latest version. The versiondisplayed via this option can be compared with the versions shown in the eDesign Downloads webpage (item 5 above).
The Help Menu also provides links to the Carrier eDesign software main web page and the Carriercommercial building products and services web site.
Options on the Documentation Menu include:
1. Quick Reference Manual - Displays an electronic copy of the HAP Quick Reference Manual. Thismanual contains a subset of the information in the help system including the introductoryinformation, tutorials, example problems and application information sections.
2. Example Problem Reports - Displays a document containing calculation results from the exampleproblem (Chapters 3 and 4 of the help system). Some companies require that calculation results ofnewly installed software must be validated against a reference set of results. This document providesthe reference results for that validation work.
3. ASHRAE 90.1 Energy Cost Budget - Displays a document describing how HAP complies withsimulation software requirements in Section 11 (Energy Cost Budget Method) of ASHRAE Standard90.1 - Energy Standard for Buildings except Low-Rise Residential Buildings.
4. ASHRAE Standard 140 Test Results – Display a document summarizing testing results for thecurrent version of HAP per ASHRAE Standard 140 – Standard Method of Test for the Evaluation ofBuilding Energy Analysis Computer Programs.
Getting Started Chapter 1
HAP Quick Reference Guide 1-15
5. ASHRAE 183 (Peak Load Calculations) - Displays a document describing how HAP complies withprovisions in ASHRAE Standard 183 - Peak Cooling and Heating Load Calculations in BuildingsExcept Low-Rise Buildings.
6. ASHRAE 90.1 Appendix G - Displays a document describing how HAP complies with simulationsoftware requirements in Appendix G (Performance Rating Method) of ASHRAE Standard 90.1 -Energy Standard for Buildings except Low-Rise Residential Buildings.
7. Using HAP for LEED EA Credit 1 - Displays a document describing how to use HAP for LEED®Energy and Atmosphere Credit 1 (Optimize Energy Performance) analyses.
8. US Federal Regulation 10 CFR 434 - Displays a document describing how HAP complies withsimulation software requirements in Federal Register 10CFR Part 434.

[This page has been left blank intentionally]
HAP Quick Reference Guide 2-1
Chapter 2 HAP Tutorials
This chapter provides three brief tutorials. The first describes how to use the Hourly Analysis Programto design systems and plants. The second and third explain how to use the program to estimate annualenergy costs for HVAC systems. The tutorials are designed for readers who want a quick description ofhow to use the program and are already familiar with the design process, HAP terminology and basicprinciples of program operation.
2.1 HAP SYSTEM DESIGN TUTORIAL
This tutorial explains how to use HAP to perform detailed system design work for systems and plants.When HAP is started, the main program window appears. At this point the system design processinvolves the following five steps to design systems and two additional steps to design plants. Note thatthis tutorial assumes the reader is prepared to enter his or her own building and system data. For acomplete example problem, please refer to Chapter 3.
1. Create a New Project
Choose New on the Project menu. This creates a new project. A project is the container whichholds your data.
Choose Save on the Project menu. You’ll be asked to name the project. From here on, save theproject periodically.
2. Enter Weather Data
Click on the “Weather” item in the tree view in the main program window. A “WeatherProperties” item appears in the list view.
Double click on the “Weather Properties” item in the list view. The Weather input window willappear.
Enter weather data. Press the OK button on the Weather input window to save the data and return to the main
program window.
3. Enter Space Data
Click on the “Space” item in the tree view in the main program window. Space information willappear in the list view.
Double-click on the “<new default space>” item in the list view. The Space input window willappear.
Enter data for your first space. While entering spaces, you may need to create schedules, walls,roofs, windows, doors or external shades. You can do this by choosing the “create new …” itemin drop-down selection lists. For example, when entering overhead lighting data, you mustchoose a schedule. In the schedule drop-down list, choose the “create new schedule” item tocreate a schedule and automatically assign it to overhead lighting. Similar procedures are usedfor walls, roofs, windows, doors and external shades. An alternate approach is to createschedules, walls, roofs, windows, doors and external shading prior to entering space data.
Press the OK button on the Space input window to save your data and return to the main programwindow.
To enter another space, in the list view right-click on the name of the space you just created. Thespace pop-up menu appears.
Chapter 2 HAP Tutorial
2-2 HAP Quick Reference Guide
Choose the “Duplicate” option on the pop-up menu. A copy of the original space will be createdand its input window will appear. This is a quick way of generating new spaces based ondefaults from the previous space. For many projects this will be more efficient than creatingeach new space from standard defaults.
Enter data for this new space. Press the OK button on the Space input window to save your data and return to the main program
window. Repeat the previous four steps to enter data for as many spaces as you need.
4. Enter Air System Data
Click on the “System” item in the tree view in the main program window. System informationwill appear in the list view.
Double-click on the “<new default system>” item in the list view. The System input windowwill appear.
Enter data for your first system. While entering the system, you will need to create afan/thermostat schedule. You can do this by choosing the “create new schedule” item in thefan/thermostat schedule drop-down list. This will create a schedule and automatically assign it toyour system. An alternate approach is to create this schedule before entering air system data.
Press the OK button on the System input window to save your data and return to the mainprogram window.
To enter another system, in the list view right-click on the name of the system you just created.The system pop-up menu appears.
Choose the “Duplicate” option on the pop-up menu. A copy of the original system will becreated and its input window will appear. This is a quick way of generating new systems basedon defaults from the previous system, if successive systems are similar. If they are not, use the"new default system" option to create each new system.
Enter data for this new system. Press the OK button on the System input window to save your data and return to the main
program window. Repeat the previous four steps to enter data for as many systems as you need.
5. Generate System Design Reports
Click on the “System” item in the tree view in the main program window. System informationwill appear in the list view.
Select the systems for which you want reports. Choose the “Print/View Design Results” option on the Reports menu. On the System Design Reports window, choose the desired reports. To view the reports before printing, press the Preview button. To print the reports directly, press the Print button. Before generating reports, HAP will check to see if system design calculations have been
performed. If not, HAP automatically runs these calculations before generating the reports.
6. Enter Plant Data (if necessary)
Click on the “Plant” item in the tree view in the main program window. Plant information willappear in the list view.
Double-click on the “<new default plant>” item in the list view. The Plant input window willappear.
Enter data for your first plant. For plant design purposes users will typically only select from thefirst six plant types (one of the “Generic” types). HAP users have additional options for specifictypes of chilled water, hot water and steam plants, but these require extra data not relevant to thedesign calculation. Therefore it is more efficient to use the Generic plant types for design. LaterGeneric plants can be converted into specific plant types without loss of data.
Press the OK button on the Plant input window to save your data and return to the main programwindow.
To enter another plant, in the list view right-click on the name of the plant you just created. Theplant pop-up menu appears.
HAP Tutorial Chapter 2
HAP Quick Reference Guide 2-3
Choose the “Duplicate” option on the pop-up menu. A copy of the original plant will be createdand its input window will appear. This is a quick way of generating new plants based on defaultsfrom the previous plant, if successive plants are similar. If they are not similar, use the "newdefault plant" option to create each new plant.
Enter data for this new plant. Press the OK button on the Plant input window to save your data and return to the main program
window. Repeat the previous four steps to enter data for as many plants as you need.
7. Generate Plant Design Reports (if necessary)
Click on the “Plant” item in the tree view in the main program window. Plant information willappear in the list view.
Select the plants for which you want reports. Choose the “Print/View Design Results” option on the Reports menu in the menu bar. On the Plant Design Reports window, choose the desired reports. To view the reports before printing, press the Preview button. To print the reports directly, press the Print button. Before generating reports, HAP will check to see if plant design calculations have been
performed. If not, HAP automatically runs these calculations before generating the reports.
2.2 HAP ENERGY ANALYSIS TUTORIAL - PRELIMINARY DESIGN
This tutorial and the following tutorial in section 2.3 explain how to use HAP to estimate annual energyuse and energy costs. HAP provides features suited to energy analysis in the preliminary or schematicdesign phase of a project and for analysis in the detailed design phase of a project.
In preliminary design the goal is often to quickly "screen" prospective HVAC design alternatives toidentify the most promising designs for further study. In this type of analysis extensive details about thebuilding and its HVAC equipment may not yet be known or may not be relevant for obtaining usefulscreening results. As a result a simplified modeling approach can be used and data entry can be madefaster. HAP provides a set of "wizard" features to help users rapidly generate building and HVACequipment input data for these applications. This tutorial explains how to use those features.
In detailed design the goal is to investigate energy consumption and energy cost performance of HVACdesigns in greater detail. In this type of analysis complete details about the building envelope, layout anduse are known and HVAC equipment is defined in greater detail. As a result, data entry is moreinvolved, but results are also more detailed and accurate. The tutorial in section 2.3 explains how to useHAP for energy analysis in detailed design applications.
Energy Analysis Tutorial for Preliminary Design
When HAP is started, the main program window appears. At this point the energy analysis involves thefollowing 3 easy steps.
1. Create a New Project
Choose New on the Project menu. This creates a new project. A project is the container whichholds your data.
Choose Save on the Project menu. You’ll be asked to name the project. From here on, save theproject periodically.
2.. Run a Full Wizard Session to Rapidly Define All Input Data
Choose the Full Wizard Session option on the Wizards menu. In the Full Wizard Session window, first click the Weather button. Select the weather data for
your analysis by either clicking on the map images or using the drop-down lists at the bottom ofthe Weather Wizard window. Then click OK to exit the Wizard.
From the Full Wizard Session window, then click the Building button. Enter data describingyour building on the two Building Wizard input screens. Then press Finish to exit the Wizard.
Chapter 2 HAP Tutorial
2-4 HAP Quick Reference Guide
From the Full Wizard Session window, click the Equipment button next. The EquipmentAlternatives window will appear.
In the Equipment Alternatives click the Add button to add a new HVAC equipment alternative.Enter data on the Equipment Wizard screens to describe your air-side equipment and, asapplicable, your DX or plant equipment. Press Finish to exit.
Repeat the previous step for each equipment alternative you wish to include in your study. When finished, click the Close button on the Equipment Alternatives window to return to the
Full Wizard Session window. From the Full Wizard Session window, click the Utility Rate button. Enter data describing your
electric and fuel prices on the Utility Rate Wizard screens. Press Finish to exit. Finally, on the Full Wizard Session window, click the Finish button. At this point HAP
automatically takes your weather, building, equipment and utility rate wizard input data andgenerates a complete set of detailed input data for your analysis. When this work is finished youare returned to HAP main window.
3. Obtain Results
On the HAP main window, click the Building node in the tree view on the left. In the Building list that appears in the right-hand list view panel select one or more buildings you
want to include in your energy cost comparison. Each "building" in the list corresponds to oneequipment alternative you defined in the Equipment Wizard.
Choose the “Print/View Simulation Results” option on the Reports menu. In the Building Simulation Reports window, choose the desired reports. To view the reports, press the Preview button. To print the reports directly, press the Print button.
Note that simulation reports can also be generated for systems and plants separately. These reportsprovide more detailed information about the energy use of air system and plant equipment. To generatethese reports, use the same procedure described above, but select systems or plants in the HAP mainwindow tree view panel instead of selecting buildings.
2.3 HAP ENERGY ANALYSIS TUTORIAL - DETAILED DESIGN
This tutorial explains how to use HAP to estimate annual energy use and energy cost for alternate systemdesigns. This tutorial is appropriate for energy analysis in the detailed design phase of a project whereextensive information about the building and its HVAC systems is known, and highly accurate results areneeded.
Energy Analysis Tutorial for Detailed Design
When HAP is started, the main program window appears. At this point the energy analysis involves thefollowing 7 steps. If system design work has already been completed, many of these steps will not benecessary or will only require minimal work.
1. Create a New Project
Choose New on the Project menu. This creates a new project. A project is the container whichholds your data.
Choose Save on the Project menu. You’ll be asked to name the project. From here on, save theproject periodically.
=OR= If system design work was done previously, then the project will already exist. In this case use
the Open option on the Project menu to open the project.
HAP Tutorial Chapter 2
HAP Quick Reference Guide 2-5
2. Enter Weather Data
Click on the “Weather” item in the tree view in the main program window. A “WeatherProperties” item appears in the list view.
Double click on the “Weather Properties” item in the list view. The Weather input window willappear.
Enter weather data. Be sure to enter data on the Simulation tab of the Weather window. Inputson this tab link simulation weather data to the project and define the holiday calendar for theyear.
Press the OK button on the Weather input window to save the data and return to the mainprogram window.
3. Enter Space Data
This step is the same as in the System Design Tutorial in section 2.1, but with the followingexceptions:
Make sure that schedules for internal loads include profiles assigned for all 7 days of the weekand for holidays. Data originally used for system design work may only have defined profiles forthe design day.
Make sure infiltration rates for energy analysis days are specified. For design work infiltrationrates may only have been specified for design cooling and design heating conditions.
4. Enter Air System Data
This step is the same as in the System Design Tutorial in section 2.1, but with the followingexceptions:
Systems used in an energy analysis may not use the "Undefined" equipment class. Any“Undefined” system must be converted to one of the specific equipment classes before it can beused in energy simulations. To convert a system, edit its data and change the “Equipment Class”input from “Undefined” to one of the other choices. This will change the cooling and heatingsources for coils in the system, but will retain the other input data. Review your input data,particularly the cooling coil and heating coil source items before saving the system.
When defining data for packaged rooftop, packaged vertical units, split DX air handlers,packaged or split DX fan coils or water source heat pumps, you must enter data on theEquipment tab of the Air System window. This tab provides inputs describing the full loadcapacity, full load efficiency and operating controls for these types of DX equipment.
When entering data for water-cooled vertical packaged units, you will need to create a coolingtower. When entering data for a water source heat pump system you will need to create a coolingtower and an auxiliary boiler. You can create both from within the air system window by choosethe “create new cooling tower” and “create new boiler” options on the drop-down lists used toselect towers and boilers. An alternate approach is to create towers and boilers prior to enteringthe air system.
5. Enter Plant Data (if necessary)
If your study includes chilled water, hot water or steam plants, define each as follows:
Click on the “Plant” item in the tree view in the main program window. Plant information willappear in the list view.
Double-click on the “<new default plant>” item in the list view. The Plant input window willappear.
Enter data for your plant. While entering plant data it may be necessary to create chillers, reversible chillers, boilers, air-to-
water heat pumps, water-to-water heat pumps, cooling towers and/or dry coolers to link to theplant. This can be done without leaving the plant window by using the "create new ..." optionswhich appear in the drop-down lists used to select these plant components. An alternate approachis to define the chillers, heat pumps, towers, and boilers prior to entering plant data.
Press the OK button on the Plant input window to save your data and return to the main programwindow.
Chapter 2 HAP Tutorial
2-6 HAP Quick Reference Guide
If more than one plant is required for your analysis, repeat the previous steps to define eachplant.
6. Enter Building Data
Click on the “Building” item in the tree view in the main program window. Building informationwill appear in the list view.
Double-click on the “<new default building>” item in the list view. The Building input windowwill appear.
Enter data for your building. While entering building data it may be necessary to create electric and fuel rates to link to the
building. This can be done without leaving the building window by using the “create newelectric rate” and “create new fuel rate” options which appear on the drop-down lists used toselect utility rates. An alternate approach is to define the electric and fuel rates prior to enteringthe building.
Press the OK button on the Building input window to save your data and return to the mainprogram window.
Repeat the previous steps to define each building in your analysis. Typically an energy analysiscontains at least two buildings containing equipment for alternate HVAC designs.
7. Generate Simulation Reports
Click on the “Building” item in the tree view in the main program window. Building informationwill appear in the list view.
To study energy use and cost data for one building, select a single building. If you wish tocompare energy use and costs for a group of buildings, select all buildings in the group.
Choose the “Print/View Simulation Results” option on the Reports menu in the menu bar. On the Building Simulation Reports window, choose the desired reports. To view the reports, press the Preview button. To print the reports directly, press the Print button. Before generating reports, HAP will determine whether system, plant and building calculations
are necessary to generate data for your reports. If so, HAP will automatically run thecalculations before generating your reports. If no calculations are necessary, reports will begenerated immediately.
Note that simulation reports can also be generated for systems and plants. These reports providemore detailed information about the energy use of these equipment components. To generate thesereports, use the same procedure described above, but use systems or plants instead of buildings.
HAP Quick Reference Guide 3-1
Chapter 3 System Design Example Problem
This chapter contains a simple example problem which demonstrates how to use HAP to design anHVAC system. The example builds on concepts and procedures discussed in Chapters 1 and 2.
3.1 OVERVIEW FOR THE EXAMPLE PROBLEM
The procedure for designing HVAC systems in HAP involves five steps, as discussed in Chapter 1:
1. Define the Problem.2. Gather Data.3. Enter Data Into HAP.4. Use HAP to Generate Design Reports.5. Select Equipment.
The example problem presented in this chapter will demonstrate each step in this process. In theremainder of this chapter a separate section will deal with each step.
3.2 DEFINING THE PROBLEM
The objective of this example problem is to design an HVAC system which serves one wing of a highschool building located in Chicago, Illinois. The floor plan for this portion of the school building isshown in Figure 3.1. It is comprised of six classrooms, a music room and its associated office, storageand practice rooms, plus two corridors for a total of 12 rooms. In Figure 3.1, classrooms D101 throughD104 face due east. East, south and west walls are exposed to ambient. The north walls adjoin other air-conditioned areas of the building; we will assume there is no heat transfer across this northern boundary.
The rooms in this portion of the school building will be air conditioned by one rooftop unit servingparallel fan powered mixing box (PFPMBX) terminals. A gas-fired preheat coil in the rooftop unit andelectric resistance heating coils in the mixing box terminals provide heating. HAP will be used to modelthe heat transfer processes in the building in order to determine the following nine equipment sizingvalues:
Rooftop unit required cooling capacity. Rooftop unit required fan airflow Rooftop unit required preheat coil capacity. Rooftop unit required outdoor airflow rate. PFPMBX terminal design airflow rates. PFPMBX terminal minimum airflow rates. PFPMBX terminal fan design airflow rates. PFPMBX terminal reheat coil capacities. Space required supply airflow rates.
Note: The VAV air system serves all of the spaces shown in Figure 3.1 except for D105 South Vestibuleand D112 West Vestibule. The two vestibules contain fan coil heaters and would be modeled using aseparate heating-only fan coil air system. For purposes of this example we will focus on the VAV airsystem and omit consideration of the vestibule fan coil units.
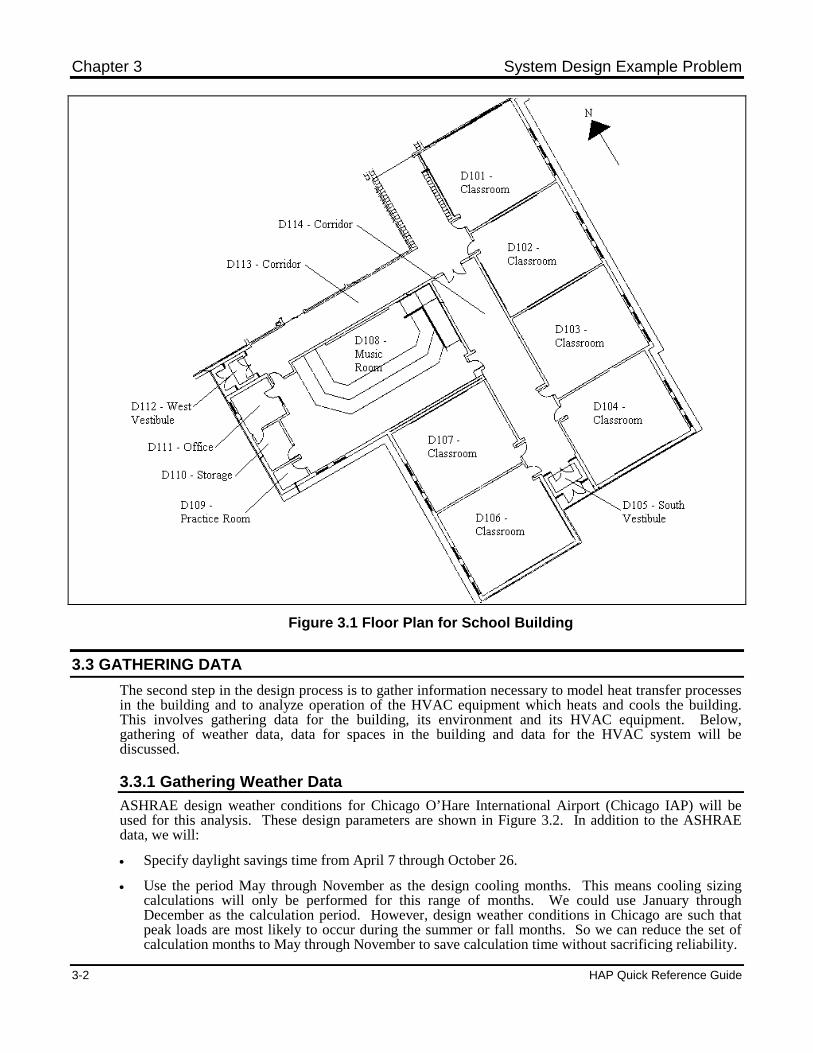
Chapter 3 System Design Example Problem
3-2 HAP Quick Reference Guide
Figure 3.1 Floor Plan for School Building
3.3 GATHERING DATA
The second step in the design process is to gather information necessary to model heat transfer processesin the building and to analyze operation of the HVAC equipment which heats and cools the building.This involves gathering data for the building, its environment and its HVAC equipment. Below,gathering of weather data, data for spaces in the building and data for the HVAC system will bediscussed.
3.3.1 Gathering Weather Data
ASHRAE design weather conditions for Chicago O’Hare International Airport (Chicago IAP) will beused for this analysis. These design parameters are shown in Figure 3.2. In addition to the ASHRAEdata, we will:
Specify daylight savings time from April 7 through October 26.
Use the period May through November as the design cooling months. This means cooling sizingcalculations will only be performed for this range of months. We could use January throughDecember as the calculation period. However, design weather conditions in Chicago are such thatpeak loads are most likely to occur during the summer or fall months. So we can reduce the set ofcalculation months to May through November to save calculation time without sacrificing reliability.
System Design Example Problem Chapter 3
HAP Quick Reference Guide 3-3
3.3.2 Gathering Space Data
In this example problem we will model the heat transfer of each room separately so peak loads andrequired airflow rates can be determined for each room. In this portion of the school building there are12 rooms, but three (D101, D102 and D103) are identical. Therefore we will define one of theseclassrooms as a space and reuse it three times. This reduces the total number of spaces needed for theanalysis from 12 to 10. Characteristics of these spaces were derived from architectural plans and frominformation about the use of the building and are described below.
Walls. One common wall construction is used for all exterior walls. The construction, whose data isshown in Figure 3.3, consists of 4-inch face brick, R-7 board insulation, 8-inch lightweight concreteblock, an air space and gypsum board finish. The exterior surface absorption is in the “dark” category.The overall U-value is 0.084 BTU/(hr-sqft-F). The overall weight is 69.8 lb/sqft.
Roofs. One uniform horizontal roof construction is used for this portion of the school building. Its datais shown in Figure 3.7. The roof construction consists of built-up roofing, board insulation with R-21, 22gauge steel deck, a plenum air space and acoustic ceiling tiles. The exterior surface absorption is in the“dark” category. The overall U-value is 0.040 BTU/(hr-sqft-F). The overall weight is 5.8 lb/sqft. Notethat in HAP the roof assembly must include all material layers from the exterior surface to the interiorsurface adjacent to the conditioned space. Thus, the ceiling plenum is considered part of the overall roofassembly.
Windows & External Shading. One type of fixed window unit is used for all windows in this portionof the school building. The window units measure 6 feet in height by 4 feet in width, are double glazed,and use an aluminum frame with thermal breaks. No internal shades are used. Manufacturer’s NFRCratings indicate the window has a U-value of 0.550 BTU/(hr-sqft-F) and a shading coefficient of 0.40.All windows have a 4-inch reveal depth. Window data is shown in Figure 3.4 while external shadingdata is shown in Figure 3.8
Lighting. Recessed, unvented fluorescent lighting fixtures are used for all rooms in this portion of theschool building. A lighting density of 1.00 W/sqft is used.
For classrooms, offices, storage rooms and practice rooms we will use design day lighting levels of 100%from 0700 through 1700, the standard occupancy period for the school, and 5% from 1800 through 2100when lighting is reduced or operated intermittently for custodial work. This lighting profile applies forthe days the school is in session. For weekends and holidays lighting levels of 0% are used. The holidayperiod includes a summer shutdown period from late June to early August. Therefore theWeekend/Holiday lighting profile will be used for July for design calculations. Lighting schedule data isshown in Figure 3.5.
For the corridors and vestibules we will use design day lighting levels of 100% for 0700 through 2100.Security lighting levels of 5% will be used for all other hours. This lighting profile applies for days theschool is in session. For weekends and holidays lighting remains at 5% security levels for all hours.Lighting schedule data is shown in Figure 3.5
Occupants. The maximum number of occupants varies by space and will be discussed later in thissection. For all rooms except the music room, a “seated at rest” activity level will be used (230BTU/hr/person sensible, 120 BTU/hr/person latent). For the music room the “office work” activity levelwill be used due to the higher level of activity in this room (245 BTU/hr/person sensible, 205BTU/hr/person latent).
For all rooms we will use design day occupancy levels of 100% for 0700 through 1700, the normal hoursof operation for the school. Occupancy during the period 1800 through 2100 is very infrequent and willbe ignored. Thus, occupancy levels of 0% will be used for all other hours of the day. This occupancyprofile applies for days the school is in session. For weekends and holidays 0% occupancy is used for allhours. For the summer shutdown period from late June to early August these 0% occupancy values willbe used. The occupant schedule is shown in Figure 3.5.
Spaces. A total of 10 spaces will be defined. Data for these spaces appears in Figures 3.8 through 3.17.Details:
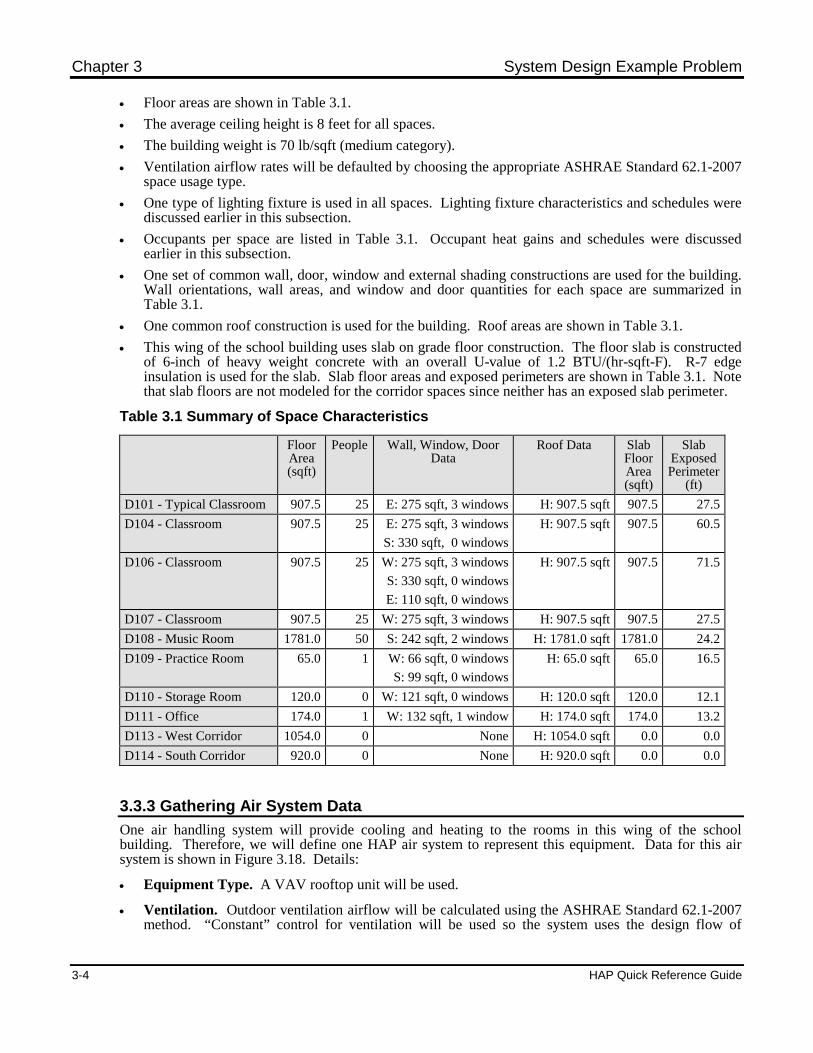
Chapter 3 System Design Example Problem
3-4 HAP Quick Reference Guide
Floor areas are shown in Table 3.1.
The average ceiling height is 8 feet for all spaces.
The building weight is 70 lb/sqft (medium category).
Ventilation airflow rates will be defaulted by choosing the appropriate ASHRAE Standard 62.1-2007space usage type.
One type of lighting fixture is used in all spaces. Lighting fixture characteristics and schedules werediscussed earlier in this subsection.
Occupants per space are listed in Table 3.1. Occupant heat gains and schedules were discussedearlier in this subsection.
One set of common wall, door, window and external shading constructions are used for the building.Wall orientations, wall areas, and window and door quantities for each space are summarized inTable 3.1.
One common roof construction is used for the building. Roof areas are shown in Table 3.1.
This wing of the school building uses slab on grade floor construction. The floor slab is constructedof 6-inch of heavy weight concrete with an overall U-value of 1.2 BTU/(hr-sqft-F). R-7 edgeinsulation is used for the slab. Slab floor areas and exposed perimeters are shown in Table 3.1. Notethat slab floors are not modeled for the corridor spaces since neither has an exposed slab perimeter.
Table 3.1 Summary of Space Characteristics
FloorArea(sqft)
People Wall, Window, DoorData
Roof Data SlabFloorArea(sqft)
SlabExposedPerimeter
(ft)
D101 - Typical Classroom 907.5 25 E: 275 sqft, 3 windows H: 907.5 sqft 907.5 27.5
D104 - Classroom 907.5 25 E: 275 sqft, 3 windows
S: 330 sqft, 0 windows
H: 907.5 sqft 907.5 60.5
D106 - Classroom 907.5 25 W: 275 sqft, 3 windows
S: 330 sqft, 0 windows
E: 110 sqft, 0 windows
H: 907.5 sqft 907.5 71.5
D107 - Classroom 907.5 25 W: 275 sqft, 3 windows H: 907.5 sqft 907.5 27.5
D108 - Music Room 1781.0 50 S: 242 sqft, 2 windows H: 1781.0 sqft 1781.0 24.2
D109 - Practice Room 65.0 1 W: 66 sqft, 0 windows
S: 99 sqft, 0 windows
H: 65.0 sqft 65.0 16.5
D110 - Storage Room 120.0 0 W: 121 sqft, 0 windows H: 120.0 sqft 120.0 12.1
D111 - Office 174.0 1 W: 132 sqft, 1 window H: 174.0 sqft 174.0 13.2
D113 - West Corridor 1054.0 0 None H: 1054.0 sqft 0.0 0.0
D114 - South Corridor 920.0 0 None H: 920.0 sqft 0.0 0.0
3.3.3 Gathering Air System Data
One air handling system will provide cooling and heating to the rooms in this wing of the schoolbuilding. Therefore, we will define one HAP air system to represent this equipment. Data for this airsystem is shown in Figure 3.18. Details:
Equipment Type. A VAV rooftop unit will be used.
Ventilation. Outdoor ventilation airflow will be calculated using the ASHRAE Standard 62.1-2007method. “Constant” control for ventilation will be used so the system uses the design flow of
System Design Example Problem Chapter 3
HAP Quick Reference Guide 3-5
outdoor air at all times. Ventilation dampers are closed during the unoccupied period and the damperleak rate is 5%.
Cooling Coil. The system provides a constant 55 F supply air temperature to zone terminals. TheDX cooling coil is permitted to operate in all months. The bypass factor for the cooling coil is 0.038which is representative of the type of equipment we expect to select.
Preheat Coil. The rooftop unit contains a preheat coil to maintain minimum supply ducttemperatures during the winter. The preheat coil is located downstream of the point where return airand outdoor ventilation air mix. The preheat setpoint is 52 F. The gas-fired heat exchanger in therooftop unit is used for this purpose. The coil is permitted to operate in all months.
Supply Fan. The supply fan in the rooftop unit will be forward curved with variable frequencydrive. The total static pressure for the system is estimated to be 3 in wg. The overall fan efficiencyis 48%. The coil configuration is draw-thru.
Return Air Plenum. The system uses a return air plenum. It is estimated that 70% of the roof load,20% of the wall load and 30% of the lighting load is removed by plenum air.
Zoning. A zone is a region of the building with one thermostatic control. One zone will be createdfor each classroom. The music room and its adjacent office, storage room and practice room will allbe part of a single zone. Each corridor will also be zone. Therefore, a total of 9 zones will becreated: one each for the six classrooms, one for the music room and two for the corridors.
Thermostats. Thermostat settings of 75 F occupied cooling, 80 F unoccupied cooling, 70 Foccupied heating and 65 F unoccupied heating will be used in all zones. The throttling range will be1.5 F. The schedule for fan and thermostat operation for the design day will designate 0700 through2100 as “occupied” hours. This covers both the 0700-1700 operating hours for the school and the1800-2100 period when custodial staff is present. All other hours will be “unoccupied”. This profileapplies for the school year which runs from August through June. During the shutdown month ofJuly all hours will be designated as “unoccupied”. Schedule data is shown in Figure 3.5.
Supply Terminals. All zones use parallel fan powered mixing box terminals with 0.5 in wg total fanstatic, 50% overall fan efficiency and a 95 F heating supply temperature. Minimum supply airflowfor the terminals is based on ASHRAE Standard 62.1-2007 requirements. We will specify minimumzone airflow as zero so the program will automatically use the Standard 62.1-2007 requirement to setthe minimum damper position. The heat source for the reheat coils is electric resistance.
Sizing Criteria. Required zone airflow rates will be based on the peak sensible load in each zone.Required space airflow rates will be based on peak space loads for the individual spaces. Safetyfactors will be specified as zero. A margin of safety will be applied later during equipment selection.

Chapter 3 System Design Example Problem
3-6 HAP Quick Reference Guide
3.4 ENTERING DATA
After weather, space and HVAC system data has been gathered, it is entered into HAP. This is the thirdstep in the design process. The procedure for entering data into HAP is presented below in a tutorialformat.
1. Create a New Project
(Optional) If you only wish to view this example rather than entering all the data yourself, youcan use archive data for the example problem which is provided on the HAP CD. To use thisarchive file:
Run HAP. Use the New option on the Project Menu to create a new untitled project. Thenchoose the Retrieve option on the Project Menu. In the Retrieve window choose the archivefile containing the HAP example problem and click the Open button. On the next windowclick the Retrieve button. Finally after data has been retrieved use the Save option on theProject Menu to save the project. Use the project name “Example Problem”.
Skip to step 3 below.
=OR=
If you will be entering example problem data yourself, choose New on the Project menu. Thiscreates a new project. A project is the container which holds your data. The new project youcreate will contain data for the example problem.
Then choose Save on the Project menu. Because you are saving the project for the first time, youwill be asked to specify a name for the project. Use “Example Problem” as the project name.From here on, save the project periodically.
2. Enter Weather Data
Click the “Weather” item in the tree view in the main program window. A “Weather Properties”item appears in the list view.
Double click on the “Weather Properties” item in the list view. The Weather input window willappear.
From the drop-down lists on the Weather window, choose data for United States / Illinois /Chicago IAP. Also select design cooling months of May through November, and specifydaylight savings time from April 7 through October 26. Design parameter input data for theexample problem is shown in Figure 3.2.
When finished entering this data, press the OK button on the Weather input window to save thedata and return to the main program window.
3. Enter Space Data
Entering space data is the most labor-intensive phase of data entry. By using the program’s“duplicate” feature input effort can be minimized. First enter data for the “D101- TypicalClassroom” space:
Click the “Space” item in the tree view in the main program window. Space information willappear in the list view.
Double-click on the “<new default space>” item in the list view. The Space input window willappear.
Enter data on the General tab of the space input window using data shown in Figure 3.8.
Switch to the Internals tab on the space input window and enter the data shown in Figure 3.8. Asyou enter internal load data it will be necessary to create a lighting schedule and an occupant
System Design Example Problem Chapter 3
HAP Quick Reference Guide 3-7
schedule. This can be done “on-the-fly” without leaving the space input window. Simply choosethe “<create new schedule>” item in the schedule drop-down list. This will launch the scheduleinput window. Enter data for the appropriate schedule shown in Figure 3.5. If you are new tothe Schedule window, make frequent use of the help features on this window to learn about themany ways in which schedule data can be entered. When finished, press the OK button to savethe schedule and return to the space window. When you do this, the schedule you created will beassigned to the space automatically. For example, if you chose “<create a new schedule>” fromthe drop down list for overhead lighting schedule, the schedule you create will be assigned tooverhead lighting automatically.
Switch to the Walls, Windows, Doors tab on the space input window and enter the data shown inFigure 3.8. As you enter this data it will be necessary to create wall, window, door and externalshade constructions. For example, while the desired exposure line in the table is highlighted, youcan create the wall construction for that exposure by choosing the “<create a new wall>” item inthe wall drop-down list. Similar procedures are used for creating window, door and externalshade constructions. Wall, window and shade construction data is shown in Figures 3.3, 3.4, 3.6and 3.7 respectively.
Switch to the Roofs, Skylights tab on the space input window and enter the data shown in Figure3.8. As you enter this data it will be necessary to create a roof construction. With the desiredexposure row in the table highlighted, you can create a roof construction for that exposure bychoosing the “<create a new roof>” item in the roof drop-down list. Roof construction data isshown in Figure 3.6.
Switch to the Floors tab on the space input window and enter the data shown in Figure 3.8.
At this point, press the OK button to save data for space D101 and return to the main programwindow.
D102 and D103 are identical to D101, so the next space we enter will be “D104 - Classroom”. The“duplicate” feature can be used to minimize input effort:
Right-click the “D101 - Typical Classroom” space item in the list view portion of the mainprogram window. On the pop-up menu that appears, select the “duplicate” option. A duplicateof “D101 - Typical Classroom” will be created, the space input window will be launched anddata for the new space will be displayed. Because this new space is a copy of D101, we will onlyneed to modify items which differ from D101.
On the General tab of the space input window change the space name to “D104 - Classroom” andspecify its floor area as shown in Figure 3.9.
Switch to each of the other tabs on the space input window in succession and enter the datashown in Figure 3.9. Note that many of the default values for this space will not need to bechanged since much of the space data is common among spaces. By making duplicates ofsuccessive spaces, the number of items which need to be modified will be minimized.
When finished modifying data for space D104, press the OK button to save data for space D104and return to the main program window.
Enter data for the remaining spaces using a procedure similar to that used for D104: Use the“duplicate” feature to create successive copies of spaces and modify the data for each new space youcreate in this manner. As you enter data for the remaining spaces, use a strategy of entering similarspaces consecutively. The recommended order for the remaining spaces in this example is D106,D107, D108, D109, D110, D111, D113 and D114. Input data for the remaining spaces is shown inFigures 3.10 through 3.17.
Chapter 3 System Design Example Problem
3-8 HAP Quick Reference Guide
4. Enter Air System Data
Click on the “System” item in the tree view in the main program window. System informationwill appear in the list view.
Double-click on the “<new default system>” item in the list view. The System input windowwill appear.
Enter data for the “VAV Rooftop” air system shown in Figure 3.18. If you are new to the airsystem window, make frequent use of the help button or the on-line help features (F1 key) tolearn about operation of this window.
As you enter data you will need to create a fan/thermostat schedule for the air system. This isdone in a manner similar to creating schedules “on-the-fly” for spaces. In the Thermostats dataview on the Zone Components tab, choose the “<create a new schedule>” item in the scheduledrop-down list. This will launch the Schedule input window. Use this window to enter thefan/thermostat schedule data shown in Figure 3.5. Be sure to specify the schedule type as“fan/thermostat” instead of “fractional”. When finished, press the OK button to save theschedule and return to the air system window. The schedule will be assigned to the air systemautomatically.
When finished entering air system data, press the OK button on the System window to save yourdata and return to the main program window.
At this point all input data has been entered and we’re ready to design the system. Procedures forgenerating system design reports will be discussed in Section 3.5.
3.5 GENERATING SYSTEM DESIGN REPORTS
The fourth step in the design process is to use the data entered in step 3 to perform system designcalculations and generate system design reports. The procedure for doing this is as follows:
Click the Systems item in the tree view portion of the main program window. Systems informationwill appear in the list view.
Right click the “VAV Rooftop" item in the list view. On the menu which appears, select the“Print/View Design Results” item. The System Design Reports window will appear.
On the System Design Reports window, select the “System Sizing Summary”, “Zone SizingSummary” and “System Load Summary” report options. Then press the Preview button.
When you press the Preview button, the program will determine whether system design data existsfor the air system. Since design data has not yet been calculated, the program will run designcalculations automatically. A status monitor will appear to help you track the progress of thecalculation. Once the calculation is finished, the reports you requested will appear in the HAPReport Viewer.
The Report Viewer can be used to browse and print the reports. Use the scroll bar to browse thereport pages. The System Sizing Summary, Zone Sizing Summary and System Load Summaryreports are shown in Figures 3.19 through 3.21. Information in these reports can be used to size thevarious components of the HVAC system as explained in section 3.6.
3.6 SELECTING EQUIPMENT
The final step in the design process is to use system design reports to select HVAC equipment. At thebeginning of this example, nine equipment sizing objectives were listed. Data provided on the SystemSizing Summary report (see Figure 3.19) and the Zone Sizing Summary report (see Figure 3.20) can beused to meet all nine of these objectives. The Air System Design Load Summary (see Figure 3.21)provides supplemental information about component loads. The table below lists the nine sizingobjectives and the report and table which contains data needed to meet each objective.
System Design Example Problem Chapter 3
HAP Quick Reference Guide 3-9
The System Sizing Summary report contains data used to select the rooftop unit. The Central CoolingCoil Sizing Data table lists the peak coil capacities, coil entering and leaving conditions and a number ofuseful check figures. The Preheat Coil Sizing Data table lists the peak load for this coil as well asentering and leaving conditions. The Supply Fan Sizing Data table provides the required airflow ratesand motor data for the supply fan. The Outdoor Ventilation Air Data section lists the total outdoor airrequirement for the system. Together this data can be used in the applied rooftop unit selection softwareoffered by Carrier and other manufacturers to select a rooftop unit which meets the sizing requirements.
The Zone Sizing Summary report contains data used to select terminal equipment. The Zone Sizing Datatable lists the required airflow rate for each zone terminal. It also lists the minimum airflow rate whichcan be used to set minimum damper positions for the mixing boxes. The Zone Terminal Sizing Datatable lists the required sizes for the parallel mixing box fans, the reheat coils and the zone heating unitcoils. The Space Loads and Airflows table lists the required airflows for each space served by thesystem. Because 8 of the 9 zones contain a single space, space and zone airflows for these zones willmatch. For the Music Room zone which contains four spaces, the airflow rates can be used to sizeductwork and supply diffusers for the four rooms in this zone. Together this data can be used in airterminal selection software offered by Carrier and other manufacturers to select terminal componentswhich meet the sizing requirements. This data can also be used in duct design calculations to sizeductwork for the system.
Table 3.2. Location of System Sizing Data on Design Reports
Objective: Table
Report: Air System Sizing Summary
1. Rooftop Cooling Capacities Central Cooling Coil Sizing Data
2. Rooftop Supply Fan Airflow Supply Fan Sizing Data
3. Rooftop Preheat Coil Capacity Preheat Coil Sizing Data
4. Rooftop Outdoor Airflow Rate Outdoor Ventilation Air Data
Report: Zone Sizing Summary
5. Supply Terminal Airflow Rate Zone Terminal Sizing Data(see “Design Air Flow”)
6. Supply Terminal Minimum Airflow Rates Zone Terminal Sizing Data(see “Minimum Air Flow”)
7. Supply Airflow Rates for Mixing Box Fans Zone Terminal Sizing Data(see “Mixing Box Fan Airflow”)
8. Terminal Reheat Coil Capacities Zone Terminal Sizing Data(see “Reheat Coil Load”)
9. Space Airflow Rates Space Loads and Airflows (see “Air Flow”)
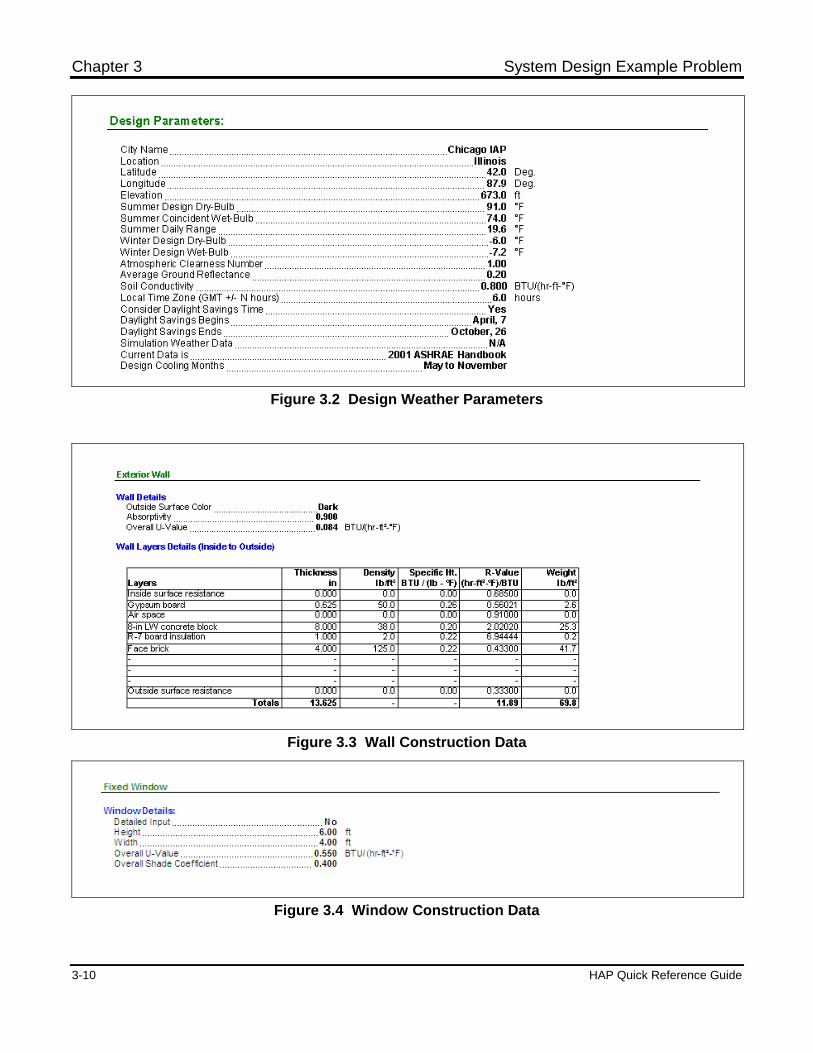
Chapter 3 System Design Example Problem
3-10 HAP Quick Reference Guide
Figure 3.2 Design Weather Parameters
Figure 3.3 Wall Construction Data
Figure 3.4 Window Construction Data
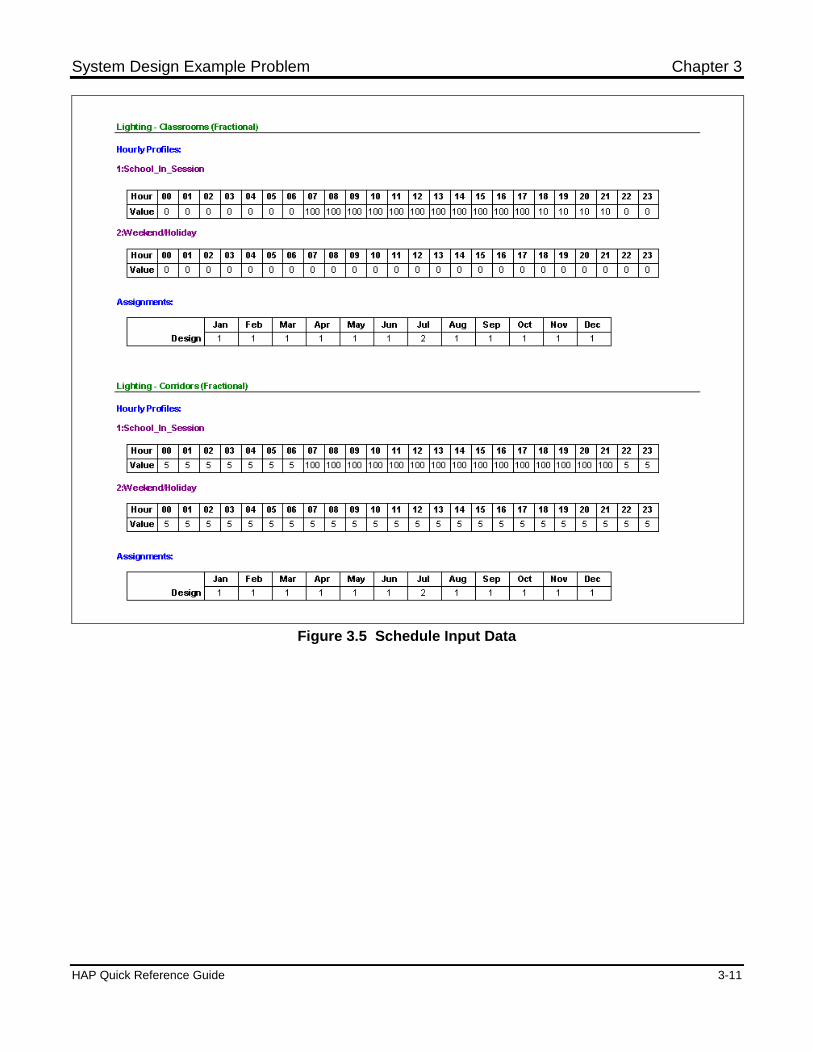
System Design Example Problem Chapter 3
HAP Quick Reference Guide 3-11
Figure 3.5 Schedule Input Data
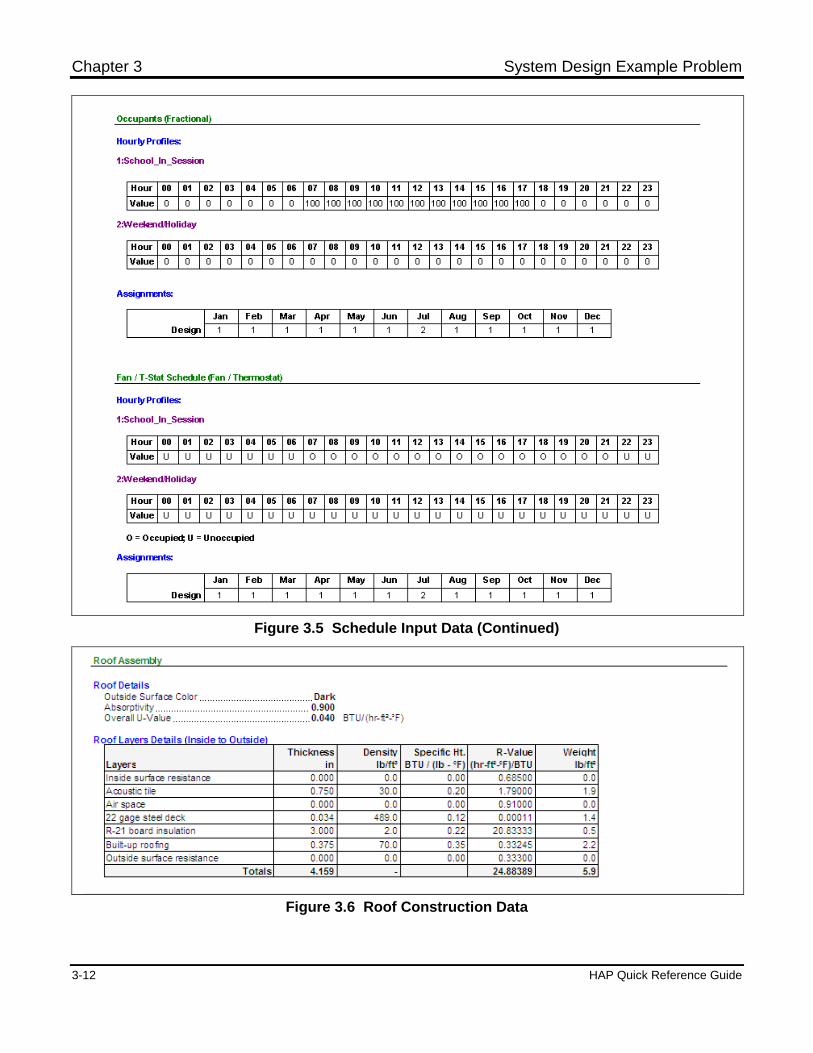
Chapter 3 System Design Example Problem
3-12 HAP Quick Reference Guide
Figure 3.5 Schedule Input Data (Continued)
Figure 3.6 Roof Construction Data
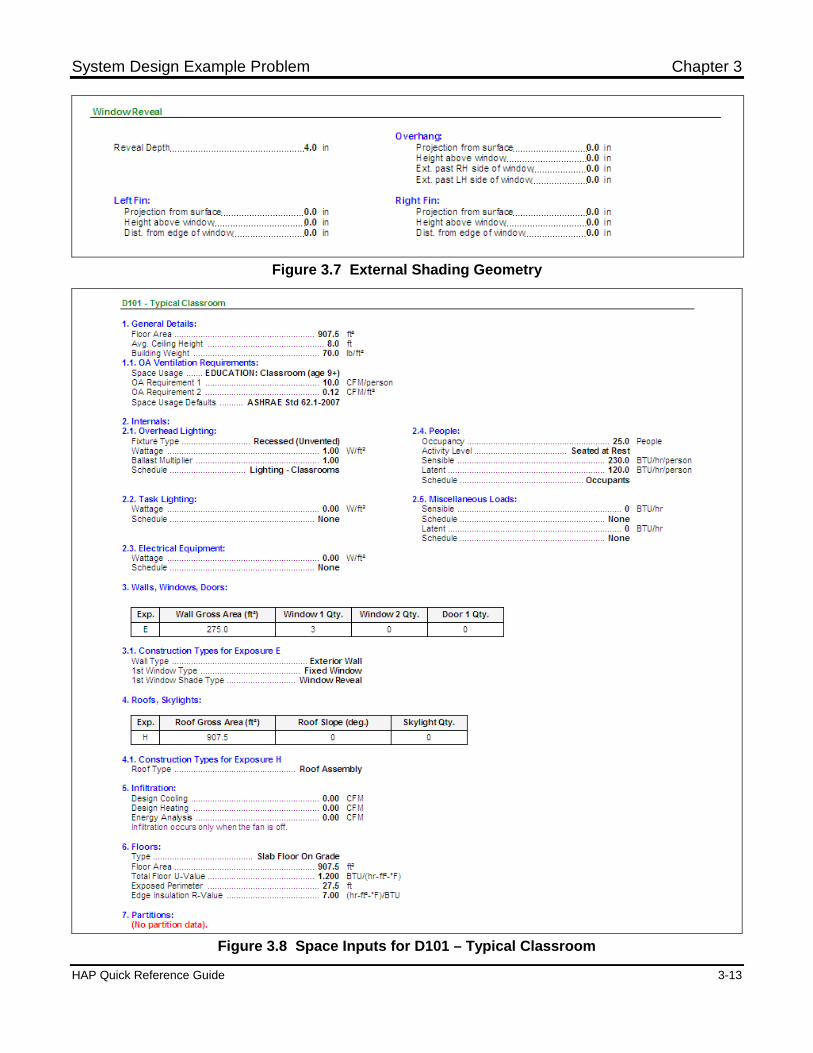
System Design Example Problem Chapter 3
HAP Quick Reference Guide 3-13
Figure 3.7 External Shading Geometry
Figure 3.8 Space Inputs for D101 – Typical Classroom
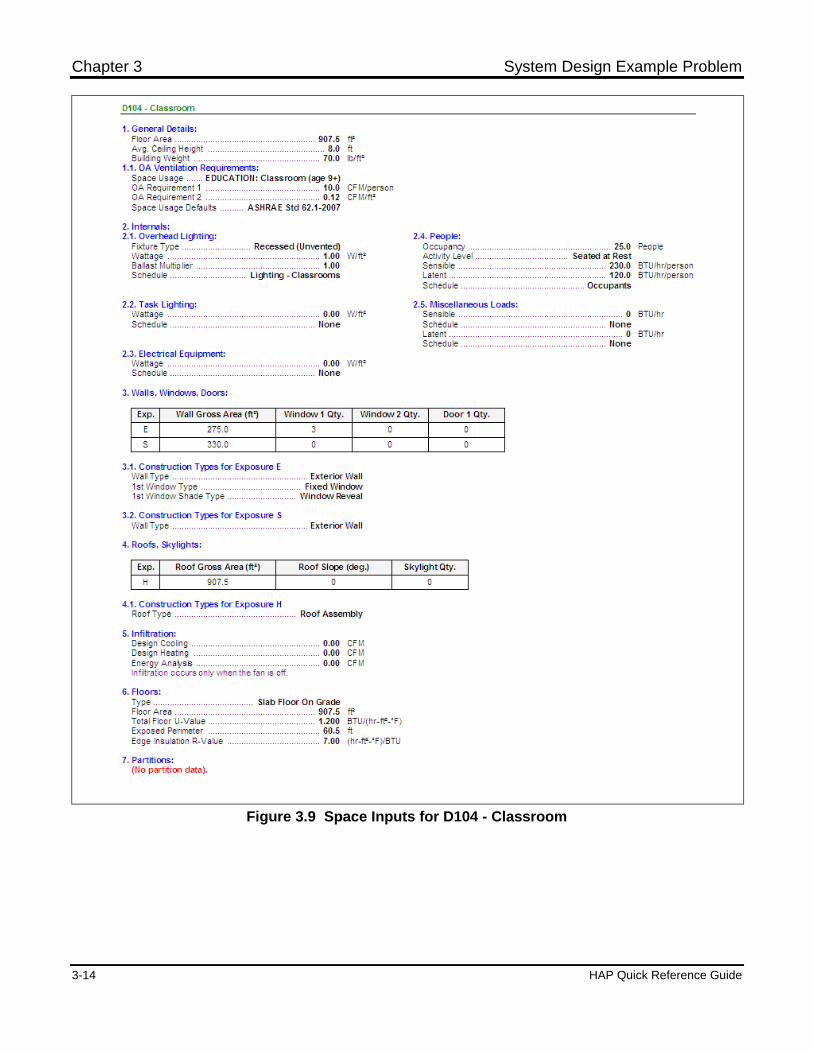
Chapter 3 System Design Example Problem
3-14 HAP Quick Reference Guide
Figure 3.9 Space Inputs for D104 - Classroom
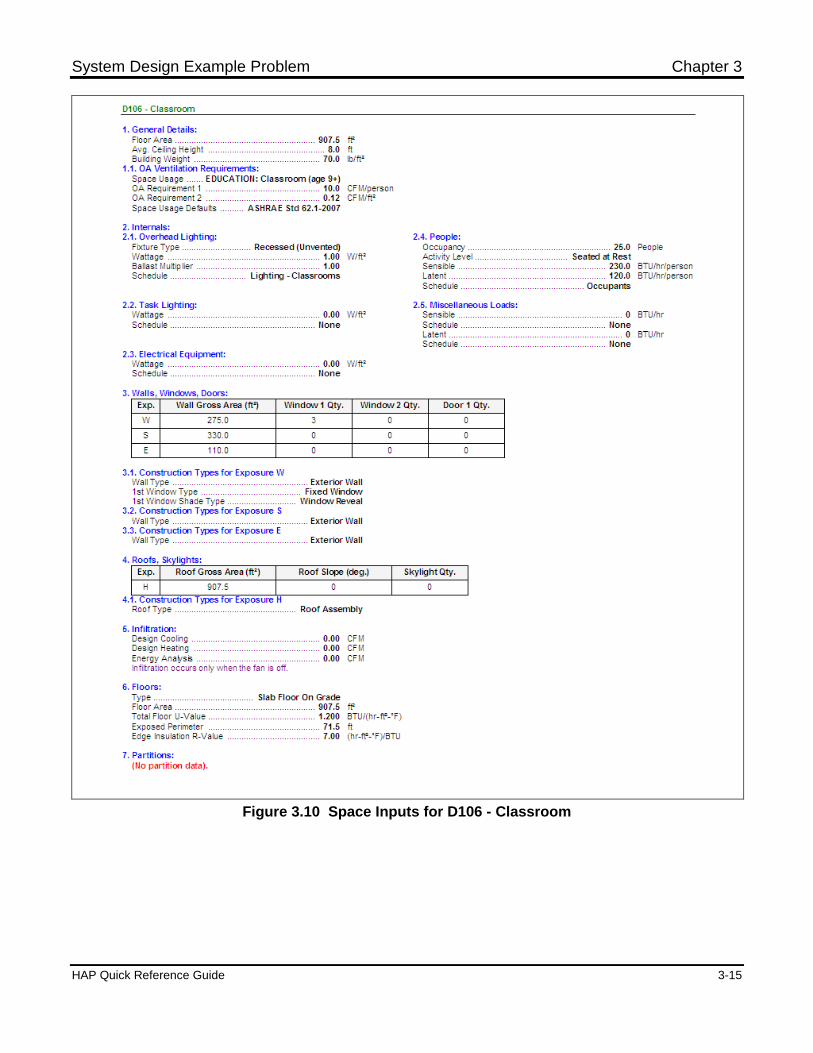
System Design Example Problem Chapter 3
HAP Quick Reference Guide 3-15
Figure 3.10 Space Inputs for D106 - Classroom
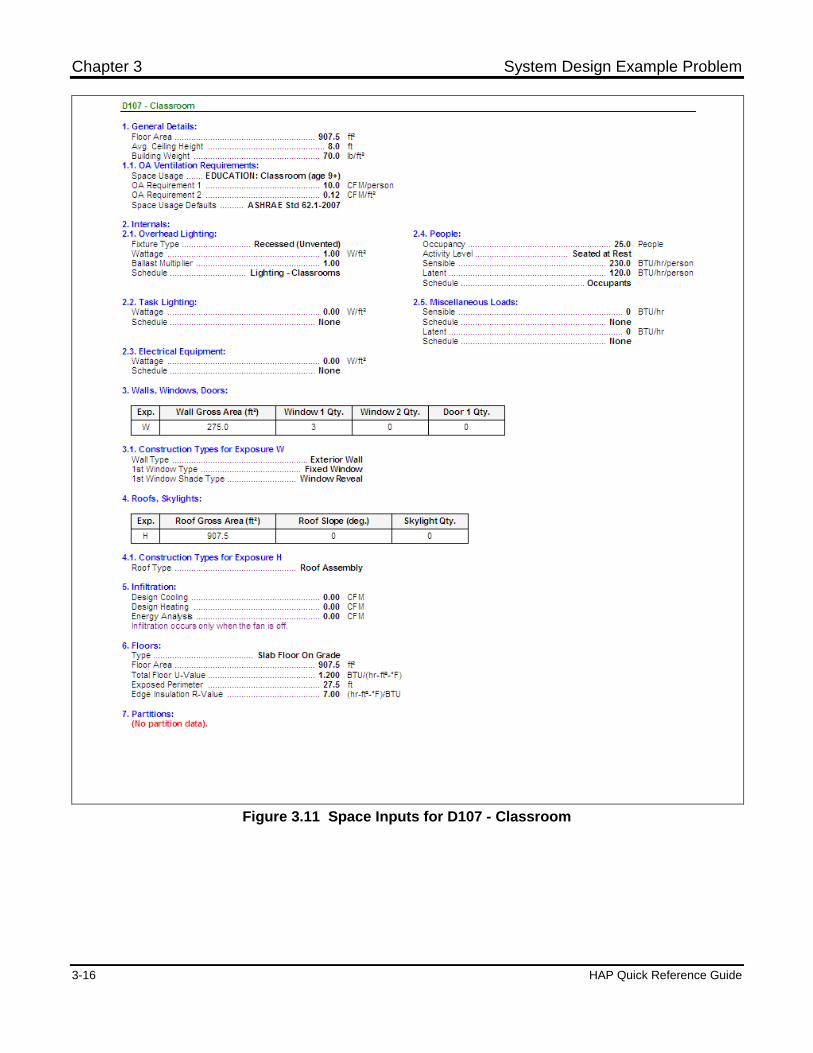
Chapter 3 System Design Example Problem
3-16 HAP Quick Reference Guide
Figure 3.11 Space Inputs for D107 - Classroom
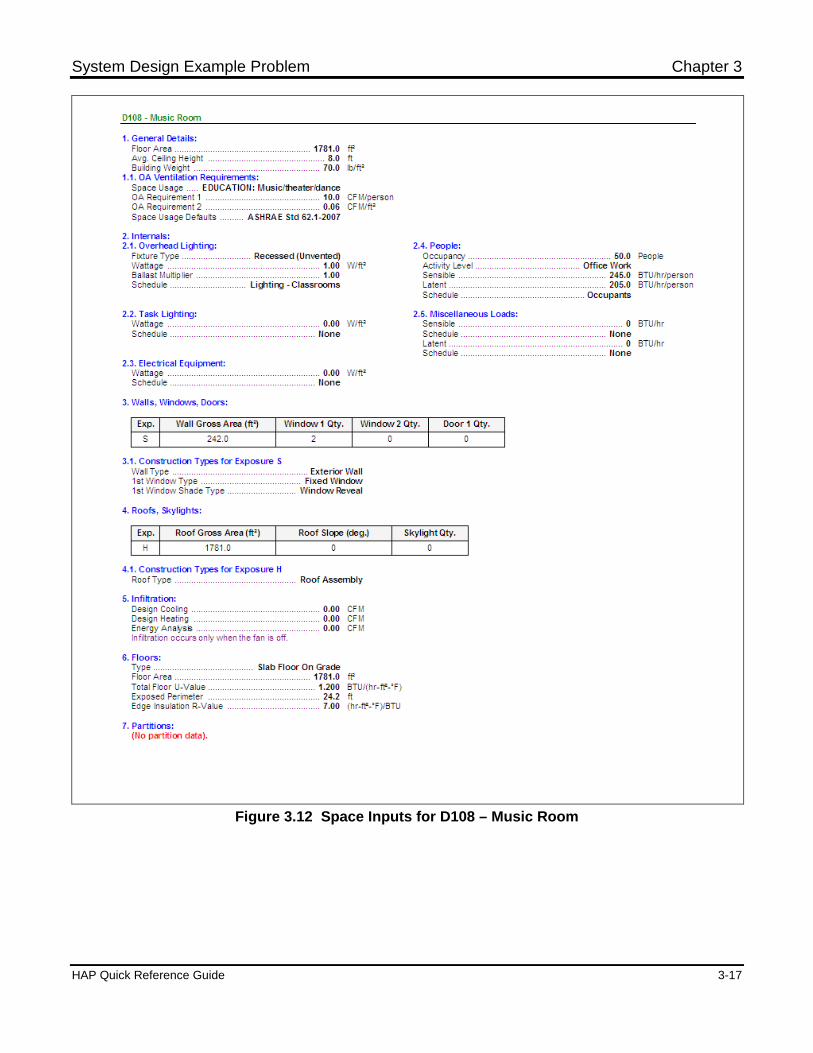
System Design Example Problem Chapter 3
HAP Quick Reference Guide 3-17
Figure 3.12 Space Inputs for D108 – Music Room
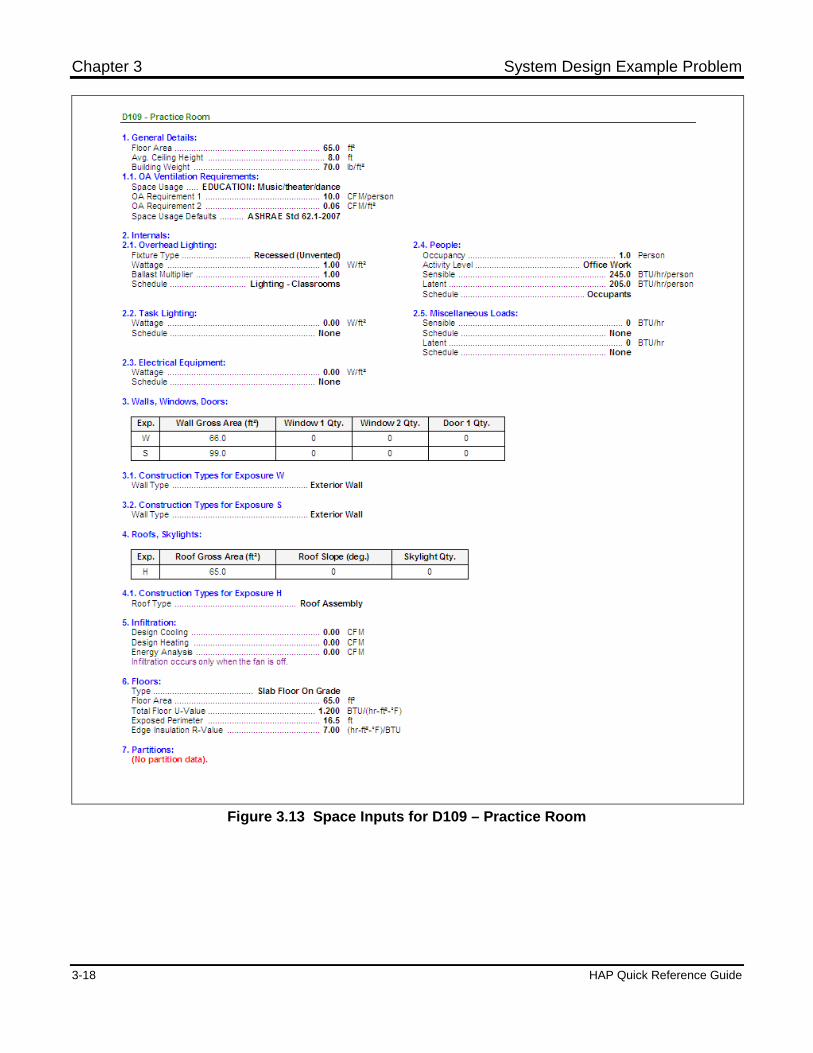
Chapter 3 System Design Example Problem
3-18 HAP Quick Reference Guide
Figure 3.13 Space Inputs for D109 – Practice Room
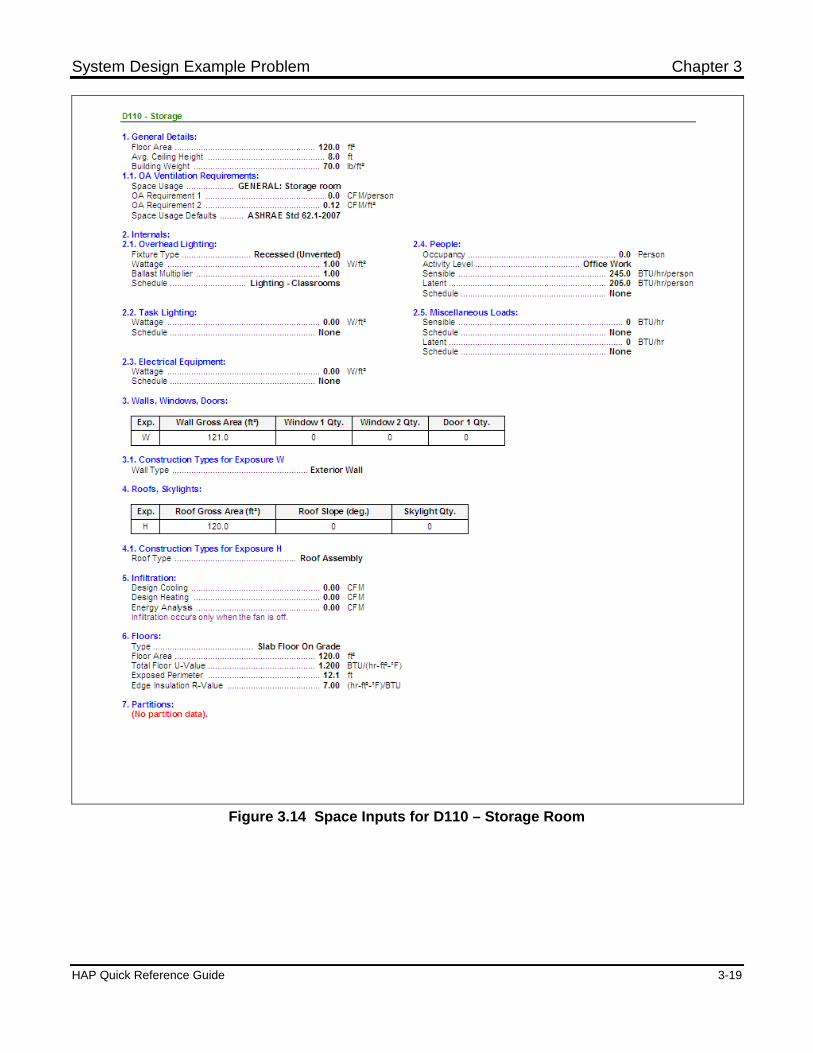
System Design Example Problem Chapter 3
HAP Quick Reference Guide 3-19
Figure 3.14 Space Inputs for D110 – Storage Room
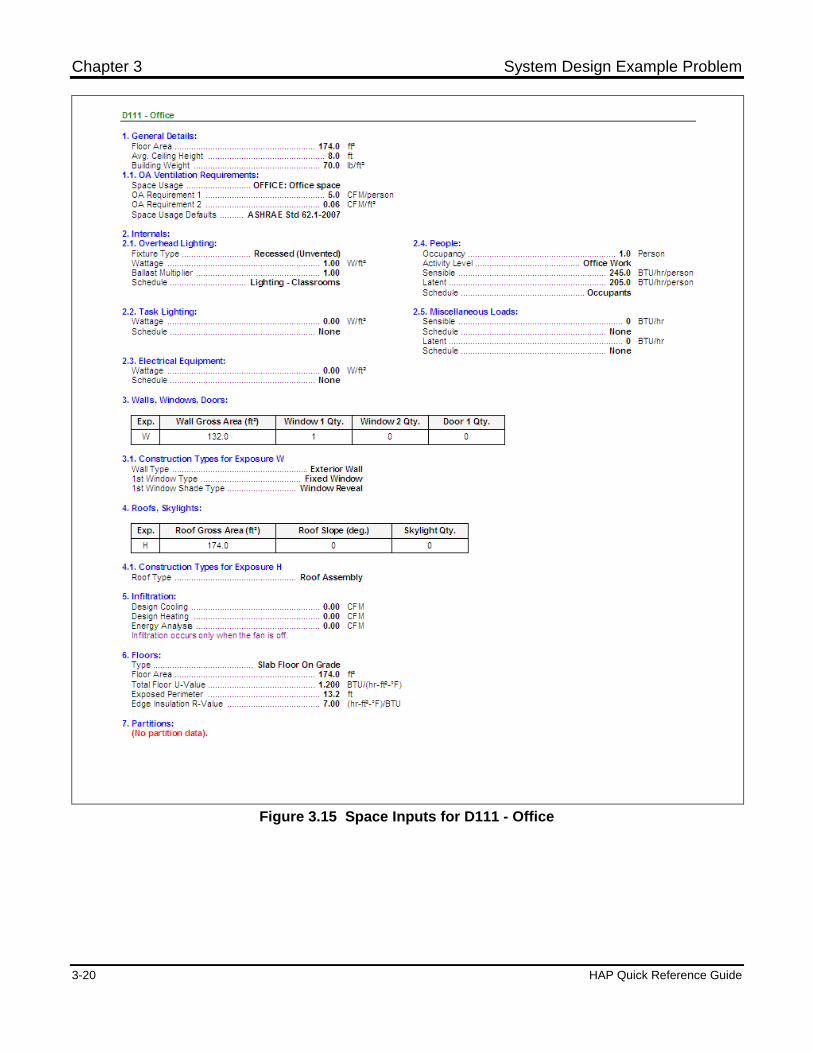
Chapter 3 System Design Example Problem
3-20 HAP Quick Reference Guide
Figure 3.15 Space Inputs for D111 - Office
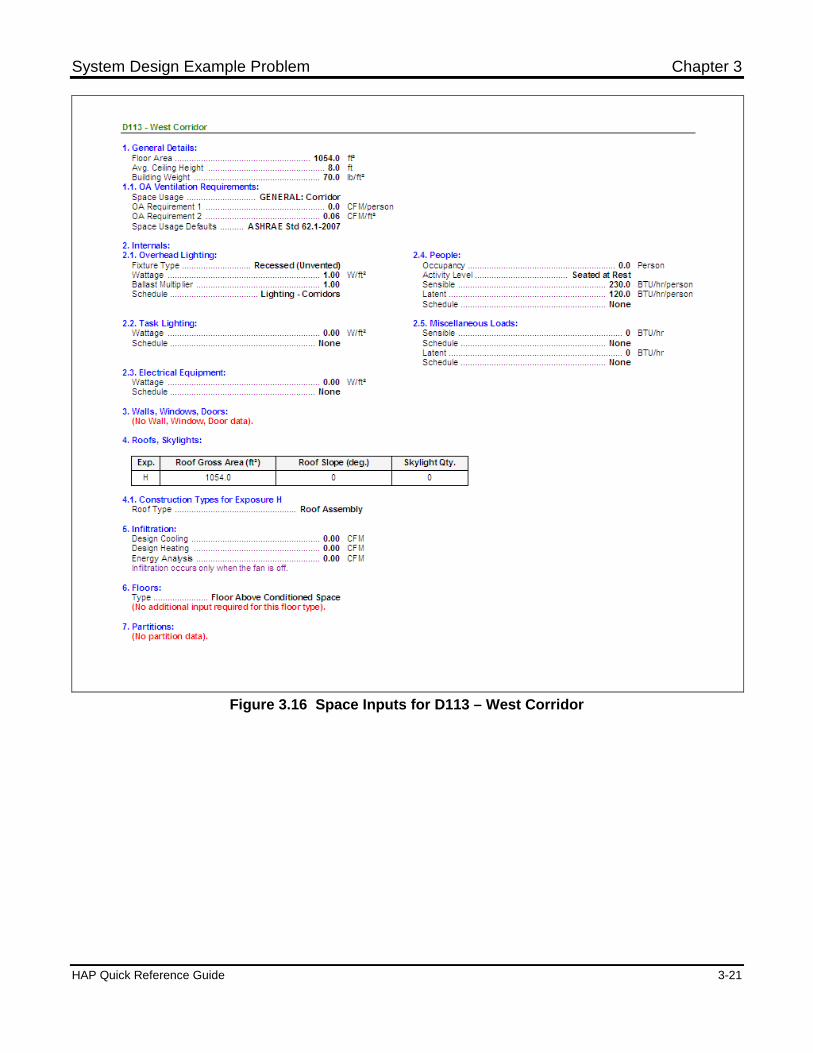
System Design Example Problem Chapter 3
HAP Quick Reference Guide 3-21
Figure 3.16 Space Inputs for D113 – West Corridor
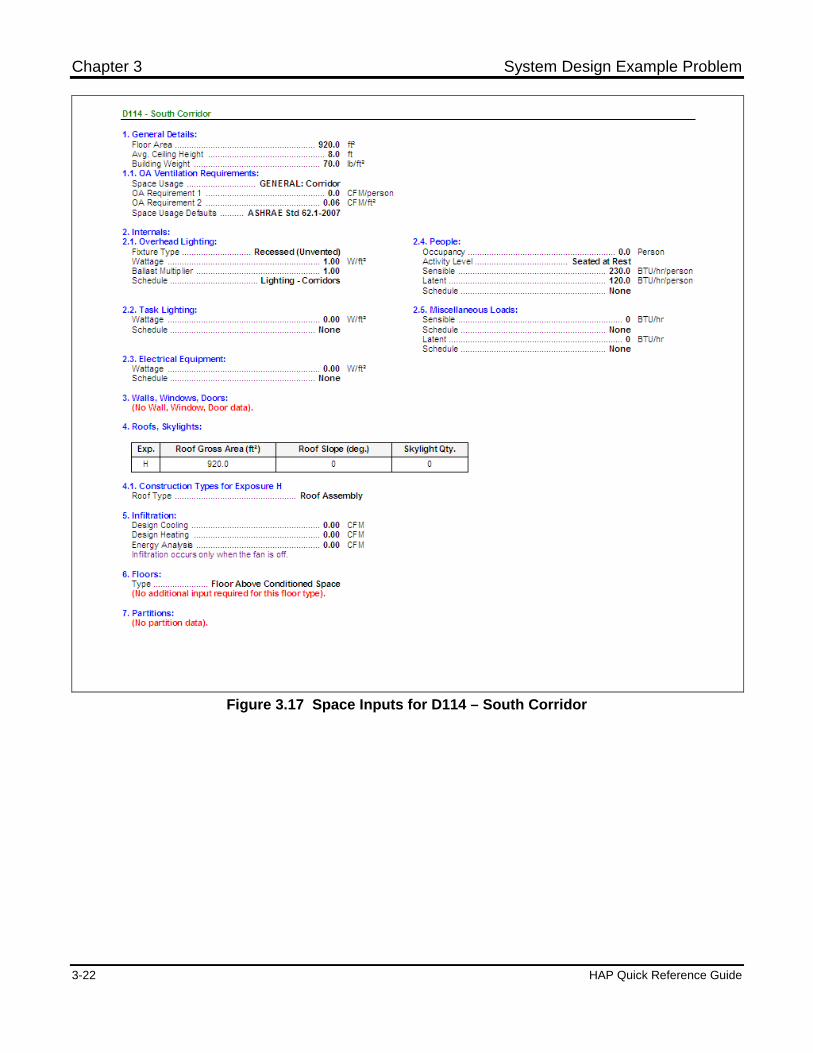
Chapter 3 System Design Example Problem
3-22 HAP Quick Reference Guide
Figure 3.17 Space Inputs for D114 – South Corridor
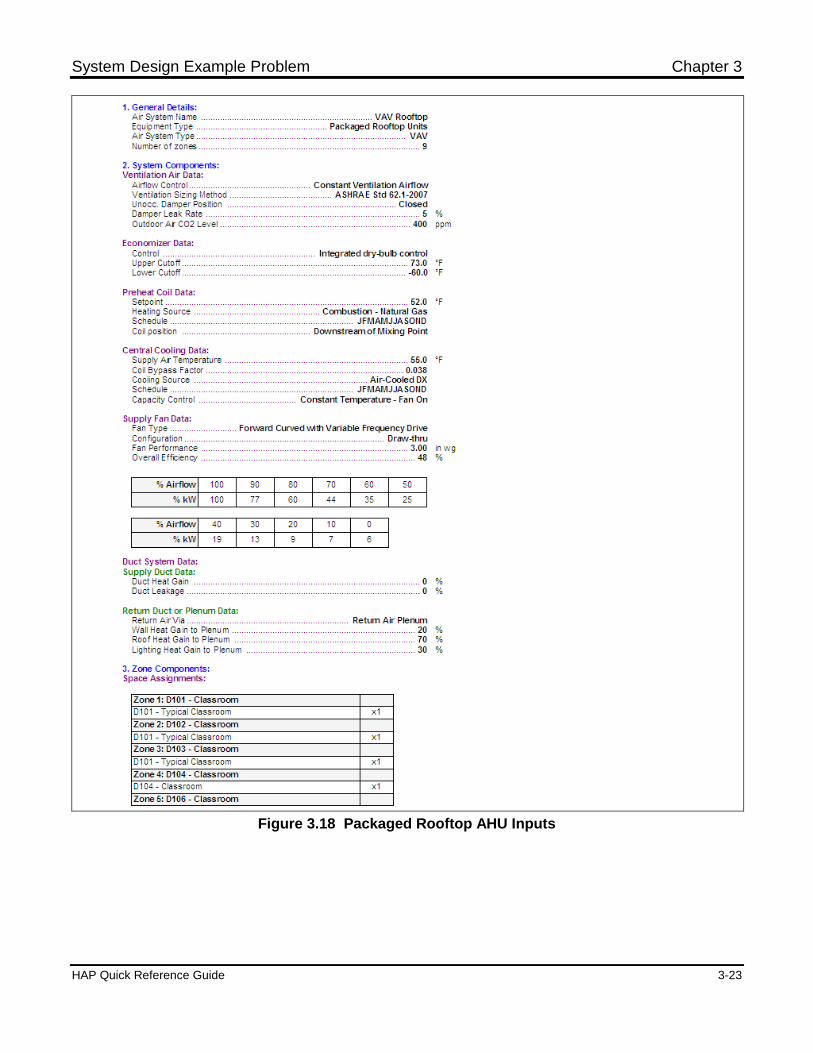
System Design Example Problem Chapter 3
HAP Quick Reference Guide 3-23
Figure 3.18 Packaged Rooftop AHU Inputs
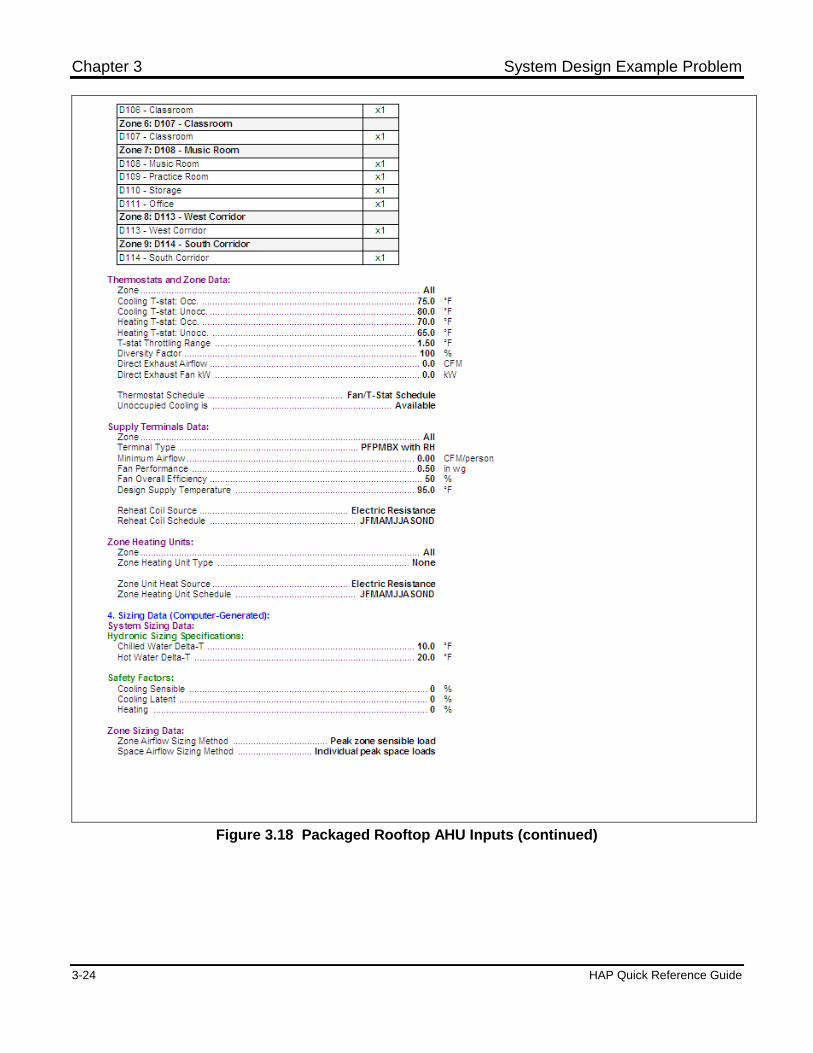
Chapter 3 System Design Example Problem
3-24 HAP Quick Reference Guide
Figure 3.18 Packaged Rooftop AHU Inputs (continued)
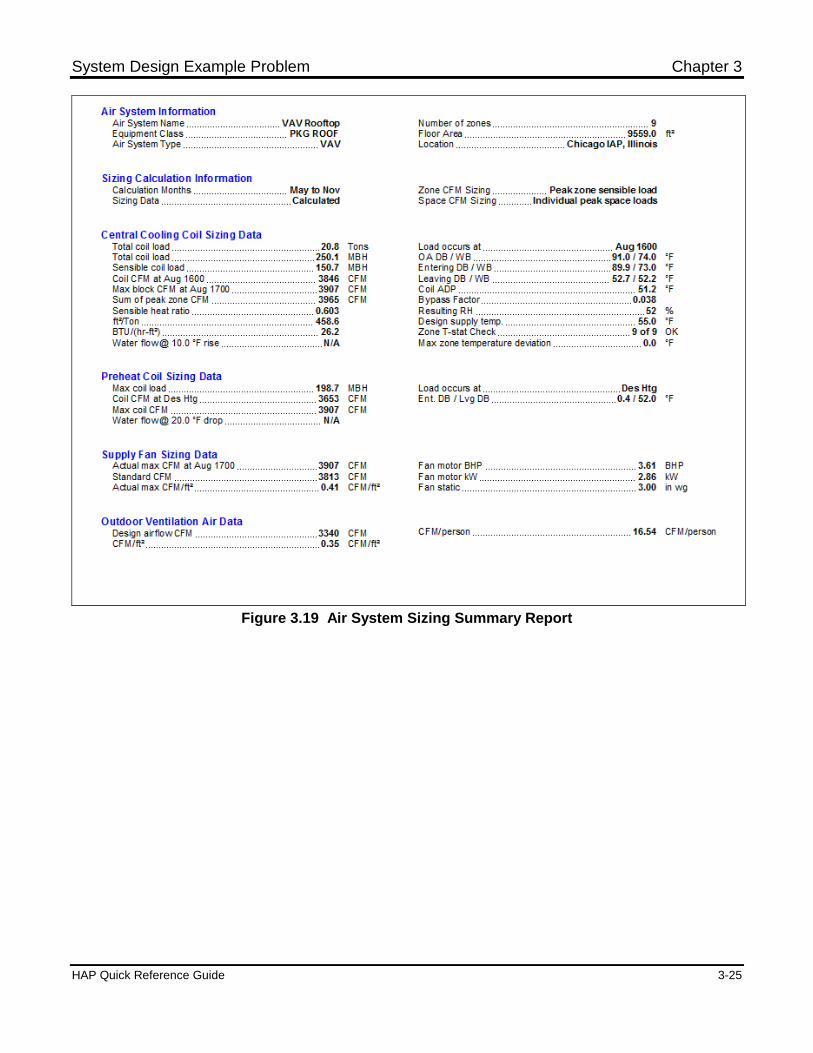
System Design Example Problem Chapter 3
HAP Quick Reference Guide 3-25
Figure 3.19 Air System Sizing Summary Report
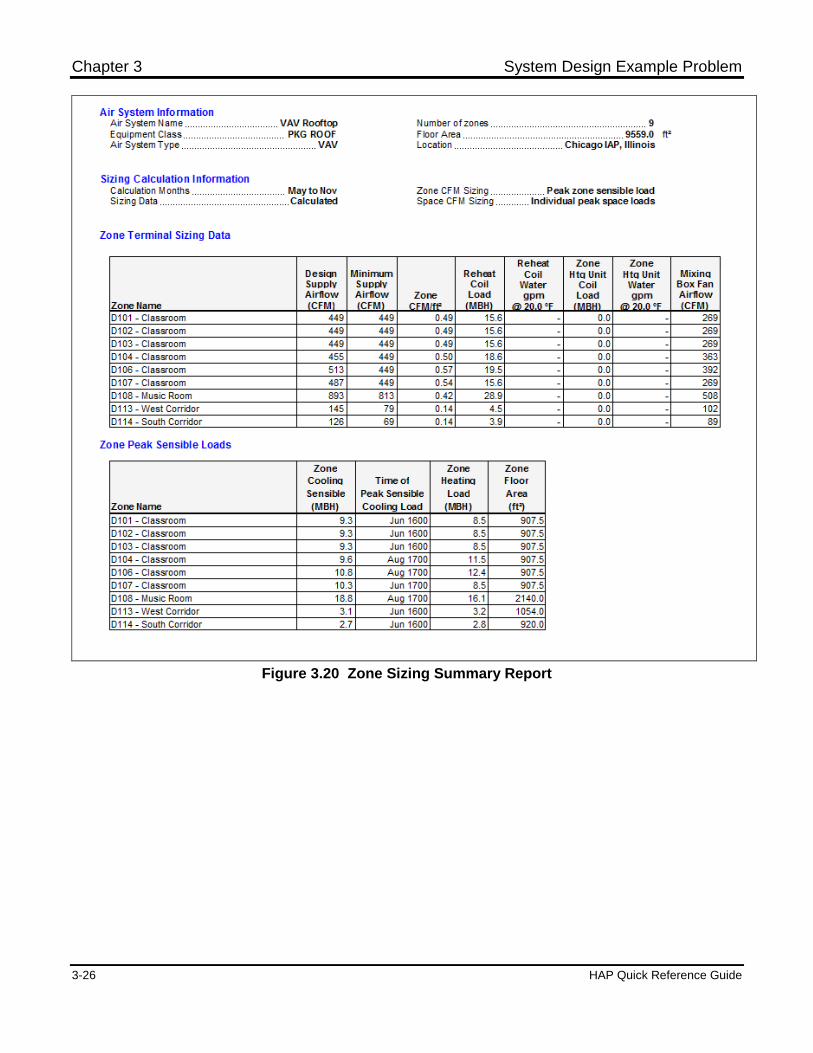
Chapter 3 System Design Example Problem
3-26 HAP Quick Reference Guide
Figure 3.20 Zone Sizing Summary Report
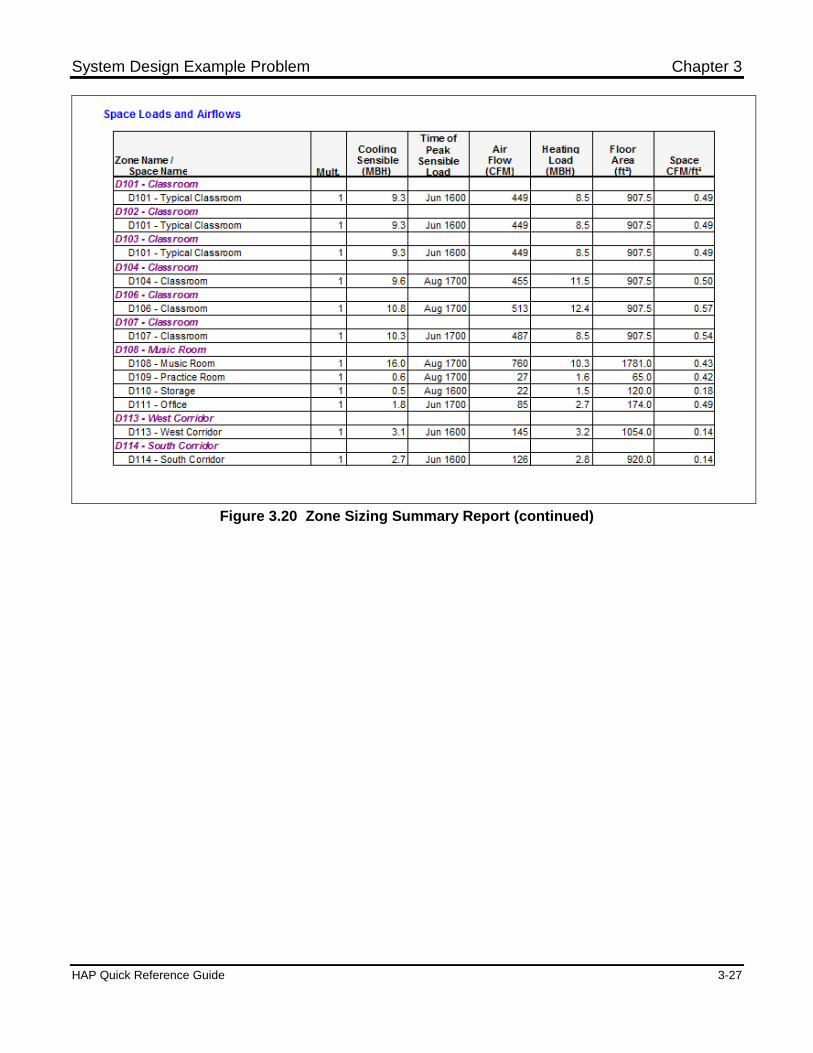
System Design Example Problem Chapter 3
HAP Quick Reference Guide 3-27
Figure 3.20 Zone Sizing Summary Report (continued)
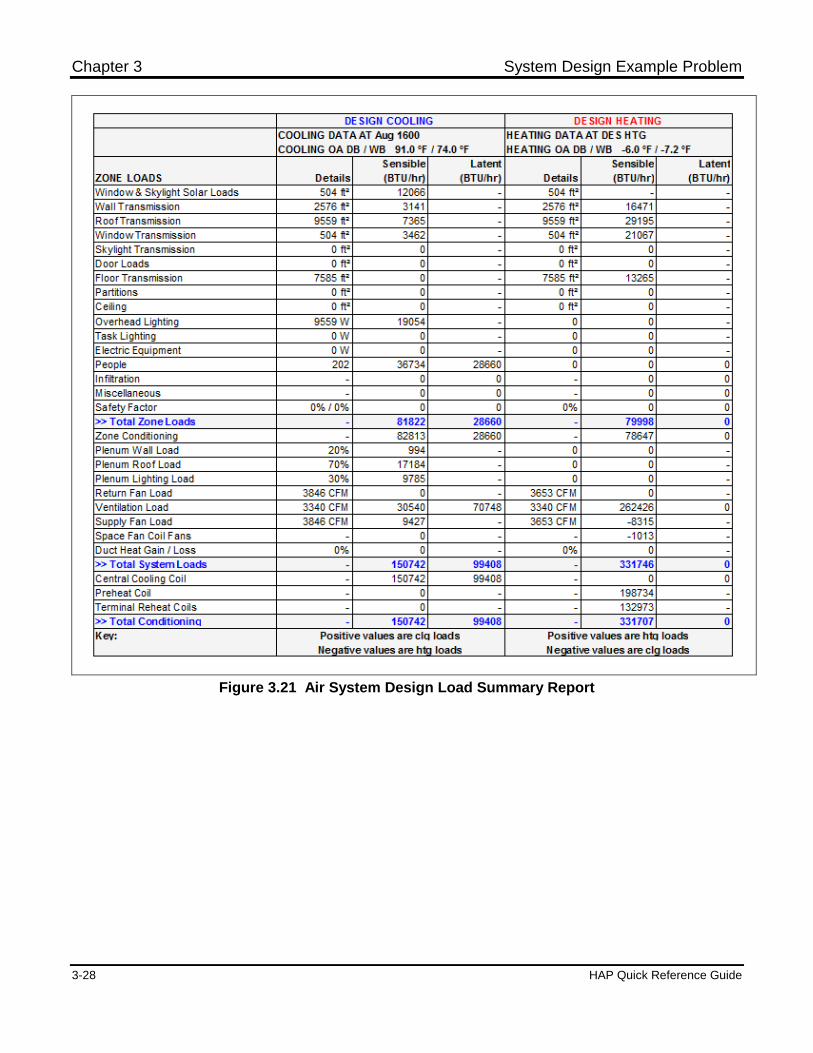
Chapter 3 System Design Example Problem
3-28 HAP Quick Reference Guide
Figure 3.21 Air System Design Load Summary Report
HAP Quick Reference Guide 4-1
Chapter 4 Energy Analysis Example Problem
This chapter contains a simple example problem which demonstrates how to use HAP to estimate annualenergy use and cost for a building. The example is suitable for the detailed design phase of a project.The example builds on concepts and procedures discussed in Chapters 1 and 2.
4.1 OVERVIEW FOR THE EXAMPLE PROBLEM
The procedure for conducting an energy analysis with HAP involves five steps previously discussed inChapter 1:
1. Define the Problem.2. Gather Data.3. Enter Data Into HAP.4. Use HAP to Generate Simulation Reports.5. Evaluate the Results.
The example problem presented in this chapter will demonstrate the first four steps in this process. In theremainder of this chapter a separate section will deal with each step.
4.2 DEFINING THE PROBLEM
The objective of this example problem is to estimate annual energy use and energy cost for a building.Normally an energy analysis compares energy use and cost for two or more design scenarios. To makethis example practical and efficient, the scope of the example will be limited to estimating energy use andcost for a single design scenario. This will demonstrate the key steps in the energy analysis process. In areal energy study, certain of the steps would be repeated to generate the additional design scenarios sothe costs of multiple scenarios could be compared.
The example will analyze the classroom wing of the high school building used in the system designexample problem discussed in Chapter 3. The floor plan for this wing of the school building is shown inFigure 4.1. It is comprised of six classrooms, a music room and its associated office, storage and practicerooms, plus two corridors for a total of 12 rooms.
The rooms in this portion of the school building will be air conditioned by one rooftop unit servingparallel fan powered mixing box (PFPMBX) terminals. A gas-fired preheat coil in the rooftop unit andelectric resistance heating coils in the mixing box terminals provide heating. HAP will be used tosimulate building loads and equipment operation hour-by-hour for one year in order to determine energyuse and energy cost.
Note: The VAV air system serves all of the spaces shown in Figure 4.1 except for D105 South Vestibuleand D112 West Vestibule. The two vestibules contain fan coil heaters and would be modeled using aseparate heating-only fan coil air system. For purposes of this example we will focus on the VAV airsystem and omit consideration of the vestibule fan coil units.
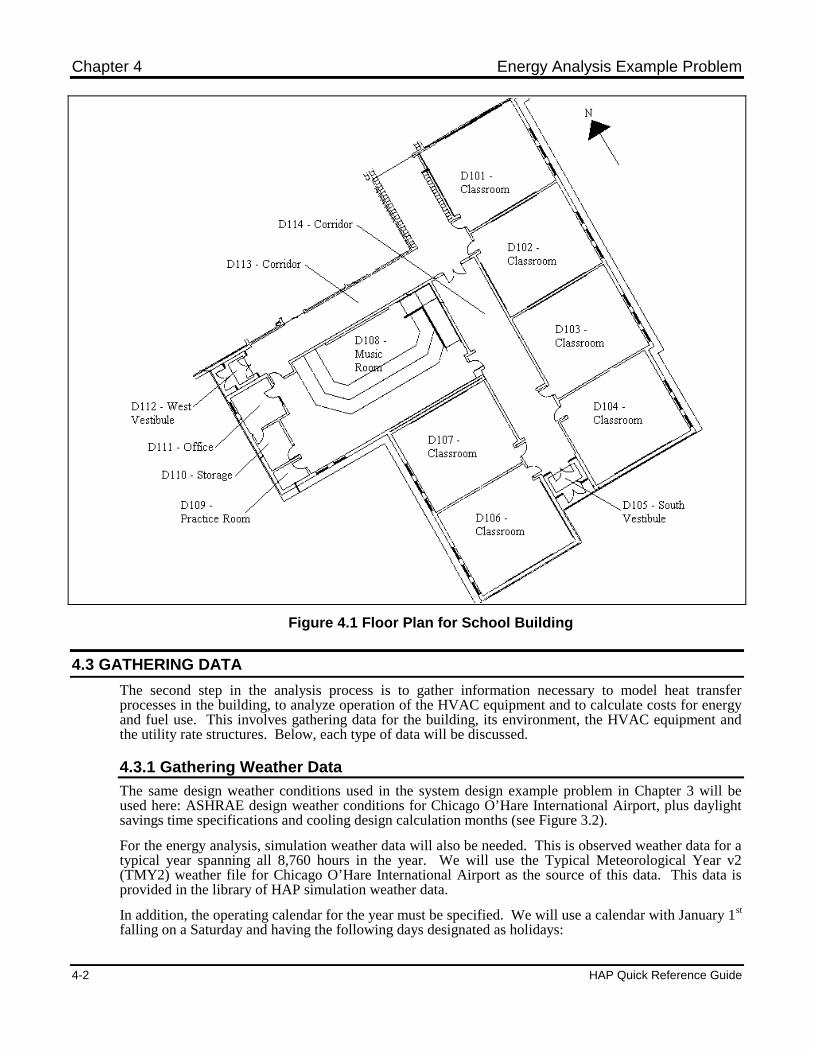
Chapter 4 Energy Analysis Example Problem
4-2 HAP Quick Reference Guide
Figure 4.1 Floor Plan for School Building
4.3 GATHERING DATA
The second step in the analysis process is to gather information necessary to model heat transferprocesses in the building, to analyze operation of the HVAC equipment and to calculate costs for energyand fuel use. This involves gathering data for the building, its environment, the HVAC equipment andthe utility rate structures. Below, each type of data will be discussed.
4.3.1 Gathering Weather Data
The same design weather conditions used in the system design example problem in Chapter 3 will beused here: ASHRAE design weather conditions for Chicago O’Hare International Airport, plus daylightsavings time specifications and cooling design calculation months (see Figure 3.2).
For the energy analysis, simulation weather data will also be needed. This is observed weather data for atypical year spanning all 8,760 hours in the year. We will use the Typical Meteorological Year v2(TMY2) weather file for Chicago O’Hare International Airport as the source of this data. This data isprovided in the library of HAP simulation weather data.
In addition, the operating calendar for the year must be specified. We will use a calendar with January 1st
falling on a Saturday and having the following days designated as holidays:
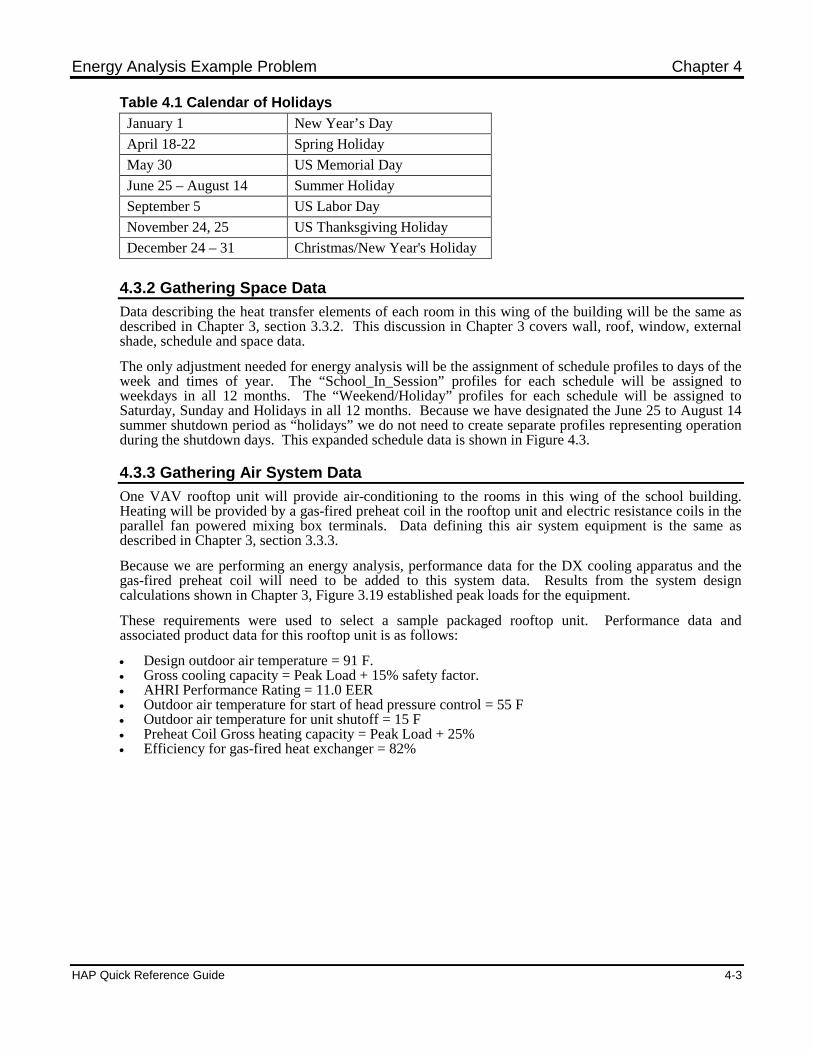
Energy Analysis Example Problem Chapter 4
HAP Quick Reference Guide 4-3
Table 4.1 Calendar of Holidays
January 1 New Year’s Day
April 18-22 Spring Holiday
May 30 US Memorial Day
June 25 – August 14 Summer Holiday
September 5 US Labor Day
November 24, 25 US Thanksgiving Holiday
December 24 – 31 Christmas/New Year's Holiday
4.3.2 Gathering Space Data
Data describing the heat transfer elements of each room in this wing of the building will be the same asdescribed in Chapter 3, section 3.3.2. This discussion in Chapter 3 covers wall, roof, window, externalshade, schedule and space data.
The only adjustment needed for energy analysis will be the assignment of schedule profiles to days of theweek and times of year. The “School_In_Session” profiles for each schedule will be assigned toweekdays in all 12 months. The “Weekend/Holiday” profiles for each schedule will be assigned toSaturday, Sunday and Holidays in all 12 months. Because we have designated the June 25 to August 14summer shutdown period as “holidays” we do not need to create separate profiles representing operationduring the shutdown days. This expanded schedule data is shown in Figure 4.3.
4.3.3 Gathering Air System Data
One VAV rooftop unit will provide air-conditioning to the rooms in this wing of the school building.Heating will be provided by a gas-fired preheat coil in the rooftop unit and electric resistance coils in theparallel fan powered mixing box terminals. Data defining this air system equipment is the same asdescribed in Chapter 3, section 3.3.3.
Because we are performing an energy analysis, performance data for the DX cooling apparatus and thegas-fired preheat coil will need to be added to this system data. Results from the system designcalculations shown in Chapter 3, Figure 3.19 established peak loads for the equipment.
These requirements were used to select a sample packaged rooftop unit. Performance data andassociated product data for this rooftop unit is as follows:
Design outdoor air temperature = 91 F. Gross cooling capacity = Peak Load + 15% safety factor. AHRI Performance Rating = 11.0 EER Outdoor air temperature for start of head pressure control = 55 F Outdoor air temperature for unit shutoff = 15 F Preheat Coil Gross heating capacity = Peak Load + 25% Efficiency for gas-fired heat exchanger = 82%
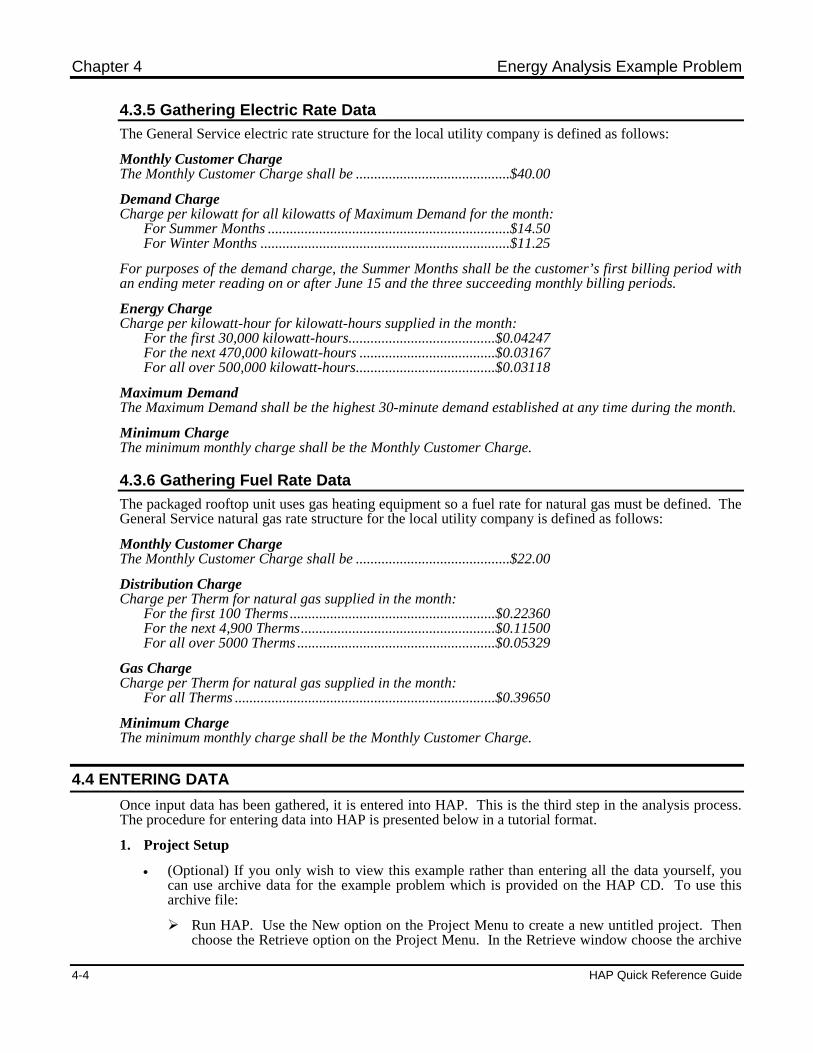
Chapter 4 Energy Analysis Example Problem
4-4 HAP Quick Reference Guide
4.3.5 Gathering Electric Rate Data
The General Service electric rate structure for the local utility company is defined as follows:
Monthly Customer ChargeThe Monthly Customer Charge shall be ..........................................$40.00
Demand ChargeCharge per kilowatt for all kilowatts of Maximum Demand for the month:
For Summer Months ..................................................................$14.50For Winter Months ....................................................................$11.25
For purposes of the demand charge, the Summer Months shall be the customer’s first billing period withan ending meter reading on or after June 15 and the three succeeding monthly billing periods.
Energy ChargeCharge per kilowatt-hour for kilowatt-hours supplied in the month:
For the first 30,000 kilowatt-hours........................................$0.04247For the next 470,000 kilowatt-hours .....................................$0.03167For all over 500,000 kilowatt-hours......................................$0.03118
Maximum DemandThe Maximum Demand shall be the highest 30-minute demand established at any time during the month.
Minimum ChargeThe minimum monthly charge shall be the Monthly Customer Charge.
4.3.6 Gathering Fuel Rate Data
The packaged rooftop unit uses gas heating equipment so a fuel rate for natural gas must be defined. TheGeneral Service natural gas rate structure for the local utility company is defined as follows:
Monthly Customer ChargeThe Monthly Customer Charge shall be ..........................................$22.00
Distribution ChargeCharge per Therm for natural gas supplied in the month:
For the first 100 Therms ........................................................$0.22360For the next 4,900 Therms.....................................................$0.11500For all over 5000 Therms ......................................................$0.05329
Gas ChargeCharge per Therm for natural gas supplied in the month:
For all Therms .......................................................................$0.39650
Minimum ChargeThe minimum monthly charge shall be the Monthly Customer Charge.
4.4 ENTERING DATA
Once input data has been gathered, it is entered into HAP. This is the third step in the analysis process.The procedure for entering data into HAP is presented below in a tutorial format.
1. Project Setup
(Optional) If you only wish to view this example rather than entering all the data yourself, youcan use archive data for the example problem which is provided on the HAP CD. To use thisarchive file:
Run HAP. Use the New option on the Project Menu to create a new untitled project. Thenchoose the Retrieve option on the Project Menu. In the Retrieve window choose the archive
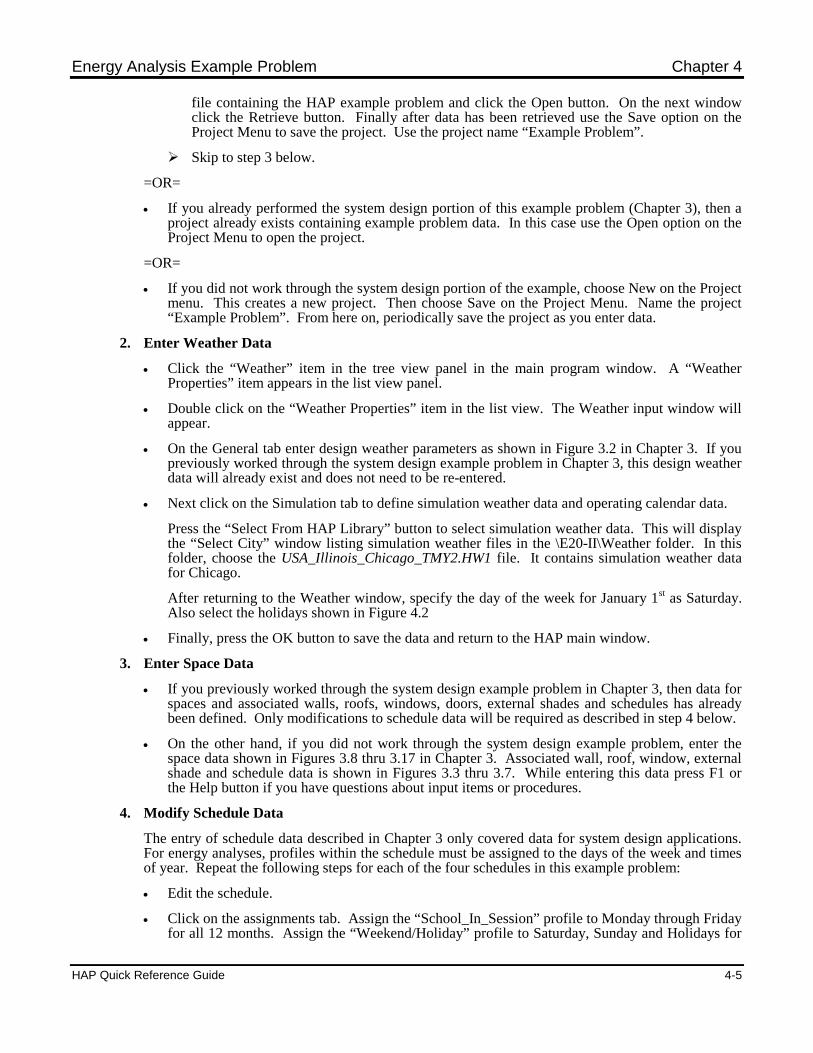
Energy Analysis Example Problem Chapter 4
HAP Quick Reference Guide 4-5
file containing the HAP example problem and click the Open button. On the next windowclick the Retrieve button. Finally after data has been retrieved use the Save option on theProject Menu to save the project. Use the project name “Example Problem”.
Skip to step 3 below.
=OR=
If you already performed the system design portion of this example problem (Chapter 3), then aproject already exists containing example problem data. In this case use the Open option on theProject Menu to open the project.
=OR=
If you did not work through the system design portion of the example, choose New on the Projectmenu. This creates a new project. Then choose Save on the Project Menu. Name the project“Example Problem”. From here on, periodically save the project as you enter data.
2. Enter Weather Data
Click the “Weather” item in the tree view panel in the main program window. A “WeatherProperties” item appears in the list view panel.
Double click on the “Weather Properties” item in the list view. The Weather input window willappear.
On the General tab enter design weather parameters as shown in Figure 3.2 in Chapter 3. If youpreviously worked through the system design example problem in Chapter 3, this design weatherdata will already exist and does not need to be re-entered.
Next click on the Simulation tab to define simulation weather data and operating calendar data.
Press the “Select From HAP Library” button to select simulation weather data. This will displaythe “Select City” window listing simulation weather files in the \E20-II\Weather folder. In thisfolder, choose the USA_Illinois_Chicago_TMY2.HW1 file. It contains simulation weather datafor Chicago.
After returning to the Weather window, specify the day of the week for January 1st as Saturday.Also select the holidays shown in Figure 4.2
Finally, press the OK button to save the data and return to the HAP main window.
3. Enter Space Data
If you previously worked through the system design example problem in Chapter 3, then data forspaces and associated walls, roofs, windows, doors, external shades and schedules has alreadybeen defined. Only modifications to schedule data will be required as described in step 4 below.
On the other hand, if you did not work through the system design example problem, enter thespace data shown in Figures 3.8 thru 3.17 in Chapter 3. Associated wall, roof, window, externalshade and schedule data is shown in Figures 3.3 thru 3.7. While entering this data press F1 orthe Help button if you have questions about input items or procedures.
4. Modify Schedule Data
The entry of schedule data described in Chapter 3 only covered data for system design applications.For energy analyses, profiles within the schedule must be assigned to the days of the week and timesof year. Repeat the following steps for each of the four schedules in this example problem:
Edit the schedule.
Click on the assignments tab. Assign the “School_In_Session” profile to Monday through Fridayfor all 12 months. Assign the “Weekend/Holiday” profile to Saturday, Sunday and Holidays for
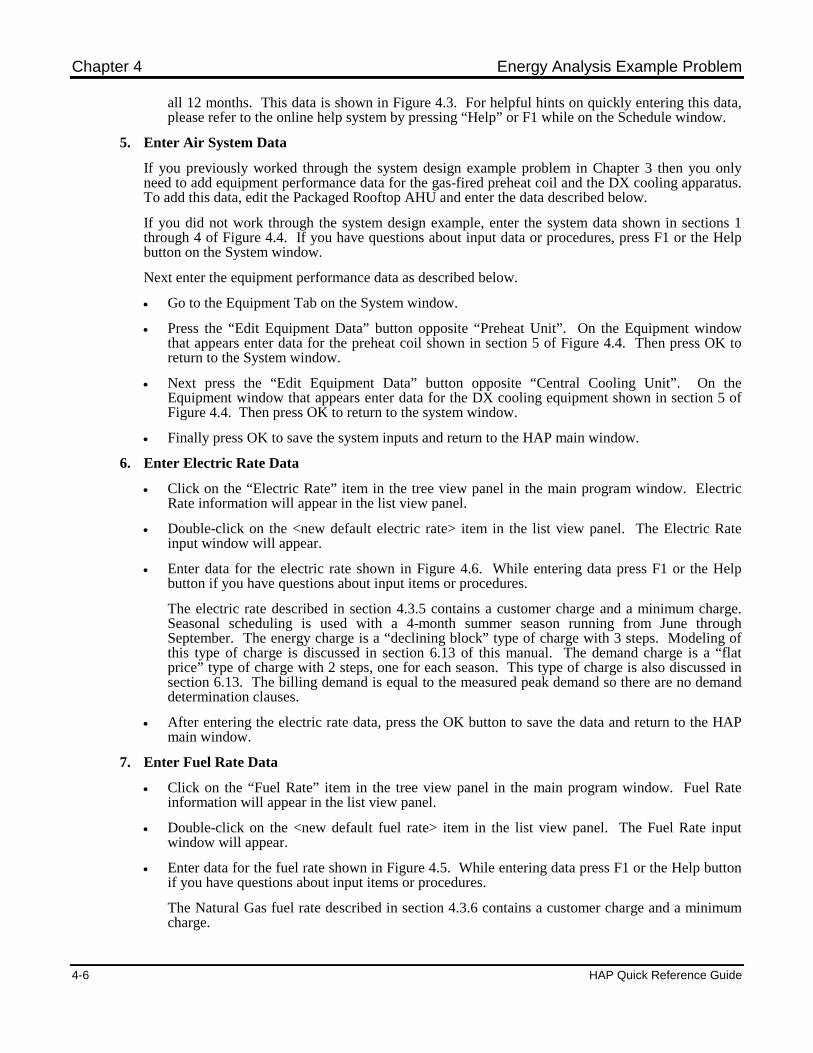
Chapter 4 Energy Analysis Example Problem
4-6 HAP Quick Reference Guide
all 12 months. This data is shown in Figure 4.3. For helpful hints on quickly entering this data,please refer to the online help system by pressing “Help” or F1 while on the Schedule window.
5. Enter Air System Data
If you previously worked through the system design example problem in Chapter 3 then you onlyneed to add equipment performance data for the gas-fired preheat coil and the DX cooling apparatus.To add this data, edit the Packaged Rooftop AHU and enter the data described below.
If you did not work through the system design example, enter the system data shown in sections 1through 4 of Figure 4.4. If you have questions about input data or procedures, press F1 or the Helpbutton on the System window.
Next enter the equipment performance data as described below.
Go to the Equipment Tab on the System window.
Press the “Edit Equipment Data” button opposite “Preheat Unit”. On the Equipment windowthat appears enter data for the preheat coil shown in section 5 of Figure 4.4. Then press OK toreturn to the System window.
Next press the “Edit Equipment Data” button opposite “Central Cooling Unit”. On theEquipment window that appears enter data for the DX cooling equipment shown in section 5 ofFigure 4.4. Then press OK to return to the system window.
Finally press OK to save the system inputs and return to the HAP main window.
6. Enter Electric Rate Data
Click on the “Electric Rate” item in the tree view panel in the main program window. ElectricRate information will appear in the list view panel.
Double-click on the <new default electric rate> item in the list view panel. The Electric Rateinput window will appear.
Enter data for the electric rate shown in Figure 4.6. While entering data press F1 or the Helpbutton if you have questions about input items or procedures.
The electric rate described in section 4.3.5 contains a customer charge and a minimum charge.Seasonal scheduling is used with a 4-month summer season running from June throughSeptember. The energy charge is a “declining block” type of charge with 3 steps. Modeling ofthis type of charge is discussed in section 6.13 of this manual. The demand charge is a “flatprice” type of charge with 2 steps, one for each season. This type of charge is also discussed insection 6.13. The billing demand is equal to the measured peak demand so there are no demanddetermination clauses.
After entering the electric rate data, press the OK button to save the data and return to the HAPmain window.
7. Enter Fuel Rate Data
Click on the “Fuel Rate” item in the tree view panel in the main program window. Fuel Rateinformation will appear in the list view panel.
Double-click on the <new default fuel rate> item in the list view panel. The Fuel Rate inputwindow will appear.
Enter data for the fuel rate shown in Figure 4.5. While entering data press F1 or the Help buttonif you have questions about input items or procedures.
The Natural Gas fuel rate described in section 4.3.6 contains a customer charge and a minimumcharge.
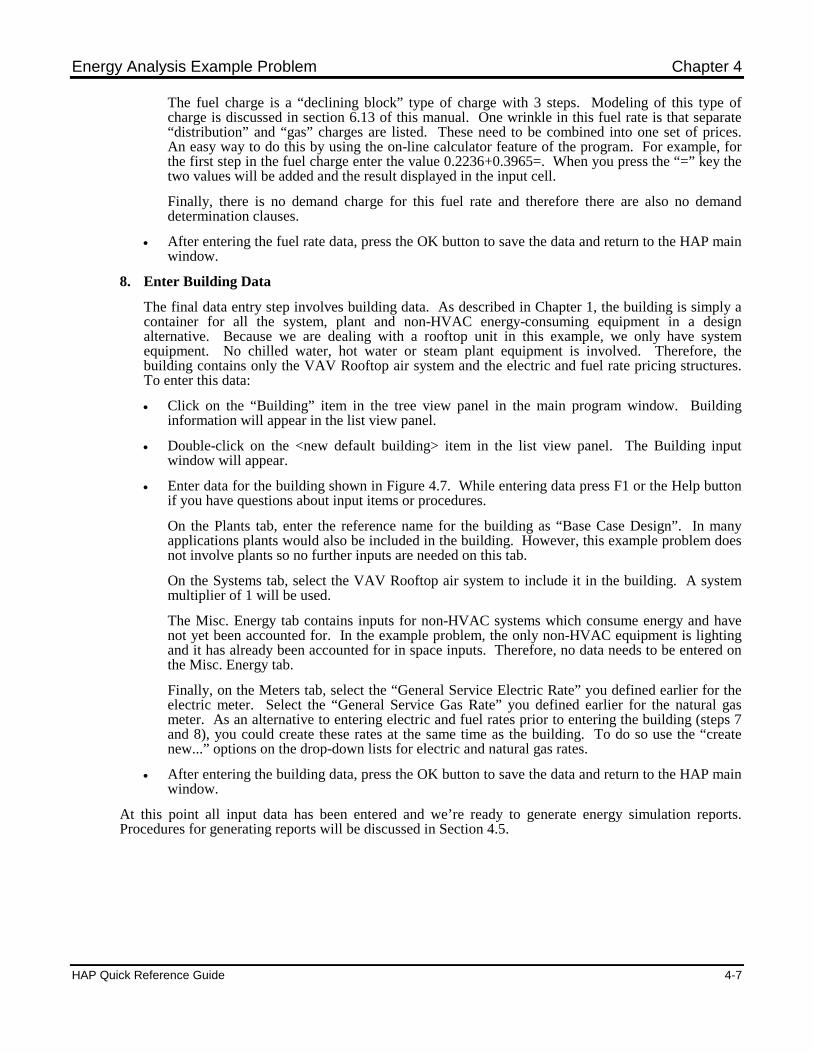
Energy Analysis Example Problem Chapter 4
HAP Quick Reference Guide 4-7
The fuel charge is a “declining block” type of charge with 3 steps. Modeling of this type ofcharge is discussed in section 6.13 of this manual. One wrinkle in this fuel rate is that separate“distribution” and “gas” charges are listed. These need to be combined into one set of prices.An easy way to do this by using the on-line calculator feature of the program. For example, forthe first step in the fuel charge enter the value 0.2236+0.3965=. When you press the “=” key thetwo values will be added and the result displayed in the input cell.
Finally, there is no demand charge for this fuel rate and therefore there are also no demanddetermination clauses.
After entering the fuel rate data, press the OK button to save the data and return to the HAP mainwindow.
8. Enter Building Data
The final data entry step involves building data. As described in Chapter 1, the building is simply acontainer for all the system, plant and non-HVAC energy-consuming equipment in a designalternative. Because we are dealing with a rooftop unit in this example, we only have systemequipment. No chilled water, hot water or steam plant equipment is involved. Therefore, thebuilding contains only the VAV Rooftop air system and the electric and fuel rate pricing structures.To enter this data:
Click on the “Building” item in the tree view panel in the main program window. Buildinginformation will appear in the list view panel.
Double-click on the <new default building> item in the list view panel. The Building inputwindow will appear.
Enter data for the building shown in Figure 4.7. While entering data press F1 or the Help buttonif you have questions about input items or procedures.
On the Plants tab, enter the reference name for the building as “Base Case Design”. In manyapplications plants would also be included in the building. However, this example problem doesnot involve plants so no further inputs are needed on this tab.
On the Systems tab, select the VAV Rooftop air system to include it in the building. A systemmultiplier of 1 will be used.
The Misc. Energy tab contains inputs for non-HVAC systems which consume energy and havenot yet been accounted for. In the example problem, the only non-HVAC equipment is lightingand it has already been accounted for in space inputs. Therefore, no data needs to be entered onthe Misc. Energy tab.
Finally, on the Meters tab, select the “General Service Electric Rate” you defined earlier for theelectric meter. Select the “General Service Gas Rate” you defined earlier for the natural gasmeter. As an alternative to entering electric and fuel rates prior to entering the building (steps 7and 8), you could create these rates at the same time as the building. To do so use the “createnew...” options on the drop-down lists for electric and natural gas rates.
After entering the building data, press the OK button to save the data and return to the HAP mainwindow.
At this point all input data has been entered and we’re ready to generate energy simulation reports.Procedures for generating reports will be discussed in Section 4.5.
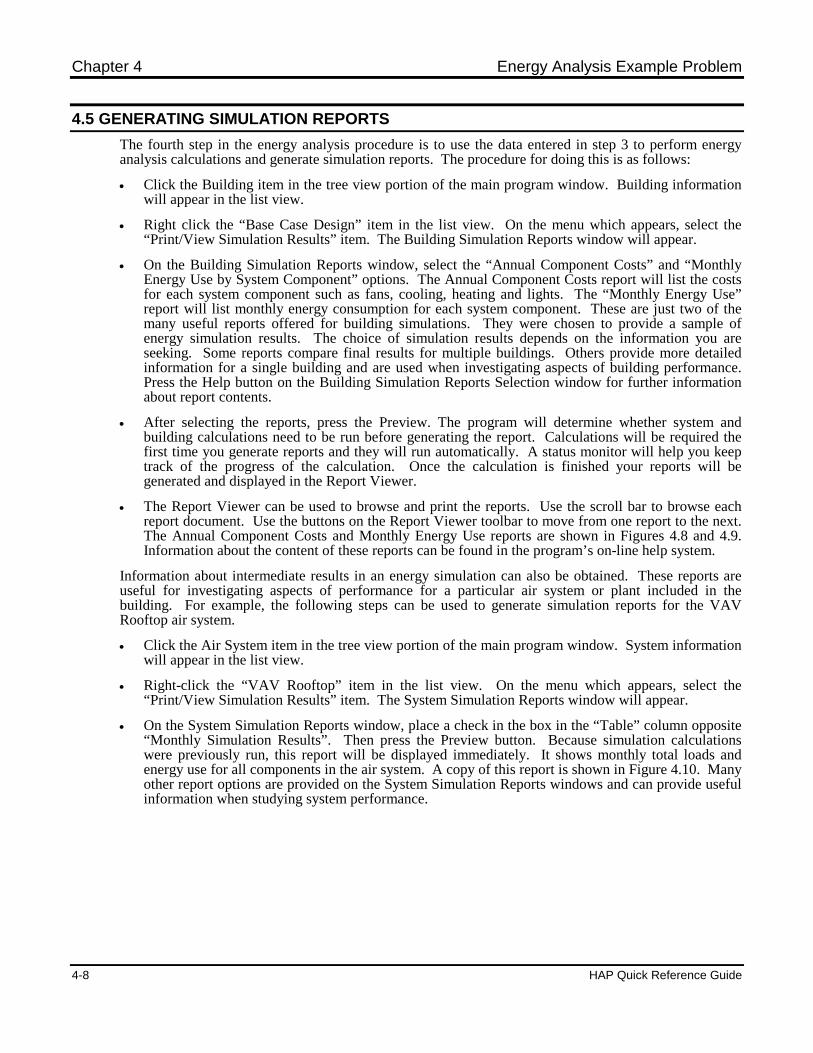
Chapter 4 Energy Analysis Example Problem
4-8 HAP Quick Reference Guide
4.5 GENERATING SIMULATION REPORTS
The fourth step in the energy analysis procedure is to use the data entered in step 3 to perform energyanalysis calculations and generate simulation reports. The procedure for doing this is as follows:
Click the Building item in the tree view portion of the main program window. Building informationwill appear in the list view.
Right click the “Base Case Design” item in the list view. On the menu which appears, select the“Print/View Simulation Results” item. The Building Simulation Reports window will appear.
On the Building Simulation Reports window, select the “Annual Component Costs” and “MonthlyEnergy Use by System Component” options. The Annual Component Costs report will list the costsfor each system component such as fans, cooling, heating and lights. The “Monthly Energy Use”report will list monthly energy consumption for each system component. These are just two of themany useful reports offered for building simulations. They were chosen to provide a sample ofenergy simulation results. The choice of simulation results depends on the information you areseeking. Some reports compare final results for multiple buildings. Others provide more detailedinformation for a single building and are used when investigating aspects of building performance.Press the Help button on the Building Simulation Reports Selection window for further informationabout report contents.
After selecting the reports, press the Preview. The program will determine whether system andbuilding calculations need to be run before generating the report. Calculations will be required thefirst time you generate reports and they will run automatically. A status monitor will help you keeptrack of the progress of the calculation. Once the calculation is finished your reports will begenerated and displayed in the Report Viewer.
The Report Viewer can be used to browse and print the reports. Use the scroll bar to browse eachreport document. Use the buttons on the Report Viewer toolbar to move from one report to the next.The Annual Component Costs and Monthly Energy Use reports are shown in Figures 4.8 and 4.9.Information about the content of these reports can be found in the program’s on-line help system.
Information about intermediate results in an energy simulation can also be obtained. These reports areuseful for investigating aspects of performance for a particular air system or plant included in thebuilding. For example, the following steps can be used to generate simulation reports for the VAVRooftop air system.
Click the Air System item in the tree view portion of the main program window. System informationwill appear in the list view.
Right-click the “VAV Rooftop” item in the list view. On the menu which appears, select the“Print/View Simulation Results” item. The System Simulation Reports window will appear.
On the System Simulation Reports window, place a check in the box in the “Table” column opposite“Monthly Simulation Results”. Then press the Preview button. Because simulation calculationswere previously run, this report will be displayed immediately. It shows monthly total loads andenergy use for all components in the air system. A copy of this report is shown in Figure 4.10. Manyother report options are provided on the System Simulation Reports windows and can provide usefulinformation when studying system performance.
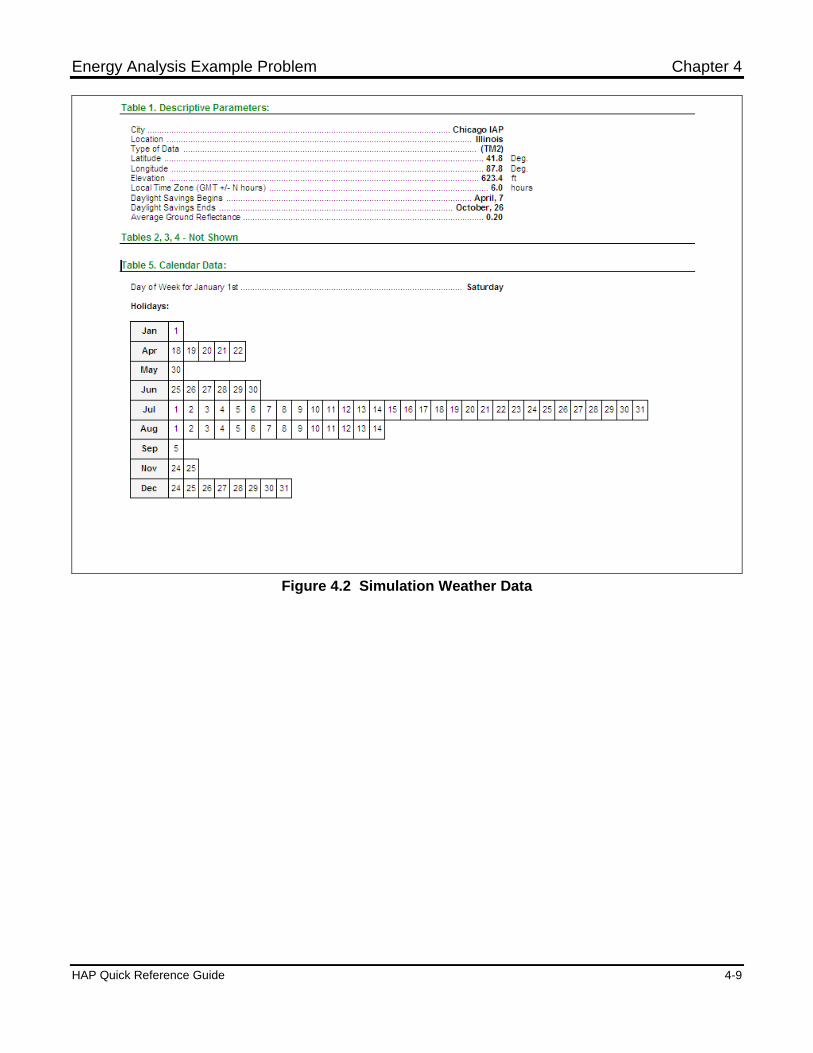
Energy Analysis Example Problem Chapter 4
HAP Quick Reference Guide 4-9
Figure 4.2 Simulation Weather Data
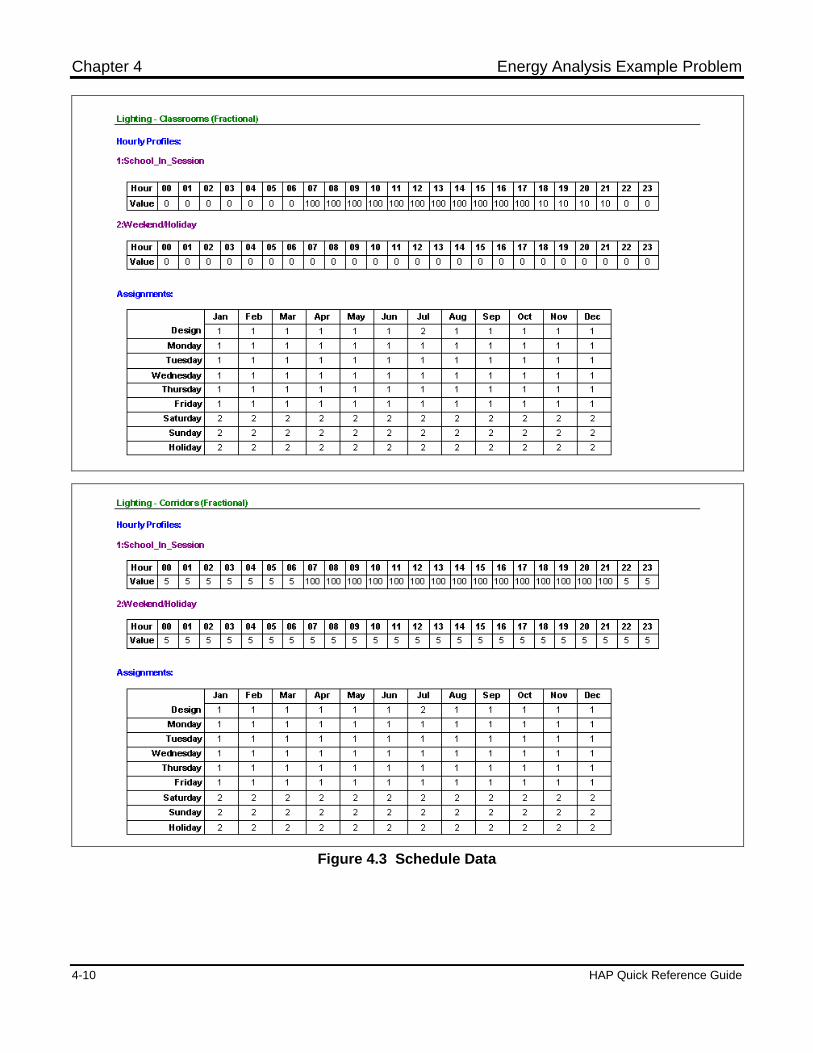
Chapter 4 Energy Analysis Example Problem
4-10 HAP Quick Reference Guide
Figure 4.3 Schedule Data
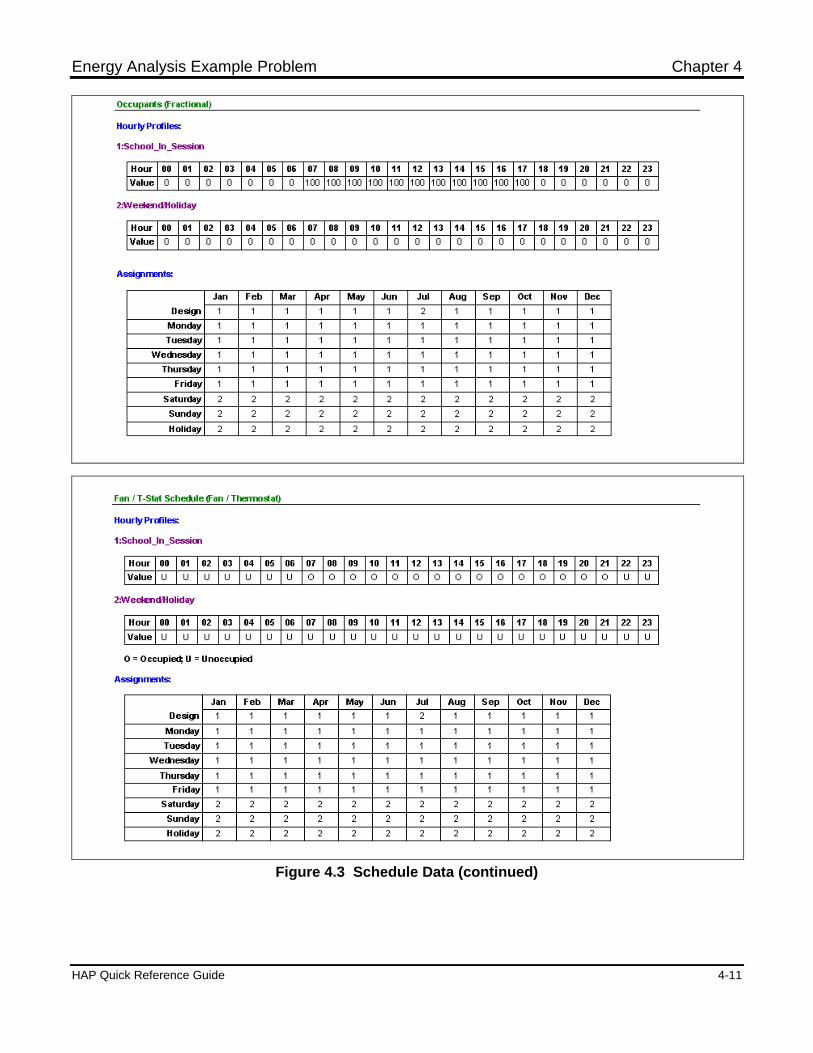
Energy Analysis Example Problem Chapter 4
HAP Quick Reference Guide 4-11
Figure 4.3 Schedule Data (continued)
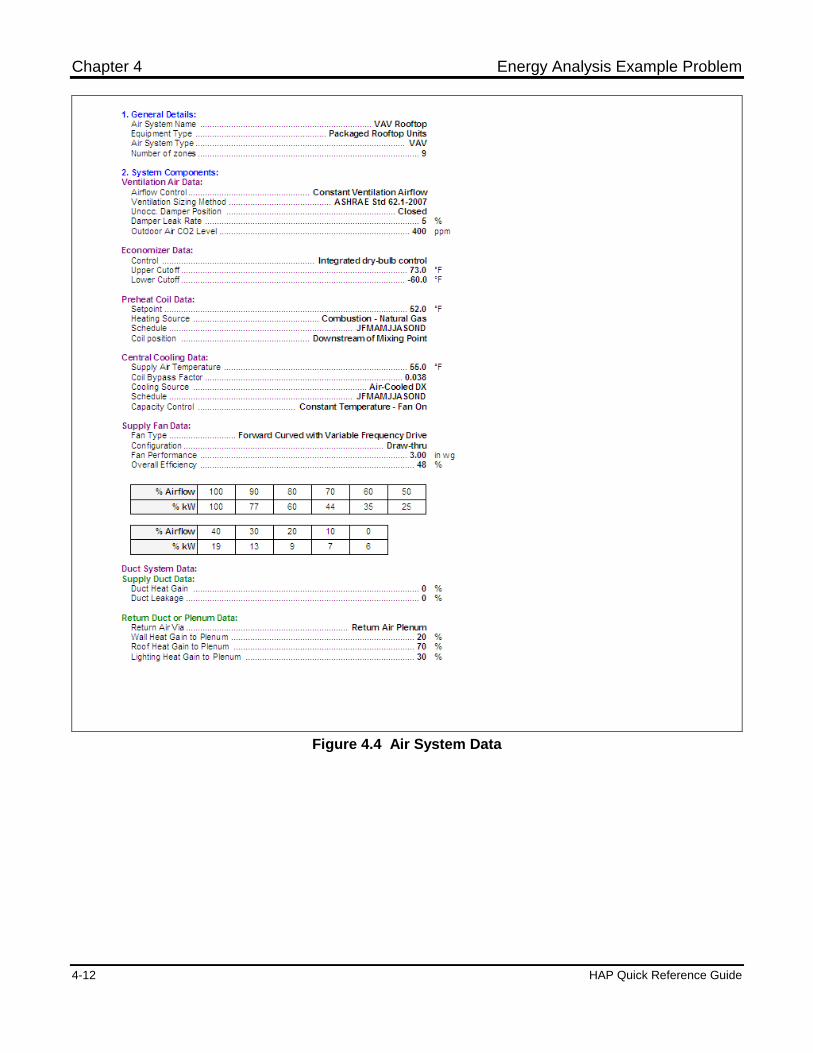
Chapter 4 Energy Analysis Example Problem
4-12 HAP Quick Reference Guide
Figure 4.4 Air System Data
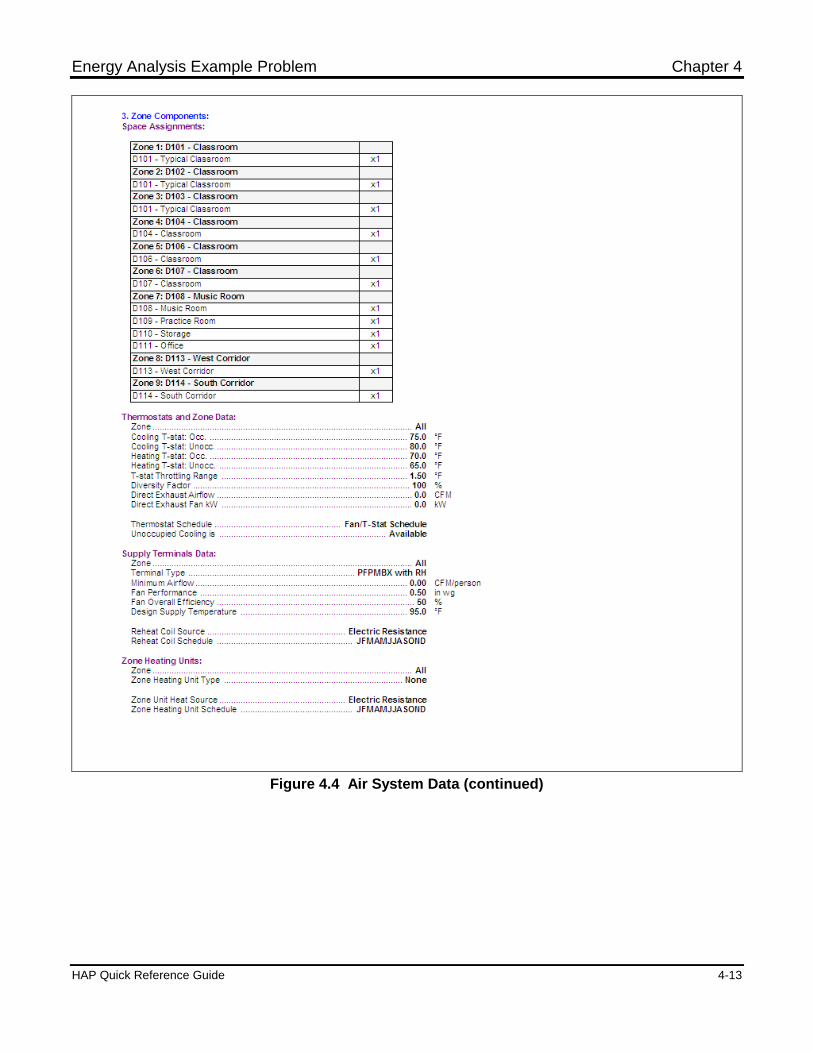
Energy Analysis Example Problem Chapter 4
HAP Quick Reference Guide 4-13
Figure 4.4 Air System Data (continued)
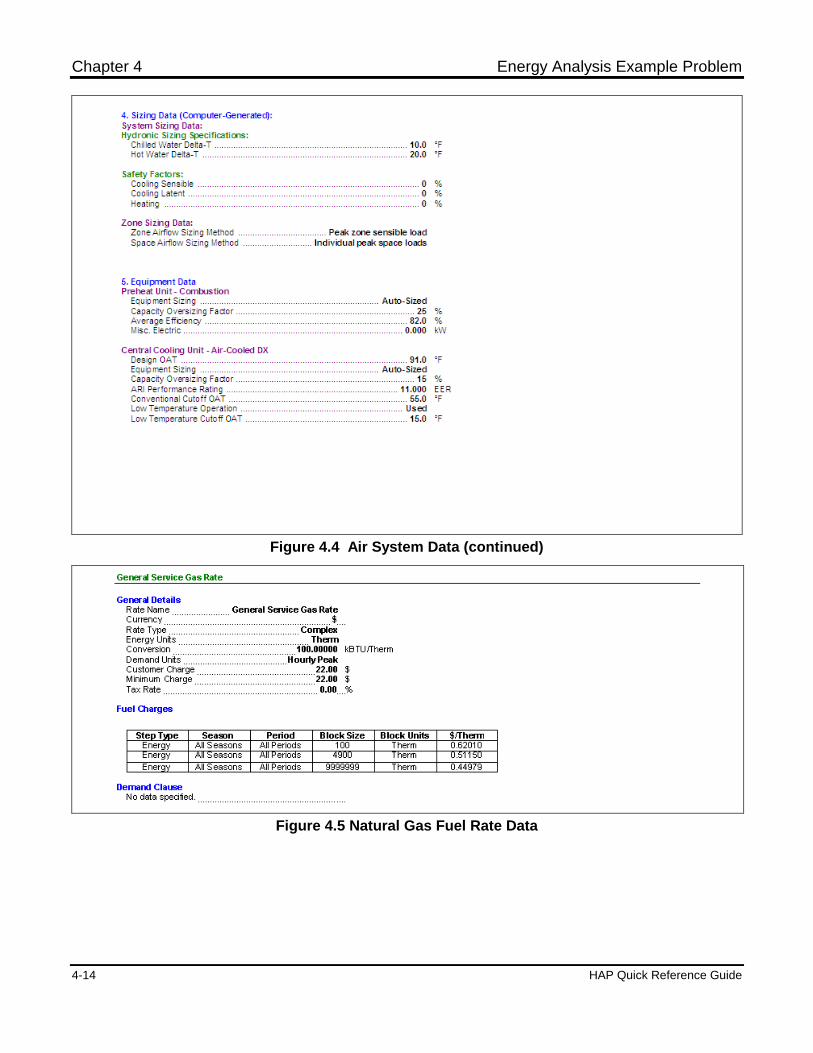
Chapter 4 Energy Analysis Example Problem
4-14 HAP Quick Reference Guide
Figure 4.4 Air System Data (continued)
Figure 4.5 Natural Gas Fuel Rate Data
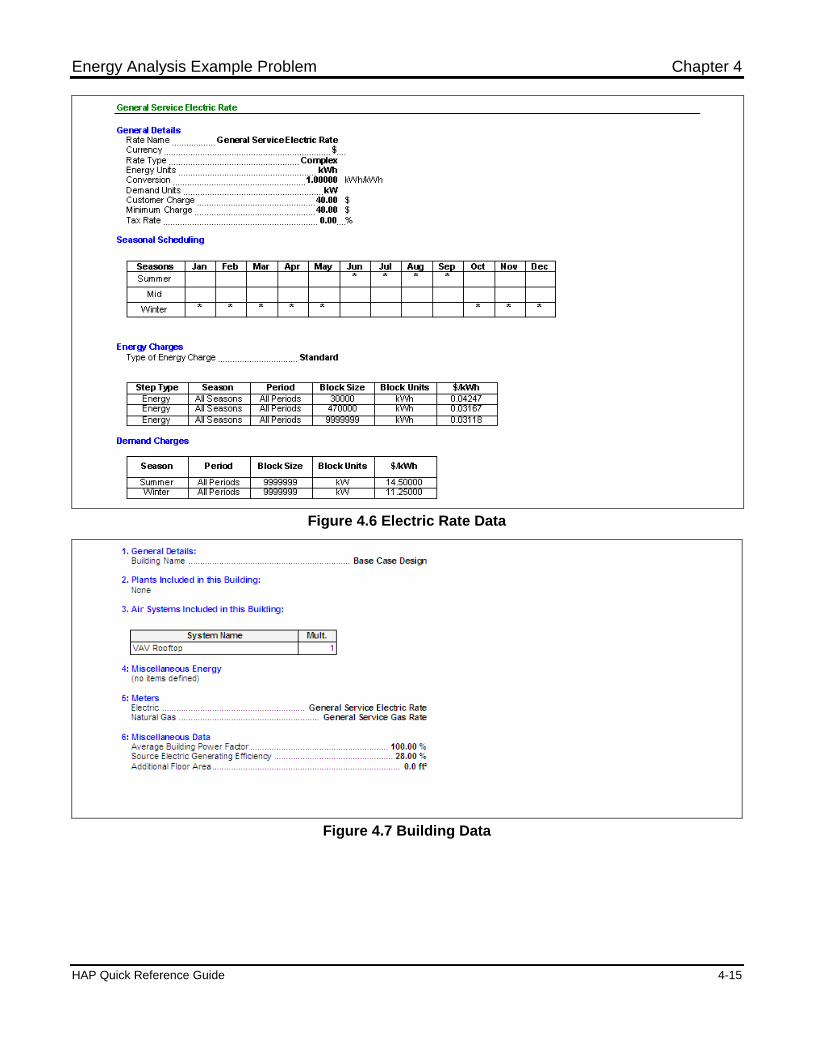
Energy Analysis Example Problem Chapter 4
HAP Quick Reference Guide 4-15
Figure 4.6 Electric Rate Data
Figure 4.7 Building Data
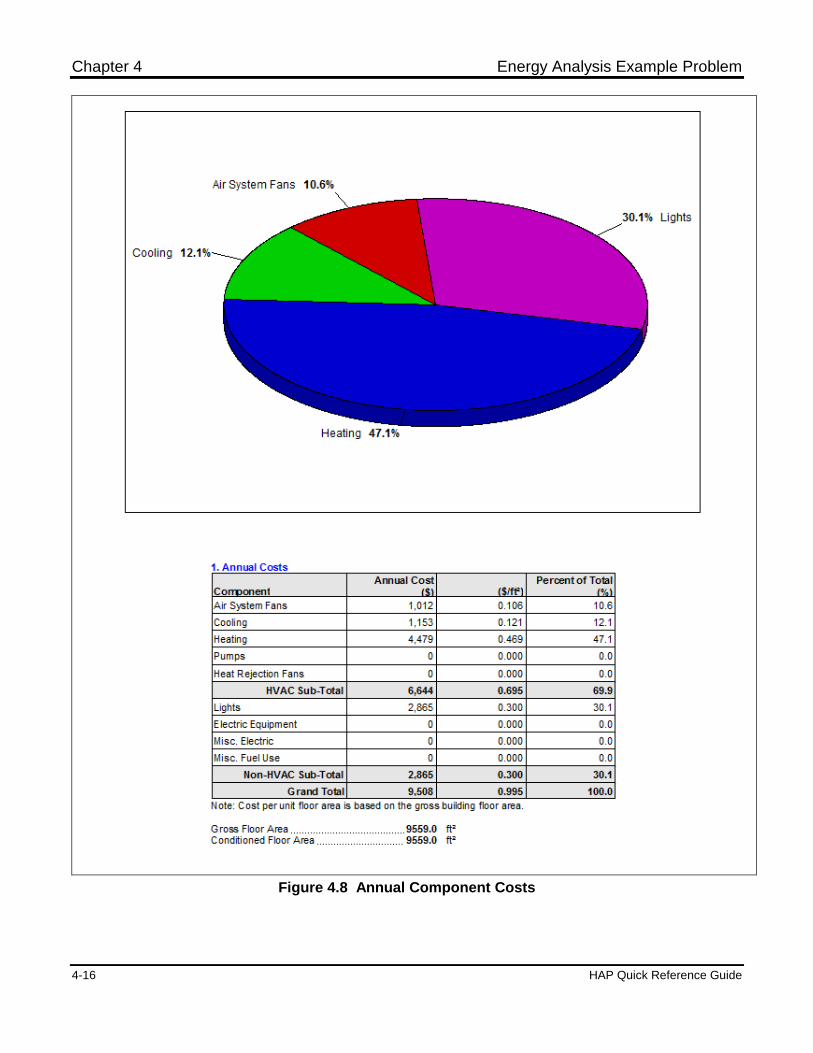
Chapter 4 Energy Analysis Example Problem
4-16 HAP Quick Reference Guide
Figure 4.8 Annual Component Costs
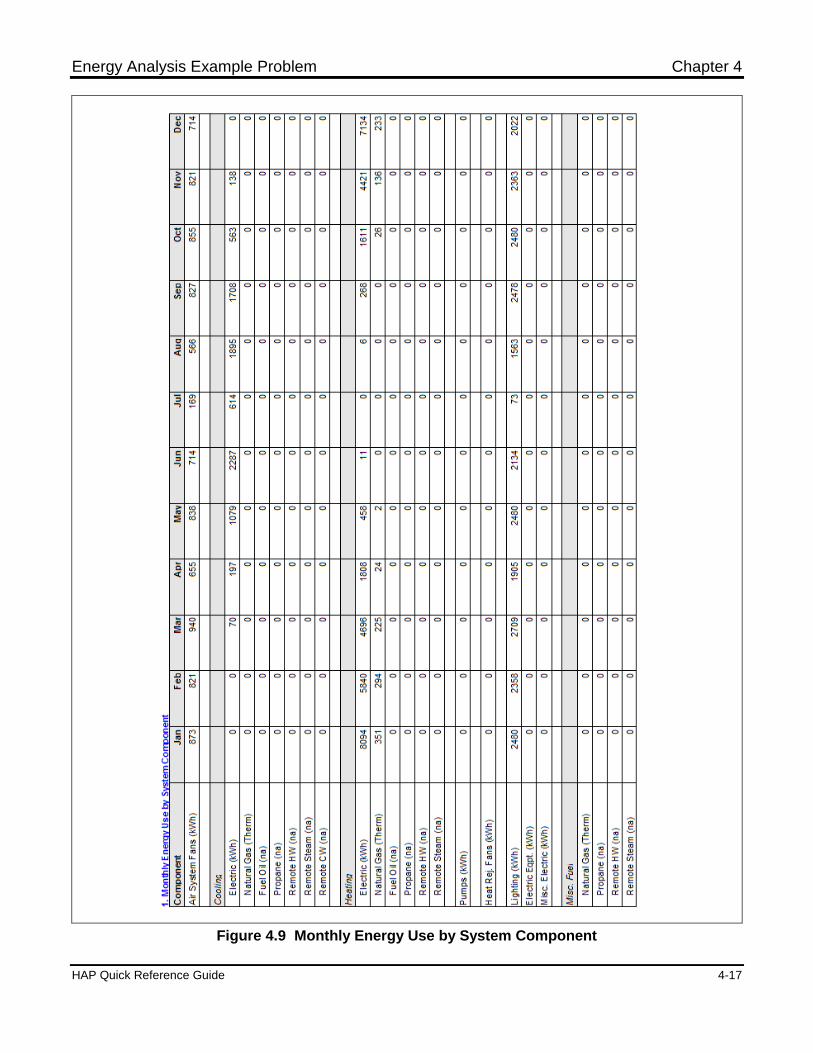
Energy Analysis Example Problem Chapter 4
HAP Quick Reference Guide 4-17
Figure 4.9 Monthly Energy Use by System Component
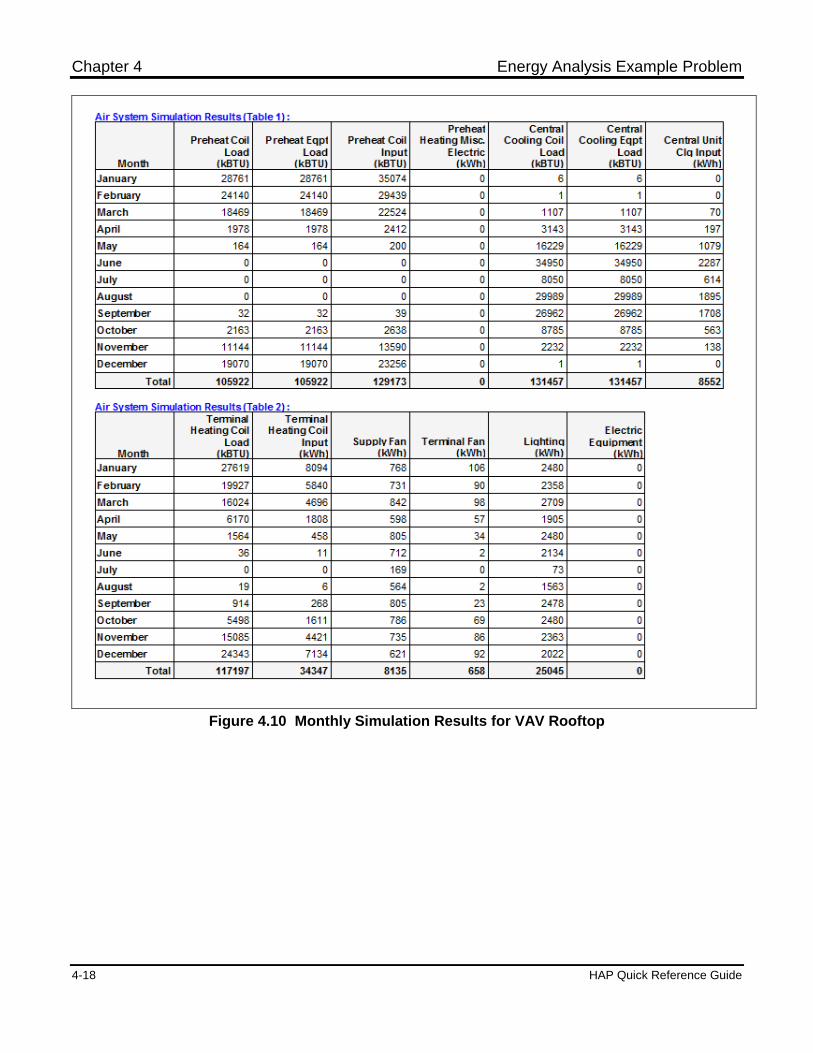
Chapter 4 Energy Analysis Example Problem
4-18 HAP Quick Reference Guide
Figure 4.10 Monthly Simulation Results for VAV Rooftop
HAP Quick Reference Guide 5-1
Chapter 5 Design Applications
This chapter provides application information describing how to use the program to perform differenttypes of system design analyses. It also provides advice on how to troubleshoot problem jobs. Materialin this chapter is written assuming the reader is familiar with the program operating principlesdiscussed in Chapter 1.
5.1 APPLICATION INFORMATION OVERVIEW
This chapter explains how to use the program for common system design applications. Chapter 1contained a general discussion of how to use the program to design systems. However, the program canbe used in design work involving a wide variety of different types of HVAC systems and equipment.Procedures for using the program for these applications are not always obvious, especially for newprogram users. Therefore, this chapter summarizes how the program can be used for four commoncategories of design applications:
Sizing single-zone HVAC units. Sizing terminal HVAC units such as fan coils and water-source heat pumps. Sizing multiple-zone HVAC systems. Sizing chiller and boiler systems.
Discussions will dwell on modeling strategies and procedures for generating sizing information. In eachcase it is assumed the reader is familiar with the basic program operating procedures outlined in Chapter1. Further, it is assumed input data has been gathered and weather, schedule, wall, roof, window, doorand shading data has already been entered. Therefore, entry of this data will not be covered in theapplication discussions.
Finally, the last section in the chapter discusses troubleshooting strategies required when investigatingprogram results.
5.2 APPLICATIONS INVOLVING SINGLE-ZONE HVAC UNITS
Introduction. Many design applications involve single-zone HVAC equipment. These include smallbuildings with open areas that can be properly air-conditioned with one single-zone unit, or regions of alarger building served by separate single-zone units. These applications generally fall into twocategories:
Applications involving rooftop or vertical packaged equipment. However, it could also involveapplications with split DX units and central station air handlers.
Applications involving terminal units such as hydronic fan coils, DX fan coils, packaged terminal airconditioners (PTACs) and water source heat pumps (WSHPs).
Applications in the first category will be discussed in this section. Analysis of terminal units will bedescribed in Section 5.3.
Analysis Strategy. To size single-zone HVAC units with the program, each HVAC unit must be definedas a separate air system. When calculations are performed, reports will be generated with sufficientinformation to size the cooling and heating coils, the unit fan and any system ductwork. Considerationsfor this analysis are discussed below.
Chapter 5 Design Applications
5-2 HAP Quick Reference Guide
1. Defining Spaces. Spaces can represent each room in the area served by the HVAC unit. This willallow load and airflow sizing data to be calculated on a room-by-room basis as well as on a zonebasis. If your objectives for the design calculation do not require a room-by-room sizing analysis,then one space representing the entire region served by the unit can be defined instead.
2. Defining The Air System. One air system must be defined for each single-zone HVAC unit to besized. Typically units will be constant volume, so the "Single Zone CAV" system option should beused and the appropriate system attributes should be defined. During air system inputs, the spacescontained in the zone served by the unit are specified. When a space is used to represent the entirebuilding or the entire region served by the unit, the zone will include only one space. When spacesrepresent separate rooms in the region served by the unit, the zone will contain a group of spaces.
3. Generating System Design Reports. First choose the air systems to be sized. In cases wheremultiple single-zone units are involved, it may be more efficient to enter the air system data for allthe HVAC units, and then generate reports all in one batch. The program provides capabilities fordoing this.
When choosing outputs, select the Air System Sizing Summary and the Zone Sizing Summary. TheAir System Sizing Summary provides data for sizing and selecting the supply fan and central coolingand heating coils. This data includes the design supply airflow rate, the design cooling and heatingcoil loads, coil selection parameters and useful check figures. The Zone Sizing Summary providesinformation for sizing space supply diffusers, zone and space ductwork and any zone heating units orreheat coils.
5.3 APPLICATIONS INVOLVING TERMINAL UNITS
Introduction. This section discusses applications involving the second category of single-zone HVACunits. This category of equipment includes packaged and split terminal air conditioners, hydronic fancoil units, induction beams, active chilled beams, and water source heat pumps (WSHPs) which are usedto condition separate rooms or groups of rooms. Examples include units serving separate offices in anoffice building, separate guest rooms in a hotel, or classrooms in a school building. Applicationsinvolving these types of equipment typically require that a large number of units be sized. To assist inthis task, the program provides special features for efficiently entering system information and producingsizing data.
Analysis Strategy. Rather than defining one air system per single-zone HVAC unit as was done inSection 5.2, the program allows one "air system input" to represent multiple HVAC units. This feature isavailable when using the Packaged DX Fan Coil, Split DX Fan Coil, 2-Pipe Fan Coil, 4-Pipe Fan Coil,WSHP, GWSHP, GSHP, VRF, Induction Beam, or Active Chilled Beam air system types. The programalso produces streamlined output for sizing this equipment. These features help minimize input effortand the quantity of output produced. Considerations for the analysis are summarized in the followingparagraphs.
1. Defining Spaces. As discussed in Section 5.2, a space should represent a single room when yourdesign analysis requires room-by-room sizing data. When this is not necessary, each space canrepresent the entire area served by one HVAC unit. In many applications, each HVAC terminal unitwill serve a single room, such as a fan coil in a hotel room, so the space must represent a single roomin these cases.
A more important consideration in this analysis is minimizing the number of spaces and units that aredefined in order to save time and effort. In most applications it is not necessary to define one spaceand one HVAC unit for every terminal unit in the building. For rooms with the same sizes andpatterns of loads, it may be possible to size an HVAC unit once, and then use the same unit inmultiple rooms. For example, guest rooms on the same exposure of a hotel might all be the samesize, use the same wall and window construction and experience the same internal loads. One spaceinput and system sizing calculation for a typical guest room might suffice for selecting units for 10 oreven 100 guest rooms in this situation. When considering how to reduce the number of unitsanalyzed, remember to evaluate all factors that affect loads. For example, separate calculations must
Design Applications Chapter 5
HAP Quick Reference Guide 5-3
be performed for two rooms of the same size on the same exposure if one is on the top floor and theother is on an intermediate floor, since only one has a roof exposure.
2. Defining the Air System. When entering air system data, specify Equipment Type as TerminalUnits and then choose the Packaged DX Fan Coil, Split DX Fan Coil, 2-Pipe Fan Coil, 4-Pipe FanCoil, WSHP, GWSHP, GSHP, VRF, Induction Beam, or Active Chilled Beam system type.
When one of these system options is chosen, the program allows multiple terminal HVAC units to bedefined in one air system input. In addition, outdoor ventilation can be supplied either directly to theunit, or by a dedicated outdoor air system (DOAS) unit. When a DOAS unit is used, the temperatureand humidity of air delivered to the terminal units will affect coil loads for the terminal HVAC units.This factor is considered in program calculations.
3. Generating System Design Reports. First choose the air system containing the terminal unit data.When choosing sizing reports, select the Zone Sizing Summary report. If ventilation air is providedby a DOAS unit, also select the Air System Sizing Summary report.
The Zone Sizing Summary provides data for sizing cooling coils, heating coils, fans and airflow foreach terminal unit and also airflow to individual spaces served by the terminal units. If an HVACterminal unit serves two or more spaces, this data will be essential for sizing space diffusers andductwork.
The Air System Sizing Summary will provide sizing data for the DOAS unit, if one is used. Thisincludes information for sizing the airflow, fan motor, cooling coil and heating coil in the ventilationunit.
5.4 APPLICATIONS INVOLVING MULTIPLE-ZONE HVAC SYSTEMS
Introduction. Many design projects involve a central packaged unit or a built-up air handling unit whichprovides conditioned air to many different regions in a building. Each of these regions has its ownthermostat making this a multiple-zone HVAC system. These systems comprise the third category ofdesign applications.
Analysis Strategy. To design multiple-zone HVAC systems with the program, each packaged unit orAHU must be defined as a separate air system. When design calculations are performed, output data willprovide sizing information for all cooling and heating coils, fans and terminals in the system.Considerations for this analysis are described below.
1. Organizing Zones & Defining Spaces. How to zone the system is one of the first decisionsrequired when organizing the analysis. Zoning usually depends on the building use and layout, andthe HVAC system controls. The goal is to provide a thermostat for each region of the buildingrequiring specific temperature control. Since the program defines a zone as the region served by onethermostat, the location of thermostats in the system dictates how rooms will be grouped into zones.
Examples: Offices on a south exposure of a building might be included in one zone since they are ofsimilar size and experience the same patterns of loads. A conference room on the same exposuremight have a separate thermostat since its pattern of loads will differ from those of the offices on thesame exposure. Further, north and south offices in a building would typically be assigned to separatezones since offices on each exposure experience significantly different patterns and magnitudes ofloads.
Once zoning decisions have been made, all spaces included in each zone must be defined. Asdiscussed in previous sections, each space should represent a separate room when room-by-roomload and airflow sizing data is required. When a room-by-room sizing analysis is not required, eachspace can represent the entire area in one zone.
Another important consideration when entering spaces is how to minimize input effort. When eachspace represents a single room, the brute force approach is to define a separate space for every roomin the building. However, in many cases series of identical rooms (same size, same pattern andmagnitude of loads) will exist in a zone. In these situations, one of the identical rooms can be
Chapter 5 Design Applications
5-4 HAP Quick Reference Guide
defined as a space once. Later during air system input, a multiplier can be applied to this space toaccount for the total number of rooms present in the zone. This reduces input effort.
2. Defining The Air System. One air system must be entered to represent the multiple-zone HVACsystem. The program provides options for defining and sizing many different types of constantvolume and variable volume multiple-zone HVAC systems. Define the appropriate attributes for thesystem being designed.
Entering air system data also requires defining the zones served by the system. The number of zonesis specified first. Next, spaces included in each zone are identified by specifying the quantity of eachspace included in a zone. In a simple case in which a zone contains one space, a quantity of 1 wouldbe defined. In another case, a zone might contain six identical offices. If one space has been definedto represent one of these offices, the zone would contain one space but the space would be assigned aquantity of 6. Finally, a zone might contain a group of different rooms each defined as a separatespace. In this case, the zone would contain multiple spaces.
3. Generating System Design Reports. First choose the air system to be sized. When designingmultiple air systems in a large building, it may be more efficient to define all the systems and thengenerate reports for all in one batch. The program provides features for doing this.
On the report selection screen, choose the Air System Sizing Summary and Zone Sizing Summaryoptions. The Air System Sizing Summary lists maximum coil loads for all central cooling and heatingcoils in the system, required airflow rates for central supply and return fans, coil selectionparameters, and useful check figures. This data can be used to select coils and fans for the system.The Zone Sizing Summary provides data for sizing zone terminals such as VAV boxes, zone reheatcoils, zone baseboard or fan coil heating units and fan powered mixing boxes, as well as spacediffusers and ductwork.
5.5 APPLICATIONS INVOLVING COOLING AND HEATING PLANTS
Introduction. System design work can also require sizing central chilled water, hot water and/or steamplants. In these situations, a plant might serve several central air handling units in a large building and/ora large number of hydronic fan coil units located in different rooms of a building. In either case, theprogram provides capabilities for sizing both the air handling and terminal units as well as the plantequipment. This section describes the analysis procedure required.
Analysis Strategy. Performing this analysis requires developing inputs for all the air systems served bythe plant first and then generating system sizing reports. Next, a chilled water plant is created andsystems having chilled water cooling coils are linked to it. A hot water or steam plant is also created andsystems having hot water or steam heating coils are linked to it. Finally, plant design reports aregenerated. Considerations required in the analysis are discussed below.
1. Defining Air Systems. The same principles discussed earlier in this chapter for single-zone andmultiple-zone systems are required when defining air systems for this application. In previousdiscussions the choice of an equipment type and the specification of the cooling and heating sourcesfor coils were not critical. However, when sizing plant equipment, these details are important.
Coils served by the cooling plant must have chilled water designated as the cooling source. Chilledwater is the default cooling source when the systems equipment classification is Chilled Water AHU,and when using the 2-Pipe Fan Coil, 4-Pipe Fan Coil, Induction Beam or Active Chilled Beamsystem types. When using systems in the Undefined equipment class, the cooling source is "Any"and can be used for chilled water plant design calculations.
Coils served by the heating plant must have hot water or steam designated as the heating source.When using systems in the Undefined equipment class, the heating source is "Any" and can be usedfor both hot water and steam design calculations.
Special Consideration. Finally, a key requirement of the plant analysis is that the total loadimposed on equipment must be considered. Because techniques for minimizing work when
Design Applications Chapter 5
HAP Quick Reference Guide 5-5
analyzing terminal equipment such as fan coils involves analyzing duplicate units only once, this cancause problems in generating correct cooling plant and heating plant load totals.
Example: A hotel contains 220 guest rooms served by 4-pipe fan coils. 100 of these rooms are onone face of the building and have identical size and load patterns. Another group of 100 are on theopposite face of the building and also have identical size and load patterns. The remaining 20 roomsmust be modeled separately because each has unique characteristics. To save time, we could modelthis situation with one 4-pipe fan coil system having 22 zones - 1 zone representing one unit out ofthe first group of 100 identical zones, 1 zone representing one unit out of the second group of 100zones and one zone each for the remaining 20 unique zones. This would vastly reduce effort requiredto size and select the fan coils.
However, if we linked this fan coil air system to a chiller or boiler plant, we would have a problemsince loads would be undercounted. We have only accounted for the loads of 22 out of the 220 fancoil units in the building.
To correct this problem, an alternate approach would be used. Define three 4-pipe fan coil airsystems. The first contains 20 zones, one for each of the 20 unique hotel zones. The second contains1 zone representing a single zone in the first group of 100 identical zones. The third system contains1 zone representing a single zone in the second group of 100 identical zones. System sizing reportscan be run as before to generate data needed to select the fan coil units.
To size the cooling plant, the three fan coil air systems would be linked to the chiller. The systemcontaining the 20 unique zones would be assigned a system multiplier of 1. The single-zone systemsrepresenting each group of 100 identical zones would each be assigned a system multiplier of 100. Inthis way the total load for all 220 fan coil units would be accounted for and the chiller would beproperly sized. The same sort of approach would be used when linking the fan coil air systems to theheating plant.
2. Generating System Design Reports. Once air systems have been defined, generate system designreports for each. As discussed in earlier sections, the system design reports provide information forsizing cooling coils, heating coils, fans, diffusers and ductwork.
If system sizing data is not a concern (e.g., if you are performing a preliminary block loadcalculation), this step can be skipped. The plant sizing calculations performed as part of step 4 willautomatically run system sizing calculations first if system sizing results do not already exist.
3. Defining Plants. For a chilled water plant, create one plant and choose "Generic Chilled WaterPlant" as the plant type. Then specify the air systems served by this plant. For each system linked tothe plant, HAP will assume that all chilled water coils, and coils whose cooling source is "Any" areserved by the plant. As mentioned in item 1 above, system multipliers can be used when an airsystem represents one of a number of identical systems or units served by the chiller.
For a changeover plant using reversible chillers, create one plant and choose "Generic ChangeoverPlant" as the plant type. Then specify the air systems served by this plant. For each air systemlinked to the plant, HAP will assume that all cooling coils with chilled water or "any" as the source,and all heating coils with hot water or "any" as the source are served by the plant.
For hot water or steam plant create one plant. For a hot water plant, choose "Generic Hot WaterPlant" as the plant type. For a steam plant, choose "Generic Steam Plant" as the plant type. Thenspecify the air systems served by this plant. In a hot water plant HAP will assume all hot water coilsand coils with a heating source of "any" are served by the plant. In a steam plant HAP will assumethat all steam coils and coils with a heating source of "any" are served by the plant.
For HAP users who will later run energy analyses, "Generic" plants can later be converted intospecific plant types. When converting plants, system selection data is preserved.
4. Generating Plant Design Reports. Finally, generate design reports for the plants. For the chilledwater plants, choose the Cooling Plant Sizing Summary report. This report lists the peak coolingplant load as well as the coincident loads for all systems served by the chiller.
Chapter 5 Design Applications
5-6 HAP Quick Reference Guide
For a hot water plant, choose the Heating Plant Sizing Summary report. This report lists the peakheating plant load as well as coincident loads for systems served by the plant.
For changeover plants using reversible chillers select both the Cooling Plant Sizing Summary and theHeating Plant Sizing Summary to obtain both cooling and heating sizing data.
5.6 TROUBLESHOOTING STRATEGIES
This section describes general strategies used to investigate load calculation and system sizing results.These investigations may be necessary when diagnosing problems with results or simply learning moreabout results generated by the program. Due to the wide range of situations requiring diagnosis, it is notpossible to discuss troubleshooting procedures for specific applications. Rather, general strategies usefulin a variety of situations will be described below.
1. Investigate Input and Output Data. When a question about results arises, first generate reports ofall input data and pertinent load calculation results. Inspect and compare data on the differentprintouts. Sometimes unusual sizing results are caused by inadvertent input errors.
2. Research Input Definitions and Calculation Procedures. In many cases, a thorough knowledge ofhow the program uses certain inputs and performs its load and sizing calculations is necessary tounderstand program results. Topics in the on-line help system provide definitions of all programinputs and explain how inputs are used by the program. Documentation topics in the help systemexplain calculation procedures.
3. Perform Comparative Analysis. When a more detailed investigation is needed various types ofcomparative analyses can be helpful. The success of this technique depends on the user's ingenuity,knowledge of system and load behavior, and knowledge of the program. Two common applicationsfor comparative analysis are provided below to serve as examples.
Single-Hour vs Multiple Hour Data. Frequently, unusual results found on the Air SystemSizing Summary or Zone Sizing Summary reports can be successfully diagnosed by comparingdata with full 24-hour load profiles.
Example: Suppose the Air System Sizing Summary report shows that the peak coil load occurs at7am. Since peak coil loads usually occur in the mid to late afternoon, this is an unexpectedresult. One way to diagnose this result is to generate the Hourly Air System Design Day Loadsreport which lists cooling coil loads for all hours in a specific month. By comparing coil loads atdifferent times of day, a user can gain insight into why the maximum load occurs in the earlymorning. Sometimes this type of result will be due to an unusually large pulldown load whichcauses loads during the first few hours of operation in the occupied period to exceed coil loadsduring the mid-afternoon hours. Such results could be due to legitimate system behavior or couldbe due to errors in modeling building heat gains or system controls.
Air System Variations. When an air system containing several components and accessorycontrols yields unusual sizing results, a useful diagnostic strategy is to run calculations forvariations of the system to determine the effect of each component or control.
Example: An air system including dehumidification control, a preheat coil and a ventilationreclaim device yields unusual sizing results. To diagnose this problem, make four copies of theair system. From one copy remove all three supplemental components and controls. This systemwill represent a base case. For the other three copies include each of the components separately.For example, one system would only include the dehumidification control. Another wouldinclude the preheat coil only, and so forth. Finally, run sizing calculations for each for the foursystem variations. A comparison of results from these systems should demonstrate the individualeffect of each component control. Often this points out the reason for the original results thatwere questioned. When it does not, it may be necessary to use 24-hour load profile reports toevaluate differences in system performance, or to run further test cases using combinations oftwo components at a time (e.g., dehumidification and the preheat coil together, the preheat coiland ventilation reclaim, etc...).
HAP Quick Reference Guide 6-1
Chapter 6 Energy Analysis Applications
This chapter explains how to use the program for common energy analysis applications. It also providesadvice on how to troubleshoot unexpected energy simulation results. Material in this chapter assumesthe reader is familiar with the program operating principles discussed in Chapter 1.
6.1 APPLICATION INFORMATION OVERVIEW
This chapter explains how to use the program for common energy analysis applications. Chapter 1contained a general discussion of how to use the program for energy analysis studies. However, theprogram can be used in studies involving a many different types of HVAC equipment. Procedures forusing the program for these applications are not always obvious, especially for new program users.Therefore, this chapter covers the following ten application topics:
General energy analysis strategies. Troubleshooting strategies. Simulating packaged rooftop units Simulating vertical packaged units. Simulating split DX air handlers. Simulating chilled water air handlers. Simulating packaged or split DX fan coil units. Simulating hydronic fan coil units. Simulating induction beam or active chilled beam systems. Simulating water source heat pump systems. Simulating ground water and ground source heat pump systems. Simulating chilled water plants. Simulating hot water and steam plants. Simulating heat recovery plants Modeling utility rate structures.
In all of these discussions it is assumed the reader is familiar with the basic program operatingprocedures outlined in Chapter 1. Further, it is assumed input data has been gathered and entered forweather, schedules, walls, roofs, windows, doors and shading geometries. Therefore, entry of this datawill not be covered in the application discussions.
6.2 ENERGY ANALYSIS STRATEGIES
The purpose of an energy analysis is to compare the annual energy use and energy costs of alternatesystem designs. To generate energy use data, the operation of all energy-consuming equipment in abuilding must be simulated. This includes energy use by air handling systems, plant equipment, and non-HVAC systems such as lighting and office equipment. In small buildings, the analysis is easy to organizedue the relatively small number of components involved. For larger buildings, however, the analysis canbe much harder to organize. In these cases it is important to consider ways to minimize input effort andcalculation time. This section discusses strategies for maximizing the accuracy of energy analysis resultswhile minimizing effort.
The most accurate energy analysis results can be obtained by analyzing equipment exactly as it isinstalled. For example, if a building contains 400 water source heat pump (WSHP) units, the mostaccurate approach would be to model 400 heat pump units and the spaces they serve separately. In this
Chapter 6 Design Applications
6-2 HAP Quick Reference Guide
way loads experienced by each WSHP unit and the performance of each unit could be accuratelyevaluated.
While this is conceptually the simplest approach to energy analysis, it can often require the largestamount of time for gathering and inputting data and then running simulations. In certain situations thenumber of spaces, zones, air systems and plants can be systematically reduced without significantlyaffecting the accuracy of results.
Simplification of the energy analysis is achieved using two techniques. One involves combining or"lumping" together similar components in the analysis. Two identical zones in an air system, forexample, can be combined without affecting system simulation results. The other is simulating identicalequipment only once, and then using multipliers to account for the total number of units in the building.In a hotel, for example, packaged terminal air conditioner (PTAC) units might be used in 75 identicalsouth-facing guest rooms. Rather than simulate all 75 PTAC units separately, one representative unit canbe simulated and then multiplied by 75 to account for the total energy consumption of the equipment inenergy cost calculations.
Both these approaches require careful evaluation of which components in the analysis can and cannot becombined. If the analysis is oversimplified, energy use and costs can be significantly over or under-estimated. Separate paragraphs below summarize considerations involved with reducing the number ofspaces, zones, air systems and plants involved in the analysis.
Space Data. In many situations, rooms in a zone can be combined and defined as one space.Because a zone has only one thermostat, it is the total zone load that drives air terminal operation andtherefore system operation, not the individual space loads. Therefore, the same total zone loads willbe calculated whether the zone is defined using one large combined space or multiple spacesrepresenting separate rooms.
In a zone containing several identical rooms, another approach is to define only one of the rooms as aspace. When linking spaces to zones, a multiplier can be used to account for the total number of thistype of room in the zone.
These techniques reduce the number of spaces entered and the time required for the program tocompute loads during the energy simulations.
Note: For several reasons design considerations may prevent using this reduction technique. If aproject involves both system design and energy analysis, it may be necessary to define each room asa space in order to size air diffusers for each room. Further, if design zone airflow rates are based onthe sum of peak space airflow rates, then spaces in the zone cannot be combined. To properly sizezone airflow rates, the individual spaces in the zone must be defined.
Zone Data. A zone is defined as the region of a building served by one thermostat. Large air-handlingsystems which contain many zones and systems involving multiple single-zone units, such as fan coils,offer the greatest potential for simplification.
In a central air-handling system serving an office building, for example, each perimeter office maycontain a thermostat. However, many offices on the same perimeter exposure may experienceidentical or very similar patterns of loads. Rather than analyzing each room as a separate zone, manyzones can be lumped together without sacrificing accuracy. For example, 20 offices on the southexposure of a building might be combined into one large south-facing zone. The same principlesapply when terminal units such as fan coils serve the offices. When combining zones:
Do combine zones with identical or similar patterns of loads. Typically these zones will have thesame exterior exposure and the same patterns of occupancy and internal heat gains.
Don't combine zones with different exterior exposures. For example, combining north-facing andsouth-facing offices is a poor choice since each experiences significantly different patterns of solarloads.
Don't combine zones which do have a roof exposure with those that don't. The presence of the roofcauses load patterns to differ from those in zones without a roof exposure.
Energy Analysis Applications Chapter 6
HAP Quick Reference Guide 6-3
Don't combine interior regions with perimeter zones. For much of the year, interior heat gains willoffset perimeter heat losses causing heating loads to be understated.
Don't combine zones with different use patterns. For example, in a school building, a classroomzone should not be combined with a cafeteria zone since the occupancy and heat gain patterns ineach differ.
The advantages of reducing the number of zones are that fewer spaces need to be input, and times forload calculations and air system simulations are reduced.
Air System Data. Opportunities for reducing the number of air systems in an analysis vary betweencentral air handling systems and terminal systems such as fan coils.
Opportunities for combining central air handling systems are usually limited, except in special caseswhere several similar or identical systems serve different parts of a building. For central air systemsto be "similar", the systems must contain the same components, be sized in the same way, serve thesame number of zones, and experience the same pattern of loads. This situation might occur in amulti-story building where separate air systems serve each floor, and patterns of loads on each floorare very similar. In such a case, an air system for a typical intermediate floor could be defined andsimulated once. When the air system is linked a plant or a building, a multiplier can be used toaccount for the total number of air systems of this type in the building.
Opportunities for reducing the number of terminal type air systems in an analysis are much morecommon. As discussed earlier, the number terminal air-conditioner units in guest rooms in a hotelcan be vastly reduced analyzing typical units and using multipliers. When identifying typical units,or when lumping units together, the criteria previously described for combining zones should beused. In addition, units which use different components or controls should not be lumped togethersince these differences will affect performance and energy consumption.
Plant Data. Opportunities for combining central plants such as chiller and boiler plants rarely exist,since buildings typically contain one of each, if plants are used at all.
6.3 TROUBLESHOOTING STRATEGIES
This section describes general strategies used to investigate energy analysis results. These investigationsmay be necessary when diagnosing problems or simply learning more about results generated by theprogram. General strategies useful in a variety of situations will be described below.
1. Investigate Input and Output Data. When a question about results arises, generate and inspectprintouts of pertinent input and simulation data. Checking input printouts often reveals input errorswhich cause incorrect results. In addition, checking and comparing printouts of simulation data oftenreveals the reason for results, or provides clues to simulation problems, as discussed below.
Questions frequently arise about unusual building energy cost results. Energy costs are the final,bottom-line results of the energy analysis. Because costs are dependent on many factors, it isnecessary to generate details showing how the costs were calculated and intermediate resultsshowing the performance of air systems and plants contributing to building energy consumption.The strategy should be to work backward from the final results to determine how they were derived.This work can be performed in two stages. First, generate detailed building outputs. The followingbuilding simulation reports are often useful:
Energy Budget by System Component: When complex rate structures are used, operating costsare not proportional to energy use due to the demand, fixed and tax charge components of theenergy bill. Therefore, operating costs often do not present a clear picture of energy use by thebuilding. Comparing only the bottom line cost figures may obscure the energy performance of thebuilding. The Energy Budget by System Component report lists annual energy use totals incommon units (kBTU in English, kWh in Metric) and can be a better basis for comparison.
Monthly Energy Use By System Component: This report lists month by month energy use byboth system component and energy type. It provides more detailed information than the Energy
Chapter 6 Design Applications
6-4 HAP Quick Reference Guide
Budget report, listing energy use in billing units (e.g., kWh for electric, Therms for gas, etc..) foreach system component category. This makes it much easier to make direct comparisonsbetween buildings and identify key differences in energy performance.
Billing Details: These reports document the individual charges contributing to the total electricand fuel bills. The reports also list the monthly average price of energy, energy consumption totals,monthly demands and the time when each demand occurs. This data can be used to determine howthe utility bill was calculated, and to identify factors contributing to unusual results. For example,an unusual increase in costs may be due to a large peak demand in one month. This might focus theinvestigation on equipment performance during the particular month with the large demand.
If building reports do not reveal the cause of a problem, the second stage in the analysis is toinvestigate simulation results for the plants and air systems in the building. Two ways of doing thisare discussed below.
Monthly-Daily-Hourly Simulation Results. One approach is to first inspect the monthly report toidentify months with unusual results, then inspect the daily report for that month to focus on theindividual days with odd results, and finally inspect hourly reports for those days.
Hourly Graphics. An alternate approach is to generate hourly graphs for long sequences of time inorder to pinpoint portions of the year showing unusual behavior, and then generate graphs forshorter periods of time to investigate behavior in greater detail. For example, cooling coil loads forall 8,760 hours in the year can be included in one plot. This plot might show times of year whenunusually large or small cooling loads exist. The next step would be to generate graphs for theseshorter periods of time to understand this behavior.
Using these strategies, problems can be efficiently investigated and diagnosed.
2. Research Input Definitions and Calculation Procedures. In many cases, thorough knowledge ofhow the program uses inputs and performs its energy simulations is necessary to understand programresults. Material in the program's on-line help system provides this information. The operationsections of the on-line help system discuss program inputs and explain how inputs are used by theprogram. The documentation sections of the on-line help system explain calculation assumptions andprocedures.
3. Perform Comparative Analyses. In some cases, investigating input and output data, andresearching calculation procedures are not sufficient to diagnose problems with results. In thesesituations, various types of comparative analyses performed with the program can be helpful. Thesuccess of this technique depends on the user's ingenuity, knowledge of load, system and equipmentbehavior, and knowledge of the program. A common example of how comparative analysis can beused is provided below.
Example: Suppose unusual energy costs results are obtained and an investigation of program outputsshows that results are due to peculiar air system behavior. The air system in question usesdehumidification control, a preheat coil and an enthalpy economizer. Careful inspection of monthly,daily and hourly simulation results does not reveal a logical reason for the results.
Because it is possible behavior of one of the system components or unanticipated interaction betweencomponents is causing the results, a useful strategy is to run simulations for variations of the airsystem to try to identify how each component influences system performance. First make four copiesof the air system. One should represent a base case without dehumidification control, a preheat coilor an economizer. The other three copies should include one of the extra components each. Forexample, one system would include only the dehumidification control, one would include the preheatcoil, and one would include the economizer. Generate air system simulation reports for all foursystems and compare results. The comparison will clearly show the effect of each component onsystem behavior, and may allow you to determine the reason for the original results. If not, it may benecessary to run simulations for simple combinations of components such as the economizer anddehumidification control, dehumidification control and the preheat coil, etc... Inspection of resultsfor these simulations may reveal unanticipated interaction or conflicts between the components.
Energy Analysis Applications Chapter 6
HAP Quick Reference Guide 6-5
6.4 SIMULATING PACKAGED ROOFTOP UNITS
This section explains how to model packaged rooftop equipment in energy simulations. This equipmentcontains a supply fan, condenser fans, DX cooling apparatus and heating apparatus all in one packagedunit. Heating options are electric resistance, combustion, heat pump and, in unusual cases, hot water orsteam. Modeling procedures are described below.
1. Air Systems. Define one air system per rooftop unit. If the building contains multiple rooftopswhich are identical, serving identical or similar areas of the building, a single rooftop unit can bemodeled and a multiplier can be applied to account for the total number of these units. Modelingtips:
Specify the Equipment Class as "Packaged Rooftop Unit" Specify the appropriate system type and enter system data. Define the performance characteristics of the DX cooling equipment using the Equipment Tab on
the Air System window. If heat pump or combustion heating is used, define performance characteristics of the heating
equipment using the Equipment Tab on the Air System window. If electric heat is used, no additional heating equipment inputs are required.
2. Plants. It is not necessary to define a plant except in the unusual cases where a hot water or steamheating coil has been added to the rooftop unit. In these cases a hot water or steam plant must bedefined to serve these coils. The rooftop air system will be linked to this plant. If a heating plantserves multiple systems, a single heating plant can be defined and all systems can be linked to it.
3. Building. If electric, combustion or heat pump heating is used, the air system is linked directly to thebuilding. A multiplier can be used if the rooftop represents one of a group of identical units. If hotwater or steam heating is used, then both the heating plant and the rooftop air system must be linkedto the building.
6.5 SIMULATING VERTICAL PACKAGED UNITS
This section explains how to model vertical packaged (VPAC) equipment in energy simulations. The air-cooled version of this equipment contains a supply fan, condenser fans, DX cooling apparatus andheating apparatus all in one packaged indoor unit; in some cases a remote condenser is used. The water-cooled version of this equipment contains a supply fan, DX cooling apparatus and heating apparatus inone packaged indoor unit. The water cooled condenser is connected to a cooling tower. Heating optionsinclude electric resistance, combustion, hot water and steam. Modeling procedures are described below.
1. Air Systems. Define one air system per vertical packaged unit. If the building contains multipleVPACs which are identical, serving identical or similar areas of the building, a single VPAC unit canbe modeled and a multiplier can be applied to account for the total number of these units. Modelingtips:
Specify the Equipment Class as "Packaged Vertical Unit" Specify the appropriate system type and enter system data. Define the performance characteristics of the DX cooling equipment using the Equipment Tab on
the Air System window. For water-cooled units, a cooling tower must be defined and linked to the air system. This is
done using the "Miscellaneous Equipment" button on the Equipment Tab. If combustion heating is used, define performance characteristics of the heating equipment using
the Equipment Tab on the Air System window. If electric heat is used, no additional heating equipment inputs are required.
2. Plants. Plant equipment is not needed unless hot water or steam heating is used. In these cases a hotwater or steam plant must be defined and the VPAC air system is linked to this plant. If the heatingplant serves multiple air systems, a single heating plant can be defined and all air systems linked to it.
Chapter 6 Design Applications
6-6 HAP Quick Reference Guide
3. Building. If electric or combustion heating is used, the VPAC air system is linked directly to thebuilding. A multiplier can be used if the VPAC represents one of a group of identical units. If hotwater or steam heating is used, then both the heating plant and the VPAC air system must be linkedto the building.
6.6 SIMULATING SPLIT DX AIR HANDLING UNITS
This section explains how to model split DX air handling units in energy simulations. This equipmentincludes an indoor unit containing fans, a DX cooling coil and heating apparatus, plus an outdoorcondensing unit. Heating options include electric resistance, combustion, heat pump, hot water andsteam. Modeling procedures are described below.
1. Air Systems. Define one air system per split DX air handler. If the building contains multiple splitunits which are identical, serving identical or similar areas of the building, a single air handler can bemodeled and a multiplier can be applied to account for the total number of these units. Modelingtips:
Specify the Equipment Class as "Split DX AHU" Specify the appropriate system type and enter system data. Define the performance characteristics of the DX cooling equipment using the Equipment Tab on
the Air System window. If heat pump or combustion heating is used, define performance characteristics of the equipment
using the Equipment Tab on the Air System window. If electric heat is used, no additional heating equipment inputs are required.
2. Plants. Plant equipment is not needed unless hot water or steam heating is used. In these cases a hotwater or steam plant must be defined and the split DX air system is linked to this plant. If the heatingplant serves multiple air systems, a single heating plant can be defined and all the air systems linkedto it.
3. Building. If heat pump, combustion or electric heat is used, the split DX air handler is linkeddirectly to the building. A multiplier can be used if the split DX unit represents one of a group ofidentical units. If hot water or steam heating is used, then both the heating plant and the split DX airsystem must be linked to the building.
6.7 SIMULATING CHILLED WATER AIR HANDLING UNITS
This section explains how to model chilled water air handling units in energy simulations. Thisequipment includes fans, a chilled water cooling coil and heating apparatus in a packaged or built-upunit. Heating options include electric resistance, combustion, hot water and steam. Modeling proceduresare described below.
1. Air Systems. Define one air system per chilled water air handler. Typically these are larger systemswhich are unique. But in those situations where a building contains multiple chilled water AHUswhich are identical, serving identical or similar areas of the building, a single air handler can bedefined and a multiplier can be applied to account for the total number of these units. Modeling tips:
Specify the Equipment Class as "Chilled Water AHU" Specify the appropriate system type and enter system data. If combustion heating is used, define performance characteristics of the equipment using the
Equipment Tab on the Air System window. If hot water, steam or electric heat is used, no additional inputs on the Equipment Tab are
required.
Changeover Systems. If you are defining a 2-pipe changeover system, specify the type ofchangeover control using the Changeover Controller option on the Equipment Tab. Changeover canbe based on a monthly schedule or outdoor air temperature threshold. These settings affect allcooling components using chilled water, and all heating components using hot water.
Energy Analysis Applications Chapter 6
HAP Quick Reference Guide 6-7
When the monthly schedule option is selected, make sure to specify the appropriate on/off schedulesin the Central Cooling, Central Heating, Precool Coil and/or Preheat Coil sections of the SystemComponents tab, and the Supply Terminals and Zone Heating Units sections of the ZoneComponents tab. If the outdoor air temperature threshold option is selected, you can set all the coilschedules to ON for 12 months, unless there are also specific times of year when cooling or heatingis off, in which case the on/off schedules can also be set.
2. Plants. Define a chilled water plant to provide chilled water to the air handler cooling coils. Plantoptions include chiller plants and remote chilled water (also known as district cooling). Typicallythe chilled water plant will serve two or more air handlers. When defining the plant, link to all theair systems served by the plant. When a system represents one of a group of identical systems, amultiplier can be used when linking it to the plant.
If the AHUs are linked to a changeover plant with reversible chillers, define a changeover plant.
If hot water or steam heating is used, define a hot water or steam plant to provide heating to airhandler heating coils. Plant options include hot water plants (boilers or dedicated heat pumps), steamboiler plants and remote (district) heating. Typically the hot water or steam plant will serve two ormore air handlers. When defining the plant, link to all the air systems served by the plant. Amultiplier can be used if an air system represents one of a group of identical systems.
3. Building. Link the chilled water AHU air system as well as the cooling plant and the heating plant(if used) to the building.
6.8 SIMULATING PACKAGED OR SPLIT DX FAN COIL UNITS
This section explains how to model packaged or split DX fan coil units in energy simulations. Thisequipment includes Packaged Terminal Air Conditioners (PTACs), Packaged Terminal Heat Pumps(PTHPs), Variable Refrigerant Flow (VRF), DX unit ventilators, room air conditioners, split DX fancoils, ductless split units and other similar products. The packaged version of the equipment contains asupply fan, air-cooled DX cooling apparatus and heating apparatus in one packaged unit. The splitversion of the equipment contains a supply fan, DX cooling coil and heating apparatus in an indoor unitplus an outdoor condensing unit. Heating options include electric resistance, combustion, heat pump, hotwater and steam. Modeling procedures are described below.
1. Air Systems. Define one air system for the entire collection of DX fan coil units. HAP will modeleach zone in the system as containing one fan coil unit. Loads for each zone and the performance ofeach zone's fan coil unit will be performed separately. Loads and energy use are then summed toobtain system totals which are displayed on the simulation reports. Modeling tips:
Specify the Equipment Class as "Terminal Units" Specify the System Type as "Packaged DX Fan Coil", "Split DX Fan Coil" or "Variable
Refrigerant Flow" and enter system data. Define performance characteristics of the DX cooling equipment using the Equipment Tab on the
Air System window. Be sure to define performance data for all zone fan coils. If heat pump or combustion heating is used, define performance characteristics of the equipment
using the Equipment Tab on the Air System window. Again, be sure to define performance forall zones.
If electric heat is used, no additional heating equipment inputs are required. If the number of fan coil units exceeds the number of zones permitted in a system, then an
additional system will be required to accommodate the extra fan coils.
2. Plants. If heat pump, combustion or electric heat is used then no plant equipment is required. If hotwater or steam heating is used, a hot water or steam plant must be defined and must link to the fancoil air system. If the heating plant serves multiple air systems, a single plant can be defined andlinked to all air systems containing hot water or steam coils.
3. Building. If electric resistance, heat pump or combustion heating is used, link the air system directlyto the building. If hot water or steam heating is used, link both the system and the plant to thebuilding.
Chapter 6 Design Applications
6-8 HAP Quick Reference Guide
Note: Fan coil systems are good candidates for the reduction techniques discussed in section 6.2.However, if you use these techniques to reduce input and calculation time, planning is required toaccount for the correct number of fan coil units in the building.
Example: A hotel is being studied which has 75 identical fan coil zones on the south face of the building,62 identical fan coil zones on the north face of the building and 48 fan coil zones which are unique. Inthis situation it may be best to define three air systems. System #1 would contain 48 zones holding the48 fan coil units that are unique. System #2 would contain only one zone representing the typical south-facing zone. System #3 would contain only one zone representing the typical north-facing zone. Whenlinking systems to the building a system multiplier of 1 would be used for system #1, a multiplier of 75would be used for system #2 and a multiplier of 62 would be used for system #3. This is necessarybecause multipliers are applied at the system level when linking systems to plants and buildings.
An alternate approach is to lump identical fan coils together rather than defining a single typical unit foreach. This means that the 75 south facing fan coil zones would be combined, using a space multiplier of75. The cooling and heating equipment inputs would define full load capacity and input power valuesthat are the sum of the 75 fan coil capacities and input powers rather than the actual capacity and powerfor one representative unit. This approach would allow the typical north and typical south zones to beincluded in System #1 with the 48 unique zones while still correctly accounting for the total loads andenergy use of these fan coil units.
6.9 SIMULATING HYDRONIC FAN COIL UNITS
This section explains how to model hydronic fan coil units in energy simulations. This equipmentcontains a supply fan, a chilled water coil and a heating coil in one packaged indoor unit. Heatingoptions include hot water, steam and electric resistance. Modeling procedures are described below.
1. Air Systems. Define one air system for the entire collection of hydronic fan coils. HAP will modeleach zone in the system as containing one fan coil unit. Loads for each zone and the performance ofeach zone's fan coil unit will be performed separately. Loads and energy use are then summed toobtain system totals which are displayed on the simulation reports. Modeling tips:
Specify the Equipment Class as "Terminal Units" Specify the System Type as "2-Pipe Fan Coil" or "4-Pipe Fan Coil" and enter system data. If hot water, steam or electric heat is used, no additional inputs are required on the Equipment
Tab. If the number of fan coil units exceeds the number of zones permitted in a system, then an
additional system will be required to accommodate the extra fan coils.
For 2-Pipe Fan Coil Changeover systems, specify the type of changeover control using theChangeover Controller option on the Equipment tab. Changeover can be based on a monthlyschedule or outdoor air temperature threshold.
When the monthly schedule option is selected, make sure to specify the appropriate on/off schedulesin the Common Data section of the Zone Components tab, and in the Cooling Coil and Heating Coilsections of the DOAS Components tab if a dedicated outdoor air system (DOAS) is used. If theoutdoor air temperature threshold option is selected, you can set all the coil schedules to ON for 12months, unless there are also specific times of year when cooling or heating is off, in which case theon/off schedules can also be set.
2. Plants. Define a chilled water plant to provide chilled water to the fan coil units. Plant optionsinclude chiller plants and remote chilled water (district cooling).
If the fan coils are linked to a changeover plant with reversible chillers, define a changeover plant.
If hot water or steam heating is used, define a hot water or steam plant to provide heat to fan coilsystem heating coils. Plant options include hot water plants (boilers or dedicated heat pumps), steamboiler plants and remote (district) heating.
Energy Analysis Applications Chapter 6
HAP Quick Reference Guide 6-9
If electric resistance heating is used then no heating plant is required; electric heat energy use will beincluded in the air system calculations.
3. Building. Link the hydronic fan coil system as well as the cooling plant and the heating plant (ifused) to the building.
Note: Fan coil systems are good candidates for the reduction techniques discussed in section 6.2. Pleaserefer to the note at the end of section 6.8 for a discussion of special considerations when reducing thenumber of fan coil units modeled.
6.10 SIMULATING INDUCTION BEAM AND ACTIVE CHILLED BEAM SYSTEMS
This topic explains how to model induction beam and active chilled beam systems in energy simulations.These systems consist of a dedicated outdoor air system (DOAS) which provides cooled anddehumidified air to ceiling-mounted induction terminals in each conditioned zone. Induction beams aretotal cooling devices which include a drain pan and therefore can serve both sensible and latent loads inthe zone. Active chilled beams are sensible-only cooling devices which can only serve the zone sensibleload. Both types of terminals can also provide heating. Modeling procedures are described below.
1. Air Systems. Define one air system representing the DOAS system and all the induction beam (IB) oractive chilled beam (ACB) terminals it serves. HAP will model each zone in the system as containingIB or ACB terminal. Loads for each zone and the performance of each zone's IB or ACB terminalwill be performed separately. Loads are then summed to obtain system totals which are displayed onthe simulation reports. Modeling tips:
a. Specify the Equipment Class as "Terminal Units"
b. Specify the System Type as "Induction Beam" or "Active Chilled Beam" and enter system data.
c. If the system is a 2-pipe cooling and heating system, specify the type of changeover control usingthe Changeover Controller option on the Equipment tab. Changeover can be based on a monthlyschedule or outdoor air temperature threshold.
When the monthly schedule option is selected, make sure to specify the appropriate on/offschedules in the Common Data section of the Zone Components tab, and in the Cooling Coil andHeating Coil sections of the DOAS Components tab if a dedicated outdoor air system (DOAS) isused. If the outdoor air temperature threshold option is selected, you can set all the coilschedules to ON for 12 months, unless there are also specific times of year when cooling orheating is off, in which case the on/off schedules can also be set.
d. If the number of IB or ACB terminals exceeds the number of zones permitted in a system, thenan additional system will be required to accommodate the extra zones.
2. Plants.
a. For applications using separate cooling and heating plants, first define a chiller plant or a remotechilled water (district cooling) plant to provide chilled water to system cooling coils. Thendefine a hot water plant or remote hot water plant to provide hot water to system heating coils.
b. For 2-pipe changeover applications using reversible chillers, define a changeover plant to provideboth chilled water and hot water to coils in the system.
Typically these plants will serve two or more air systems. When defining the plant, link to all theair systems served by the plant. When a system represents one of a group of identical systems, amultiplier can be used when linking it to the plant.
3. Building. Link the chilled water and hot water plants, or the changeover plant to the building.
Chapter 6 Design Applications
6-10 HAP Quick Reference Guide
6.11 SIMULATING WATER SOURCE HEAT PUMP SYSTEMS
This section explains how to model water source heat pump (WSHP) systems in energy simulations.These systems consist of a number of heat pump units connected to a common water loop. Heat isrejected from the loop through a cooling tower and heat is added by a hot water boiler. Modelingprocedures are described below.
1. Air Systems. Define one air system for the entire collection of WSHP units. HAP will model eachzone in the system as containing one WSHP unit. Loads for each zone and the performance of eachzone's WSHP will be performed separately. Interaction of the WSHP units via the common waterloop will also be analyzed. Loads and energy use for the individual WSHP units are then summed toobtain system totals which are displayed on the simulation reports. Modeling tips:
Specify the Equipment Class as "Terminal Units" Specify the System Type as "Water Source Heat Pumps" and enter system data. Define performance characteristics of the WSHP units for both cooling duty and heating duty
using the Equipment Tab on the Air System window. Be sure to define performance data for allWSHP units.
Also enter system information using the "Miscellaneous Equipment" button on the Equipmenttab to define the cooling tower and boiler used and the loop setpoints.
When a dedicated outdoor air system (DOAS) unit is used, it can be designated as a WSHP unit,or as an Air-Cooled DX unit. When used, performance of the cooling and heating apparatus inthe DOAS unit must be defined using the Vent Cooling and Vent Heating buttons on theEquipment tab.
If the number of WSHP units exceeds the number of zones permitted in a system, then anadditional system will be required to accommodate the extra WSHP units.
2. Plants. No plant needs to be defined for this type of equipment. All equipment energy use isaccounted for in air system calculations.
3. Building. Link the WSHP air system to the building.
Note: WSHP systems are good candidates for the reduction techniques discussed in section 6.2.However, because all WSHP units in a single system are connected to a common loop, it is important touse a "lumping" technique to reduce the number of WSHP units modeled rather than modeling single"typical" units.
Example: A hotel is being studied which has 30 identical WSHP zones on the south face of the building,25 identical WSHP zones on the north face of the building and 28 WSHP zones which are unique. In thissituation it may be best to still define one air system so all 83 heat pump units can be connected to acommon water loop. The first 28 zones in the system could represent the WSHP zones which are unique.Zone 29 would represent a combination of the 30 identical WSHP units in south facing rooms. Thismeans the full load capacity and input power for this WSHP unit would be the sum for the 30 identicalunits. Also, the space multiplier for this zone would be 30. Finally, zone 30 would represent acombination of the 25 identical WSHP units in north facing rooms. Its space multiplier would be 25.
If the alternate approach of defining one typical south room WSHP and one typical north room WSHPhad been used, these two WSHP units would have to be put into separate air systems so the total numberof WSHP units in the building could be accounted for using system multipliers when linking to thebuilding. But placing the WSHP units in separate systems disconnects them from the common waterloop used by the 28 unique WSHP units which invalidates the system analysis for the water loop.Therefore modeling single "typical" units is not valid approach for analyzing WSHP loop systems.
6.12 SIMULATING GROUND WATER AND GROUND SOURCE HEAT PUMP SYSTEMS
This section explains how to model ground water source heat pump (GWSHP) and Ground Source HeatPump (GSHP) systems in energy simulations. These systems consist of a number of heat pump unitsconnected to a water loop. In a GWSHP system source water is drawn from a well, river or lake. In aGSHP system the heat source/sink is a vertical borehole well or a horizontal buried heat exchanger.
Energy Analysis Applications Chapter 6
HAP Quick Reference Guide 6-11
The modeling procedures for these types of equipment are nearly identical to those described in section6.11. The exception is that instead of modeling a cooling tower and auxiliary boiler, the heat source/sinkis modeled using the "river / sea / well water" option in which average source water temperatures aredefined for each month of the year. Auxiliary heat is assumed to be electric.
6.13 SIMULATING CHILLED WATER PLANTS
This section explains how to model chilled water plants in energy simulations. The program simulatesthree types of chilled water plants:
In a chiller plant, a group of one or more chillers operate to provide chilled water to cooling coils inone or more air handling unit or fan coil systems.
In a changeover plant, reversible air-to-water (A2W) or water-to-water (W2W) chillers providechilled water and hot water to 2-pipe coils in air handlers or fan coils.
In a remote chilled water system, chilled water is supplied to air systems from an external source,such as a district cooling system.
Modeling procedures are described below.
1. Air Systems. Define one or more air systems containing chilled water cooling coils using theprocedures described in the previous sections.
2. Plants. Define a chilled water or changeover plant serving these air systems. Modeling tips:
Specify the Plant Type as "Chiller Plant", "Changeover Plant" or "Remote Chilled Water". Chillers and cooling towers (if used) can be created while you are entering the plant via the
"create new..." options or can be defined prior to entering data for a chiller plant. If steam absorption chillers are used, users have a choice of modeling a boiler to generate steam
for the chillers, or using steam from a remote source such as waste steam. When using a boiler, itcan be created while you are entering the plant via the "create new boiler" option or it can bedefined prior to entering data for the chiller plant.
Use the Systems tab in the Plant window to link the plant to the set of air systems in the buildingwhich use chilled water cooling coils. The plant will serve the combined load of all these coolingcoils. A changeover plant will also serve the hot water coil loads for these systems.
For chiller plants and changeover plants, use the Configuration tab in the Plant window to definethe configuration and control of the plant. Use the Schedule of Equipment tab to link thenecessary chillers, cooling towers and boilers to the plant.
For any of the plant types use the Distribution Tab to define characteristics of the waterdistribution system and its pumps.
If you define a chiller or a remote chilled water plant, you will need to define a separate hotwater or steam plant if heating is provided from those sources. If you define a changeover plant,then that single plant will provide for both the cooling and heating needs of the air systems.
If reversible chillers are used, it may be necessary to provide a source of auxiliary heat. Optionsfor describing and controlling auxiliary heat are provided on the Configuration tab. The sourceof auxiliary heat is specified on the Schedule of Equipment tab and can be a hot water boiler orremote source hot water.
3. Building. Link the chilled water plant to the building. This will include its energy use in energycost calculations.
6.14 SIMULATING HOT WATER AND STEAM PLANTS
This section explains how to model hot water and steam plants in energy simulations. The programsimulates four types of heating plants:
In a Hot Water plant, boilers, air-to-water (A2W) or water-to-water (W2W) heat pumps or acombination of these equipment types provide hot water to one or more air handling unit or fan coilsystems.
Chapter 6 Design Applications
6-12 HAP Quick Reference Guide
In a Remote Hot Water plant, hot water is supplied to air system coils from an external source, such adistrict heating system.
In a Steam Boiler plant, steam boilers supply steam to coils in one or more air systems. In a Remote Steam plant, steam is supplied to air system coils from an external source, such as a
district steam system.
Modeling procedures are described below.
1. Air Systems. Define one or more air systems containing hot water or steam heating coils using theprocedures described in the previous sections.
2. Plants. Define a hot water plant or a steam plant serving these air systems. Modeling tips:
For hot water, specify the Plant Type as "Hot Water Plant" or "Remote Hot Water". For steam, specify the Plant Type as "Steam Boiler Plant" or "Remote Steam". Boilers and A2W or W2W heat pumps can be defined at the same time you create the plant using
the "create new ..." option in the equipment drop-down list, or can be defined prior to enteringthe plant.
Use the Systems tab in the Plant window to link the plant to the set of air systems in the buildingwhich use hot water heating coils or steam coils. The plant will serve the combined load of allthese heating coils. A changeover plant will also supply the combined chilled water coil loadsfor these systems.
Use the Configuration tab in the Plant window to define the number of boilers or heat pumps inthe plant, the method of control and, for hot water plants, the method of hot water supplytemperature control.
For hot water plants use the Distribution tab to define characteristics of the hot water distributionsystem and its pumps.
For steam plants use the Distribution tab to define the pipe heat loss factor. If heat pumps are used, it may be necessary to provide a source of auxiliary heat. Options for
defining and controlling auxiliary heat are provided on the Configuration tab. The source ofauxiliary heat is specified on the Schedule of Equipment tab and can be a hot water boiler orremote source hot water.
3. Building. Link the heating plant to the building. This will include its energy use in energy costcalculations.
6.15 SIMULATING HEAT RECOVERY PLANTS
This section explains how to model heat recovery plants in energy simulations. The program heatrecovery plants using six types of heat recovery schemes:
Dedicated heat recovery chiller in parallel with cooling-only chillers. Air-cooled chillers with water-cooled heat recovery condenser. Heat exchanger in condenser water loop. Dedicated heat recovery chiller in condenser loop. Air-cooled or water-cooled chillers with desuperheaters Double-bundle chillers.
Modeling procedures are described below.
1. Air Systems. Define one or more air systems containing chilled water cooling coils and/or hot waterheating coils using the procedures described in the previous sections.
2. Plants. Define a “heat recovery plant” serving these air systems. A “heat recovery plant” is aspecial type of plant in HAP which combines all of the equipment of a chilled water plant, a hotwater plant and the heat recovery plant into one. Modeling tips:
Specify Plant Type as “Heat Recovery Plant” pm the General Tab in the Plant Propertieswindow.
Use the Systems tab in the Plant window to link the plant to the set of air systems which usechilled water cooling and/or hot water cooling coils.
Energy Analysis Applications Chapter 6
HAP Quick Reference Guide 6-13
Use the Service Hot Water tab to define service water heating loads and equipment if applicable. Use the Configuration tab to define the number of chillers and boilers in the plant, the methods
of control and, the type of heat recovery used. On the Schedule of Equipment tab choose or create the chillers, boilers and heat recovery units
included in the plant. When linking heat recovery equipment, it must match the type of heatrecovery specified. For example, if you specified “Double-Bundle Chiller” heat recovery, then atleast one of the chillers selected or created must specify that double bundle heat recovery ispresent.
On the Distribution tab, specify the configurations for the chilled water and hot waterdistribution loops and the performance of the pumps.
On the Source Water tab specify the configuration, controls and performance of pumps in thecondenser water loop.
3. Building. Link the heat recovery plant to the building. This will include its energy use in energycost calculations.
6.16 MODELING UTILITY RATE STRUCTURES
This section explains how to use the program to model utility rate structures in energy simulations. Theterm "utility rate" refers to the pricing structure a utility uses when billing for electric energy use or fueluse in a building. Utility rate data is used by HAP when calculating energy costs. HAP deals with twodistinct types of utility rates:
Electric Rates define pricing structures for electric energy use and demand.
Fuel Rates define the pricing structures for natural gas, fuel oil, propane, remote chilled water,remote hot water and remote steam.
While data is defined in the program in two separate data categories (one for electric and one for fuel),both types of utility rates use the same terminology and input items and the same application concepts.The following discussions will use electric rates for examples, but the concepts apply equal to electricand fuel rates.
6.16.1 Basic Concepts
Individual utility companies charge for energy use, fuel use and demand in widely different ways and usevastly different terminology in stating their pricing structures. This presents a challenge for developingone consistent approach to modeling utility rate structures in the program. HAP uses a modular approachto meet this challenge. The program provides building blocks representing the common billingmechanisms for energy, demand, demand determination and miscellaneous charges. The user is able topick and choose among these building blocks to assemble a utility rate model that best represents thepricing structure used for their building.
The key elements in successfully using the utility rate modeling features in HAP are:
1. Recognizing the separate billing mechanisms used in your utility rate structure and matching them tothe corresponding building blocks offered by HAP.
2. Understanding the common terminology used by HAP and relating this to the specific terminologyused by your utility company.
The following subsections discuss terminology and building blocks involved with the three commoncomponents of a commercial building utility bill: energy or fuel charges, demand charges, demanddetermination. Each subsection below will define terms, provide examples of the common billingmechanisms and show examples of how data would be input in HAP. Further information on thesesubjects can be found in the program's on-line help system in the sections dealing with utility rate inputsand energy cost calculations.
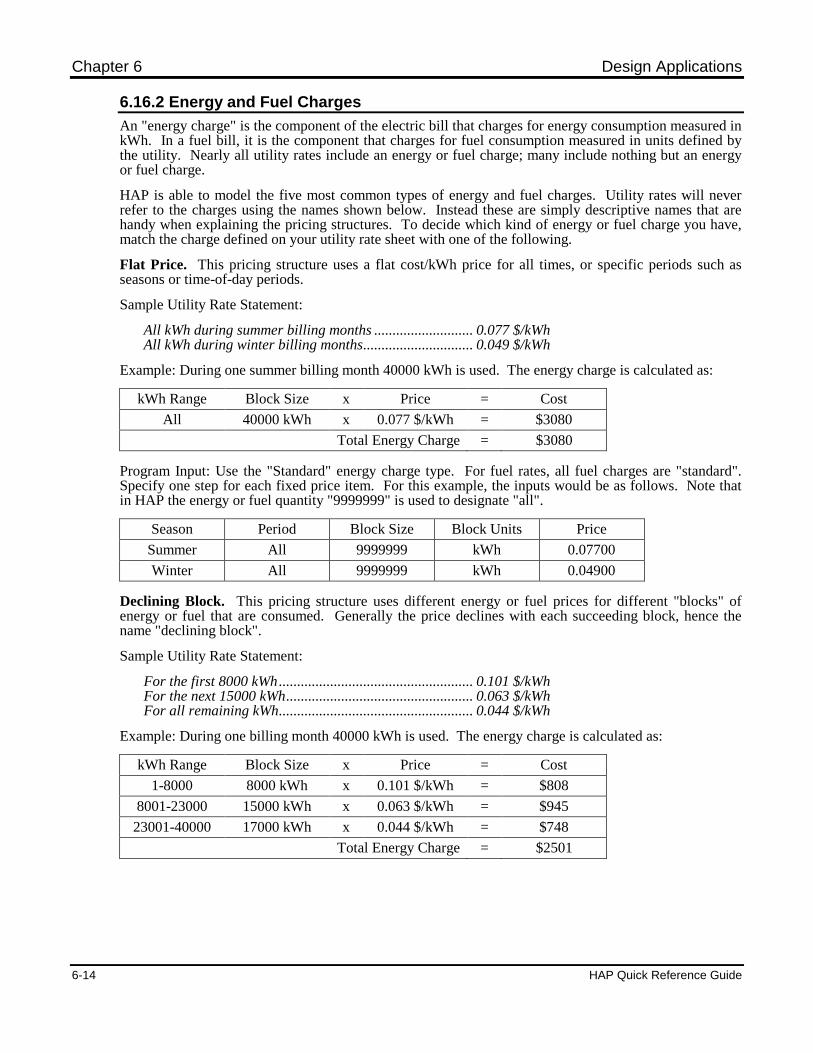
Chapter 6 Design Applications
6-14 HAP Quick Reference Guide
6.16.2 Energy and Fuel Charges
An "energy charge" is the component of the electric bill that charges for energy consumption measured inkWh. In a fuel bill, it is the component that charges for fuel consumption measured in units defined bythe utility. Nearly all utility rates include an energy or fuel charge; many include nothing but an energyor fuel charge.
HAP is able to model the five most common types of energy and fuel charges. Utility rates will neverrefer to the charges using the names shown below. Instead these are simply descriptive names that arehandy when explaining the pricing structures. To decide which kind of energy or fuel charge you have,match the charge defined on your utility rate sheet with one of the following.
Flat Price. This pricing structure uses a flat cost/kWh price for all times, or specific periods such asseasons or time-of-day periods.
Sample Utility Rate Statement:
All kWh during summer billing months ........................... 0.077 $/kWhAll kWh during winter billing months.............................. 0.049 $/kWh
Example: During one summer billing month 40000 kWh is used. The energy charge is calculated as:
kWh Range Block Size x Price = Cost
All 40000 kWh x 0.077 $/kWh = $3080
Total Energy Charge = $3080
Program Input: Use the "Standard" energy charge type. For fuel rates, all fuel charges are "standard".Specify one step for each fixed price item. For this example, the inputs would be as follows. Note thatin HAP the energy or fuel quantity "9999999" is used to designate "all".
Season Period Block Size Block Units Price
Summer All 9999999 kWh 0.07700
Winter All 9999999 kWh 0.04900
Declining Block. This pricing structure uses different energy or fuel prices for different "blocks" ofenergy or fuel that are consumed. Generally the price declines with each succeeding block, hence thename "declining block".
Sample Utility Rate Statement:
For the first 8000 kWh..................................................... 0.101 $/kWhFor the next 15000 kWh................................................... 0.063 $/kWhFor all remaining kWh..................................................... 0.044 $/kWh
Example: During one billing month 40000 kWh is used. The energy charge is calculated as:
kWh Range Block Size x Price = Cost
1-8000 8000 kWh x 0.101 $/kWh = $808
8001-23000 15000 kWh x 0.063 $/kWh = $945
23001-40000 17000 kWh x 0.044 $/kWh = $748
Total Energy Charge = $2501
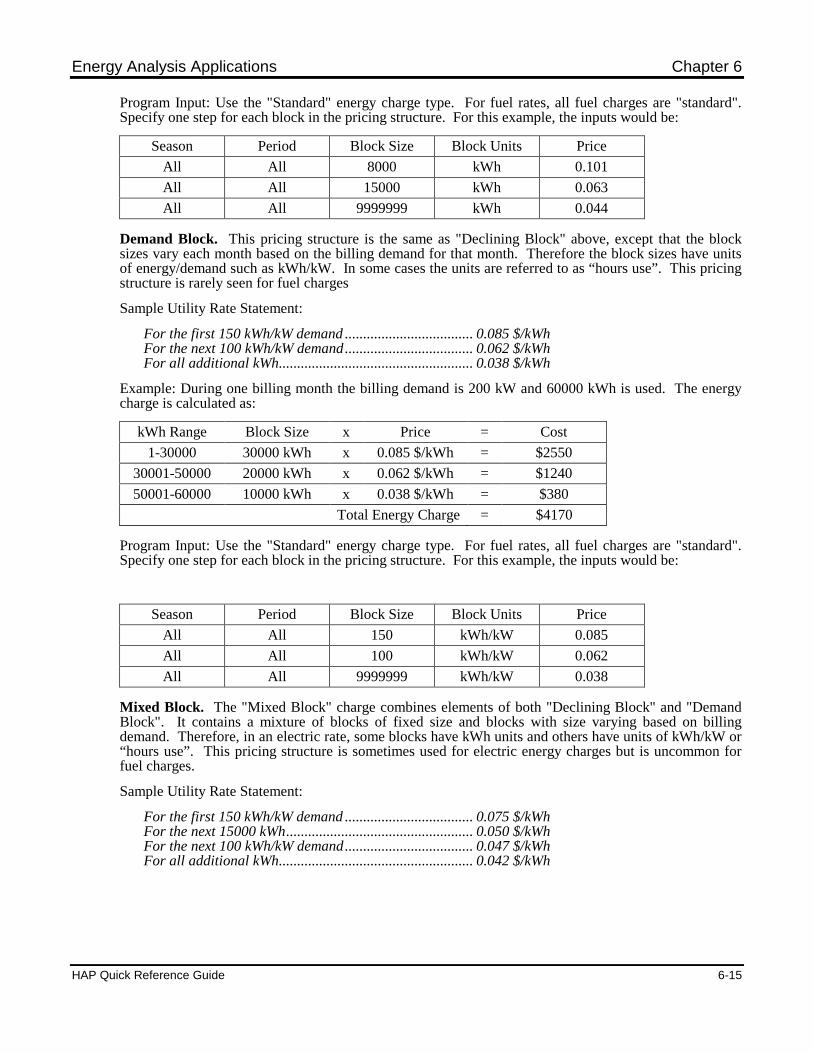
Energy Analysis Applications Chapter 6
HAP Quick Reference Guide 6-15
Program Input: Use the "Standard" energy charge type. For fuel rates, all fuel charges are "standard".Specify one step for each block in the pricing structure. For this example, the inputs would be:
Season Period Block Size Block Units Price
All All 8000 kWh 0.101
All All 15000 kWh 0.063
All All 9999999 kWh 0.044
Demand Block. This pricing structure is the same as "Declining Block" above, except that the blocksizes vary each month based on the billing demand for that month. Therefore the block sizes have unitsof energy/demand such as kWh/kW. In some cases the units are referred to as “hours use”. This pricingstructure is rarely seen for fuel charges
Sample Utility Rate Statement:
For the first 150 kWh/kW demand ................................... 0.085 $/kWhFor the next 100 kWh/kW demand................................... 0.062 $/kWhFor all additional kWh..................................................... 0.038 $/kWh
Example: During one billing month the billing demand is 200 kW and 60000 kWh is used. The energycharge is calculated as:
kWh Range Block Size x Price = Cost
1-30000 30000 kWh x 0.085 $/kWh = $2550
30001-50000 20000 kWh x 0.062 $/kWh = $1240
50001-60000 10000 kWh x 0.038 $/kWh = $380
Total Energy Charge = $4170
Program Input: Use the "Standard" energy charge type. For fuel rates, all fuel charges are "standard".Specify one step for each block in the pricing structure. For this example, the inputs would be:
Season Period Block Size Block Units Price
All All 150 kWh/kW 0.085
All All 100 kWh/kW 0.062
All All 9999999 kWh/kW 0.038
Mixed Block. The "Mixed Block" charge combines elements of both "Declining Block" and "DemandBlock". It contains a mixture of blocks of fixed size and blocks with size varying based on billingdemand. Therefore, in an electric rate, some blocks have kWh units and others have units of kWh/kW or“hours use”. This pricing structure is sometimes used for electric energy charges but is uncommon forfuel charges.
Sample Utility Rate Statement:
For the first 150 kWh/kW demand ................................... 0.075 $/kWhFor the next 15000 kWh................................................... 0.050 $/kWhFor the next 100 kWh/kW demand................................... 0.047 $/kWhFor all additional kWh..................................................... 0.042 $/kWh
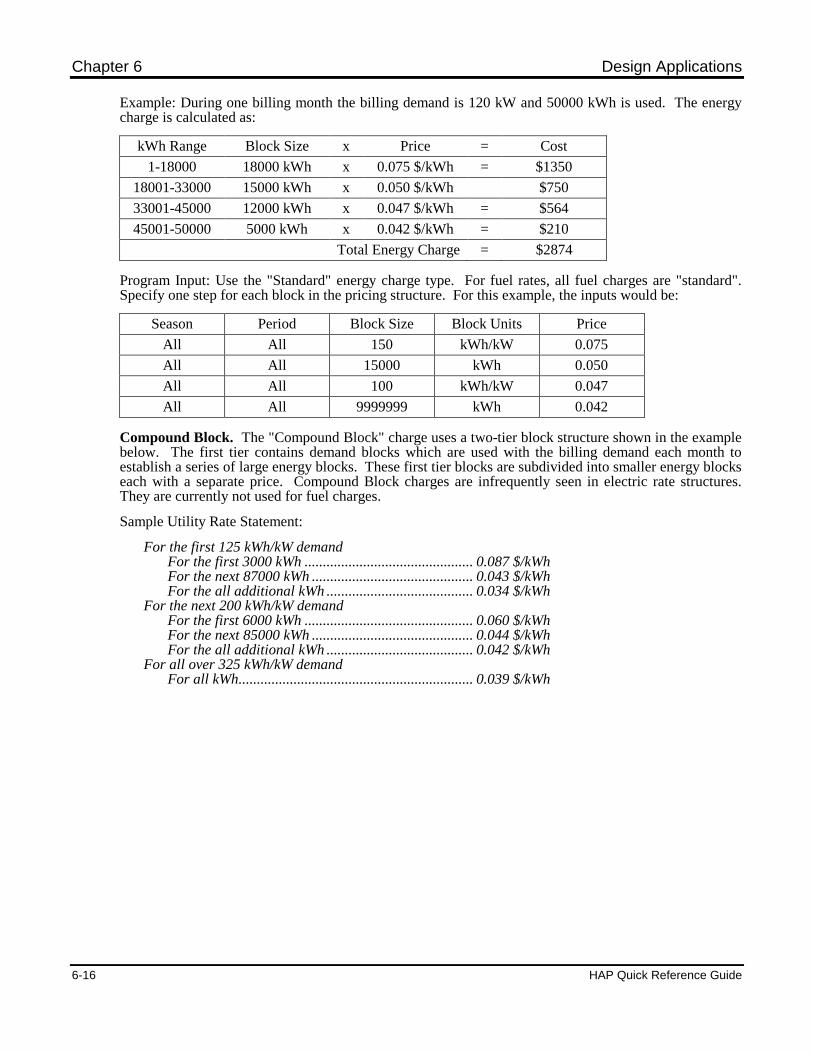
Chapter 6 Design Applications
6-16 HAP Quick Reference Guide
Example: During one billing month the billing demand is 120 kW and 50000 kWh is used. The energycharge is calculated as:
kWh Range Block Size x Price = Cost
1-18000 18000 kWh x 0.075 $/kWh = $1350
18001-33000 15000 kWh x 0.050 $/kWh $750
33001-45000 12000 kWh x 0.047 $/kWh = $564
45001-50000 5000 kWh x 0.042 $/kWh = $210
Total Energy Charge = $2874
Program Input: Use the "Standard" energy charge type. For fuel rates, all fuel charges are "standard".Specify one step for each block in the pricing structure. For this example, the inputs would be:
Season Period Block Size Block Units Price
All All 150 kWh/kW 0.075
All All 15000 kWh 0.050
All All 100 kWh/kW 0.047
All All 9999999 kWh 0.042
Compound Block. The "Compound Block" charge uses a two-tier block structure shown in the examplebelow. The first tier contains demand blocks which are used with the billing demand each month toestablish a series of large energy blocks. These first tier blocks are subdivided into smaller energy blockseach with a separate price. Compound Block charges are infrequently seen in electric rate structures.They are currently not used for fuel charges.
Sample Utility Rate Statement:
For the first 125 kWh/kW demandFor the first 3000 kWh .............................................. 0.087 $/kWhFor the next 87000 kWh ............................................ 0.043 $/kWhFor the all additional kWh ........................................ 0.034 $/kWh
For the next 200 kWh/kW demandFor the first 6000 kWh .............................................. 0.060 $/kWhFor the next 85000 kWh ............................................ 0.044 $/kWhFor the all additional kWh ........................................ 0.042 $/kWh
For all over 325 kWh/kW demandFor all kWh................................................................ 0.039 $/kWh
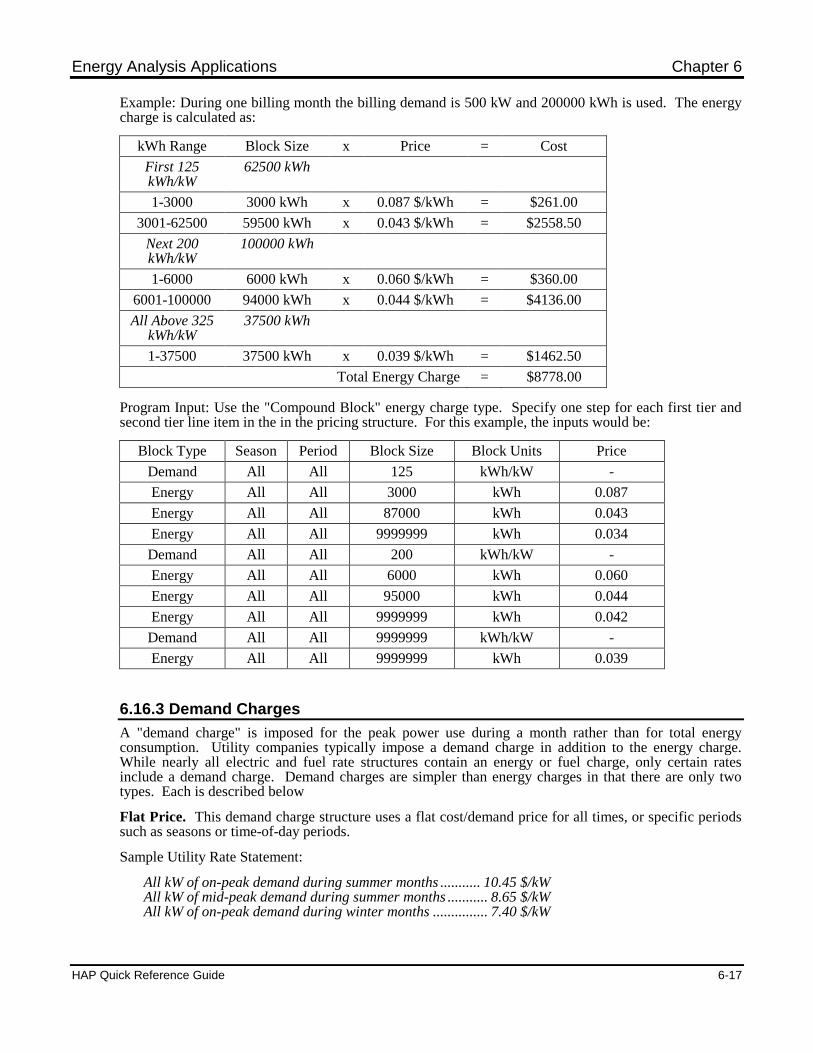
Energy Analysis Applications Chapter 6
HAP Quick Reference Guide 6-17
Example: During one billing month the billing demand is 500 kW and 200000 kWh is used. The energycharge is calculated as:
kWh Range Block Size x Price = Cost
First 125kWh/kW
62500 kWh
1-3000 3000 kWh x 0.087 $/kWh = $261.00
3001-62500 59500 kWh x 0.043 $/kWh = $2558.50
Next 200kWh/kW
100000 kWh
1-6000 6000 kWh x 0.060 $/kWh = $360.00
6001-100000 94000 kWh x 0.044 $/kWh = $4136.00
All Above 325kWh/kW
37500 kWh
1-37500 37500 kWh x 0.039 $/kWh = $1462.50
Total Energy Charge = $8778.00
Program Input: Use the "Compound Block" energy charge type. Specify one step for each first tier andsecond tier line item in the in the pricing structure. For this example, the inputs would be:
Block Type Season Period Block Size Block Units Price
Demand All All 125 kWh/kW -
Energy All All 3000 kWh 0.087
Energy All All 87000 kWh 0.043
Energy All All 9999999 kWh 0.034
Demand All All 200 kWh/kW -
Energy All All 6000 kWh 0.060
Energy All All 95000 kWh 0.044
Energy All All 9999999 kWh 0.042
Demand All All 9999999 kWh/kW -
Energy All All 9999999 kWh 0.039
6.16.3 Demand Charges
A "demand charge" is imposed for the peak power use during a month rather than for total energyconsumption. Utility companies typically impose a demand charge in addition to the energy charge.While nearly all electric and fuel rate structures contain an energy or fuel charge, only certain ratesinclude a demand charge. Demand charges are simpler than energy charges in that there are only twotypes. Each is described below
Flat Price. This demand charge structure uses a flat cost/demand price for all times, or specific periodssuch as seasons or time-of-day periods.
Sample Utility Rate Statement:
All kW of on-peak demand during summer months ........... 10.45 $/kWAll kW of mid-peak demand during summer months ........... 8.65 $/kWAll kW of on-peak demand during winter months ............... 7.40 $/kW
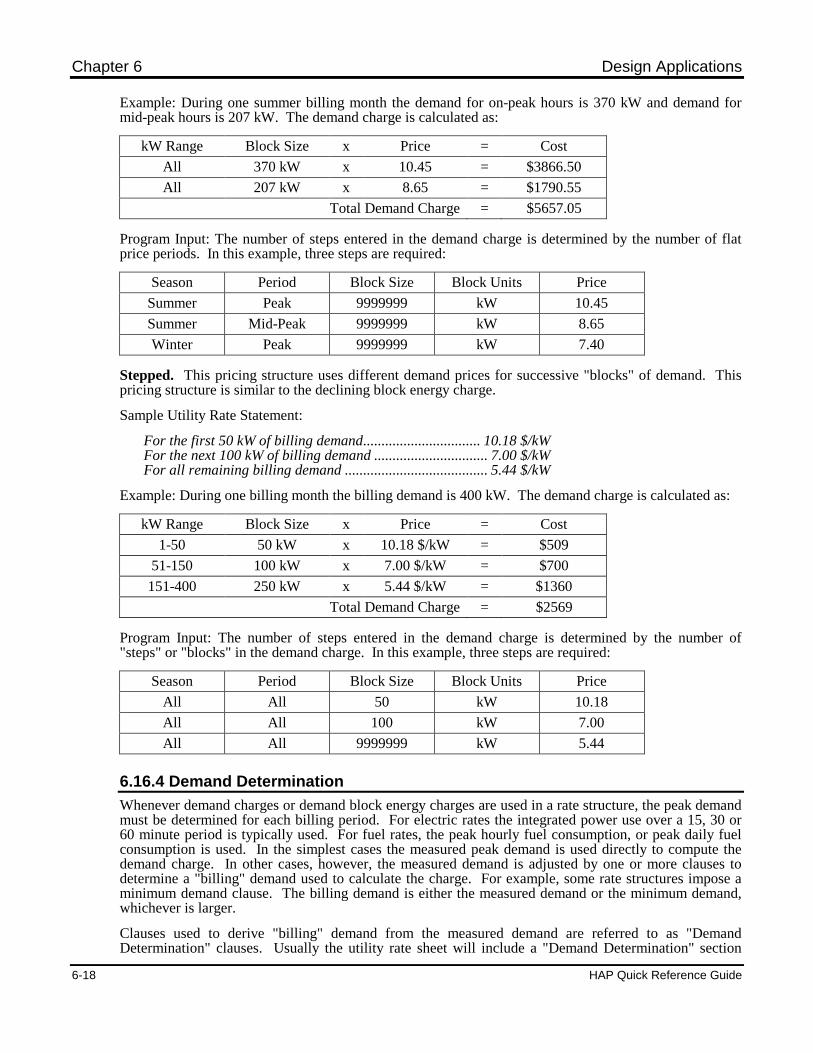
Chapter 6 Design Applications
6-18 HAP Quick Reference Guide
Example: During one summer billing month the demand for on-peak hours is 370 kW and demand formid-peak hours is 207 kW. The demand charge is calculated as:
kW Range Block Size x Price = Cost
All 370 kW x 10.45 = $3866.50
All 207 kW x 8.65 = $1790.55
Total Demand Charge = $5657.05
Program Input: The number of steps entered in the demand charge is determined by the number of flatprice periods. In this example, three steps are required:
Season Period Block Size Block Units Price
Summer Peak 9999999 kW 10.45
Summer Mid-Peak 9999999 kW 8.65
Winter Peak 9999999 kW 7.40
Stepped. This pricing structure uses different demand prices for successive "blocks" of demand. Thispricing structure is similar to the declining block energy charge.
Sample Utility Rate Statement:
For the first 50 kW of billing demand................................ 10.18 $/kWFor the next 100 kW of billing demand ............................... 7.00 $/kWFor all remaining billing demand ....................................... 5.44 $/kW
Example: During one billing month the billing demand is 400 kW. The demand charge is calculated as:
kW Range Block Size x Price = Cost
1-50 50 kW x 10.18 $/kW = $509
51-150 100 kW x 7.00 $/kW = $700
151-400 250 kW x 5.44 $/kW = $1360
Total Demand Charge = $2569
Program Input: The number of steps entered in the demand charge is determined by the number of"steps" or "blocks" in the demand charge. In this example, three steps are required:
Season Period Block Size Block Units Price
All All 50 kW 10.18
All All 100 kW 7.00
All All 9999999 kW 5.44
6.16.4 Demand Determination
Whenever demand charges or demand block energy charges are used in a rate structure, the peak demandmust be determined for each billing period. For electric rates the integrated power use over a 15, 30 or60 minute period is typically used. For fuel rates, the peak hourly fuel consumption, or peak daily fuelconsumption is used. In the simplest cases the measured peak demand is used directly to compute thedemand charge. In other cases, however, the measured demand is adjusted by one or more clauses todetermine a "billing" demand used to calculate the charge. For example, some rate structures impose aminimum demand clause. The billing demand is either the measured demand or the minimum demand,whichever is larger.
Clauses used to derive "billing" demand from the measured demand are referred to as "DemandDetermination" clauses. Usually the utility rate sheet will include a "Demand Determination" section
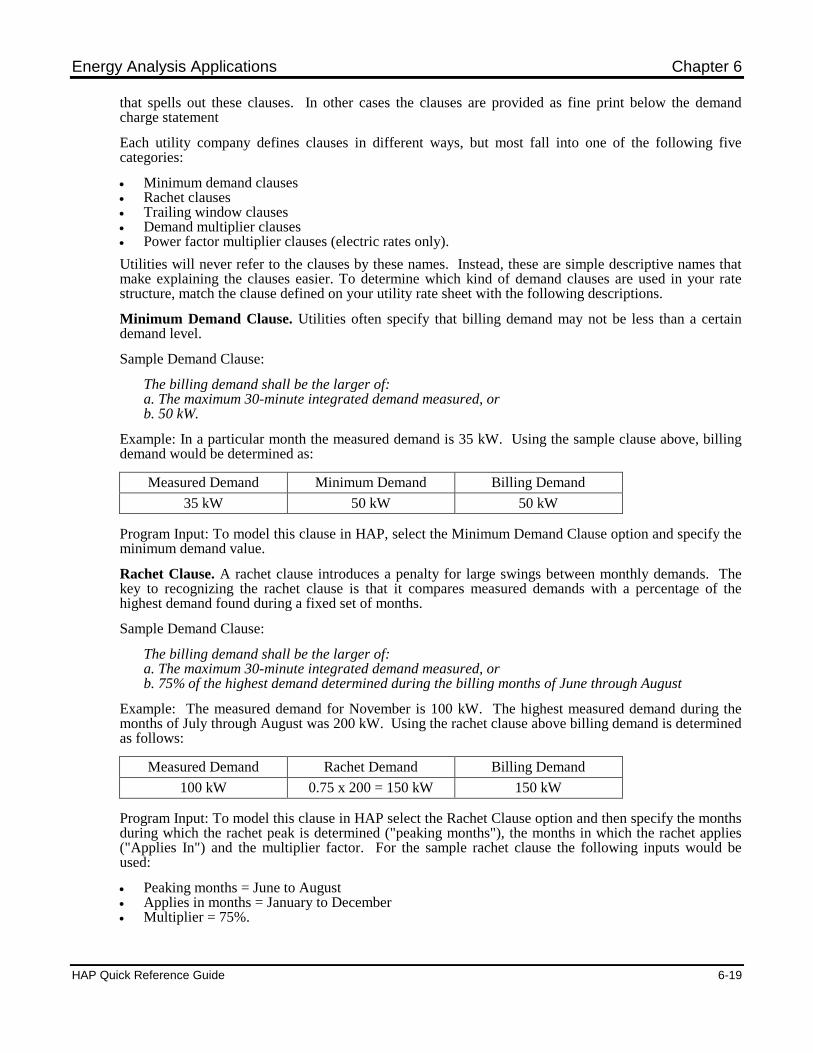
Energy Analysis Applications Chapter 6
HAP Quick Reference Guide 6-19
that spells out these clauses. In other cases the clauses are provided as fine print below the demandcharge statement
Each utility company defines clauses in different ways, but most fall into one of the following fivecategories:
Minimum demand clauses Rachet clauses Trailing window clauses Demand multiplier clauses Power factor multiplier clauses (electric rates only).
Utilities will never refer to the clauses by these names. Instead, these are simple descriptive names thatmake explaining the clauses easier. To determine which kind of demand clauses are used in your ratestructure, match the clause defined on your utility rate sheet with the following descriptions.
Minimum Demand Clause. Utilities often specify that billing demand may not be less than a certaindemand level.
Sample Demand Clause:
The billing demand shall be the larger of:a. The maximum 30-minute integrated demand measured, orb. 50 kW.
Example: In a particular month the measured demand is 35 kW. Using the sample clause above, billingdemand would be determined as:
Measured Demand Minimum Demand Billing Demand
35 kW 50 kW 50 kW
Program Input: To model this clause in HAP, select the Minimum Demand Clause option and specify theminimum demand value.
Rachet Clause. A rachet clause introduces a penalty for large swings between monthly demands. Thekey to recognizing the rachet clause is that it compares measured demands with a percentage of thehighest demand found during a fixed set of months.
Sample Demand Clause:
The billing demand shall be the larger of:a. The maximum 30-minute integrated demand measured, orb. 75% of the highest demand determined during the billing months of June through August
Example: The measured demand for November is 100 kW. The highest measured demand during themonths of July through August was 200 kW. Using the rachet clause above billing demand is determinedas follows:
Measured Demand Rachet Demand Billing Demand
100 kW 0.75 x 200 = 150 kW 150 kW
Program Input: To model this clause in HAP select the Rachet Clause option and then specify the monthsduring which the rachet peak is determined ("peaking months"), the months in which the rachet applies("Applies In") and the multiplier factor. For the sample rachet clause the following inputs would beused:
Peaking months = June to August Applies in months = January to December Multiplier = 75%.
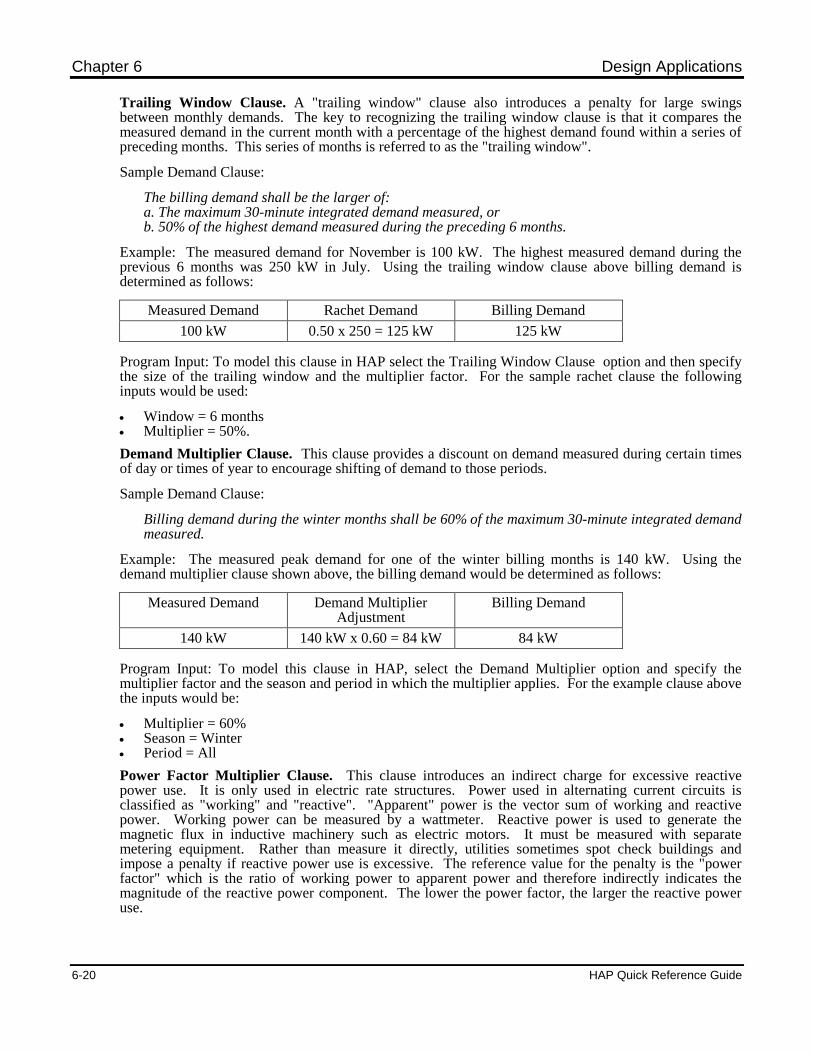
Chapter 6 Design Applications
6-20 HAP Quick Reference Guide
Trailing Window Clause. A "trailing window" clause also introduces a penalty for large swingsbetween monthly demands. The key to recognizing the trailing window clause is that it compares themeasured demand in the current month with a percentage of the highest demand found within a series ofpreceding months. This series of months is referred to as the "trailing window".
Sample Demand Clause:
The billing demand shall be the larger of:a. The maximum 30-minute integrated demand measured, orb. 50% of the highest demand measured during the preceding 6 months.
Example: The measured demand for November is 100 kW. The highest measured demand during theprevious 6 months was 250 kW in July. Using the trailing window clause above billing demand isdetermined as follows:
Measured Demand Rachet Demand Billing Demand
100 kW 0.50 x 250 = 125 kW 125 kW
Program Input: To model this clause in HAP select the Trailing Window Clause option and then specifythe size of the trailing window and the multiplier factor. For the sample rachet clause the followinginputs would be used:
Window = 6 months Multiplier = 50%.
Demand Multiplier Clause. This clause provides a discount on demand measured during certain timesof day or times of year to encourage shifting of demand to those periods.
Sample Demand Clause:
Billing demand during the winter months shall be 60% of the maximum 30-minute integrated demandmeasured.
Example: The measured peak demand for one of the winter billing months is 140 kW. Using thedemand multiplier clause shown above, the billing demand would be determined as follows:
Measured Demand Demand MultiplierAdjustment
Billing Demand
140 kW 140 kW x 0.60 = 84 kW 84 kW
Program Input: To model this clause in HAP, select the Demand Multiplier option and specify themultiplier factor and the season and period in which the multiplier applies. For the example clause abovethe inputs would be:
Multiplier = 60% Season = Winter Period = All
Power Factor Multiplier Clause. This clause introduces an indirect charge for excessive reactivepower use. It is only used in electric rate structures. Power used in alternating current circuits isclassified as "working" and "reactive". "Apparent" power is the vector sum of working and reactivepower. Working power can be measured by a wattmeter. Reactive power is used to generate themagnetic flux in inductive machinery such as electric motors. It must be measured with separatemetering equipment. Rather than measure it directly, utilities sometimes spot check buildings andimpose a penalty if reactive power use is excessive. The reference value for the penalty is the "powerfactor" which is the ratio of working power to apparent power and therefore indirectly indicates themagnitude of the reactive power component. The lower the power factor, the larger the reactive poweruse.
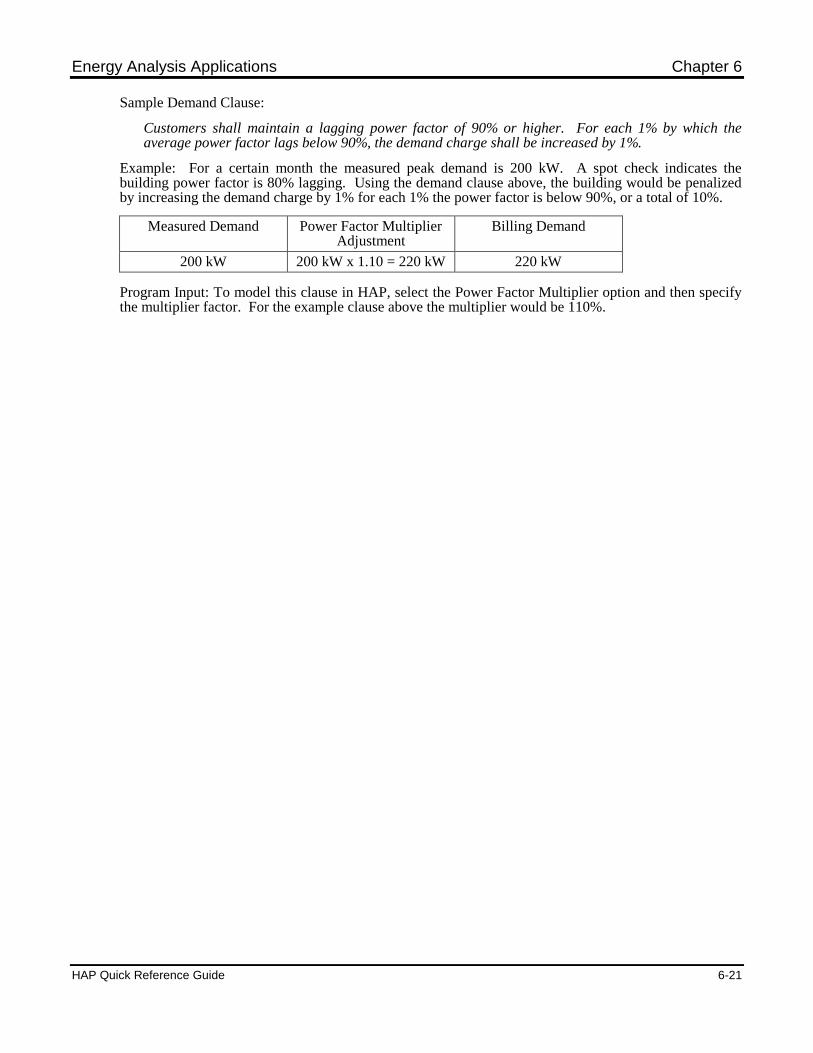
Energy Analysis Applications Chapter 6
HAP Quick Reference Guide 6-21
Sample Demand Clause:
Customers shall maintain a lagging power factor of 90% or higher. For each 1% by which theaverage power factor lags below 90%, the demand charge shall be increased by 1%.
Example: For a certain month the measured peak demand is 200 kW. A spot check indicates thebuilding power factor is 80% lagging. Using the demand clause above, the building would be penalizedby increasing the demand charge by 1% for each 1% the power factor is below 90%, or a total of 10%.
Measured Demand Power Factor MultiplierAdjustment
Billing Demand
200 kW 200 kW x 1.10 = 220 kW 220 kW
Program Input: To model this clause in HAP, select the Power Factor Multiplier option and then specifythe multiplier factor. For the example clause above the multiplier would be 110%.

[This page has been left blank intentionally]
HAP Quick Reference Guide A-1
Appendix A Performing Common Tasks with HAP
This appendix describes procedures used to perform common tasks in HAP such as entering or editingdata and generating reports. This information may be useful for new users learning the program and foroccasional users who need a refresher on operating procedures.
While designing and analyzing HVAC systems with HAP, a common set of procedures is used to enterdata, modify data and generate reports. Using common procedures to operate the program makes theprogram easier to learn and simpler to use. Whether you are working with walls, spaces or systems, forexample, the same basic procedures are used.
A. 1 BASIC PROCEDURES FOR PERFORMING COMMON TASKS
Common tasks such as entering, editing or deleting data use the same basic procedure which is explainedin this section. This basic procedure will be applied to each common task discussed in the subsequentsections in this Appendix.
The procedure for performing many common tasks involves the following steps.
1. Select the Data Category by clicking on the desired item in the tree view panel on the left-hand sideof the HAP main window. For example, if you need to work with Space data, first click on the"Space" item in the tree view panel. This will cause a list of spaces in your project to appear in thelist view panel on the right side of the HAP main window.
2. Select One or More Items from the list view panel on the HAP main window. For example, whenworking with spaces, select one or more space items from the list of spaces in your project. Thereare four ways to select items:
a. Selecting a Single Item - Click once on the name of the item you wish to select. The name willbe highlighted indicating is has been selected.
b. Selecting Multiple, Consecutive Items - While pressing the [Shift] key on the keyboard, clickon the name of the first and last items in the group you wish to select. The names of all items inthe group will be highlighted to indicate they are selected.
c. Selecting Multiple, Non-Consecutive Items - While pressing the [Ctrl] key on the keyboard,click on the name of each item in the group you wish to select. Each name will be highlighted toindicate it is selected.
d. Selecting All Items in the Category - Choose the Select All option on the Edit Menu (on themenu bar). The names of all items shown in the list view will be highlighted indicating they areselected.
3. Perform the Task on the selected items. Particular tasks such as entering or editing data can usuallybe performed by several different methods. Users are free to choose the method that is mostconvenient. These methods include the following. Which methods can be used for each task will beexplained in subsequent sections of this appendix.
a. Menu Bar. Often an option on the Edit Menu or Report Menu on the main window menu barcan be used to perform the task.
Appendix A Performing Common Tasks with HAP
A-2 HAP Quick Reference Guide
b. Toolbar. In many cases one of the buttons on the main window toolbar can be used to performthe task.
c. Item Pop-Up Menus. Right-clicking on the group of selected items will display the item pop-upmenu which usually will contain an option for performing the task.
d. Category Pop-Up Menus. Right-clicking on the selected category in the tree view panel willdisplay the category pop-up menu. Note that selecting an option on this pop-up menu willperform the task on ALL items in the category, not just those currently selected. Therefore,category pop-up menus should be used carefully.
e. Direct Use of the Keyboard. In some cases the keyboard keys can be used to directly perform atask.
f. Special Features. There are also cases where special additional methods are provided forperforming tasks. These will be explained in the subsequent sections where they apply.
A.2 CREATING A NEW ITEM
There are three ways to create new items in HAP. The example below deals with wall data, but theprocedure can be used for any category of data in HAP. Simply substitute your category name for "wall"in the following description.
To create a new wall item:
1. Select the Wall category in the tree view pane on the left side of the main window. A list of walls inthe project will appear in the right-hand list view pane.
2. Use one of the following three methods to create a new item.
a. Select the "New Default…" item in the list view pane.b. Right click on the Wall item in the tree view panel to display the category pop-up menu. Then
select the "New" option in this pop-up menu.c. Use a special feature to create a new wall from within one of the program input forms. See
details below.
3. After creating the new wall, the input window will appear. Enter data for the wall and then press OKto save the data and return to the HAP main window.
Special Feature. Certain categories of data can be created from within other input forms. For example,while entering space data on the space window, you can create a new wall as follows:
1. While editing data in the Space Input Window on the “Walls, Windows Doors” tab, choose the“create new wall” item in the wall drop-down list. The wall input window will then appear.
2. Enter the desired wall data including the wall name.3. Click the OK button to save the wall and return to the space input window. When you return to the
space window, the wall you created will automatically be selected for use in the space.
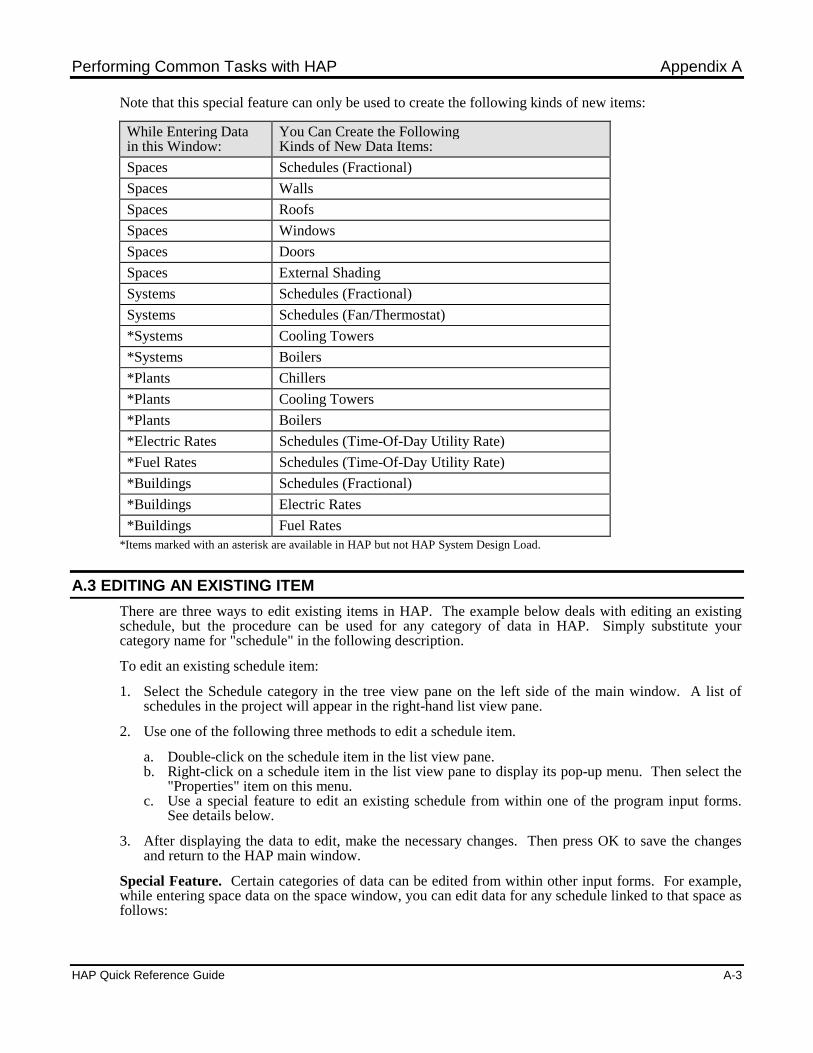
Performing Common Tasks with HAP Appendix A
HAP Quick Reference Guide A-3
Note that this special feature can only be used to create the following kinds of new items:
While Entering Datain this Window:
You Can Create the FollowingKinds of New Data Items:
Spaces Schedules (Fractional)
Spaces Walls
Spaces Roofs
Spaces Windows
Spaces Doors
Spaces External Shading
Systems Schedules (Fractional)
Systems Schedules (Fan/Thermostat)
*Systems Cooling Towers
*Systems Boilers
*Plants Chillers
*Plants Cooling Towers
*Plants Boilers
*Electric Rates Schedules (Time-Of-Day Utility Rate)
*Fuel Rates Schedules (Time-Of-Day Utility Rate)
*Buildings Schedules (Fractional)
*Buildings Electric Rates
*Buildings Fuel Rates
*Items marked with an asterisk are available in HAP but not HAP System Design Load.
A.3 EDITING AN EXISTING ITEM
There are three ways to edit existing items in HAP. The example below deals with editing an existingschedule, but the procedure can be used for any category of data in HAP. Simply substitute yourcategory name for "schedule" in the following description.
To edit an existing schedule item:
1. Select the Schedule category in the tree view pane on the left side of the main window. A list ofschedules in the project will appear in the right-hand list view pane.
2. Use one of the following three methods to edit a schedule item.
a. Double-click on the schedule item in the list view pane.b. Right-click on a schedule item in the list view pane to display its pop-up menu. Then select the
"Properties" item on this menu.c. Use a special feature to edit an existing schedule from within one of the program input forms.
See details below.
3. After displaying the data to edit, make the necessary changes. Then press OK to save the changesand return to the HAP main window.
Special Feature. Certain categories of data can be edited from within other input forms. For example,while entering space data on the space window, you can edit data for any schedule linked to that space asfollows:
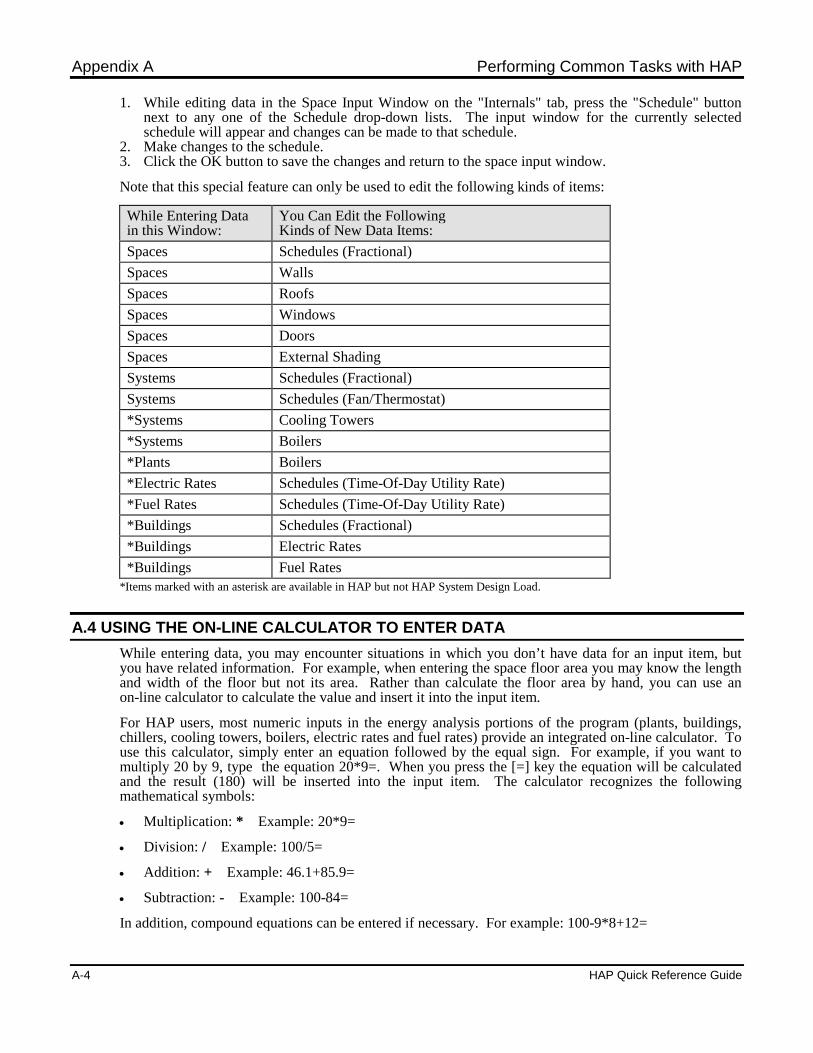
Appendix A Performing Common Tasks with HAP
A-4 HAP Quick Reference Guide
1. While editing data in the Space Input Window on the "Internals" tab, press the "Schedule" buttonnext to any one of the Schedule drop-down lists. The input window for the currently selectedschedule will appear and changes can be made to that schedule.
2. Make changes to the schedule.3. Click the OK button to save the changes and return to the space input window.
Note that this special feature can only be used to edit the following kinds of items:
While Entering Datain this Window:
You Can Edit the FollowingKinds of New Data Items:
Spaces Schedules (Fractional)
Spaces Walls
Spaces Roofs
Spaces Windows
Spaces Doors
Spaces External Shading
Systems Schedules (Fractional)
Systems Schedules (Fan/Thermostat)
*Systems Cooling Towers
*Systems Boilers
*Plants Boilers
*Electric Rates Schedules (Time-Of-Day Utility Rate)
*Fuel Rates Schedules (Time-Of-Day Utility Rate)
*Buildings Schedules (Fractional)
*Buildings Electric Rates
*Buildings Fuel Rates
*Items marked with an asterisk are available in HAP but not HAP System Design Load.
A.4 USING THE ON-LINE CALCULATOR TO ENTER DATA
While entering data, you may encounter situations in which you don’t have data for an input item, butyou have related information. For example, when entering the space floor area you may know the lengthand width of the floor but not its area. Rather than calculate the floor area by hand, you can use anon-line calculator to calculate the value and insert it into the input item.
For HAP users, most numeric inputs in the energy analysis portions of the program (plants, buildings,chillers, cooling towers, boilers, electric rates and fuel rates) provide an integrated on-line calculator. Touse this calculator, simply enter an equation followed by the equal sign. For example, if you want tomultiply 20 by 9, type the equation 20*9=. When you press the [=] key the equation will be calculatedand the result (180) will be inserted into the input item. The calculator recognizes the followingmathematical symbols:
Multiplication: * Example: 20*9=
Division: / Example: 100/5=
Addition: + Example: 46.1+85.9=
Subtraction: - Example: 100-84=
In addition, compound equations can be entered if necessary. For example: 100-9*8+12=
Performing Common Tasks with HAP Appendix A
HAP Quick Reference Guide A-5
For both HAP and HAP System Design Load users, the system design portions of the program (weather,spaces, systems, walls, roofs, windows, doors, external shades) do not yet offer this integrated on-linecalculator feature. Until these portions can be upgraded to include the integrated calculator, theWindows On-Line Calculator must be used instead. The following example illustrates how to use theWindows calculator.
Example: You need to enter the floor area for a space, but you only know the floor dimensions are 17 ftby 32 ft. The Windows Calculator can be used to compute the floor area and then insert it into HAP asfollows:
1. Start the Windows Calculator: From the Windows desktop, press Start. On the Start Menu choosePrograms. On the Programs Menu choose Accessories. On the Accessories Menu chooseCalculator. If you don’t need the calculator right away, minimize the Calculator window by pressingthe minimize button on the Calculator title bar. The calculator will be available for use wheneveryou need it.
The Windows Calculator is a program supplied with the Windows operating system. For typicalWindows installations it is placed in the Accessories program group.
2. While running HAP and entering space data, display the Calculator by pressing the Calculator buttonthat appears on your taskbar. The Calculator will appear.
3 Calculate the floor area by pressing the calculator keypad buttons for the equation 17 * 32 = . Theresult (544) will appear in the calculator display.
4. Copy the result to the clipboard: Choose the Edit option in the Calculator menu bar. Then choose theCopy option on the Edit Menu. This copies the result of your equation (544) to the Windowsclipboard.
5. Return to HAP and place the cursor in the floor area text box by clicking once on this text box so thedefault floor area is highlighted.
6. Finally, on your keyboard, hold the [Shift] key down and press [Ins]. This inserts the contents of theWindows clipboard into the input field. The value 544 will appear as your floor area, replacing theprevious floor area value.
A.5 DUPLICATING AN EXISTING ITEM
While entering data, it is often useful to create new items using defaults from an existing item. Forexample, a series of spaces in a building might use the same wall and window constructions and the samelighting levels and schedules. Defining this series of spaces with each new space based on the lastspace’s data can yield a tremendous increase in productivity. You only need to change a handful ofspace inputs for each successive space, rather than specifying every input item for each space.
The Duplicate feature in HAP is used for this purpose. For example, when you duplicate a space, a newspace is created using input data from the original space as defaults. Many readers will be familiar withthe Copy and Paste features commonly offered in Windows software. HAP’s Duplicate feature combinesCopy and Paste into one function. So in one step, Duplicate lets you make a copy of an item and paste itinto your project.
There are three ways to make a duplicate of an existing item in HAP. The example below deals withduplicating an existing space, but the procedure can be used for any category of data in HAP. Simplysubstitute your category name for "space" in the following description.
To duplicate an existing space:
1. Select the Space category in the tree view pane on the left side of the main window. A list of spacesin the project will appear in the list view pane.
2. Select the desired space in the list view pane by clicking on it once.
Appendix A Performing Common Tasks with HAP
A-6 HAP Quick Reference Guide
3. Use one of the following three methods to duplicate a space:
a. Use the "Duplicate" option on the Edit Menu.b. Press the "Duplicate" button on the Toolbar.c. Right-click on the selected space item to display its pop-up menu. Then select the "Duplicate"
item on this menu.
4. After the space has been duplicated its data will be displayed in the space input window. Edit data asnecessary and then press OK to save the changes and return to the HAP main window.
A.6 DUPLICATING A BUILDING (WITH SPACES AND HVAC EQUIPMENT)
When performing a LEED® Energy and Atmosphere Credit 1 analysis, or a LEED® Energy andAtmosphere Prerequisite 2 (Whole Building Energy Simulation option) analysis it is sometimesnecessary to make a copy of a HAP building and all the air systems, plants, spaces, chillers, coolingtowers and boilers that are linked to the building. An example is after a Proposed Design has beencreated and you wish to make a copy of all its data as the basis for assembling the Baseline 0 degbuilding. The Duplicate Building (with Spaces and HVAC Eqpt) option is used for this purpose. To usethis option:
1. Select the Building category in the tree view pane on the left side of the main window. A list ofbuildings in your project will appear in the list view pane on the right.
2. Select the desired Building in the list view pane by clicking on it once.
3. Use one of the following two methods of duplicating the Building:
a. Choose the Duplicate Building (with Spaces and HVAC Eqpt) on the Edit Menu.
=OR=
b. Right-click on the selected Building to display its pop-up menu and then choose the DuplicateBuilding (with Spaces and HVAC Eqpt) on this menu.
4. A window will appear explaining what this option does and asking whether you are using this optionto copy data in preparation for creating a Baseline Building or a Proposed Design. If you chooseBaseline Building, the program will use the prefix [B000] for the copies of data it creates so you caneasily identify the data. If you choose Proposed Design, the program will use the prefix [P] for thecopies of data it creates. A third option is provided for directly specifying a custom prefix for theduplicated data other than [B000] or [P].
After making your selection press OK to duplicate the Building.
5. The program will then make a copy of the original Building and all the spaces, air systems, plants,chillers, cooling towers and boilers linked to the Building. Names of copied items will be assignedthe proper prefix as described above.
6. Once the program is finished, a message will be displayed confirming completion of the work andexplaining how to identify the data items that were created.
A.7 COPYING ITEMS
Please see section A.5, Duplicating an Existing Item.
A.8 REPLACING SPACE DATA
During the course of a design project, specifications for the building sometimes change. For example,the wall construction characteristics change or lighting levels are adjusted. In such a situation, its usefulto be able to globally change all space data rather than modifying the spaces one at a time.
Performing Common Tasks with HAP Appendix A
HAP Quick Reference Guide A-7
The Replace feature in HAP is used for this purpose. For example, the Replace feature can be used tochange the overhead lighting wattage for 45 spaces all in one step. This provides a vast time savingsover modifying the 45 spaces one at a time. A Replace can be performed in two ways:
The first is using a “search and replace” approach in which you define a “value to replace” and a“replace with” value. For example, if “value to replace” is 2.0 W/sqft of overhead lighting, and“replace with” is 1.8 W/sqft, the program will search for all occurrences of 2.0 W/sqft of overheadlighting in the spaces you choose, and will replace these with 1.8 W/sqft.
The second is using a “replace all” approach in which you only specify a “replace with” value; the“value to replace” specification is left blank in this case. For example, if the “value to replace” isblank and the “replace with” value is 1.8 W/sqft of overhead lighting, the program will replace alloverhead lighting inputs in the spaces you designate with 1.8 W/sqft, regardless of what the originaloverhead lighting values are.
There are four methods for globally replacing space data in HAP. The example below deals withchanging the overhead lighting W/sqft in a group of spaces from 2.0 to 1.8. The same general procedurecan be used for replacing many other types of space input data.
1. Select the Space category in the tree view pane on the left side of the main window. A list of spacesin the project will appear in the list view pane.
2. In the list view pane select the spaces whose data is to be modified
3. Use one of the following four methods to replace the data:
a. Use the "Replace" option on the Edit Menu.b. Press the "Replace" button on the Toolbar.c. Right-click on the group of selected spaces to display its pop-up menu. Then select the
"Replace" item on this menu.d. Right-click on the Space category name in the tree view pane on the left side of the main window
to display the Space category pop-up menu. Then select the "Replace" option on this menu.Note that this will apply changes to ALL spaces in the project, so this method should be usedcarefully.
4. After the Replace option is selected, the Replace Data window will appear.
5. On the Internals tab of this window choose "Overhead Lighting W/sqft" as the category to bechanged, specify a "value to replace" of 2.0 and a "replace with" value of 1.8.
6. Then click on the OK button to run the search and replace process. The program will notify you ofthe number of spaces searched and the number of items replaced before returning to the HAP mainwindow.
A.9 ROTATING SPACES
During the course of a design project, the orientation of the building is sometimes adjusted by thearchitect. In such a situation, it is useful to be able to globally change the orientations of wall exposuresand roof exposures in all your spaces rather than modifying the spaces one at a time.
The Rotate feature in HAP is used for this purpose. For example, suppose a building contains 100spaces. Midway through the design process, the architect changes the building orientation by shifting it45 degrees clockwise. The rotate feature can be used to adjust the wall and roof orientations in one step.This provides a vast time savings over modifying the 100 spaces one at a time.
There are four ways to rotate space data in HAP. The example below deals with rotating the orientationof wall and roof exposures by 45 degrees clockwise. The same general procedure can be used for rotationby other amounts.
1. Select the Space category in the tree view pane on the left side of the main window. A list of spacesin the project will appear in the list view pane.
Appendix A Performing Common Tasks with HAP
A-8 HAP Quick Reference Guide
2. In the list view pane select the spaces to be rotated.
3. Use one of the following four methods to rotate the spaces:
a. Use the "Rotate" option on the Edit Menu.b. Press the "Rotate" button on the Toolbar.c. Right-click on the group of selected spaces to display its pop-up menu. Then select the "Rotate"
item on this menu.d. Right-click on the Space category name in the tree view pane on the left side of the main window
to display the Space category pop-up menu. Then select the "Rotate" option on this menu. Notethat this will rotate ALL spaces in the project, so this method should be used carefully.
4. After the Rotate option is selected, the Rotate Data window will appear. On this window specify theamount of rotation (45 degrees in this example). Then press the OK button to begin the rotation.The program will report the number of wall and roof exposures that were rotated before returning tothe HAP main window.
A.10 PERFORMING LEED (90.1 PRM) ROTATIONS
When performing a LEED® Energy and Atmosphere Credit 1 analysis or a LEED® Energy andAtmosphere Prerequisite 2 (Whole Building Energy Simulation Option) analysis, it is necessary to makefour copies of the Baseline Building. The first Baseline Building, using an orientation equal to theProposed Design, is assembled by manually defining the characteristics of its spaces, systems, plants,chillers, cooling towers, and boilers, as necessary. Then it is necessary to make three further copies ofthis Baseline Building with spaces rotated 90 deg, 180 deg and 270 deg, respectively, from the originalBaseline Building orientation. The "Perform LEED (90.1 PRM) Rotations" option is used to quicklygenerate these three copies of the Baseline Building. To use this option:
1. Select the Building category in the tree view pane on the left side of the main window. A list ofbuildings in your project will appear in the list view pane on the right.
2. Select the Baseline Building in the list view pane by clicking on it once.
3. Use one of the following two methods to perform the LEED® rotations:
a. Choose the "Perform LEED (90.1 PRM) Rotations" option on the Edit Menu.
=OR=
b. Right-click on the selected Building to display its pop-up menu and then choose the "PerformLEED (90.1 PRM) Rotations" option on this menu.
4. A window will appear explaining what this option does. Press OK to start the rotations.
5. The program will produce three copies of the Baseline Building you selected. Copies include thebuilding and all the spaces, air systems, plants, chillers, cooling towers and boilers linked to thebuilding. The spaces in the first copy will be rotated 90 deg from the original orientation. Thespaces in the second copy will be rotated 180 deg. The spaces in the third copy will be rotated 270deg. HAP uses prefixes for the copied items so you can easily identify them. [B090] indicates datafor the Baseline 90 deg rotation, [B180] indicates data for the Baseline 180 deg rotation, and [B270]indicates data for the Baseline 270 deg rotation.
6. When the program is finished generating this data it displays a message confirming completion andexplaining how to identify the data that was produced.
A.11 DELETING ITEMS
There are five ways to delete existing items in HAP. The example below deals with deleting air systems,but the procedure can be used for any category of data in HAP. Simply substitute your category name for
Performing Common Tasks with HAP Appendix A
HAP Quick Reference Guide A-9
"system" in the following description. Note: If you ever accidentally delete data, you can often undo thedeletion. A paragraph at the end of this section explains how.
To delete two air systems from a project:
1. Select the System category in the tree view pane on the left side of the main window. A list ofsystems in the project will appear in the list view pane.
2. In the list view pane select the two air systems to be deleted.
3. Use one of the following five methods to delete the air systems:
a. Press the Delete key on the keyboard.b. Use the Delete option on the Edit Menu.c. Use the Delete button on the Toolbar.d. Right-click on the selected systems in the list view pane to display the item pop-up menu. Then
select the "Delete" item on this menu.e. Right-click on the System category in the tree view pane to display the pop-up menu for the
system category. Then select the "Delete" item on this menu. Note that this will delete ALLsystems in the project, so this option should be used carefully.
4. HAP will display a warning message listing the number of systems to be deleted and asking you toconfirm the deletion before it erases the data.
How to Undo Accidental Deletion of Data: When data is deleted, it is permanently erased from theworking copy of your project. However, if you ever mistakenly delete data and have not yet saved theproject, you can undo the deletion by re-opening the project. Use the Open option on the Project Menu.When you choose the Open option, HAP will ask if you want to save changes to your current projectdata. Make sure you DO NOT save the project data at this point. Then reopen the project. Data fromyour most recent project/save will be restored. While this will successfully undo your accidental deletionof data, any other changes you made to the project since the last project/save will also be lost.
A.12 GENERATING INPUT DATA REPORTS
HAP provides four ways to print or view input data for your project. When printing data, it is sentdirectly to your printer. When viewing data, information appears in the HAP Report Viewer. TheViewer allows you to quickly browse the data. The Viewer also provides a button for printing the data.Further information on the Report Viewer can be found in section A.18.
The example below deals with viewing or printing input data for a group of spaces, but the procedure canbe used for any category of data in HAP. Simply substitute your category name for "space" in thefollowing description.
To view or print input data for a group of spaces:
1. Select the Space category in the tree view pane on the left side of the main window. A list of spacesin the project will appear in the list view pane.
2. In the list view pane select the spaces whose input data is to be viewed or printed.
3. Use one of the following four methods to view or print the input data:
a. Choose the "View Input Data" or "Print Input Data" options on the Reports Menu.b. Press the "View Input Data" button on the Toolbar.c. Right-click on the selected spaces in the list view pane to display the item pop-up menu. Then
select the "View Input Data" or "Print Input Data" option on this menu.d. Right-click on the Space category in the tree view pane to display the pop-up menu for the space
category. Then select the "View Input Data" or "Print Input Data" option on this menu. Notethat this will view or print input data for ALL spaces, so this option should be used carefully.
Appendix A Performing Common Tasks with HAP
A-10 HAP Quick Reference Guide
A.13 GENERATING SYSTEM DESIGN REPORTS
System design reports provide information about loads and the required sizes of air system componentssuch as coils, fans, and supply terminals. HAP provides four ways to generate these reports, all utilizingthe same basic procedure.
1. Select the System category in the tree view pane on the left side of the main window. A list ofsystems in the project will appear in the list view pane.
2. In the list view pane select the desired systems.
3. Use one of the following four methods to view or print system design reports:
a. Choose the "Print/View Design Results" option on the Reports Menu.b. Press the "Print/View Design Results" button on the Toolbar.c. Right-click on the selected systems in the list view pane to display the item pop-up menu. Then
select the "Print/View Design Results" option on this menu.d. Right-click on the System category in the tree view pane to display the pop-up menu for the
system category. Then select the "Print/View Design Results" option on this menu. Note thatthis will generate design reports for ALL systems in the project, so this option should be usedcarefully.
4. The System Design Reports Selection window will appear. Select the reports to be generated.
5. To view the reports, press the Preview button on the System Design Reports window. If systemdesign calculations must be run before the reports can be generated, HAP will run these calculationsautomatically. If no calculations are needed, the reports will be displayed immediately. Reports aredisplayed in the HAP Report Viewer (see section A.18). After viewing the reports you can print thereports by pressing the Print button on the Report Viewer.
6. To print the reports directly, press the Print button on the System Design Reports window. If systemdesign calculations must be run before the reports can be generated, HAP will run these calculationsautomatically. If no calculations are needed, the reports will be printed immediately.
A.14 GENERATING PLANT DESIGN REPORTS
Plant design reports provide sizing information for chiller plants and boiler plants. HAP provides fourways to generate these reports, all utilizing the same basic procedure.
1. Select the Plant category in the tree view pane on the left side of the main window. A list of plants inthe project will appear in the list view pane.
2. In the list view pane select the desired plants.
3. Use one of the following four methods to view or print plant design reports:
a. Choose the "Print/View Design Results" option on the Reports Menu.b. Press the "Print/View Design Results" button on the Toolbar.c. Right-click on the selected plants in the list view pane to display the item pop-up menu. Then
select the "Print/View Design Results" option on this menu.d. Right-click on the Plant category in the tree view pane to display the pop-up menu for the plant
category. Then select the "Print/View Design Results" option on this menu. Note that this willgenerate design reports for ALL plants in the project, so this option should be used carefully.
4. The Plant Design Reports Selection window will appear. Select the reports to be generated.
5. To view the reports, press the Preview button on the Plant Design Reports window. If plant orsystem design calculations must be run before the reports can be generated, HAP will run thesecalculations automatically. If no calculations are needed, the reports will be displayed immediately.Reports are displayed in the HAP Report Viewer (see section A.18). After viewing the reports youcan print the reports by pressing the Print button on the Report Viewer.
Performing Common Tasks with HAP Appendix A
HAP Quick Reference Guide A-11
6. To print the reports directly, press the Print button on the Plant Design Reports window. If plant orsystem design calculations must be run before the reports can be generated, HAP will run thesecalculations automatically. If no calculations are needed, the reports will be printed immediately.
A.15 GENERATING SYSTEM SIMULATION REPORTS
System simulation reports provide information about system operation and energy use during a typicalyear. These reports are offered in HAP but not HAP System Design Load. HAP provides four ways togenerate these reports, all utilizing the same basic procedure.
1. Select the System category in the tree view pane on the left side of the main window. A list ofsystems in the project will appear in the list view pane.
2. In the list view pane select the desired systems.
3. Use one of the following four methods to view or print system simulation reports:
a. Choose the "Print/View Simulation Results" option on the Reports Menu.b. Press the "Print/View Simulation Results" button on the Toolbar.c. Right-click on the selected systems in the list view pane to display the item pop-up menu. Then
select the "Print/View Simulation Results" option on this menu.d. Right-click on the System category in the tree view pane to display the pop-up menu for the
system category. Then select the "Print/View Simulation Results" option on this menu. Notethat this will generate simulation reports for ALL systems in the project, so this option should beused carefully.
4. The System Simulation Reports Selection window will appear. Select the reports to be generated.
5. To view the reports, press the Preview button on the System Simulation Reports window. If systemcalculations must be run before the reports can be generated, HAP will run these calculationsautomatically. If no calculations are needed, the reports will be displayed immediately. Reports aredisplayed in the HAP Report Viewer (see section A.18). After viewing the reports you can print thereports by pressing the Print button on the Report Viewer.
6. To print the reports directly, press the Print button on the System Simulation Reports window. Ifsystem calculations must be run before the reports can be generated, HAP will run these calculationsautomatically. If no calculations are needed, the reports will be printed immediately.
A.16 GENERATING PLANT SIMULATION REPORTS
Plant simulation reports provide information about plant operation and energy use during a typical year.These reports are offered in HAP but not HAP System Design Load. HAP provides four ways togenerate these reports, all utilizing the same basic procedure.
1. Select the Plant category in the tree view pane on the left side of the main window. A list of plants inthe project will appear in the list view pane.
2. In the list view pane select the desired plants.
3. Use one of the following four methods to view or print plant simulation reports:
a. Choose the "Print/View Simulation Results" option on the Reports Menu.b. Press the "Print/View Simulation Results" button on the Toolbar.c. Right-click on the selected plants in the list view pane to display the item pop-up menu. Then
select the "Print/View Simulation Results" option on this menu.d. Right-click on the Plant category in the tree view pane to display the pop-up menu for the plant
category. Then select the "Print/View Simulation Results" option on this menu. Note that thiswill generate simulation reports for ALL plants in the project, so this option should be usedcarefully.
Appendix A Performing Common Tasks with HAP
A-12 HAP Quick Reference Guide
4. The Plant Simulation Reports Selection window will appear. Select the reports to be generated.
5. To view the reports, press the Preview button on the Plant Simulation Reports window. If plant orsystem calculations must be run before the reports can be generated, HAP will run these calculationsautomatically. If no calculations are needed, the reports will be displayed immediately. Reports aredisplayed in the HAP Report Viewer (see section A.18). After viewing the reports you can print thereports by pressing the Print button on the Report Viewer.
6. To print the reports directly, press the Print button on the Plant Simulation Reports window. If plantor system calculations must be run before the reports can be generated, HAP will run thesecalculations automatically. If no calculations are needed, the reports will be printed immediately.
A.17 GENERATING BUILDING SIMULATION REPORTS
Building simulation reports provide information about annual energy use and energy cost. These reportsare offered in HAP but not HAP System Design Load. HAP provides four ways to generate thesereports, all utilizing the same basic procedure.
1. Select the Building category in the tree view pane on the left side of the main window. A list ofbuildings in the project will appear in the list view pane.
2. In the list view pane select the desired buildings.
3. Use one of the following four methods to view or print building simulation reports:
a. Choose the "Print/View Simulation Results" option on the Reports Menu.b. Press the "Print/View Simulation Results" button on the Toolbar.c. Right-click on the selected buildings in the list view pane to display the item pop-up menu. Then
select the "Print/View Simulation Results" option on this menu.d. Right-click on the Building category in the tree view pane to display the pop-up menu for the
building category. Then select the "Print/View Simulation Results" option on this menu. Notethat this will generate simulation reports for ALL buildings in the project, so this option shouldbe used carefully.
4. The Building Simulation Reports Selection window will appear. Select the reports to be generated.
5. To view the reports, press the Preview button on the Building Simulation Reports Results window.If building, plant or system calculations must be run before the reports can be generated, HAP willrun these calculations automatically. If no calculations are needed, the reports will be displayedimmediately. Reports are displayed in the HAP Report Viewer (see section A.18). After viewing thereports you can print the reports by pressing the Print button on the Report Viewer.
6. To print the reports directly, press the Print button on the Building Simulation Reports window. Ifbuilding, plant or system calculations must be run before the reports can be generated, HAP will runthese calculations automatically. If no calculations are needed, the reports will be printedimmediately.
A.18 USING THE REPORT VIEWER
This section describes the features and operation of the HAP Reports Viewer. The Viewer is used todisplay all input, design and simulation reports in HAP. It appears when you press the Preview button onany of the Report Selection windows in the program.
Overview of Layout and Features. The Report Viewer consists of four key components.
1. The Title Bar appears across the top of the Report Viewer window. At the right-hand end of the titlebar is a close button which is used to close the viewer and return to the HAP main window.
2. The Menu Bar appears beneath the title bar. It contains two menus which provide options forperforming useful tasks with reports.
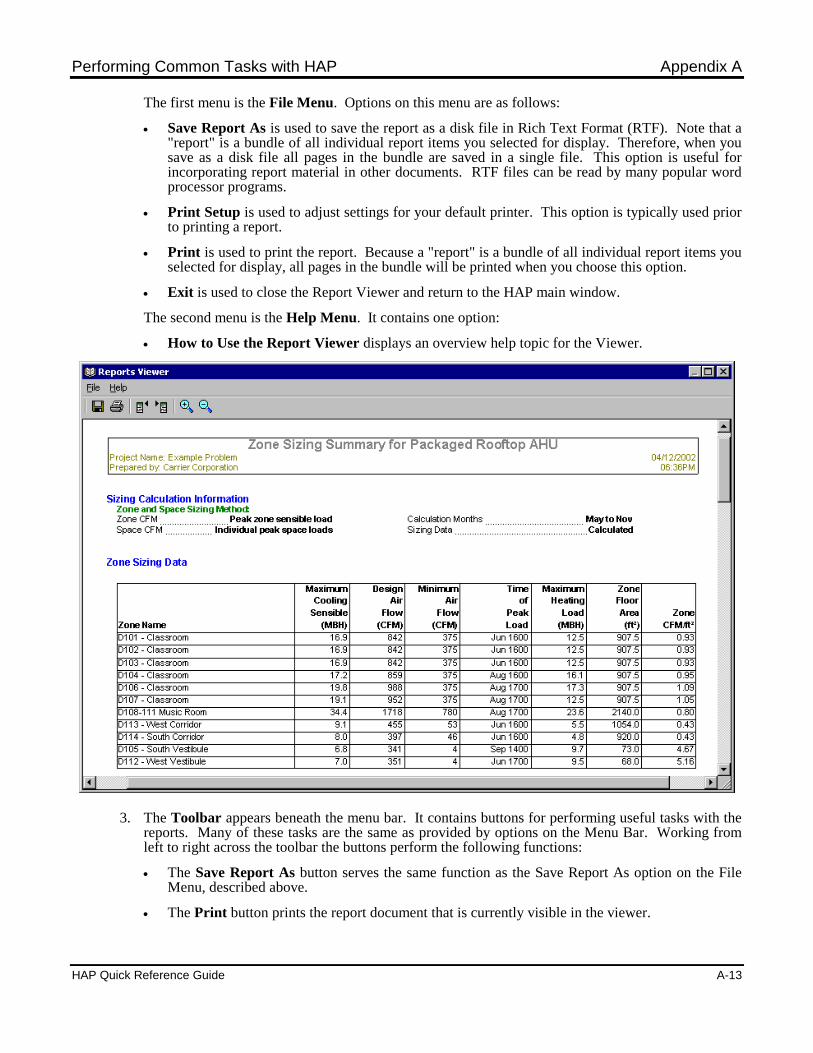
Performing Common Tasks with HAP Appendix A
HAP Quick Reference Guide A-13
The first menu is the File Menu. Options on this menu are as follows:
Save Report As is used to save the report as a disk file in Rich Text Format (RTF). Note that a"report" is a bundle of all individual report items you selected for display. Therefore, when yousave as a disk file all pages in the bundle are saved in a single file. This option is useful forincorporating report material in other documents. RTF files can be read by many popular wordprocessor programs.
Print Setup is used to adjust settings for your default printer. This option is typically used priorto printing a report.
Print is used to print the report. Because a "report" is a bundle of all individual report items youselected for display, all pages in the bundle will be printed when you choose this option.
Exit is used to close the Report Viewer and return to the HAP main window.
The second menu is the Help Menu. It contains one option:
How to Use the Report Viewer displays an overview help topic for the Viewer.
3. The Toolbar appears beneath the menu bar. It contains buttons for performing useful tasks with thereports. Many of these tasks are the same as provided by options on the Menu Bar. Working fromleft to right across the toolbar the buttons perform the following functions:
The Save Report As button serves the same function as the Save Report As option on the FileMenu, described above.
The Print button prints the report document that is currently visible in the viewer.
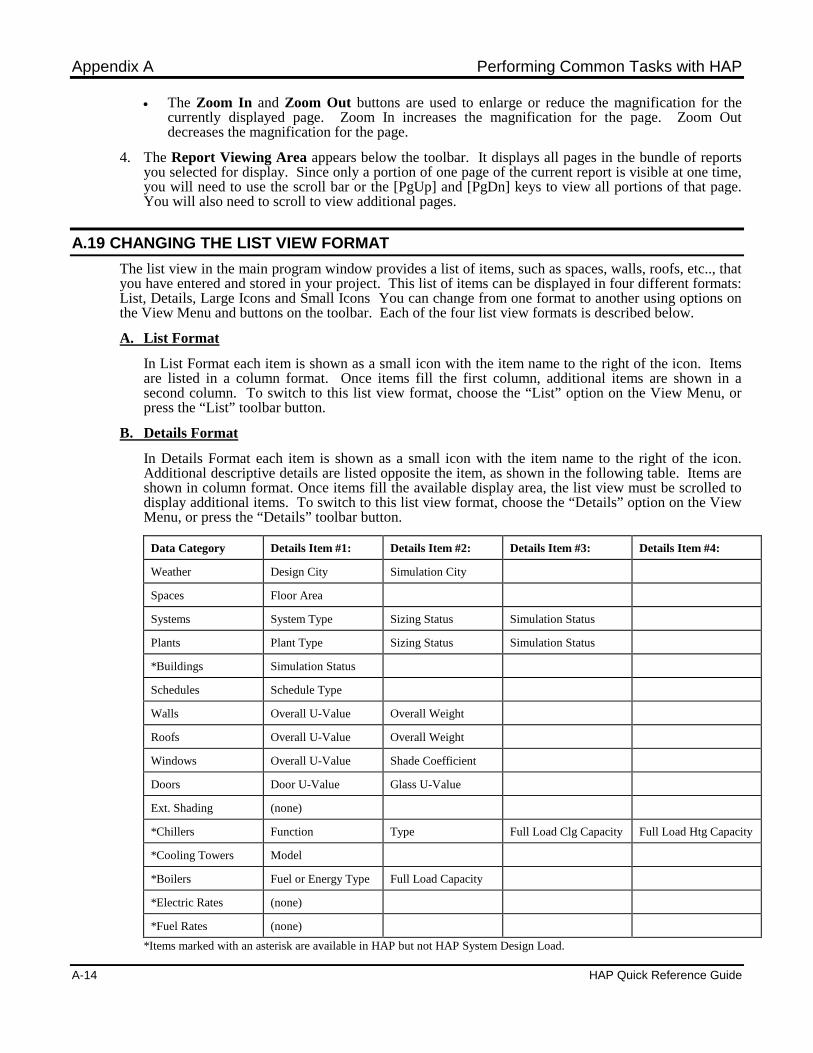
Appendix A Performing Common Tasks with HAP
A-14 HAP Quick Reference Guide
The Zoom In and Zoom Out buttons are used to enlarge or reduce the magnification for thecurrently displayed page. Zoom In increases the magnification for the page. Zoom Outdecreases the magnification for the page.
4. The Report Viewing Area appears below the toolbar. It displays all pages in the bundle of reportsyou selected for display. Since only a portion of one page of the current report is visible at one time,you will need to use the scroll bar or the [PgUp] and [PgDn] keys to view all portions of that page.You will also need to scroll to view additional pages.
A.19 CHANGING THE LIST VIEW FORMAT
The list view in the main program window provides a list of items, such as spaces, walls, roofs, etc.., thatyou have entered and stored in your project. This list of items can be displayed in four different formats:List, Details, Large Icons and Small Icons You can change from one format to another using options onthe View Menu and buttons on the toolbar. Each of the four list view formats is described below.
A. List Format
In List Format each item is shown as a small icon with the item name to the right of the icon. Itemsare listed in a column format. Once items fill the first column, additional items are shown in asecond column. To switch to this list view format, choose the “List” option on the View Menu, orpress the “List” toolbar button.
B. Details Format
In Details Format each item is shown as a small icon with the item name to the right of the icon.Additional descriptive details are listed opposite the item, as shown in the following table. Items areshown in column format. Once items fill the available display area, the list view must be scrolled todisplay additional items. To switch to this list view format, choose the “Details” option on the ViewMenu, or press the “Details” toolbar button.
Data Category Details Item #1: Details Item #2: Details Item #3: Details Item #4:
Weather Design City Simulation City
Spaces Floor Area
Systems System Type Sizing Status Simulation Status
Plants Plant Type Sizing Status Simulation Status
*Buildings Simulation Status
Schedules Schedule Type
Walls Overall U-Value Overall Weight
Roofs Overall U-Value Overall Weight
Windows Overall U-Value Shade Coefficient
Doors Door U-Value Glass U-Value
Ext. Shading (none)
*Chillers Function Type Full Load Clg Capacity Full Load Htg Capacity
*Cooling Towers Model
*Boilers Fuel or Energy Type Full Load Capacity
*Electric Rates (none)
*Fuel Rates (none)
*Items marked with an asterisk are available in HAP but not HAP System Design Load.
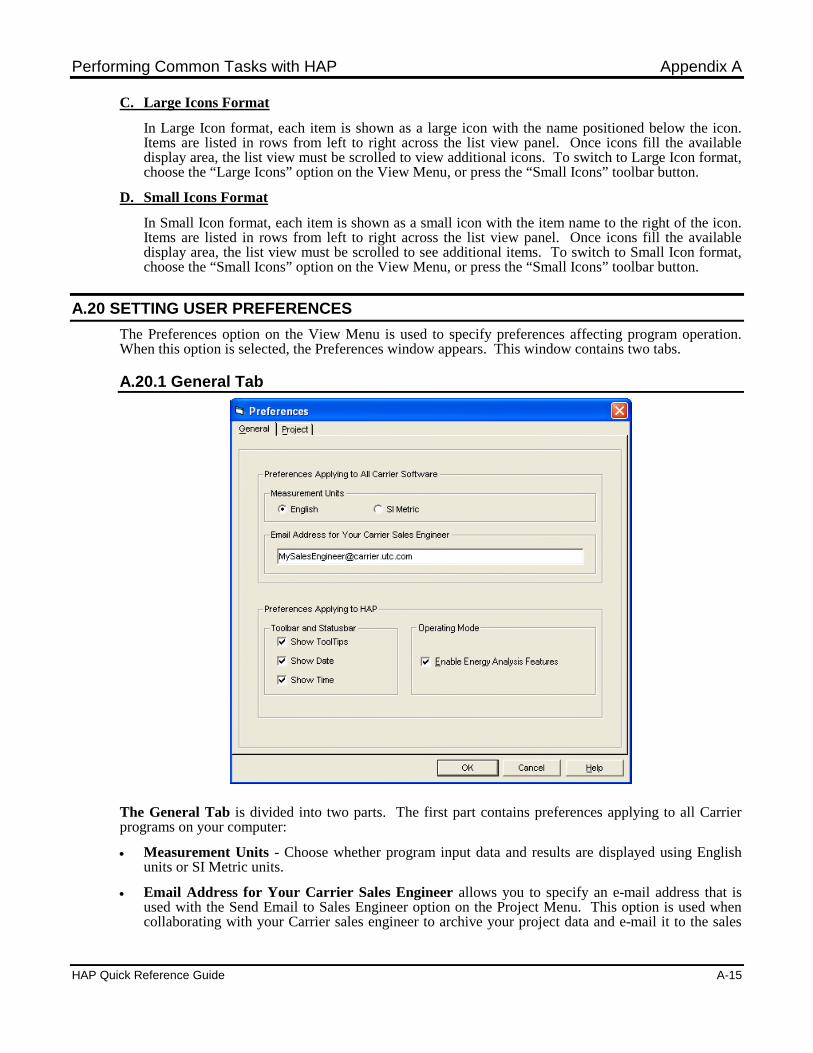
Performing Common Tasks with HAP Appendix A
HAP Quick Reference Guide A-15
C. Large Icons Format
In Large Icon format, each item is shown as a large icon with the name positioned below the icon.Items are listed in rows from left to right across the list view panel. Once icons fill the availabledisplay area, the list view must be scrolled to view additional icons. To switch to Large Icon format,choose the “Large Icons” option on the View Menu, or press the “Small Icons” toolbar button.
D. Small Icons Format
In Small Icon format, each item is shown as a small icon with the item name to the right of the icon.Items are listed in rows from left to right across the list view panel. Once icons fill the availabledisplay area, the list view must be scrolled to see additional items. To switch to Small Icon format,choose the “Small Icons” option on the View Menu, or press the “Small Icons” toolbar button.
A.20 SETTING USER PREFERENCES
The Preferences option on the View Menu is used to specify preferences affecting program operation.When this option is selected, the Preferences window appears. This window contains two tabs.
A.20.1 General Tab
The General Tab is divided into two parts. The first part contains preferences applying to all Carrierprograms on your computer:
Measurement Units - Choose whether program input data and results are displayed using Englishunits or SI Metric units.
Email Address for Your Carrier Sales Engineer allows you to specify an e-mail address that isused with the Send Email to Sales Engineer option on the Project Menu. This option is used whencollaborating with your Carrier sales engineer to archive your project data and e-mail it to the sales
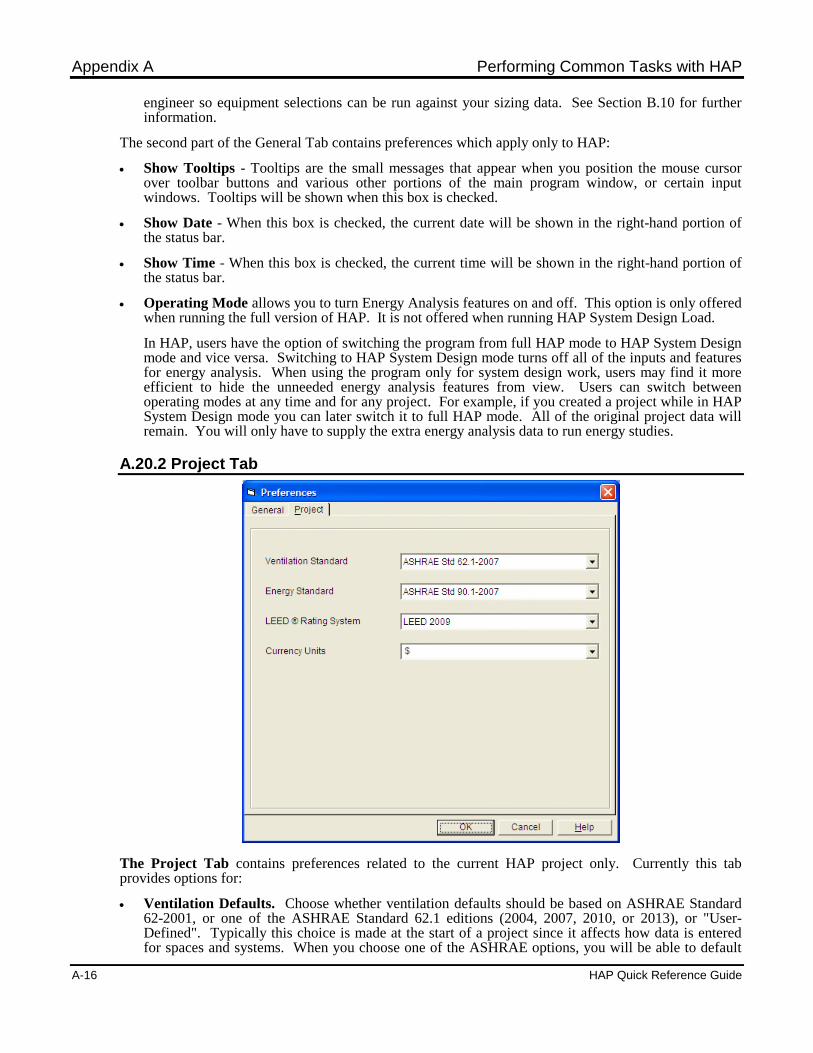
Appendix A Performing Common Tasks with HAP
A-16 HAP Quick Reference Guide
engineer so equipment selections can be run against your sizing data. See Section B.10 for furtherinformation.
The second part of the General Tab contains preferences which apply only to HAP:
Show Tooltips - Tooltips are the small messages that appear when you position the mouse cursorover toolbar buttons and various other portions of the main program window, or certain inputwindows. Tooltips will be shown when this box is checked.
Show Date - When this box is checked, the current date will be shown in the right-hand portion ofthe status bar.
Show Time - When this box is checked, the current time will be shown in the right-hand portion ofthe status bar.
Operating Mode allows you to turn Energy Analysis features on and off. This option is only offeredwhen running the full version of HAP. It is not offered when running HAP System Design Load.
In HAP, users have the option of switching the program from full HAP mode to HAP System Designmode and vice versa. Switching to HAP System Design mode turns off all of the inputs and featuresfor energy analysis. When using the program only for system design work, users may find it moreefficient to hide the unneeded energy analysis features from view. Users can switch betweenoperating modes at any time and for any project. For example, if you created a project while in HAPSystem Design mode you can later switch it to full HAP mode. All of the original project data willremain. You will only have to supply the extra energy analysis data to run energy studies.
A.20.2 Project Tab
The Project Tab contains preferences related to the current HAP project only. Currently this tabprovides options for:
Ventilation Defaults. Choose whether ventilation defaults should be based on ASHRAE Standard62-2001, or one of the ASHRAE Standard 62.1 editions (2004, 2007, 2010, or 2013), or "User-Defined". Typically this choice is made at the start of a project since it affects how data is enteredfor spaces and systems. When you choose one of the ASHRAE options, you will be able to default
Performing Common Tasks with HAP Appendix A
HAP Quick Reference Guide A-17
space ventilation requirements by selecting a space usage type. In addition, options will be offered insystem inputs for calculating ventilation airflow requirements that comply with the Standard. Whenyou choose "User-Defined", you will always be required to specify space ventilation requirementsyourself and the only ventilation calculation option will be "Sum of Space OA Airflows".
Energy Standard. Choose whether the energy standard used in this project will be ASHRAEStandard 90.1-2004, 90.1-2007, or 90.1-2010. This choice affects how HAP defaults minimumefficiencies for equipment. When the "ASHRAE Minimum Eqpt Efficiency" option is selected,instead of directly specifying equipment performance values like kW, EER, COP, SEER or HSPF oraverage efficiency (%), the program will default efficiencies based on the ASHRAE 90.1 standardyou select. In addition, you choice of the ASHRAE 90.1 standard here will determine the LEED®Rating System used in the project. Because each LEED® rating system relates to a specific editionof ASHRAE Standard 90.1, the two choices must be synchronized. ASHRAE 90.1-2004 is pairedwith LEED NC-2.2. ASHRAE 90.1-2007 is paired with LEED 2009.
LEED® Rating System. Choose whether the LEED® rating system used in this project will beLEED NC-2.2 or LEED 2009. This choice affects how the LEED EA Credit 1 Summary report isformatted. Formatting is customized to the rating system you select. As noted in the previous bullet,HAP automatically synchronizes the ASHRAE 90.1 energy standard with your LEED® Ratingsystem choice.
Currency Units. Specify the currency symbol or abbreviation to be used in this project. This inputwill be used for all program inputs and results involving cost. For example, if you specify "$" as thecurrency units, all energy and fuel prices will be based on $ and all energy cost reports will displaycosts in units of $.
A.20.3 Command Buttons
Finally, the window contains three buttons in the lower right-hand corner:
Press the OK button to apply any changes you’ve made to the preferences and then exit.. Press the Cancel button to exit without applying changes you’ve made to preferences. Press the Help button to display the overview help topic for this window.

[This page has been left blank intentionally]
HAP Quick Reference Guide B-1
Appendix B Performing Common Project Mgt Tasks
This appendix describes procedures used to perform various project management tasks. As noted inChapter 1, a project is a container for data from HAP and other Carrier programs. HAP provides awide variety of options for managing this data.
B.1 CREATING A NEW PROJECT
A new project is typically created when starting a design job. The project will serve as the container forall your input and calculation data for the job. To create a new project:
Choose the New option on the Project Menu.
If changes to the current project have not yet been saved, HAP will ask you if you want to save thecurrent project before creating a new one.
Then a new “Untitled” project will be created. No data for this project will be permanently storeduntil the first time you use the Save option on the Project Menu.
When you choose the Save option on the Project Menu, you’ll be asked to name the project.
B.2 OPENING AN EXISTING PROJECT
Before you can enter data, edit data and generate reports for an existing project, you first need to openthe project:
Choose the Open option on the Project Menu.
The Open Project window will appear. It contains a list of all existing projects arranged inalphabetical order. Select the desired project from this list.
If changes to the current project have not yet been saved, HAP will ask you if you want to save thecurrent project before opening another one.
Then the project you selected will be loaded into memory. When you are returned to the HAP mainprogram window, data for the project you selected will be displayed.
B.3 SAVING A PROJECT
The Save option on the Project Menu is used to permanently store data you entered or changes you’vemade to a project. While working with a project, its data is stored in temporary copies of the project datafiles. Saving the project copies your new data and your modified data to permanent storage. To save aproject, simply choose the Save option on the Project Menu. Note that when you save a new project forthe first time, you will be asked to name the project. Thereafter, when you save the project data will besaved under this project name automatically.
By default the program will save data under \E20-II\PROJECTS in a folder whose name is the same asthe project name. Many users elect to accept this storage convention. However, for those who wish tosave the data elsewhere, the software provides a feature to save the project in any folder on any drive
Appendix B Performing Common Project Management Tasks
B-2 HAP Quick Reference Guide
accessible to your computer. The only requirement is that when the project is first saved the storagefolder must be empty.
As a sound data management practice, we recommend saving the project periodically as you work with it.If you ever need to undo a mistake you’ve made, you can re-open the project without saving it. Thisrestores the project data from your last project save, but any changes made since the last save will be lost.If project data is saved frequently, undoing a mistake will only cause a small amount of data to be lost.
B.4 SAVING A PROJECT AS A NEW PROJECT
The Save As option on the Project Menu is used to store changes to your current project data in a newproject rather than the existing project. Typically this feature is used when making a copy of a project.To save a project as a new project:
First choose the Save As option on the Project Menu.
You will be asked to specify a name for the new project. By default the project will be saved under\E20-II\PROJECTS in a folder whose name is the same as the project name. However, users mayoverride this default and save the data in any other folder. The only requirement is that when theproject is first saved the folder must be empty.
HAP then saves your current project data in the new project folder and closes the old project. Allsubsequent changes to project data and saving of project data will affect the new project you created.
B.5 DELETING A PROJECT
To delete a project:
First, choose the Delete option on the Project Menu. The Delete Project window will appear.
On the Delete Project window choose the project you wish to delete.
HAP data files for the selected project will then be erased. If the project only contained HAP data,the project itself will be erased. However, if the project contained data from other programs, theproject will remain in existence along with the data from these other programs.
Example: A project contains HAP and AHUBuilder data. You choose the Project/Delete option fromwithin HAP. Only the HAP data will be erased. The project will continue to exist and will containonly data for AHUBuilder.
The Project/Delete option should be used with care. When project data is deleted it is permanently lostand cannot be recovered.
B.6 EDITING PROJECT PROPERTIES
The Properties option on the Project Menu is used to enter or change the descriptive information for aproject. When this menu option is selected the Project Properties window appears. It contains thedescriptive items listed below. Of these the Project Name is the only item that must be defined since it isused throughout HAP for various purposes. All of the other items are for the user’s own reference andare therefore optional.
Project Name: A reference name for the project. It appears on all HAP reports, in the title bar of theHAP main program window and on selection lists when opening and deleting projects. It isimportant to use a descriptive name for the project so you can easily determine what data the projectcontains. Note that after a project has been saved for the first time its project name cannot bechanged, except by using the Save As option on the Project Menu.
Job Number: A reference number for the project. Users often enter the internal billing number orcompany reference number for the project here.
Performing Common Project Management Tasks Appendix B
HAP Quick Reference Guide B-3
Contact Type: An item that defines who the client for the project is: a contractor, owner, architect,etc…
Contact Name: The name of the client or a person in the client’s firm who is the contact for thisproject.
Salesperson: The name of the salesperson working with you on the project to supply HVACequipment information.
Date: A significant date for the project. Some users specify the date the project was created. Othersspecify the contract date or a delivery date.
Notes: Notes concerning the status of the project or any other pertinent information.
Press the OK button on the Project Properties window to exit and save the changes you made. Press theCancel button on the Project Properties window to exit without saving changes.
B.7 ARCHIVING A PROJECT
The Archive option on the Project menu saves project data in one compressed file for safekeeping. Aproject is typically archived when saving it for backup storage, for future reference, or when transferringdata from one computer to another. In order to archive data for a project:
First open the project you wish to archive. When you choose the Archive option, HAP data for thecurrently open project will be archived.
Choose the Archive option on the Project Menu.
You will then be asked to specify the name of the archive file and the destination drive and folderwhere the archive file will be written. Use a descriptive name for the archive file so you will be ableto recognize it easily when you need to use it in the future. The destination folder you specify can beon a hard disk drive or on removable media such as a zip drive or floppy disks. When using floppydisks, it is helpful to have a set of formatted floppies ready. While the archive software willautomatically format disks, the archive runs faster if you use pre-formatted floppies. Once a filename and folder has been specified, press the Save button.
The program then compresses the HAP data files for the current project, placing the data in a singleZIP-format file in the destination folder you specified. When archiving to floppy disks, the archivefile will be spanned across multiple floppies if this is necessary.
Note: Archiving data does not remove it from the project. It merely stores a copy of the data forsafekeeping. You can continue working with the current project data after it has been archived.
B.8 RETRIEVING A PROJECT
The Retrieve option on the Project menu restores data that was previously archived using theProject/Archive option. The Archive option saves project data in one compressed file for safekeeping.The Retrieve option uncompresses the archive data and makes it available for use again. A project istypically retrieved when receiving archive data from another computer, when referring to an old projectthat was archived for safekeeping, or when restoring backup data after a hard disk failure. In order toretrieve data for a project:
First create a new project or open the project you want to retrieve data into. Data is always retrievedinto the currently open project. Often users create a new project to receive retrieved data so existingdata will not be overwritten. For example, if the current project contains HAP data, when youretrieve archived HAP data it will replace all of the current data. Thus, if you do not want to losedata in the current project, you must create a new project before retrieving.
Choose the Retrieve option on the Project Menu. The program will display a window asking you toidentify the archive file you wish to retrieve data from.
Appendix B Performing Common Project Management Tasks
B-4 HAP Quick Reference Guide
Once a file is identified, the program will display its vital statistics. These statistics include the nameof the archived project and the data contained in the archive. You are asked to confirm that this isthe archive data you want to retrieve. Press the Retrieve button to begin retrieval, or the Browsebutton to select a different archive file.
The selected data will then be retrieved from the archive file and placed in the current project. Whenyou return to the HAP main program window, the HAP data you retrieved will be displayed.
B.9 CONVERTING DATA FROM PREVIOUS VERSIONS
The “Convert” options on the Project Menu are used to convert data from prior versions of HAP for usein the current version. Typically these options are used when you started a project with a previousversion of HAP and want to complete the work using the new version. The procedure for convertingprevious version data varies depending on whether the previous version is HAP v4.x (i.e. Windows-basedsoftware) or HAP v3.2 (DOS-based software). Each procedure will be discussed below.
B.9.1 Converting v4.x Data
HAP v4.x data can be converted from either an active project or an archive file. An active project is onethat would appear on the Open Project window if you set the project filter to a specific earlier versionsuch as “Hourly Analysis Program v4.8”. An archive file is a .E3A file you produced using the“Archive” option in the previous version of HAP to store project data for backup or archival purposes.Procedures for converting data from each source are provided below.
A. Converting an Archive File
This procedure applies for the case where previous version data is stored in an .E3A archive file. Datain the archive file will be extracted and then converted to current HAP format. Data will be saved in thecurrent HAP project folder.
1. Run the current version of HAP.
2. Select the project in which converted data will be stored.
a. Users typically use the New option on the Project Menu to create a new, untitled project and thensave this project after converting the data.
b. An alternative is to use the Open option on the Project Menu to open an existing project.However, if that project already contains current HAP data the existing data will be replaced byconverted data and will be lost. Therefore using Project/Open should only be done when theexisting project doesn’t yet have current version data or loss of the existing data is not a concern.
3. Start the conversion process by choosing “Convert HAP v4.x Data” on the Project Menu.
4. If an existing project was opened in step 2, a message will appear warning that current HAP data inthe project will be overwritten by converted data. If it is OK to proceed, press the Yes button.
5 On the “Convert HAP v4.x Data” window, press the “Archive File” button, indicating you want toconvert data from an archive file.
6. In the File Open window choose the archive file you wish to convert data from. For example, thismight be an archive file containing HAP v4.8 data.
7. The contents of the archive file will be extracted and then converted a format required by the currentversion of HAP. At the end of the conversion a message will appear indicating whether theconversion was successful.
8. After inspecting the converted data, use the Save option on the Project Menu to save the data
Performing Common Project Management Tasks Appendix B
HAP Quick Reference Guide B-5
B. Converting Data in an Active Project
This procedure applies for the case where the previous version data is in an active project. This oldversion data will be converted to current HAP data format and saved in the same project folder as theoriginal data.
1. Run the current version of HAP.
2. Select the project containing data to be converted.
a. Choose the Open option on Project Menu.
b. In the Open Project window change the filter at the bottom of the window to the specificprevious version, such as “Hourly Analysis Program v4.8” if converting from v4.8 This willdisplay a list of projects containing data from that version of HAP. You can also set the filter to“Show All Projects” if desired.
c. Choose the desired project from the list. If this project has never been opened with the currentversion of HAP before, a blank set of files in the current format will be created when you openthe project. Thus, when you return to the main window you’ll see a project containing no datayet. Continue with steps 3 thru 6 to fill it with converted data.
3. Start the conversion process by choosing “Convert HAP v4.x Data” on the Project Menu.
4. A message will appear warning that current version data the project will be overwritten by converteddata. This is OK since at this point you have a blank set of current data in the project. Press “Yes”to continue.
5 On the “Convert HAP v4.x Data” window, press the “Active Project” button, indicating you want toconvert data from an active project.
6. Old version data in the project will then be converted to the format required by the current version ofHAP. At the end of the conversion a message will appear indicating whether the conversion wassuccessful.
7. After inspecting the converted data, use the Save option on the Project Menu to save the data.
B.9.2 Converting v3.2 Data
This scenario applies when converting data from a HAP v3.2 project. It also applies when convertingdata from a System Design Load v1.2 project. Both were old DOS-based versions of HAP releasedbetween 1995 and 1999. To convert this data:
First, make sure the data you wish to convert has been loaded into a project folder for the DOSprogram. For example, when converting from HAP v3.2, the data being converted must be stored inone of the HAP v3.2 data folders. Note that it is not possible to convert data directly from a HAPv3.2 archive file. The archive file must first be retrieved into a HAP v3.2 project folder.
Next, while running the current version of HAP, open the project you want to place the converteddata in. In many cases, users will create a new project and place converted data in this project toavoid overwriting and destroying data in an existing project.
Then choose the “Convert HAP v3.2 Project Data” option on the Project Menu. A window willappear. It is used to identify the data folder containing data you want to convert. HAP v3.2 andSystem Design Load v1.2 stored data in a rigid tree structure. Therefore, if you are looking for HAPv3.2 data folders, they will be found beneath the \E20-II\HAP32 folder. If you are looking forSystem Design Load v1.2 data folders, they will be found beneath the \E20-II\SDL12 folder.
Choose the data folder containing the data you wish to convert.
Appendix B Performing Common Project Management Tasks
B-6 HAP Quick Reference Guide
Then the program reads data from the HAP v3.2 or System Design Load v1.2 data folder, converts itto a format compatible with the current version of HAP and saves the data in the current project.When the conversion is finished, the program displays a message indicating whether the datatranslation was successful. Press the Help button in this message window for further informationabout the translation process and for tips on how to work with the data once it is available in thecurrent version of HAP.
Note that the following categories of data are converted from HAP v3.2 and System Design Loadv1.2: design weather, spaces, air systems, schedules, walls, roofs, windows, doors and externalshades. The following categories of data are not converted because of significant compatibilityissues: simulation weather data, calendar data, electric rates, fuel rates, plants and buildings.
Finally, when you return to the HAP main program window, the data you converted will bedisplayed.
B.9.3 How Previous Version Data is Converted
When data from a previous version of HAP is converted to be compatible with the current version, it is“translated” rather than “transferred”. It is important to make a distinction between “translation” of dataand “transfer” of data:
“Data Transfer” refers to the simple copying of data. The result of a data transfer is an exact copy ofthe original data. No data is added, deleted or modified.
The result of “Data Translation” is the original data with missing items added, unusable itemsdiscarded and other items reorganized.
Fortunately translation of data from one version of HAP to the next preserves the vast majority of yourdata. To view information about items adjusted during translation and about which categories of data areconverted, press the Help button in the status message window that appears at the end of the translationprocess.
B.10 PUBLISHING EQUIPMENT SIZING REQUIREMENTS FOR USE IN ECAT
The Publish Equipment Sizing Requirements option on the Project Menu is used to electronically linkHAP sizing results with Carrier Electronic Catalog (E-CAT) to make selecting equipment faster andeasier. A toolbar button is also provided for this purpose.
The traditional process for equipment selections involves first running a system design tool like HAP togenerate equipment sizing requirements, then printing the requirements, and finally manually entering therequirements into an equipment selection tool like E-CAT. With the Publish option in HAP the printingand manual data entry steps are eliminated. Once you Publish equipment sizing requirements, the data isimmediately available to drive equipment selections in E-CAT.
There are two ways to use the Publish feature to make equipment selections easier. The first is thecollaboration scenario where you are doing the design work and your Carrier sales engineer is assistingyou with selections. This procedure is described in part A below. The second is the do-it-yourselfscenario where you are doing both the design work and the equipment selections. This procedure isdescribed in part B below.
A. Collaboration Scenario
1. Use HAP to perform sizing calculations for your air systems and plants (if applicable).
2. When the design is finished and you're ready for equipment selection, select the "Publish EquipmentSizing Requirements" option on the Project Menu, or click the corresponding toolbar button.
3. In the Publish Equipment Sizing Requirements window (Figure B10.1) select the systems and/orplants whose sizing requirements you wish to publish. This window consists of a list of all systemsand plants in the current project for which sizing calculations have been run. To select an item in the
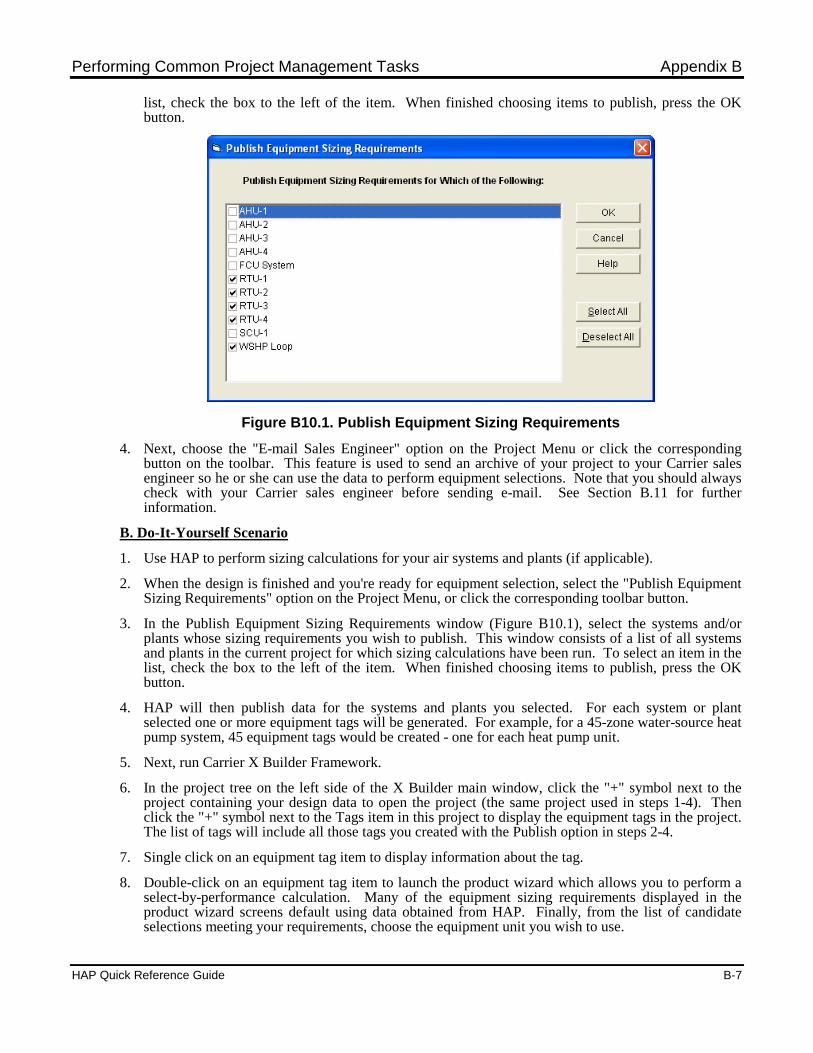
Performing Common Project Management Tasks Appendix B
HAP Quick Reference Guide B-7
list, check the box to the left of the item. When finished choosing items to publish, press the OKbutton.
Figure B10.1. Publish Equipment Sizing Requirements
4. Next, choose the "E-mail Sales Engineer" option on the Project Menu or click the correspondingbutton on the toolbar. This feature is used to send an archive of your project to your Carrier salesengineer so he or she can use the data to perform equipment selections. Note that you should alwayscheck with your Carrier sales engineer before sending e-mail. See Section B.11 for furtherinformation.
B. Do-It-Yourself Scenario
1. Use HAP to perform sizing calculations for your air systems and plants (if applicable).
2. When the design is finished and you're ready for equipment selection, select the "Publish EquipmentSizing Requirements" option on the Project Menu, or click the corresponding toolbar button.
3. In the Publish Equipment Sizing Requirements window (Figure B10.1), select the systems and/orplants whose sizing requirements you wish to publish. This window consists of a list of all systemsand plants in the current project for which sizing calculations have been run. To select an item in thelist, check the box to the left of the item. When finished choosing items to publish, press the OKbutton.
4. HAP will then publish data for the systems and plants you selected. For each system or plantselected one or more equipment tags will be generated. For example, for a 45-zone water-source heatpump system, 45 equipment tags would be created - one for each heat pump unit.
5. Next, run Carrier X Builder Framework.
6. In the project tree on the left side of the X Builder main window, click the "+" symbol next to theproject containing your design data to open the project (the same project used in steps 1-4). Thenclick the "+" symbol next to the Tags item in this project to display the equipment tags in the project.The list of tags will include all those tags you created with the Publish option in steps 2-4.
7. Single click on an equipment tag item to display information about the tag.
8. Double-click on an equipment tag item to launch the product wizard which allows you to perform aselect-by-performance calculation. Many of the equipment sizing requirements displayed in theproduct wizard screens default using data obtained from HAP. Finally, from the list of candidateselections meeting your requirements, choose the equipment unit you wish to use.

Appendix B Performing Common Project Management Tasks
B-8 HAP Quick Reference Guide
B.11 E-MAILING PROJECT DATA TO YOUR CARRIER SALES ENGINEER
The Send Email to Sales Engineer option on the Project Menu is used to automatically archive thecurrent project and e-mail it to your Carrier sales engineer so the sales engineer can perform equipmentselections against your data.
Integration features that link HAP with the Carrier Electronic Catalog (E-CAT) Builder programs aresteadily being added. These electronic links between HAP and Builder programs can increase yourproductivity. It is no longer necessary to print the sizing results and manually enter the data into aBuilder program to run selections. Now this data can flow electronically between programs.
You can use HAP sizing results in a Carrier E-CAT Builder to select equipment yourself. Or youcollaborate with your sales engineer to have the sales engineer do the selections. In the latter case, the"Send Email to Sales Engineer" feature helps with this collaboration.
When collaborating with your Carrier sales engineer, its important to do four things before using the"Send Email..." feature:
Contact your Carrier sales engineer to make sure he or she is able to assist you with equipmentselections.
Make sure you have specified the e-mail address of your Carrier sales engineer via the Preferencesoption on the View Menu.
Make sure you have finished running system design calculations for your systems in your project. Use the Publish Equipment Sizing Requirements button on the HAP toolbar to generate the
requirements needed by E-CAT programs for making selections.
Once you're ready to send data, steps in the process are as follows:
1. Select the "Send Email to Sales Engineer" option on the Project Menu or press the "Send Email..."button on the toolbar.
2. HAP will automatically save your current project, if necessary.
3. HAP will then automatically archive the project. You'll be asked to name the archive file.
4. HAP will then launch your e-mail software, create an e-mail addressed to your Carrier sales engineerand attach the archive file to the e-mail.
5. You will need to add the subject for the e-mail and write the e-mail message asking your salesengineer to select equipment against the systems in your project. Finally press the Send button tosend the e-mail.
Notes:
a. The "Send Email..." feature requires that you use e-mail software installed on your computer harddisk. This is called "client-based" e-mail. In addition the software must comply with the MicrosoftMAPI standard for email messaging. Most client-based e-mail software does comply. Examplesinclude Microsoft Outlook and Eudora. Note that if you use web-based e-mail like Yahoo orHotmail, the feature will not work. In that case you use an the alternate approach - use the archiveoption on the Project Menu to archive your project and then compose an e-mail to your salesengineer and attach your archive file.
b. Some configurations of computers, computer networks, or e-mail software will prevent the "SendEmail..." feature from working. This is typically due to security settings that prevent a softwareprogram from remotely launching your e-mail program or from remotely creating e-mail messages. Ifthis problem exists, an error message will appear when you try to use the "Send Email..." feature.One possible solution is to make sure your e-mail software is running before you use the feature inHAP. If this does not resolve the problem, you will need to create and send the e-mail yourself byrunning your e-mail software, creating a message and attaching the HAP archive file.
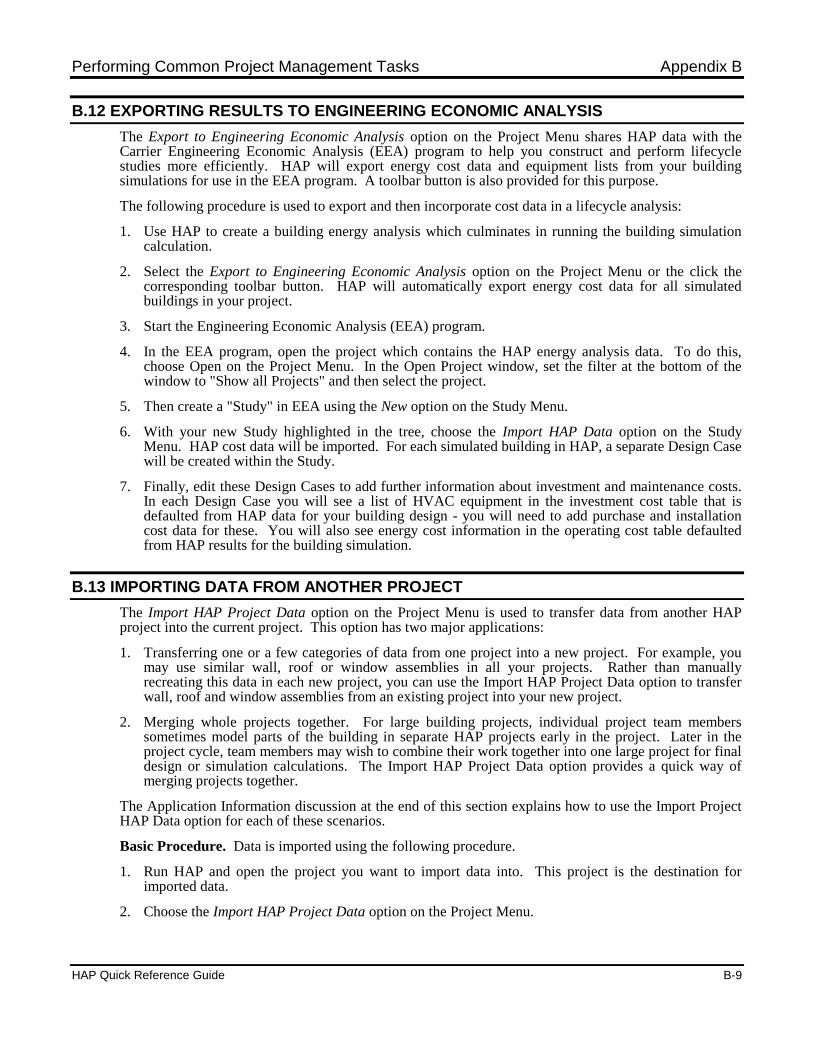
Performing Common Project Management Tasks Appendix B
HAP Quick Reference Guide B-9
B.12 EXPORTING RESULTS TO ENGINEERING ECONOMIC ANALYSIS
The Export to Engineering Economic Analysis option on the Project Menu shares HAP data with theCarrier Engineering Economic Analysis (EEA) program to help you construct and perform lifecyclestudies more efficiently. HAP will export energy cost data and equipment lists from your buildingsimulations for use in the EEA program. A toolbar button is also provided for this purpose.
The following procedure is used to export and then incorporate cost data in a lifecycle analysis:
1. Use HAP to create a building energy analysis which culminates in running the building simulationcalculation.
2. Select the Export to Engineering Economic Analysis option on the Project Menu or the click thecorresponding toolbar button. HAP will automatically export energy cost data for all simulatedbuildings in your project.
3. Start the Engineering Economic Analysis (EEA) program.
4. In the EEA program, open the project which contains the HAP energy analysis data. To do this,choose Open on the Project Menu. In the Open Project window, set the filter at the bottom of thewindow to "Show all Projects" and then select the project.
5. Then create a "Study" in EEA using the New option on the Study Menu.
6. With your new Study highlighted in the tree, choose the Import HAP Data option on the StudyMenu. HAP cost data will be imported. For each simulated building in HAP, a separate Design Casewill be created within the Study.
7. Finally, edit these Design Cases to add further information about investment and maintenance costs.In each Design Case you will see a list of HVAC equipment in the investment cost table that isdefaulted from HAP data for your building design - you will need to add purchase and installationcost data for these. You will also see energy cost information in the operating cost table defaultedfrom HAP results for the building simulation.
B.13 IMPORTING DATA FROM ANOTHER PROJECT
The Import HAP Project Data option on the Project Menu is used to transfer data from another HAPproject into the current project. This option has two major applications:
1. Transferring one or a few categories of data from one project into a new project. For example, youmay use similar wall, roof or window assemblies in all your projects. Rather than manuallyrecreating this data in each new project, you can use the Import HAP Project Data option to transferwall, roof and window assemblies from an existing project into your new project.
2. Merging whole projects together. For large building projects, individual project team memberssometimes model parts of the building in separate HAP projects early in the project. Later in theproject cycle, team members may wish to combine their work together into one large project for finaldesign or simulation calculations. The Import HAP Project Data option provides a quick way ofmerging projects together.
The Application Information discussion at the end of this section explains how to use the Import ProjectHAP Data option for each of these scenarios.
Basic Procedure. Data is imported using the following procedure.
1. Run HAP and open the project you want to import data into. This project is the destination forimported data.
2. Choose the Import HAP Project Data option on the Project Menu.
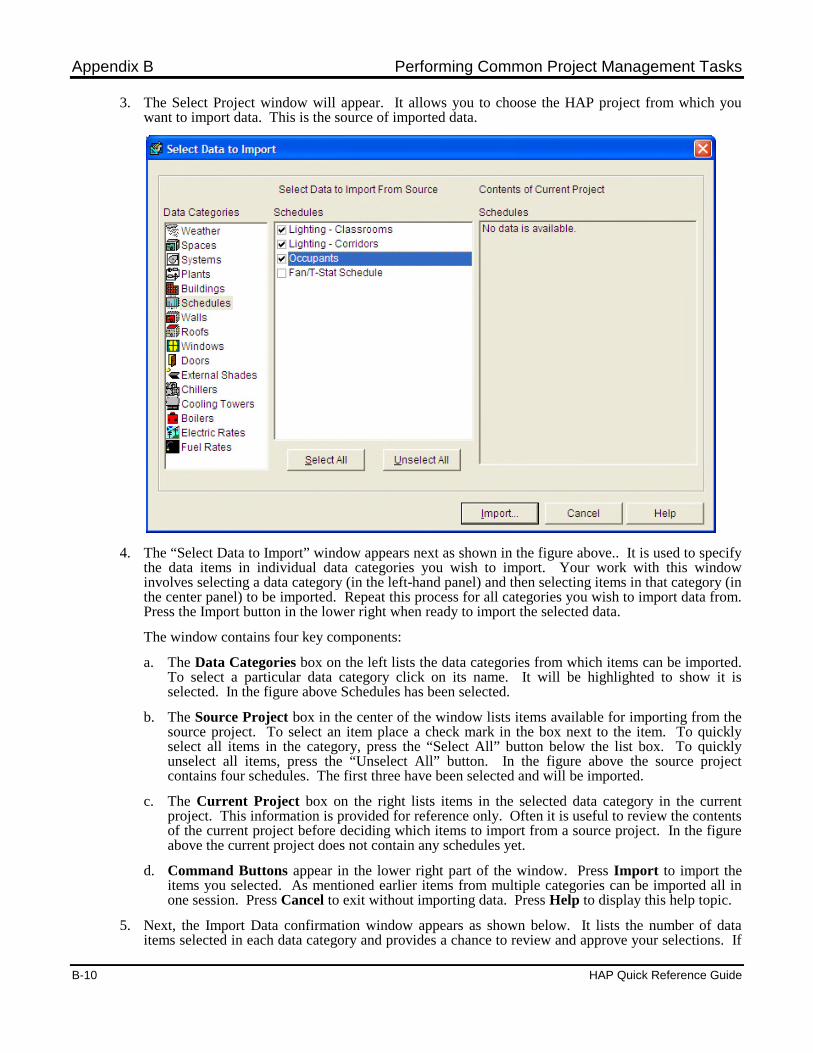
Appendix B Performing Common Project Management Tasks
B-10 HAP Quick Reference Guide
3. The Select Project window will appear. It allows you to choose the HAP project from which youwant to import data. This is the source of imported data.
4. The “Select Data to Import” window appears next as shown in the figure above.. It is used to specifythe data items in individual data categories you wish to import. Your work with this windowinvolves selecting a data category (in the left-hand panel) and then selecting items in that category (inthe center panel) to be imported. Repeat this process for all categories you wish to import data from.Press the Import button in the lower right when ready to import the selected data.
The window contains four key components:
a. The Data Categories box on the left lists the data categories from which items can be imported.To select a particular data category click on its name. It will be highlighted to show it isselected. In the figure above Schedules has been selected.
b. The Source Project box in the center of the window lists items available for importing from thesource project. To select an item place a check mark in the box next to the item. To quicklyselect all items in the category, press the “Select All” button below the list box. To quicklyunselect all items, press the “Unselect All” button. In the figure above the source projectcontains four schedules. The first three have been selected and will be imported.
c. The Current Project box on the right lists items in the selected data category in the currentproject. This information is provided for reference only. Often it is useful to review the contentsof the current project before deciding which items to import from a source project. In the figureabove the current project does not contain any schedules yet.
d. Command Buttons appear in the lower right part of the window. Press Import to import theitems you selected. As mentioned earlier items from multiple categories can be imported all inone session. Press Cancel to exit without importing data. Press Help to display this help topic.
5. Next, the Import Data confirmation window appears as shown below. It lists the number of dataitems selected in each data category and provides a chance to review and approve your selections. If
Performing Common Project Management Tasks Appendix B
HAP Quick Reference Guide B-11
the quantities are correct, press the Yes button to continue. To revise selections press the No buttonto return to the Select Data to Import window.
6. The data you selected will then be imported from the source project into the current project. A statusmonitor will show the progress of this work.
7. When data has been imported a confirmation window will appear. Its appearance is similar to theImport Window shown above. Its purpose is to confirm the data imported successfully. In mostcases the quantities shown in the confirmation window will match those in the original Import Datawindow. However, when you select data categories with linked items, the number of items shown asimported on the second confirmation window will be larger than on the first. For example, if youselected spaces to be imported, these spaces may link to one or more schedules, wall, roof, windowor door assemblies, or to external shade geometries. To provide a complete representation of thespaces you requested, HAP will automatically identify and import all linked schedules, walls, roofs,windows, doors, and shade geometries. These linked items will then be included in the tally on thesecond confirmation screen. Data categories in a HAP project that have linked items are spaces, airsystems, plants, buildings and, in some cases, electric rates and fuel rates.
Application Information. The general steps above should be applied as follows for the two majorapplications of the Import HAP Project Data option:
(A) Transferring One or a Few Categories of Data from One Project to Another
1. Run HAP. Open the "destination" project you want to import data into. This is often a newproject..
2. Choose the Import HAP Project Data option on the Project Menu.
3. Select the "source" project from which data will be imported. This may be another existingproject or a project you have set up as a "template", containing commonly used data that youimport into each new project you create.
Appendix B Performing Common Project Management Tasks
B-12 HAP Quick Reference Guide
4. In “Select Data to Import” window choose the first data category you wish to import in the left-hand panel, and then the individual items you wish to import from that category in the middlepanel.
5. Repeat step 4 for each category of data you want to import.
6. Click the Import button.
7. Check the data on the confirmation window. If data is correct, press Yes to import the data.
(B) Merging Whole Projects
1. Run HAP. Open the "destination" project you want to import data into. This could be a newproject, or more frequently it will be an existing project that contains a portion of the buildingyou are modeling.
2. Choose the Import HAP Project Data option on the Project Menu.
3. Select the "source" project from which data will be imported. This will be a project containingone of the other portions of the building being modeled.
4. In “Select Data to Import” window choose the "Building" category in the left-hand panel.Typically for merge scenarios, there will only be one Building item in the project. Check the boxto select that item.
5. Click the Import button.
6. Check the data on the confirmation window. If data is correct, press OK to import the data.
7. Repeat steps 2 through 6 if there are further projects containing portions of the building that needto be merged into the current project.
As noted earlier, the Import option imports the data you selected and the software identifies all linkeditems and automatically imports those as well. Therefore if you select one Building item for import,HAP will import that Building and will automatically import all plants, air systems, spaces,schedules, walls, roofs, windows, doors, shades, chillers, towers, boilers, electric rates and fuel ratesit identifies as linked to that Building. In this way the full content of a building from the sourceproject can be combined into the destination project.
B.14 IMPORTING DATA FROM CAD AND BIM SOFTWARE
The Import gbXML Data option on the Project Menu is used to read data from a gbXML-format filecreated by another software program and use it to automatically generate HAP space, wall, roof, window,door and schedule data. This feature can help you greatly reduce the time and effort needed to transferbuilding information from floor plan drawings into HAP for use in load calculations and energy analyses.For example, you might use a computer aided drafting (CAD) or building information modeling (BIM)tool to extract floor plan information from drawing files and write the data in gbXML format, and thenuse HAP to read the gbXML to produce spaces and construction data. This electronic transfer replacesthe manual process of taking data off drawings and manually entering it into HAP.
About gbXML. gbXML is increasingly being used as a neutral format for exchanging building databetween such tools as Computer Aided Drafting (CAD), Building Information Modeling (BIM) andengineering analysis software programs. “gbXML” stands for “green building XML”. “XML stands for“extensible mark-up language” which is a language for representing information. While the namesuggests a use for green building applications, gbXML is usable for any application, green or otherwise.Certain software vendors offer tools to produce gbXML-format files from CAD drawings or BIM data.As long as a tool generates gbXML data which conforms to the gbXML “schema” (the rules forformatting the data) v0.34 or later HAP will be able to read and translate the gbXML data.
Typical Operating Procedure. The typical procedure for creating, importing and using gbXML datagenerated from CAD drawings involves the following steps.
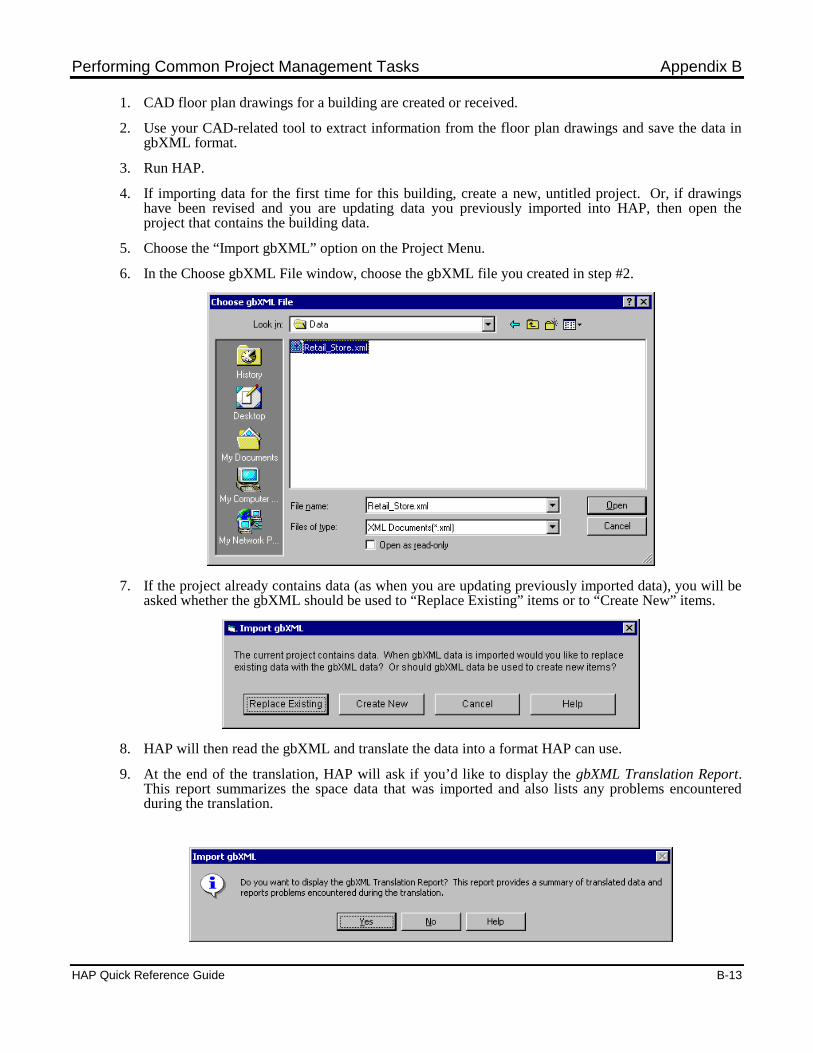
Performing Common Project Management Tasks Appendix B
HAP Quick Reference Guide B-13
1. CAD floor plan drawings for a building are created or received.
2. Use your CAD-related tool to extract information from the floor plan drawings and save the data ingbXML format.
3. Run HAP.
4. If importing data for the first time for this building, create a new, untitled project. Or, if drawingshave been revised and you are updating data you previously imported into HAP, then open theproject that contains the building data.
5. Choose the “Import gbXML” option on the Project Menu.
6. In the Choose gbXML File window, choose the gbXML file you created in step #2.
7. If the project already contains data (as when you are updating previously imported data), you will beasked whether the gbXML should be used to “Replace Existing” items or to “Create New” items.
8. HAP will then read the gbXML and translate the data into a format HAP can use.
9. At the end of the translation, HAP will ask if you’d like to display the gbXML Translation Report.This report summarizes the space data that was imported and also lists any problems encounteredduring the translation.
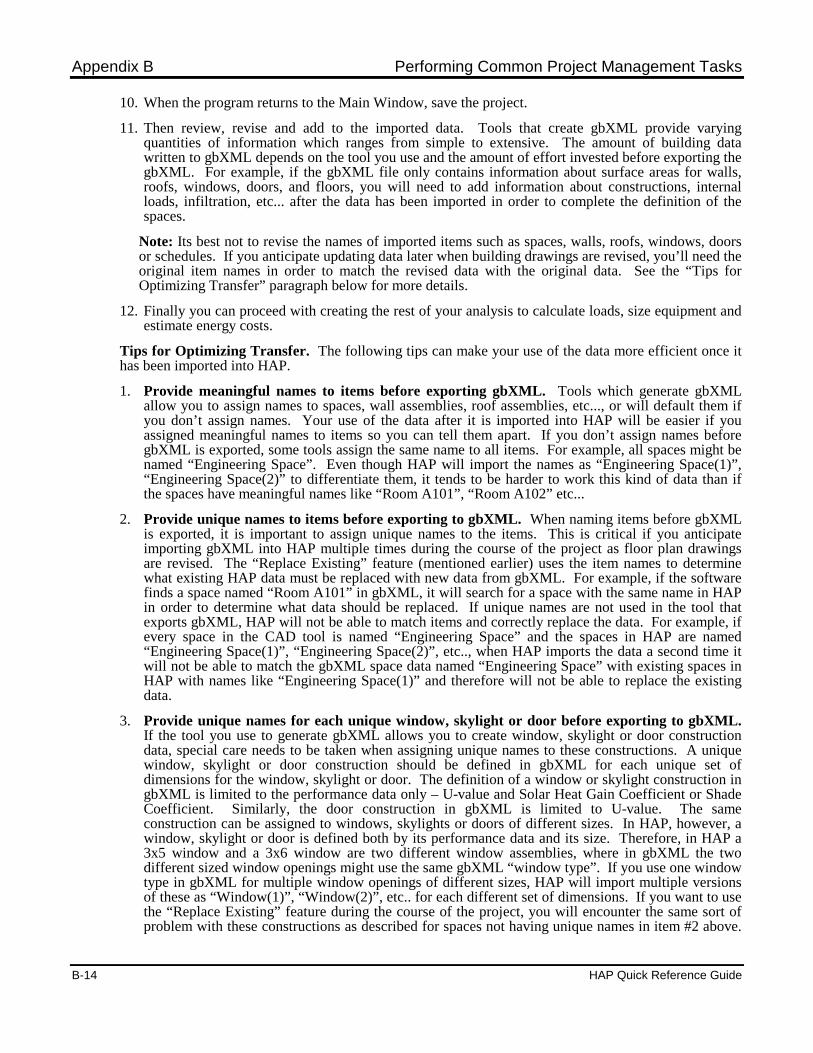
Appendix B Performing Common Project Management Tasks
B-14 HAP Quick Reference Guide
10. When the program returns to the Main Window, save the project.
11. Then review, revise and add to the imported data. Tools that create gbXML provide varyingquantities of information which ranges from simple to extensive. The amount of building datawritten to gbXML depends on the tool you use and the amount of effort invested before exporting thegbXML. For example, if the gbXML file only contains information about surface areas for walls,roofs, windows, doors, and floors, you will need to add information about constructions, internalloads, infiltration, etc... after the data has been imported in order to complete the definition of thespaces.
Note: Its best not to revise the names of imported items such as spaces, walls, roofs, windows, doorsor schedules. If you anticipate updating data later when building drawings are revised, you’ll need theoriginal item names in order to match the revised data with the original data. See the “Tips forOptimizing Transfer” paragraph below for more details.
12. Finally you can proceed with creating the rest of your analysis to calculate loads, size equipment andestimate energy costs.
Tips for Optimizing Transfer. The following tips can make your use of the data more efficient once ithas been imported into HAP.
1. Provide meaningful names to items before exporting gbXML. Tools which generate gbXMLallow you to assign names to spaces, wall assemblies, roof assemblies, etc..., or will default them ifyou don’t assign names. Your use of the data after it is imported into HAP will be easier if youassigned meaningful names to items so you can tell them apart. If you don’t assign names beforegbXML is exported, some tools assign the same name to all items. For example, all spaces might benamed “Engineering Space”. Even though HAP will import the names as “Engineering Space(1)”,“Engineering Space(2)” to differentiate them, it tends to be harder to work this kind of data than ifthe spaces have meaningful names like “Room A101”, “Room A102” etc...
2. Provide unique names to items before exporting to gbXML. When naming items before gbXMLis exported, it is important to assign unique names to the items. This is critical if you anticipateimporting gbXML into HAP multiple times during the course of the project as floor plan drawingsare revised. The “Replace Existing” feature (mentioned earlier) uses the item names to determinewhat existing HAP data must be replaced with new data from gbXML. For example, if the softwarefinds a space named “Room A101” in gbXML, it will search for a space with the same name in HAPin order to determine what data should be replaced. If unique names are not used in the tool thatexports gbXML, HAP will not be able to match items and correctly replace the data. For example, ifevery space in the CAD tool is named “Engineering Space” and the spaces in HAP are named“Engineering Space(1)”, “Engineering Space(2)”, etc.., when HAP imports the data a second time itwill not be able to match the gbXML space data named “Engineering Space” with existing spaces inHAP with names like “Engineering Space(1)” and therefore will not be able to replace the existingdata.
3. Provide unique names for each unique window, skylight or door before exporting to gbXML.If the tool you use to generate gbXML allows you to create window, skylight or door constructiondata, special care needs to be taken when assigning unique names to these constructions. A uniquewindow, skylight or door construction should be defined in gbXML for each unique set ofdimensions for the window, skylight or door. The definition of a window or skylight construction ingbXML is limited to the performance data only – U-value and Solar Heat Gain Coefficient or ShadeCoefficient. Similarly, the door construction in gbXML is limited to U-value. The sameconstruction can be assigned to windows, skylights or doors of different sizes. In HAP, however, awindow, skylight or door is defined both by its performance data and its size. Therefore, in HAP a3x5 window and a 3x6 window are two different window assemblies, where in gbXML the twodifferent sized window openings might use the same gbXML “window type”. If you use one windowtype in gbXML for multiple window openings of different sizes, HAP will import multiple versionsof these as “Window(1)”, “Window(2)”, etc.. for each different set of dimensions. If you want to usethe “Replace Existing” feature during the course of the project, you will encounter the same sort ofproblem with these constructions as described for spaces not having unique names in item #2 above.
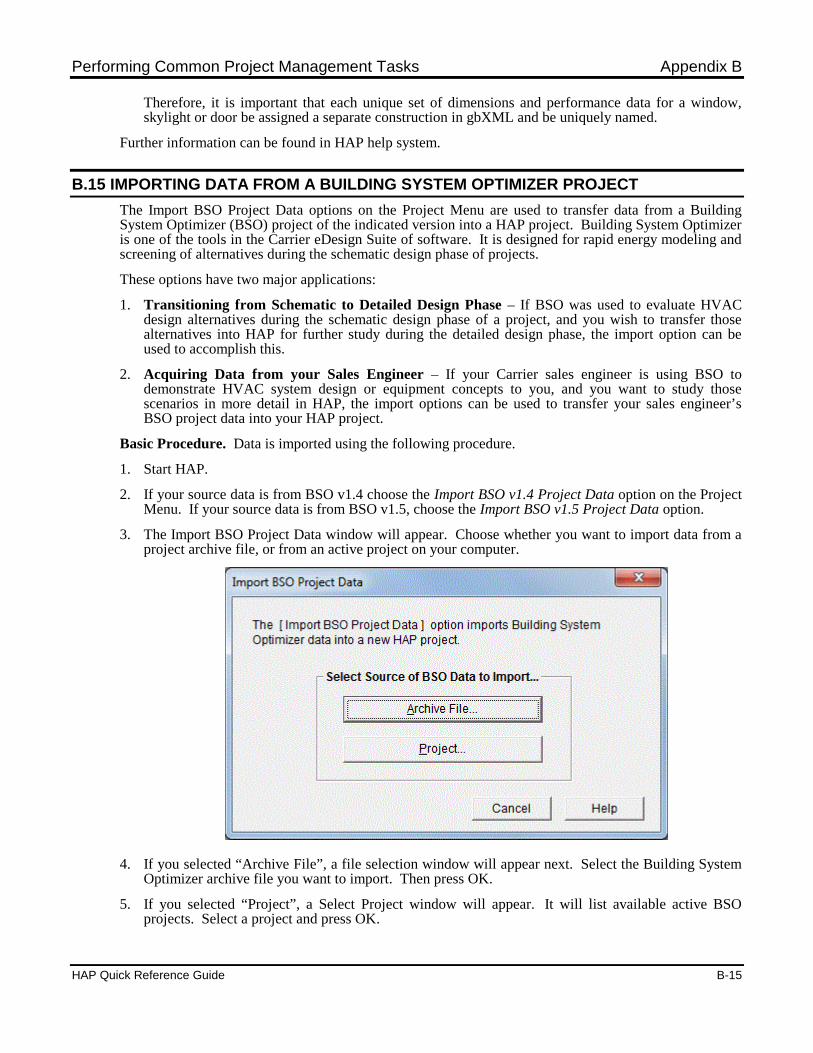
Performing Common Project Management Tasks Appendix B
HAP Quick Reference Guide B-15
Therefore, it is important that each unique set of dimensions and performance data for a window,skylight or door be assigned a separate construction in gbXML and be uniquely named.
Further information can be found in HAP help system.
B.15 IMPORTING DATA FROM A BUILDING SYSTEM OPTIMIZER PROJECT
The Import BSO Project Data options on the Project Menu are used to transfer data from a BuildingSystem Optimizer (BSO) project of the indicated version into a HAP project. Building System Optimizeris one of the tools in the Carrier eDesign Suite of software. It is designed for rapid energy modeling andscreening of alternatives during the schematic design phase of projects.
These options have two major applications:
1. Transitioning from Schematic to Detailed Design Phase – If BSO was used to evaluate HVACdesign alternatives during the schematic design phase of a project, and you wish to transfer thosealternatives into HAP for further study during the detailed design phase, the import option can beused to accomplish this.
2. Acquiring Data from your Sales Engineer – If your Carrier sales engineer is using BSO todemonstrate HVAC system design or equipment concepts to you, and you want to study thosescenarios in more detail in HAP, the import options can be used to transfer your sales engineer’sBSO project data into your HAP project.
Basic Procedure. Data is imported using the following procedure.
1. Start HAP.
2. If your source data is from BSO v1.4 choose the Import BSO v1.4 Project Data option on the ProjectMenu. If your source data is from BSO v1.5, choose the Import BSO v1.5 Project Data option.
3. The Import BSO Project Data window will appear. Choose whether you want to import data from aproject archive file, or from an active project on your computer.
4. If you selected “Archive File”, a file selection window will appear next. Select the Building SystemOptimizer archive file you want to import. Then press OK.
5. If you selected “Project”, a Select Project window will appear. It will list available active BSOprojects. Select a project and press OK.
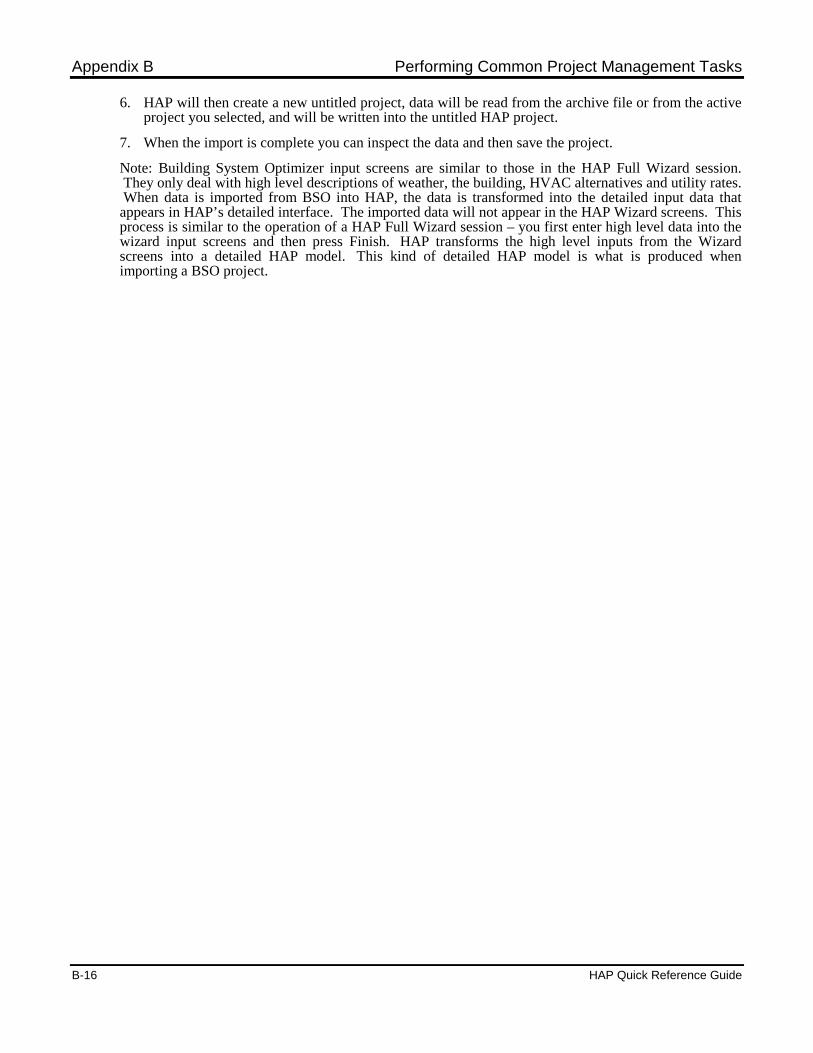
Appendix B Performing Common Project Management Tasks
B-16 HAP Quick Reference Guide
6. HAP will then create a new untitled project, data will be read from the archive file or from the activeproject you selected, and will be written into the untitled HAP project.
7. When the import is complete you can inspect the data and then save the project.
Note: Building System Optimizer input screens are similar to those in the HAP Full Wizard session.They only deal with high level descriptions of weather, the building, HVAC alternatives and utility rates.When data is imported from BSO into HAP, the data is transformed into the detailed input data that
appears in HAP’s detailed interface. The imported data will not appear in the HAP Wizard screens. Thisprocess is similar to the operation of a HAP Full Wizard session – you first enter high level data into thewizard input screens and then press Finish. HAP transforms the high level inputs from the Wizardscreens into a detailed HAP model. This kind of detailed HAP model is what is produced whenimporting a BSO project.
HAP Quick Reference Guide C-1
Appendix C Index
Air SystemsDesign Applications...................5-1, 5-2, 5-3, 5-4, 5-6Energy Applications ..................6-1, 6-3, 6-5, 6-6, 6-7, 6-8, 6-9, 6-10, 6-11Definition...................................1-2, 1-5Deleting Data .............................A-8Duplicating Data........................A-5Editing Data ...............................A-3Entering Data .............................2-2, 2-5, 3-8, 4-6, A-2Input Data Report.......................A-9System Design Reports ..............A-9System Simulation Reports........A-11
Application InformationAir Handlers...............................5-3, 6-6Boilers........................................5-4, 6-11Chillers.......................................5-4, 6-11DX Fan Coils .............................5-2, 6-7Energy Analysis .........................1-3, 1-4, 4-1, 6-1Entering Data .............................1-2, 1-4, 1-5, 2-1, 2-3, 2-5, 3-6, 4-4Gathering Data...........................1-2, 1-4, 1-5, 3-2, 4-2Generating Reports ....................1-3, 1-4, 1-6, 2-2, 2-3, 2-4, 2-6, 3-8, 4-8Ground Source Heat Pumps.......5-2, 6-10Hydronic Fan Coils....................5-2, 6-8Packaged DX Equipment...........5-1, 5-3, 6-5Selecting Equipment ..................1-3, 3-9Single-Zone Units ......................5-1Split DX Equipment ..................5-1, 5-2, 5-3, 6-6, 6-7System Design ...........................1-2, 3-1Troubleshooting Strategies ........5-6, 6-3Utility Rates ...............................6-12Variable Refrigerant Flow .........5-2, 6-7Water Source Heat Pumps .........5-2, 6-10
BoilersApplications...............................5-4, 6-11Deleting Data .............................A-8Duplicating Data........................A-5Editing Data ...............................A-3Entering Data .............................2-5, A-2Input Data Report.......................A-9
Appendix C Index
C-2 HAP Quick Reference Guide
BuildingsDefinition...................................1-6Deleting Data .............................A-8Duplicating Data........................A-5Duplicating w/ Spaces & Eqpt...A-6Editing Data ...............................A-3Entering Data .............................2-6, 4-7, A-2Input Data Report.......................A-9Performing LEED Rotations......A-8Simulation Reports ....................A-12
Calculator Feature .........................A-4
ChillersApplications...............................5-4, 6-11Deleting Data .............................A-8Duplicating Data........................A-5Editing Data ...............................A-3Entering Data .............................2-5, A-2Input Data Report.......................A-9
Common Program TasksChanging List View Format ......A-14Changing Units of Measure .......A-16Copying Items............................A-6Creating a New Item..................A-2Deleting an Existing Item ..........A-8Duplicating an Existing Item .....A-5Editing an Existing Item ............A-3Enabling Energy Features..........A-17Generating Input Data Reports ..A-9Generating Design Reports........A-9, A-10Generating Simulation Reports..A-11, A-12Overview....................................1-12Replacing Space Data ................A-6Rotating Spaces .........................A-7Selecting Items in List View......A-1Setting User Preferences............A-16Using the Report Viewer ...........A-12
Cooling TowersDeleting Data .............................A-8Duplicating Data........................A-5Editing Data ...............................A-3Entering Data .............................2-5, A-2Input Data Report.......................A-9
DoorsDeleting Data .............................A-8Duplicating Data........................A-5Editing Data ...............................A-3Entering Data .............................2-1, A-2Input Data Report.......................A-9
Index Appendix C
HAP Quick Reference Guide C-3
Electric RatesApplications...............................6-13Deleting Data .............................A-8Duplicating Data........................A-5Editing Data ...............................A-3Entering Data .............................2-6, 4-6, A-2Input Data Report.......................A-9
Energy AnalysisExample .....................................4-1Procedure ...................................1-3Reports .......................................A-11, A-12Tutorial ......................................2-3, 2-4
English Units ...................................A-16
Example ProblemsEnergy Analysis .........................4-1System Design ...........................3-1
External ShadesDeleting Data .............................A-8Duplicating Data........................A-5Editing Data ...............................A-3Entering Data .............................2-1, 3-7, A-2Input Data Report.......................A-9
Fuel RatesApplications...............................6-13Deleting Data .............................A-8Duplicating Data........................A-5Editing Data ...............................A-3Entering Data .............................2-6, 4-7, A-2Input Data Report.......................A-9
Help System ....................................1-14
Program OperationInput Windows...........................1-10List View ...................................1-9, A-14Main Program Window .............1-7Menu Bar ...................................1-8Toolbar.......................................1-8Tree View ..................................1-9
PlantsApplications...............................5-4, 6-11Definition...................................1-3, 1-6Deleting Data .............................A-8Duplicating Data........................A-5Editing Data ...............................A-3Entering Data .............................2-2, 2-5, A-2Input Data Report.......................A-9Plant Design Reports .................A-10Plant Simulation Reports ...........A-11
Appendix C Index
C-4 HAP Quick Reference Guide
ProjectsArchiving ...................................B-3Converting from Previous Vrsn. B-4Creating......................................2-1, 2-3, 2-4, 3-6, 4-5, B-1Data Management ......................1-13Definition...................................1-12Deleting......................................B-2Editing Properties ......................B-2E-Mailing Project Data ..............B-8Exporting Results to EEA..........B-9Importing from Another Project B-9Importing from BSO ..................B-15Importing from CAD or BIM.....B-12Opening......................................B-1Publishing Sizing Requirements B-6Retrieving...................................B-3Saving ........................................B-1, B-2
ReportsEnergy Analysis .........................A-11, A-12Input Data ..................................A-9System Design ...........................A-10
RoofsDeleting Data .............................A-8Duplicating Data........................A-5Editing Data ...............................A-3Entering Data .............................2-1, 3-7, A-2Input Data Report.......................A-9
SchedulesDeleting Data .............................A-8Duplicating Data........................A-5Editing Data ...............................A-3Entering Data .............................2-1, 2-5, 3-7, 4-6, A-2Input Data Report.......................A-9
SI Metric Units ...............................A-16
SpacesDefinition...................................1-2, 1-5Deleting Data .............................A-8Duplicating Data........................A-5Editing Data ...............................A-3Entering Data .............................2-1, 2-5, 3-7, A-2Input Data Report.......................A-9Replacing Space Data ................A-6Rotating Space Data ..................A-7
System DesignExample .....................................3-1Procedure ...................................1-2Reports .......................................A-10Tutorial ......................................2-1
TutorialsEnergy Analysis .........................2-3, 2-4System Design ...........................2-1
Index Appendix C
HAP Quick Reference Guide C-5
Units of Measurement ....................A-16
WallsDeleting Data .............................A-8Duplicating Data........................A-5Editing Data ...............................A-3Entering Data .............................2-1, 3-7, A-2Input Data Report.......................A-9
Weather DataDefinition...................................1-2, 1-5Entering Data .............................2-1, 2-3, 3-6, 4-5, A-2Input Data Report.......................A-9
WindowsDeleting Data .............................A-8Duplicating Data........................A-5Editing Data ...............................A-3Entering Data .............................2-1, 3-7, A-2Input Data Report.......................A-9
Wizard Interface ............................1-4, 2-3

[This page has been left blank intentionally]