household financial fragility during covid-19: rising
TRANSCRIPT

Household Financial Fragility during COVID-19:Rising Inequality and Unemployment Insurance Benefit
Reductions*
Daniel Schneider
Harvard Kennedy School
Peter Tufano
Said Business School, University of Oxford
Annamaria Lusardi
George Washington University
October 30, 2020
∗Daniel Schneider: Harvard Kennedy School, 79 JFK Street, Cambridge, MA 02138; [email protected]. Peter Tufano: Saïd Business School, University of Oxford, OX1 3LW; [email protected]. Annamaria Lusardi: George Washington University School of Business, FungerHall, 2201 G Street NW, Suite 450, Washington, DC 20052; [email protected]. We would like to thankKyungla Chae, Joe LaBriola, and Nikhil Yagnik for excellent research assistance. We are grateful to AndreaHasler, Tim Flacke, and Melissa Gopnik for helpful comments on the paper.

Household Financial Fragility during COVID-19: RisingInequality and Unemployment Insurance Benefit Reductions
Abstract
We draw on new high frequency survey data collected from repeated cross-sectionsof Americans over the period June 2020 through October 2020. These data capturerich measures of household financial fragility and employment status. We find no ev-idence of an economic recovery in household finances as of October of 2020. In fact,by some measures, we find evidence of a building “second wave” of negative shocksto household finances and of growing inequality in financial fragility by household in-come, educational attainment, and gender from August to September/October of 2020.Finally, using difference-in-difference models, we estimate that the expiration of theCARES Act’s Pandemic Unemployment Compensation benefits, which augmented un-employment insurance by $600 a week, significantly increased the financial fragility ofunemployed workers in America.

IntroductionEach day brings new data on the spread of COVID-19, with graphs charting new waves
of infections, which groups are most affected, and the short- and long-term impact of the
disease. But COVID-19 is not only a public health crisis, it is an economic one as well.
Research to date on the economic impact of COVID-19 in the United States has focused
on the macro-economic impact or on changes in employment. A smaller body of research has
examined the incidence of material hardship and difficulty paying bills during the pandemic
and the protective role that the CARES Act played in buffering household finances. With
the expiration of the CARES Act, the United States faces an unequal recovery in which
the most vulnerable in America become ever more financially fragile. Yet, little research has
examined trends in financial fragility over the course of the pandemic and almost no research
has examined the consequences of the CARES Act’s expiration for household finances.
In this paper, we show, using new high frequency survey data, the evolution of American
household fragility over the course of the past few months. These data were collected from
repeated cross-sections of the United States population between June 2020 and October 2020.
We examine changes over time in four measure of financial fragility - spending in excess of
income, difficulty paying bills, having little or no short-term savings, and postponing a major
purchase in the last month. We then examine inequality in these measures of fragility by
socio-demographic characteristics. Finally, we estimate a set of models that look at the
same four economic outcomes as a function of employment status over time. We use a
difference-in-difference approach, where we would expect no divergence in trend between
employed and unemployed in the June - August period (white the Pandemic Unemployment
Compensation (PUC) provision for $600 expanded unemployment insurance was in effect),
but then widening gaps between the unemployed and others in the August - October period
(after the PUC expired). We document three stylized facts.
First, while unemployment rates have partially abated in a V-like pattern, households
have simply not seen meaningful economic recovery and, in fact, there appears to be a trou-
1

bling “second wave” in household fragility among Americans, due to economic policy. We
show this through simple data collected regularly over the past few months on a number of
markers of household financial fragility. Second, some socio-demographic groups of Ameri-
cans remain far more exposed to financial fragility than others. We describe large differences
in the financial fragility of Americans by race/ethnicity, gender, age, educational attainment,
and household income. These gaps were present prior to the COVID-19 crisis. But, we find
that inequality in financial fragility along the lines of household income, educational at-
tainment, and gender markedly increased between August and September/October of 2020.
Third, public policy can effectively buttress this financial fragility. The converse of course is
that when policy fails, fragility can be exacerbated. While the incidence of unemployment
has reduced since the peak in April of 2020, for unemployed workers, things have been get-
ting much worse since the expiration of the PUC (the $600 UI benefit). We estimate a set of
difference-in-difference models and find that the expiration of the PUC has led to a 50-100%
increase in financial fragility among the unemployed.
Background
Financial Fragility and COVID-19A number of recent papers have examined the impact of COVID-19 on economic activity,
including unemployment rates, business failure and macroeconomic indicators (e.g. Chetty
et al., 2020; Gourinchas et al., 2020; Bartik et al., 2020). Other papers and news stories
have documented the effects on individuals and households, which include reduced levels of
consumption, increased levels of savings for the affluent, negative consequences for mental
health (e.g. Andersen et al., 2020; Athreya et al., 2020; Dossche and Zlatanos, 2020; Holingue
et al., 2020; Moen et al., 2020; Xiong et al., 2020). Just as COVID-19 demonstrates the
interconnected systemic nature of public health, economic, political and social factors, at
the household level, physical and mental health issues, economic issues, personal preferences
and identities blend together.
2

Building upon our earlier work (Lusardi, Schneider and Tufano, 2011), which examined
and coined the term “financial fragility” examining how households navigated through a
crisis of major proportion (the financial crisis of 2007-2008), we examine household economic
wellbeing through metrics of how “close to the edge” these families are or perceive themselves
to be in the current crisis. Financial fragility can be measured in a variety of ways, including
ability to come up with resources in time of need or access to liquid assets that can replace
several months of lost income, to measures of financial difficulties (Lusardi, Schneider and
Tufano, 2011; Demertzis et al., 2020; Desai and Forsberg, 2020).
While research has closely tracked unemployment and macro-economic indicators, the
evolution of financial fragility over the pandemic has been less well documented. An analysis
of financial fragility using a measure of the inability to come up with $2,000 within 30 days (as
proposed in Lusardi et al., 2011) and a variety of data sets shows that, since the financial crisis
of 2007-2008, where financial fragility in the US reached peaks of 50%, financial fragility has
been declining steadily over time. However, Lusardi et. al. (2020) show that as of January
2020, just before the start of the pandemic and its economic consequences, as many as 27%
of US households were still financially fragile. One-in-three households reported difficulties
with making ends meet and a similar percentage reported that because of their ongoing debt
payments they were unable to adequately address other financial priorities. Even during
a time of economic expansion and high employment, many US families were in financial
distress
There is little research that examines financial fragility over the course of the pandemic.
Research early in the pandemic, in March and April of 2020, found that one third of adults
reported cutting back spending on food and 40% had reduced major household purchases
(Karpman et al., 2020). But, data from the USC Center for Economic and Social Research’s
Understanding Coronavirus in America tracking survey appears to show fairly constant fi-
nancial fragility levels over the past several months (Kapteyn et al., 2020) as does some work
examining trends in food insecurity in the Household Pulse Survey (Rowe, 2020).
3

Socio-Demographic Inequality in Financial FragilityThese aggregate statistics conceal large differences across demographic groups. Prior to
the COVID-19 pandemic, there were wide gaps in financial fragility by race/ethnicity. In
January 2020, 50% of African-Americans and 31% of women were considered financially
fragile, against just 21% of whites and 23% of men (Lusardi et. al., 2020). In the midst
of the pandemic, these inequalities were strongly persistent, with African American and
Hispanic households more likely to experience food insecurity and have trouble paying bills
(Clemens et al., 2020).
Financial fragility is also stratified by education and income levels. Those with lower
educational attainment and lower incomes were more likely to be financially fragile, but
notably, fragility is not uncommon even among the higher-earning and more highly educated
(Hasler et al., 2018; Lusardi, 2019; Lusardi, Schneider, and Tufano, 2011). For example,
prior to COVID-19, around 30% of middle-income households reported that they would
struggle to cope with a $2,000 expense within a month’s timeframe (Hasler and Lusardi,
2019). During COVID-19, one clear emergent finding is that for low-income households,
the pandemic appears to have increased material hardship, both in terms of food insecurity
(Bitler et al., 2020; Schanzenbach and Pitts, 2020; Waxman, 2020; Ziliak, 2020) and housing
insecurity (Engelhardt and Erickson, 2020; Greene and McCargo, 2020; Grinstein-Weiss et
al., 2020). Less educated households continue to struggle to pay bills more than those with
greater educational attainment (Clemens et al., 2020). But, for higher-income households,
the pandemic does not appear to have been a drag on household economic security, with
higher-income households increasing savings (Cox et al., 2020).
Women are disproportionately represented among occupations that require personal con-
tact and where employment losses have been largest during COVID-19 and as a consequence,
women have been more likely to lose their jobs than men (Alon et al. 2020). Addition-
ally, increased childcare demands due to continuing closures of schools and daycare centers
have fallen disproportionately on mothers (Prados, 2020). These gender-unequal COVID-19
4

shocks are likely to compound existing gender inequalities in financial fragility. Even during
times of economic growth, women had higher levels of financial fragility (Hasler and Lusardi,
2019) and, as such, their ability to deal with a larger financial shock, such as extended
unemployment during the COVID-19 crisis, is likely to be even more fragile.
Additionally, young adults (individuals age 18-37 in 2018) were also already a group
at risk for financial fragility (Bolognesi et. al., 2020). Young workers were saddled by
debt, were late in making debt payment obligations, and their money management behavior
indicated signs of financial distress. Indeed, even before the CARES Act allowed people
to withdraw from retirement accounts, many young adults were already tapping in their
retirement accounts.
Unemployment and Financial Fragility during Covid-19The unemployment rate and number of unemployed has dramatically changed since February
2020. The shutdown of the economy that sought to slow the spread of the virus began in
March 2020, after which the unemployment rate jumped from a historical low of 3.5% in
February, to a high of 14.7% in April 2020. Thereafter, as some states started to reopen,
unemployment fell to 13.3% in May and to 10.2% in July, but millions of Americans remained
jobless into the autumn.
Given the critical role of employment - and the loss of jobs as a result of public-health
imposed lockdowns, governments around the world have created schemes to either keep
workers employed either on furlough (such as the furlough scheme in the United Kingdom) or
by paying employers to continue to keep people employed. In the US, the federal government
passed the CARES Act on March 27, 2020, sending economic impact payments of up to
$1,200 per adult (with smaller or zero payments for high earners) and $500 per minor child
to American citizens and permanent residents (Congressional Research Service 2020). The
CARES Act also allowed penalty-free withdrawals from retirement plans, established the
Paycheck Protection Program for small businesses, expanded safety net programs, allowed
5

affected federally-backed mortgage holders to go into a forbearance period on their loans,
and suspended evictions of renters living in federally funded housing (Congressional Research
Service 2020).
Significantly, given the massive negative shocks to employment, the CARES Act tem-
porarily extended the duration of unemployment insurance by 13 weeks (Pandemic Emer-
gency Unemployment Compensation or PEUC provision), allowed typically ineligible indi-
viduals to apply for unemployment benefits, and increased unemployment insurance (UI)
payments by $600 per week (the Pandemic Unemployment Compensation or PUC provi-
sion). However, the PUC expired on July 31st, 2020 and the Federal Government has failed
to enact extensions or additional support. American families are now facing difficult choices
as the economy seems to be leading toward a second wave of the pandemic and Congress is
divided on how to continue to support families through the pandemic. Yet, little research
has examined the consequences of the PUC expiration for household financial fragility, in
part because data have lagged quickly moving events. Drawing on data collected through
July of 2020 in the Survey of Households and Economic Decision making, Canilang, et al.
(2020) concluded that governmental financial relief efforts put in place as response to the
economic consequences of the pandemic appear to have eased families’ immediate financial
distress and inability to cover expenses. Analysis of data collected during the spring of 2020
found that among unemployed workers who did not receive timely UI payments, rates of
material hardship were significantly higher than among unemployed workers who did re-
ceive UI (Schneider, Harknett, and Gailliot, 2020; Karpman and Acs, 2020) and simulations
suggest that poverty declined as a result of the PUC (Parolin et al., 2020). To date, the
only evidence of the expiration of PUC comes from Farrell et al. (2020) using de-identified
bank account data from JP Morgan Chase customers. This work suggests that following the
expiration of the $600 UI benefit supplement, spending by the unemployed declined by 14%
and checking-account balances began to decline after rising in the spring and early summer.
6

Methods
DataWe draw on a new source of high-frequency survey data collected from repeated cross-sections
of the United States population. The survey was fielded on five occasions between June of
2020 and October of 2020: (1) June 19 - June 26, (2) July 15 - July 19, (3) August 4 -
August 9, (4) September 10 - September 14, and (5) October 9 - October 13. The survey
was fielded by Dynata, a global data and insights firm. A total of 19,010 respondents were
recruited to the survey across the five waves - 3,000 at W1 and approximately 4,000 at each
later wave. After list-wise deletion of respondents missing data on key covariates, we have
an analysis sample of 18,382.
We weight each wave of the survey data to match the distribution of various charac-
teristics of the United States adult population, as measured by the 2014-2018 American
Community Survey 5-year sample (downloaded via IPUMS; Ruggles et al. 2020). Specif-
ically, we weight to match population means of sex, race/ethnicity (operationalized as the
percent of adults reporting their race as white only, Black only, Asian only, Latinx or His-
panic, and two or more races), age (operationalized as percent of adults aged 18-24, 25-34,
35-44, 55-64, and over 65), education (operationalized as percent with a HS degree or less,
some college, a Bachelor’s degree, and some graduate education), and region (operationalized
as percent in each of the nine Census divisions).
We estimate these weights using the calibrate command in Stata (D’Souza 2011) to im-
plement the linear calibration method of Deville and Sarndal (1992). Because calibrating
weights to population totals can result in some observations having negative observation
weights, we assign the smallest positive weight from the calibration procedure to all obser-
vations whose initial calibration weight is negative. The weighted population means in each
survey wave closely match the population means from the American Community Survey
(within one percentage point for all wave-variables).
7

MeasuresFinancial Fragility. We focus on the four measures of household financial fragility. First,
we measure the degree to which respondents report that their spending exceeds income.
Respondents were asked, “what describes your spending and income?,” and presented with a
five point response option scale where the 1 was labeled as “spending substantially exceeds
income” and the 5 was labeled as “income substantially exceeds spending.” We dichotomize
this measure to compare respondents reporting a “1” or a “2” against those reporting 3-5.
Second, we measure the degree to which respondents report being unable to pay their
bills on time. Respondents were asked, “what describes your ability to pay your bills?,” and
presented with a five point response option scale where the 1 was labeled as “unable to pay
on time” and the 5 was labeled as “always pay on time.” We dichotomize this measure to
compare respondents reporting a “1” or a “2” against those reporting 3-5.
Third, we measure the degree to which respondents report having insufficient savings to
cover short-term needs. Respondents were asked, “what best describes your level of savings
to cover short-term needs?,” and presented with a five point response option scale where the
1 was labeled as “little to no savings” and the 5 was labeled as “able to cover 6 months or
more of living expenses.” We dichotomize this measure to compare respondents reporting a
“1” or a “2” against those reporting 3-5.
Fourth, we measure if respondents report “postponing a major purchase due to the cost in
the last month.” This is a dichotomous variable coded “1” if they postponed such a purchase.
Employment Status. We use a multi-category measure of current employment status
that contrasts respondents employed full-time, employed part-time, self-employed, and re-
tired against those who are unemployed.
Socio-Demographic Characteristics. We measure a set of socio-demographic characteris-
tics that both serve as stratifying variables and as controls. We construct a five-category
8

measure of race/ethnicity: white, non-Hispanic, Black, non-Hispanic, Asian, non-Hispanic,
Hispanic, and non-Hispanic individuals of more than two races. We code educational at-
tainment as high schol or technical school, some college, a four-year degree, or graduate
education. We create a dichotomous measure of gender. We construct a four-category mea-
sure of household income, contrasting respondents in households making less than $60,000
per year, those making from $60,000 up to $100,000, those making from $100,000 up to
$150,000 and those in household making $150,000 or more per year. Finally, we measure
age continuously as a control and as a six-category variable when stratifying (18-24, 25-34,
35-44, 45-54, 55-64, and 65 or above).
ModelsFirst, we first regress each of these outcomes on wave, controlling for race/ethnicity, gender,
age, and education. All of the models are weighted to the American Community Survey
on age, gender, race/ethnicity, education, and region. We estimate OLS models for each
outcome.
Second, we describe socio-demographic inequality in financial fragility in September/Oc-
tober, following the expiration of the PUA, against inequality in early August. To do so,
we estimate a set of OLS models of financial fragility on the interaction of each socio-
demographic characteristics with an indicator for the survey being completed in September
or October versus August. For the models of household income inequalities, we control for
race/ethnicity, gender, age, and educational attainment. For the models of racial/ethnic
inequality, we control only for gender and age so as not to artificially suppress racial/ethnic
inequalities that stem from structural differences in educational attainment and household
income. For the models of gender inequality, we control for race/ethnicity age, and educa-
tional attainment. For the models of educational inequality, we control for gender, race/eth-
nicity, and age. Finally, for the models of life-course inequality, we control for educational
attainment, gender, and race/ethnicity. All of the models are weighted.
9

Third, we directly investigate the effects of the PUC expiration on financial fragility. We
do so using a set of difference-in-difference models in which we examine differences between
employed and unemployed respondents before and after the expiration of the PUC in late July
2020. Specifically, we regress each of our measures of financial fragility on employment status,
controlling for race/ethnicity, gender, age, education and a set of state fixed-effects. All of
the models are weighted to the American Community Survey on age, gender, race/ethnicity,
education, and region.
We test two flexible functional forms for time. First, we enter an indicator for survey
wave. Second, we segment the five waves into three periods (June/July, August, Septem-
ber/October). This effectively separates the early period, the period through the end of
the PUC, the $600 UI program in late July, and the two months (September and October)
following the end of the program.
We then estimate eight total models, interacting the employment status indicator with
each form for time and do so for each of the four outcomes. If the expiration of the PUC
increased financial fragility, we would expect little divergence in trends between unemployed
and employed respondents across the months of June, July, and August when the PUC was
in effect, but would expect significant divergence between August and October between these
groups after the PUC expired.
ResultsWe present results in three steps. First, we present regression-adjusted plots of change
over the period June 2020 through October 2020 in our four measures of financial fragility.
Second, we examine whether inequality in financial fragility increased between August of 2020
and September/October of 2020 in terms of income, educational attainment, race/ethnicity,
gender, or age. Finally, we estimate the effect of the PUC expiration with a set of difference-
in-difference models that compare unemployed and employed respondents before and after
the PUC expired.
10

Changes in Household Financial FragilityFigure 1 plots trends in our four measures of household economic fragility across waves,
from June through October of 2020. There is no evidence of any economy recovery at the
household level for any of the four measures. The share of households who report that their
spending exceeds incomes remains essentially unchanged - it was 15% in June and 16% in
October. The share of households who report being unable to pay their bills rose over this
time, from 7.3% in June to a high of 9.7% in October. Short-term savings at the household
level significantly declined over the period, with the share of household who reported lacking
such savings rising from 23% in June to 30% in October. Finally, we see no recovery in
household consumption expectations, with the share of households who report postponing
a major expenditure within the past month steady at 16% across the months from June to
October. However, as we show below, these overall trends masks substantial heterogeneity
between households.
Rising Inequality in Household Financial FragilityThe averages above hide the fact that financial fragility is starkly stratified by socio-economic
status. In August of 2020, households making less than $60,000 per year were significantly
more likely to report that their spending exceeded income, that they were unable to pay their
bills on time, that they lacked short-term savings, and that they had postponed a major
purchase in the prior month. Perhaps deep income inequality in fragility is not surprising,
but, over the course a few months we see significant widening in these gaps related to income.
Panel A of Table 1 summarizes the interactions between household income group and period.
We see significant widening in income-related gaps in financial fragility between August and
September/October in terms of spending exceeding income, being unable to pay bills on
time and especially in terms of lacking savings for short-term needs.
We plot these predicted values in Figure 2a, showing the widening income inequality in
financial fragility. This gap is especially striking for lacking savings for short-term needs.
We find a 20 point gap between households making less than $60,000 and those making
11

more than $150,000 in August, but a 30 point gap by September/October, driven both by
a decline in the share of the highest income households lacking savings and a sharp increase
in the share of lower income households lacking savings.
We find similar inequality and significant widening of gaps in financial fragility by ed-
ucation. In August of 2020, approximately 15% of those with less than a four-year degree
reported that their spending exceeded income, about 5 percentage points more than those
with at least graduate education. Similarly, we find educational gaps in being unable to
pay bills and in having little or no savings for short-term needs as of August 2020. For
spending exceeding income and lacking short-term savings, these gaps widened significantly
by September/October, as seen in the significant interaction coefficients in Panel B of Table
1. As before, this widening was most pronounced for lacking savings for short-term needs,
where the gap grew from approximately 15 percentage points between those with a high
school degree and those with a graduate degree to 25 points by September/October as the
fragility of the least educated spiked and that of the most educated remained steady.
In Panel C of Table 1, we also report evidence of widening gender inequality across these
months. While women and men fared comparably in August in terms of spending exceeding
income and having difficulty paying bills, significant gaps had appeared by September/Oc-
tober of 2020 between men and women. Such gaps were already present in August when it
came to having short-term savings, but as seen in Figure 2c, this gap widened significantly
by September/October. We do not observe widening of gaps in terms of postponing a major
purchase.
Panel D and Panel E of Table 1 show a set of insignificant coefficients on the interaction
of race/ethnicity and period and of age and period. While there are large and significant
gaps in financial fragility by race/ethnicity and by age, these gaps did not widen between
August of 2020 and September/October of 2020.
12

Effects of the PUC Expiration on Financial FragilityOne significant change between August of 2020 and September/October of 2020 was the
expiration of the PUC provision that provided additional $600 UI payments. This provision
expired on July 31st, 2020, with the last checks arriving in the week prior. We gauged
household financial fragility in June, July, and then in early August (4-9), right after these
final checks were received. Given our measures of household financial fragility, we would
expect that August reports in the survey would reference the recall period essentially up
through the last PUC benefits. We then contrast the August wave with measurements of
household financial fragility in September and in October, following the PUC expiration.
We model our four measures of household financial fragility as a function of employment
status interacted with survey wave. These interactions give us a difference-in-difference
estimate of the expiration of PUC benefits on fragility. These coefficients are reported in
Table 2a. Figure 3a shows the predicted values for each of the four fragility outcomes over
the five waves by employment status. The red line shows the adjusted trend for unemployed
respondents, the grey lines show the trends for those who were working and retired. We
would expect to see little change between employed and unemployed respondents over the
period June - August while the PUC was in effect. But, we then expect sharp increases in
fragility following expiration in September and October.
In late June, 20% of unemployed respondents reported that their spending exceeded
income. That share basically held steady in July, before declining by the end of August.
The share then increased by mid-September and held at about 30% through October, or
increased by about 50%. In contrast, just about 10% of respondents employed full-time
reported that their spending exceeded income and this share held steady across the five
waves. We find evidence of a significant divergence (p < .05) in household financial fragility
between employed and unemployed respondents in the weeks between early August and mid-
September and between early August and mid-October, the time period coinciding with the
expiration of the PUC, the $600 UI benefit. In contrast, we see no such divergence between
13

June and August while the PUC was in effect and, in fact we find no other significant
differences comparing across months or employment statuses.
We see a similar set of trends for unemployed respondents’ inability to pay their bills on
time. About 10% of unemployed respondents found themselves short of funds from late June
through early August, almost twice the share of employed respondents. But, while employed
respondents saw no increase in difficulty paying bills through early October, the share of
unemployed respondents facing difficulty with bill payment sharply increased, doubling from
11% in August to 22% in October. Over the weeks following the expiration of the PUC, the
increase in difficulty with bill payment was significantly greater (p < .01) for unemployed
workers than full time workers, where we saw no such change in the difference between June
and August.
During the summer of 2020, 38% of unemployed workers reported that that they had little
to no savings for short-term needs, or about twice as high as for working full-time, at about
20%. But, while that latter 20% share held fairly constant for employed workers through
the fall of 2020, the share of unemployed workers lacking short-term savings increased by
almost 10 percentage points, to 47% of all unemployed workers by September/October of
2020. Here too, this divergence in the weeks after the expiration of the PUC was significant
(p < .05), where changes in the gaps were not significant over the course of the summer of
2020.
Finally, in August of 2020, 17% of unemployed workers reported putting off a major
purchase, about the same share as among all other workers. But here too, in the weeks after
the expiration of the PUC, we saw significant divergence (p < .05) and, by October, the
share of unemployed workers putting off a purchase had risen to 23% against just 15% of
workers employed full-time. The PUC may have served as an “automatic stabilizer” for the
economy, but its expiration threatens to undercut consumer expenditures when they were
needed most.
We complement these models with a simpler set of models that interacts employment
14

status and period, collapsing the five waves of data into three periods (June/July vs. August
vs. September/October). We focus on the August vs. September/October comparison as it
coincides with the expiration of the PUC. As reported in Table 2b and Figure 3b, these tests
match those reported above. In brief, for spending exceeding income, we find no significant
diff-in-diff compared FT workers and unemployed between June/July and August. But, we
find significant (� = 11%; p < .001) in the diff-in-diff of FT workers and unemployed workers
between August and Sept/Oct.
The same is true of difficulty paying bills. The diff-in-diff coefficient is small and non-
significant comparing the groups across June/July to August (� = 3%;n.s.) but much larger
and significant in the August to Sept/Oct comparison (� = 8%; p < .01).
The expiration of the PUC also appears to have increased lack of short-term savings
among unemployed workers. While there is no significant June/July to August difference
(� = 1%;n.s.) the August to Sept/Oct comparison (� = 8%; p = .05) is substantial and
statistically significant.
But, we find less evidence of PUC expiration effects when looking at delay in purchases.
While there is no significant diff-in-diff coefficient when comparing full-time and unemployed
workers between June/July and August (� = 0%;n.s), the coefficient is relatively small and
not-significant when comparing August and Sept/Oct (� = 4%; p = 0.148).
DiscussionOur findings are straightforward and troubling.
First, in aggregate we see no recovery at the household level in financial fragility over the
course of the pandemic. While stock market and unemployment figures may have improved
since earlier in 2020, there is no corresponding improvement in measures of the financial
fragility of the average American family. We see no evidence of rounding a corner, but fear
a long and difficult winter for the average American, an increasing fraction of whom cannot
make ends meet. The implications? We fear greater physical and mental illness and reduced
15

wellbeing. We expect to see greater pressure on already taxed family, private and public
support systems.
Second, the “average” conceals disturbing differences. Pre-Covid, lower income families,
less well educated households, and women experienced considerably higher levels of financial
fragility than did others. Over the last few months, these gaps have widened markedly for
these groups. Apart from the sheer unfairness of this situation, these divides threaten to
drive even more wedges between haves and have-nots. While some may benefit from these
fractures in American society, clearly, we all stand to lose. The COVD19 crisis appears to
already be widening existing inequalities.
Third, perhaps not surprisingly, the expiration of the CARES Act Pandemic Unemploy-
ment Compensation provisions is revealing ever more stark differences in financial fragility
between the employed and unemployed. Without further action, we can expect that the fi-
nancial fragility of the unemployed will continue to rise, with their savings depleted, unpaid
bills mounting, and short and long term purchases deferred at best. This is not about fewer
gifts on Christmas morning, but rather the prospect of severe financial fragility. While the
PUC appears to have held inequalities constant, following expiration, these class and gender
inequalities are widening quickly.
The evidence we present is simple and clear: we are facing a growing financial fragility
crisis at the household level and ever widening gaps between rich and poor, men and women,
more and less educated, and unemployed and employed. Collective action, in the form of
both government action and civic engagement, is needed to fight a pandemic or an economic
crisis - or a climate emergency. For a brief moment, the CARES Act demonstrated the
capacity of our leaders to come together to address some of these issues. In their new
book, The Upswing, Robert Putnam and Shaylan Romney Garret report how American
“came together a century ago” and argue that “we can do it again.” We share this optimism,
recognizing widening gaps like the ones we document will make that work of collective action
both much harder and more essential.
16

ReferencesAlon, T.M., Doepke, M., Olmstead-Rumsey, J. and Tertilt, M., 2020. “The Impact of
COVID-19 on Gender Equality.” NBER Working Paper Series, Working Paper 26947,National Bureau of Economic Research.
Andersen, A.L., Hansen, E.T., Johannesen, N. and Sheridan, A., 2020. “Consumer Re-sponses to the COVID-19 Crisis: Evidence from Bank Account Transaction Data.”Available at SSRN 3609814.
Athreya, K., Mather, R., Mustre-del-Rio, J. and Sanchez, J.M., 2020. “Household FinancialDistress and the Burden of ’Aggregate’ Shocks.” Working Paper Series, WP 20-12,Federal Reserve Bank of Richmond.
Bartik, Alexander, Marianne Bertrand, Feng Lin, Jesse Rothstein, and Matthew Unrath.2020. “Measuring the Labor Market at the Onset of the COVID-19 Crisis.” BrookingsPapers on Economic Activity.
Bolognesi, A., Hasler, A., Lusardi, A., 2020. “Millennials and Money: Financial Prepared-ness and Money Management Practices Before COVID-19.” TIAA Institute ResearchDialogue. Issue no. 167.
Bitler, Marianne, Hilary Hoynes, and Diane Schanzenbach. 2020. “The Social Safety Net inthe Wake of COVID-19.” NBER Working Paper 27796.
Clemens, Austin, Kate Bahn, Raksha Kopparam, Carmen Sanchez Cumming. 2020. “Equi-table Growth’s Household Pulse Graphs: September 30-October 12.” Washington Centerfor Equitable Growth.
Clemens, Austin, Raksha Kopparam, Carmen Sanchez Cumming. 2020. “EquitableGrowth’s Household Pulse Graphs: September 2-14 edition.” Washington Center forEquitable Growth.
Chetty, R., Friedman, J., Hendren, N., Stepner, M. and the Opportunity Insights Team,2020. “The Economic Impacts of COVID-19: Evidence From a New Public DatabaseBuilt from Private Sector Data.” Opportunity Insights.
Cox, Natalie, Peter Ganong, Pascal Noel, Joseph Vavra, Arlene Wong, Diana Farrell, andFiona Greig. 2020. “Initial Impacts of the Pandemic on Consumer Behavior: Evidencefrom Linked Income, Spending, and Savings Data.” Working Paper.
Demertzis, M., Dominguez-Jimenez, M. and Lusardi, A., 2020. “The Financial Fragilityof European Households in the Time of COVID-19.” Policy Contribution, 2020/15,Bruegel.
Desai, H. and Forsberg, E., 2020. “Multidimensional Fragility in 2020.” OECD DevelopmentCo-Operation Working Paper 79.
17

Dossche, M. and Zlatanos, S., 2020. “COVID-19 and the Increase in Household Savings:Precautionary or Forced?” ECB Economic Bulletin, Issue 6/2020, European CentralBank.
Engelhardt, Gary V. and Michael D. Eriksen. “Housing-Related Financial Distress Duringthe Pandemic.” Research Institute for housing America Special Report.
Farrell, Diana, Peter Ganong, Fiona Greig, Max Liebeskind, Pascal Noel, Daniel Sullivan,Joseph Vavra. 2020. “The Unemployment Benefit Boost: Trends in Spending and SavingWhen The $600 Supplement Ended.” JP Morgan Chase Institute.
Gourinchas, P.O., Kalemli-Ozcan, S, Penciakova, V. and Sander, N., 2020. “COVID-19 andSME Failures.” NBER Working Paper Series. Working Paper 27877.
Greene, Solomon and Alanna McCargo. 2020. New Data Suggest COVID-19 is WideningHousing Disparities by Race and Income Urban Institute.
Grinstein-Weiss, Michal, Brinda Gupta, Yung Chung, Hedwig Lee, and Mathieu Despard.2020. Housing Hardships Reach Unprecedented Heights During the COVID-19 Pan-demic. Brookings Institute.
Hasler, A., Lusardi, A. and Oggero N., 2018. “Financial Fragility in the US: Evidence andImplications.” GFLEC Working Paper Series, WP 2018-1.
Hasler, A. and Lusardi A., 2019. “Financial Fragility Among Middle-Income Households:Evidence Beyond Asset Building.” GFLEC Working Paper Series, WP 2019-1.
Holingue, C., Kalb, L.G., Riehm, K.E., Bennett, D., Kapteyn, A., Veldhuis, C.B., Johnson,R.M., Fallin, M.D., Kreuter, F., Stuart, E.A. and Thrul, J., 2020. “Mental Distress inthe United States at the Beginning of the COVID-19 Pandemic.” American Journal ofPublic Health 110(11): 1628-1634.
Kapteyn, A., Angrisani, M., Bennett, D., Bruine de Bruin, W., Darling, J., Gutsche, T.,Liu, Y., Meijer, E., Perez-Arce, F., Schaner, S., Thomas, K. And Weerman, B., 2020.“Tracking the Effect of the COVID-19 Pandemic on the Lives of American Households.”Survey Research Methods 14(2): 179-186.
Karpman, Michael, Stephen Zuckerman, Dulce Gonzalez, and Genevieve M. Kenney. 2020.“The COVID-19 Pandemic Is Straining Families’ Abilities to Afford Basic Needs.” UrbanInstitute.
Lusardi, A., Schneider D. and Tufano P., 2011. “Financially Fragile Households: Evidenceand Implications.” Brookings Papers on Economic Activity. 83-134.
Lusardi, A., Hasler, A. and Yakoboski, P.J., 2020. “Building up Financial Literacy andFinancial Resilience.” Mind & Society.
Moen, P., Pedtke, J.H. and Flood, S., 2020. “Disparate Disruptions: Intersectional COVID-19 Employment Effects by Age, Gender, Education, and Race/Ethnicity.” Work, Agingand Retirement 6(4): 207-228.
18

Putnam, Robert and Shaylan Romney Garret. 2020. The Upswing: How America CameTogether a Century Ago and How We Can Do iI Again. Simon and Schuster.
Prados, M. and Zamarro, G., 2020. “Gender Differences in Couples’ Division of Childcare,Work and Mental Health During COVID-19.” CESR-Schaeffer Working Paper (003).
Rachidi, Angela. 2020. “Food Insufficiency Rates Remain Stable Despite Reduced FederalAssistance.” AEI.
Schanzenbach, Diane and Abigail Pitts. 2020. “Estimates of Food Insecurity During theCOVID-19 Crisis: Results from the COVID Impact Survey, Week 1 (April 20-26, 2020).”Institute for Policy Research Rapid Research Report.
Waxman, Elaine. 2020. “More Than One in Five US Adults Experienced Food Insecurity inthe Early Weeks of the Pandemic.” Urban Institute.
Xiong, J., Lipsitz, O., Nasri, F., Lui, L.M., Gill, H., Phan, L., Chen-Li, D., Iacobucci,M., Ho, R., Majeed, A. and McIntyre, R.S. 2020. “Impact of COVID-19 Pandemic onMental Health in the General Population: A Systematic Review.” Journal of AffectiveDisorders 277: 55-64.
Ziliak, Jim. 2020. “Food Hardship during the Covid-19 Pandemic and Great Recession.”Applied Economic Perspectives and Policy.
19
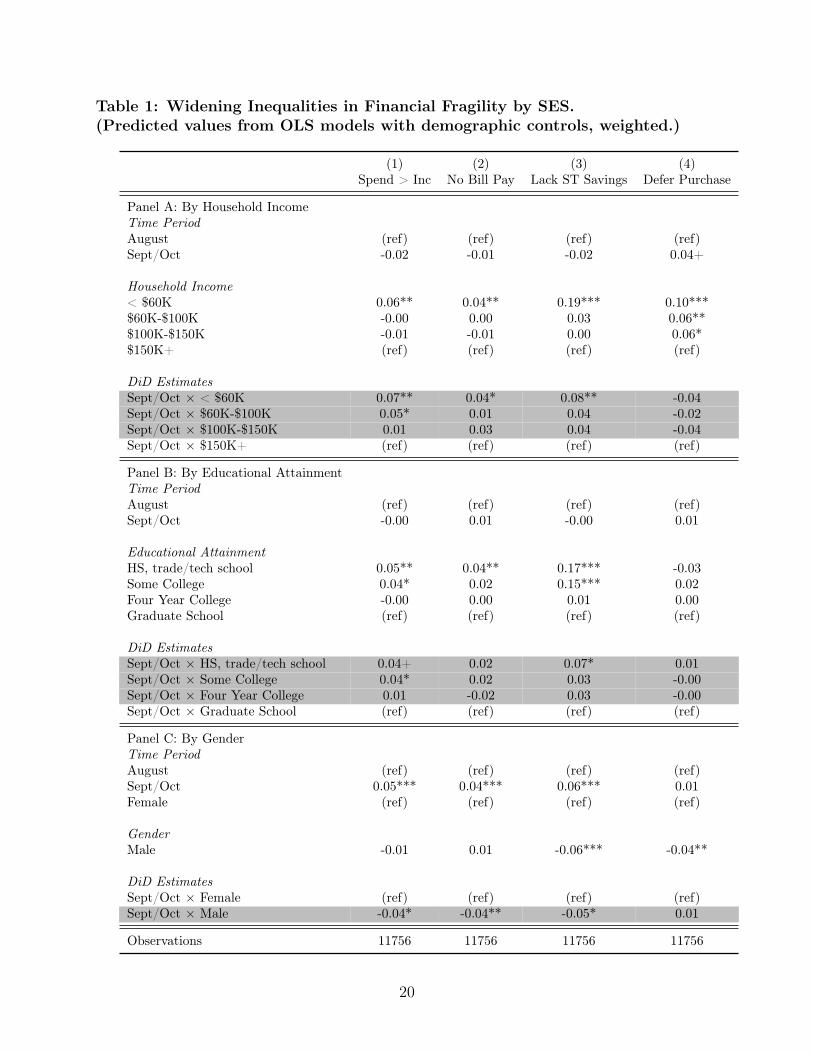
Table 1: Widening Inequalities in Financial Fragility by SES.(Predicted values from OLS models with demographic controls, weighted.)
(1) (2) (3) (4)Spend > Inc No Bill Pay Lack ST Savings Defer Purchase
Panel A: By Household IncomeTime Period
August (ref) (ref) (ref) (ref)Sept/Oct -0.02 -0.01 -0.02 0.04+
Household Income
< $60K 0.06** 0.04** 0.19*** 0.10***$60K-$100K -0.00 0.00 0.03 0.06**$100K-$150K -0.01 -0.01 0.00 0.06*$150K+ (ref) (ref) (ref) (ref)
DiD Estimates
Sept/Oct ⇥ < $60K 0.07** 0.04* 0.08** -0.04Sept/Oct ⇥ $60K-$100K 0.05* 0.01 0.04 -0.02Sept/Oct ⇥ $100K-$150K 0.01 0.03 0.04 -0.04Sept/Oct ⇥ $150K+ (ref) (ref) (ref) (ref)
Panel B: By Educational AttainmentTime Period
August (ref) (ref) (ref) (ref)Sept/Oct -0.00 0.01 -0.00 0.01
Educational Attainment
HS, trade/tech school 0.05** 0.04** 0.17*** -0.03Some College 0.04* 0.02 0.15*** 0.02Four Year College -0.00 0.00 0.01 0.00Graduate School (ref) (ref) (ref) (ref)
DiD Estimates
Sept/Oct ⇥ HS, trade/tech school 0.04+ 0.02 0.07* 0.01Sept/Oct ⇥ Some College 0.04* 0.02 0.03 -0.00Sept/Oct ⇥ Four Year College 0.01 -0.02 0.03 -0.00Sept/Oct ⇥ Graduate School (ref) (ref) (ref) (ref)
Panel C: By GenderTime Period
August (ref) (ref) (ref) (ref)Sept/Oct 0.05*** 0.04*** 0.06*** 0.01Female (ref) (ref) (ref) (ref)
Gender
Male -0.01 0.01 -0.06*** -0.04**
DiD Estimates
Sept/Oct ⇥ Female (ref) (ref) (ref) (ref)Sept/Oct ⇥ Male -0.04* -0.04** -0.05* 0.01
Observations 11756 11756 11756 11756
20

(1) (2) (3) (4)Spend > Inc No Bill Pay Lack ST Savings Defer Purchase
Panel D: By Race/EthnicityTime Period
August (ref) (ref) (ref) (ref)Sept/Oct 0.02+ 0.03*** 0.03* 0.00
Race/Ethnicity
White, nh (ref) (ref) (ref) (ref)Black, nh -0.01 0.03 -0.08** -0.02Asian, nh -0.02 -0.04** -0.10** -0.03Hispanic -0.06** -0.01 -0.07* -0.02Two or more, nh 0.00 0.06 0.04 -0.06
DiD Estimates
Sept/Oct ⇥ White, nh (ref) (ref) (ref) (ref)Sept/Oct ⇥ Black, nh 0.05 -0.04 0.04 -0.00Sept/Oct ⇥ Asian, nh -0.04 -0.01 -0.04 0.04Sept/Oct ⇥ Hispanic 0.04 -0.01 0.03 0.03Sept/Oct ⇥ Two or more, nh 0.07 0.01 0.03 0.10+
Panel E: By Age GroupTime Period
August (ref) (ref) (ref) (ref)Sept/Oct 0.01 0.01 0.01 0.00
Age Group
18-24 0.05+ 0.08*** 0.01 0.12***25-34 0.06* 0.06*** 0.11*** 0.15***35-44 0.05* 0.05*** 0.09** 0.09***45-54 0.08*** 0.06*** 0.13*** 0.09***55-64 0.04+ 0.03* 0.06* 0.03+65+ (ref) (ref) (ref) (ref)
DiD Estimates
Sept/Oct ⇥ 18-24 -0.01 -0.02 0.01 -0.02Sept/Oct ⇥ 25-34 0.04 0.02 0.01 -0.01Sept/Oct ⇥ 35-44 0.05+ 0.04* 0.06 0.04Sept/Oct ⇥ 45-54 0.03 0.01 0.05 0.01Sept/Oct ⇥ 55-64 0.02 -0.00 0.02 0.02Sept/Oct ⇥ 65+ (ref) (ref) (ref) (ref)
Observations 11756 11756 11756 11756
21

Table 2a: Effects of PUC Expiration on Financial Fragility.(Predicted values from OLS models with demographic controls, weighted.)
(1) (2) (3) (4)Spend > Inc No Bill Pay Lack ST Savings Defer Purchase
Survey Wave
late Jun (ref) (ref) (ref) (ref)mid Jul 0.01 0.01 0.01 -0.02early Aug -0.01 -0.00 0.01 -0.02mid Sept -0.01 -0.01 -0.00 -0.01early Oct 0.00 0.01 0.04+ -0.02Employment Status
Full-time (ref) (ref) (ref) (ref)Part-time 0.05 0.04 -0.08** -0.01Retired 0.00 -0.02 -0.04 -0.04+Unemployed 0.09** 0.05** 0.15*** -0.01Self-employed 0.03 0.03 0.10* -0.02
DiD Estimates (vs. June)
mid Jul ⇥ Full-time 0.00 0.00 0.00 0.00mid Jul ⇥ Part-time -0.04 -0.01 0.08+ 0.02mid Jul ⇥ Retired -0.02 0.01 -0.00 0.02mid Jul ⇥ Unemployed 0.03 0.05+ 0.03 0.04mid Jul ⇥ Self-employed -0.01 -0.03 -0.07 0.10+early Aug ⇥ Full-time 0.00 0.00 0.00 0.00early Aug ⇥ Part-time -0.01 -0.03 0.01 -0.00early Aug ⇥ Retired -0.02 0.01 0.04 0.02early Aug ⇥ Unemployed -0.01 -0.00 0.01 0.02early Aug ⇥ Self-employed -0.01 -0.00 -0.09 0.04mid Sept ⇥ Full-time 0.00 0.00 0.00 0.00mid Sept ⇥ Part-time -0.04 -0.01 0.08+ 0.04mid Sept ⇥ Retired 0.03 0.04* 0.10** 0.00mid Sept ⇥ Unemployed 0.10* 0.04 0.11* 0.04mid Sept ⇥ Self-employed 0.05 0.07+ -0.01 0.02early Oct ⇥ Full-time 0.00 0.00 0.00 0.00early Oct ⇥ Part-time -0.01 -0.01 0.10* -0.00early Oct ⇥ Retired 0.00 0.01 0.08** 0.03early Oct ⇥ Unemployed 0.08* 0.09** 0.07 0.09*early Oct ⇥ Self-employed 0.04 -0.05 -0.03 0.07
Observations 18382 18382 18382 18382
22

Table 2b: Effects of PUC Expiration on Financial Fragility.(Predicted values from OLS models with demographic controls, weighted.)
(1) (2) (3) (4)Spend > Inc No Bill Pay Lack ST Savings Defer Purchase
Time Period
June/July 0.01 0.01 -0.00 0.01August (ref) (ref) (ref) (ref)Sept/Oct 0.01 0.00 0.01 0.01
Employment Status
Full-time (ref) (ref) (ref) (ref)Part-time 0.04 0.00 -0.07** -0.01Retired -0.02 -0.01 0.00 -0.01Unemployed 0.07*** 0.05** 0.16*** 0.01Self-employed 0.03 0.03 0.01 0.03
DiD Estimates vs. August
June/July ⇥ Full-time 0.00 0.00 0.00 0.00June/July ⇥ Part-time -0.01 0.02 0.04 0.02June/July ⇥ Retired 0.01 -0.00 -0.04 -0.01June/July ⇥ Unemployed 0.03 0.03 0.01 0.00June/July ⇥ Self-employed 0.00 -0.02 0.05 0.01Sept/Oct ⇥ Full-time 0.00 0.00 0.00 0.00Sept/Oct ⇥ Part-time -0.01 0.02 0.09* 0.02Sept/Oct ⇥ Retired 0.04+ 0.02 0.05+ -0.01Sept/Oct ⇥ Unemployed 0.11*** 0.08** 0.08* 0.04Sept/Oct ⇥ Self-employed 0.05 0.01 0.07 0.00
Observations 18382 18382 18382 18382
23

Figure 1: HH Economic Security by Wave.(Predicted values from OLS models with demographic controls, weighted.)
0%
10%
20%
30%
40%
late J
un
mid Ju
l
early
Aug
mid Sep
t
early
Oct
Spending Exceeds Income
0%
10%
20%
30%
40%
late J
un
mid Ju
l
early
Aug
mid Sep
t
early
Oct
Unable to Pay Bills on Time
0%
10%
20%
30%
40%
late J
un
mid Ju
l
early
Aug
mid Sep
t
early
Oct
Little to no Savings for Short-Term Needs
0%
10%
20%
30%
40%
late J
un
mid Ju
l
early
Aug
mid Sep
t
early
Oct
Last Month Postponed Major Purchase
24

Figure 2a: Household Income Inequality in Financial Fragility.(Predicted values from OLS models with demographic controls, weighted.)
0%
10%
20%
30%
40%
August Sept/Oct
Spending Exceeds Income
0%
10%
20%
30%
40%
August Sept/Oct
Unable to Pay Bills on Time
0%
10%
20%
30%
40%
August Sept/Oct
Little to no Savings for Short-Term Needs
0%
10%
20%
30%
40%
August Sept/Oct
Last Month Postponed Major Purchase
< $60K $60K-$100K $100K-$150K $150K+
25

Figure 2b: Educational Inequality in Financial Fragility.(Predicted values from OLS models with demographic controls, weighted.)
0%
10%
20%
30%
40%
August Sept/Oct
Spending Exceeds Income
0%
10%
20%
30%
40%
August Sept/Oct
Unable to Pay Bills on Time
0%
10%
20%
30%
40%
August Sept/Oct
Little to no Savings for Short-Term Needs
0%
10%
20%
30%
40%
August Sept/Oct
Last Month Postponed Major Purchase
hs, trade/tech school some college 4yr college grad school
26

Figure 2c: Gender Inequality in Financial Fragility.(Predicted values from OLS models with demographic controls, weighted.)
0%
10%
20%
30%
40%
August Sept/Oct
Spending Exceeds Income
0%
10%
20%
30%
40%
August Sept/Oct
Unable to Pay Bills on Time
0%
10%
20%
30%
40%
August Sept/Oct
Little to no Savings for Short-Term Needs
0%
10%
20%
30%
40%
August Sept/Oct
Last Month Postponed Major Purchase
Female Male
27

Figure 3a: Employment Status and HH Economic Security by Wave.(Predicted values from OLS with demographic controls + State FE, weighted.)
0%
10%
20%
30%
40%
late J
un
mid Ju
l
early
Aug
mid Sep
t
early
Oct
Spending Exceeds Income
0%
10%
20%
30%
40%
late J
un
mid Ju
l
early
Aug
mid Sep
t
early
Oct
Unable to Pay Bills on Time
0%
10%
20%
30%
40%
50%
60%
late J
un
mid Ju
l
early
Aug
mid Sep
t
early
Oct
Little to no Savings for Short-Term Needs
0%
10%
20%
30%
40%
late J
un
mid Ju
l
early
Aug
mid Sep
t
early
Oct
Last Month Postponed Major Purchase
Full-time Part-time RetiredUnemployed Self-employed
28

Figure 3b: Employment Status and HH Economic Security by Period.(Predicted values from OLS with demographic controls + State FE, weighted.)
0%
10%
20%
30%
40%
June/July August Sept/Oct
Spending Exceeds Income
0%
10%
20%
30%
40%
June/July August Sept/Oct
Unable to Pay Bills on Time
0%
10%
20%
30%
40%
50%
June/July August Sept/Oct
Little to no Savings for Short-Term Needs
0%
10%
20%
30%
June/July August Sept/Oct
Last Month Postponed Major Purchase
Full-time Part-time RetiredUnemployed Self-employed
29