how can we reduce our spending? - … · understanding mobile phone plans can ensure effective and...
TRANSCRIPT
How can we reduce our spending?
Year 7 This unit is aligned with the following Australian Curriculum learning areas:
Mathematics, supported by English and Economics and Business
2
Copyright information
Websites: asic.gov.au, moneysmart.gov.au
Creative Commons
This resource is available under the Creative Commons licence (BY-NC-SA). Under this licence, the material is available for free use and adaption so that educators can use, adapt and re-publish material from the resource without seeking the permission of ASIC.
Copyright notice
This work is based on materials that constitute copyright of the Australian Securities and Investments Commission and is licensed under a Creative Commons Attribution Non-Commercial Share Alike 3.0 Australia Licence. For an explanation of what this licence allows you to do please refer to the Creative Commons website at creativecommons.org.au.
You must include this statement on any adaption of the resource:
This work is licensed under a Creative Commons Attribution Non-Commercial Share Alike 3.0 Australia Licence (see: creativecommons.org/licenses/by-nc-sa/3.0/au/legalcode). A Legal Notice applies to the use of these materials, see: Legal Notice: moneysmart.gov.au/copyright
The material in this resource is made available for the purpose of providing access to general information about consumer and financial literacy education and is not professional advice. If you intend to rely on the material, you should obtain advice relevant to your particular circumstances to evaluate its accuracy, currency and completeness.
Some material may include or summarise views, standards or recommendations of third parties. ASIC does not endorse such material and its inclusion does not indicate that ASIC recommends any course of action.
ASIC requests that if you re-publish this work that you notify ASIC by email [email protected]. We are interested in hearing how people are using and adapting the materials.
CAL exemption
This resource is exempt from collection by copyright agencies and is a free resource for educational institutions.
Note
All links were correct at the time of publication, however, due to the dynamic nature of the internet ASIC cannot guarantee they will remain correct.
3
How can we reduce our spending?
Introduction
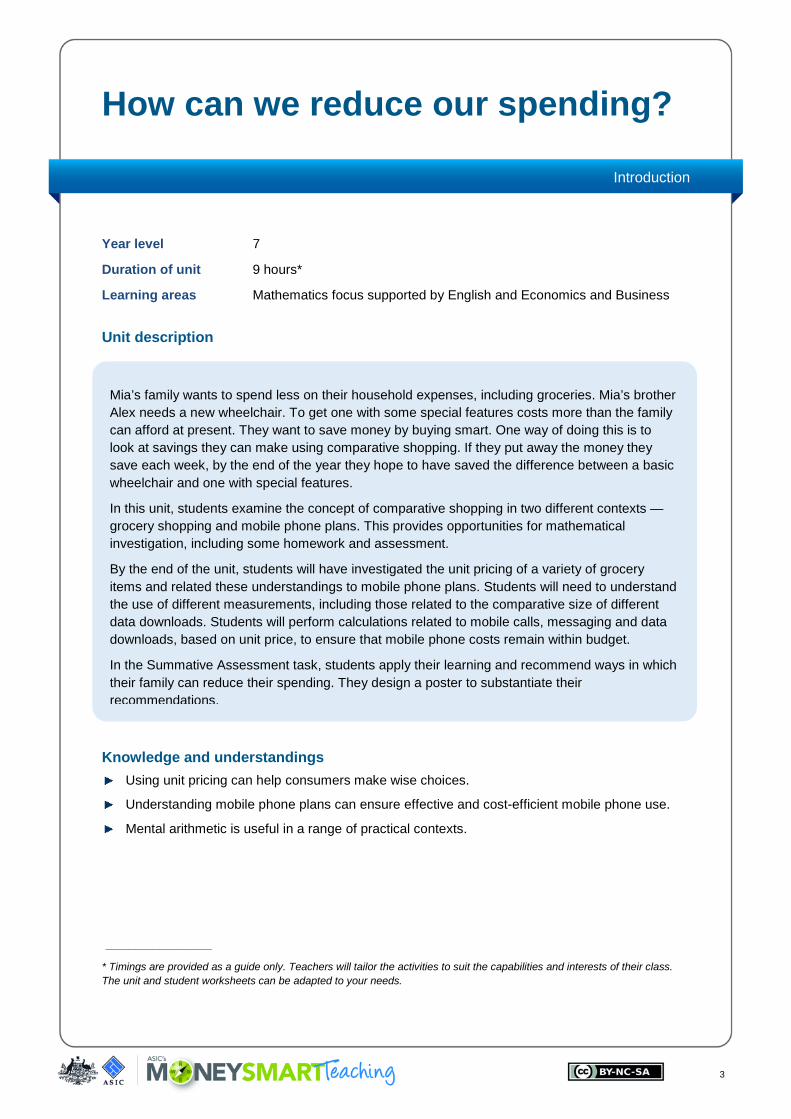
Year level 7
Duration of unit 9 hours*
Learning areas Mathematics focus supported by English and Economics and Business
Unit description
Knowledge and understandings Using unit pricing can help consumers make wise choices.
Understanding mobile phone plans can ensure effective and cost-efficient mobile phone use.
Mental arithmetic is useful in a range of practical contexts.
__________________
* Timings are provided as a guide only. Teachers will tailor the activities to suit the capabilities and interests of their class. The unit and student worksheets can be adapted to your needs.
Mia’s family wants to spend less on their household expenses, including groceries. Mia’s brother Alex needs a new wheelchair. To get one with some special features costs more than the family can afford at present. They want to save money by buying smart. One way of doing this is to look at savings they can make using comparative shopping. If they put away the money they save each week, by the end of the year they hope to have saved the difference between a basic wheelchair and one with special features.
In this unit, students examine the concept of comparative shopping in two different contexts —grocery shopping and mobile phone plans. This provides opportunities for mathematical investigation, including some homework and assessment.
By the end of the unit, students will have investigated the unit pricing of a variety of grocery items and related these understandings to mobile phone plans. Students will need to understand the use of different measurements, including those related to the comparative size of different data downloads. Students will perform calculations related to mobile calls, messaging and data downloads, based on unit price, to ensure that mobile phone costs remain within budget.
In the Summative Assessment task, students apply their learning and recommend ways in which their family can reduce their spending. They design a poster to substantiate their recommendations.

4
Year 7
Links The following table provides the relevant links to the Australian Curriculum learning areas, achievement standards and general capabilities.
Australian Curriculum learning areas and achievement standards
Mathematics Content Descriptions
Strand: Number and Algebra — Sub-strand: Real Numbers
o Round decimals to a specified number of decimal places (ACMNA156)
— Sub-strand: Money and financial mathematics
o Investigate and calculate ‘best buys’, with and without digital technologies (ACMNA174)
Strand: Statistics and Probability — Data Representation and interpretation
o Identify and investigate issues involving numerical data collected from primary and secondary sources (ACMSP169)
Achievement Standards
By the end of Year 7, students solve problems involving the comparison, addition and subtraction of integers. They make the connections between whole numbers and index notation and the relationship between perfect squares and square roots. They solve problems involving percentages and all four operations with fractions and decimals. They compare the cost of items to make financial decisions. Students represent numbers using variables. They connect the laws and properties for numbers to algebra. They interpret simple linear representations and model authentic information. Students describe different views of three-dimensional objects. They represent transformations in the Cartesian plane. They solve simple numerical problems involving angles formed by a transversal crossing two lines. Students identify issues involving the collection of continuous data. They describe the relationship between the median and mean in data displays.
Students use fractions, decimals and percentages, and their equivalences. They express one quantity as a fraction or percentage of another. Students solve simple linear equations and evaluate algebraic expressions after numerical substitution. They assign ordered pairs to given points on the Cartesian plane. Students use formulas for the area and perimeter of rectangles and calculate volumes of rectangular prisms. Students classify triangles and quadrilaterals. They name the types of angles formed by a transversal crossing parallel line. Students determine the sample space for simple experiments with equally likely outcomes and assign probabilities to those outcomes. They calculate mean, mode, median and range for data sets. They construct stem-and-leaf plots and dot-plots.
English Content Descriptions
Strand: Literacy — Sub-strand: Interpreting, analysing, evaluation
5
Year 7
o Use comprehension strategies to interpret, analyse and synthesise ideas and information, critiquing ideas and issues from a variety of textual sources (ACELY1723)
— Sub-strand: Creating texts o Plan, draft and publish imaginative, informative and persuasive
texts, selecting aspects of subject matter and particular language, visual, and audio features to convey information and ideas (ACELY1725)
Achievement Standards
By the end of Year 7, students understand how text structures can influence the complexity of a text and are dependent on audience, purpose and context. They demonstrate understanding of how the choice of language features, images and vocabulary affects meaning.
Students explain issues and ideas from a variety of sources, analysing supporting evidence and implied meaning. They select specific details from texts to develop their own response, recognising that texts reflect different viewpoints. They listen for and explain different perspectives in texts.
Students understand how the selection of a variety of language features can influence an audience. They understand how to draw on personal knowledge, textual analysis and other sources to express or challenge a point of view. They create texts showing how language features and images from other texts can be combined for effect.
Students create structured and coherent texts for a range of purposes and audiences. They make presentations and contribute actively to class and group discussions, using language features to engage the audience. When creating and editing texts they demonstrate understanding of grammar, use a variety of more specialised vocabulary and accurate spelling and punctuation.
Economics and business
Content Descriptions
Strand: Knowledge and understanding o The ways consumers and producers interact and respond to
each other in the market (ACHEK017)
o Why and how individuals and businesses plan to achieve short-term and long-term personal, organisational and financial objectives (ACHEK018)
Strand: Skills — Sub-strand: Interpretation and analysis
o Interpret data and information displayed in different formats to identify relationships and trends (ACHES023)
— Sub-strand: Economic reasoning, decision-making and application
o Generate a range of alternatives in response to an observed economic or business issue or event, and evaluate the potential costs and benefits of each alternative (ACHES024)
o Apply economics and business knowledge, skills and concepts in familiar and new situations (ACHES025)
— Sub-strand: Communication and reflection
o Present evidence-based conclusions using economics and

6
Year 7
business language and concepts in a range of appropriate formats, and reflect on the consequences of alternative actions (ACHES026)
Achievement Standards
By the end of Year 7, students describe the interdependence of consumers and producers in the market. They explain the importance of short- and long-term planning to individual and business success and identify different strategies that may be used. They describe the characteristics of successful businesses and explain how entrepreneurial capabilities contribute to this success. Students identify the reasons individuals choose to work and describe the various sources of income that exist.
When researching, students develop questions and gather data and information from different sources to investigate an economic or business issue. They interpret data to identify trends. They propose alternative responses to an issue and assess the costs and benefits of each alternative. They apply economics and business knowledge, skills and concepts to familiar problems. Students develop and present conclusions using appropriate texts, terms and concepts. They identify the effects of their decisions and the possible effects of alternative actions.
General Capabilities Typically, by the end of Year 7 students:
Literacy navigate, read and view a variety of challenging subject-specific texts with a wide range of graphic representations
interpret and evaluate information, identify main ideas and supporting evidence, and analyse different perspectives using comprehension strategies
use pair, group and class discussions and formal and informal debates as learning tools to explore ideas, test possibilities, compare solutions, rehearse ideas and arguments in preparation for creating texts
use wide knowledge of the structure and features of learning area texts to comprehend and compose texts, using creative adaptations of text structures and conventions for citing others
recognise and use aspects of language to suggest possibility, probability, obligation and conditionality
Numeracy solve complex problems by estimating and calculating using efficient mental, written and digital strategies
identify and justify ‘best value for money’ decisions
identify trends using number rules and relationships
convert between common metric units for volume and capacity and use perimeter, area and volume formulas to solve authentic problems
ICT locate, retrieve or generate information using search facilities and organise information in meaningful ways
Creative & Critical Thinking
pose questions to probe assumptions and investigate complex issues
clarify information and ideas from texts or images when exploring challenging issues
draw parallels between known and new ideas to create new ways of achieving goals

7
Year 7
generate alternatives and innovative solutions, and adapt ideas, including when information is limited or conflicting
predict possibilities, and identify and test consequences when seeking solutions and putting ideas into action
assess assumptions in their thinking and invite alternative opinions
evaluate and justify the reasons behind choosing a particular problem-solving strategy
justify reasons for decisions when transferring information to similar and different contexts
differentiate the components of a designed course of action and tolerate ambiguities when drawing conclusions
explain intentions and justify ideas, methods and courses of action, and account for expected and unexpected outcomes against criteria they have identified
Personal & Social Capability
identify and choose a range of learning strategies appropriate to specific tasks and describe work practices that assist their learning
assess the extent to which individual roles and responsibilities enhance group cohesion and the achievement of personal and group objectives
Cross-curriculum priorities N/A
Proficiency strands Understanding
— Students understand the unitary method and its use in comparing value. They understand the considerations involved in calculating mobile phone charges.
Fluency — Students perform calculations associated with comparative shopping and mobile phone
use. They calculate totals and averages. They perform mental calculations in practical contexts.
Problem Solving — Students solve problems associated with reducing spending in a variety of practical
contexts. Students identify and discuss a range of strategies for solving problems
Reasoning — Students perform calculations to justify their selection of a product. Students use national
data to inform estimates.
Diversity of learners
The Australian Curriculum is based on the assumptions that each student can learn and that the needs of every student are important. These needs are shaped by individual learning histories and abilities as well as personal, cultural and language backgrounds, and socio-economic factors. Teachers may adapt or plan additional learning activities depending on the multiple, diverse and changing needs of their students.

8
Year 7
National Consumer and Financial Literacy Framework (Note: the student learnings in the National Consumer and Financial Literacy Framework are divided into, and are applicable over, bands covering two chronological years.)
Dimension Student learnings by the end of Year 8
Knowledge and understanding
Explain why it is important to set and prioritise personal financial goals Identify implications of ‘terms and conditions’ such as fees, penalties, interest
and warranties Analyse and explain the range of factors affecting consumer choices
Competence
Compare income, spending commitments and life-styles at different stages of life
Determine the value of ‘deals’ when purchasing goods and services such as ‘buy one, get one free’
Justify the selection of a range of goods and services in a variety of ‘real-life’ contexts
Identify and explain marketing strategies used in advertising and social media to influence consumer decision-making
Responsibility and enterprise
Recognise the importance of planning for their financial futures and appreciate that sacrificing current expenditure can bring long-term benefits
Recognise that people have different ways of living and expectations according to their values and/or financial situation
Recognise that their ability to make informed decisions about personal finance and financial products is strengthened by finding and evaluating relevant information and accessing reliable advice
Demonstrate awareness that family, community and socio-cultural values and customs can influence consumer behaviour and financial decision-making

9
Year 7
Sequenced teaching and learning activities
Introducing Resources
Activity 1 Comparing prices (90 minutes)
Students perform mental and written calculations to support comparative shopping, and complete a PMI on ‘Should we always choose the purchase with the best value for money?’ (Cheapest). They also consider factors other than price that can determine the most suitable purchase.
Worksheet 1: Comparing prices mentally
Worksheet 2: Comparing prices using written calculations
Worksheet 3: PMI chart – Should we always choose the purchase with the best value for money?
Assessment: Diagnostic
The PMI chart allows teachers to gauge students’ understanding of considerations involved in comparative shopping. Students are observed as they perform and discuss mental calculations. This enables teachers to gauge the students’ mathematical ability.
Activity 2 Introducing unit pricing (60 minutes)
Students examine how unit prices are calculated using specific examples, and undertake calculations to determine the unit price of a range of grocery items. They will then compare the cost of shopping with and without paying attention to unit pricing.
Computer access/or printout of ACCC article on grocery unit prices
Resource 1: Unit pricing
Supermarket advertising brochures/online supermarket catalogues
Worksheet 4: Calculating unit prices
Developing Resources
Activity 3 Mobile phone unit price comparison (120 minutes)
Students explore some online learning objects about mobile phone plans, which compare unit prices of the different features. They will examine data downloads, compare and calculate the average size of downloading specific items to develop a data use profile, then determine if the use of mobile data is affordable.
Computer access to MoneySmart Teaching online interactive mobile phone activities and learning objects
Resource 2: Calculating mobile phone costs example
Worksheet 5: Calculating mobile phone costs
Video: Teens and Consumer Issues – moneysmart.gov.au/tools-and-resources/videos/video-teens-and-consumer-issues
Activity 4 Mobile phone plans with data (180 minutes)
Students explore the considerations they need to make when purchasing phone plans with data usage. They determine how to stay savvy with the range of plans and offers available to them. They look at phone usage and compare to a
Computer access
accc.gov.au/consumers/internet-phone
Worksheet 6: Calculating data downloads
Four A3 sheets and Blu-Tack®
Worksheet 7: Choosing a prepaid provider
10
Year 7
Developing Resources
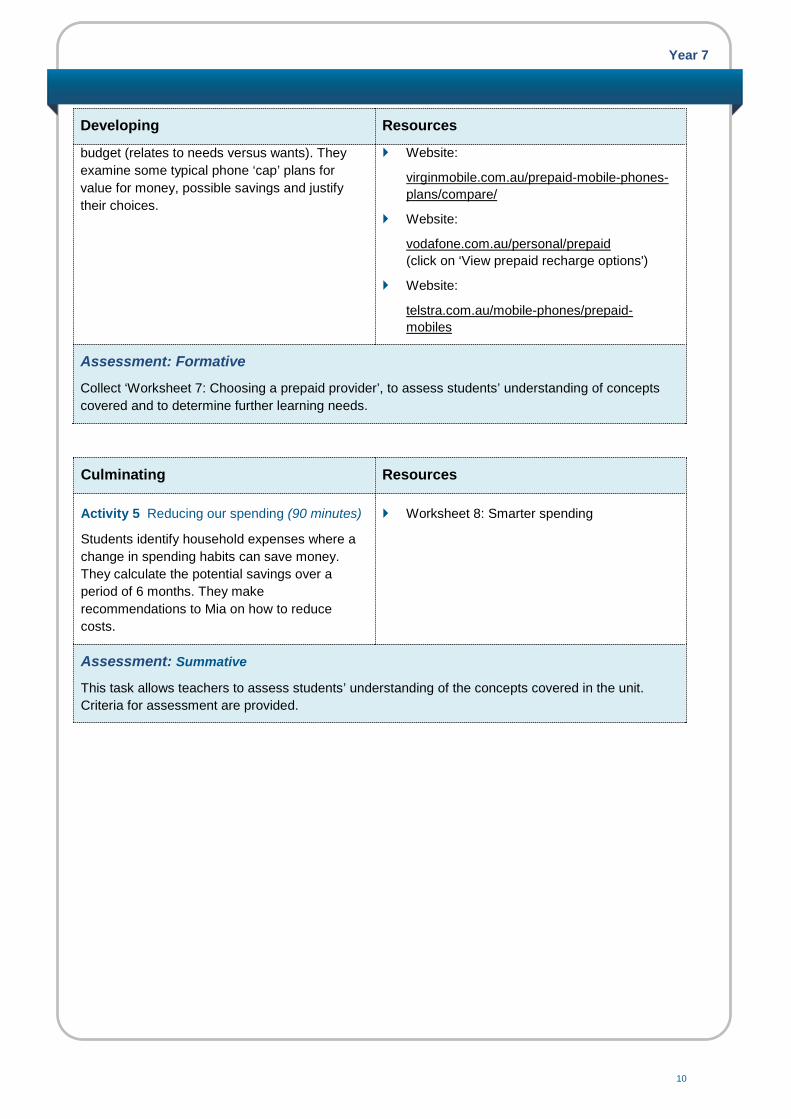
budget (relates to needs versus wants). They examine some typical phone ‘cap’ plans for value for money, possible savings and justify their choices.
Website:
virginmobile.com.au/prepaid-mobile-phones-plans/compare/
Website:
vodafone.com.au/personal/prepaid (click on ‘View prepaid recharge options')
Website:
telstra.com.au/mobile-phones/prepaid-mobiles
Assessment: Formative
Collect ‘Worksheet 7: Choosing a prepaid provider’, to assess students’ understanding of concepts covered and to determine further learning needs.
Culminating Resources
Activity 5 Reducing our spending (90 minutes)
Students identify household expenses where a change in spending habits can save money. They calculate the potential savings over a period of 6 months. They make recommendations to Mia on how to reduce costs.
Worksheet 8: Smarter spending
Assessment: Summative
This task allows teachers to assess students’ understanding of the concepts covered in the unit. Criteria for assessment are provided.

Unit planner
11 11
Unit planner
Assessment rubric
This rubric aligns with Year 7 Australian Curriculum: Mathematics, which is the focus of this unit. Teachers may wish to expand to include other learning areas. This rubric is intended as a guide only. It can be modified to suit teachers' needs and to be integrated into existing assessment systems. Teachers may also wish to collect the worksheets as work samples for individual student folios.
Student's name: __________________________________________________________________________________________________________________
Skill Relevant content description(s)
Relevant activities and worksheets
Competent Developing at level Needs further development
Notes
The student can understand and apply the conventions for rounding prices correct to two decimal places
Round decimals to a specified number of decimal places (ACMNA156)
Activity 2 Worksheet 4
The student determines all unit prices correctly to two decimal places for a range of grocery items
The student determines all unit prices to two decimal places for a range of grocery items. Occasional errors are corrected with little or no assistance
The student requires teacher guidance to apply the conventions for rounding correctly
The student can perform mental and written calculations to determine ‘best buys’
Investigate and calculate ‘best buys’, with and without digital technologies (ACMNA174)
Activity 1 Worksheets 1, 2 and 3
The student selects and uses efficient mental and written strategies to accurately calculate ‘best buys’. The student provides a succinct and thorough justification of their solution
The student selects and uses appropriate mental and written strategies to calculate ‘best buys’. Occasional errors are corrected with little or no assistance. The student provides acceptable justification of their solution
The student selects and uses some basic mental and written strategies to calculate some simple ‘best buys’. Justification is unclear or not provided
The student can apply the unitary method to identify ‘best buy’ situations, such as comparing the cost per 100 g
See ACMNA174 above
Activity 2 Worksheet 4
The student selects the correct pricing units for all grocery items and accurately calculates their unit prices
The student selects the correct pricing units for most grocery items and calculates their unit prices. Occasional errors are corrected with little or no assistance
The student requires teacher guidance and support to select and calculate the correct pricing units for grocery items

Unit planner
12 12
Assessment rubric (cont)
Skill Relevant content description(s)
Relevant activities and worksheets
Competent Developing at level Needs further development
Notes
The student can locate data from a variety of sources including print and online
Identify and investigate issues involving numerical data collected from primary and secondary sources (ACMSP169)
Activity 2
Worksheet 4
The student independently and successfully locates and records all required information
The student locates and records all required information with some assistance
The student locates and records information with significant teacher guidance
The student can interpret and apply given information
See ACMSP169 above
Activity 3 Worksheet 5
The student selects and uses all relevant data to accurately calculate total mobile phone costs for given scenarios
The student selects and uses relevant data to calculate total mobile phone costs for given scenarios. Occasional errors are corrected with little or no assistance
The student requires teacher guidance to select and use some relevant data before attempting to calculate total mobile phone costs for given scenarios
The student can locate, read, discuss and analyse information from a variety of sources
See ACMSP169 above
Activity 4 Worksheets 6 and 7
The student records sensible estimates of mobile phone and data usage. The student makes thorough, meaningful and accurate comparisons between several prepaid plan offers and provides a clear, concise and fully justified recommendation for the best one based on needs and budget
The student records estimates of mobile phone and data usage. The student makes some valid comparisons between several prepaid plan offers and provides a recommendation with some justification for the best one based on needs and budget
The student records given estimates of mobile phone and data usage. The student requires teacher guidance and support to make simple comparisons between several prepaid plan offers. A recommendation is provided with unclear or no justification

Unit planner
13 13
Assessment rubric (cont)
Skill Relevant content description(s)
Relevant activities and worksheets
Competent Developing at level Needs further development
Notes
The student can explain and apply their learning by recommending ways in which spending can be reduced
Suggested Summative Assessment
ACMNA156 ACMNA174 ACMSP169
Activity 5 Worksheet 8 (includes assessment criteria)
The student: – provides a clear and
detailed explanation of a practical strategy for saving money
– comments thoughtfully on the pros and cons of the strategy
– researches cost differences thoroughly
– calculates correctly the potential savings over a 6-month period
– explains calculations clearly and includes unit price calculations where relevant
– creates a well- designed, detailed and imaginative poster
The student: – provides a
satisfactory explanation of a practical strategy for saving money
– comments on a few of the pros and/or cons of the strategy
– researches some cost differences
– calculates, with some errors, the potential savings over a 6-month period
– explains most calculations and includes some unit price calculations where relevant
– creates a poster that organises and displays most information satisfactorily
The student: – provides minimal
explanation of a practical strategy for saving money
– comments on one or two of the pros and/or cons of the strategy
– researches little about cost differences
– attempts to calculate the potential savings over a 6-month period, but has little success
– provides little or no explanation of calculations
– creates a poster that lacks detail and organisation
14
Teacher notes
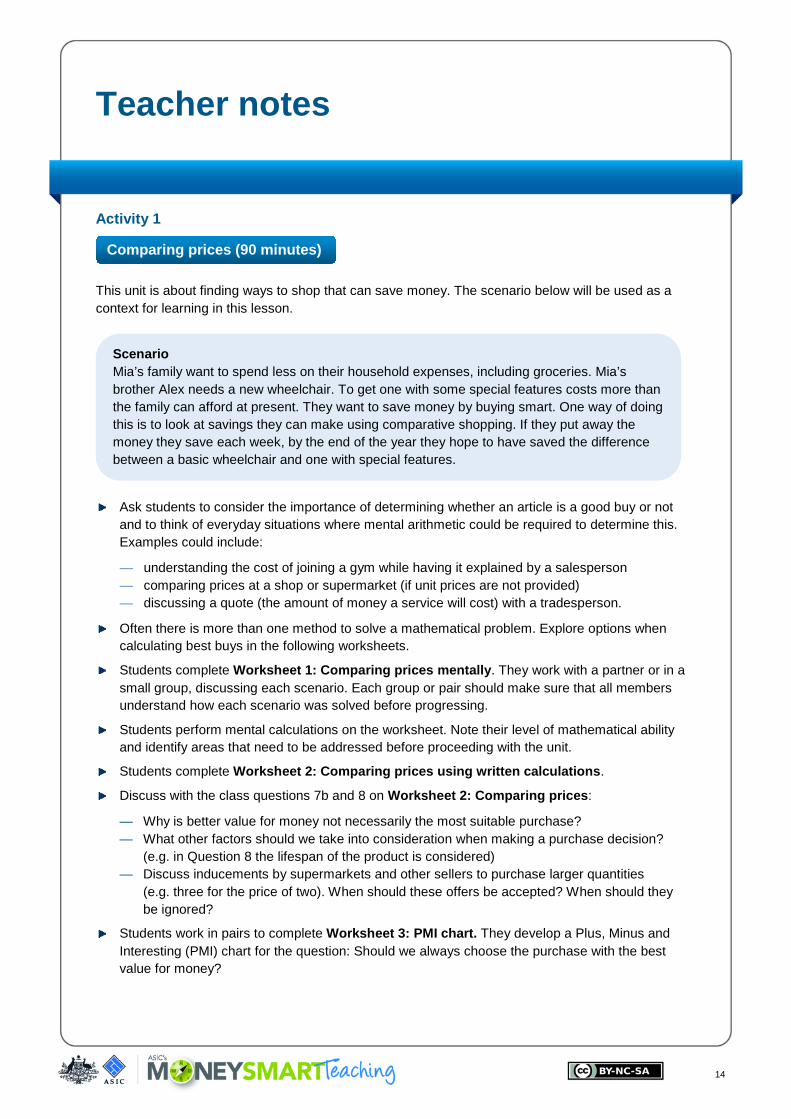
Activity 1
This unit is about finding ways to shop that can save money. The scenario below will be used as a context for learning in this lesson.
Ask students to consider the importance of determining whether an article is a good buy or not and to think of everyday situations where mental arithmetic could be required to determine this. Examples could include:
— understanding the cost of joining a gym while having it explained by a salesperson — comparing prices at a shop or supermarket (if unit prices are not provided) — discussing a quote (the amount of money a service will cost) with a tradesperson.
Often there is more than one method to solve a mathematical problem. Explore options when calculating best buys in the following worksheets.
Students complete Worksheet 1: Comparing prices mentally. They work with a partner or in a small group, discussing each scenario. Each group or pair should make sure that all members understand how each scenario was solved before progressing.
Students perform mental calculations on the worksheet. Note their level of mathematical ability and identify areas that need to be addressed before proceeding with the unit.
Students complete Worksheet 2: Comparing prices using written calculations.
Discuss with the class questions 7b and 8 on Worksheet 2: Comparing prices:
— Why is better value for money not necessarily the most suitable purchase? — What other factors should we take into consideration when making a purchase decision?
(e.g. in Question 8 the lifespan of the product is considered) — Discuss inducements by supermarkets and other sellers to purchase larger quantities
(e.g. three for the price of two). When should these offers be accepted? When should they be ignored?
Students work in pairs to complete Worksheet 3: PMI chart. They develop a Plus, Minus and Interesting (PMI) chart for the question: Should we always choose the purchase with the best value for money?
Comparing prices (90 minutes)
Scenario Mia’s family want to spend less on their household expenses, including groceries. Mia’s brother Alex needs a new wheelchair. To get one with some special features costs more than the family can afford at present. They want to save money by buying smart. One way of doing this is to look at savings they can make using comparative shopping. If they put away the money they save each week, by the end of the year they hope to have saved the difference between a basic wheelchair and one with special features.

15
Teacher notes
Collect the PMI charts and note students’ understanding of the considerations involved in comparative shopping.
As homework, ask students to discuss with their parents areas of the family budget where some savings could occur. Each student should write a list of at least five expenses where they and their family feel some money could be saved by changing spending habits. (If it is considered to be too intrusive for your students to ask about household budgets, you could provide an alternative task – identify, with their parents’ help, how savings can be made in a supermarket context by identifying five products where money could be saved by changing their spending habits. NOTE – if making this alteration, you will need to adjust the culminating assessment task, outlined on Worksheet 8: Smarter spending.
Notes
The ABC program ‘Checkout’ is an excellent resource for developing competence in consumer and financial literacy.
Start collecting advertisements and catalogues with prices of groceries – perhaps send a letter home to ask for these.
Activity 2
Examine how unit prices are calculated
Unit prices are based on the most appropriate unit of measurement, which is usually written on the packaging.
Students can look at unit pricing in real terms by visiting a supermarket or finding online grocery catalogues using the search term ‘supermarket specials Australia’.
The ACCC provides guidelines for unit pricing. Students work in pairs to answer the questions below. The ACCC website address is accc.gov.au.
— What does ACCC stand for? — What is the purpose of the ACCC? — Students type ‘grocery unit prices’ into their search engine then read the information online to
find the unit that would generally be used for products with the following quantities.
Quantity Unit
365 g 100 g
250 mL 100 mL
3.5 L
2.3 kg
Briefly discuss students’ responses to these questions in class.
Introducing unit pricing (60 minutes)
Large supermarkets are required to display a unit price on most grocery items so that shoppers can compare prices and determine the product that provides them with the best value.
16
Teacher notes
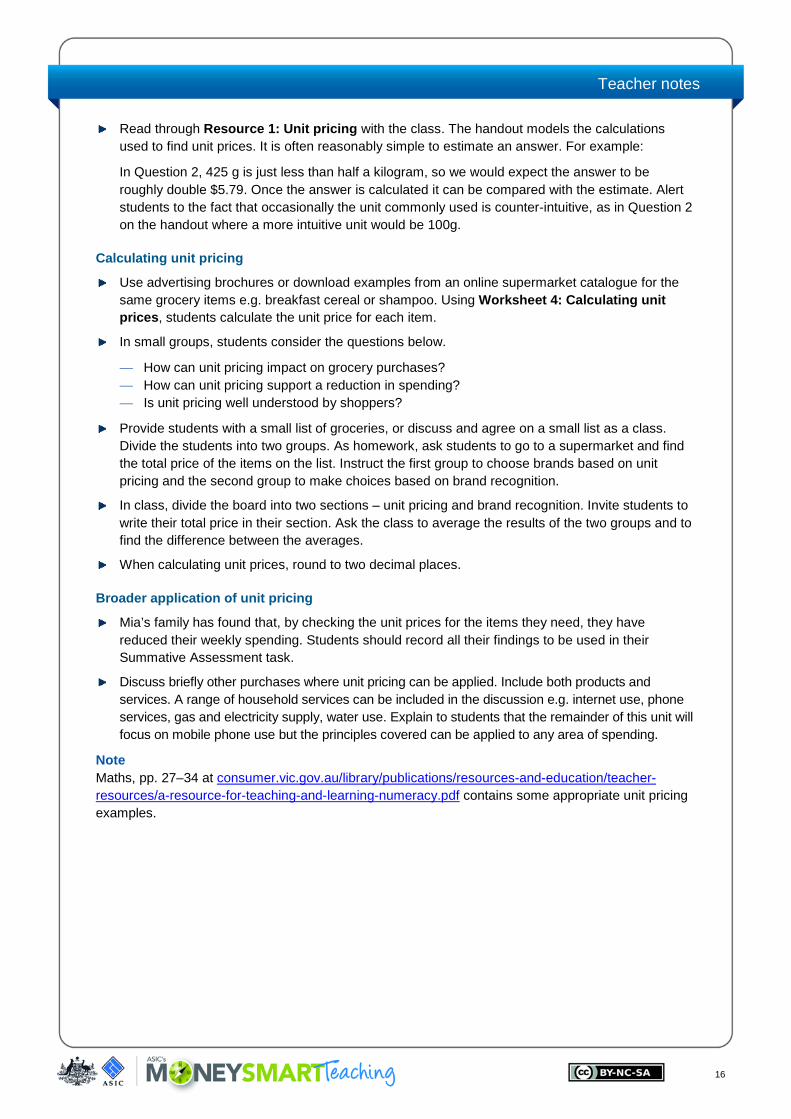
Read through Resource 1: Unit pricing with the class. The handout models the calculations used to find unit prices. It is often reasonably simple to estimate an answer. For example:
In Question 2, 425 g is just less than half a kilogram, so we would expect the answer to be roughly double $5.79. Once the answer is calculated it can be compared with the estimate. Alert students to the fact that occasionally the unit commonly used is counter-intuitive, as in Question 2 on the handout where a more intuitive unit would be 100g.
Calculating unit pricing
Use advertising brochures or download examples from an online supermarket catalogue for the same grocery items e.g. breakfast cereal or shampoo. Using Worksheet 4: Calculating unit prices, students calculate the unit price for each item.
In small groups, students consider the questions below.
— How can unit pricing impact on grocery purchases? — How can unit pricing support a reduction in spending? — Is unit pricing well understood by shoppers?
Provide students with a small list of groceries, or discuss and agree on a small list as a class. Divide the students into two groups. As homework, ask students to go to a supermarket and find the total price of the items on the list. Instruct the first group to choose brands based on unit pricing and the second group to make choices based on brand recognition.
In class, divide the board into two sections – unit pricing and brand recognition. Invite students to write their total price in their section. Ask the class to average the results of the two groups and to find the difference between the averages.
When calculating unit prices, round to two decimal places.
Broader application of unit pricing
Mia’s family has found that, by checking the unit prices for the items they need, they have reduced their weekly spending. Students should record all their findings to be used in their Summative Assessment task.
Discuss briefly other purchases where unit pricing can be applied. Include both products and services. A range of household services can be included in the discussion e.g. internet use, phone services, gas and electricity supply, water use. Explain to students that the remainder of this unit will focus on mobile phone use but the principles covered can be applied to any area of spending.
Note Maths, pp. 27–34 at consumer.vic.gov.au/library/publications/resources-and-education/teacher-resources/a-resource-for-teaching-and-learning-numeracy.pdf contains some appropriate unit pricing examples.
17
Teacher notes
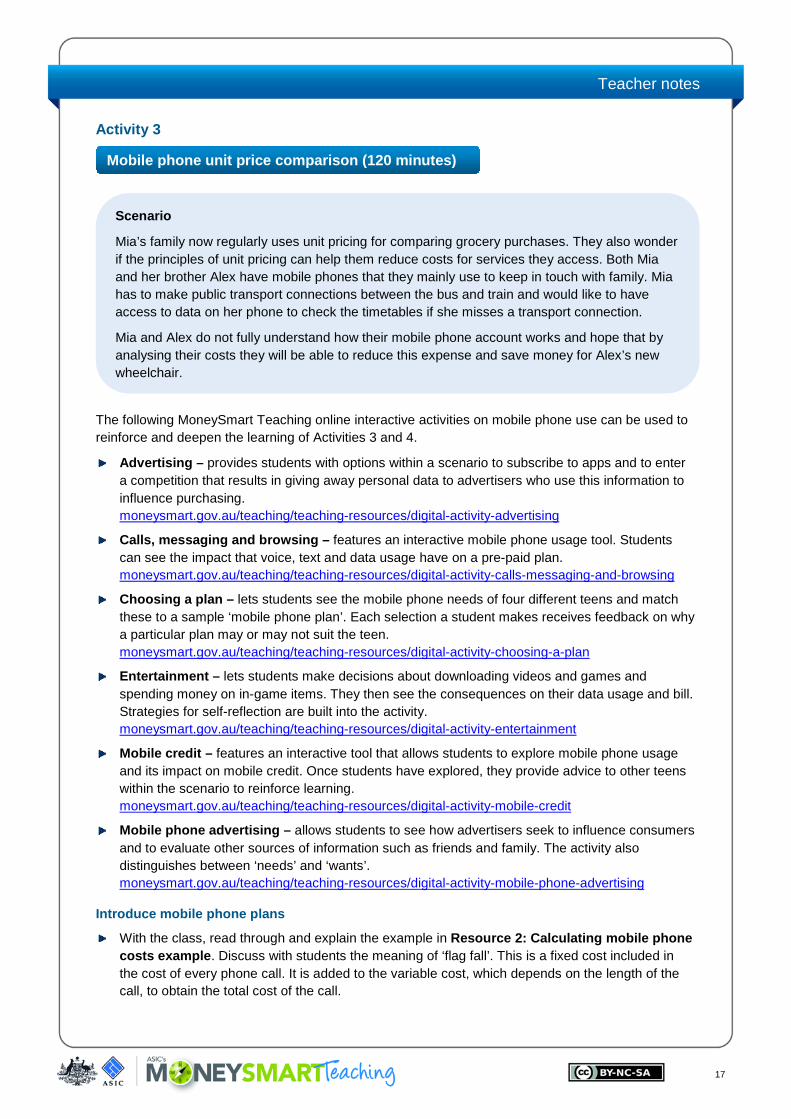
Activity 3
The following MoneySmart Teaching online interactive activities on mobile phone use can be used to reinforce and deepen the learning of Activities 3 and 4.
Advertising – provides students with options within a scenario to subscribe to apps and to enter a competition that results in giving away personal data to advertisers who use this information to influence purchasing. moneysmart.gov.au/teaching/teaching-resources/digital-activity-advertising
Calls, messaging and browsing – features an interactive mobile phone usage tool. Students can see the impact that voice, text and data usage have on a pre-paid plan. moneysmart.gov.au/teaching/teaching-resources/digital-activity-calls-messaging-and-browsing
Choosing a plan – lets students see the mobile phone needs of four different teens and match these to a sample ‘mobile phone plan’. Each selection a student makes receives feedback on why a particular plan may or may not suit the teen. moneysmart.gov.au/teaching/teaching-resources/digital-activity-choosing-a-plan
Entertainment – lets students make decisions about downloading videos and games and spending money on in-game items. They then see the consequences on their data usage and bill. Strategies for self-reflection are built into the activity. moneysmart.gov.au/teaching/teaching-resources/digital-activity-entertainment
Mobile credit – features an interactive tool that allows students to explore mobile phone usage and its impact on mobile credit. Once students have explored, they provide advice to other teens within the scenario to reinforce learning. moneysmart.gov.au/teaching/teaching-resources/digital-activity-mobile-credit
Mobile phone advertising – allows students to see how advertisers seek to influence consumers and to evaluate other sources of information such as friends and family. The activity also distinguishes between ‘needs’ and ‘wants’. moneysmart.gov.au/teaching/teaching-resources/digital-activity-mobile-phone-advertising
Introduce mobile phone plans
With the class, read through and explain the example in Resource 2: Calculating mobile phone costs example. Discuss with students the meaning of ‘flag fall’. This is a fixed cost included in the cost of every phone call. It is added to the variable cost, which depends on the length of the call, to obtain the total cost of the call.
Mobile phone unit price comparison (120 minutes)
Scenario
Mia’s family now regularly uses unit pricing for comparing grocery purchases. They also wonder if the principles of unit pricing can help them reduce costs for services they access. Both Mia and her brother Alex have mobile phones that they mainly use to keep in touch with family. Mia has to make public transport connections between the bus and train and would like to have access to data on her phone to check the timetables if she misses a transport connection.
Mia and Alex do not fully understand how their mobile phone account works and hope that by analysing their costs they will be able to reduce this expense and save money for Alex’s new wheelchair.

18
Teacher notes
Students complete Worksheet 5: Calculating mobile phone costs.
Show the video ‘Teens and consumer issues’ – moneysmart.gov.au/tools-and-resources/videos/video-teens-and-consumer-issues
Discuss issues raised in the video, before students work in pairs to answer the following questions (internet access may be required for students who need to research the answer).
— What is the difference between a capped plan and a prepaid plan?
Note that: – some plans offer ‘free talk time’ e.g. for calls on the same network or between certain
times of the day – there is data that is zero rated or free – e.g. Facebook. – What happens on each of these plans if you have used up your credit and wish to make
additional calls, or use additional data? – Why do you think that prepaid is recommended over caps for young phone users? – What is ‘bill shock’ and which of the two types of plans does it more often relate to?
Discuss students’ answers to the questions.
Note For more information see Maths, pp. 70–77 education.vic.gov.au/Resource/
Activity 4
Mobile phone and data download costs
Note Mobile data enables a mobile device, such as a smartphone, tablet or mobile broadband modem, to access the internet without the need to plug into a fixed phone line. Data is often included in a mobile phone plan, but a data plan can also be purchased separately.
Access this website with students:
— accc.gov.au/consumers/internet-phone
Organise students into three ‘expert’ groups. Each group selects, reads and discusses one aspect of buying a mobile phone plan with data. e.g. Choosing mobile plans, inclusions in mobile plans and managing data usage. Once each group has read and analysed their article, organise students into groups of three (or six), with one (or two) student from each ‘expert’ group. Students share with their group their understanding of the article they have read, and develop and record a group response to the question: What is mobile phone data? Share responses briefly with the class.
Students document their findings as a brochure or guide to help others contemplating purchasing a mobile phone plan that uses data.
Can you afford data on your mobile phone?
Most ‘bill shock’ experiences occur in relation to mobile data plans. Young users are especially at risk if they do not understand the meaning of data limits, the consequences of exceeding them and how to track the use of data. Using a prepaid plan reduces risk, but young users still need sufficient awareness to ration credit over the duration of the plan.
Mobile phone plans with data (180 minutes)

19
Teacher notes
Students share their questions with the class. Questions that could be considered, include:
— What other personal expenses do Mia and Alex have? — What is their source of income to pay the mobile account amount each month (timeframe)? — Is this income regular and long term? — Is accessing the internet from their phone a need or a want?
Discuss alternative options for internet access that don’t require a data plan or smartphone, e.g. wi-fi hotspots.
Students work in groups to complete Worksheet 6: Calculating data downloads. The second Choice article above contains information that could be useful to students in estimating Mia’s data usage. The meaning of Kb and Mb is explained on the worksheet. See Worksheet 6: Calculating data downloads for data download charges.
Refer to some prepaid phone plans to align the anticipated usage to a phone. Choose prepaid plans that reflect the budget of the students in the class. Examples can be found at:
— virginmobile.com.au/prepaid-mobile-phones-plans/compare/ — vodafone.com.au/personal/prepaid (click on ‘View prepaid recharge options') — telstra.com.au/mobile-phones/prepaid-mobiles — optus.com.au/shop/prepaidmobile/prepaidoffers
Alternatively, students could visit digital resource: moneysmart.gov.au/mst-digital-resources/shopping-for-a-mobile/start_here.html to find a range of products suitable for specific types of users.
Emphasise that most consumers have to review their expenses and compromise wants compared to needs so that expenses do not impact adversely on their income. Money is a limited resource, and spending should be prioritised so that money can be managed effectively.
The pattern of phone usage is an important consideration in determining value for money and is the first step in managing phone usage to avoid ‘bill shock’.
Explain that some people might need data on their mobile phone plan and others might not need it but still want it. Organise students into groups and ask them to write some other examples of needs and wants.
When students report their examples back to the class, discuss the following questions:
— How do needs and wants vary from person to person? — Can you think of an example of an item that might be a want at one age and a need at
another age? — Can you think of a situation where someone might genuinely need to have data as part of
their mobile phone plan? — Can you think of some things that you want that others might genuinely need, and some
things that you need that others might only want?
Write the following four questions on A3 sheets and tack them to the wall in different areas of the classroom. Organise students into four groups. Each group starts with a different question and spends a few minutes discussing and recording their ideas and responses before moving to the next question.
Mia and Alex are trying to determine how much they can sensibly spend each month on internet access (‘data’) from their mobile phones. Write a list of questions Mia and Alex should ask themselves to help them make this decision.

20
Teacher notes
1. What strategies can be used to record phone usage? 2. What is the impact of confusing needs and wants on using a mobile phone? 3. What challenges do mobile phone users face? 4. What constraints are imposed on mobile phone consumers?
After each group has returned to their starting point, they review and summarise the responses and report this summary back to the class.
Students complete Worksheet 7: Choosing a prepaid provider. Collect worksheets to determine further learning needs.
Class discussion:
— How can we monitor how much credit we are using on our mobile phones? — How can we monitor how much data we are using on our mobile phones? — Where can we find help if we experience difficulties with our provider?
Many phones have features that allow users to track phone usage. Many providers offer online tracking of mobile phone use and mobile data use. Most providers offer SMS reminders when a percentage of credit has been used. If students have a problem with their provider, it is recommended that they ask their parents or another adult to contact their provider, and if that fails, to contact the Telecommunications Industry Ombudsman (tio.com.au).
Broader application of mobile phone comparisons
Mia's family has found that by using a prepaid plan with their mobile phones they can reduce their weekly spending.
Activity 5
Students complete and submit the assessment task described on Worksheet 8: Smarter spending.
Note Worksheet 8: Smarter spending will need to be adapted if you used the alternative homework task in Activity 1.
Each student describes to the class one of the five savings measures they have identified.
Reducing our spending (90 minutes)

Resources
22
Resource 1: Unit pricing Resources
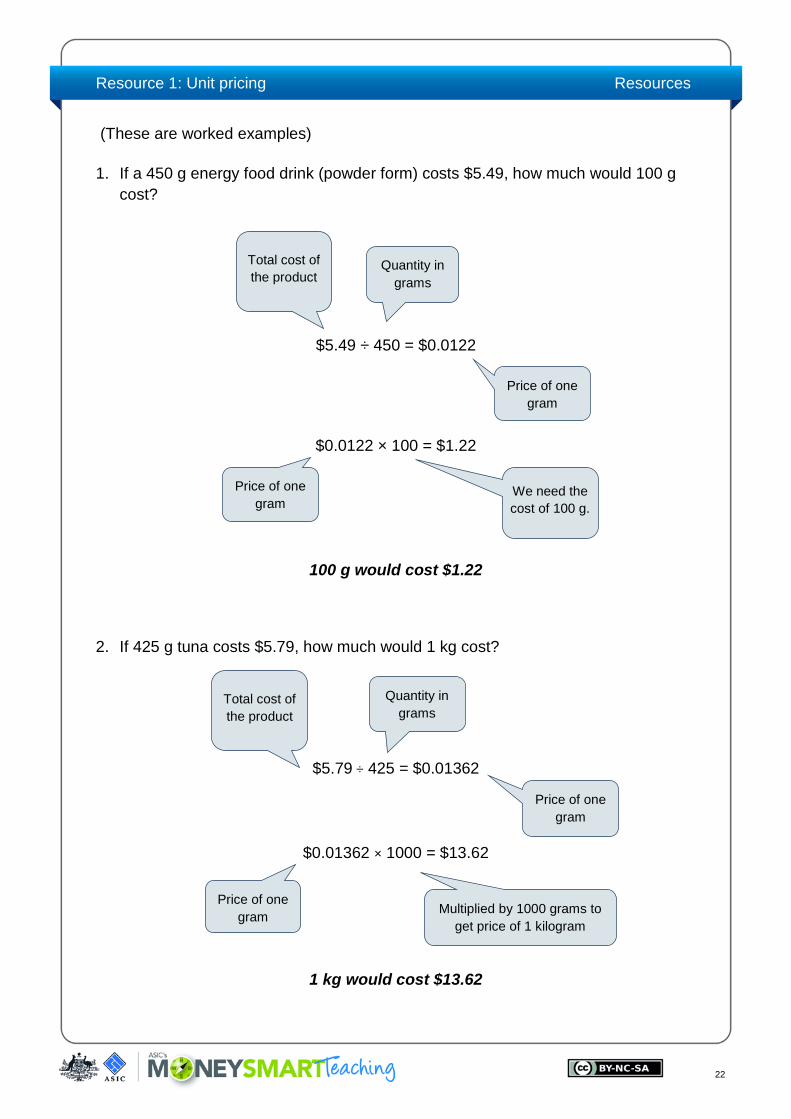
(These are worked examples)
1. If a 450 g energy food drink (powder form) costs $5.49, how much would 100 g cost?
$5.49 ÷ 450 = $0.0122
$0.0122 × 100 = $1.22
100 g would cost $1.22
2. If 425 g tuna costs $5.79, how much would 1 kg cost?
$5.79 ÷ 425 = $0.01362
$0.01362 × 1000 = $13.62
1 kg would cost $13.62
Total cost of the product
Quantity in grams
Price of one gram
Quantity in grams
Price of one gram
Multiplied by 1000 grams to get price of 1 kilogram
Price of one gram
Price of one gram
We need the cost of 100 g.
Total cost of the product
23
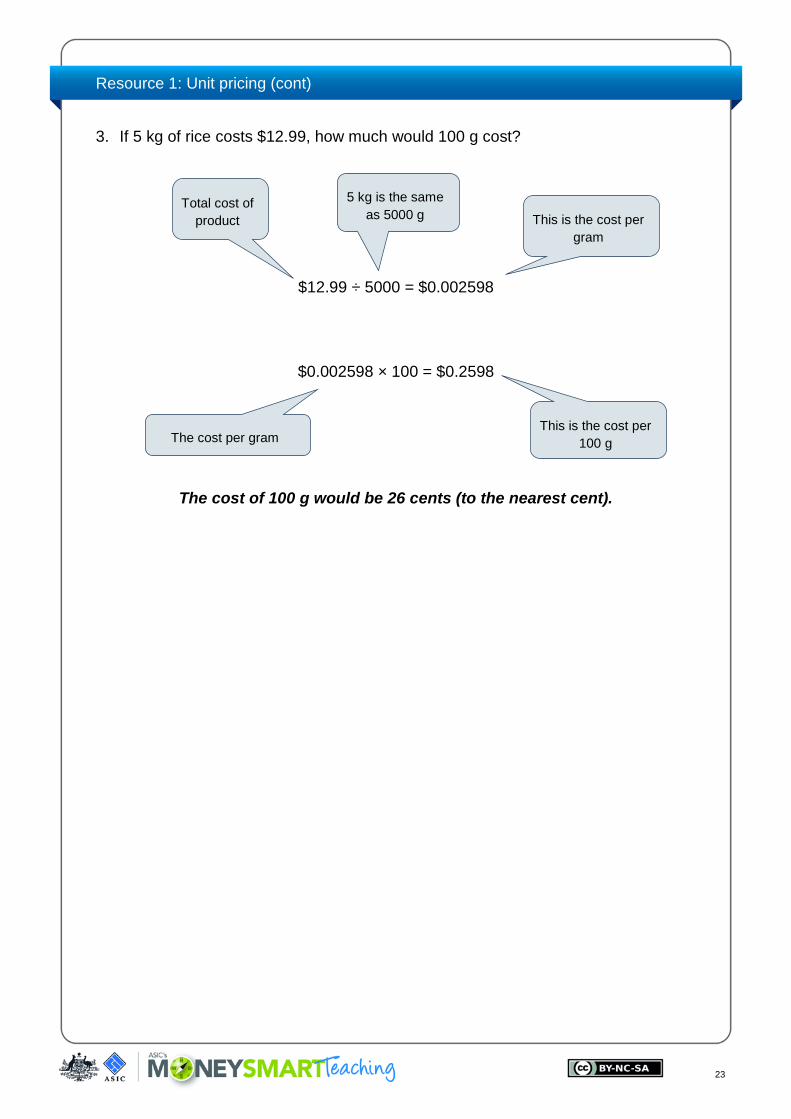
Resource 1: Unit pricing (cont)
3. If 5 kg of rice costs $12.99, how much would 100 g cost?
$12.99 ÷ 5000 = $0.002598
$0.002598 × 100 = $0.2598
The cost of 100 g would be 26 cents (to the nearest cent).
Total cost of product
5 kg is the same as 5000 g This is the cost per
gram
The cost per gram This is the cost per
100 g
24
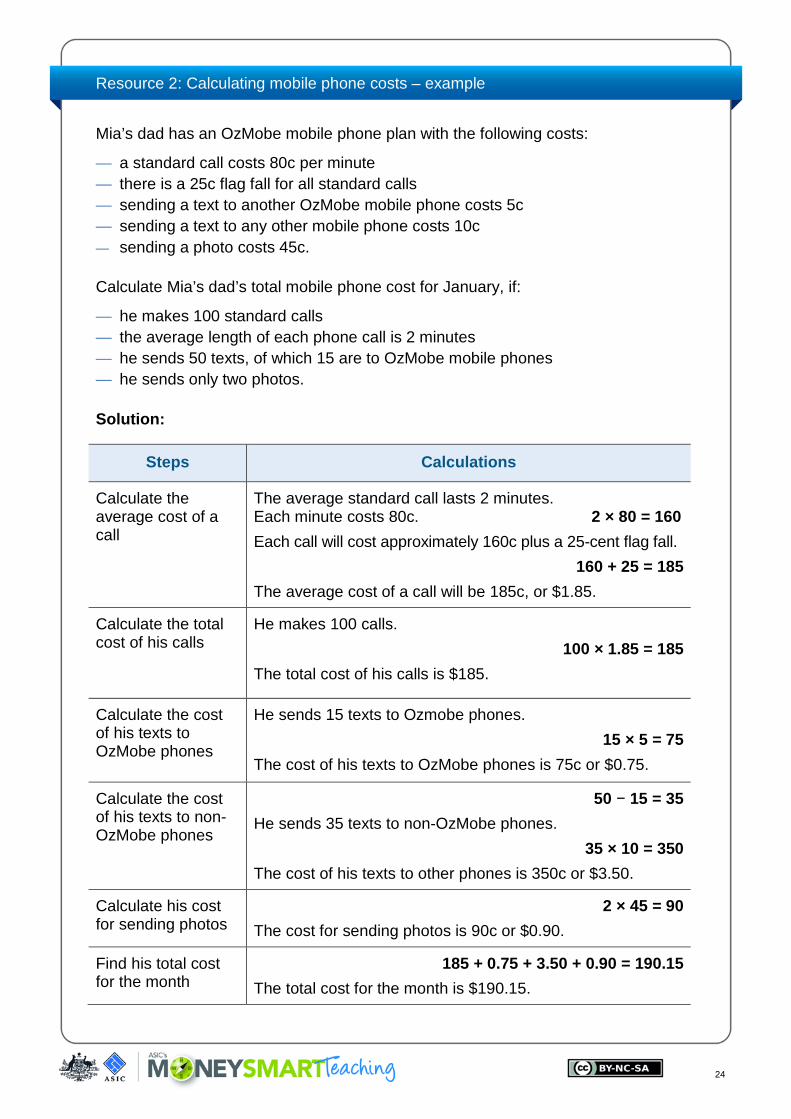
Resource 2: Calculating mobile phone costs – example
Mia’s dad has an OzMobe mobile phone plan with the following costs:
— a standard call costs 80c per minute — there is a 25c flag fall for all standard calls — sending a text to another OzMobe mobile phone costs 5c — sending a text to any other mobile phone costs 10c — sending a photo costs 45c.
Calculate Mia’s dad’s total mobile phone cost for January, if:
— he makes 100 standard calls — the average length of each phone call is 2 minutes — he sends 50 texts, of which 15 are to OzMobe mobile phones — he sends only two photos.
Solution:
Steps Calculations
Calculate the average cost of a call
The average standard call lasts 2 minutes. Each minute costs 80c. 2 × 80 = 160 Each call will cost approximately 160c plus a 25-cent flag fall.
160 + 25 = 185 The average cost of a call will be 185c, or $1.85.
Calculate the total cost of his calls
He makes 100 calls. 100 × 1.85 = 185
The total cost of his calls is $185.
Calculate the cost of his texts to OzMobe phones
He sends 15 texts to Ozmobe phones. 15 × 5 = 75
The cost of his texts to OzMobe phones is 75c or $0.75.
Calculate the cost of his texts to non-OzMobe phones
50 − 15 = 35 He sends 35 texts to non-OzMobe phones.
35 × 10 = 350 The cost of his texts to other phones is 350c or $3.50.
Calculate his cost for sending photos
2 × 45 = 90 The cost for sending photos is 90c or $0.90.
Find his total cost for the month
185 + 0.75 + 3.50 + 0.90 = 190.15 The total cost for the month is $190.15.

Worksheets
26
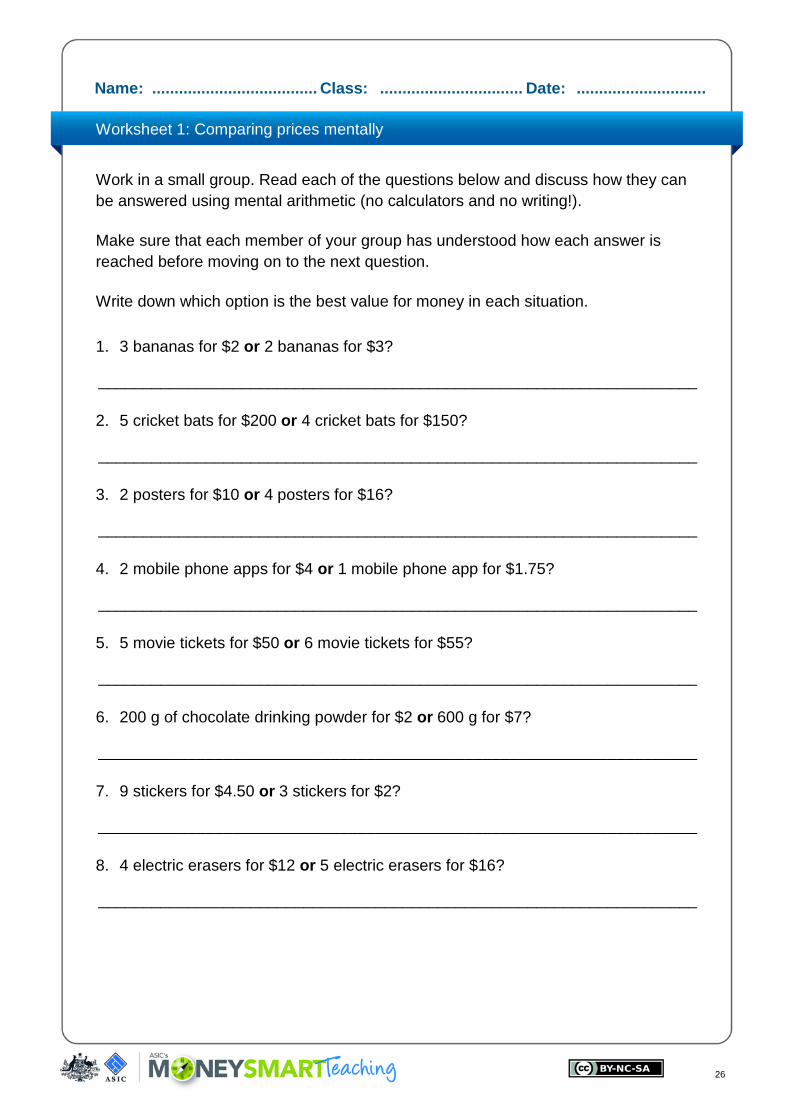
Name: ..................................... Class: ................................ Date: ............................. Worksheet 1: Comparing prices mentally
Work in a small group. Read each of the questions below and discuss how they can be answered using mental arithmetic (no calculators and no writing!).
Make sure that each member of your group has understood how each answer is reached before moving on to the next question.
Write down which option is the best value for money in each situation.
1. 3 bananas for $2 or 2 bananas for $3?
___________________________________________________________________
2. 5 cricket bats for $200 or 4 cricket bats for $150?
___________________________________________________________________
3. 2 posters for $10 or 4 posters for $16?
___________________________________________________________________
4. 2 mobile phone apps for $4 or 1 mobile phone app for $1.75?
___________________________________________________________________
5. 5 movie tickets for $50 or 6 movie tickets for $55?
___________________________________________________________________
6. 200 g of chocolate drinking powder for $2 or 600 g for $7?
___________________________________________________________________
7. 9 stickers for $4.50 or 3 stickers for $2?
___________________________________________________________________
8. 4 electric erasers for $12 or 5 electric erasers for $16?
___________________________________________________________________

27
Name: ..................................... Class: ................................ Date: ............................. Worksheet 2: Comparing prices using written calculations
Work with a partner, but you should each write your own solutions in your mathematics workbook.
1. Alex’s mother can buy 8 ice-cream cones for $4.80 or 16 ice-cream cones for $9.10. Which option is better value for money?
__________________________________________________________________
__________________________________________________________________
__________________________________________________________________
__________________________________________________________________
2. Tim’s dad can buy 2 toothbrushes for $4.30 or 6 toothbrushes for $12.50. Which option is better value for money?
__________________________________________________________________
__________________________________________________________________
__________________________________________________________________
__________________________________________________________________
Example:
Michelle can buy 4 stickers for $3.70 or 8 stickers for $7.50. Which option is better value for money?
Solution:
For the first option, 4 stickers cost $3.70.
8 stickers would cost twice this price – 2 × 3.70 = 7.40
So, 8 stickers would cost $7.40.
This is less than $7.50, so the first option is better value for money.

28
Name: ..................................... Class: ................................ Date: ............................. Worksheet 2: Comparing prices using written calculations (cont)
3. Monica can buy a packet of biscuits for $2.50 or 3 packets for $5. Which option is better value for money?
__________________________________________________________________
__________________________________________________________________
__________________________________________________________________
Example: Bill can buy 4 football collector cards for $4.80 or 5 football collector cards for $5.50. Which option is better value for money?
Solution: Method 1:
For the first option, 4 football collector cards cost $4.80. 4.80 ÷ 4 = 1.20 So, each football collector card costs $1.20. 1.20 × 5 = 6.00 So, 5 football collector cards would cost $6.00.
This is more than $5.50, so the second option is better value for money.
Method 2: For the first option, 4 football collector cards cost $4.80. 4.80 ÷ 4 = 1.20 So, for the first option, the cost per football collector card is $1.20. For the first option, 5 football collector cards cost $5.50. 5.50 ÷ 5 = 1.10 So, for the second option, the cost per football collector card is $1.10.
The second option represents better value for money as the cost per football card is less.
29
Name: ..................................... Class: ................................ Date: ............................. Worksheet 2: Comparing prices using written calculations (cont)
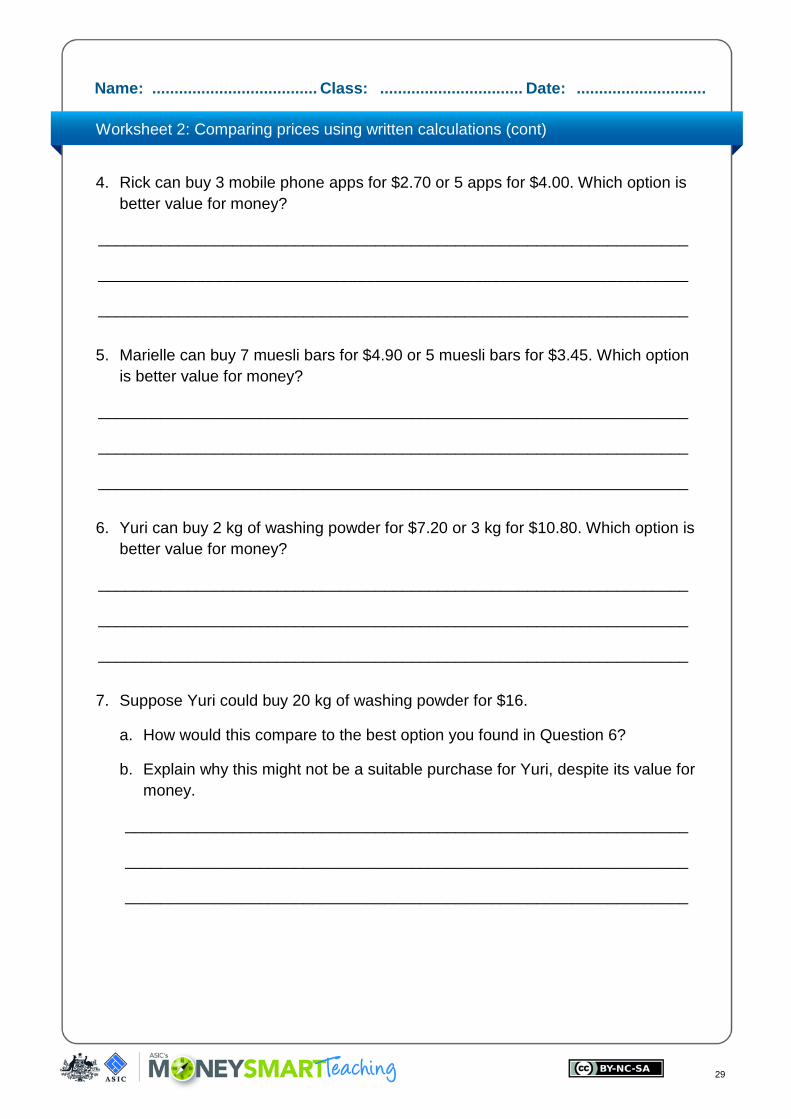
4. Rick can buy 3 mobile phone apps for $2.70 or 5 apps for $4.00. Which option is better value for money?
__________________________________________________________________
__________________________________________________________________
__________________________________________________________________
5. Marielle can buy 7 muesli bars for $4.90 or 5 muesli bars for $3.45. Which option is better value for money?
__________________________________________________________________
__________________________________________________________________
__________________________________________________________________
6. Yuri can buy 2 kg of washing powder for $7.20 or 3 kg for $10.80. Which option is better value for money?
__________________________________________________________________
__________________________________________________________________
__________________________________________________________________
7. Suppose Yuri could buy 20 kg of washing powder for $16.
a. How would this compare to the best option you found in Question 6?
b. Explain why this might not be a suitable purchase for Yuri, despite its value for money.
_______________________________________________________________
_______________________________________________________________
_______________________________________________________________
30
Name: ..................................... Class: ................................ Date: ............................. Worksheet 2: Comparing prices using written calculations (cont)
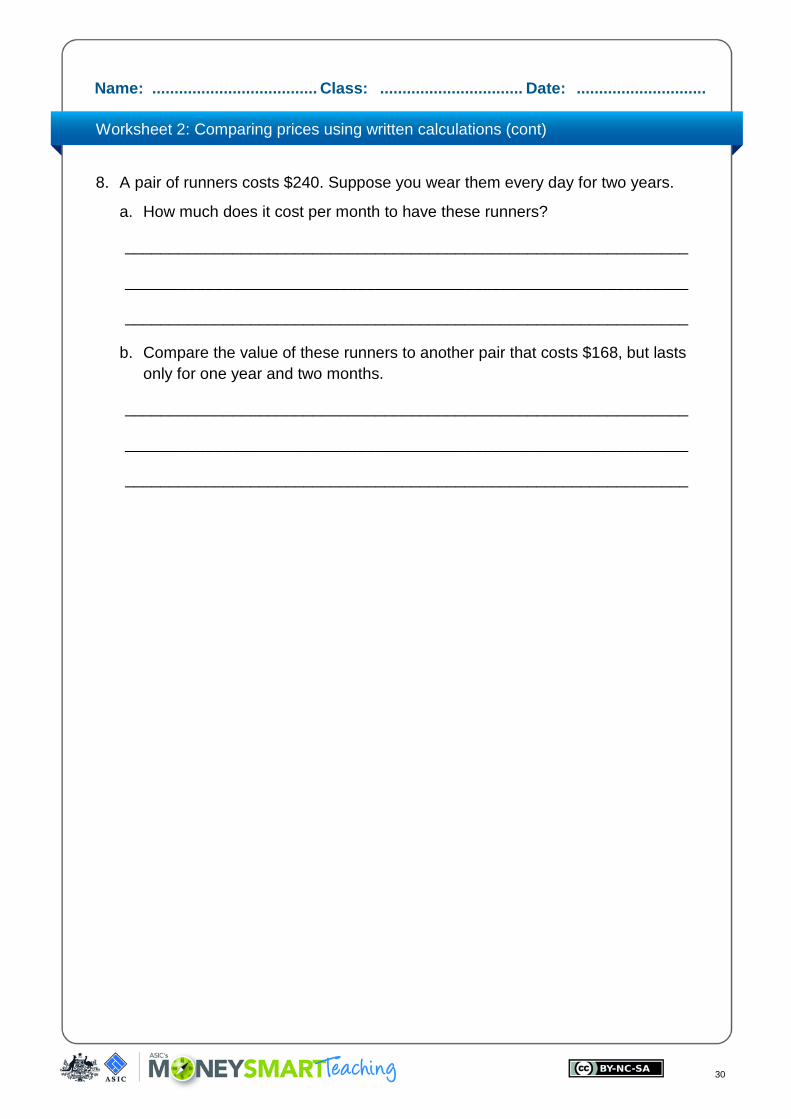
8. A pair of runners costs $240. Suppose you wear them every day for two years.
a. How much does it cost per month to have these runners?
_______________________________________________________________
_______________________________________________________________
_______________________________________________________________
b. Compare the value of these runners to another pair that costs $168, but lasts only for one year and two months.
_______________________________________________________________
_______________________________________________________________
_______________________________________________________________
31
Name: ..................................... Class: ................................ Date: ............................. Worksheet 3: PMI chart
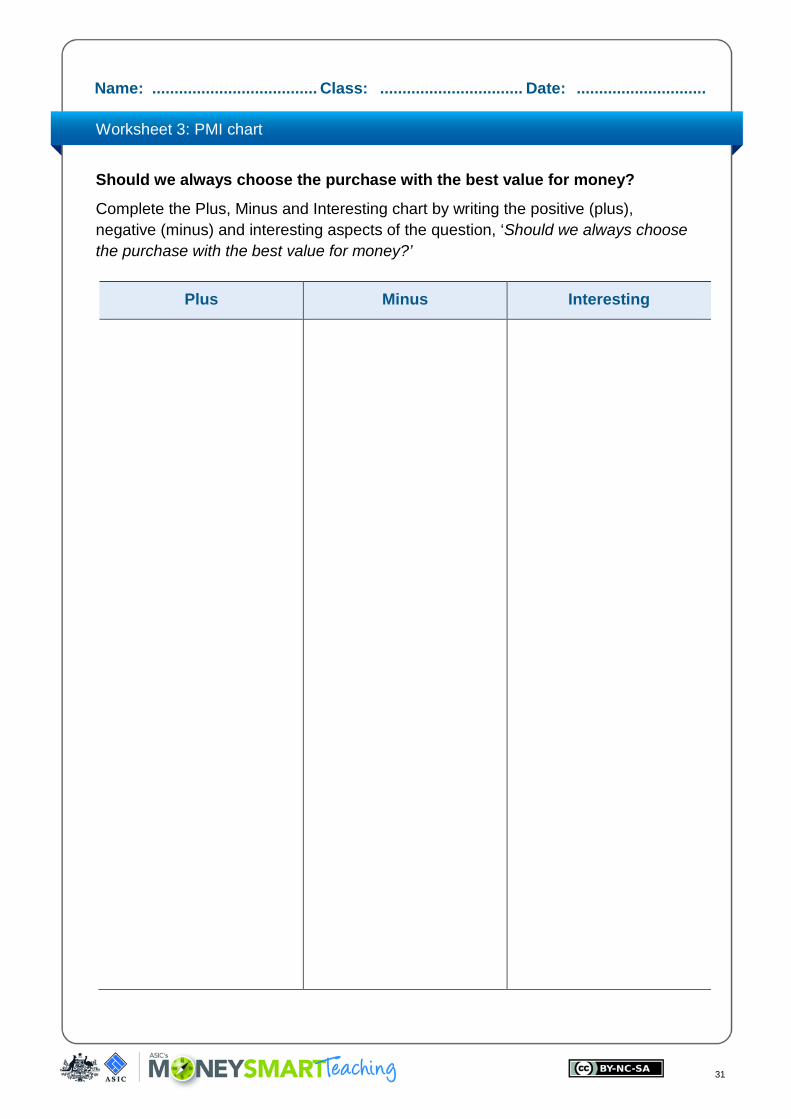
Should we always choose the purchase with the best value for money?
Complete the Plus, Minus and Interesting chart by writing the positive (plus), negative (minus) and interesting aspects of the question, ‘Should we always choose the purchase with the best value for money?’
Plus Minus Interesting
32
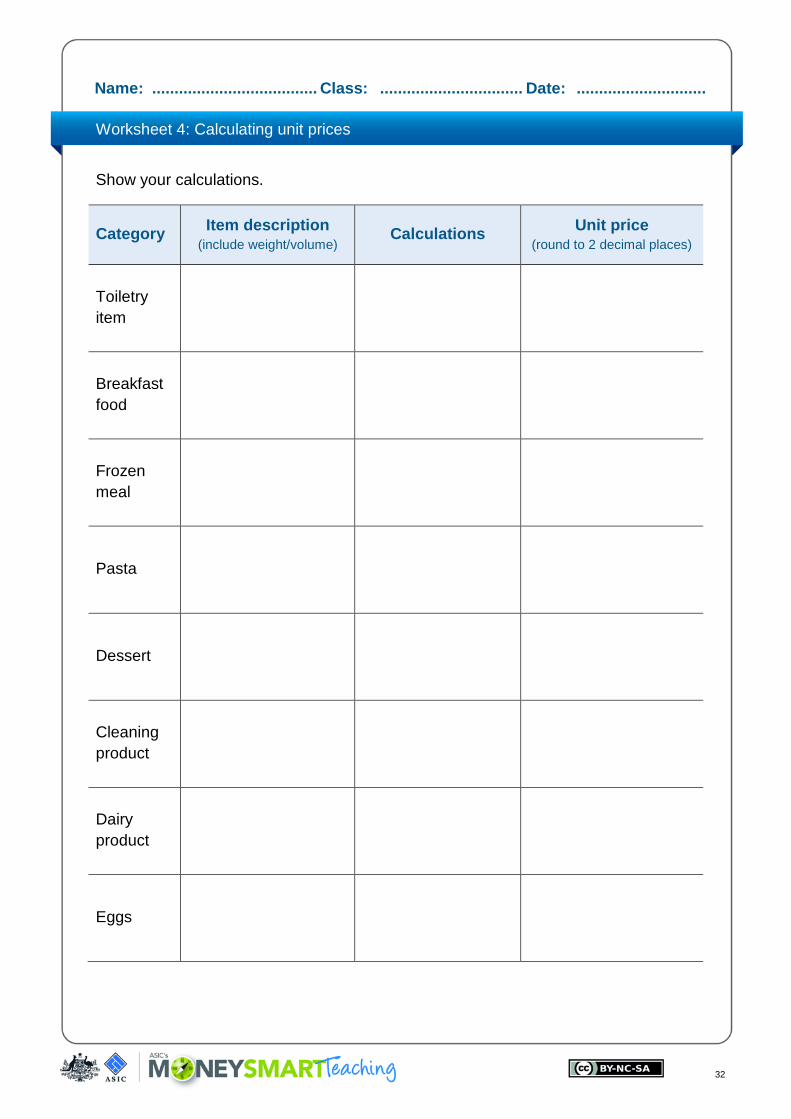
Name: ..................................... Class: ................................ Date: ............................. Worksheet 4: Calculating unit prices
Show your calculations.
Category Item description (include weight/volume) Calculations Unit price
(round to 2 decimal places)
Toiletry item
Breakfast food
Frozen meal
Pasta
Dessert
Cleaning product
Dairy product
Eggs

33
Name: ..................................... Class: ................................ Date: ............................. Worksheet 5: Calculating mobile phone costs
Read Resource 2: Calculating mobile phone costs – example then answer the questions below.
1. Mia’s cousin has a Tube-ular prepaid phone plan with the following costs:
— a standard call costs 35c per 30 seconds — there is a 30c flag fall for all standard calls — sending a text costs 10c — sending a photo to a Tube-ular customer costs 50c — sending a photo to anyone else costs $1.
Using the table below, calculate Mia’s cousin’s total mobile phone cost for January, if:
— she makes 200 standard calls — the average length of her phone calls is 3 minutes — she sends 90 texts — she sends 10 photos to her friends who are all customers of Tube-ular — she sends 10 photos to other family members who are not customers of
Tube-ular.
Steps Calculations
Calculate the average cost of a call
Calculate the total cost of her calls
Calculate the total cost of her texts
Calculate the cost of sending photos to her friends
Calculate the cost of sending photos to her family members
Find her total cost for the month
34
Name: ..................................... Class: ................................ Date: ............................. Worksheet 5: Calculating mobile phone costs (cont)
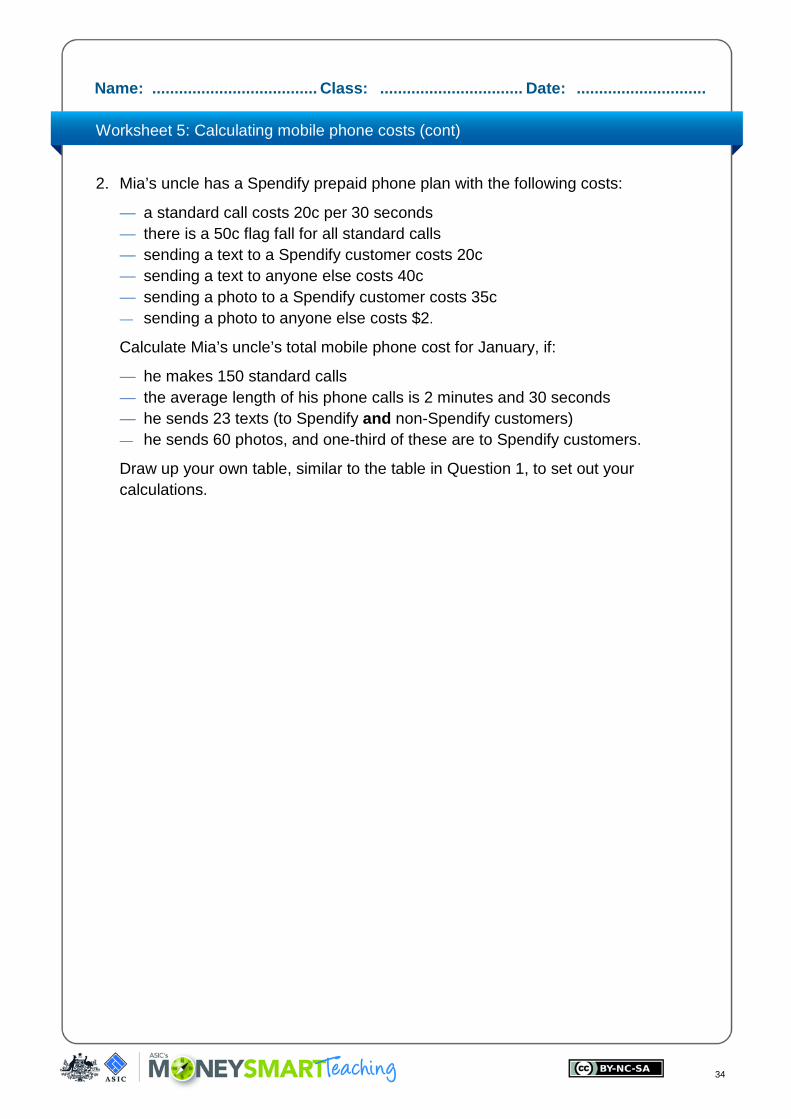
2. Mia’s uncle has a Spendify prepaid phone plan with the following costs:
— a standard call costs 20c per 30 seconds — there is a 50c flag fall for all standard calls — sending a text to a Spendify customer costs 20c — sending a text to anyone else costs 40c — sending a photo to a Spendify customer costs 35c — sending a photo to anyone else costs $2.
Calculate Mia’s uncle’s total mobile phone cost for January, if:
— he makes 150 standard calls — the average length of his phone calls is 2 minutes and 30 seconds — he sends 23 texts (to Spendify and non-Spendify customers) — he sends 60 photos, and one-third of these are to Spendify customers.
Draw up your own table, similar to the table in Question 1, to set out your calculations.
35
Name: ..................................... Class: ................................ Date: ............................. Worksheet 6: Calculating data downloads
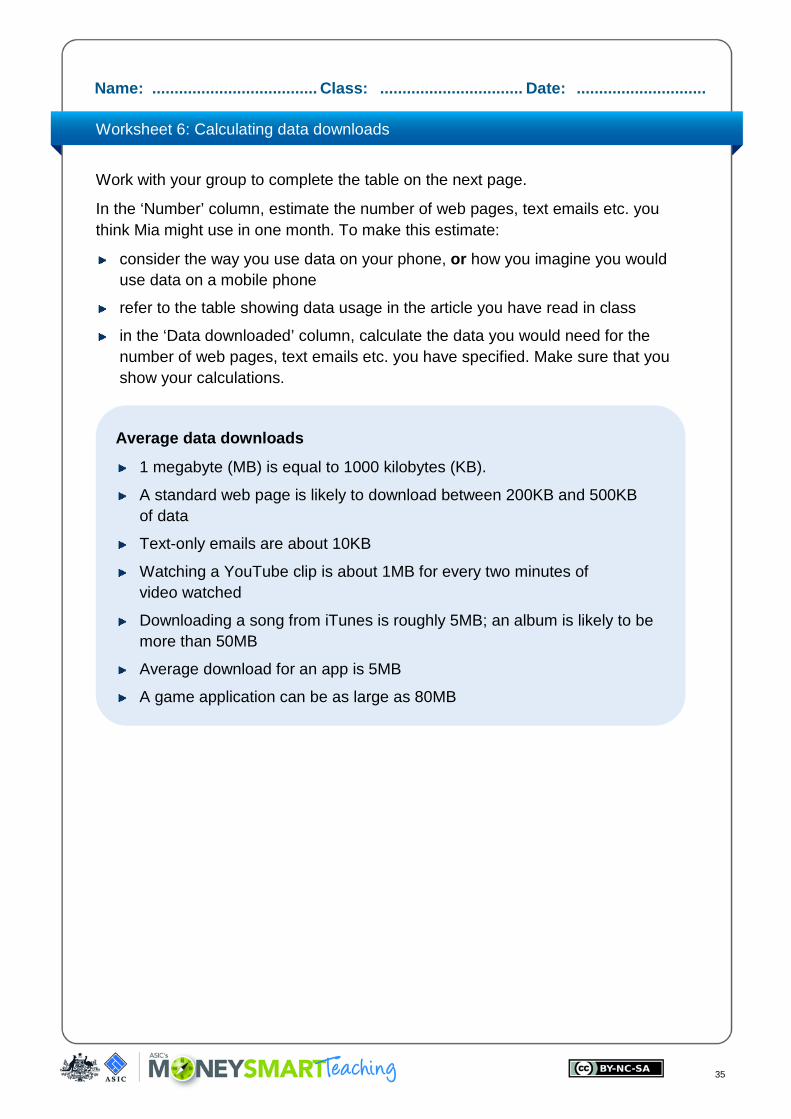
Work with your group to complete the table on the next page.
In the ‘Number’ column, estimate the number of web pages, text emails etc. you think Mia might use in one month. To make this estimate:
consider the way you use data on your phone, or how you imagine you would use data on a mobile phone
refer to the table showing data usage in the article you have read in class
in the ‘Data downloaded’ column, calculate the data you would need for the number of web pages, text emails etc. you have specified. Make sure that you show your calculations.
Average data downloads
1 megabyte (MB) is equal to 1000 kilobytes (KB).
A standard web page is likely to download between 200KB and 500KB of data
Text-only emails are about 10KB
Watching a YouTube clip is about 1MB for every two minutes of video watched
Downloading a song from iTunes is roughly 5MB; an album is likely to be more than 50MB
Average download for an app is 5MB
A game application can be as large as 80MB

36
Name: ..................................... Class: ................................ Date: ............................. Worksheet 6: Calculating data downloads (cont)
KB usage calculator – Mia’s data usage for 1 month
Download Number Data downloaded (in KB)
Web page
Text only email
YouTube clip
iTunes song
Application
Gaming application
Total of data downloads

37
Name: ..................................... Class: ................................ Date: ............................. Worksheet 7: Choosing a prepaid provider
Ozmobe, Tube-ular and Spendify offer prepaid plans.
OzMobe Tube-ular Spendify
Call rate 80c per minute 35c per 30 seconds
20c per 30 seconds
Flag fall 25c 30c 50c
SMS to same provider/MMS 5c 10c 20c
SMS to a different provider 10c 10c 40c
MMS to the same provider 45c 50c 35c
MMS to a different provider 45c $1 $2
Data 1.5GB (1500 MB) 1GB (1000MB) 1.5GB (1500MB)
Which of the phone plans – OzMobe, Tube-ular or Spendify – would you recommend for Mia? You will need to estimate some numbers related to her mobile phone use. Here is some information to help you. You will need to fill in some information based on what you have learned about how people use their mobile phones.
Information you are given Things you need to estimate
Calls are mostly to family members who are with the same provider
The number of calls Mia would make in a month
Calls are usually less than 2 minutes
She makes about one or two longer phone calls each a day
The average length of Mia’s calls
She sends most of her texts to family and friends. Her family members are with the same provider but some of her friends are not
The number of texts Mia sends to family members and the number she sends to friends
She sends very few photos compared to her friends and family
The number of photos Mia might send in a month

38
Name: ..................................... Class: ................................ Date: ............................. Worksheet 7: Choosing a prepaid provider (cont)
Record each of your estimates based on your own estimates and on the data needs you calculated in the previous worksheet. Explain which provider you would recommend for Mia. Justify your answer and explain how this plan can save her money compared to the other two plans.
39
Name: ..................................... Class: ................................ Date: ............................. Worksheet 8: Smarter spending
In Activity 1 you talked to your family and identified five expenses where you felt you might be able to save some money.
Complete the following for each of these expenses.
1. Write a strategy for saving money. For example, will you:
— consume less (i.e. buy less of a product, use less of a service) — switch brands or providers — change the way in which you use this product or service? (e.g. use electricity
at off-peak times)
__________________________________________________________________
__________________________________________________________________
__________________________________________________________________
__________________________________________________________________
__________________________________________________________________
__________________________________________________________________
2. Explain any additional benefits (other than saving money) that could occur as a result of implementing your strategy.
__________________________________________________________________
__________________________________________________________________
__________________________________________________________________
__________________________________________________________________
__________________________________________________________________
__________________________________________________________________
40
Name: ..................................... Class: ................................ Date: ............................. Worksheet 8: Smarter spending (cont)
3. Explain any disadvantages to implementing your strategy.
__________________________________________________________________
__________________________________________________________________
__________________________________________________________________
__________________________________________________________________
__________________________________________________________________
__________________________________________________________________
4. Calculate the amount of money you can save over the next six months by implementing your strategy. Make sure that you explain your calculations. Include unit prices where relevant and show how these unit prices were calculated.
__________________________________________________________________
__________________________________________________________________
__________________________________________________________________
__________________________________________________________________
__________________________________________________________________
__________________________________________________________________
5. Create a poster for your family with your five recommendations for saving money.
__________________________________________________________________
__________________________________________________________________
__________________________________________________________________
__________________________________________________________________
__________________________________________________________________
__________________________________________________________________
41
Name: ..................................... Class: ................................ Date: ............................. Worksheet 8: Smarter spending (cont)
Criteria for assessment:
Practical strategies for saving money are clearly explained.
The pros and cons of each strategy are clearly explained.
Cost differences have been researched.
The savings over a six-month period are correctly calculated.
The calculations are clearly explained.
Unit price calculations are included where they are relevant.
You might like to take your poster home to show your family how they could save money over the next six months.
Discuss with them what the family could do if they had this extra money.
.

Solutions

Year 7 Mathematics Solutions
43
Worksheet 1
(Students use mental strategies to compare prices)
1. 3 bananas for $2 – more bananas for less money
2. 4 cricket bats for $150 – cost per bat is $37.50 instead of $40
3. 4 posters for $16 – compare by doubling or halving prices
4. 1 mobile phone app for $1.75 – halve the price to compare
5. 6 movie tickets for $55 – cost per ticket is approximately $9 instead of $10
6. 200 g of chocolate drinking powder for $2 – triple the cost and compare to the 600 g price
7. 9 stickers for $4.50 – triple or take one-third to compare prices
8. 4 electric erasers for $12 – cost per eraser is $3 instead of $3.20
Worksheet 2
1. 8 for $4.80, so 16 for $9.60; therefore 16 for $9.10 is better value
2. 2 for $4.30, so 6 for $12.90; therefore 6 for $12.50 is better value
3. 1 for $2.50, so 3 for $7.50; therefore 3 for $5 is better value
4. 3 for $2.70, so $0.90 per app or 5 for $4.00, so $0.80 per app; therefore 5 for $4.00 is better value
5. 7 for $4.90, so $0.70 per muesli bar or 5 for $3.45, so $0.69 per muesli bar;therefore 5 for $3.45 is slightly better value
6. 2 kg for $7.20, so $3.60 per kg or 3 kg for $10.80, so $3.60 per kg; therefore they each represent the same value for money
7. a. 20 kg for $16, so $0.80 per kg which is $2.80 per kg cheaper than the options in Question 6
b. The quantity may be too large for Yuri’s needs/use and therefore may deteriorate over time and have to be thrown out, thus wasting money. It may also be too bulky to store and handle in such a large quantity. Being so cheap, it may not be a good quality washing powder, thus requiring more powder per use than the other brands and needing to be replaced sooner than expected.
8. a. Cost per month = 240 ÷ 24 = $10
b. Cost per month = $168 ÷ 14 = $12
Therefore the $240 runners are better value.
Year 7 Mathematics Solutions
44
Worksheet 3
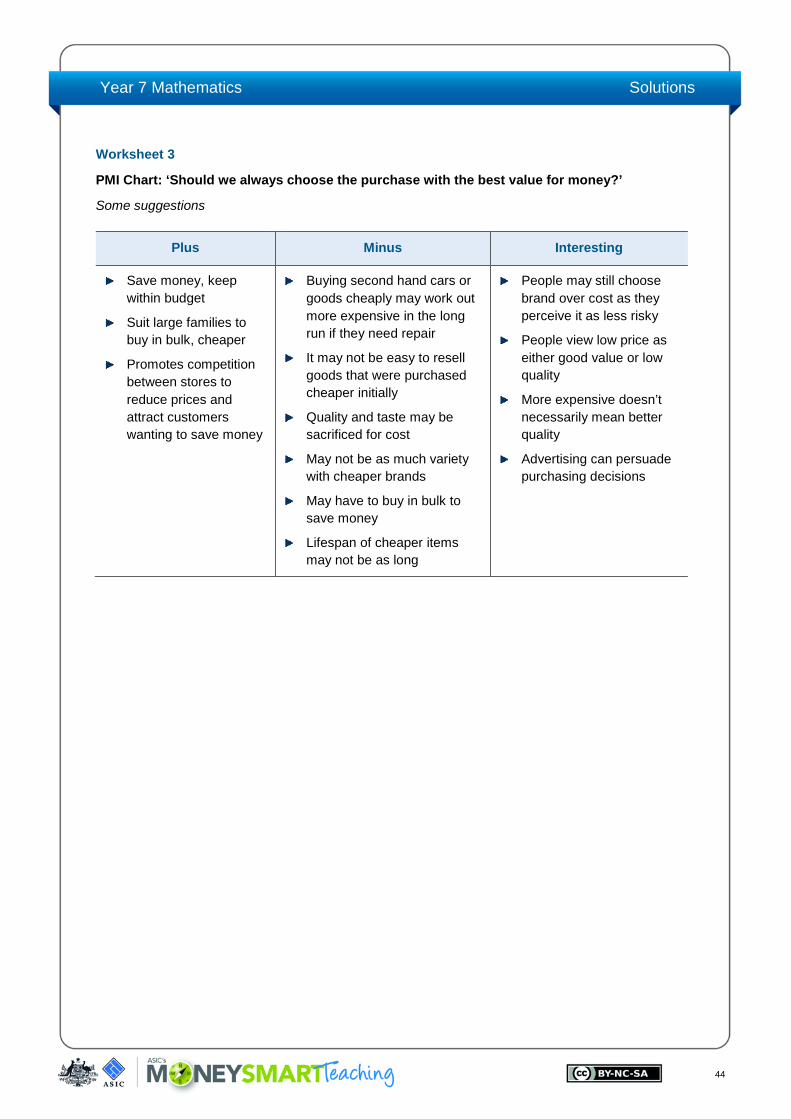
PMI Chart: ‘Should we always choose the purchase with the best value for money?’
Some suggestions
Plus Minus Interesting
Save money, keep within budget
Suit large families to buy in bulk, cheaper
Promotes competition between stores to reduce prices and attract customers wanting to save money
Buying second hand cars or goods cheaply may work out more expensive in the long run if they need repair
It may not be easy to resell goods that were purchased cheaper initially
Quality and taste may be sacrificed for cost
May not be as much variety with cheaper brands
May have to buy in bulk to save money
Lifespan of cheaper items may not be as long
People may still choose brand over cost as they perceive it as less risky
People view low price as either good value or low quality
More expensive doesn’t necessarily mean better quality
Advertising can persuade purchasing decisions

Year 7 Mathematics Solutions
45
Worksheet 4
(Example only – students research their own products and prices)
Category Item description (include weight/volume)
Calculations Unit price (round to 2
decimal places)
Toiletry item Fresha Roll-on Deodorant 40 mL $2.99
$2.99 ÷ 40 × 100 = $7.475
$7.48/100 mL
Breakfast food Earth’s Goodness Bran 525 g $2.99
$2.99 ÷ 525 × 100 = $0.5695
$0.57/100 g or 57c/100 g
Frozen meal Frozo Foods’ Beef Stroganoff 350 g $3.59
$3.59 ÷ 350 × 100 = $1.0257
$1.03/100 g
Pasta Mia Casa Spaghetti 500 g 89¢
$0.89 ÷ 500 × 100 = $0.178
$0.18/100 g or 18c/100 g
Dessert Dessert Delights Vanilla Ice-cream 2 L $2.19
$2.19 ÷ 2000 × 100 = $0.1095
$0.11/100 mL or 11c/100 mL
Cleaning product Express Dishwashing Liquid 600 mL $2.49
$2.49 ÷ 600 × 100 = $0.415
$0.42/100 mL or 42c/100 mL
Dairy product Happy Valley Tasty cheese 250 g $4.75
$4.75 ÷ 250 × 100 = $1.9
$1.90/100 g
Eggs Gordon’s Farm 1 doz. large eggs 700 g $4.29
$4.29 ÷ 700 × 100 = $0.6129
$0.61/100 g or 61c/100 g

Year 7 Mathematics Solutions
46
Worksheet 5
1.
Steps Calculations
Calculate the average cost of a call $0.35 × 2 × 3 + $0.3 = $2.40
Calculate the total cost of her calls 200 × $2.40 = $480
Calculate the total cost of her texts 90 × $0.1 = $9
Calculate the cost of sending photos to her friends 10 × $0.5 = $5
Calculate the cost of sending photos to her family members 10 × $1 = $10
Find her total cost for the month $480 + $9 + $5 + $10 = $504
2.
Steps Calculations
Calculate the average cost of a call $0.2 × 2 × 2.5 + $0.5 = $1.50
Calculate the total cost of his calls 150 × $1.5 = $225
Calculate the total cost of his texts (for example: 8 to Spendify customers and 15 to others)
8 × $0.2 + 15 × $0.4 = $7.60
Calculate the cost of sending photos 20 × $0.35 + 40 × $2 = $87
Find his total cost for the month $1.5 + $225 + $7.6 + $87 = $321.10
Year 7 Mathematics Solutions
47
Worksheet 6
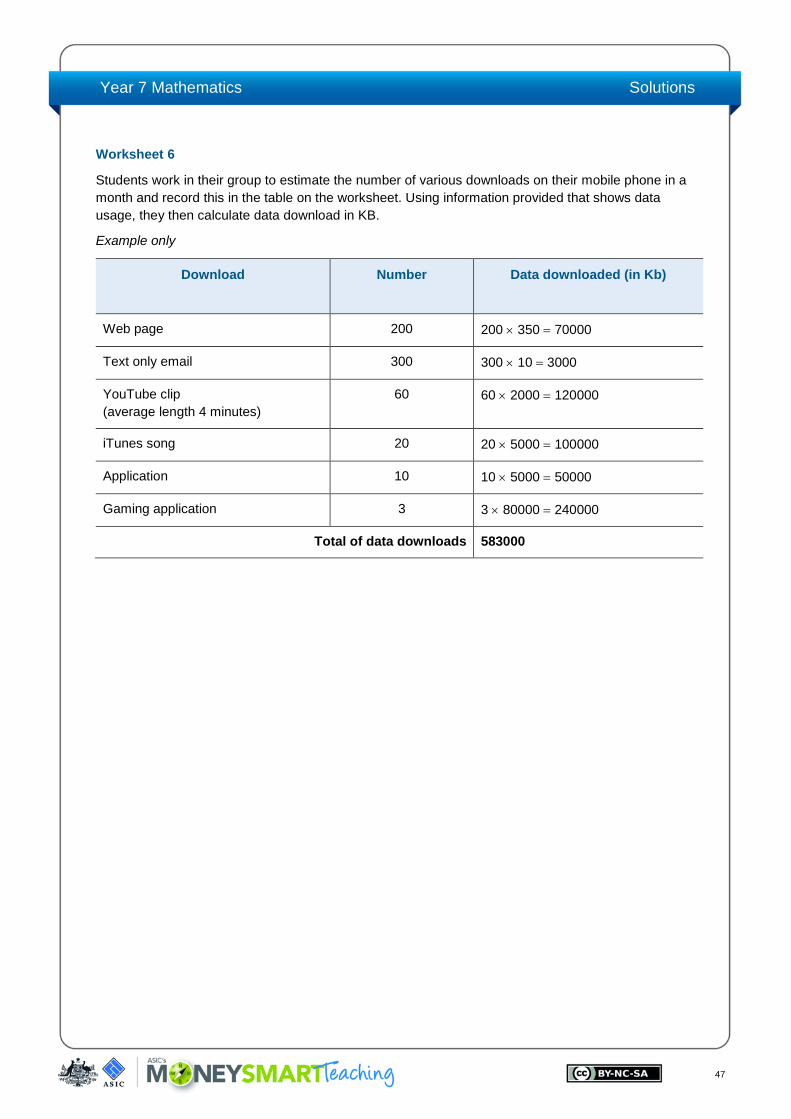
Students work in their group to estimate the number of various downloads on their mobile phone in a month and record this in the table on the worksheet. Using information provided that shows data usage, they then calculate data download in KB.
Example only
Download
Number Data downloaded (in Kb)
Web page 200 200 × 350 = 70000
Text only email 300 300 × 10 = 3000
YouTube clip (average length 4 minutes)
60 60 × 2000 = 120000
iTunes song 20 20 × 5000 = 100000
Application 10 10 × 5000 = 50000
Gaming application 3 3 × 80000 = 240000
Total of data downloads 583000

Year 7 Mathematics Solutions
48
Worksheet 7
Students use information provided on the worksheet and record their own estimates of the number and type of phone usage for this worksheet. Students’ solutions and justification will depend on their individual estimates and calculations.
Example only
Mia’s estimated monthly phone use and cost
Phone usage Estimates Ozmobe Tube-ular Spendify
Calls to family
– Short (use 2 mins)
– Long (average 5 mins)
60
30
Cost/min = $0.8
Cost of calls + Flag fall
$0.8×2×60+$0.25×60 = $111
$0.8×5×30+$0.25×30 = $127.50
Cost/min = $0.7
Cost of calls + Flag fall
$0.7×2×60+$0.3×60 = $102
$0.7×5×30+$0.3×30 = $114
Cost/min = $0.4
Cost of calls + Flag fall
$0.4×2×60+$0.5×60 = $78
$0.4×5×30+$0.5×30 = $75
Calls to friends
– Short (use 2 mins)
– Long (average 5 mins)
20
6
Cost/min = $0.8
$0.8×2x20+$0.25×20 = $37
$0.8×5×6+$0.25×6 = $25.50
Cost/min = $0.7
$0.7×2×20+$0.3×20 = $34
$0.7×5×6+$0.3×6 = $22.80
Cost/min = $0.4
$0.4×2×20 +$0.5×20 = $26
$0.4×5×6+$0.5×6 = $15
Texts to family 30 $0.05×30 = $1.50 $0.1×30 = $3 $0.2×30 = $6
Texts to friends 60 $0.05×40+$0.1×20 = $4
$0.1×60 = $6 $0.2×40+$0.4×20 = $16
Photos 10 $0.45×10 = $4.50 $0.5×4+$1×6 = $8 $0.35×4+$2×6 = $13.40
Downloads (Worksheet 6)
0.583GB 1.5GB included 1GB included 1.5GB included
TOTAL COST $311 $289.80 $229.40
Note: For this example, 2 minutes was used for a short call and long calls were averaged at 5 minutes. The cost of texts to friends have been calculated using a mix of both the same provider and different provider rates. The estimates used in this example may vary considerably from those used by students.
Recommendation based on the example
Mia would be better with Spendify as her provider because it is her cheapest option based on the estimates used in this example. Including the cost of flag fall, a 2 minute call is only $1.30 compared to $1.85 and $1.70 with the other two providers; Mia can continue talking for only 40 cents/minute compared to 80 cents and 70 cents with the others. Spendify offers a data allowance that more than satisfies Mia’s estimated requirement. The higher cost of sending a photo with Spendify does not impact greatly as Mia sends very few photos. The cost of texting is higher with Spendify, but Mia saves on the cost of phone calls and she could monitor her use of texts.

Year 7 Mathematics Solutions
49
Worksheet 8
Students complete and submit the assessment task outlined on this Worksheet. Each student describes the savings measures they have identified in Activity 1, so answers will vary accordingly. Marking criteria for this assessment are given on the Worksheet and in the Assessment rubric.