how do we improve our data delivery systems? do we improve our data delivery systems? ... oakland...
TRANSCRIPT
How Do We Improve Our Data Delivery Systems?
CAFAS Elephants All the Way Down
Welcome & Introductions • CAFAS Super User Group – self proclaimed
title • “We’re not experts, we’re explorers” • Sharing strategies for the exploration of CAFAS
data and use of such data for clinical purposes
Intro & Disclaimer Introductions
Saginaw CMH Heidi Wale Oakland CMH Nicole Lawson & Jennifer Muller Kalamazoo CMH Becca Sanders & Rebecca Clore Detroit-Wayne Crystal Palmer & Bayley Thompson Ottawa CMH Dr. Darren Lubbers & Ann Heerde
We are not MDCH sponsored
– Nor are we replacing the LOF Project
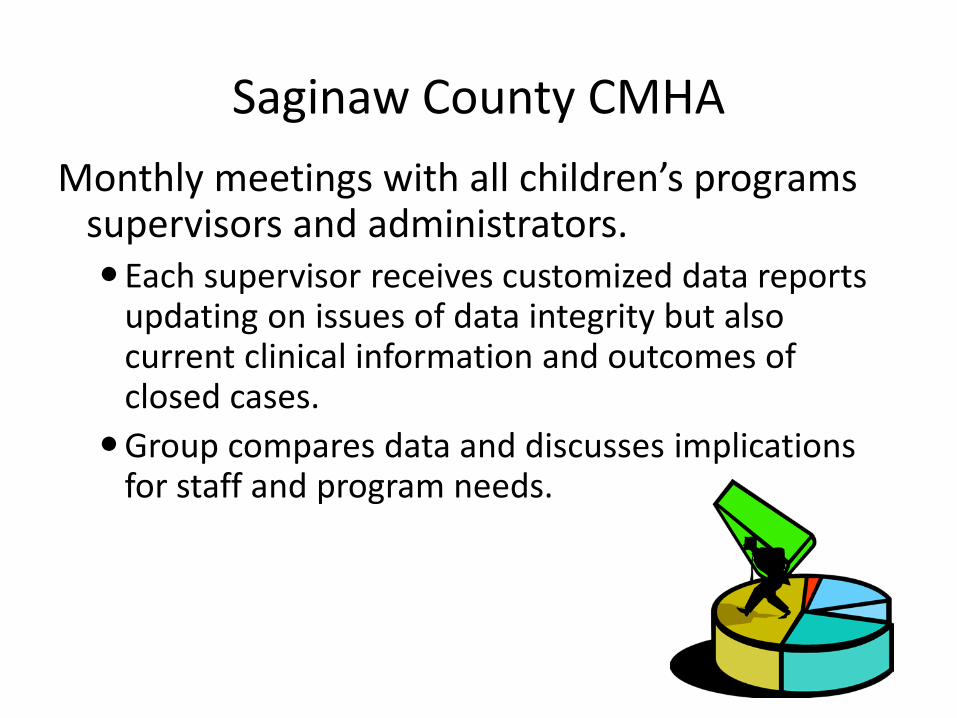
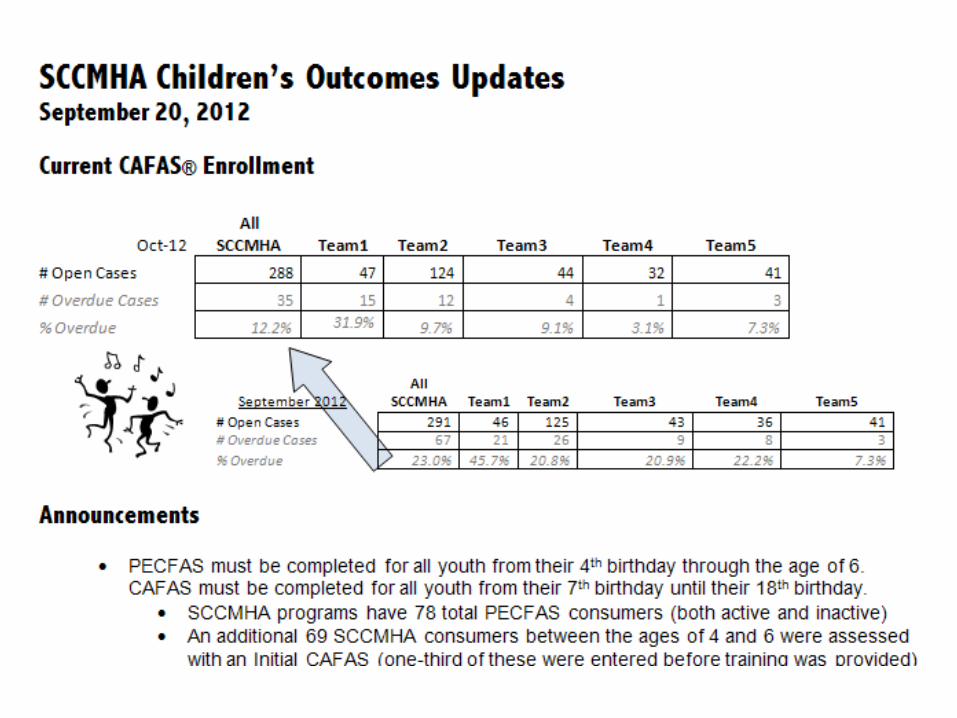
Saginaw County CMHA Monthly meetings with all children’s programs
supervisors and administrators. Each supervisor receives customized data reports
updating on issues of data integrity but also current clinical information and outcomes of closed cases.
Group compares data and discusses implications for staff and program needs.
0
20
40
60
80
100
120
Mean
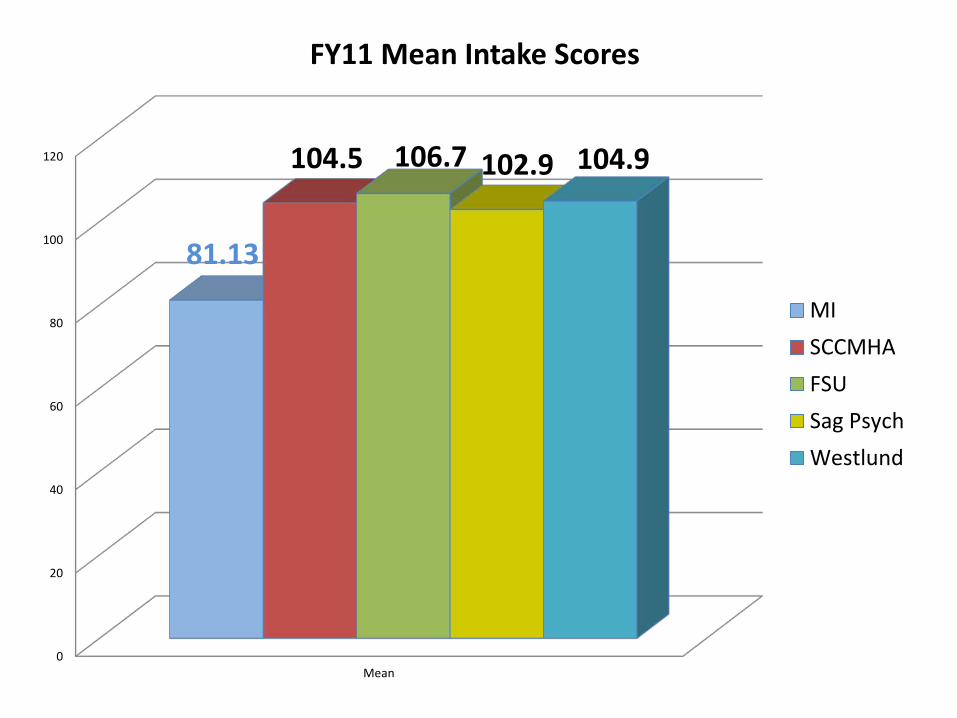
81.13
104.5 106.7 102.9 104.9
FY11 Mean Intake Scores
MISCCMHAFSUSag PsychWestlund
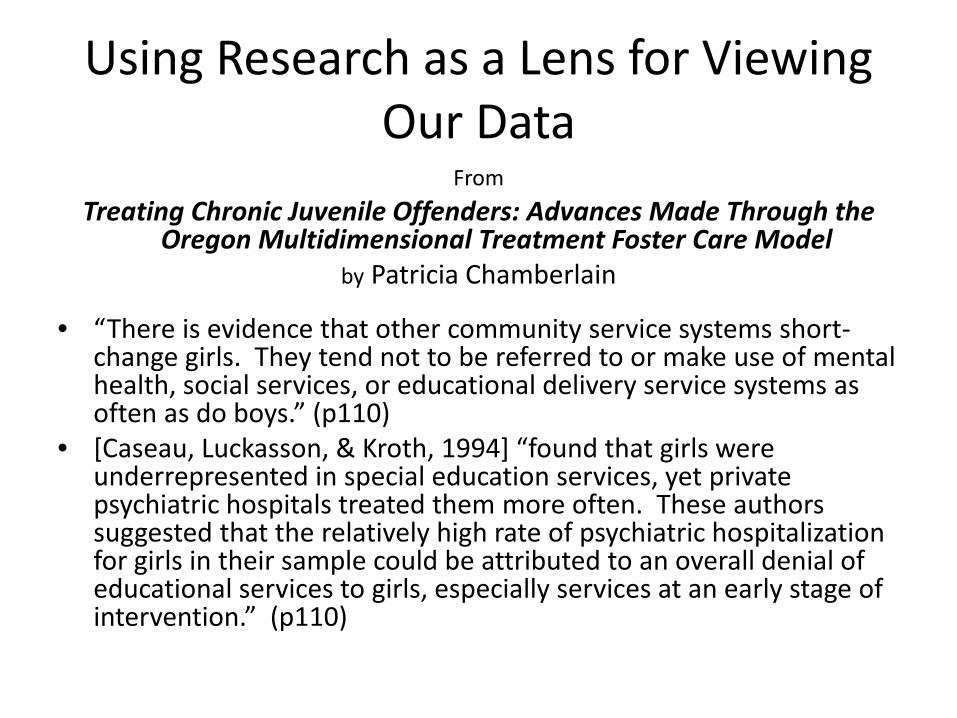
Using Research as a Lens for Viewing Our Data
From Treating Chronic Juvenile Offenders: Advances Made Through the
Oregon Multidimensional Treatment Foster Care Model by Patricia Chamberlain
• “There is evidence that other community service systems short-change girls. They tend not to be referred to or make use of mental health, social services, or educational delivery service systems as often as do boys.” (p110)
• [Caseau, Luckasson, & Kroth, 1994] “found that girls were underrepresented in special education services, yet private psychiatric hospitals treated them more often. These authors suggested that the relatively high rate of psychiatric hospitalization for girls in their sample could be attributed to an overall denial of educational services to girls, especially services at an early stage of intervention.” (p110)
0.0%
10.0%
20.0%
30.0%
40.0%
50.0%
60.0%
70.0%
80.0%
6 7 8 9 10 11 12 13 14 15 16 17
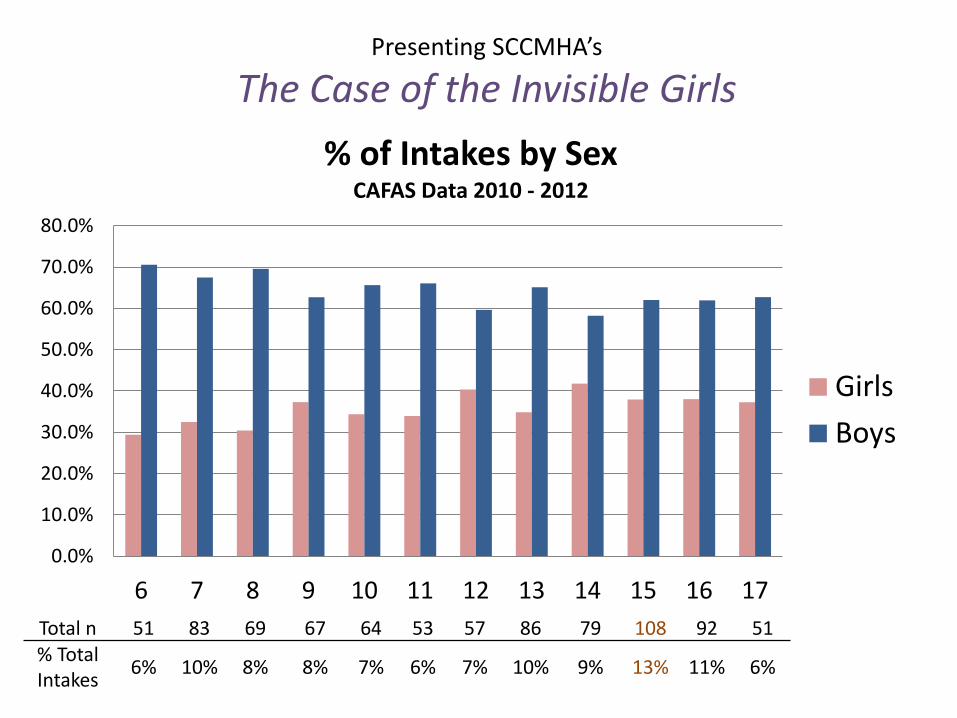
% of Intakes by Sex CAFAS Data 2010 - 2012
GirlsBoys
Total n 51 83 69 67 64 53 57 86 79 108 92 51 % Total Intakes 6% 10% 8% 8% 7% 6% 7% 10% 9% 13% 11% 6%
Presenting SCCMHA’s
The Case of the Invisible Girls
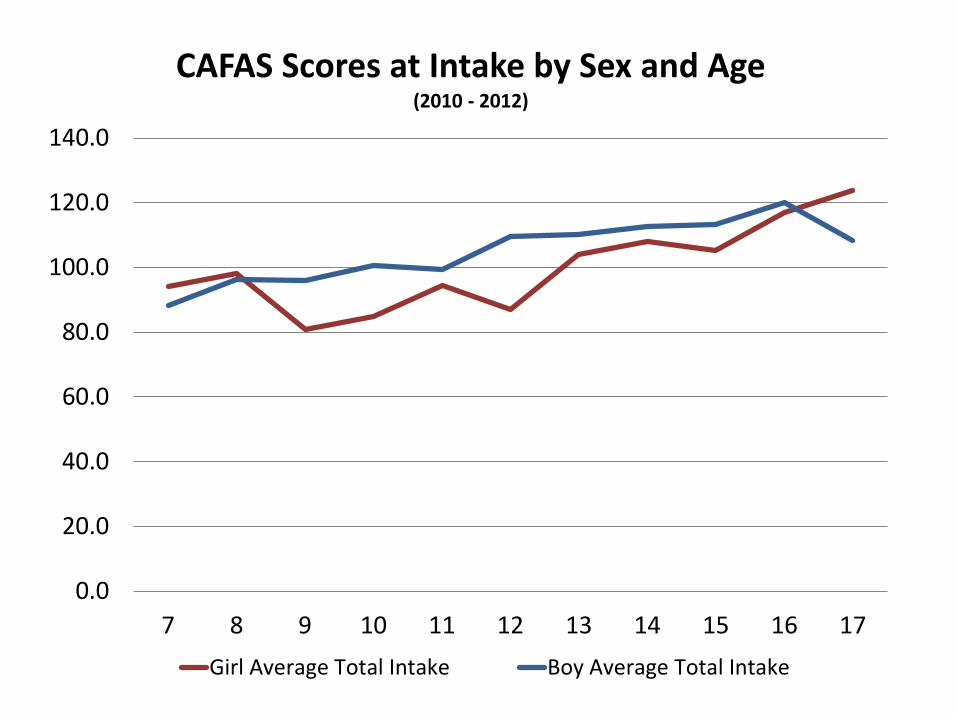
0.0
20.0
40.0
60.0
80.0
100.0
120.0
140.0
7 8 9 10 11 12 13 14 15 16 17
CAFAS Scores at Intake by Sex and Age (2010 - 2012)
Girl Average Total Intake Boy Average Total Intake
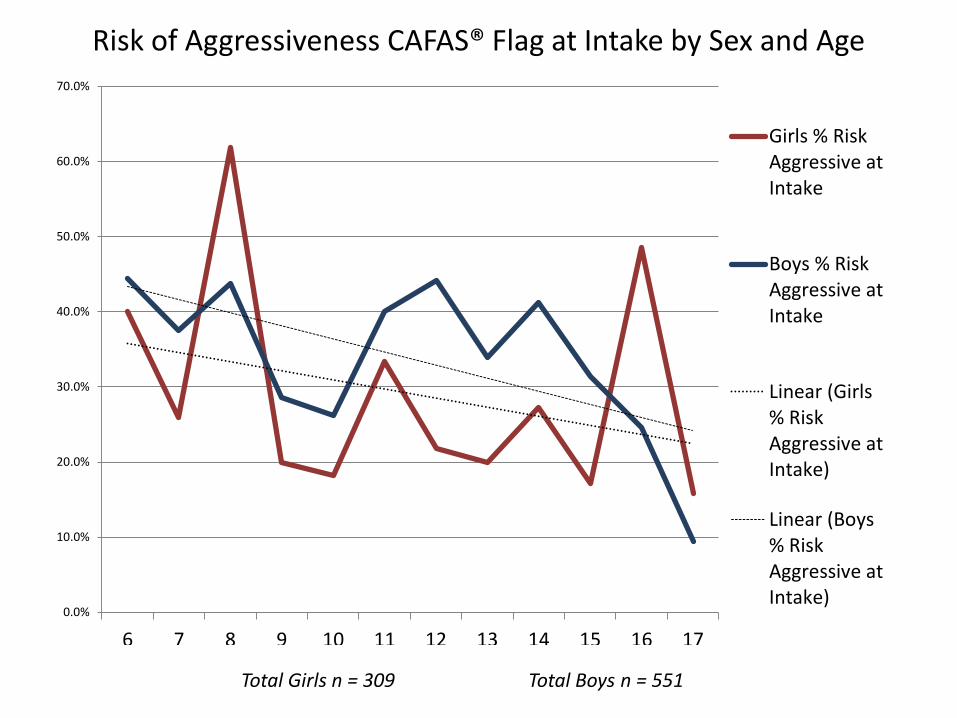
Total Girls n = 309 Total Boys n = 551
Risk of Aggressiveness CAFAS® Flag at Intake by Sex and Age
0.0%
10.0%
20.0%
30.0%
40.0%
50.0%
60.0%
70.0%
6 7 8 9 10 11 12 13 14 15 16 17
Girls % RiskAggressive atIntake
Boys % RiskAggressive atIntake
Linear (Girls% RiskAggressive atIntake)
Linear (Boys% RiskAggressive atIntake)
0.0%
10.0%
20.0%
30.0%
40.0%
50.0%
60.0%
70.0%
80.0%
90.0%
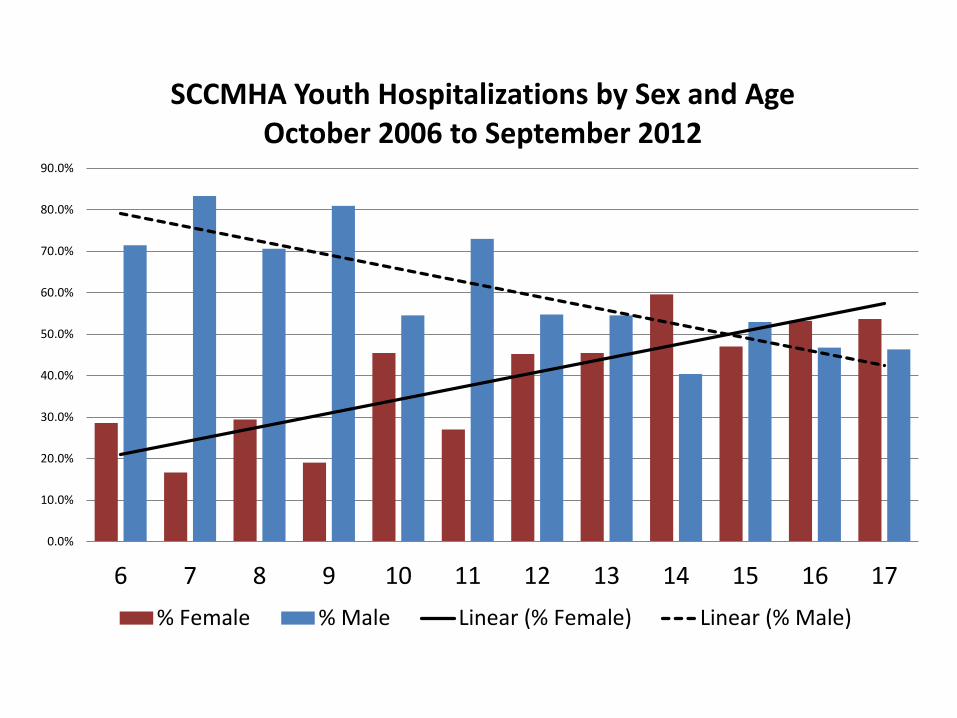
6 7 8 9 10 11 12 13 14 15 16 17
SCCMHA Youth Hospitalizations by Sex and Age October 2006 to September 2012
% Female % Male Linear (% Female) Linear (% Male)
Combining CAFAS data with other system data for provider network management
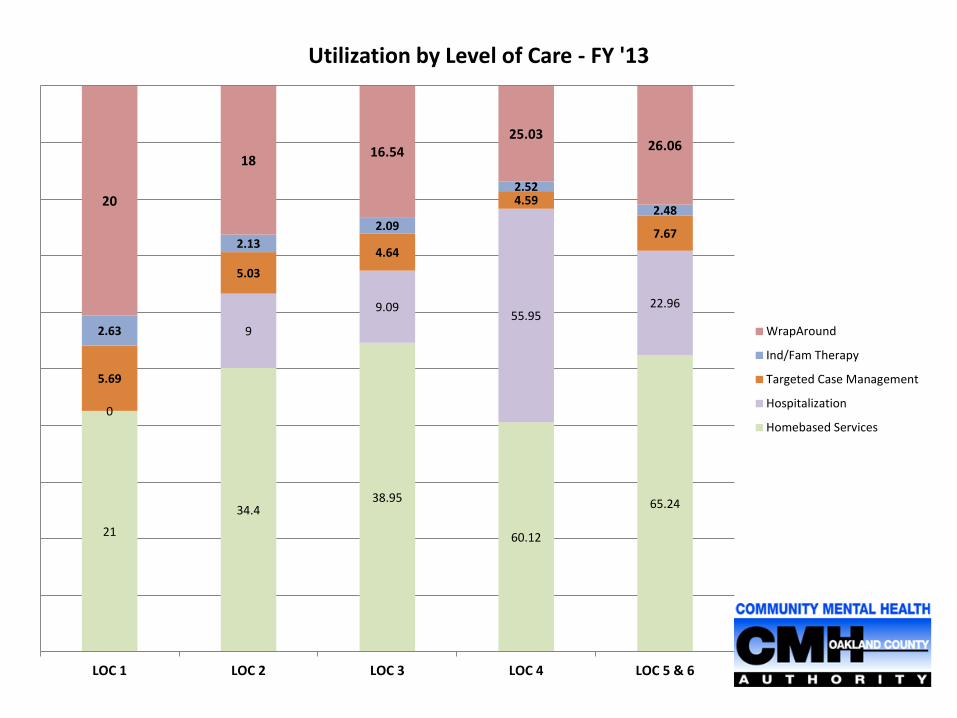
21
34.4 38.95
60.12
65.24
0
9
9.09 55.95
22.96
5.69
5.03 4.64
4.59
7.67
2.63
2.13 2.09
2.52
2.48 20
18 16.54 25.03
26.06
LOC 1 LOC 2 LOC 3 LOC 4 LOC 5 & 6
Utilization by Level of Care - FY '13
WrapAround
Ind/Fam Therapy
Targeted Case Management
Hospitalization
Homebased Services
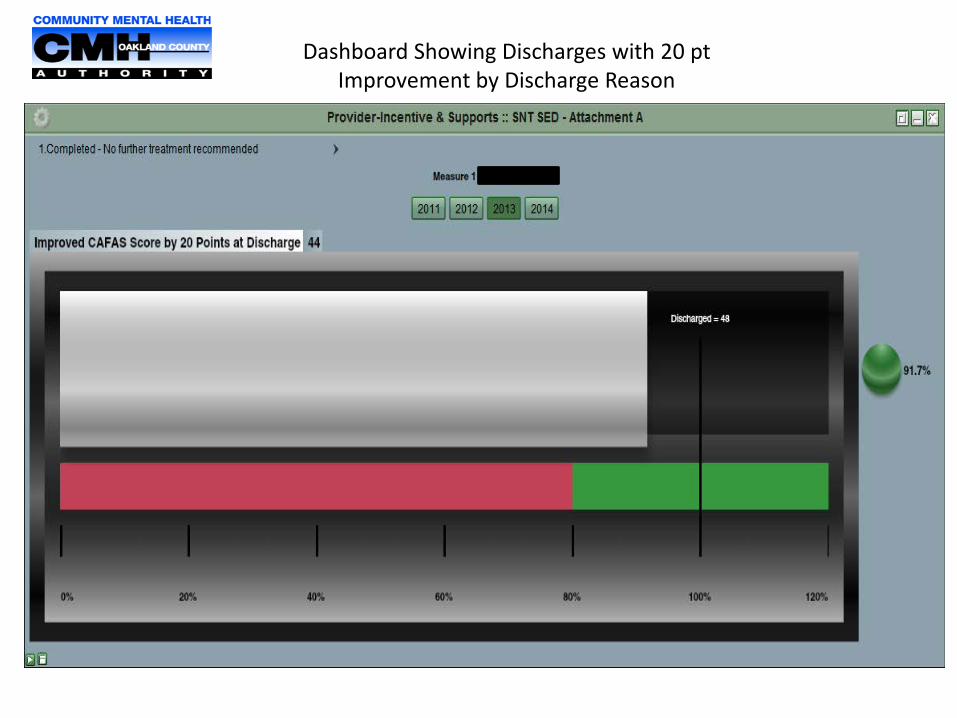
Dashboard Showing Discharges with 20 pt Improvement by Discharge Reason
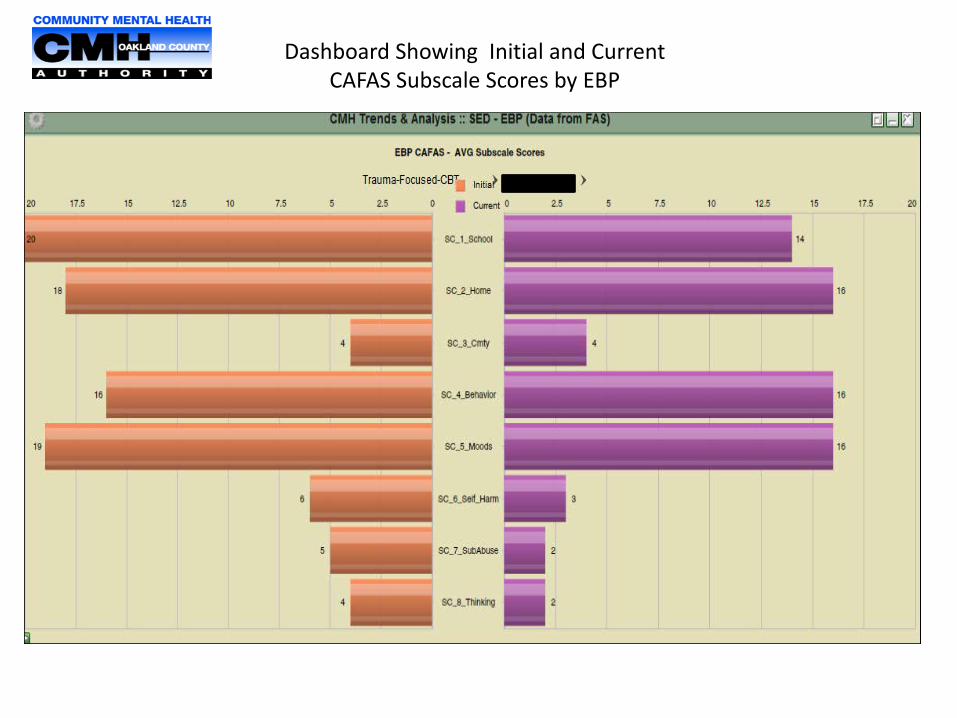
Dashboard Showing Initial and Current CAFAS Subscale Scores by EBP
Becca Sanders Evaluator [email protected] Rebecca Clore Community EBP Trainer [email protected]
September 2014
The Data Guided Culture Club: Using Data to Avoid CAFAStrophies

Goal for Today… Provide you with a DGC2 Turbo Tour DGC2= Data Guided Culture Club
DGC2 Mission… Further the growth of a data guided culture across the children’s mental health provider network. DGC2: just one input towards achievement of... A culture across children’s mental health wherein (CAFAS) data plays a key role in decision making at all levels.
DGC2: Why on Earth…
DGC2: What We Do, Nuts and Bolts Pore over aggregate… Look for red flags... Repore, interpret, and brainstorm reform options... Pilot reforms that make sense… Revisit data…
• Taskmasters • Meetings (2X per year) • DGC2 Members…
• Supervisors • Managers • Data TA Staff
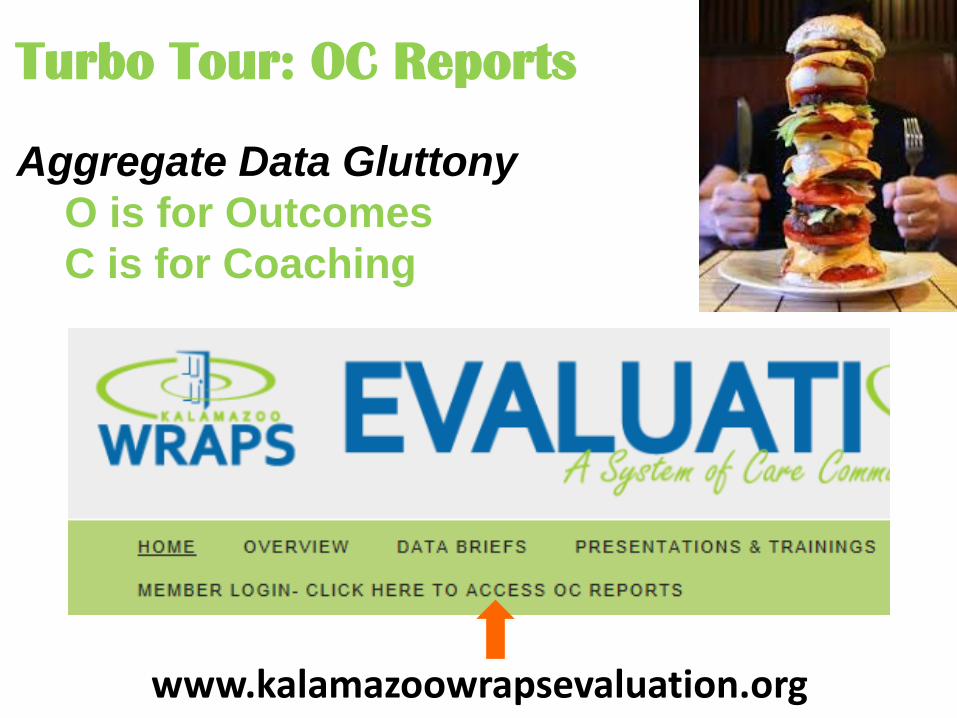
Turbo Tour: OC Reports
Aggregate Data Gluttony O is for Outcomes C is for Coaching
www.kalamazoowrapsevaluation.org
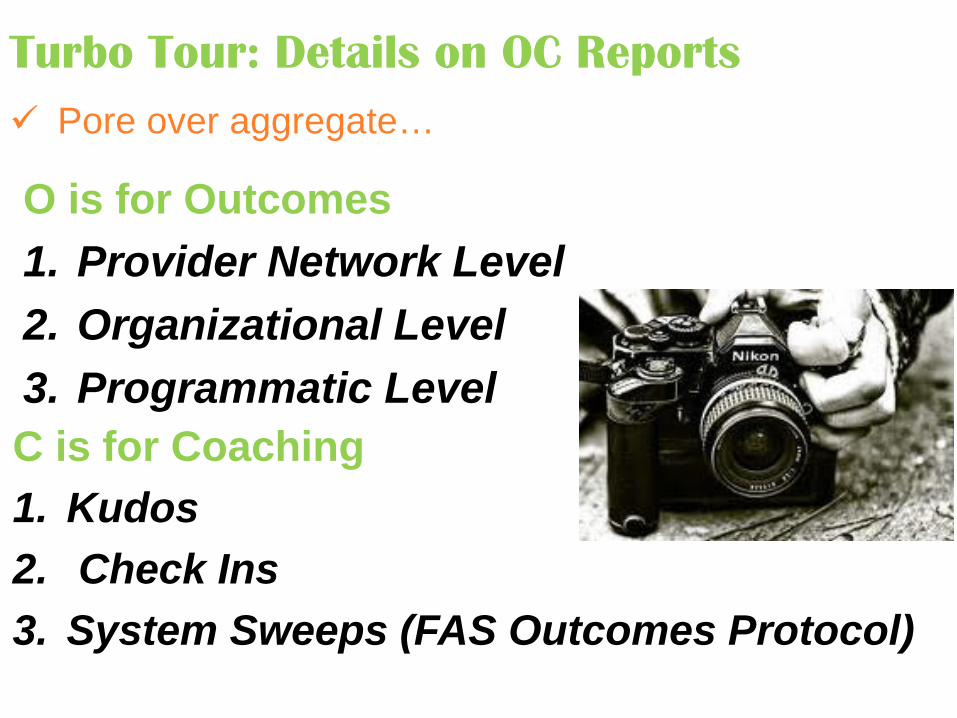
Turbo Tour: Details on OC Reports
O is for Outcomes 1. Provider Network Level 2. Organizational Level 3. Programmatic Level
C is for Coaching 1. Kudos 2. Check Ins 3. System Sweeps (FAS Outcomes Protocol)
Pore over aggregate…
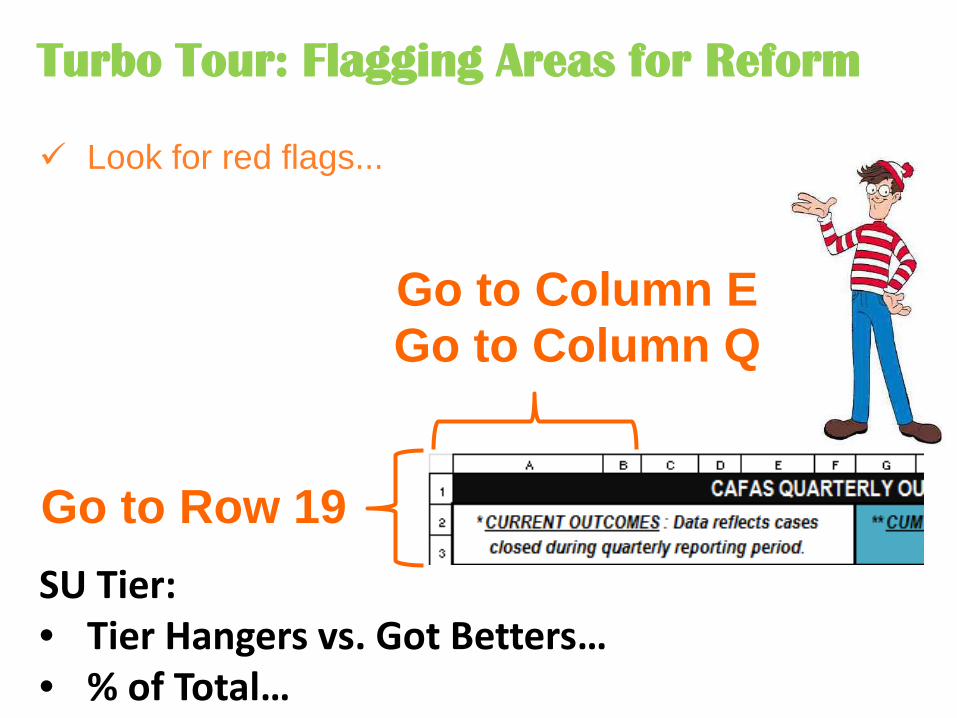
Turbo Tour: Flagging Areas for Reform
Go to Row 19
Go to Column E Go to Column Q
Look for red flags...
SU Tier: • Tier Hangers vs. Got Betters… • % of Total…
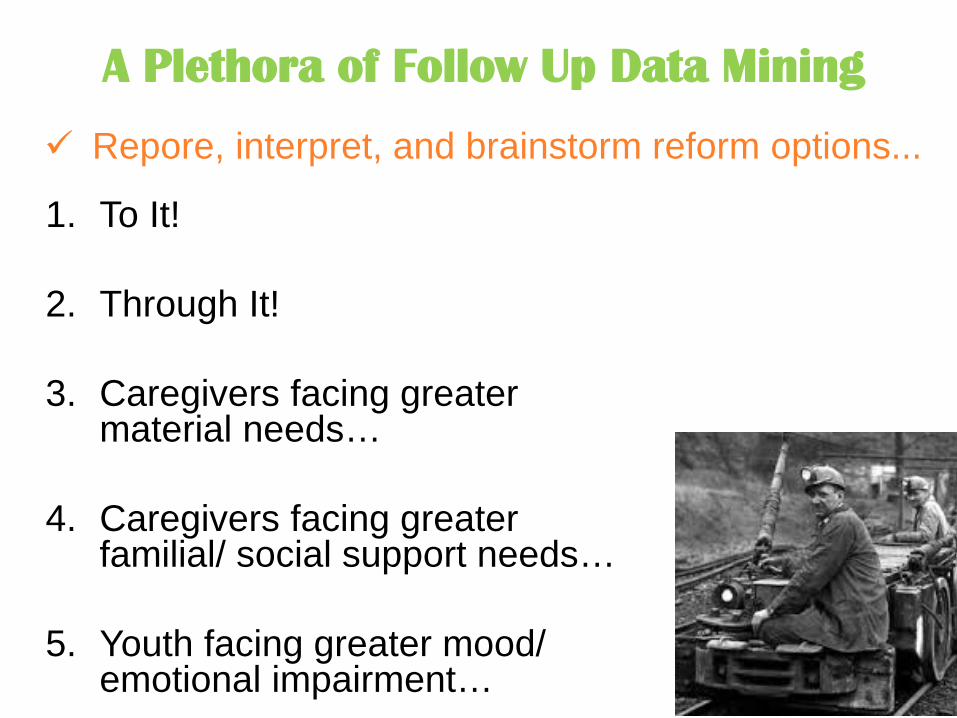
A Plethora of Follow Up Data Mining
1. To It!
2. Through It!
3. Caregivers facing greater material needs…
4. Caregivers facing greater
familial/ social support needs…
5. Youth facing greater mood/ emotional impairment…
Repore, interpret, and brainstorm reform options...
Data Guided Reforms
To it Reforms… • Hurry up! Move CAFASter
• MH SA Equality at the Gate
• Engagement improvement
• Impairment ID
• Bridge to services
• Sustainability
Pilot reforms that make sense…
Data Guided Reforms
Through It Reforms… • Contingency management • Hurry up! Move CAFASter… • Strengthening Clinical Component • Workforce development (outpatient) and so on…
Pilot reforms that make sense…
Next Up…
Behavior Problems with Moderate Mood….
Pore over aggregate… Look for red flags... Repore, interpret, and brainstorm reform options... Pilot reforms that make sense… Revisit data…
Goooo CAFASystem Reform…
Be CAFASensational…
Sharing Outcomes and Insuring Data Fidelity
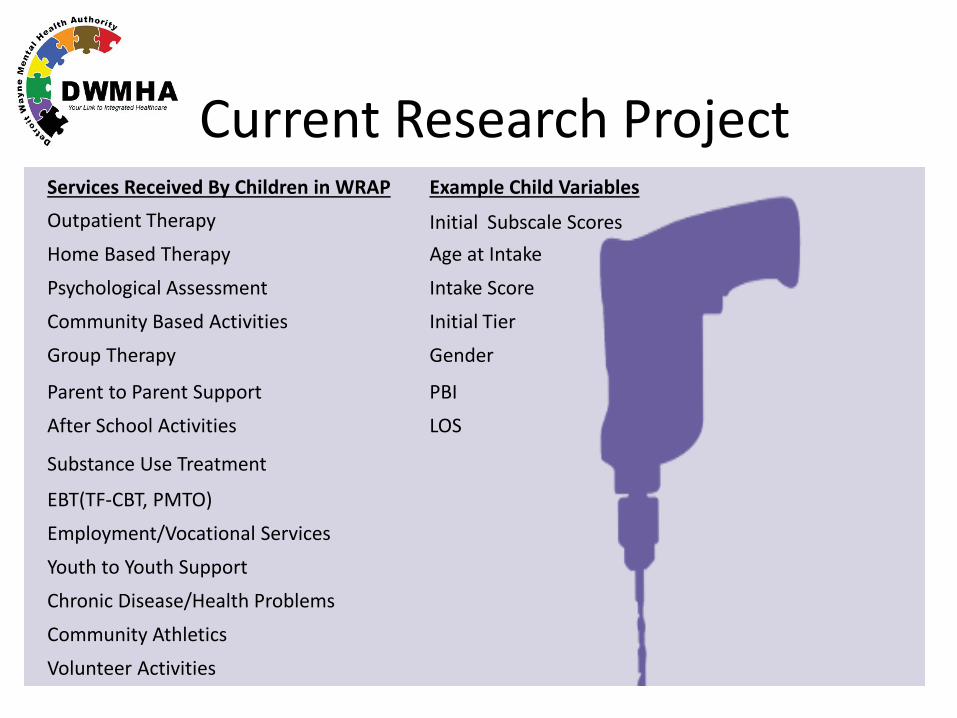
Current Research Project Services Received By Children in WRAP Example Child Variables Outpatient Therapy Initial Subscale Scores Home Based Therapy Age at Intake
Psychological Assessment Intake Score
Community Based Activities Initial Tier
Group Therapy Gender
Parent to Parent Support PBI
After School Activities LOS
Substance Use Treatment
EBT(TF-CBT, PMTO)
Employment/Vocational Services
Youth to Youth Support
Chronic Disease/Health Problems
Community Athletics
Volunteer Activities
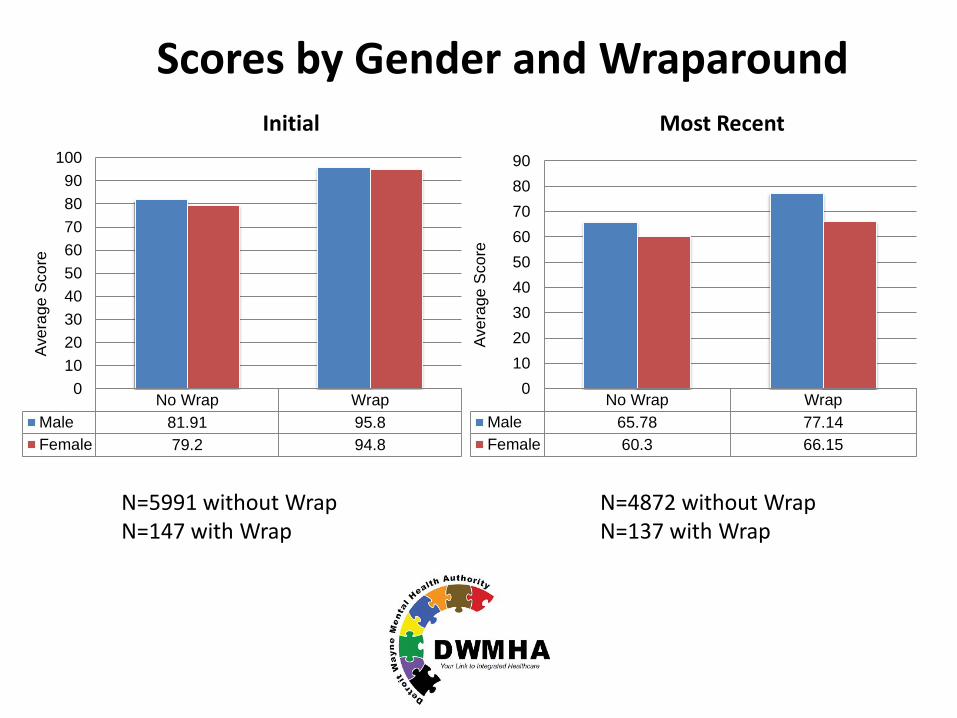
N=5991 without Wrap N=147 with Wrap
No Wrap WrapMale 81.91 95.8Female 79.2 94.8
0102030405060708090
100
Aver
age
Sco
re
No Wrap WrapMale 65.78 77.14Female 60.3 66.15
0102030405060708090
Aver
age
Sco
re
Scores by Gender and Wraparound Initial Most Recent
N=4872 without Wrap N=137 with Wrap
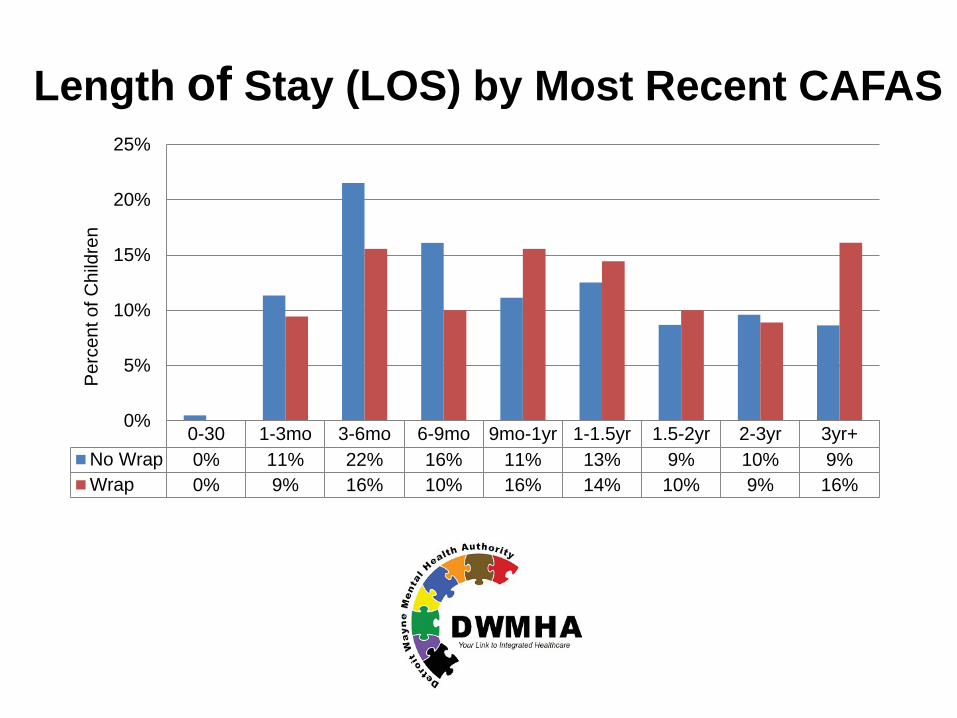
0-30 1-3mo 3-6mo 6-9mo 9mo-1yr 1-1.5yr 1.5-2yr 2-3yr 3yr+No Wrap 0% 11% 22% 16% 11% 13% 9% 10% 9%Wrap 0% 9% 16% 10% 16% 14% 10% 9% 16%
0%
5%
10%
15%
20%
25%
Per
cent
of C
hild
ren
Length of Stay (LOS) by Most Recent CAFAS
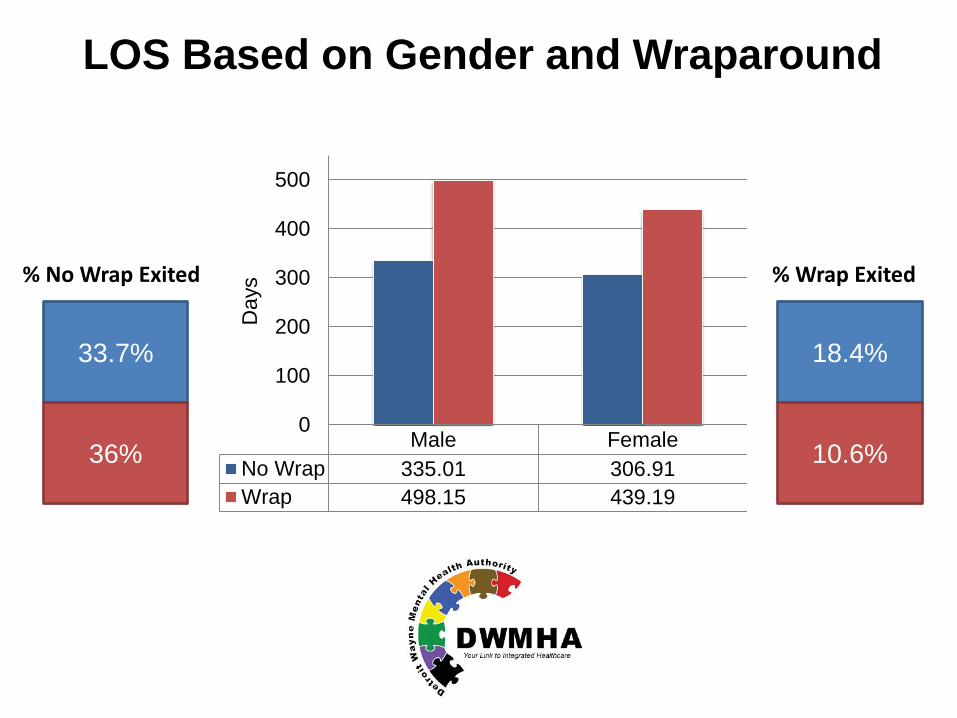
33.7%
36%
% No Wrap Exited
18.4%
10.6%
% Wrap Exited
Male FemaleNo Wrap 335.01 306.91Wrap 498.15 439.19
0
100
200
300
400
500
Day
s
LOS Based on Gender and Wraparound
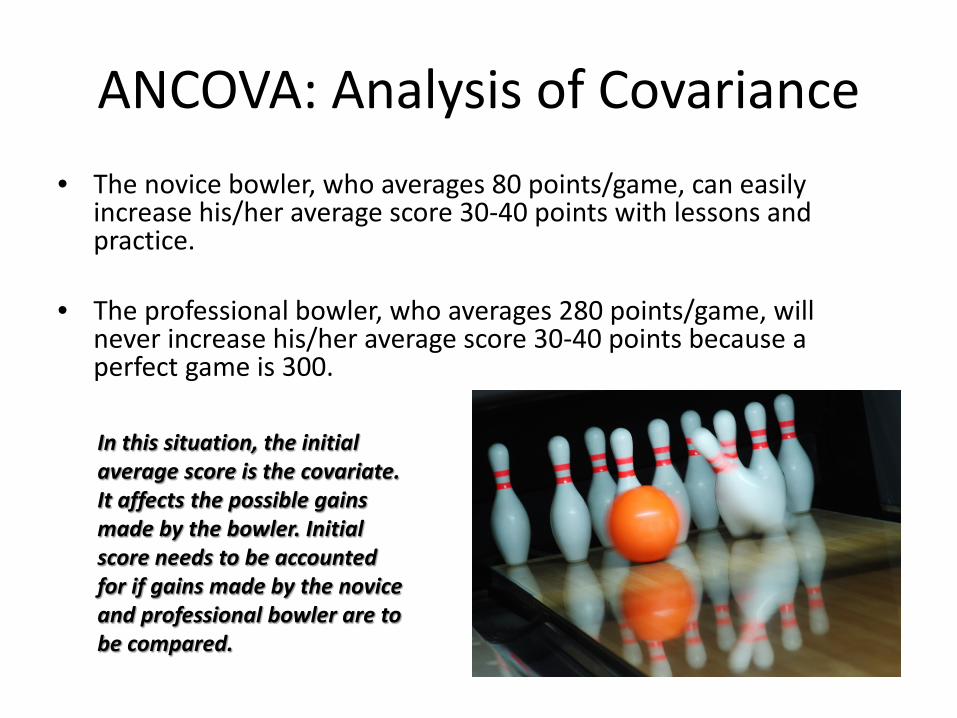
ANCOVA: Analysis of Covariance • The novice bowler, who averages 80 points/game, can easily
increase his/her average score 30-40 points with lessons and practice.
• The professional bowler, who averages 280 points/game, will
never increase his/her average score 30-40 points because a perfect game is 300. In this situation, the initial average score is the covariate. It affects the possible gains made by the bowler. Initial score needs to be accounted for if gains made by the novice and professional bowler are to be compared.
What affects gains?
Research Questions:
Do average gains differ by treatment intensity?
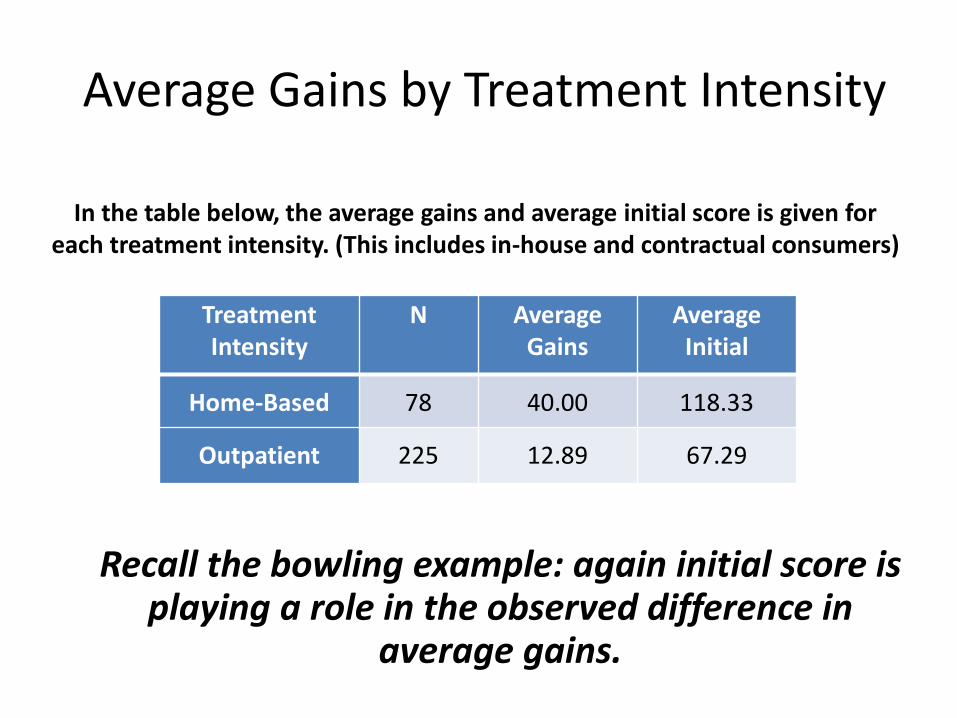
Average Gains by Treatment Intensity
In the table below, the average gains and average initial score is given for each treatment intensity. (This includes in-house and contractual consumers)
Treatment Intensity
N Average Gains
Average Initial
Home-Based 78 40.00 118.33
Outpatient 225 12.89 67.29
Recall the bowling example: again initial score is playing a role in the observed difference in
average gains.
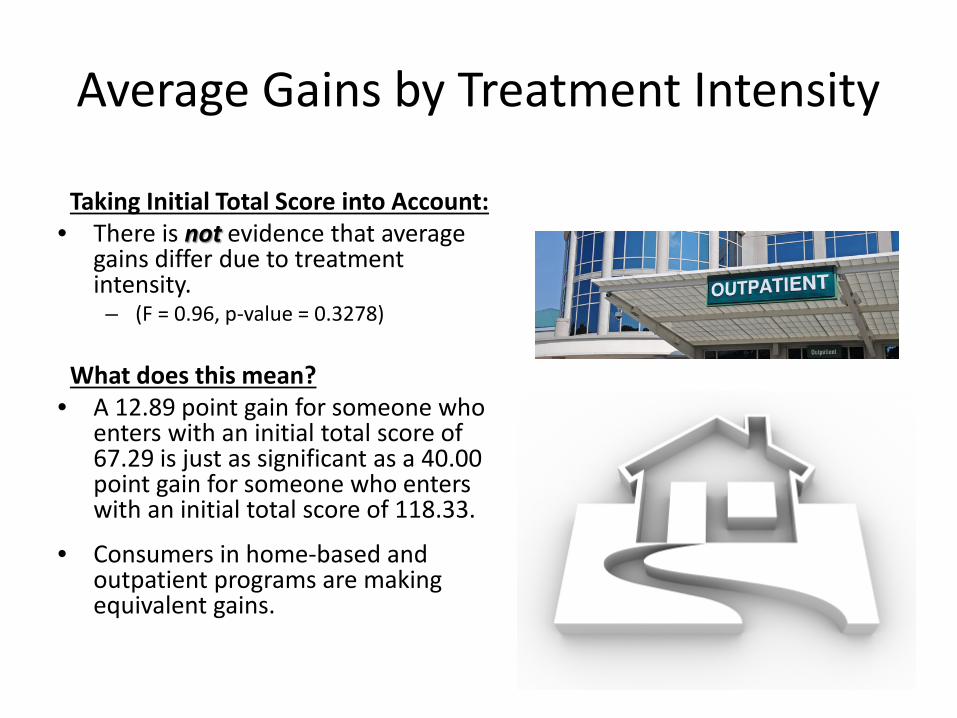
Average Gains by Treatment Intensity
Taking Initial Total Score into Account: • There is not evidence that average
gains differ due to treatment intensity. – (F = 0.96, p-value = 0.3278)
What does this mean?
• A 12.89 point gain for someone who enters with an initial total score of 67.29 is just as significant as a 40.00 point gain for someone who enters with an initial total score of 118.33.
• Consumers in home-based and outpatient programs are making equivalent gains.
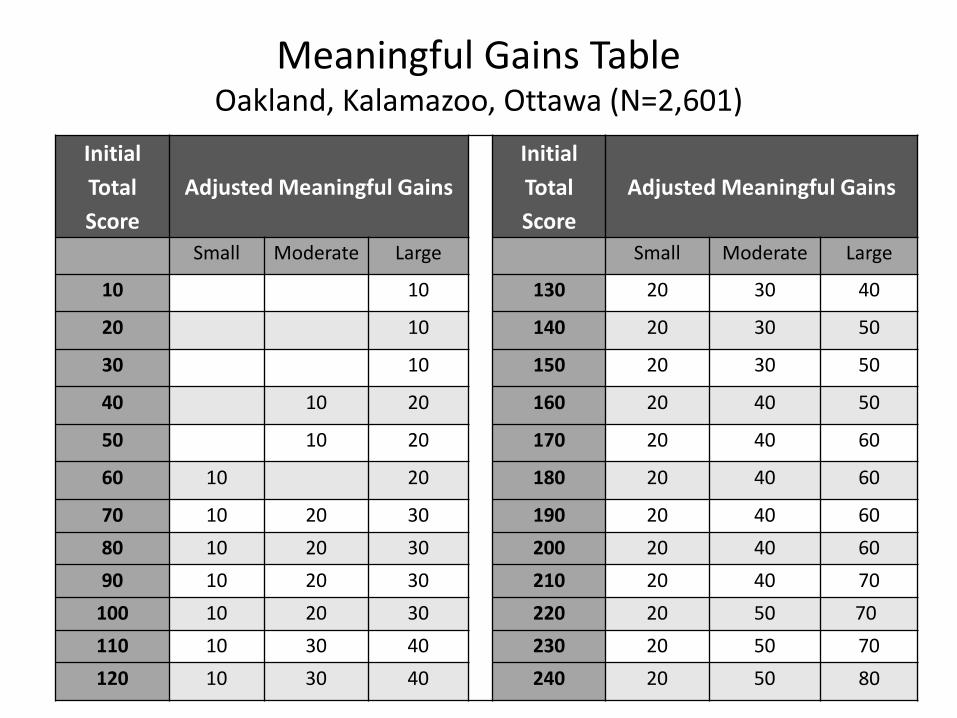
Meaningful Gains Table Oakland, Kalamazoo, Ottawa (N=2,601)
Initial Total Score
Adjusted Meaningful Gains Initial
Total Score
Adjusted Meaningful Gains
Small Moderate Large Small Moderate Large
10 10 130 20 30 40
20 10 140 20 30 50
30 10 150 20 30 50
40 10 20 160 20 40 50
50 10 20 170 20 40 60
60 10 20 180 20 40 60
70 10 20 30 190 20 40 60 80 10 20 30 200 20 40 60 90 10 20 30 210 20 40 70
100 10 20 30 220 20 50 70 110 10 30 40 230 20 50 70 120 10 30 40 240 20 50 80
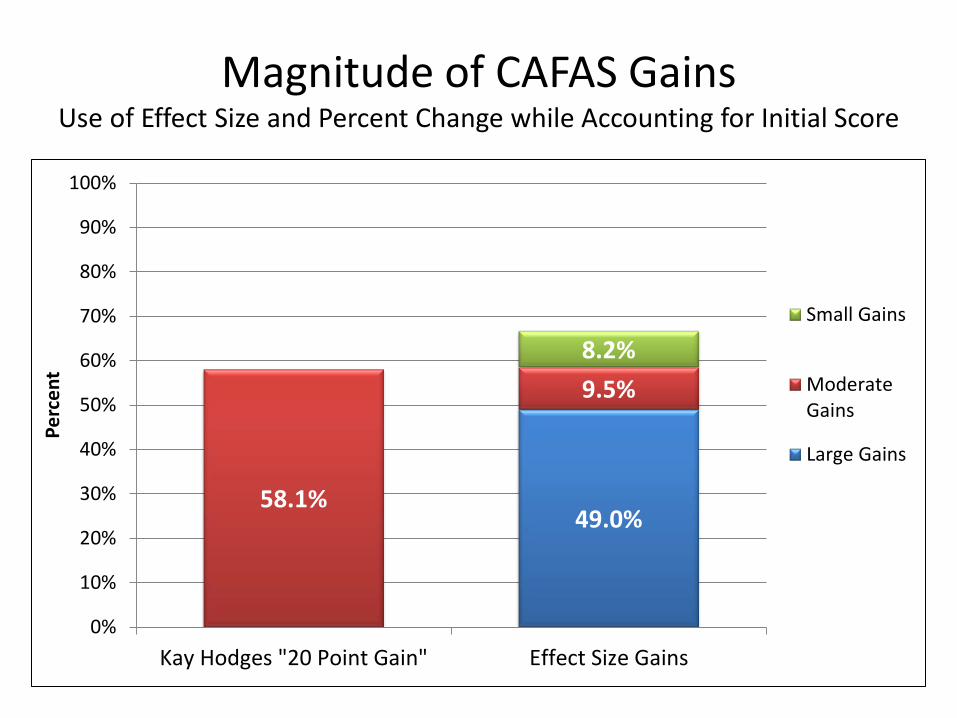
Magnitude of CAFAS Gains Use of Effect Size and Percent Change while Accounting for Initial Score
49.0% 58.1%
9.5% 8.2%
0%
10%
20%
30%
40%
50%
60%
70%
80%
90%
100%
Kay Hodges "20 Point Gain" Effect Size Gains
Perc
ent
Small Gains
ModerateGains
Large Gains
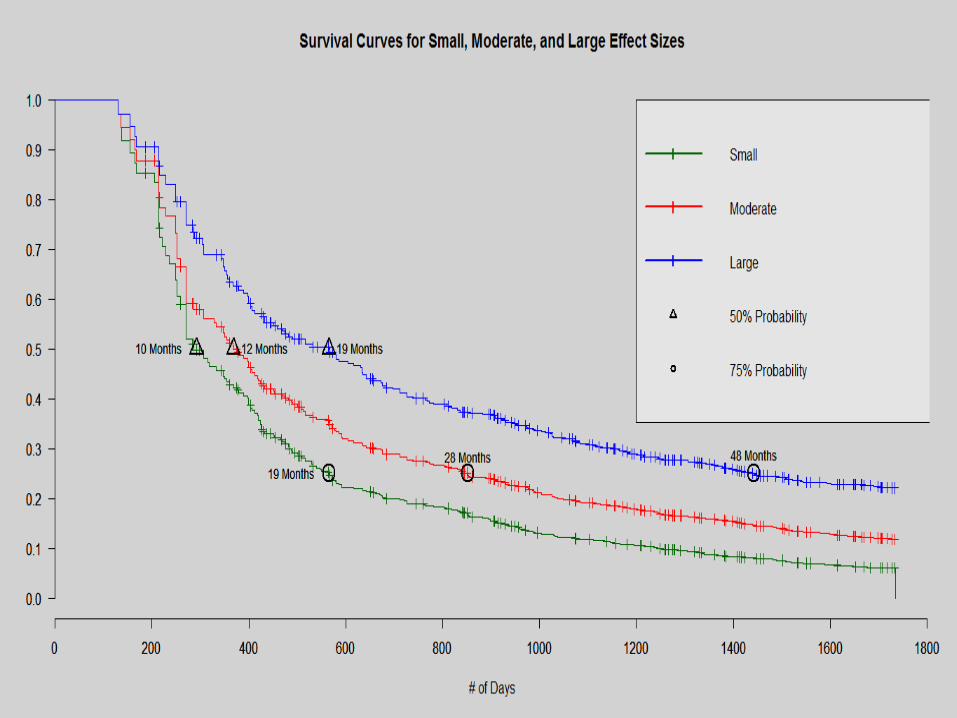
CAFAS Effect Size Gains: Survival Analysis
Goal • Estimate the amount of time it takes for a
client in services to reach a desired effect size gain (small, moderate, large)
• We would like to be able to give caregivers an expected time until a significant gain can be reached.
In Conclusion