how does context matter? comparing achievement …
TRANSCRIPT

i
HOW DOES CONTEXT MATTER?
COMPARING ACHIEVEMENT SCORES, OPPORTUNITIES TO
LEARN, AND TEACHER PREPARATION ACROSS SOCIO-
ECONOMIC QUINTILES IN TIMSS AND PISA
A DISSERTATION
SUBMITTED TO THE SCHOOL OF EDUCATION
AND THE COMMITTEE ON GRADUATE STUDIES
OF STANFORD UNIVERSITY
IN PARTIAL FULFILLMENT OF THE REQUIREMENTS
FOR THE DEGREE OF`
DOCTOR OF PHILOSOPHY
Frank M. Adamson
June 2010

http://creativecommons.org/licenses/by-nc/3.0/us/
This dissertation is online at: http://purl.stanford.edu/tx676tr1985
© 2010 by Frank Marshall Adamson. All Rights Reserved.
Re-distributed by Stanford University under license with the author.
This work is licensed under a Creative Commons Attribution-Noncommercial 3.0 United States License.
ii

I certify that I have read this dissertation and that, in my opinion, it is fully adequatein scope and quality as a dissertation for the degree of Doctor of Philosophy.
Martin Carnoy, Primary Adviser
I certify that I have read this dissertation and that, in my opinion, it is fully adequatein scope and quality as a dissertation for the degree of Doctor of Philosophy.
Linda Darling-Hammond
I certify that I have read this dissertation and that, in my opinion, it is fully adequatein scope and quality as a dissertation for the degree of Doctor of Philosophy.
Francisco Ramirez
I certify that I have read this dissertation and that, in my opinion, it is fully adequatein scope and quality as a dissertation for the degree of Doctor of Philosophy.
Richard Shavelson
Approved for the Stanford University Committee on Graduate Studies.
Patricia J. Gumport, Vice Provost Graduate Education
This signature page was generated electronically upon submission of this dissertation in electronic format. An original signed hard copy of the signature page is on file inUniversity Archives.
iii

iv
Abstract
Many people have touted education as a great equalizer because it provides
students with the skills and opportunity to succeed in life based on their own merit.
While this attitude has helped increase access to education around the world, the
quality of that education varies. Globally, education has multiple challenges. On the
micro level, educational quality remains inconsistent, and on the macro level,
increasing economic inequality has potential to deleteriously affect education. This
study analyzes the relationships between micro level education phenomena and these
macro level economic forces to determine how economic inequality relates to
education quality.
This study engages the infamous educational “black box” in three different
areas that capture, in aggregate, a meaningful portion of the classroom experience:
opportunity to learn (OTL), teacher preparation, and student achievement. The
analysis situates educational quality in the context of country-level economics by
comparing students across three types of economic disparities: inequality between
countries, inequality within countries, and inequality in the socio-economic status
(SES) of students. Between-country inequality consists of differences in overall
country income while within-country inequality concerns the distribution of income.
Between-student inequality gauges the relative SES of families and their ability to
provide resources conducive to education.
The main hypothesis is that high SES students in more-unequal countries have
relatively more access to educational resources, leading to relatively better teachers,
relatively more OTL, and higher math scores. The converse would hold true for low
SES students. Findings from international comparisons using the international
assessments in 2003 (PISA and TIMSS) show that income inequality adversely relates
to educational factors for students in all SES groups. Both high and low SES students
in more-unequal countries have lower achievement scores, less prepared teachers, and
less OTL. More detailed analysis at the country level does not identify any “silver
bullets” for low or high income inequality countries, but does show that OTL has a

v
greater relationship to achievement for higher SES students, while environmental
factors such as community size matter for low SES students. Theses findings imply
that high SES students have the foundation to take better advantage of their
educational settings while low SES students must first manage their social and
economic environments.

vi
Acknowledgements
I would like to thank the staffs of the OECD and the IEA, everyone involved in
data collection within participating countries, and the students themselves for
providing rigorous and rich international datasets that allow for new research
possibilities and contribute to our understanding of education systems around the
world.
My advisor, Dr. Martin Carnoy, provided invaluable guidance throughout
graduate school and offered his keen insights during the dissertation process. His
ability to discern important implications and findings remains unparalleled in the field,
and I am honored to have studied with him. Dr. Francisco Ramirez also provided
timely advice and asked global questions requiring me to consider the international
and country-level import of my findings. Dr. Richard Shavelson offered important
methodological recommendations based on his extensive knowledge of PISA, TIMSS,
and psychometrics. Dr. Linda Darling-Hammond superbly modeled how to write
clear, precise papers linking research to important policy questions.
I am also firmly indebted to my colleagues, Jon Dolle and Dr. Iliana Brodziak,
for their intellectual advice, their support during the dissertation process, and their
warm friendship. Aurora Wood and Lauren Stevenson contributed to the framing of
this study at important stages of its development. Maham Mela provided a measure of
country centralization that strengthened this study. Dr. Amita Chudgar and Dr. Tom
Luschei provided strong tutelage in my doctoral studies, and I am grateful for their
wisdom. Dr. Joel Sherman offered freely of his mentorship as I began my career in
International and Comparative Education and helped me understand the uses of
information, research, and policy in the field. I also acknowledge all of my teachers,
colleagues, students, and friends who have given me support throughout my life and
career path. Our communication provided much of the impetus for this project, and I
thank you for your involvement and care.
This study received funding from Stanford University’s School of Education
Dissertation Support Grant. This research was supported by a grant from the American
Educational Research Association, which receives funds for its "AERA Grants

vii
Program" from the National Science Foundation and the National Center for
Education Statistics of the Institute of Education Sciences (U.S. Department of
Education) under NSF Grant #REC-0310268. Opinions reflect those of the author and
do not necessarily reflect those of the granting agencies.
Finally, I dedicate this dissertation to my family, my parents Frank and Lynda,
and my brothers John, Bob, and of course, Greg, all of whom stood behind me
unwaveringly throughout this process. This dissertation is a culmination of the hard
work and love necessary in a strong family foundation, and I appreciate your support.

viii
Table of Contents TABLE OF CONTENTS ...................................................................................................................VIII LIST OF FIGURES ...............................................................................................................................XI LIST OF TABLES ..............................................................................................................................XIII ACRONYMS ....................................................................................................................................XVIII CHAPTER 1. EDUCATION WITHIN A NATIONAL ECONOMIC CONTEXT........................... 1
CONCEPTUALIZING RELATIONSHIPS BETWEEN ECONOMIC CONDITIONS AND FACTORS OF EDUCATIONAL QUALITY........................................................................................................................ 9 SCOPE OF THE STUDY........................................................................................................................... 11
Defining Terms ............................................................................................................................... 12 SUMMARY............................................................................................................................................ 14
Organization of the Dissertation .................................................................................................... 14 CHAPTER 2: LINKING ECONOMIC CONDITIONS WITH EDUCATIONAL FACTORS AND OUTCOMES .......................................................................................................................................... 16
ECONOMIC RELATIONSHIPS WITH EDUCATION FACTORS .................................................................... 18 Measuring Student Socio-Economic Status.................................................................................... 19 Relationships Between SES and Educational Factors ................................................................... 24 Relating SES and Achievement on PISA and TIMSS ..................................................................... 27 Macroeconomic Research – Country Wealth................................................................................. 29 Macroeconomic Research – Country Income Inequality ............................................................... 30
INDICATORS OF EDUCATIONAL QUALITY ............................................................................................ 32 Teacher Preparation ...................................................................................................................... 32 Opportunities to Learn ................................................................................................................... 33 School Factors................................................................................................................................ 34
USING PRODUCTION FUNCTIONS IN EDUCATION ................................................................................. 34 Limitations of Production Functions.............................................................................................. 36
CHAPTER 3: CONCEPTUAL FRAMEWORK, RESEARCH DESIGN, AND METHODOLOGY.................................................................................................................................................................. 39
UNDERSTANDING RELATIONSHIPS BETWEEN THE MICRO AND MACRO ECONOMIC LEVELS AND EDUCATION QUALITY: A CONCEPTUAL FRAMEWORK......................................................................... 39 RESEARCH QUESTIONS AND HYPOTHESES........................................................................................... 41
Research Question #1..................................................................................................................... 41 Research Question #2..................................................................................................................... 45
RESEARCH DESIGN .............................................................................................................................. 46 Part I: Identifying Relationships Between Economic Factors and Measures of Educational Quality ............................................................................................................................................ 47 Part II: Production Functions Predicting Educational Attainment in Economically Different Countries ........................................................................................................................................ 49
DATA ................................................................................................................................................... 50 Program for International Student Assessment (PISA).................................................................. 50 Trends in International Mathematics and Science Study (TIMSS) ................................................ 52 Plausible Values, Weights, and Estimation Commands................................................................. 52
METHODOLOGY ................................................................................................................................... 54 Creating the SES Index for Grouping by SES Quintiles ................................................................ 54 International Measures of Country Income, Income Inequality, and Centralization .................... 57 Analysis Part I: International Comparisons .................................................................................. 60 Analysis Part II: Individual Country Production Functions.......................................................... 63
DESCRIPTIVE STATISTICS..................................................................................................................... 65
ix
CHAPTER 4: THE LEVEL AND DISTRIBUTION OF STUDENT ACHIEVEMENT ACROSS COUNTRY ECONOMIC LEVEL AND INCOME DISTRIBUTION............................................. 75
RELATING STUDENT ACHIEVEMENT TO ECONOMIC CONDITIONS........................................................ 75 Student Achievement, Student SES, and Country Income in PISA ................................................. 79 Student Achievement, Student SES, and Income Inequality in PISA.............................................. 87 Student Achievement, Student SES, and Country Income in TIMSS .............................................. 94 Student Achievement, Student SES, and Income Inequality in TIMSS ......................................... 101
CHAPTER 5: THE LEVEL AND DISTRIBUTION OF TEACHER PREPARATION AND OPPORTUNITIES TO LEARN ACROSS COUNTRY ECONOMIC LEVEL AND INCOME DISTRIBUTION .................................................................................................................................. 109
RELATING TEACHER PREPARATION TO ECONOMIC CONDITIONS....................................................... 109 The Teacher Preparation Index, Student SES, and Country Income in TIMSS ........................... 110 Teacher Preparation (ISCED Only), Student SES, and Country Income in TIMSS .................... 112 Teacher Preparation, Student SES, Country Income, and Income Inequality in TIMSS ............. 122 Teacher Preparation (ISCED Only), Student SES, Country Income, and Income Inequality in TIMSS ........................................................................................................................................... 123
RELATING OPPORTUNITIES TO LEARN TO ECONOMIC CONDITIONS................................................... 132 Opportunities to Learn, Student SES, and Country Income in PISA ........................................... 134 Opportunities to Learn, Student SES, and Income Inequality in PISA ........................................ 140 Opportunities to Learn, Student SES, and Country Income in TIMSS......................................... 145 Opportunities to Learn, Student SES, Country Income, and Income Inequality in TIMSS.......... 157
CHAPTER 6. COMPARING ACHIEVEMENT OUTCOMES BETWEEN SES QUINTILES IN HIGH AND LOW INCOME PER CAPITA COUNTRIES WITH DIFFERING INCOME DISTRIBUTIONS................................................................................................................................ 168
SELECTING COUNTRIES PARTICIPATING IN BOTH PISA AND TIMSS ................................................ 169 USING PRODUCTION FUNCTIONS TO IDENTIFY CROSS-NATIONAL EDUCATIONAL PATTERNS ........... 173 THE RELATIONSHIP OF STUDENT CHARACTERISTICS, CLASSROOM RESOURCES, AND SCHOOL CAPACITY TO ACHIEVEMENT IN ECONOMICALLY DIFFERENT COUNTRIES........................................ 176
Comparing Student Characteristics Across Countries ................................................................ 177 Comparing Classroom Resources and School Capacity Across Countries ................................. 186 Comparing Classroom Resources and School Capacity Between Low and High SES Quintiles Across Countries .......................................................................................................................... 200 Comparing Production Function Results Between PISA and TIMSS .......................................... 224
CHAPTER 7. CONCLUSIONS, POLICY RECOMMENDATIONS, AND DIRECTIONS FOR FUTURE RESEARCH ........................................................................................................................ 230
RELATIONSHIPS BETWEEN ECONOMIC CONDITIONS, STUDENT SES, AND STUDENT ACHIEVEMENT. 231 RELATIONSHIPS BETWEEN ECONOMIC CONDITIONS, STUDENT SES, AND TEACHER PREPARATION.. 234 RELATIONSHIPS BETWEEN ECONOMIC CONDITIONS, STUDENT SES, AND OPPORTUNITIES TO LEARN........................................................................................................................................................... 234 EDUCATIONAL COMPARISONS BETWEEN ECONOMICALLY DIFFERENT COUNTRIES .......................... 236 SUGGESTIONS FOR FUTURE RESEARCH.............................................................................................. 241
APPENDICES ...................................................................................................................................... 246 APPENDIX 1: STUDENT ACHIEVEMENT INTERNATIONAL COMPARISON TABLES FOR PISA AND TIMSS........................................................................................................................................................... 247 APPENDIX 2: TEACHER PREPARATION INTERNATIONAL COMPARISON TABLES FOR TIMSS............. 251 APPENDIX 3: OPPORTUNITIES TO LEARN INTERNATIONAL COMPARISON TABLES FOR PISA AND TIMSS ............................................................................................................................................... 255 APPENDIX 4: PRODUCTION FUNCTION RESULTS FOR HIGH GNI PER CAPITA COUNTRIES PARTICIPATING IN BOTH PISA AND TIMSS .................................................................................... 261

x
APPENDIX 5: PRODUCTION FUNCTION RESULTS FOR LOW GNI PER CAPITA COUNTRIES PARTICIPATING IN BOTH PISA AND TIMSS .................................................................................... 298 APPENDIX 6: PRODUCTION FUNCTION RESULTS FOR HIGH GNI PER CAPITA COUNTRIES PARTICIPATING IN BOTH PISA AND TIMSS, BY HIGH AND LOW SES QUINTILES........................... 329 APPENDIX 7: PRODUCTION FUNCTION RESULTS FOR LOW GNI PER CAPITA COUNTRIES PARTICIPATING IN BOTH PISA AND TIMSS, BY HIGH AND LOW SES QUINTILES........................... 365
REFERENCES..................................................................................................................................... 396
xi
List of Figures FIGURE 1. ILLUSTRATING LEVELS OF ECONOMIC DIFFERENCES ................................................................ 3 FIGURE 2. MEAN MATHEMATICS ACHIEVEMENT ON PISA 2003 AND INCOME PER CAPITA (2003), BY
COUNTRY .......................................................................................................................................... 5 FIGURE 3. MEAN MATHEMATICS ACHIEVEMENT ON PISA 2003 AND GINI COEFFICIENTS, BY COUNTRY.. 6 FIGURE 4. MEAN MATHEMATICS ACHIEVEMENT ON TIMSS 2003 AND GINI COEFFICIENTS, BY COUNTRY7 FIGURE 5. MEAN MATHEMATICS ACHIEVEMENT ON TIMSS 2003 AND GINI COEFFICIENTS, BY COUNTRY8 FIGURE 6. CONCEPTUAL FRAMEWORK ..................................................................................................... 41 FIGURE 7. HYPOTHESIZED ACHIEVEMENT SCORES DISPERSING AS INCOME INEQUALITY INCREASES ..... 43 FIGURE 9. THE LORENZ CURVE ................................................................................................................ 58 FIGURE 10. SES QUINTILE SLOPES FROM OLS REGRESSION OF PISA 2003 MATH SCORES AND GNI PER
CAPITA (2003) ................................................................................................................................ 85 FIGURE 12. SES QUINTILE SLOPES FROM OLS REGRESSION OF PISA 2003 MATH SCORES, GNI PER
CAPITA (2003), AND DECENTRALIZATION ...................................................................................... 86 FIGURE 14. SES QUINTILE SLOPES FROM OLS REGRESSION OF PISA 2003 MATH SCORES, GNI PER
CAPITA, AND GINI COEFFICIENTS.................................................................................................... 92 FIGURE 15. SES QUINTILE SLOPES FROM OLS REGRESSION OF PISA 2003 MATH SCORES, GNI PER
CAPITA, GINI COEFFICIENTS, AND DECENTRALIZATION ................................................................. 93 FIGURE 16. SES QUINTILE SLOPES FROM OLS REGRESSION OF TIMSS 2003 MATH SCORES AND GNI PER
CAPITA (2003) ................................................................................................................................ 99 FIGURE 17. SES QUINTILE SLOPES FROM OLS REGRESSION OF TIMSS 2003 MATH SCORES, GNI PER
CAPITA (2003), AND DECENTRALIZATION .................................................................................... 100 FIGURE 18. SES QUINTILE SLOPES FROM OLS REGRESSION OF TIMSS 2003 MATH SCORES, GNI PER
CAPITA, AND GINI COEFFICIENTS.................................................................................................. 107 FIGURE 19. SES QUINTILE SLOPES FROM OLS REGRESSION OF TIMSS 2003 MATH SCORES, GNI PER
CAPITA, GINI COEFFICIENTS, AND DECENTRALIZATION ............................................................... 108 FIGURE 20. SES QUINTILE SLOPES FROM OLS REGRESSION OF TIMSS 2003 TEACHER PREPARATION
INDEX AND GNI PER CAPITA (2003) ............................................................................................. 116 FIGURE 21. SES QUINTILE SLOPES FROM OLS REGRESSION OF TIMSS 2003 TEACHER PREPARATION
INDEX, GNI PER CAPITA (2003), AND DECENTRALIZATION.......................................................... 117 FIGURE 22. SES QUINTILE SLOPES FROM OLS REGRESSION OF TIMSS 2003 TEACHER PREPARATION
(ISCED) AND GNI PER CAPITA (2003) ......................................................................................... 120 FIGURE 23. SES QUINTILE SLOPES FROM OLS REGRESSION OF TIMSS 2003 TEACHER PREP. (ISCED),
GNI PER CAPITA (2003), AND DECENTRALIZATION...................................................................... 121 FIGURE 24. SES QUINTILE SLOPES FROM OLS REGRESSION OF TIMSS 2003 TEACHER PREPARATION
INDEX, GNI PER CAPITA, AND GINI COEFFICIENTS ....................................................................... 126 FIGURE 25. SES QUINTILE SLOPES FROM OLS REGRESSION OF TIMSS 2003 TEACHER PREPARATION
INDEX, GNI PER CAPITA, GINI COEFFICIENTS, AND DECENTRALIZATION..................................... 127 FIGURE 26. SES QUINTILE SLOPES FROM OLS REGRESSION OF TIMSS 2003 TEACHER PREPARATION
INDEX (ISCED), GNI PER CAPITA, AND GINI COEFFICIENTS........................................................ 130 FIGURE 27. SES QUINTILE SLOPES FROM OLS REGRESSION OF TIMSS 2003 TEACHER PREP. INDEX
(ISCED), GNI PER CAPITA, GINI COEFFICIENTS, AND DECENTRALIZATION................................. 131 FIGURE 28. SES QUINTILE SLOPES FROM LOGISTIC REGRESSION OF PISA 2003 GRADE LEVEL AND GNI
PER CAPITA (2003)........................................................................................................................ 138 FIGURE 29. SES QUINTILE SLOPES FROM LOGISTIC REGRESSION OF PISA 2003 GRADE LEVEL, GNI PER
CAPITA (2003), AND DECENTRALIZATION .................................................................................... 139 FIGURE 30. SES QUINTILE SLOPES FROM OLS REGRESSION OF PISA 2003 GRADE LEVEL, GNI PER
CAPITA, AND GINI COEFFICIENTS.................................................................................................. 143 FIGURE 31. SES QUINTILE SLOPES FROM OLS REGRESSION OF PISA 2003 GRADE LEVEL. GNI PER
CAPITA, GINI COEFFICIENTS, AND DECENTRALIZATION ............................................................... 144 FIGURE 32. SES QUINTILE SLOPES FROM OLS REGRESSION OF TIMSS 2003 OPPORTUNITIES TO LEARN
ALGEBRA AND GNI PER CAPITA (2003)........................................................................................ 151

xii
FIGURE 30. SES QUINTILE SLOPES FROM OLS REGRESSION OF TIMSS 2003 OPPORTUNITIES TO LEARN ALGEBRA, GNI PER CAPITA (2003), AND DECENTRALIZATION .................................................... 152
FIGURE 34. SES QUINTILE SLOPES FROM OLS REGRESSION OF TIMSS 2003 OPPORTUNITIES TO LEARN ALGEBRA AND GEOMETRY AND GNI PER CAPITA (2003)............................................................. 155
FIGURE 32. SES QUINTILE SLOPES FROM OLS REGRESSION OF TIMSS 2003 OPPORTUNITIES TO LEARN ALGEBRA AND GEOMETRY, GNI PER CAPITA (2003), AND DECENTRALIZATION ......................... 156
FIGURE 33. SES QUINTILE SLOPES FROM OLS REGRESSION OF TIMSS 2003 OPPORTUNITIES TO LEARN ALGEBRA, GNI PER CAPITA, AND GINI COEFFICIENTS ................................................................. 162
FIGURE 34. SES QUINTILE SLOPES FROM OLS REGRESSION OF TIMSS 2003 OPPORTUNITIES TO LEARN ALGEBRA, GNI PER CAPITA, GINI COEFFICIENTS, AND DECENTRALIZATION............................... 163
FIGURE 35. SES QUINTILE SLOPES FROM OLS REGRESSION OF TIMSS 2003 OPPORTUNITIES TO LEARN ALGEBRA AND GEOMETRY, GNI PER CAPITA, AND GINI COEFFICIENTS....................................... 166
FIGURE 36. SES QUINTILE SLOPES FROM OLS REGRESSION OF TIMSS 2003 OPPORTUNITIES TO LEARN ALGEBRA AND GEOMETRY, GNI PER CAPITA, GINI COEFFICIENTS, AND DECENTRALIZATION .... 167

xiii
List of Tables TABLE 1. HYPOTHESIZING RELATIONSHIPS BETWEEN ECONOMIC INEQUALITY AND EDUCATION QUALITY
........................................................................................................................................................ 45 TABLE 2. LIST OF VARIABLES AND DESCRIPTIONS FROM TIMSS AND PISA ........................................... 48 TABLE 3. ECONOMIC CONDITIONS AND LEVELS OF CENTRALIZATION IN COUNTRIES PARTICIPATING IN
PISA 2003, BY GINI COEFFICIENTS ................................................................................................ 67 TABLE 4. ECONOMIC CONDITIONS AND LEVELS OF CENTRALIZATION IN COUNTRIES PARTICIPATING IN
TIMSS 2003, BY GINI COEFFICIENTS ............................................................................................. 69 TABLE 5. VARIABLES AND DESCRIPTIONS USED IN PISA PART II ANALYSIS........................................... 71 TABLE 6. MEAN VALUES FOR PISA 2003 VARIABLES IN COUNTRY PRODUCTION FUNCTIONS, BY
COUNTRY ECONOMIC CONDITIONS................................................................................................. 72 TABLE 7. VARIABLES AND DESCRIPTIONS USED IN TIMSS PART II ANALYSIS ....................................... 73 TABLE 8. MEAN VALUES FOR TIMSS 2003 VARIABLES IN COUNTRY PRODUCTION FUNCTIONS, BY
COUNTRY (SORTED BY ECONOMIC CONDITION) ............................................................................. 74 TABLE 9. ESTIMATED OLS COEFFICIENTS OF PISA 2003 MATH ACHIEVEMENT SCORES ON SOCIO-
ECONOMIC STATUS, SES QUINTILES, GNI PER CAPITA, AND LEVELS OF DECENTRALIZATION...... 83 TABLE 10. ESTIMATED OLS COEFFICIENTS OF PISA 2003 MATH ACHIEVEMENT SCORES ON SOCIO-
ECONOMIC STATUS, SES QUINTILES, GNI PER CAPITA, GINI COEFFICIENTS, AND LEVELS OF DECENTRALIZATION ....................................................................................................................... 90
TABLE 11. ESTIMATED OLS COEFFICIENTS OF TIMSS 2003 MATH ACHIEVEMENT SCORES ON SOCIO-ECONOMIC STATUS, SES QUINTILES, GNI PER CAPITA, AND LEVELS OF DECENTRALIZATION...... 97
TABLE 12. ESTIMATED OLS COEFFICIENTS OF TIMSS 2003 MATH ACHIEVEMENT SCORES ON SOCIO-ECONOMIC STATUS, SES QUINTILES, GNI PER CAPITA, GINI COEFFICIENTS, AND LEVELS OF DECENTRALIZATION ..................................................................................................................... 105
TABLE 13. ESTIMATED OLS COEFFICIENTS OF TIMSS 2003 TEACHER PREPARATION INDEX ON SOCIO-ECONOMIC STATUS, SES QUINTILES, GNI PER CAPITA, AND LEVELS OF DECENTRALIZATION.... 114
TABLE 14. ESTIMATED OLS COEFFICIENTS OF TIMSS 2003 TEACHER PREPARATION INDEX (ISCED ONLY) ON SOCIO-ECONOMIC STATUS, SES QUINTILES, GNI PER CAPITA, AND LEVELS OF DECENTRALIZATION ..................................................................................................................... 118
TABLE 15. ESTIMATED OLS COEFFICIENTS OF TIMSS 2003 TEACHER PREPARATION INDEX ON SOCIO-ECONOMIC STATUS, SES QUINTILES, GNI PER CAPITA, GINI COEFFICIENTS, AND LEVELS OF DECENTRALIZATION ..................................................................................................................... 124
TABLE 16. ESTIMATED OLS COEFFICIENTS OF TIMSS 2003 TEACHER PREPARATION INDEX (ISCED ONLY) ON SOCIO-ECONOMIC STATUS, SES QUINTILES, GNI PER CAPITA, GINI COEFFICIENTS, AND LEVELS OF DECENTRALIZATION ................................................................................................... 128
TABLE 17. MEAN VALUES OF PERCENTAGE OF TIME SPENT IN MATHEMATICS CONTENT AREAS IN TIMSS 2003, BY LEVELS OF CENTRALIZATION ............................................................................ 134
TABLE 18. LOGIT REGRESSION PROBABILITIES OF HIGHER PISA GRADE LEVELS FOR SOCIO-ECONOMIC STATUS, SES QUINTILES, GNI PER CAPITA, AND LEVELS OF DECENTRALIZATION ...................... 136
TABLE 19. LOGIT REGRESSION PROBABILITIES OF HIGHER PISA GRADE LEVELS FOR SOCIO-ECONOMIC STATUS, SES QUINTILES, GNI PER CAPITA, GINI COEFFICIENTS, AND LEVELS OF DECENTRALIZATION ..................................................................................................................... 141
TABLE 20. ESTIMATED OLS COEFFICIENTS OF TIMSS 2003 OPPORTUNITIES TO LEARN ALGEBRA ON SOCIO-ECONOMIC STATUS, SES QUINTILES, GNI PER CAPITA, AND LEVELS OF DECENTRALIZATION ..................................................................................................................... 149
TABLE 21. ESTIMATED OLS COEFFICIENTS OF TIMSS 2003 OPPORTUNITIES TO LEARN ALGEBRA AND GEOMETRY ON SOCIO-ECONOMIC STATUS, SES QUINTILES, GNI PER CAPITA, AND LEVELS OF DECENTRALIZATION ..................................................................................................................... 153
TABLE 22. ESTIMATED OLS COEFFICIENTS OF TIMSS 2003 OPPORTUNITIES TO LEARN ALGEBRA ON SOCIO-ECONOMIC STATUS, SES QUINTILES, GNI PER CAPITA, GINI COEFFICIENTS, AND LEVELS OF DECENTRALIZATION ..................................................................................................................... 160

xiv
TABLE 23. ESTIMATED OLS COEFFICIENTS OF TIMSS 2003 OPPORTUNITIES TO LEARN (ALGEBRA AND GEOMETRY) ON SOCIO-ECONOMIC STATUS, SES QUINTILES, GNI PER CAPITA, GINI COEFFICIENTS, AND LEVELS OF DECENTRALIZATION............................................................................................ 164
TABLE 24. GROSS NATIONAL INCOME PER CAPITA AND GINI COEFFICIENTS FOR COUNTRIES SELECTED FOR PRODUCTION FUNCTION ANALYSIS ....................................................................................... 170
TABLE 25. COUNTRY SELECTION BY COUNTRY INCOME PER CAPITA AND INCOME INEQUALITY FOR WITHIN COUNTRY PRODUCTION FUNCTIONS................................................................................ 171
TABLE 26. COUNTRIES WITH LARGEST AND SMALLEST DIFFERENCES BETWEEN HIGH AND LOW SES QUINTILE COEFFICIENTS ............................................................................................................... 179
TABLE 27. SUMMARY RESULTS FROM PISA 2003 PRODUCTION FUNCTIONS FOR STUDENT CHARACTERISTICS, BY COUNTRY ECONOMIC GROUPS ................................................................ 182
TABLE 28. SUMMARY RESULTS FROM TIMSS 2003 PRODUCTION FUNCTIONS FOR STUDENT CHARACTERISTICS, BY COUNTRY ECONOMIC GROUPS ................................................................ 184
TABLE 29. SUMMARY RESULTS FROM PISA 2003 PRODUCTION FUNCTIONS FOR CLASSROOM RESOURCES, BY COUNTRY ECONOMIC GROUPS (ONLY SIGNIFICANT COEFFICIENTS REPORTED) 191
TABLE 30. SUMMARY RESULTS FROM TIMSS 2003 PRODUCTION FUNCTIONS FOR CLASSROOM RESOURCES, BY COUNTRY ECONOMIC GROUPS (ONLY SIGNIFICANT COEFFICIENTS REPORTED) 194
TABLE 31. SUMMARY RESULTS FROM PISA 2003 PRODUCTION FUNCTIONS FOR SCHOOL CAPACITY, BY COUNTRY ECONOMIC GROUPS (ONLY SIGNIFICANT COEFFICIENTS REPORTED) .......................... 196
TABLE 32. SUMMARY RESULTS FROM TIMSS 2003 PRODUCTION FUNCTIONS FOR SCHOOL CAPACITY, BY COUNTRY ECONOMIC GROUPS (ONLY SIGNIFICANT COEFFICIENTS REPORTED) .................... 198
TABLE 33. SUMMARY RESULTS FROM PISA 2003 PRODUCTION FUNCTIONS FOR CLASSROOM RESOURCES, BY COUNTRY ECONOMIC GROUPS AND LOW AND HIGH SES QUINTILES (ONLY SIGNIFICANT COEFFICIENTS REPORTED)....................................................................................... 206
TABLE 34. SUMMARY RESULTS FROM TIMSS 2003 PRODUCTION FUNCTIONS FOR CLASSROOM RESOURCES, BY COUNTRY ECONOMIC GROUPS AND LOW AND HIGH SES QUINTILES (ONLY SIGNIFICANT COEFFICIENTS REPORTED)....................................................................................... 212
TABLE 35. SUMMARY RESULTS FROM PISA 2003 PRODUCTION FUNCTIONS FOR SCHOOL CAPACITY, BY COUNTRY ECONOMIC GROUPS AND LOW AND HIGH SES QUINTILES (ONLY SIGNIFICANT COEFFICIENTS REPORTED) ............................................................................................................ 216
TABLE 36. SUMMARY RESULTS FROM TIMSS 2003 PRODUCTION FUNCTIONS FOR SCHOOL CAPACITY, BY COUNTRY ECONOMIC GROUPS AND LOW AND HIGH SES QUINTILES (ONLY SIGNIFICANT COEFFICIENTS REPORTED) ............................................................................................................ 220
TABLE 37. COUNTRIES WITH SMALLEST AND LARGEST R2 DIFFERENCES BETWEEN COEFFICIENTS OF STUDENT CHARACTERISTICS AND CLASSROOM/SCHOOL VECTORS IN PISA................................ 226
TABLE 38. COUNTRIES WITH SMALLEST AND LARGEST R2 DIFFERENCES BETWEEN COEFFICIENTS OF STUDENT CHARACTERISTICS AND CLASSROOM/SCHOOL VECTORS IN TIMSS............................. 227
TABLE 39. ESTIMATED OLS COEFFICIENTS OF PISA 2003 MATH ACHIEVEMENT SCORES ON SOCIO-ECONOMIC STATUS, SES QUINTILES, GNI PER CAPITA, AND COUNTRY FIXED EFFECTS ............. 247
TABLE 40. ESTIMATED OLS COEFFICIENTS OF PISA 2003 MATH ACHIEVEMENT SCORES ON SOCIO-ECONOMIC STATUS, SES QUINTILES, GNI PER CAPITA, GINI COEFFICIENTS, AND COUNTRY FIXED EFFECTS ........................................................................................................................................ 248
TABLE 41. ESTIMATED OLS COEFFICIENTS OF TIMSS 2003 MATH ACHIEVEMENT SCORES ON SOCIO-ECONOMIC STATUS, SES QUINTILES, GNI PER CAPITA, AND COUNTRY FIXED EFFECTS ............. 249
TABLE 42. OLS REGRESSION OF TIMSS 2003 MATH ACHIEVEMENT SCORES ON SOCIO-ECONOMIC STATUS, SES QUINTILES, GNI PER CAPITA, GINI COEFFICIENTS, AND COUNTRY FIXED EFFECTS250
TABLE 43. ESTIMATED OLS COEFFICIENTS OF TIMSS 2003 TEACHER PREPARATION INDEX ON SOCIO-ECONOMIC STATUS, SES QUINTILES, GNI PER CAPITA, AND COUNTRY FIXED EFFECTS ............. 251
TABLE 44. ESTIMATED OLS COEFFICIENTS OF TIMSS 2003 TEACHER PREPARATION INDEX (ISCED ONLY) ON SOCIO-ECONOMIC STATUS, SES QUINTILES, GNI PER CAPITA, AND COUNTRY FIXED EFFECTS ........................................................................................................................................ 252
TABLE 45. ESTIMATED OLS COEFFICIENTS OF TIMSS 2003 TEACHER PREPARATION INDEX ON SOCIO-ECONOMIC STATUS, SES QUINTILES, GNI PER CAPITA, GINI COEFFICIENTS, AND COUNTRY FIXED EFFECTS ........................................................................................................................................ 253

xv
TABLE 46. ESTIMATED OLS COEFFICIENTS OF TIMSS 2003 TEACHER PREPARATION INDEX (ISCED ONLY) ON SOCIO-ECONOMIC STATUS, SES QUINTILES, GNI PER CAPITA, GINI COEFFICIENTS, AND COUNTRY FIXED EFFECTS............................................................................................................. 254
TABLE 47. LOGIT REGRESSION PROBABILITIES OF HIGHER PISA GRADE LEVELS FOR SOCIO-ECONOMIC STATUS, SES QUINTILES, GNI PER CAPITA, AND COUNTRY FIXED EFFECTS ................................ 255
TABLE 48. LOGIT REGRESSION PROBABILITIES OF HIGHER PISA GRADE LEVELS FOR SOCIO-ECONOMIC STATUS, SES QUINTILES, GNI PER CAPITA, GINI COEFFICIENTS, AND COUNTRY FIXED EFFECTS 256
TABLE 49. ESTIMATED OLS COEFFICIENTS OF TIMSS 2003 OPPORTUNITIES TO LEARN (ALGEBRA) ON SOCIO-ECONOMIC STATUS, SES QUINTILES, GNI PER CAPITA, AND COUNTRY FIXED EFFECTS.. 257
TABLE 50. ESTIMATED OLS COEFFICIENTS OF TIMSS 2003 OPPORTUNITIES TO LEARN (ALGEBRA) ON SOCIO-ECONOMIC STATUS, SES QUINTILES, GNI PER CAPITA, GINI COEFFICIENTS, AND COUNTRY FIXED EFFECTS.............................................................................................................................. 258
TABLE 51. ESTIMATED OLS COEFFICIENTS OF TIMSS 2003 OPPORTUNITIES TO LEARN (ALGEBRA AND GEOMETRY) ON SOCIO-ECONOMIC STATUS, SES QUINTILES, GNI PER CAPITA, AND COUNTRY FIXED EFFECTS.............................................................................................................................. 259
TABLE 52. ESTIMATED OLS COEFFICIENTS OF TIMSS 2003 OPPORTUNITIES TO LEARN (ALGEBRA AND GEOMETRY) ON SOCIO-ECONOMIC STATUS, SES QUINTILES, GNI PER CAPITA, GINI COEFFICIENTS, AND COUNTRY FIXED EFFECTS ..................................................................................................... 260
TABLE 53. ESTIMATED OLS COEFFICIENTS OF PISA 2003 MATH ACHIEVEMENT SCORES ON STUDENT CHARACTERISTICS, CLASSROOM RESOURCES, AND SCHOOL CAPACITY IN JAPAN ....................... 262
TABLE 54. ESTIMATED OLS COEFFICIENTS OF TIMSS 2003 MATH ACHIEVEMENT SCORES ON STUDENT CHARACTERISTICS, CLASSROOM RESOURCES, AND SCHOOL CAPACITY IN JAPAN ....................... 265
TABLE 55. ESTIMATED OLS COEFFICIENTS OF PISA 2003 MATH ACHIEVEMENT SCORES ON STUDENT CHARACTERISTICS, CLASSROOM RESOURCES, AND SCHOOL CAPACITY IN SWEDEN.................... 268
TABLE 56. ESTIMATED OLS COEFFICIENTS OF TIMSS 2003 MATH ACHIEVEMENT SCORES ON STUDENT CHARACTERISTICS, CLASSROOM RESOURCES, AND SCHOOL CAPACITY IN SWEDEN.................... 271
TABLE 57. ESTIMATED OLS COEFFICIENTS OF PISA 2003 MATH ACHIEVEMENT SCORES ON STUDENT CHARACTERISTICS, CLASSROOM RESOURCES, AND SCHOOL CAPACITY IN AUSTRALIA............... 274
TABLE 58. ESTIMATED OLS COEFFICIENTS OF TIMSS 2003 MATH ACHIEVEMENT SCORES ON STUDENT CHARACTERISTICS, CLASSROOM RESOURCES, AND SCHOOL CAPACITY IN AUSTRALIA............... 277
TABLE 59. ESTIMATED OLS COEFFICIENTS OF PISA 2003 MATH ACHIEVEMENT SCORES ON STUDENT CHARACTERISTICS, CLASSROOM RESOURCES, AND SCHOOL CAPACITY IN ITALY........................ 280
TABLE 60. ESTIMATED OLS COEFFICIENTS OF TIMSS 2003 MATH ACHIEVEMENT SCORES ON STUDENT CHARACTERISTICS, CLASSROOM RESOURCES, AND SCHOOL CAPACITY IN ITALY........................ 283
TABLE 61. ESTIMATED OLS COEFFICIENTS OF PISA 2003 MATH ACHIEVEMENT SCORES ON STUDENT CHARACTERISTICS, CLASSROOM RESOURCES, AND SCHOOL CAPACITY IN HONG KONG ............. 286
TABLE 62. ESTIMATED OLS COEFFICIENTS OF TIMSS 2003 MATH ACHIEVEMENT SCORES ON STUDENT CHARACTERISTICS, CLASSROOM RESOURCES, AND SCHOOL CAPACITY IN HONG KONG ............. 289
TABLE 63. ESTIMATED OLS COEFFICIENTS OF PISA 2003 MATH ACHIEVEMENT SCORES ON STUDENT CHARACTERISTICS, CLASSROOM RESOURCES, AND SCHOOL CAPACITY IN THE UNITED STATES . 292
TABLE 64. ESTIMATED OLS COEFFICIENTS OF TIMSS 2003 MATH ACHIEVEMENT SCORES ON STUDENT CHARACTERISTICS, CLASSROOM RESOURCES, AND SCHOOL CAPACITY IN THE UNITED STATES . 295
TABLE 65. ESTIMATED OLS COEFFICIENTS OF PISA 2003 MATH ACHIEVEMENT SCORES ON STUDENT CHARACTERISTICS, CLASSROOM RESOURCES, AND SCHOOL CAPACITY IN HUNGARY ................. 299
TABLE 66. ESTIMATED OLS COEFFICIENTS OF TIMSS 2003 MATH ACHIEVEMENT SCORES ON STUDENT CHARACTERISTICS, CLASSROOM RESOURCES, AND SCHOOL CAPACITY IN HUNGARY ................. 302
TABLE 67. ESTIMATED OLS COEFFICIENTS OF PISA 2003 MATH ACHIEVEMENT SCORES ON STUDENT CHARACTERISTICS, CLASSROOM RESOURCES, AND SCHOOL CAPACITY IN THE SLOVAK REPUBLIC...................................................................................................................................................... 305
TABLE 68. ESTIMATED OLS COEFFICIENTS OF TIMSS 2003 MATH ACHIEVEMENT SCORES ON STUDENT CHARACTERISTICS, CLASSROOM RESOURCES, AND SCHOOL CAPACITY IN THE SLOVAK REPUBLIC...................................................................................................................................................... 308
TABLE 69. ESTIMATED OLS COEFFICIENTS OF PISA 2003 MATH ACHIEVEMENT SCORES ON STUDENT CHARACTERISTICS, CLASSROOM RESOURCES, AND SCHOOL CAPACITY IN LATVIA ..................... 311
xvi
TABLE 70. ESTIMATED OLS COEFFICIENTS OF TIMSS 2003 MATH ACHIEVEMENT SCORES ON STUDENT CHARACTERISTICS, CLASSROOM RESOURCES, AND SCHOOL CAPACITY IN LATVIA ..................... 314
TABLE 71. ESTIMATED OLS COEFFICIENTS OF PISA 2003 MATH ACHIEVEMENT SCORES ON STUDENT CHARACTERISTICS, CLASSROOM RESOURCES, AND SCHOOL CAPACITY IN THE RUSSIAN FEDERATION ................................................................................................................................. 317
TABLE 72. ESTIMATED OLS COEFFICIENTS OF TIMSS 2003 MATH ACHIEVEMENT SCORES ON STUDENT CHARACTERISTICS, CLASSROOM RESOURCES, AND SCHOOL CAPACITY IN THE RUSSIAN FEDERATION ................................................................................................................................. 320
TABLE 73. ESTIMATED OLS COEFFICIENTS OF PISA 2003 MATH ACHIEVEMENT SCORES ON STUDENT CHARACTERISTICS, CLASSROOM RESOURCES, AND SCHOOL CAPACITY IN TUNISIA .................... 323
TABLE 74. ESTIMATED OLS COEFFICIENTS OF TIMSS 2003 MATH ACHIEVEMENT SCORES ON STUDENT CHARACTERISTICS, CLASSROOM RESOURCES, AND SCHOOL CAPACITY IN TUNISIA .................... 326
TABLE 75. ESTIMATED OLS COEFFICIENTS OF PISA 2003 MATH ACHIEVEMENT SCORES ON STUDENT CHARACTERISTICS, CLASSROOM RESOURCES, AND SCHOOL CAPACITY IN JAPAN FOR LOW AND HIGH SES QUINTILES.................................................................................................................... 330
TABLE 76. ESTIMATED OLS COEFFICIENTS OF TIMSS 2003 MATH ACHIEVEMENT SCORES ON STUDENT CHARACTERISTICS, CLASSROOM RESOURCES, AND SCHOOL CAPACITY IN JAPAN FOR LOW AND HIGH SES QUINTILES.................................................................................................................... 333
TABLE 77. ESTIMATED OLS COEFFICIENTS OF PISA 2003 MATH ACHIEVEMENT SCORES ON STUDENT CHARACTERISTICS, CLASSROOM RESOURCES, AND SCHOOL CAPACITY IN SWEDEN FOR LOW AND HIGH SES QUINTILES.................................................................................................................... 336
TABLE 78. ESTIMATED OLS COEFFICIENTS OF TIMSS 2003 MATH ACHIEVEMENT SCORES ON STUDENT CHARACTERISTICS, CLASSROOM RESOURCES, AND SCHOOL CAPACITY IN SWEDEN FOR LOW AND HIGH SES QUINTILES.................................................................................................................... 339
TABLE 79. ESTIMATED OLS COEFFICIENTS OF PISA 2003 MATH ACHIEVEMENT SCORES ON STUDENT CHARACTERISTICS, CLASSROOM RESOURCES, AND SCHOOL CAPACITY IN AUSTRALIA FOR LOW AND HIGH SES QUINTILES ............................................................................................................ 342
TABLE 80. ESTIMATED OLS COEFFICIENTS OF TIMSS 2003 MATH ACHIEVEMENT SCORES ON STUDENT CHARACTERISTICS, CLASSROOM RESOURCES, AND SCHOOL CAPACITY IN AUSTRALIA FOR LOW AND HIGH SES QUINTILES ............................................................................................................ 345
TABLE 81. ESTIMATED OLS COEFFICIENTS OF PISA 2003 MATH ACHIEVEMENT SCORES ON STUDENT CHARACTERISTICS, CLASSROOM RESOURCES, AND SCHOOL CAPACITY IN ITALY FOR LOW AND HIGH SES QUINTILES.................................................................................................................... 348
TABLE 82. ESTIMATED OLS COEFFICIENTS OF TIMSS 2003 MATH ACHIEVEMENT SCORES ON STUDENT CHARACTERISTICS, CLASSROOM RESOURCES, AND SCHOOL CAPACITY IN ITALY FOR LOW AND HIGH SES QUINTILES.................................................................................................................... 351
TABLE 83. ESTIMATED OLS COEFFICIENTS OF PISA 2003 MATH ACHIEVEMENT SCORES ON STUDENT CHARACTERISTICS, CLASSROOM RESOURCES, AND SCHOOL CAPACITY IN HONG KONG FOR LOW AND HIGH SES QUINTILES ............................................................................................................ 353
TABLE 84. ESTIMATED OLS COEFFICIENTS OF TIMSS 2003 MATH ACHIEVEMENT SCORES ON STUDENT CHARACTERISTICS, CLASSROOM RESOURCES, AND SCHOOL CAPACITY IN HONG KONG FOR LOW AND HIGH SES QUINTILES ............................................................................................................ 356
TABLE 85. ESTIMATED OLS COEFFICIENTS OF PISA 2003 MATH ACHIEVEMENT SCORES ON STUDENT CHARACTERISTICS, CLASSROOM RESOURCES, AND SCHOOL CAPACITY IN THE UNITED STATES FOR LOW AND HIGH SES QUINTILES ................................................................................................... 359
TABLE 86. ESTIMATED OLS COEFFICIENTS OF TIMSS 2003 MATH ACHIEVEMENT SCORES ON STUDENT CHARACTERISTICS, CLASSROOM RESOURCES, AND SCHOOL CAPACITY IN THE UNITED STATES FOR LOW AND HIGH SES QUINTILES ................................................................................................... 362
TABLE 87. ESTIMATED OLS COEFFICIENTS OF PISA 2003 MATH ACHIEVEMENT SCORES ON STUDENT CHARACTERISTICS, CLASSROOM RESOURCES, AND SCHOOL CAPACITY IN HUNGARY FOR LOW AND HIGH SES QUINTILES.................................................................................................................... 366
TABLE 88. ESTIMATED OLS COEFFICIENTS OF TIMSS 2003 MATH ACHIEVEMENT SCORES ON STUDENT CHARACTERISTICS, CLASSROOM RESOURCES, AND SCHOOL CAPACITY IN HUNGARY FOR LOW AND HIGH SES QUINTILES.................................................................................................................... 369

xvii
TABLE 89. ESTIMATED OLS COEFFICIENTS OF PISA 2003 MATH ACHIEVEMENT SCORES ON STUDENT CHARACTERISTICS, CLASSROOM RESOURCES, AND SCHOOL CAPACITY IN THE SLOVAK REPUBLIC FOR LOW AND HIGH SES QUINTILES ............................................................................................ 372
TABLE 90. ESTIMATED OLS COEFFICIENTS OF TIMSS 2003 MATH ACHIEVEMENT SCORES ON STUDENT CHARACTERISTICS, CLASSROOM RESOURCES, AND SCHOOL CAPACITY IN THE SLOVAK REPUBLIC FOR LOW AND HIGH SES QUINTILES ............................................................................................ 375
TABLE 91. ESTIMATED OLS COEFFICIENTS OF PISA 2003 MATH ACHIEVEMENT SCORES ON STUDENT CHARACTERISTICS, CLASSROOM RESOURCES, AND SCHOOL CAPACITY IN LATVIA FOR LOW AND HIGH SES QUINTILES.................................................................................................................... 378
TABLE 92. ESTIMATED OLS COEFFICIENTS OF TIMSS 2003 MATH ACHIEVEMENT SCORES ON STUDENT CHARACTERISTICS, CLASSROOM RESOURCES, AND SCHOOL CAPACITY IN LATVIA FOR LOW AND HIGH SES QUINTILES.................................................................................................................... 381
TABLE 93. ESTIMATED OLS COEFFICIENTS OF PISA 2003 MATH ACHIEVEMENT SCORES ON STUDENT CHARACTERISTICS, CLASSROOM RESOURCES, AND SCHOOL CAPACITY IN THE RUSSIAN FEDERATION FOR LOW AND HIGH SES QUINTILES ....................................................................... 384
TABLE 94. ESTIMATED OLS COEFFICIENTS OF TIMSS 2003 MATH ACHIEVEMENT SCORES ON STUDENT CHARACTERISTICS, CLASSROOM RESOURCES, AND SCHOOL CAPACITY IN THE RUSSIAN FEDERATION FOR LOW AND HIGH SES QUINTILES ....................................................................... 387
TABLE 95. ESTIMATED OLS COEFFICIENTS OF PISA 2003 MATH ACHIEVEMENT SCORES ON STUDENT CHARACTERISTICS, CLASSROOM RESOURCES, AND SCHOOL CAPACITY IN TUNISIA FOR LOW AND HIGH SES QUINTILES.................................................................................................................... 390
TABLE 96. ESTIMATED OLS COEFFICIENTS OF TIMSS 2003 MATH ACHIEVEMENT SCORES ON STUDENT CHARACTERISTICS, CLASSROOM RESOURCES, AND SCHOOL CAPACITY IN TUNISIA FOR LOW AND HIGH SES QUINTILES.................................................................................................................... 393

xviii
Acronyms
GNI Gross National Income IEA International Association for the Evaluation of Educational
Achievement ISCED International Standard Classification of Education NAEP National Assessment of Education Progress (United States) OECD Organization for Economic Cooperation and Development OTL Opportunities to Learn PIRLS Progress in International Reading Literacy Study PISA Program for International Student Assessment TIMSS Trends in International Math and Science Study TP Teacher Preparation

1
I never teach my pupils; I only attempt to provide the conditions in which they can learn.
- Albert Einstein
Chapter 1. Education within a National Economic Context Einstein’s epigraph focuses on the importance of context for learning. Since
Einstein’s time, the education research community has documented relationships
between several specific contexts of education and students and their learning
processes: family background, teacher quality, opportunities to learn, classroom and
school resources, and broader economic conditions of states and countries. However,
further questions remain about the complex interactions between these contexts, both
in the level at which they operate (national, state, or local) and their relative
importance for different students at these levels. For instance, students with lower
levels of socio-economic status (SES) might attend schools with underprepared
teachers when their achievement could benefit from an increased investment in teacher
preparation. Conversely, their higher SES peers might have better prepared teachers.
The different opportunities to learn of these peers could relate to their higher academic
achievement. Such examples also occur within a national economic context, first
defined by per capita country income and then, by the dispersion of income within a
country. This study takes Einstein’s notion of context to its logical conclusion by
identifying the specific factors that comprise the best learner-centered environments

2
for different types of students having disparate family and national economic
conditions.
Examining how education operates within a national economic context is a
timely pursuit. Income inequality has increased in a number of countries in the past
decades, a phenomenon known as the great U-turn (Alderson & Nielsen, 2002).
During early industrialization, income inequality initially increased, but as
industrialization became institutionalized, these income disparities decreased, a
change called the Kuznet’s curve. As societies enter late and post-industrial phases,
income inequality once again increases (Alderson & Nielsen, 2002). Jeffery Sachs
(2007) identifies increasing economic inequality, both within and between countries,
as a major source for social and environmental problems facing future generations,
including for the field of education. Given the importance of individual student SES in
education, one can specifically question whether country income inequality
exacerbates the already strong relationship between individual SES and educational
achievement (Coleman, 1966; Rothstein, 2004).
Based on the increasing prevalence of income inequality and the importance of
student background, this study examines three different types of economic disparities:
inequality between countries, inequality within countries, and inequality among
students. Figure 1 illustrates these three levels of economic differences, as well as
school resources, a focus of attention in the second part of this study. Between-country
inequality consists of differences in overall income, for example, the large disparity in
Gross National Income (GNI) per capita between the United States and Mexico.
Within-country inequality concerns the distribution of income in a particular country,
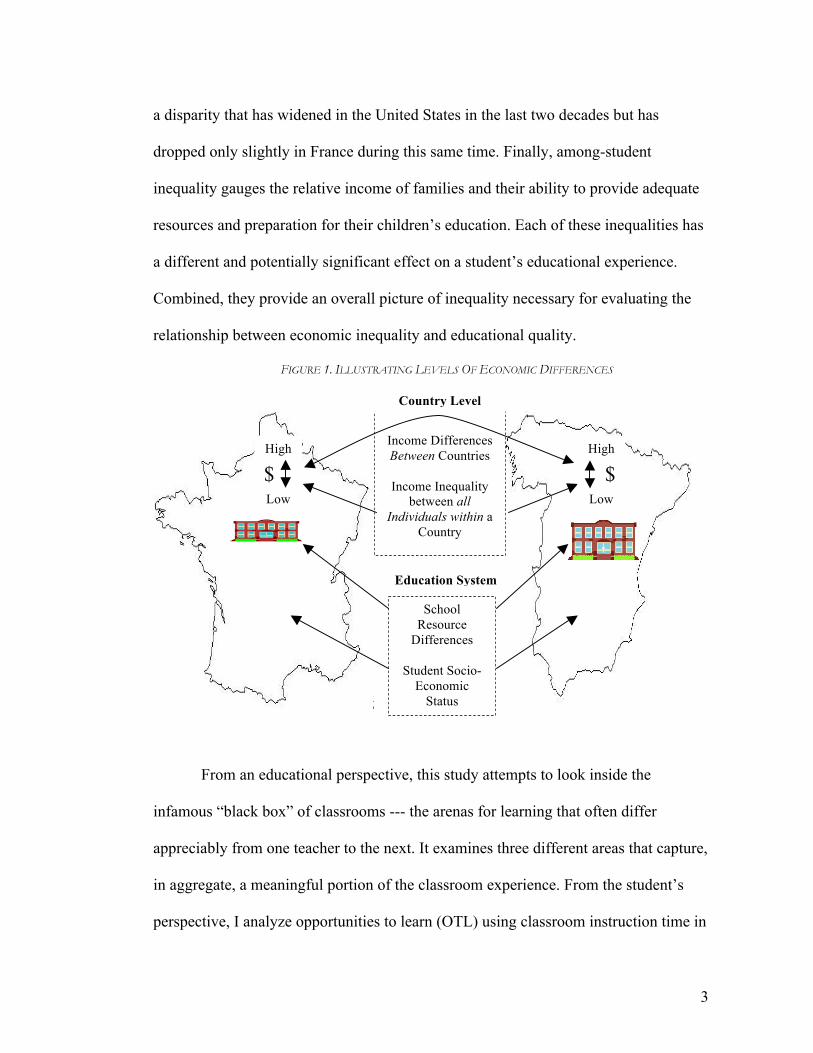
3
a disparity that has widened in the United States in the last two decades but has
dropped only slightly in France during this same time. Finally, among-student
inequality gauges the relative income of families and their ability to provide adequate
resources and preparation for their children’s education. Each of these inequalities has
a different and potentially significant effect on a student’s educational experience.
Combined, they provide an overall picture of inequality necessary for evaluating the
relationship between economic inequality and educational quality.
FIGURE 1. ILLUSTRATING LEVELS OF ECONOMIC DIFFERENCES
From an educational perspective, this study attempts to look inside the
infamous “black box” of classrooms --- the arenas for learning that often differ
appreciably from one teacher to the next. It examines three different areas that capture,
in aggregate, a meaningful portion of the classroom experience. From the student’s
perspective, I analyze opportunities to learn (OTL) using classroom instruction time in
High
$
Low
Income Differences Between Countries
Income Inequality
between all Individuals within a
Country
School Resource
Differences Student Socio-
Economic Status
Education System
Country Level
High
$
Low

4
content areas to reveal how students spend time in class. I also investigate the levels of
teacher preparation to understand if teachers have the necessary content and
pedagogical knowledge to serve as foundations for their classroom approaches.
Finally, I examine OTL and teacher preparation both as outcomes in themselves and
as predictors of achievement.
Unfortunately, these measures do not directly capture the quality of curriculum
delivery; they present only the conditions through which delivery occurs. Therefore, I
also use student assessment scores to measure the results of the educational experience
for students. Figure 2 – Figure 5 show the correlations between mean student
achievement scores with overall country wealth and income distribution within
countries. The achievement scores for countries come from two international
assessments analyzed here, the Program for International Student Assessment (PISA)
and the Trends in International Math and Science Study (TIMSS). All four charts
show high correlations between achievement scores and economic conditions.
Specifically, income per capita correlates positively with achievement, so students
living in countries with higher income perform better (without accounting for other
factors). Conversely, income inequality correlates negatively with student
achievement on both tests. These correlations form the basis for asking further
questions about the complex interactions between countries, student SES, and
education quality.

5
FIGURE 2. MEAN MATHEMATICS ACHIEVEMENT ON PISA 2003 AND INCOME PER CAPITA (2003), BY COUNTRY

6
FIGURE 3. MEAN MATHEMATICS ACHIEVEMENT ON PISA 2003 AND GINI COEFFICIENTS, BY COUNTRY

7
FIGURE 4. MEAN MATHEMATICS ACHIEVEMENT ON TIMSS 2003 AND GINI COEFFICIENTS, BY COUNTRY

8
FIGURE 5. MEAN MATHEMATICS ACHIEVEMENT ON TIMSS 2003 AND GINI COEFFICIENTS, BY COUNTRY
9
Conceptualizing Relationships between Economic Conditions and Factors of Educational Quality
Robert Merton (1957) offers a method for distinguishing between levels of
sociological theories that applies to this study. He differentiates between grand,
abstract theories with no empirical basis, middle theories that integrate theory and
empirical findings, and narrow data collection devoid of theoretical bases (Merton,
1957). I amend his approach by referring to macro, meso, and micro theories and their
roles within this study. A macro theory, such as Marxism, remains difficult if not
impossible to empirically test. This study does not test macro-level theories because
the analysis and findings are descriptive, not causal. The findings help identify
relationships between income inequality and education rather than attribute causality
for the effects on education of policy decisions about country-level income
distribution. However, the conclusion does present suggests some future research that
could provide more information about the role of income inequality in education,
which in turn could lead to theory-building on the macro level.
The focus here remains primarily on meso- and micro-level theories. The
meso-level theories tested here concern the relationships between the vectors such as
Coleman (1966) and Rothstein’s (2004) theory of SES as the primary explanatory
variable for student achievement and Heyneman and Loxley’s (1983) theory that
schooling has a more important role for students in lower income per capita countries
than SES. This study also uses micro-level theories that posit relationships between
specific variables. For example, this study tests the theory that income inequality
relates differently to achievement for students at different SES levels. Based on this

10
approach, the conceptual framework and research questions focus on the micro-level
variable relationships and the meso-level theoretical predictions between vectors of
education and economic conditions.
This study builds upon a baseline of research knowledge about the
relationships between specific economic conditions, educational factors, and student
achievement. Specifically, researchers have shown that country income per capita,
increased teacher preparation, more opportunities to learn (OTL), and higher student
SES relate positively to student achievement (M. Chiu & L. Khoo, 2005; Darling–
Hammond, 2000; Rothstein, 2004; Schmidt, et al., 2001). Chiu and Khoo (2005) find
that income inequality correlates negatively with student achievement on average, and
De Gregorio and Wha-Lee (2002) find that it relates negatively to attainment levels.
However, some questions remain unanswered, such as whether educational factors
relate in similar ways to lower and higher SES students and whether the relationships
differ in economically different countries. Furthermore, if country-level inequalities do
relate to different outcomes for different SES students, what other features of the
educational contexts in these countries (such as class size or school resources) relate
more to achievement for students at difference SES levels? This study examines these
questions from both an international and within country perspective.
Some hypotheses emerge for these research questions based upon and
expanded from previous research. First, Chiu and Khoo (2005) and Gregorio and
Wha-Lee (2002) have related income inequality negatively to educational outcomes,
but not for students in different SES brackets. Assuming that higher SES students in
more-unequal countries receive a larger share of educational resources, I hypothesize

11
that high SES students will have higher achievement levels, more prepared teachers,
and more OTL than their peers in more-equal countries. Conversely, low SES students
would receive fewer resources in this model, leading to lower achievement levels, less
prepared teachers, and fewer OTL. For differences in relationships between schooling
and achievement in different countries, this study tests Heyneman and Loxely’s (1983)
theory that schooling matters more in lower income per capita countries. Additionally,
I hypothesize that student SES relates more to achievement in unequal countries where
family background varies more, while schooling matters more in more-equal countries
where SES presumably does not vary as greatly.
Scope of the Study This study uses data from two international achievement tests (PISA and
TIMSS) that provide the educational data and background information necessary for
addressing the research questions. The World Bank provides information on income
per capita and income inequality for the economic portion of the analysis. Ideally, this
study would use longitudinal data linking each student to a classroom to determine the
effect of teachers, classrooms, schools, and country contexts on student performance.
These data do not yet exist on an international level. Therefore, the two cross-sectional
datasets provide the education quality measures outlined above as well as extensive
information on students, teachers, and schools that permit a tiered analysis of
education settings and macro-level economic indicators.
12
Using the two datasets of PISA and TIMSS also offers the benefits of
comparing results between them to more strongly confirm hypotheses. Alternatively,
different findings between the tests can raise questions about why differences occur
and what kinds of different information each dataset provides. Both the first PISA
2000 study and earlier TIMSS findings confirmed that “only around one-tenth of the
total variation in student performance in PISA lies between countries,” meaning the
remaining variation occurs within countries (OECD, 2001, p. 51). This finding
provides the rationale for not only using two datasets but also for performing two sets
of analyses, first at the international level and, then, within countries. Thus, this study
design attempts to improve validity by using multiple datasets and examining variance
both between and within countries, but it does not offer causal explanations of the
relationships between income inequality and educational factors.
Defining Terms
This study employs economic terms at both the country level and the student
level. At the country level, income per capita refers to the World Bank’s measure of
Gross National Income (GNI) per capita. This measure potentially improves upon
previous versions of Gross Domestic Product (GDP) per capita by using income to
better capture the average spending power and quality of life for families in a
particular country. GNI per capita serves best as an international comparative measure
showing the relative economic power of citizens in a particular country, weighted for
comparability across countries as discussed further in the methods.
Income inequality at the country level is measured here using the Gini index.
The Hong Kong Legislative Secretariat (2005) produced a clear description of its
calculation. Briefly, the Gini coefficient, named for Corrado Gini, measures the
13
relative income inequality in a country by plotting income on a graph, with a resulting
coefficient of 0 representing perfect income equality and a result of 1 representing
perfect income inequality. At points in this analysis, the Gini index is used, in which
the Gini is converted to a scale from 0-100. The Gini coefficient is not perfect for two
main reasons. First, it is not calculated every year for every country, so the years
closest to 2003 from the World Bank database suffice. Second, some countries
calculate income at the family level while others calculate it using individual data;
therefore, comparisons are not exactly “apples to apples.” For the purposes of this
study, the Gini coefficient does differentiate on a broader level between countries
within different bands of income inequality.
Within education, the three variables of student SES, OTL, and teacher
preparation merit discussion. Student SES is an essential variable in this study and has
evolved greatly over the past half-century. The literature review offers a detailed
description of the SES construct and the methodology discusses the operationalization
of SES in both PISA and TIMSS. PISA does offer a slightly stronger SES variable
when compared to the construct models from the literature.
OTL and teacher preparation both differ between PISA and TIMSS, thus
demonstrating another difference in the tests. Since PISA does not include teacher-
level data and the principal level data have too many missing values for teachers,
teacher preparation can only be analyzed using TIMSS data. For OTL, I use a coarse
proxy of grade level for PISA, while TIMSS provides a more detailed metric of the
amount of time spent on math topics (algebra and geometry here) in eighth grade math
classrooms. Schmidt et al. (2001) have already shown that more OTL in TIMSS

14
relates to better student performance, so this study tests whether different students
have access to more OTL. The literature review and methodology discuss each of
these variables in more depth.
Summary Einstein’s belief in the importance of the learning environment provides the
motivation for this study that compares relationships of different contexts for different
types of students. Previous research has already identified important relationships
between both economic and educational factors important for students, but a dearth of
information exists regarding the interaction between these factors for different
students. This study identifies specific interactions of interest using meso- and micro-
level theories to develop hypotheses about potential relationships. Then, the study tests
the interactions between student SES, country economic conditions, and educational
factors using data from two international assessments. The findings aim to further
describe the similarities and differences in optimal learning situations for different
students.
Organization of the Dissertation
This dissertation consists of seven chapters. Chapter 1 has introduced the
problem of understanding the interactions between country economic contexts, student
SES, and education factors that contribute to higher achievement for students. Chapter
2 establishes the research base showing that particular contextual factors for education
do matter, opening the possibility for further specifying how and for whom they
matter most. Chapter 3 includes the conceptual framework, research design, data

15
descriptions, and methodology describing the research approach for identifying how
education context functions. Chapters 4 and 5 present results and findings from Part I
of the research design, the international analyses of achievement (Chapter 4) and
teacher preparation and opportunities to learn (Chapter 5). Chapter 6 describes the
results and findings from Part II of the study, national level education production
functions for eleven economically different countries. Finally, Chapter 7 presents
conclusions from the empirical chapters and suggests directions for future research.
16
Chapter 2: Linking Economic Conditions with Educational Factors and Outcomes
The title of this study, How Does Context Matter?, indicates that the education
research community has previously demonstrated that context does indeed matter.
Whereas context does seem to matter, a main debate in education research for the past
half-century centers on which context—family background or schools (Coleman,
1966; Heyneman & Loxley, 1983; Rothstein, 2004). The short answer is that both
matter, but weighing one over the other leads to different policy recommendations.
One perspective emerged from Coleman’s (1966) seminal study, Equality of
Educational Opportunity (the Coleman Report), that found strong relationships
between student SES and achievement. Rothstein’s (2004) work continues this
theoretical approach by proposing that the overarching effect of student background
precludes schools from narrowing achievement gaps between students with different
SES and that larger social programs are necessary to effectively address the issue.
From the perspective that schools matter, Heyneman and Loxley (1983) found that
schools significantly relate to student achievement in lower income countries. Schmidt
(2001) later outlined the relationships between schools and achievement using TIMSS
data. Researchers have also found links between myriad classroom factors and
achievement, including two areas salient to this study, teacher preparation (Darling–
Hammond, 2000) and opportunities to learn (Schmidt, McKnight, Cogan, & Jakwerth,
1999).
17
Researchers, therefore, have compiled studies, findings, and policy
recommendations supporting both sides of the family background versus schooling
debate. This study addresses the debate from two angles. First, by examining the
interaction between country-level inequality and individual student SES, this study
adds a new layer of economic context (income inequality) to previous analyses of SES
and achievement. This line of inquiry follows the Coleman-Rothstein trajectory of
understanding the relationships between family background and student achievement.
However, this study also analyzes the relationship of SES with multiple factors of
educational quality in schools and classrooms: student achievement, teacher
preparation, and opportunities to learn. Considering these traditional educational
inputs as outcomes offers a view of both the economic systems influencing student
access to education based on SES and of the elements of schooling that researchers
have found important.
This literature review presents research in three main areas: the role of family
background and SES on educational outcomes; the relationship among country-level
income, income inequality, and student achievement; and two elements of schooling,
teacher preparation and opportunities to learn, that represent important factors for
student achievement. Although much research in education focuses on the system in
the United States, the US remains a global outlier because it has an unusual
combination of high wealth and high income inequality. Therefore, when researchers
examine education internationally, especially in developing countries, domestic US
education findings and approaches might not apply. Therefore, this literature review
presents domestic studies of education systems in other countries as well as

18
comparative studies. The discussion of SES includes its development as a construct
and the measurements of its relationship with student outcomes, especially
achievement.
Economic Relationships with Education Factors
The Coleman report (1966) brought attention to the relationship of student
achievement and student socio-economic status (SES) during the Civil Rights
movement. Almost forty years later, Rothstein’s (2004) book, Class and Schools,
reconfirmed the basic tenet that lower SES students have, on average, lower levels of
achievement than their higher SES peers. However, the intervening generation of
educational research produced additional evidence both in the United States and
abroad. For instance, Heyneman and Loxely (1983) suggested that schooling does
matter in low-income countries for low SES students in addition to their low SES
status. These findings from an international study demonstrate the potential for
educational differences in economically different countries and the subsequent need
for research beyond industrial countries (especially the United States) that receive the
most scholarly attention. A comprehensive review of the emergence and development
of the concept of SES remains outside the scope of this study. The sample of studies
reviewed, however, provides a foundation for understanding the measurement of
student SES and its relationship to student achievement in both the United States and
other countries, with a particular focus on findings using PISA and TIMSS.
Research has identified student SES as an important factor contributing to a
myriad of outcomes in the fields of health, child development, and education (Schulz,
19
2005, p. 2). Within education, Rothstein (2004) provides the justification, if not
imperative, for studying SES, stating that “the fact that children's skills can so clearly
be predicted by their race and family economic status is a direct challenge to our
democratic ideals.” Schulz and Rothstein demonstrate the importance of
understanding SES both as a factor in education and in its relationship to larger social
topics. Before examining these relationships, one must first consider the complexities
of the “construct” of socio-economic status and its measurement. I also revisit this
topic in the methodology of this study when analyzing the TIMSS and PISA
approaches to SES.
Measuring Student Socio-Economic Status
In education, capturing student SES emerges from the need to differentiate
between the family background of students and the effects of their schooling. By more
precisely measuring family background, educators can understand how to organize
school systems to mediate SES differences. Buchmann (2002) details the expansion of
the concept of SES from early studies relating a father’s education level and
occupational status to his son’s attainment and the role of all three in the son’s
occupation status. Schulz (2005) notes that higher SES parents offer more “financial
support and home resources for individual learning” and “a more stimulating home
environment to promote cognitive development” p. 3. These paternal measures have
evolved to include more specificity than the original SES constructs because current
measures include both parents’ education levels, their occupational status, and the
family income (Buchmann, 2002). This section traces the development of the SES
construct to provide a basis for understanding its importance in education,

20
supplemented by comments detailing how TIMSS and PISA developers operationalize
SES in their student surveys.
Marks et al. (2006) summarize previous research on SES by identifying four
areas in which SES relates to education: material, social, and cultural resources along
with school systems. Material resources include income and wealth, but also home
possessions such as study desks, books, and computers. Coleman (1987) explains
social resources, “social capital” in Coleman’s terms, as “the norms, the social
networks, and the relationships between adults and children that are of value for the
child’s’ growing up” (p. 36). These relationships extend beyond a mother’s
educational level, for instance, to her level of involvement in her child’s education in
all of its manifestations (Coleman, 1987). Marks et al. (2006) draw on Bourdieu and
Passeron’s (1977) theory of cultural capital, finding a greater link between cultural
capital and achievement on PISA than between social capital and PISA scores.
(Bourdieu’s influential model is outlined in further detail below). Finally, Marks et al.
(2006) also identify school level SES as an important feature contributing to student
achievement. This study does not directly measure school SES but uses school
resources and classroom measures to distill the relationships between students, family
background, and schooling. To properly examine these relationships in the literature, a
brief review of the theoretical development of the SES construct is appropriate.
One important theoretical contribution that helped shape the expansion of the
SES construct comes from Bourdieu’s (1977) concept of cultural capital. Lamont and
Lareau (1988) propose a definition of cultural capital as "widely shared, high status
cultural signals (attitudes, preferences, formal knowledge, behaviors, goods, and

21
credentials) used for social and cultural exclusion" (p. 156). This definition, according
to Roscigno and Ainsworth-Darnell (1999), highlights the exclusionary character of
cultural capital at the heart of Bourdieu's framework. The dominant class uses three
types of capital as signaling mechanisms to preserve class distinctions: embodied,
objectified, and institutionalized (Bourdieu & Passeron, 1977). “Embodied capital”
consists of the properties of self that one acquires, consciously or not, over time and
primarily through the family and the surrounding social institutions. “Objectified
capital” refers to physical artifacts such as books or works of art that one owns and is
able to interpret as cultural symbols by using preexisting knowledge of cultural codes.
Finally, “institutionalized cultural capital” consists of qualifications or credentials,
primarily from the academic realm, that serve as markers for possible conversion to
economic capital in the labor market. Bourdieu and Passeron (1977) further discuss
cultural capital as a means of reproducing class disparities across generations;
however, the analysis here only points to this theory as an important source for a more
through understanding of the contribution of different attributes of family environment
on a student’s a priori preparation for the schooling experience.
Buchmann (2002) outlines three SES categories that map onto Bourdieu’s
typology of cultural capital in useful ways. First, parental education represents the
institutional dimension of cultural capital; it relates to the overall value a family places
on education including its propensity to pay for higher levels of education in the long
term. Parental occupation falls under both the embodied and institutional factors of
cultural capital in that a parent’s job most likely impacts home life and the embodied
trajectory of cultural knowledge that a child experiences. Additionally, the relative

22
status of a job serves as an institutional marker. Finally, parental income relates to
objectified cultural capital indirectly as families with increasing levels of disposable
income populate their homes with books, art, technology, and other cultural artifacts
that provide stimulus throughout a student’s adolescence.
In conjunction with the evolution of SES theory, including Bourdieu’s
contribution, researchers also developed more precise measures to survey students (in
the case of education) about their family backgrounds. Unfortunately, because many
survey data collections in education gather information from students, their responses
about parental issues vary in validity. Older students have higher likelihoods of
knowing parental histories, but surveys of any individuals concerning income have
lower levels of accuracy (Buchmann, 2002). To address these issues, researchers have
developed measures and, when needed, proxies for the three main components of SES:
parental occupation, education, and income.
International research primarily uses two scales for measuring occupations and
their relative prestige, Standard International Occupational Prestige (SIOP) and the
International Socioeconomic Index (ISEI) of occupational status (Buchmann, 2002).
Buchmann (2002) notes that while this measure previously pertained specifically to
fathers, maternal occupational has emerged as an independent predictor of both
student achievement and attainment. As discussed in the methodology section below,
PISA includes items for both maternal and paternal occupation status using the ISEI
(OECD, 2005). However, TIMSS does not collect parental occupation as part of its
student survey (Martin, Mullis, & Chrostowski, 2004).

23
In the area of parental education, researchers have developed two
classifications—the International Standard Classification of Education (ISCED) and
the Comparative Analysis of Social Mobility in Industrial Nations (CASMIN)
(Buchmann, 2002). Both ISCED and CASMIN are scales upon which countries can
map their education systems to standardize levels of attainment for cross-national
comparison. For the purposes of measuring SES, a mother’s level of education has a
greater influence on younger students although the mother’s and father’s education
remain highly correlated (Buchmann, 2002). While student self-reports of parental
education levels certainly vary in accuracy, the measurement of this element of SES
does not require a proxy. However, den Broeck (2003) found that the students “who
don’t know the educational level of their parents or give no answer on a question
about the educational level of their parents are a select group, namely the students with
parents with less formal education” and that “about one third of the students
overestimates the educational level of their parents” (p. 182-183). Ideally, researchers
include multiple measures of education and the other attributes of SES discussed here
to mitigate these biases.
Data about family income also have measurement challenges for slightly
different reasons. People, in general, are more reluctant to respond to income
questions and when they do, reliability varies (Buchmann, 2002). Therefore,
researchers have resorted to proxies including home possessions or home structural
characteristics (Buchmann, 2002). A classic example often used in education is the
number of books in the home, although researchers note that this measure accounts for
long-term accumulated wealth as opposed to short-term actual income (Buchmann,
24
2002). Both PISA and TIMSS include a measure of books in the home along with
other home possessions (Martin, et al., 2004; OECD, 2005).
Buchmann (2003) offers further avenues for better measurement of family
background by including family background and social capital along with Bourdieu’s
cultural capital, an approach similar to Marks et al. (2006). Buchmann (2003)
identifies family size and the number of parents living at home as important factors in
a student’s home life. Buchmann (2003) then defines social capital as “capital that
inheres in social relationships,” to differentiate it from cultural capital or “knowledge
of socially-valued cultural cues” (p. 13). TIMSS and PISA both collect various types
of these data, with PISA collecting more data within the social category capital.
Although an outline of theoretical rationales used when measuring the SES construct
appears here, the methodology section (Chapter 3) contains more detail about the
operationalization of SES in TIMSS, PISA, and this study.
Relationships Between SES and Educational Factors
Research on the relationship between SES and education often examines three
different educational factors: access, attainment, and achievement. In developed
countries, the issue of access to schools has receded as education has become widely
available (Baker & LeTendre, 2005). Instead, access now usually applies as a concept
when discussing a student’s access to higher-quality education, an issue addressed in
this study through the analysis of TP and OTL.
Other strands of research focus on educational attainment in relation to SES,
disentangling “primary effects” from “secondary effects.” (Breen, Luijkx, Müller, &
Pollak, 2005) describes the difference:

25
Primary effects of social origin result from differences in school performance
of children from different class backgrounds, while secondary effects are due
to different propensities prevailing in different classes to progress to the next
educational step – even at the same level of performance. (p. 5)
This study examines primary effects of student achievement instead of attainment.
With the expansion of international assessments, researchers can now study SES in
relation to student achievement, identifying links between family backgrounds and the
abilities students develop in school. However, this study focuses on the interaction
between country-level economic inequality, student SES, and aspects of educational
quality. Almost no research combines all three elements; therefore, this literature
review presents studies that link SES or country-level economic conditions to student
achievement.
From the family background (SES) perspective, Lytton, H., and Pyryt, M.
(1998) find that, for students in grades three and six in Calgary, Canada, family
income explained around 45 percent of variation on mathematics and language arts
achievement tests. The same study showed that only 3 to 6 percent of the variation
came from school-based factors (Lytton & Pyryt, 1998). Willms, D. (2003) expands
on this relationship to include a wide variety of social outcomes beginning in early
childhood, where a child of low SES would have a receptive vocabulary about 9 points
lower than a high SES child, a difference that relates to the skills a child possesses
upon school entry. In Australia, Ainley, J. (2000), finds that about 32 percent of lowest
SES group students would have achievement scores in the lowest 20 percent of
achievement scores, compared to eight percent high SES students. This dissertation

26
adopts an approach similar to Ainley’s, comparing achievement results between lower
and higher socio-economic students after grouping students into quintiles based on
SES.
In the United States, McKinsey (2009) finds a relationship between family
income and years of learning using results from NAEP, where a student receiving a
federally subsized lunch (a measure of family income) lags approximately two years
of learning behind a peer receiving no subsidy (from a wealthier family). The
relationship between income and achievement remains high even in states with the
highest overall test scores, such as Massachusetts, where “students eligible for free
lunch are six times more likely to be ‘below basic’ in grade 4 math than ineligible
students” (McKinsey & Company, 2009, p. 40). McKinsey (2009) also finds that the
gap in achievement based on income in the United States persists throughout
education. Schneider (2008) disputes this proposition, concluding that “parents’
influence decreases as children get older” (p. 522). This intramural debate underscores
the larger point that SES plays a massive role in a student’s educational prospects.
Some of the above studies also mention the effect of schools on achievement.
The school-level analysis divides into two categories: studies using the SES of schools
and those examining school and classroom inputs. The school-level SES arguments
offer the perspective that schools do matter for student achievement, but schools might
matter more because of the aggregation of family background characteristics than due
to the educational opportunities at the schools. In the United States, Histead, D. &
Spicuzza, R. (2003) determine that, on a grade 3 reading assessment in Minnesota, the
highest performing schools with poverty at 80% or more scored lower than the schools

27
with poverty 30% or less, showing a large difference in performance at the school
level.
Using United States data from an international assessment, Bracey (2003) finds
from the PIRLS study that schools with less than 10% of the students eligible for free
school meals had an average score one standard deviation high than schools with 75%
of students eligible for free school meals. International research confirms the
importance of school level SES. In Canada, “students in schools with higher mean
SES performed significantly better in mathematics, reading and writing. And these
effects were over and above those of individual SES” (Ma & Klinger, 2000, p. 50).
This strand of research confirms the importance of family background in aggregate in
addition to its relationship with achievement for an individual student. While this
dissertation only empirically addresses SES at the student level, it does examine
multiple school inputs and their relationships to student achievement.
Relating SES and Achievement on PISA and TIMSS
Turning to research using the datasets analyzed in this study, Chiu and Khoo
(2005) uncover several links between elements of SES and achievement in PISA. The
authors find that the mother’s education significantly relates to achievement in
mathematics, science, and reading literacy, supporting some previous research
showing that maternal levels of education matters more for students (M. Chiu & L.
Khoo, 2005). Chiu and Khoo (2005) also report that peer SES is a factor in student
achievement, in that “students averaged 7 points higher in all subjects per 10%
increase in mean highest job status of schoolmates’ parents” (p.587). Based on these
findings at both the student and school levels, Chui and Khoo (2005) offer an

28
important theoretical point that providing higher quality education for lower SES
students represents a better use of limited educational resources. This better use occurs
because of “diminishing marginal returns” in which students with the most need
receive the most help from a unit increase in resources (M. Chiu & L. Khoo, 2005, p.
575). Therefore, this study identifies not only social class differences in achievement,
but also a theory of resource distribution with policy implications. This study further
tests their findings by separating students into quintiles and by using TIMSS results to
validate findings.
Examining PISA 2000 results, Marks et al. (2006) find that “in most countries,
socioeconomic inequalities in student achievement are, contrary to expectations,
slightly stronger in reading than for mathematics and science” (p. 115). Marks et al.
(2006) also point to the importance of accounting for tracking when comparing data
across countries, and they do find a tendency for countries tracking students at a
younger age to have stronger relationships between SES and tracking than for
countries tracking at later grade levels. This relationship does not hold for the United
States, a country without formal tracking but with higher levels of relationships
between SES and achievement. These types of results highlight the difficulty in
international comparisons when analyzing SES. However, these results do confirm
that whether SES effects occur at the individual level (the United Kingdom and the
United States) or at the school level due to early tracking (Belgium, Czech Republic,
Germany, and Hungary), SES relates significantly to achievement across countries on
PISA.

29
Analyzing TIMSS scores in Canada, Ma (2001) found that family structure and
SES had significant effects on student achievement in mathematics and science,
whereas gender and family size had marginal effects. Also in Canada, Ma and Klinger
(2000) estimate that 35 to 50% of variance among students in TIMSS achievement
comes from to SES. However, their SES measure uses student self-reports of cultural
and home possessions instead of parental measures, indicating a different approach to
measuring SES with a similar significant finding. In terms of school SES effects,
Gonzales et al. (2008) find in the 2007 TIMSS that students in public schools with
more than half the population receiving free and reduced-price meals scored lower
than the TIMSS average, while those attending schools with less than half the
population receiving free and reduced price meals exceeded the TIMSS average
(Gonzales, et al., 2008). Results and findings from each of these studies on both PISA
and TIMSS confirm the relationships between SES and achievement at both the
student and school levels.
Macroeconomic Research – Country Wealth
Refuting Coleman’s (1966) assertion that student SES matters much more than
schooling for increasing achievement, Heyneman and Loxley (1983) found that
school and teacher quality appear to be the predominant influence on student
learning around the world; and the poorer the national setting in economic
terms, the more powerful this school effect appears to be. (p. 1184)
Their paper included data from a broad range of countries in Africa, Asia, Latin
America, and the Middle East. In countries with low income per capita, primary
school children “have learned substantially less after similar amounts of time in school

30
than have pupils in high-income countries. At the same time, the lower the income of
the country, the weaker the influence of pupils' social status on achievement”
(Heyneman & Loxley, 1983, p. 1162). Therefore, Heyneman and Loxley (1983)
present two findings germane to this study: 1) countries with different income levels
have different relationships between SES and 2) in developing countries, schooling
relates significantly to achievement. This study reexamines both of these findings
using newer data.
A recent re-analysis of Heyneman and Loxely from Baker et al. (2002) using
TIMSS data does not confirm their findings. The authors posit that the expansion of
schooling in lower income per capita countries in the years between the studies might
have altered the overall importance of schooling as a distinguishing factor (Baker, et
al., 2002). Furthermore, in this study, the countries examined in detail using
production functions all occupy the upper half of the global GNI per capita
distribution. Therefore, given the time lapse and the lack of lower income countries,
the Heyenman-Loxley theory may not appear as strong or at all. Nevertheless, the
issue of the importance of schooling and the relationship between school resources
and achievement remains controversial in education and this study contributes to the
research on the topic.
Macroeconomic Research – Country Income Inequality
Dating from the 1800’s, the tide of rising and falling income inequality has
tracked the levels of industrialization in a country. Economists have measured this
relationship, first through the Kuznet’s curve, and then through the Great U-turn
(Alderson & Nielsen, 2002). The Kuznet’s curve refers to the curvilinear relationship

31
between fluctuation of income inequality and a country’s trajectory of
industrialization. During the first few decades of industrialization, countries see an
increase in income inequality, followed by a period of decline in income inequality.
Newer observations have found a “Great U-turn” in which countries in late or post-
industrialization have steadily increasing levels of income inequality. Alderson and
Nielson (2002) cite the U.S. example in which income inequality increased in the late
1800’s until the 1920s, decreased until the 1970s (the Kuznet’s curve), and then
steadily increased again (the Great U-turn). Other countries have demonstrated similar
patterns.
The trajectory of income inequality is important in international research
because countries are at different stages of agricultural, industrial, and post-industrial
development at the moment of any cross-sectional assessment. For instance, many
post-“communist” countries are selected in the second part of this study. These
countries have data suggesting that they have lower and middle levels of income
inequality that might reflect vestiges of this economic system. On the other hand,
Boedo (2006) states that, after the Soviet fall and ensuing rapid change to market-
capitalism, inequality increased in every Eastern bloc country except the Slovak
Republic. For countries still in transition, findings in this study could indicate future
larger disparities in education based on the twin conditions of increasing permeation
of market capitalism that result in increased income inequality and an increasing
dispersion in educational achievement and resource distribution.
From an education perspective, Rothstein (2004) identifies the effects of
income inequality on education by asserting that “incomes have become more

32
unequally distributed in the United States in the last generation, and this inequality
contributes to the academic achievement gap” (p. xi). He suggests a variety of
solutions, from a higher minimum wage to an earned income tax credit, which he
considers educational policies for their probable effect of increasing levels of
academic performance (Rothstein, 2004). De Gregorio and Wha-Lee (2002)
performed a cross-national analysis using panel data from 1960 through 1990,
confirming Rothstein by finding that “countries with higher educational attainment
also have a more-equal income distribution” (p. 403). Building on Rothstein (2004),
De Gregorio and Wha-Lee (2002), and Chiu and Khoo (2005), this study further
explores the interaction between income inequality and different levels of SES. The
area of research regarding income inequality and education outcomes remains
underdeveloped in comparison with the country income per capita research.
Furthermore, their interaction is under researched and, therefore, a primary focus in
this study.
Indicators of Educational Quality
Teacher Preparation
Many international studies examine correlations between students’ socio-
economic status and their performance on standardized achievement tests. However,
only a few studies look at whether students of different SES levels also have varying
access to school resources, including teacher preparation within classrooms and other
resources at the school level (Guthrie & Rothstein, 1999). Darling–Hammond (2000)
finds that teacher preparation may relate strongly to student achievement because

33
greater teacher exposure to mathematics content and pedagogy has positive
relationships with student learning of fundamental mathematical concepts. Chiu and
Khoo (2005) find that levels of teacher qualifications significantly affect math scores
on international assessments. They also find interesting results vis-à-vis SES
measures. After controlling for certified teacher variance, a parents’ highest job status
variance did not significantly affect test scores (M. Chiu & L. Khoo, 2005). Given the
previous research on the strength of the SES-achievement relationship, these findings
demonstrate the importance of teachers and schools for student performance.
Opportunities to Learn
From the student perspective, the amount of time teachers devote to specific
areas of study represents a significant element of OTL (Schmidt, et al., 2001). Schmidt
et al. (1999) find that American students spend much of their math class time focusing
on computation. Eighth-graders in Singapore and Japan spend significant time on
conceptual topics such as algebra, and these countries outperform the U.S. on
assessments (I. V. S. Mullis, Martin, González, & Chrostowski, 2004; Schmidt, et al.,
1999). Carnoy et al. (2004) also examine OTL measures internationally, finding that
increased OTL in algebra and statistics produce higher test scores relative to class time
spent on numeration. The PISA assessment only includes a proxy measure for OTL
(grade level), a strongly limiting aspect of the survey. In terms of both teacher
preparation and opportunities to learn, Chiu and Khoo (2005) hypothesize that both
factors have a stronger relation with student achievement in lower SES groups than in
higher SES groups. This study tests these hypotheses.

34
School Factors
This study focuses primarily on the relationship between student SES and
economic and education conditions and does not directly analyze aggregated school-
level SES. Research does show important relationships between school-level SES and
student outcomes, but other school variables also play an important role in student
achievement. Two of these variables discussed above, teacher preparation and
opportunities to learn, function at the classroom level and represent one level of
schooling. However, schools themselves have attributes like resources and size that
relate to student achivement. Chiu and Koo (2005) find that, in the PISA, school
resources mediate the effects of school-mean parent SES. They surmise that more
privileged parents enroll their students in schools with more resources, thus helping
raise student scores. In Ma’s (2001) Canadian study, school size had important effects
although teacher influence had marginal effects. This present study further examines
the relationship between classroom and school inputs and student achievement in
Chapter 6 by applying the production function approach described below.
Using Production Functions in Education
Production functions originate from economic studies of production in firms
that measure the effect of a given set of inputs upon a defined output (Carnoy, 1995).
The theory of production holds that “at any given time, there will be a maximum
amount of product for any given amounts of factor inputs,” with a given state of
technical knowledge (Samuelson & Nordhaus, 2001). The production function
provides the technical expression of this relationship using a mathematical model to
35
estimate the significance and magnitude of input effects. In the field of education,
production functions most commonly identify academic achievement as the output,
often measured by standardized test scores, in this cases, scores on the TIMSS and
PISA (Carnoy, 1995).
A typical traditional production function will resemble the following:
SAt = f (SFt, CRt, SCt)
where SAt represents student achievement at time t (mathematics test scores in this
study); St represents student and family inputs up to time t, including socio-economic
status, gender, and age; CRt represents classroom resources up to period t, including
class size, instructional time on math, teacher preparation, and opportunities to learn;
and SCt, representing school capacity, including school resources, school size, and
community size (Hanushek, 1986; Levin, 1995).
The education production function has been widely used since its inclusion the
Coleman Report, although research has since disputed Coleman’s findings that student
outcomes have little relationship with school-level inputs. Even though SES and other
family characteristics remain an important indicator for success, school-level inputs do
influence student achievement (Hanushek, 1986; Murnane, 1975). Now, after
hundreds of production function studies, the focus remains on identifying the effect of
teacher practices and curriculum on student achievement. This study uses both student
and school variables from TIMSS and PISA to estimate inputs using ordinary least
squares (OLS) regression.

36
Limitations of Production Functions
The production function has limitations occurring in three domains: outputs,
inputs, and overall theory. The technique of production functions in assessing
educational outputs implies that schools function in a similar manner to private firms
(Carnoy, 1995). While true in certain respects, the production function usually uses
individual student achievement as the output, even though schools may have the need
and mandate to produce other types of outputs. Carnoy, for example, describes several
“non-traditional” variables of a political nature. For instance, being part of the public
sector exposes schools to conditions different from private firms, such as a larger
public bureaucracy and the institutional values associated with democracy.
Carnoy (1995) suggests viewing schools or school districts as “mini-
democratic-states,” in which internal and external pressures such as parental, political,
social, and bureaucratic demands affect schools or school districts. He identifies a
laundry list of objectives including student achievement, teacher efficacy, and
administrative power that do not compare to conditions in private firms. Additionally,
social benefits such as reduced crime, fewer drug-related problems, social integration,
and work ethic serve as other key social outcomes of education that researchers, due to
measurement difficulties, do not often include in production function studies (Turner,
1996).
Since the Coleman report, researchers have debated whether or not schools
affect on student achievement. The debate about the effect of inputs stems from the
methodological difficulty of accurately capturing teacher and school effects. For
instance, measures of teacher certification do not fully capture teacher quality;

37
therefore, unexplained variance can influence the model. Hanushek (1986) notes that,
in many cases, the availability of data, instead of the theoretical foundations of the
study, guides the choice of inputs. Levin (1980) also cites the issue of incorrect
specification of the schooling process as a potential challenge for econometric
estimation. He emphasizes the issue of mulitcollinearity, where inputs have high levels
of correlation and may violate regression assumptions. Finally, Levin (1995) posits
that teachers as inputs may not support the goals of the school and thus skewing
measurements of their (and other) inputs as creating certain outputs.
Levin and Hanushek also point to theoretical problems informing the use of
educational production functions. Hanushek (1986) states that educational production
functions differ from the underlying assumptions of a deterministic relationship
between inputs and outputs and the free variance of each input. As such, “the
production function is unknown (to both decision makers and researchers) and must be
estimated using imperfect data” (p. 1149). Levin (1980) sees an even more basic
problem than measurement error in production functions. He finds that the lack of an
underlying theory of education leads to a “crude empiricism” in research, and he states
that studies should address the theories of school and of organizational behavior (p.
205).
In the current study, the theoretical basis of testing the relationship between
country level inequality and student SES in terms of student achievement addresses
Levin’s concern about theoretical approach. Furthermore, developers of the PISA and
TIMSS have used rigorous sampling and data collection procedures to overcome some
of the measurement challenges presented above in the description of inputs and

38
outputs. This study capitalizes on the PISA and TIMSS approach to build precision
into the education production function model. The next chapter describes the
conceptual framework and methods, including production functions, in greater detail.

39
Chapter 3: Conceptual Framework, Research Design, and Methodology
Chapter 3 outlines the theoretical model underpinning the study, followed by
the analytical process employed to test different hypotheses and answer the research
questions. The conceptual framework builds on the previously established correlations
between achievement and educational factors presented by posing research questions
about income inequality and its interaction with student SES in both an international
and country level context. Then, the section on research design outlines the two stages
of research undertaken followed by a description of the two datasets used. Finally, the
methodology details the different statistical techniques employed to accurately answer
the research questions.
Understanding Relationships between the Micro and Macro Economic Levels and Education Quality: A Conceptual Framework
This study covers several facets of education addressed in the literature. At its
core, this study examines the interaction between student SES and country income
along with SES and income inequality for both educational inputs and outcomes. The
primary exploratory analysis focuses on two relationships from an educational
perspective: SES and country income and SES and income inequality. The literature
review above presents the positively correlated relationships between the economic
factors of country income and higher achievement, student SES and higher
achievement, increased teacher preparation and higher achievement, more OTL and

40
higher achievement, and the negative correlation between income inequality and
student attainment. Given this research foundation, this study combines the constructs
from these separate analyses to test the interactions described above for three
education factors of interest: student achievement, teacher preparation, and OTL.
Student assessment attempts to measure how schools and parents have
educated a child. While researchers can attribute smaller differences in test scores to
random variance, or educators can argue that certain assessment tools test different or
untaught skills, larger achievement differences in assessments do serve as a sign of the
quality of schooling as well as the role of the home environment. This study
disaggregates these relationships by accounting for SES and the country economic
environment along with classroom and school factors (in individual country analyses).
In addition to student achievement, this study also examines two outputs that the state
provides to students—teacher preparation and OTL. Researchers usually categorize
these variables as inputs to education, but considering them instead as outputs permits
testing of a country’s commitment to equitable education opportunity. While previous
research shows the importance of examining teacher preparation and OTL as measures
of educational quality, these studies do not combine classroom analyses with both
macro-level country economic conditions and the micro-level economic inequality of
student SES.
Figure 6 shows findings from previous research, the two overarching research
questions, and the relationships between educational concepts that this study

41
addresses. The dotted lines represent relationships under investigation and arrows on
the ends represent potential directionality1.
FIGURE 6. CONCEPTUAL FRAMEWORK
Research Questions and Hypotheses
Research Question #1
Two research questions remain unanswered in the literature. First, what are the
relationships between educational quality and economic conditions (country income,
income inequality, and student SES)? Researchers have shown that SES relates to
student outcomes, but how do students with similar SES levels perform in different
national economic contexts? The first step is to test the interaction between SES and
1 Some arrows point in both directions because this study does not make causal claims. However, I assume that student achievement does not affect educational quality or economic conditions (achievement effects in countries remain plausible, but only over a protracted time).
Teacher Preparation
Chiu & Koo (-)
Research Question 1: What are the relationships between specific aspects of
educational quality and economic inequality?
Previous Research: Established Correlations
Research Question 2: How do educational and economic factors relate to student achievement?
Chiu & Koo (-)
Schmidt et al (+)
Darling-Hammond (+)
Student Achievement
Opportunities to Learn
Student Socio- Economic Status
Country Income Inequality
Student Achievement
?
Education Quality
Economic Conditions
?
School Resources (Analysis Part 2)
Rothstein (+)

42
country income for student achievement, teacher preparation, and opportunities to
learn. In countries with greater overall income, a realistic expectation would be to find
higher achievement, better prepared teachers, and more OTL. Following this approach
is the hypothesis that countries with less income inequality will have a more-equal
distribution of these educational outputs among students in different SES groups than
countries with greater income inequality.
After testing the country-level hypotheses, I then test the relationship of
income inequality to the three educational outputs, expecting wealthier students in
countries with more income inequality to receive a higher share of the educational
resources, including better-prepared teachers. Therefore, they might outperform their
peers living in countries with less income inequality (controlling for country income).
The inverse would hold true for lower-income students because they hypothetically
receive comparatively fewer resources in countries with more-unequal income
distributions. These fewer resources potentially lead to lower performance for students
when compared to their peers in countries with more-equal income distributions where
both “poor” and “wealthy” students would have more similar shares of educational
resources. In countries with lower income levels, the educational outcomes should
differ for the highest SES students but remain similar for large swaths of lower and
middle SES students who have less access to more prepared teachers and classrooms
with more OTL. Figure 7 illustrates the hypothesized test score distribution increasing
as income inequality increases.

43
FIGURE 7. HYPOTHESIZED ACHIEVEMENT SCORES DISPERSING AS INCOME INEQUALITY INCREASES
More formally, I hypothesize that low SES students, in countries with high
levels of inequality, have teachers with less preparation, spend less class time on
important math topics, and score significantly lower on assessments. The inverse will
hold true for higher SES students in countries with more-unequal income distributions
(Berne & Stiefel, 1984; Rothstein, 2004; Sherman & Poirier, 2007).

44
Table 1 shows the different groups tested and the hypothesized direction of the three
educational outputs for students with different SES levels. I also hypothesize that
achievement gains for students in low income per capita countries will be moderate
compared to students in higher income countries.
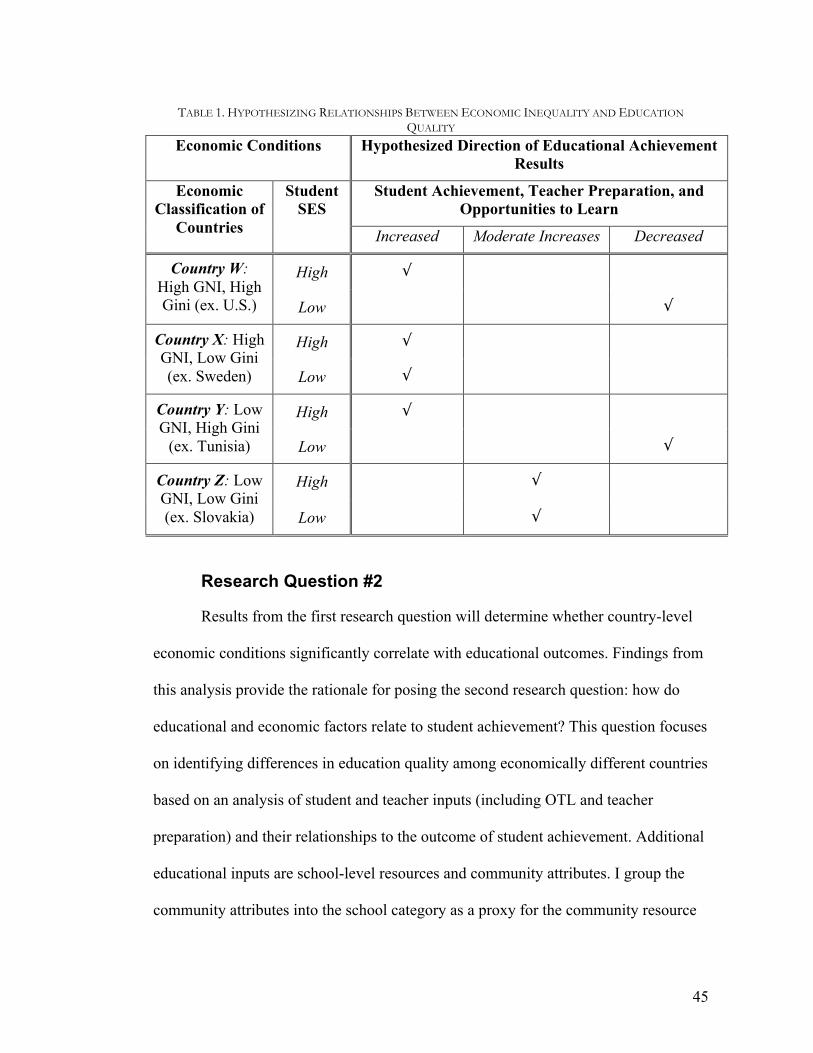
45
TABLE 1. HYPOTHESIZING RELATIONSHIPS BETWEEN ECONOMIC INEQUALITY AND EDUCATION QUALITY
Economic Conditions Hypothesized Direction of Educational Achievement Results
Student Achievement, Teacher Preparation, and Opportunities to Learn
Economic Classification of
Countries
Student SES
Increased Moderate Increases Decreased
High √ Country W: High GNI, High Gini (ex. U.S.) Low √
High √ Country X: High GNI, Low Gini (ex. Sweden) Low √
High √ Country Y: Low GNI, High Gini
(ex. Tunisia) Low √
High √ Country Z: Low GNI, Low Gini (ex. Slovakia) Low √
Research Question #2
Results from the first research question will determine whether country-level
economic conditions significantly correlate with educational outcomes. Findings from
this analysis provide the rationale for posing the second research question: how do
educational and economic factors relate to student achievement? This question focuses
on identifying differences in education quality among economically different countries
based on an analysis of student and teacher inputs (including OTL and teacher
preparation) and their relationships to the outcome of student achievement. Additional
educational inputs are school-level resources and community attributes. I group the
community attributes into the school category as a proxy for the community resource

46
capacities to aid schooling. However, the community-school relationship is most
likely less beneficial in very small (rural) or very large (urban) communities. They
have fewer resources to distribute, while medium-sized communities might make
larger investments in education.
I compare the findings between countries in economically different groups,
such as wealthy but more-equal countries (Japan and Sweden) with wealthy but more-
unequal countries (the U.S. and Hong Kong). I expect educational inputs to correlate
more with achievement in low-inequality countries and that these countries provide
more equitable educational resources across the spectrum of student SES. On the other
hand, I expect student SES to correlate more with achievement in high-inequality
countries, with large differences in achievement between low and high SES students. I
anticipate that classroom and school resources have a smaller role in more-unequal
countries that have either high or low levels of income.
Research Design
Much research on educational equity addresses school-level resources and
access for students from different socio-economic status (SES) backgrounds. Few
studies have explored the relationships between student achievement, differences in
student SES, and educational resources for students of different SES backgrounds
(Darling–Hammond, 2000; Schmidt, et al., 2001). In this study, I examine these
influences for countries participating in the 2003 Trends in International Mathematics
and Science Study (TIMSS) and the 2003 Program for International Student
Assessment (PISA). I also examine the mathematics achievement sections of these

47
two data sets that provide assessment results and background information for 8th
graders and 15-year-olds, respectively. These cross-sectional tests do not track
students over time; therefore, each test, administered at a similar time in each student’s
life, represents a serious effort to understand the environment of adolescent
educational achievement on an international scale.
Part I: Identifying Relationships Between Economic Factors and Measures of Educational Quality
To answer the two research questions, I organize my analysis in two parts. I
use Part I to identify whether country-level economic characteristics and student SES
correlate with the three dependent variables: student math achievement, teacher
preparation, and OTL. By examining teacher preparation and OTL as outcome
variables, I focus on these two areas of education previously identified as important
for students and the additional, but traditional, area of achievement (Litchfield, 1999;
World Bank, 2007). I then use two economic factors to capture income disparities
within and between countries. The Gini coefficient measures income differences
within a particular country. The Gross National Income per capita (GNI) measures the
overall level of domestic income that allows countries to be compared to each other
(World Bank, 2008).2 Using these measures, I determine if each educational outcome
systematically relates to overall income and income inequality of countries, a finding
that, if true, will indicate inequities in education sectors. I then divide students into
SES quintiles to uncover differences both between the quintiles internationally and
2 As described below, the GNI per capita measure is standardized between countries using the World Bank’s Atlas method, which uses a three-year average that smoothes exchange rate fluctuations.

48
within quintiles in countries with more or less income inequality. Table 2 lists the
variables pertinent to analytical Parts I and II.
TABLE 2. LIST OF VARIABLES AND DESCRIPTIONS FROM TIMSS AND PISA Part I
Variable Type Variable Description Math Achievement Student scores on TIMSS and PISA math Teacher Preparation Index of Teacher MA, BA, and credential Outcome
Variables Opportunities to Learn
TIMSS – % of class time spent on math subjects (algebra, geometry, numeration) PISA – grade level of student Part II
Vectors Variable Description Student Socio-Economic Status
SES measure including: Highest ISCED level, highest parental occupation, and home items (computer, books)
Student gender Student Characteristics
Student age Varies slightly in PISA, much more in TIMSS because administered to 8th graders of any age
Math class size Size of students math class (classroom level in TIMSS, principal report in PISA)
Math instructional time
Math time as % of overall time (classroom level in TIMSS, principal report in PISA)
Teacher Preparation Same as dependent variable, used as predictor in Part II
Classroom Resources
Opportunities to Learn
Same as dependent variable, used as predictor in Part II
School Resources Availability of school resources for mathematics instruction
School size Number of students School Capacity
Community size Six categories of size (hamlet to metropolis)
Sources: IEA TIMSS 2003 International User Guide; OECD PISA 2003 Technical Report.
TIMSS and PISA contain different measures of OTL. TIMSS includes
measures of the amount of time students spend studying different math subjects, a
significant indictor of performance. PISA includes only the student’s grade level as a
proxy for exposure to math in a year of secondary school. Therefore, I compare results
from the TIMSS and PISA regarding OTL to find not only differences between
student SES groups but also to distinguish the explanatory power of the two different
OTL measures. I expect to confirm Chiu and Khoo’s (2005) hypothesis that both
teacher preparation and OTL have a stronger relation with student achievement in
lower SES groups than in higher SES groups.
49
Part II: Production Functions Predicting Educational Attainment in Economically Different Countries
In Part II, I group the population of seventeen countries participating in both
TIMSS and PISA into low and high GNI per capita countries (income levels of less
than $10,000 or greater than $20,000) and into three different levels of Gini
coefficients: low (<30), middle (30-40), and high (>40). I use the results of the first
section (showing that country-level economic indicators do relate to education) as the
basis for further identifying variations in the relationships between educational factors
and achievement scores in economically similar and economically different countries.
In countries within these groups, I first compare countries that have similar
GNI per capita and Gini coefficients to find similar or different correlations between
educational inputs and achievement scores, using production functions.3 I estimate
within-country production functions to identify the relationship between student
achievement and three input vectors: student characteristics, classroom resources, and
school capacity (Table 2). I then compare high and low SES quintiles within these
similar countries to see if within-country inequities exist between students with
different SES. Finally, I compare countries with different levels of inequality to find
patterns in educational resource provision relating to the country’s economic situation.
I expect to find that schooling matters more for both higher and lower SES students in
countries with less income inequality and lower income per capita, while SES would
relate more to achievement in more income inequality and higher income per capita
3 As discussed in the literature review, production functions originate from economic studies of production in firms measuring the relationships of a given set of inputs upon a defined output (Carnoy, 1995; Samuelson & Nordhaus, 2001).

50
countries. I also expect to find that classroom and school variables matter more for
higher SES students, while SES relates to achievement more for lower SES students.
Data
This study uses data provided in the 2003 administrations of the Program for
International Student Assessment (PISA) and the Trends in International Mathematics
and Science (TIMSS) studies. Using data from the same year reduces comparability
concerns stemming from annual changes in or external shocks on national education
systems. Math achievement scores serve as the dependent variable because they
depend less on knowledge gained outside of school than science or language arts
scores. Also, the 2003 PISA focused on mathematics (approximately two-thirds of the
total number of items), making those data more extensive and therefore increasing
reliability.
Program for International Student Assessment (PISA)
In 2003, the Organization for Economic Cooperation and Development
(OECD) administered the PISA in forty-one countries.4 Designed to provide member
countries with reliable and extensive data in three different areas (in addition to
demographic data), the test examines: 1) student performance in language arts,
mathematics, and science content areas; 2) student perceptions about their educational
environment; and, 3) principal reports about the operation and goals of their particular
schools. The PISA operates on a triennial basis with a rotating content focus. The
4 Liechtenstein is not included in this analysis because of its status as an outlier for country income ($30,000 above the second largest income per capita country) and its small population.

51
2000 assessment focused primarily on students’ reading literacy, the 2003 version
primarily on mathematics literacy, and a 2006 test primarily assessed science literacy.
In each testing session, the primary content area occupies approximately two-thirds of
total testing time. The PISA does not assess students at a given grade level; instead,
fifteen-year-old students participate in PISA because they represent a population near
the end of compulsory schooling and close to joining the labor force and social sphere
in their respective countries (OECD, 2004).
Unlike most previous international assessments, including TIMSS, the PISA
does not attempt to measure student mastery of specific curriculum content. National
governments participating in the development of PISA preferred to gather information
on cross-curricular competencies to show how well students can apply information
obtained from school in different contexts (Schleicher, 1999). PISA developers think
that students with a broader range of application in their knowledge have better
opportunities for success in a society that increasingly demands the transfer of skills
across domains (OECD, 2001). PISA operationalizes this approach through
performance measures and questionnaires. The performance measures require in-depth
reading, comprehension, interpretation, and application of given texts in the three
content areas of reading literacy, mathematics literacy, and science literacy. The
survey questionnaires ask students about a variety of characteristics and attitudes
toward school. PISA also asks principals about different features of their schools.
However, PISA does not incorporate teacher-level data into its study, an approach that
remains a major focus of TIMSS.

52
Trends in International Mathematics and Science Study (TIMSS)
Administered by the International Association for the Evaluation of
Educational Achievement (IES), the TIMSS began in 1995 as an assessment of
mathematics and science in 45 countries. Conducted on a quadrennial basis, the
assessment collects student performance data in mathematics and science for 4th and
8th graders, although this analysis uses only 8th grade assessments. TIMSS assesses
students with items developed from internationally created curriculum frameworks (I.
V. Mullis, et al., 2003). Since TIMSS focuses on a country’s delivery of education, it
differs from PISA’s focus on measuring current student knowledge. TIMSS includes
surveys of four different levels: student, teacher, principal, and a national curriculum
coordinator survey. The 2003 TIMSS included fifty countries, with an overlap of
seventeen countries with the 2003 PISA.5
Plausible Values, Weights, and Estimation Commands
Both PISA and TIMSS employ two advanced statistical techniques in their
analysis that require explanation: plausible values and survey weights (student,
country, and replicate). Because the number of items in each assessment is greater
than the number to which an individual student can respond and the assessments are
not used for student-level accountability, students do not respond to every test item.
Therefore, the OECD and IEA impute student response patterns across test booklets,
resulting in five separate scores, called plausible values. Analysis of plausible values
requires estimating five equations, one for each score imputation, with the final 5 TIMSS also included subpopulations in four territories – Basque (Spain), Indiana (U.S.), Ontario and Quebec (Canada) – that are not included in this study. Argentina and Yemen did not have reliable data for the 2003 administration and are not included.
53
coefficients averaged across the equations. New standard errors are then calculated
using equations provided by PISA and TIMSS in their respective technical reports
(Martin, 2005; OECD, 2005).
Secondly, PISA and TIMSS use clustered sampling methods to draw a sample
of schools and of 15-year-old students (PISA) or classrooms within the schools
(TIMSS). Both PISA and TIMSS use a probability proportional to size school-level
sampling design and provide weights with both a school and student base weight
(OECD, 2005).6 Furthermore, analysis of PISA and TIMSS requires the use of
replicate weights as the sampling variance estimator to calculate the standard errors of
a statistic while avoiding the assumption of random sampling. In addition to the
replicate sampling weights for within country analysis, the datasets also include
country level weights that permit the comparison of data across countries. When
comparing results internationally in this study, the combination of student and country
weights are used in the estimations. Therefore, PISA and TIMSS employ student and
country sampling weights as well as replicate weights for variance estimation.
Replicate weights provide a better estimation of the sampling variance by
generating several subsamples for which the statistic of interest is computed and then
compared to the whole sample for an estimate of the sampling variance (OECD,
2005).7 PISA uses a technique called Balanced Repeated Replication (Fay’s version
6 On rare occasions, only one school is sampled from a cluster, preventing estimation using the survey regression commands in Stata. Combining these singleton primary sampling units (psu) with the adjacent psu permits analysis without eliminating data. 7 Chapter 3 of the OECD’s data analysis manual for PISA offers a comprehensive discussion of sampling design and estimation procedures, including the jackknife replicate weights used in TIMSS and the Fay’s adjusted BRR approach used in PISA.

54
with a factor of 0.5) and provides 80 replicate weights, which the technical report
describes (OECD, 2005). Practically, each regression equation is estimated 80 times
using each replicate weight with the results of these calculations then averaged. These
estimations then occur for each of the five plausible values, averaged for a final
estimated student score. TIMSS uses Jackknife Repeated Replication (JRR) and
provides 75 replicate weights that require the same analytical steps described above.
Kevin MacDonald of the World Bank designed a program for the STATA
software add-on program (ado file) that performs statistical operations accounting for
the complex survey weights used in PISA and TIMSS. The “pv” command estimates
and combines the five plausible values using the replicate and student weights. The
program then uses the formulas provided by the OECD and the IEA to recalculate the
standard errors for the averaged plausible values. Using the MacDonald approach
exclusively allows for consistency in the estimation of results for both PISA and
TIMSS, reducing the possibility for differences in results due to artifacts from
different statistical techniques. Mean country scores for achievement produced using
the MacDonald file match the OECD published values for PISA within one point,
further validating this technique.
Methodology
Creating the SES Index for Grouping by SES Quintiles
This study divides the TIMSS and PISA samples into SES quintile subsets for
making equity comparisons. Creating accurate subsets depends on the use of an
appropriate measure of SES. The PISA includes an index of SES “derived from three
variables related to family background: highest level of parental education,” highest

55
parental occupation, and the number of home possessions (OECD, 2005, p. 316).
PISA designers note that “socio-economic status is usually seen as based on education,
occupational status and income” and used home possessions as a proxy for income to
develop a more complete SES measure (OECD, 2005). The home possessions index
includes fourteen measures such as number of books, internet access, a table to study,
etc. (OECD, 2005). As discussed in Chapter 2, PISA includes the three main elements
of the current theory of SES: parents’ education levels, their occupational status, and
family income (Buchmann, 2002).
To create the SES index, PISA developers obtained weighted likelihood
estimates (WLEs) for each of the individual household measures using Item Response
Theory (IRT) scaling procedures to produce item parameters from international
calibration samples (OECD, 2005). They transformed these new household item
WLEs into an international metric with an OECD average of zero and a standard
deviation of one. They grouped these household items (income proxies) and combined
them with parents’ education and occupation status using principal component
analysis (OECD, 2005). The OECD (2005) imputed missing data using multiple
regression when one category of SES was missing. The SES variable correlates with
the similar PISA 2000 variable at 0.95. In the development of the SES variable, the
OECD has employed a variety of advanced statistical techniques to capture family
contributions to a student’s development as accurately as possible and in conjunction
with the previous research on SES.
The TIMSS dataset includes two of the three SES measures discussed above,
parental education and home possessions, but TIMSS does not provide a combined

56
index of the two. Given that SES represents a crucial parameter in this study, the SES
index for TIMSS mirrors the PISA in the inclusion of variables for home possessions
(income proxies) and parental education, but not in methodology. Instead of
performing IRT scaling and PCA, this study uses an approach with fewer
opportunities for error, but sacrifices some level of precision.
I created the SES index by combining measures for the home possessions
(fewer in TIMSS than PISA) and parental education. I used mean imputation for
missing observations. While not as precise as multiple regression, mean imputation
offers an interesting benefit in this study. When assigning students to SES quintiles,
fewer students are placed in the lowest or highest SES quintiles. Furthermore, as
research in chapter 2 shows, low SES students do not respond to questions about SES
more often than their peers. Therefore, estimates of differences in this study between
low and higher SES quintiles are likely conservative because potentially more students
would be placed in the low SES category with complete data on the SES variables.
Because TIMSS includes fewer SES variables, students do not divide evenly
into quintiles. In order to separate the sample population into SES quintiles, I
generated a variable with random observations between 0.1 and 0.00001 (small
amounts that do meaningfully alter the overall SES score), then added it to the
standardized SES score, giving each observation a slightly different score and
enabling their separation into quintiles. This approach results in some random
distribution of students into different quintiles even though they have the same SES
scores. This shortcoming of the data could be improved in TIMSS with the inclusion
of more SES variables.
57
In conclusion, the PISA variable includes one more main component of SES
(parental occupation) than TIMSS, while also employing a more advanced statistical
approach to creating a SES index. However, the TIMSS SES index in this study
effectively differentiates students along broad lines of SES quintiles rather than
according to specific student levels of SES measures. Comparisons between SES
quintiles for TIMSS are therefore likely accurate and reflect real social differences.
International Measures of Country Income, Income Inequality, and Centralization
This study employs three different country-level measures that potentially
relate significantly to educational inputs and outcomes: two economic measures and
an index of centralization in the education sector. The economic variables include a
measure of country income, called Gross National Income (GNI) per capita, and
measure of income inequality within a country, called the Gini coefficient. Figures for
GNI per capita in this study come from the World Bank database, adjusted to 2003
U.S. dollars using the World Bank’s Atlas method that smoothes exchange-rate
fluctuations using a three-year average (World Bank, 2008).
The Gini coefficient serves as a statistical measure of dispersion (in this case,
for economic inequality), ranging from 0-1. In the Gini coefficient, a score of zero
represents perfect equality and a score of one represents perfect inequality. Originally
conceived of by Corrado Gini (1912), the Gini coefficient for an individual country is
determined by the following equation:
Gini = 1 – 2 ∫01 L(X)dX

58
In this equation, L(X) represents the Lorenz curve. The equation determines the ratio
between areas above and under this curve as a measure of dispersion. Figure 8 shows
the Lorenz curve and the areas that form the ratio of the Gini coefficient.
FIGURE 8. THE LORENZ CURVE
Source: Wikimedia Commons - http://en.wikipedia.org/wiki/File:Economics_Gini_coefficient2.svg
The World Bank (2007) supplies extensive methodological information about
the formation and use of the Gini coefficient (Litchfield, 1999). Specifically,
Litchfield (1999) notes that while the Gini coefficient does account for many
necessary elements of inequality, it sometimes cannot measure decomposition into
separate groups if those groups do not have separate income vectors. Furthermore,
income data from the World Bank used to create Gini coefficients come from different

59
sources, including individual income, family income, and the distribution of
consumption spending. In some European countries, the Gini coefficients are reduced
by redistributive taxation policies. In this study on education, the relationship between
SES status and achievement might not relate in the same manner to individual incomes
in countries with such redistributive policies.
Each of these issues contributes to an overall under-theorized measure of
income inequality. This occurs because researchers lack reliability in income data and
because dispersion remains a difficult methodological target. In this study, the issue of
an under-theorized measure is important because, if student inputs and outcomes do
correlate with income inequality, the measure of inequality still remains unclear.
Understanding the mechanisms that might that create income inequality becomes
necessary for concrete recommendations about how to alleviate differences in
educational outcomes related to income inequality.
In this study, data for the Gini coefficients come either from the World Bank or
from country finance ministries when not available from the World Bank. Also,
because the World Bank does not make annual calculations, the Gini coefficients
come from the closest year to 2003 as possible. Finally, this study also incorporates a
categorical measure of centralization within a country’s education system. This
variable distinguishes between countries with centralized finance and management
systems, centralized finance and decentralized management systems, and
decentralized finance and management systems.8
8 Maham Mela, graduate student of education at Teachers College, Columbia University, created the centralization variable by analyzing individual country

60
Analysis Part I: International Comparisons
Part I of the analysis in this study compares three different outcomes between
high and low SES groups: test scores, teacher certification, and measures of OTL. The
analysis includes all countries participating in the 2003 TIMSS and PISA, with the
exceptions cited above. GNI per capita, the Gini coefficient, and the centralization
index serve as the independent variables. The analysis tests whether income inequality
relates to educational outcomes for high or low SES students while controlling for the
absolute level on income in the country and levels of centralization. In each case, a
first analysis using only the income per capita offers a baseline for comparing the
income inequality results.
Each dependent variable (achievement, teacher preparation, and opportunities
to learn) relates to important features of education that could differ by SES groups, as
discussed in the conceptual framework. Examining teacher preparation first, I use two
different dependent variables in TIMSS. First, I develop a composite index that
includes teacher responses about their ISCED attainment levels, whether they have a
bachelor’s degree in mathematics, and if they have a teaching license or certificate.
These three variables cover the spectrum of teacher preparation possibilities, including
their overall preparation, their content knowledge, and their pedagogical preparation.
When combined, this index contains a high level of missing observations (~27%);
therefore, I also use only the ISCED attainment levels as a second dependant variable
in the analysis. The ISCED-only variable contains approximately 18 percent missing
ministry of education websites and international sources to find the relevant governance and finance information. Her gracious provision of these data has strengthened this study.

61
observations, or one-third fewer than the composite teacher-preparation index. Using
both measures helps validate the results. PISA does not include teacher surveys and
the principal surveys have too many missing data for a credible analysis of teacher
preparation as a dependent variable.
OTL variables also differ between the TIMSS and PISA. The PISA offers only
grade level as a proxy for OTL, insomuch as students in 10th grade or higher probably
have had exposure to more advanced mathematical concepts than those in 9th grade or
below. This assumption may not hold for lower SES students who may not take
algebra until the tenth grade. Therefore, comparing results between the high and low
SES groups might be of particular interest in this case. The measure is a dichotomous
variable of 10th grade and above or 9th grade and below, requiring a binomial logit
regression.
The TIMSS captures measures of OTL more thoroughly through teacher
reports of the content covered in classrooms. The TIMSS collects the amount of time
spent by students on five different subjects: algebra, data, geometry, number, and
measurement (TIMSS, 2003). Because algebra and geometry represent the more
difficult subjects in mathematics requiring previous math preparation for the student, I
examine these subjects to identify potential systematic differences in OTL for students
in different SES quintiles. Since the OTL outcomes differ between the TIMSS and
PISA, the outcomes cannot be compared directly. The amount of variance explained
and the significance level of the coefficients will reveal the effectiveness of each
measure of OTL (beyond the obvious differences of more refined TIMSS measures).

62
This study uses ordinary least squares (OLS) estimates to analyze the
relationships between math achievement on PISA and TIMSS and teacher preparation
and OTL on TIMSS. The proxy for OTL in PISA, grade level, requires a binomial
logistic regression. Hierarchical linear modeling (HLM) could help distinguish
between the country and student effects on education outcomes in the first part of the
analysis. However, Appendices 1-3 provide results for country fixed-effects models
that show the overall contribution of countries to student outcomes, providing a
baseline for comparing the relationships of country-level economic variables without
the more complex interpretation of second level γ coefficients obtained using HLM.
Part II continues to evaluate educational equity by using production functions in
eleven countries to explore in-depth how different inputs affect student outcomes.
Because production function theory stipulates an equal possible relationship between
any level of input (classroom, school, etc.) and output, OLS is used in Part II instead
of HLM. Furthermore, OLS estimates unbiased coefficients. Because of the
complexity of survey weights in PISA and TIMSS, the cluster command in STATA
does not operate when using replicate weights. However, analyses using the cluster
command without the survey weights produced similar results.9
9 Advancements in statistical programs should include the option for clustering while estimating multiple samples using replicate weights. Doing this research revealed the dearth of communication within the academic research community and between researchers and software engineers regarding the appropriate methodological techniques for accurate analyses of these complex data. Better communication among these actors is paramount for producing reliable studies across the field of international and comparative education.

63
Analysis Part II: Individual Country Production Functions
Part II of this study measures the relationships between the inputs and
outcomes as analyzed in the form of production functions. Table 2 above provides a
pictorial representation of the formal production function below:
A = α + βX + δC +φS + µ,
where X is a vector of student characteristics, C is a vector of classroom resources, S is
a vector of school capacity (including community size, a proxy for resources available
for schools), and µ, an error term.
In the production function model, every variable has a potential effect as an
input. Policymakers can affect inputs on the teacher, classroom, and school levels as
opposed to inputs of individual and demographic differences that policy cannot
change. As diagrammed above in Table 2, some of these variables remain consistent
between the TIMSS and the PISA; while the OTL variables, however, differ between
the two tests. In this study, the selection of independent variables contains three
vectors: student characteristics, classroom resources, and school capacity. Many of the
classroom and school variables have missing data too large for imputation. Therefore,
they are recoded into either dichotomous variables or terciles (when possible) and the
missing data are also included as a dummy variable to determine whether the missing
responses differ significantly from the non-missing responses.
The first vector of the student characteristics and demographics includes three
variables: SES, gender, and age. In Part II, I estimate production functions both for
overall countries, then for high and low SES quintiles individually to see if differences

64
occur between SES groups. Gender often has a significant effect on school experience
and education performance since males outperform females in math and science, but
not for reading, on both TIMSS and PISA (Ina V. S. Mullis, et al., 2004; OECD, 2003;
PISA, 2001). Student age, especially on TIMSS, might also influence performance.
Results for student SES are not reported in Chapter 6 for low and high SES students
within their respective quintiles, although these results are available in the full tables
in Appendices 4-7.
The second vector, classroom resources, includes math class size, math
instructional time, teacher preparation, and opportunities to learn. Part I uses the latter
two, teacher preparation and OTL, and they remain the same in Part II. Math class size
can make a difference in the amount of attention a student receives from a teacher.
While classes can be too small for beneficial peer effects, generally classes in middle
and high schools suffer because of their great size and the inability of the teacher to
address the separate learning needs of each student. TIMSS measures class size not in
terciles, but categorically by the number of students (1-24 students – 1st group, 25-32
students – 2nd group, and 33 students or more – group 3). Math instructional time
serves as a broader measure of OTL on TIMSS, in addition to the geometry and
algebra measures. On PISA, it serves as a concurrent measure of OTL with grade
level.
The third vector, school capacity, includes the amount of resources available in
schools, the size of the school, and the size of the community surrounding the school.
At the school level, schools with large populations generally have more bureaucratic
systems and more levels of administration that combines to make resource

65
management and allocation a more challenging task than at smaller schools. Added to
the school size factor is the size of the community. Large schools located in urban
areas often face even more budget constraints and the resulting problems of resource
allocation. TIMSS and PISA both capture material resources at schools through one
variable that includes many responses about resource allocation at schools. Both the
TIMSS and PISA ask principals the same questions about the shortage of a number of
items at their schools, such as instructional materials, supply budgets, instructional
space, etc (OECD, 2005; TIMSS, 2005). Both datasets then combine these individual
item responses into an index of material resource availability in schools. According to
the hypotheses above, I expect low SES students to have negative relationships with
classroom resources and school capacity while high SES students receive and benefit
from a greater share of these educational expenditures.
Descriptive Statistics
Table 3 and Table 4 provide gross national income per capita, the Gini
coefficient, and the degree of centralization measures used in the regressions in Part 1
of this study for each of the countries in the PISA and TIMSS samples, respectively. I
order the countries by their estimated Gini coefficients, from low (greater equality) to
high (greater inequality). Table 5 provides information about the variables used in the
country production functions in Part II for PISA. Table 6 then provides the mean
values and standard errors for these variables. Table 7 provides similar information as
Table 5, but for the TIMSS data. Table 8 provides the mean values and standard errors
for the variables outlined in Table 7 and used for the TIMSS production functions in

66
Part II. In these tables, student SES is standardized, having an international mean of 0
and an SD of 1 based on the participating OECD countries in PISA and all countries in
TIMSS. Therefore, the mean SES values in these Table 6 and Table 8 are included for
information about SES as analyzed in the international regressions in Part I of the
study. Because I created the student SES index for TIMSS, the part II SES variable is
standardized at within individual countries. PISA’s variable could not be
restandardized. However, an equal amount of students comprise each of the quintiles
in both PISA and TIMSS, and the quintiles serve as the main analytical focus of this
study.
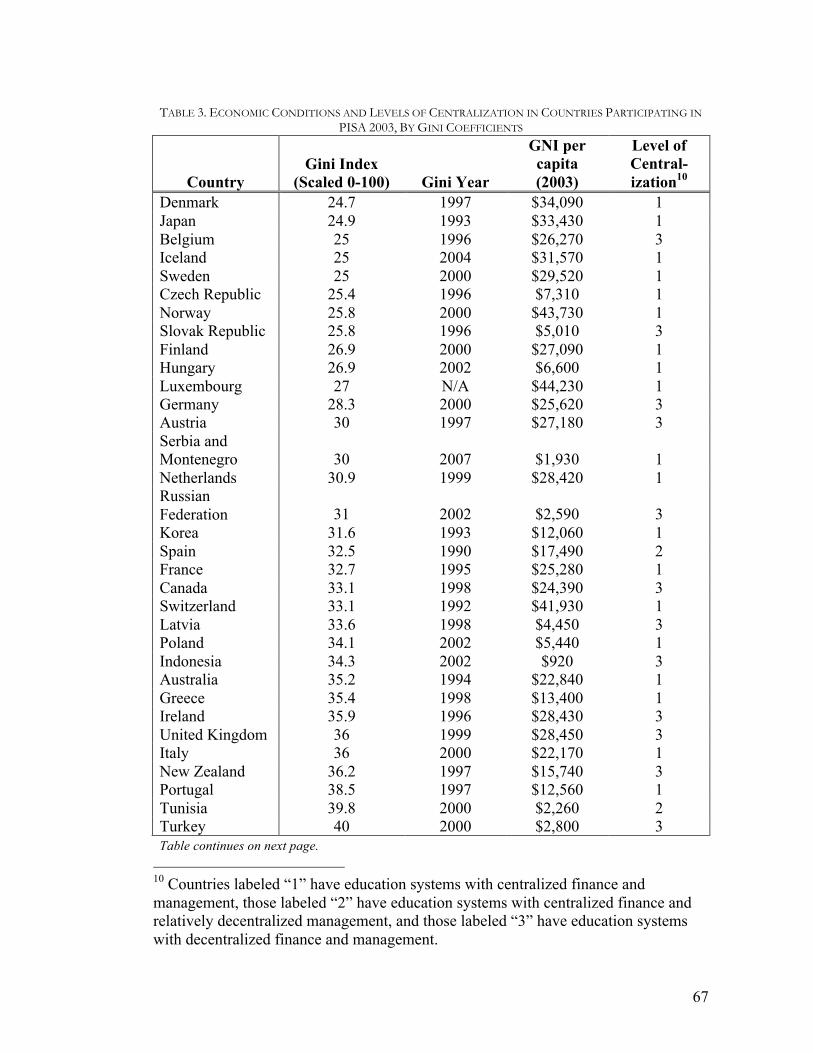
67
TABLE 3. ECONOMIC CONDITIONS AND LEVELS OF CENTRALIZATION IN COUNTRIES PARTICIPATING IN PISA 2003, BY GINI COEFFICIENTS
Country Gini Index
(Scaled 0-100) Gini Year
GNI per capita (2003)
Level of Central-ization10
Denmark 24.7 1997 $34,090 1 Japan 24.9 1993 $33,430 1 Belgium 25 1996 $26,270 3 Iceland 25 2004 $31,570 1 Sweden 25 2000 $29,520 1 Czech Republic 25.4 1996 $7,310 1 Norway 25.8 2000 $43,730 1 Slovak Republic 25.8 1996 $5,010 3 Finland 26.9 2000 $27,090 1 Hungary 26.9 2002 $6,600 1 Luxembourg 27 N/A $44,230 1 Germany 28.3 2000 $25,620 3 Austria 30 1997 $27,180 3 Serbia and Montenegro 30 2007 $1,930 1 Netherlands 30.9 1999 $28,420 1 Russian Federation 31 2002 $2,590 3 Korea 31.6 1993 $12,060 1 Spain 32.5 1990 $17,490 2 France 32.7 1995 $25,280 1 Canada 33.1 1998 $24,390 3 Switzerland 33.1 1992 $41,930 1 Latvia 33.6 1998 $4,450 3 Poland 34.1 2002 $5,440 1 Indonesia 34.3 2002 $920 3 Australia 35.2 1994 $22,840 1 Greece 35.4 1998 $13,400 1 Ireland 35.9 1996 $28,430 3 United Kingdom 36 1999 $28,450 3 Italy 36 2000 $22,170 1 New Zealand 36.2 1997 $15,740 3 Portugal 38.5 1997 $12,560 1 Tunisia 39.8 2000 $2,260 2 Turkey 40 2000 $2,800 3 Table continues on next page.
10 Countries labeled “1” have education systems with centralized finance and management, those labeled “2” have education systems with centralized finance and relatively decentralized management, and those labeled “3” have education systems with decentralized finance and management.

68
Country Gini Index
(Scaled 0-100) Gini Year
GNI per capita (2003)
Level of Central-ization11
United States 40.8 2000 $37,570 3 Thailand 43.2 2000 $2,150 1 Hong Kong 43.4 1996 $25,590 1 Uruguay 44.6 2000 $3,860 2 Macao China 45 N/A $14,600 1 Mexico 54.6 2000 $6,370 3 Brazil 59.3 2001 $2,960 2
Sources: OECD – PISA 2003; World Bank; Maham Mela (centralization levels).
11 Countries labeled “1” have education systems with centralized finance and management, those labeled “2” have education systems with centralized finance and relatively decentralized management, and those labeled “3” have education systems with decentralized finance and management.

69
TABLE 4. ECONOMIC CONDITIONS AND LEVELS OF CENTRALIZATION IN COUNTRIES PARTICIPATING IN TIMSS 2003, BY GINI COEFFICIENTS
Country Gini Coefficient (Scaled 0-100) Gini Year
GNI per capita (2003)
Level of Central-ization12
Japan 24.9 1993 $33,430 1 Belgium 25 1996 $26,270 3 Sweden 25 2000 $29,520 1 Norway 25.8 2000 $43,730 1 Slovak Republic 25.8 1996 $5,010 3 Hungary 26.9 2002 $6,600 1 Macedonia 28.2 1998 $1,990 1 Slovenia 28.4 1998 $11,990 2 Serbia and Montenegro 30 2007 $1,930 1 Romania 30.3 2002 $2,290 2 Netherlands 30.9 1999 $28,420 1 Russia 31 2002 $2,590 3 Scotland 31 N/A $27,312 3 Korea 31.6 1993 $12,060 1 Bulgaria 31.9 2001 $2,230 2 Lithuania 31.9 2000 $4,330 2 Saudi Arabia 32 N/A $9,400 1 Yemen 33.4 1998 $490 2 Latvia 33.6 1998 $4,450 3 Indonesia 34.3 2002 $920 3 Taiwan 34.3 2003 $13,140 1 Egypt 34.4 1999 $1,310 1 Cyprus 35 N/A $15,160 1 Australia 35.2 1994 $22,840 1 Israel 35.5 1997 $16,320 2 Bahrain 36 N/A $12,630 1 England 36 1999 $28,450 3 Italy 36 2000 $22,170 1 New Zealand 36.2 1997 $15,740 3 Jordan 36.4 1997 $2,000 2 Moldova 36.9 2002 $570 1 Palestine 37 N/A $1,319 2 Estonia 37.2 2000 $5,740 2 Armenia 37.9 1998 $950 3 Table continues on next page.
12 Countries labeled “1” have education systems with centralized finance and management, those labeled “2” have education systems with centralized finance and relatively decentralized management, and those labeled “3” have education systems with decentralized finance and management.
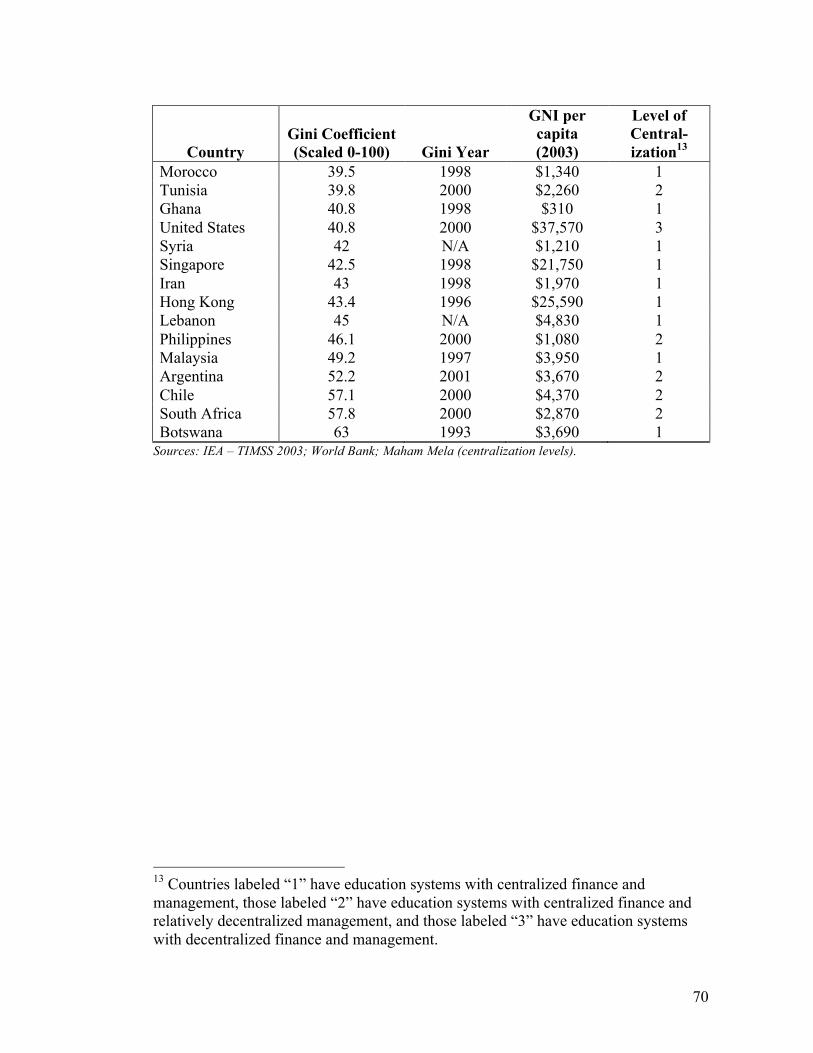
70
Country Gini Coefficient (Scaled 0-100) Gini Year
GNI per capita (2003)
Level of Central-ization13
Morocco 39.5 1998 $1,340 1 Tunisia 39.8 2000 $2,260 2 Ghana 40.8 1998 $310 1 United States 40.8 2000 $37,570 3 Syria 42 N/A $1,210 1 Singapore 42.5 1998 $21,750 1 Iran 43 1998 $1,970 1 Hong Kong 43.4 1996 $25,590 1 Lebanon 45 N/A $4,830 1 Philippines 46.1 2000 $1,080 2 Malaysia 49.2 1997 $3,950 1 Argentina 52.2 2001 $3,670 2 Chile 57.1 2000 $4,370 2 South Africa 57.8 2000 $2,870 2 Botswana 63 1993 $3,690 1
Sources: IEA – TIMSS 2003; World Bank; Maham Mela (centralization levels).
13 Countries labeled “1” have education systems with centralized finance and management, those labeled “2” have education systems with centralized finance and relatively decentralized management, and those labeled “3” have education systems with decentralized finance and management.

71
TABLE 5. VARIABLES AND DESCRIPTIONS USED IN PISA PART II ANALYSIS Variable Vector Variable Description Variable Information SES index Student
Characteristics SES measure including: Highest
parental ISCED level, highest parental occupation, and items at home
Standardized with mean=0 and SD=1
Gender Student Characteristics
Student gender Male = 0 Female = 1
Grade Student Characteristics (DV in Part I)
Grade level of student Min = 10 Max = 23
Math Student/ Teacher Ratio
Classroom Resources
Student/teacher ratio for math in the school
Min = 3 Max = 679
Math time Classroom Resources
Ratio of math to total instructional time
Min = 0 Max = 1
Teacher % MA in Math
Classroom Resources
Proportion of teachers with an MA in mathematics
Min = 3% Max = 100%
School Resources
School Capacity Index of availability of school resources for mathematics instruction
Standardized with mean=0 and SD=1
School Size
School Capacity Total school enrollment – all grades Min = 3 Max = 7781
Community Size
School Capacity Total number of people in the community
1 = fewer than 3,000 2 = 3,001 – 15,000 3 = 15,000 – 100,000 4 = 100,001 – 1,000,000 5 = 1,000,000 or more
Source: OECD – PISA 2003.

72
TABLE 6. MEAN VALUES FOR PISA 2003 VARIABLES IN COUNTRY PRODUCTION FUNCTIONS, BY COUNTRY ECONOMIC CONDITIONS
Country SES % Female Grade
Math Student/Teacher
Ratio (School)
Math Time
Teacher % MA
in Math
School resources
School Size
Community Size
Japan -0.08 52 All 10th 127.6 0.18 Miss -0.09 850.84 3.76 (0.02) Grade (2.96) (0.00) (0.10) (21.95) (0.06) Sweden 0.25 50 0.05 61.0 0.13 0.61 0.03 532.20 2.61 (0.02) (0.01) (3.01) (0.00) (0.02) (0.06) (19.62) (0.06) Australia 0.23 49 0.92 88.6 0.18 0.61 0.18 899.91 3.82 (0.02) (0.00) (1.45) (0.00) (0.02) (0.05) (20.20) (0.06) Italy -0.11 52 0.84 86.8 0.16 0.74 -0.03 707.34 3.24 (0.02) (0.01) (2.24) (0.00) (0.02) 0.07 (19.72) (0.06) Hong Kong -0.76 50 0.58 97.3 0.21 0.44 -0.01 1039.35 N/A (0.03) (0.01) (1.63) (0.00) (0.02) (0.07) (12.67) United States 0.30 50 0.68 125.1 0.21 0.85 0.29 1394.70 2.95 (0.03) (0.02) (2.52) (0.00) (0.01) (0.06) (45.32) (0.05) Hungary -0.07 47 0.29 87.7 0.12 0.97 -0.18 486.63 3.47
(0.02) (0.01) (4.94) (0.00) (0.01) (0.08) (14.32) (0.57) Slovak Republic -0.08 49 0.61 120.8 0.15 0.92 -0.31 494.80 2.73 (0.03) (0.02) (3.72) (0.00) (0.01) (0.05) (12.18) (0.54) Latvia 0.12 52 0.06 134.6 0.16 0.70 0.06 656.34 2.61 0.03 (0.01) (3.72) (0.00) (0.04) (0.07) (23.81) (0.06) Russian -0.09 50 0.68 159.6 0.15 0.88 -0.10 754.22 3.17 Federation (0.02) (0.02) (8.46) (0.00) (0.02) (0.10) (35.13) (0.07) Tunisia -1.34 51 0.37 148.1 0.17 0.76 -0.34 1046.02 2.76 (0.04) (0.01) (1.50) (0.00) (0.02) (0.07) (31.51) (0.07) Notes: Standard errors in parentheses. In Part II of this study, SES country means and school resources are
standardized at 0 with a standard deviation of 1. Therefore, internationally based SES means are presented here for context. Source: OECD – PISA 2003.

73
TABLE 7. VARIABLES AND DESCRIPTIONS USED IN TIMSS PART II ANALYSIS Variable Vector Variable Description Variable Information SES index Student
Characteristics SES measure including: Highest
parental ISCED level and items at home
Standardized with mean=0 and SD=1
Gender Student Characteristics
Student gender Male = 0 Female = 1
Age Student Characteristics
Student age Min = 10 Max = 23
Class size Classroom Resources
Class size for mathematics instruction
1 = 1-24 students 2 = 25-32 students 3 = 33-40 students 4 = 41 or more students
Math time Classroom Resources
Minutes of math taught each week Min = 3 Max = 600
Teacher Preparation
Index
Classroom Resources
(DV in Part I)
Teacher preparation index including: degree of education completed,
Teacher MA in mathematics, and completed teacher certification
Min = 1 Max = 8
OTL Classroom Resources
(DV in Part I)
Percentage of class time spent on combined algebra and geometry
mathematics topics
Min = 0 Max = 100
School Resources
School Capacity Index of availability of school resources for mathematics instruction
1 = high 2 = middle 3 = low
School Size
School Capacity Total school enrollment – all grades Min = 21 Max = 9999
Community Size
School Capacity Total number of people in the community
1 = more than 500,000 2 = 100,001 – 500,000 3 = 50,001 – 100,000 4 = 15,001 – 50,000 5 = 3,001 – 15,000 6 = fewer than 3,000
Source: IEA – TIMSS 2003.

74
TABLE 8. MEAN VALUES FOR TIMSS 2003 VARIABLES IN COUNTRY PRODUCTION FUNCTIONS, BY COUNTRY (SORTED BY ECONOMIC CONDITION)
Country SES Percent Female Age Class
Size Math Time
Teacher Prep. Index
OTL School Resources
School Size
Community Size
Japan 0.51 0.51 14.40 2.77 158.86 5.07 65.11 1.43 513.68 2.46 (0.02) (0.01) (0.00) (0.03) (3.40) (0.02) (1.30) (0.04) (9.38) (0.07) Sweden 0.66 0.49 14.89 1.31 153.87 5.34 40.68 1.63 507.00 3.69 (0.02) (0.01) (0.01) (0.04) (2.97) (0.05) (0.81) (0.04) (13.76) 0.13) Australia 0.63 0.48 13.88 1.74 207.83 5.70 40.53 1.45 888.15 2.71 (0.02) (0.02) (0.02) (0.05) (4.46) (0.05) (1.20) (0.04) (28.46) (0.15) Italy 0.20 0.50 13.89 1.21 226.67 5.16 60.55 1.63 641.43 3.77 (0.03) (0.01) (0.01) (0.03) (2.49) (0.03) (0.78) (0.04) (12.57) (0.10) Hong Kong -0.09 0.50 14.39 3.32 261.68 5.50 59.77 1.38 1070.23 1.79 (0.02) (0.02) (0.02) (0.05) (8.14) (0.06) (1.23) (0.04) (10.54) (0.08) United States 0.43 0.48 14.23 1.51 226.01 5.79 55.02 1.49 720.77 3.70 (0.02) (0.01) (0.01) (0.04) (3.30) (0.03) (1.13) (0.04) (21.12) (0.08) Hungary 0.58 0.50 14.51 1.38 184.82 Miss 53.94 1.69 483.36 3.85
(0.30) (0.01) (0.01) (0.04) (2.35) (0.69) (0.04) (17.76) (0.10) Slovak Republic 0.34 0.52 14.32 1.64 201.15 6.13 61.74 2.03 496.69 4.32 (0.03) (0.01) (0.01) (0.05) (2.33) (0.04) (1.18) (0.04) (13.37) (0.09) Latvia 0.43 0.51 15.05 1.56 211.52 Miss 69.32 1.90 637.61 4.08 (0.03) (0.01) (0.02) (0.06) (1.60) (1.61) (0.04) (21.34) (0.14) Russian 0.47 0.51 14.19 1.59 229.96 5.77 84.11 2.20 723.48 3.51
Federation (0.04) (0.01) (0.02) (0.07) (3.30) (0.04) (1.33) (0.04) (20.70) (0.12) Tunisia -0.74 0.47 14.81 2.73 225.64 5.92 46.18 1.98 954.90 4.08 (0.04) (0.01) (0.03) (0.04) (1.72) (0.04) (0.93) (0.04) (28.51) (0.08) Notes: Standard errors in parentheses. In Part II of this study, SES country means are standardized at 0 with a standard deviation of 1. Therefore, internationally based SES means are presented here for context. Source: IEA – TIMSS 2003.

75
Chapter 4: The Level and Distribution of Student Achievement Across Country Economic Level and Income Distribution
Part I of this study examines the relationships between three educational
outcomes —student achievement, teacher preparation, and opportunities to learn —
with individual student SES, participating country income per capita, income
distribution within countries, and levels of centralization in country educational
systems. Chapter 4 focuses solely on the relationship between student achievement
and these predictor variables. Internationally, if the distribution of student
performance varies significantly across different social class groups in countries with
different incomes per capita and income distributions, establishing how these
distributions differ provides information about the role of national economic policies
for education. Furthermore, ascertaining whether the distribution of education
resources diverge or converges according to SES will provide impetus for identifying
how these distributions differ on a national level in the Part II analysis.
Relating Student Achievement to Economic Conditions
To examine the above relationships, I estimate OLS regressions of student
achievement and compare variations in coefficient sizes and significance levels for
different socio-economic groups while accounting for economic differences and levels
of centralization in countries. Each set of regressions begins with two baseline models
that establish the initial relationships between PISA or TIMSS mathematics

76
achievement and student SES. One model employs student SES as a single continuous
variable, while the second model disaggregates SES into quintiles that better illustrate
the relationships of student SES and student achievement for different types of
students.
I subsequently add the GNI per capita and Gini coefficients of participating
countries to the base models (Table 9 – Table 23)14, again estimating the coefficients
of both continuous SES and SES quintiles. Because GNI per capita and the Gini
coefficient are rather highly correlated, I do not include the Gini when examining GNI
per capita. However, I do include GNI per capita when examining the Gini-
achievement relationship to control for overall country wealth. I then incorporate
interaction terms between the GNI per capita and student SES and the Gini and
student SES for each model. The interaction terms explain whether the relationship
between student achievement and SES differs significantly between countries with
higher or lower income per capita and income inequality.
This section of the study compares countries internationally, specifically
examining variation in income inequality. However, because of the somewhat limited
country selection, the Gini coefficients of countries in this study are concentrated
between 0.25 and 0.45. Many countries in Latin America and Africa have Gini
coefficients of around 0.55. While this study does include a substantial range for the
14 To make interpretation easier, I divide GNI per capita by $1,000 so that the beta coefficient (β) represents thousands of dollars. One can multiply a GNI per capita coefficient by 10 and understand the effect of a change of $10,000 in country income. Similarly, one can multiply the Gini coefficient by 10 to see the changes in test scores corresponding to a 0.10 increase in income inequality on the Gini scale of 0-1.

77
Gini coefficient, the sample of countries that took both PISA and TIMSS remains
right-censored for income inequality.
The concerns are two-fold. First, the relationships between income inequality
and student achievement might not be accurately measured from a global perspective.
Secondly, the few high-income inequality countries included now function as outliers,
potentially having larger relationships to the SESxGini interaction slopes than might
otherwise occur. Further research including more Latin American and African
countries would likely mediate both of these concerns.
I add a measure of the degree of educational centralization within each
country’s education system. I distinguish countries that centralize both the financial
and management aspects of their education systems (the reference category) from two
other types of countries: countries with financial centralization but decentralized
management and countries with both financial and managerial decentralized systems
of education. In the sample of PISA countries, only four countries have decentralized
management and centralized finance (Brazil, Spain, Tunisia, and Uruguay). Therefore,
the low sample size makes results for this category subject to individual country
artifacts.
A concrete explanation of statistical interactions and their direct application in
this study will help clarify the results. A basic interaction equation includes two
independent variables and a variable consisting of these variables multiplied together:
Yi = β0 + β1X1i + β2X2i + β3(X1*X2i) + εi
where, in this study, Yi is student achievement, β0 is the y-intercept, X1i is student SES,
X2i is GNI per capita or Gini coefficients, and εi is the error term. In regressions using

78
interaction terms, the β coefficient for the original variable or main effect (such as
student SES) represents the relationship between the dependent variable (such as PISA
student achievement) and student SES when other predictor variables like GNI per
capita or Gini equal 0. The interaction β coefficient shows how much weaker or
stronger the relationship is between student achievement and student SES. If the β3
coefficient for the interaction term (X1*X2i) is significant, adding that coefficient to the
main effect provides the final coefficient for the relationship between student SES and
student achievement. This coefficient corresponds to a one-unit increase in the other
interaction variable (GNI per capita or Gini), meaning that the relationship of SES to
student achievement varies as income per capita or income inequality increases.
Figures accompany the regression tables to show the interaction slopes (β3) for the
student SES quintiles, the β3 coefficients, and the significance levels using the
predicted achievement scores plotted according either income per capita or income
inequality. Similar graphs show slope differences for SES quintiles for all PISA and
TIMSS regressions with math achievement, TP, and OTL as dependent variables in
both Chapters 4 and 5.
To determine the predicted score changes, I multiply the GNI per capita by 10
and add this interaction coefficient to the student SES β1 coefficient. When examining
student SES quintiles, I add the interaction β3 coefficient for the high SES quintile
multiplied by the GNI per capita to the β1 coefficient for the high SES quintile (or
main effect). This combined SES β3 coefficient represents the change in PISA math
achievement for high SES students for every increase of $10,000 in GNI per capita. In
each model, an increase in income per capita could lead to an increase or a decrease in

79
the relationship between student SES and achievement for high SES groups. The same
procedure of multiplying the SES-Gini interaction by 10 and adding it to the main
effect yields the same type of score prediction as using the GNI per capita.
Interacting student SES quintiles and GNI per capita or the Gini coefficient
addresses the main goals of understanding how students from different backgrounds
perform differently on PISA and TIMSS and how outcomes differ for students in
countries with lower or higher income and smaller or greater income disparities. To
make these differences clearer, discussion of the results includes, when useful,
examples from three countries with different economic conditions and levels of
centralization– Sweden, Tunisia, and the United States. These countries serve as
theoretical examples to help clarify conceptually difficult interaction effects. Results
do not reflect actual situations in each country because many more factors could
influence education systems, but using them as examples helps solidify understanding
of the trends in relationships between economic conditions and education systems.
Student Achievement, Student SES, and Country Income in PISA
The ordinary least squares (OLS) regression results using PISA scores for
student achievement show student SES as statistically significant in every model. In
the baseline Model 1 of Table 9, an increase of 1 SD in student SES accounts for
almost half of an SD in test scores, or 46 points. However, as Model 2 shows, these
differences are unequal among SES quintiles. Students in the lowest SES quintile
score 47 points lower than those in the middle SES quintile, or almost 0.5 of an SD.
The difference between middle quintile SES students and their highest SES
counterparts is also relatively large, with the highest SES students scoring 55 points

80
higher than middle SES students, or slightly more than 0.5 of an SD higher. In
aggregate, the achievement difference between the bottom and top SES quintiles is
around one SD for PISA mathematics. This result confirms findings from the Coleman
(1966) and Rothstein (2004) research track demonstrating the enormous role of SES in
student achievement.
Differences in the coefficients for the middle-low SES and middle-high SES
student, compared to middle SES students, remain significant, but these students score
around 0.2 of an SD below and above their middle SES counterparts, respectively.
PISA results show significant differences among all SES groups in the initial model
with large differences in the coefficients for the lowest and highest SES groups. These
initial results show that, without accounting for other factors, students coming from
especially low or high SES families have large score differences on PISA compared to
their middle SES counterparts. These baseline models predict 22% and 11% of the
variance in PISA math scores, respectively. In general, the R-squares for models using
the SES quintiles are lower than those with continuous SES because of the decrease in
variation. Therefore, the continuous SES models better demonstrate the magnitude of
the relationship between SES and achievement while the SES quintile models offer a
finer-grained view of the relationship of PISA scores to different student SES levels.
Adding income per capita and its interaction with SES in Models 3 and 4 in
Table 9 illustrates how much a country’s overall income relates to student
achievement for students in different SES quintiles. In Model 3, which uses the
continuous SES variable, income per capita does significantly relate to achievement
on PISA. First, the coefficient for continuous student SES increases from the baseline

81
model by 5 points, meaning that SES becomes more important for students after
accounting for country income, a finding corroborated by Model 4. The results for
income per capita show that an additional $10,000 increase in country income
corresponds to an increase of 14 points in student achievement.
To place these results in context, in 2003, the United States had an income per
capita of $37,570, around $35,000 higher than Tunisia ($2,260) and $8,000 higher
than Sweden ($29,520). After controlling for income per capita, the average 15-year-
old in a country with an income per capita similar the United States would score 49
points higher than the average Tunisian student on the PISA math assessment, ceteris
paribus. Furthermore, the average American student would score around 12 points
higher on PISA than the average Swedish 15-year-old when accounting for country
income per capita. While the main effect of income per capita is significant in Model
3, the interaction between income per capita and the continuous SES measure is not
significant in this model. This result suggests that the difference in PISA scores across
SES groups does not vary significantly for countries at different levels of gross
national income per capita.
In Table 9, Model 4 uses SES quintiles, income per capita, and interaction
terms between income per capita and the SES quintiles. This method enables us to
disaggregate the possible slope effects by SES level. When accounting for country
income, students in the lowest quintile have less disparity in PISA scores from their
middle SES counterpoints than in the baseline model, a difference of around 0.4 of an
SD. On the opposite end, high SES students outscore their middle SES counterparts by
more than 0.6 of an SD on PISA. Also, in Model 4, the interactions between SES
82
quintiles and the GNI coefficient are not significant. Figure 9 offers a graphical
representation of these results, showing the achievement coefficient for each SES
quintile. The interactions are not significant, suggesting that the PISA score
differences across SES groups do not change as income per capita increases.
Models 5 and 6 in Table 9 add an additional country-level categorical variable
that identifies country education systems as either fully decentralized, decentralized in
management but with centralized finances, or fully centralized in both management
and finances. The fully centralized countries serve as the reference category, although
as mentioned above, PISA only has four countries with decentralized management and
centralized finances. The decentralization variables are not significant in either model
for country income and math achievement in PISA, and the SES quintile slopes shown
in Figure 10 remain similar to those in Figure 9. Overall, Table 9 shows that as
country income per capita increases, student mathematics achievement on PISA
increases similarly for every SES quintile, confirming findings from Chiu and Khoo
(2005).

83
TABLE 9. ESTIMATED OLS COEFFICIENTS OF PISA 2003 MATH ACHIEVEMENT SCORES ON SOCIO-ECONOMIC STATUS, SES QUINTILES, GNI PER CAPITA, AND LEVELS OF DECENTRALIZATION
Independent Variables
Model 1: SES
Continuous
Model 2: SES
Quintiles
Model 3: SES Continuous
& GNI
Model 4: SES Quintiles
& GNI
Model 5: SES Continuous, GNI, &
Decentralization
Model 6: SES Quintiles, GNI, & Decentralization
SES 46.30*** 51.07*** 48.33*** (13.27) (4.04) (6.88) Low SES -47.73*** -37.57** -37.64* (2.80) (13.90) (15.99) Mid-low SES -17.87*** -13.86*** -13.93** (2.68) (4.01) (4.91) Mid-high SES 20.04*** 20.77** 21.09** (1.60) (8.04) (7.94) High SES 55.11*** 61.49*** 61.90*** (9.58) (3.88) (3.99) GNI 03 1.41*** 2.68* 1.03** 2.16* (0.40) (1.07) (0.37) (1.03) SES x GNI 03 -0.63 -0.53
(0.55) (0.80) Low SES -0.50 -0.49 x GNI 03 (0.69) (0.78) Mid-low SES -0.20 -0.19 x GNI 03 (0.32) (0.35) Mid-high SES -0.06 -0.06 x GNI 03 (0.45) (0.45) High SES -0.39 -0.40 x GNI 03 (0.29) (0.31) Decentralized -52.26 -66.70
Management (51.28) (44.70) Decentralized -14.07 -12.22
Completely (55.58) (59.67) Table continues on next page.

84
Independent Variables
Model 1: SES
Continuous
Model 2: SES
Quintiles
Model 3: SES Continuous
& GNI
Model 4: SES Quintiles
& GNI
Model 5: SES Continuous, GNI, &
Decentralization
Model 6: SES Quintiles, GNI, & Decentralization
Constant 493.50*** 484.14*** 468.62*** 434.21*** 485.35*** 454.67*** (37.47) (57.44) (42.46) (63.67) (3.21) (16.00) Observations 271772 271772 271772 271772 271772 271772 R-squared 0.22 0.11 0.25 0.20 0.27 0.23 Notes: Standard errors in parentheses. *** p<0.001, ** p<0.01, * p<0.05 Middle SES quintile and centralized countries serve as reference categories. GNI per capita measured in thousands of dollars. Source: OECD – PISA 2003.

85
FIGURE 9. SES QUINTILE SLOPES FROM OLS REGRESSION OF PISA 2003 MATH SCORES AND GNI PER CAPITA (2003)

86
FIGURE 10. SES QUINTILE SLOPES FROM OLS REGRESSION OF PISA 2003 MATH SCORES, GNI PER CAPITA (2003), AND DECENTRALIZATION

87
Student Achievement, Student SES, and Income Inequality in PISA
As shown above for student achievement on PISA, country income per capita
greatly increases student achievement but does not influence differences in student
achievement across SES groups within each country. Income inequality within
countries represents another potential factor influencing student performance.
Originally, I hypothesized that lower SES students in more-unequal countries have
relatively lower test scores than in countries with more-equal income distributions.
Higher SES students would have relatively higher scores in countries with higher
levels of income inequality. However, in the case of PISA, the SES-Gini interactions
are not significant in either case, with some anomalous results requiring further
research. The main finding reveals that higher income inequality appears to have a
negative relationship with average test scores as illustrated in Figure 11, which shows
a downward slope for all SES quintiles.
Table 10 provides the OLS results on math achievement when I include GNI
per capita, the Gini coefficient, the SES-Gini interaction terms, and levels of
decentralization as predictor variables. The Gini coefficient and SES-Gini interaction
added in Model 3 show that neither SES nor the Gini remains significant. SES
strongly relates to achievement; therefore, including a predictor that hides the
significance of SES vis-à-vis achievement raises questions. Furthermore, the reality
that SES and the Gini both measure income dispersion at different levels may lead to
this perplexing result. Analyzing the SES quintiles provides possible answers but lacks
a definitive conclusion.

88
Model 4 in Table 10 shows the results of interacting Gini-SES quintiles, with
the negative coefficient for the lowest SES quintile increasing around -0.5 of an SD
from Model 2 to over -0.7 of an SD while the mid-low SES quintile increases 0.1 of
an SD to around -0.3 of an SD. The positive coefficient for the high SES students also
decreases in size by over 0.1 of an SD. Furthermore, the Gini coefficient is significant,
with an increases in income inequality of 0.1 on the Gini corresponding to an
achievement decrease of around 0.3 of an SD in math scores. Accounting for income
inequality increases the relationship between test scores and SES for low SES students
while decreasing the relationship for high SES students. Models 5 and 6 in Table 10
do not show a significant relationship between decentralization and achievement when
accounting for income inequality.
Figure 11 and Figure 12 display the expected trend between student
achievement and income inequality. The trends in these graphs illustrate that scores
decrease for all SES groups as income inequality increases. I hypothesized that scores
would increase for the highest SES group as they likely receive a larger share of
country income and educational resources than students in countries with more-equal
income distributions, but that does not occur. Instead, scores for high SES students
fall, although they appear to increase relative to other SES groups as income
inequality increases. The figures also show a convergence of the lower four SES
quintiles, but the interactions are not statistically significant in PISA.
The SES-Gini interactions for the TIMSS data discussed below are significant
for the highest SES quintile, a finding confirming the PISA SES slope trends shown in
Figure 11 and Figure 12. The difference in significance levels raises the possibility

89
that the pool of countries in PISA differs in an important way from the TIMSS sample.
Since TIMSS provides a broader range of economic diversity in its sample than
PISA’s OECD-centric model, it could account for the stronger relationships between
income inequality, SES, and math achievement in TIMSS. This study then replicates
the above analysis above using the TIMSS data.

90
TABLE 10. ESTIMATED OLS COEFFICIENTS OF PISA 2003 MATH ACHIEVEMENT SCORES ON SOCIO-ECONOMIC STATUS, SES QUINTILES, GNI PER CAPITA, GINI COEFFICIENTS, AND LEVELS OF DECENTRALIZATION
Selected Independent Variables
Model 1: SES
Continuous
Model 2: SES
Quintiles
Model 3: SES Continuous
& Gini
Model 4: SES Quintiles
& Gini
Model 5: SES Continuous, Gini, &
Decentralization
Model 6: SES Quintiles, Gini, & Decentralization
SES 46.30*** 41.81 41.61 (13.27) (49.85) (42.94) Low SES -47.73*** -73.97* -72.37* (2.80) (30.59) (29.86) Mid-low SES -17.87*** -29.31* -29.32* (2.68) (13.17) (14.15) Mid-high SES 20.04*** 20.71** 20.21* (1.60) (7.59) (8.26) High SES 55.11*** 40.52* 39.77** (9.58) (15.84) (15.28) GNI 03 1.21*** 1.79 0.97* 1.58 (0.21) (1.08) (0.46) (1.39) Gini -1.39 -2.96* -0.7 -2.3 (3.38) (1.30) (3.38) (1.74) SES x Gini -0.1 -0.08 (1.15) (0.95) Low SES 0.8 0.76 x Gini (0.79) (0.75) Mid-low SES 0.34 0.35 x Gini (0.42) (0.45) Mid-high SES -0.03 -0.01 x Gini (0.20) (0.22) High SES 0.41 0.43 x Gini (0.55) (0.52) Decentralized -48.99 -47.97
Management (26.36) (43.44) Table continues on next page.

91
Selected Independent Variables
Model 1: SES
Continuous
Model 2: SES
Quintiles
Model 3: SES Continuous
& Gini
Model 4: SES Quintiles
& Gini
Model 5: SES Continuous, Gini, &
Decentralization
Model 6: SES Quintiles, Gini, & Decentralization
Decentralized -13.25 -8.55 Completely (35.35) (38.19)
Constant 493.50*** 484.14*** 516.62*** 551.42*** 507.27*** 540.73*** (37.47) (57.44) (95.47) (6.76) (111.70) (32.82) Observations 271772 271772 271772 271772 271772 271772 R-squared 0.22 0.11 0.25 0.23 0.27 0.24 Notes: Standard errors in parentheses. *** p<0.001, ** p<0.01, * p<0.05 Middle SES quintile and centralized countries serve as reference categories. Source: OECD – PISA 2003.

92
FIGURE 11. SES QUINTILE SLOPES FROM OLS REGRESSION OF PISA 2003 MATH SCORES, GNI PER CAPITA, AND GINI COEFFICIENTS

93
FIGURE 12. SES QUINTILE SLOPES FROM OLS REGRESSION OF PISA 2003 MATH SCORES, GNI PER CAPITA, GINI COEFFICIENTS, AND DECENTRALIZATION

94
Student Achievement, Student SES, and Country Income in TIMSS
Turning to the TIMSS, Models 1 and 2 in Table 11 show a similar, highly
significant relationship between student SES and student achievement with smaller
differences in the magnitudes of coefficients between SES quintiles than those found
in PISA. In baseline Model 1, a one-SD increase in SES accounts for a 58-point
increase in TIMSS scores without controlling for other variables. However, SES
quintiles in Model 2 reveal that the lowest SES students score around 0.3 of an SD
lower than their middle SES counterparts, a much smaller gap than PISA. The highest
SES quintile students score around 0.5 of an SD higher than their middle SES peers,
similar to PISA. Furthermore, the lower-middle SES quintiles have a smaller spread
between the coefficients than in PISA. These differences suggest that lower SES
groups have smaller achievement gaps vis-à-vis their middle SES peers in TIMSS than
PISA.
Models 3 and 4 add GNI per capita and the SES-GNI interaction terms to the
baseline regressions (Table 11). The GNI per capita is significant and accounts for a
17-point increase in TIMSS math scores for every $10,000 increase in country
income. Using country examples, an average student in a country like the United
States would score 14 points higher on TIMSS than his or her counterpart in Sweden
and 60 points higher on TIMSS than a similar student in Tunisia. This relationship
between GNI per capita and math achievement is similar in TIMSS and PISA.
Models 3 and 4 incorporate the interaction effects created by multiplying the
SES and GNI per capita. In countries with higher income per capita, the relationship

95
between SES and achievement is slightly but significantly less positive than the
relationship in lower-income countries. Model 4 shows that the interactions are
significant for the lower two SES quintiles. Figure 13 illustrates the divergence in the
slopes for the five groups of SES students compared to their peers in other quintiles.
These results show that higher-income countries have larger gaps between their low
SES students and their middle SES peers than lower-income countries. The gaps
between the higher SES students and the middle do not increase significantly. These
results tend to confirm PISA results showing a trend toward divergence between low
SES and middle SES quintiles. More importantly, these results somewhat confirm
Heyneman and Loxley’s (1983) finding that SES matters less for achievement in
lower-income countries than in higher-income countries. The corollary for this
finding, that schooling matters more in lower-income countries, is tested in Chapter 6.
The differences between PISA and TIMSS could reflect differences in country
samples, with TIMSS having a greater number of lower income countries. If so, the
larger representation of countries in TIMSS could demonstrate a greater predictive
power using a broader range of economic systems. However, the differences could
also reflect the nature of the PISA and TIMSS tests. Since TIMSS is a curriculum-
based test, results could come from more curriculum tracking in higher income
countries, particularly for lower (also ethnically different) SES groups. Later chapters
explore these issues.
Adding the centralization variables in Models 5 and 6 of Table 11 reveals that
the coefficients for decentralized management and complete decentralization are
significant in both models. In TIMSS, compared to countries with centralized

96
education systems, those with decentralized management or complete decentralization
have significantly lower scores across SES groups. Including decentralized countries
in the analysis changes the SES-GNI per capita interaction coefficients little.
Figure 12 shows that the slopes of lower SES and middle SES students
continue to diverge—particularly at the lower SES groups—after accounting for levels
of decentralization. Overall, the TIMSS results show significant increasing
disadvantages for lower SES students as country per capita income rises. Furthermore,
in decentralized education systems, average test scores tend to be lower when
accounting for GNI per capita and student SES.

97
TABLE 11. ESTIMATED OLS COEFFICIENTS OF TIMSS 2003 MATH ACHIEVEMENT SCORES ON SOCIO-ECONOMIC STATUS, SES QUINTILES, GNI PER CAPITA, AND LEVELS OF DECENTRALIZATION
Selected Independent Variables
Model 1: SES
Continuous
Model 2: SES
Quintiles
Model 3: SES Continuous
& GNI
Model 4: SES Quintiles
& GNI
Model 5: SES Continuous, GNI, &
Decentralization
Model 6: SES Quintiles, GNI, & Decentralization
SES 58.47*** 50.08*** 49.78*** (0.90) (1.02) (1.05) Low SES -32.92*** -21.06*** -21.19*** (1.22) (1.64) (1.47) Mid-low SES -13.12*** -8.69*** -9.52*** (1.31) (1.84) (1.60) Mid-high SES 21.20*** 18.94*** 20.19*** (1.55) (2.24) (2.00) High SES 52.32*** 52.02*** 53.31*** (2.35) (3.20) (2.93) GNI 03 1.77*** 3.30*** 1.31*** 2.78*** (0.07) (0.10) (0.07) (0.10) SES x GNI 03 -0.19*** -0.19***
(0.05) (0.05) Low SES -0.80*** -0.79*** x GNI 03 (0.10) (0.09) Mid-low SES -0.29*** -0.27*** x GNI 03 (0.08) (0.07) Mid-high SES 0.04 -0.02 x GNI 03 (0.09) (0.09) High SES -0.21 -0.28** x GNI 03 (0.11) (0.10) Decentralized -69.94*** -71.79***
Management (2.56) (2.68) Decentralized -9.61*** -6.03**
Completely (2.11) (2.34) Table continues on next page.

98
Selected Independent Variables
Model 1: SES
Continuous
Model 2: SES
Quintiles
Model 3: SES Continuous
& GNI
Model 4: SES Quintiles
& GNI
Model 5: SES Continuous, GNI, &
Decentralization
Model 6: SES Quintiles, GNI, & Decentralization
Constant 464.71*** 453.16*** 441.00*** 409.70*** 462.87*** 431.20*** (0.75) (1.51) (1.21) (2.16) (1.26) (1.89) Observations 228706 228706 228706 228706 228706 228706 R-squared .28 .07 .33 .23 .37 .27 Notes: Standard errors in parentheses. *** p<0.001, ** p<0.01, * p<0.05 Middle SES quintile and centralized countries serve as reference categories. SES missing values mean imputed. GNI per capita measured in thousands of dollars. Source: IEA – TIMSS 2003.
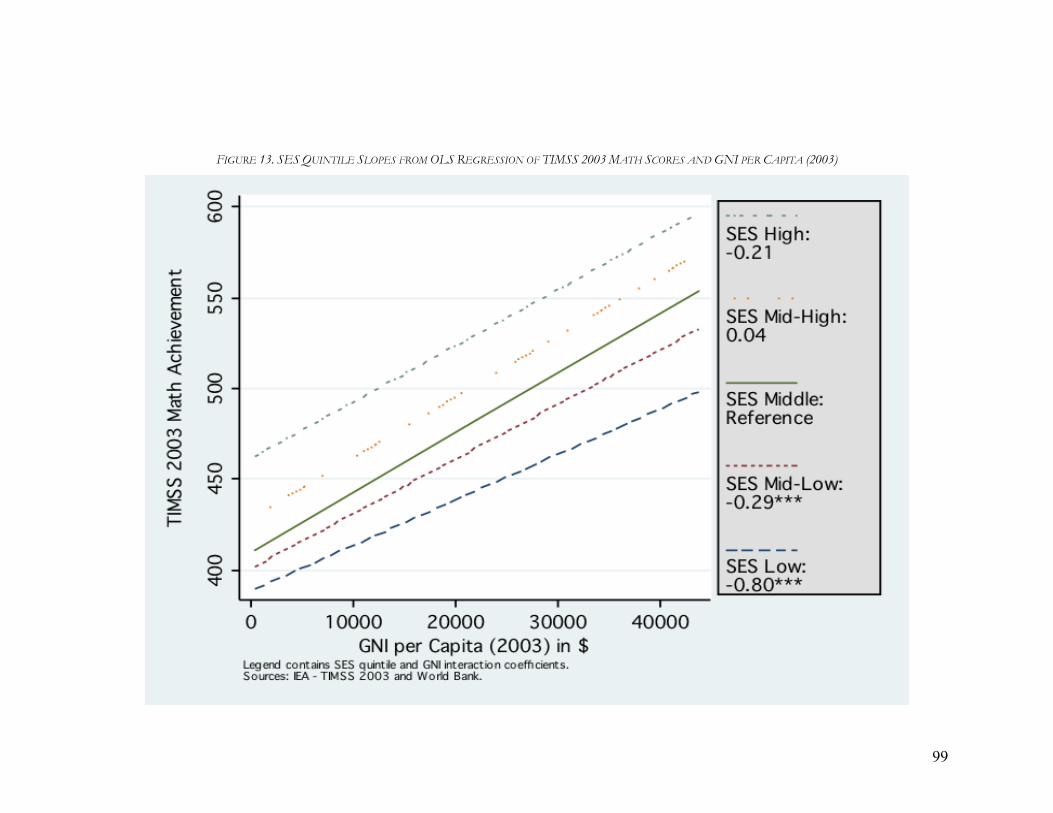
99
FIGURE 13. SES QUINTILE SLOPES FROM OLS REGRESSION OF TIMSS 2003 MATH SCORES AND GNI PER CAPITA (2003)

100
FIGURE 14. SES QUINTILE SLOPES FROM OLS REGRESSION OF TIMSS 2003 MATH SCORES, GNI PER CAPITA (2003), AND DECENTRALIZATION

101
Student Achievement, Student SES, and Income Inequality in TIMSS
Unlike the PISA analysis, math achievement on TIMSS relates significantly
and negatively with the Gini coefficient in all models. As income inequality increases,
test scores decrease, although in different ways for different SES students. The first
two models in Table 12 show the same relationships of SES to math achievement in
TIMSS as in the previous section. Model 3 shows that TIMSS test scores are much
lower in countries with more-unequal income distribution and, given the positive,
significant coefficient for the SES-Gini interaction, the difference in test scores
between lower and higher SES students tends to increase.
Results from Model 4 using the SES quintiles provide more information about
this finding. Model 4 indicates that the main impact of more-unequal income
distribution on the gap between test scores of higher and lower SES students occurs at
the higher SES levels. Nevertheless, math scores for high SES students in more-
unequal countries are still much lower when compared to their high SES peers in
more-equal income countries. Figure 15 illustrates the differences in the SES quintiles,
showing the increasing divergence in achievement gap for high SES students
compared to other SES groups. Including the two levels of decentralization in the
regression in Models 5 and 6 does change the SES-Gini relationship found in Models
3, but not Model 4. Figure 16 illustrates the similar overall divergence of math scores
between SES groups when including the decentralization variables in the regression.
These TIMSS findings partially confirm my initial hypothesis that income
inequality results in an increased dispersion of math achievement between SES

102
quintiles. Income inequality negatively relates to math achievement for students with
all levels of SES. High SES students in countries with higher income inequality have
much lower scores compared to their high SES student counterparts in more-equal
countries (in part because increased inequality is associated with lower income per
capita), but they do have an advantage when compared to their in-country peers in
other SES quintiles.
These findings suggest that having high levels of income inequality in a
country offers few educational benefits. High SES students perform lower than their
peers internationally although being wealthier does help them from a within-country,
or national, perspective. For lower SES students, the achievement gap between the
highest 20% and the lowest 80% of the student population increases somewhat as
inequality increases, meaning that the more unequal the income of countries, the better
the high SES quintile of the students performs in mathematics relative to the rest of the
students, an outcome with potential labor market and social ramifications.
To summarize, in the case of the TIMSS test, average scores rise with higher
income per capita and decline with greater inequality of income in the population. The
decline in average test scores with greater inequality is the case even when controlling
for average income per capita. Further, as income per capita increases, TIMSS test
scores diverge between lower and middle SES students, and appear to converge
slightly between higher and middle SES students. The net effect, however, is that the
difference in TIMSS math test scores rises with increased income per capita, but the
gap between lower and higher SES students gets wider as income per capita increases.
This result is unexpected.

103
At the same time, average TIMSS math scores decline with rising income
inequality, and the divergence between test scores in the highest SES group and the
others increases. This is an expected result. Therefore, students in lower-income
countries could have lower TIMSS scores on two grounds: they have less income per
capita and greater income inequality. But the variation in test scores could be lower in
lower income countries because of lower income per capita and the variation might be
higher because of higher income inequality.
Both PISA and TIMSS show that income inequality negatively correlates with
student math achievement. This correlation does not become positive for high SES
students; it remains negative and relatively uniform for all SES quintiles. Essentially,
the mean achievement levels decrease as income inequality increases. Therefore, the
results might imply that simply lowering the level of income inequality would increase
achievement scores. However, that simplistic view demands further analysis of how
governmental and cultural mechanisms that create income inequality behave in order
to attempt change. Given the under-theorized nature of the Gini coefficient, such an
analysis remains difficult, but some possible explanations exist.
The question becomes “What are the specific features of the more unequal
countries that might relate to lower student performance?” One potential answer is the
existence of a within-country ceiling effect in which students believe that they perform
well, but they actually live in a country with a lower overall mean performance. These
students would then have lower international performance because the entire country
system might have lowered expectations. Another method from the educational
perspective would be to examine important inputs in the educational system and

104
identify links to outcomes in countries with different levels of income inequality.
Chapter 5 replicates the student achievement analyses above for two such important
inputs: teacher preparation and opportunities to learn.

105
TABLE 12. ESTIMATED OLS COEFFICIENTS OF TIMSS 2003 MATH ACHIEVEMENT SCORES ON SOCIO-ECONOMIC STATUS, SES QUINTILES, GNI PER CAPITA, GINI COEFFICIENTS, AND LEVELS OF DECENTRALIZATION
Selected Independent Variables
Model 1: SES
Continuous
Model 2: SES
Quintiles
Model 3: SES Continuous
& Gini
Model 4: SES Quintiles
& Gini
Model 5: SES Continuous, Gini, &
Decentralization
Model 6: SES Quintiles, Gini, & Decentralization
SES 58.47*** 38.19*** 42.68*** (0.90) (3.62) (3.32) Low SES -32.92*** -39.64*** -39.53*** (1.22) (5.90) (5.85) Mid-low SES -13.12*** -15.25** -15.24** (1.31) (5.11) (5.09) Mid-high SES 21.20*** 21.18*** 21.61*** (1.55) (5.89) (5.84) High SES 52.32*** 29.03** 29.58*** (2.35) (8.85) (8.97) GNI 2003 1.60*** 2.65*** 1.45*** 2.56*** (0.07) (0.07) (0.07) (0.08) Gini Coefficient -4.25*** -5.51*** -3.59*** -5.12*** (0.11) (0.15) (0.10) (0.14) SES x Gini 0.10 0 (0.09) (0.08) Low SES 0.19 0.19 x Gini (0.15) (0.15) Mid-low SES 0.06 0.06 x Gini (0.13) (0.13) Mid-high SES -0.02 -0.03 x Gini (0.14) (0.14) High SES 0.57* 0.57* x Gini (0.23) (0.23) Decentralized -30.02*** -17.31***
Management (2.62) (2.69) Table continues on next page.

106
Selected Independent Variables
Model 1: SES
Continuous
Model 2: SES
Quintiles
Model 3: SES Continuous
& Gini
Model 4: SES Quintiles
& Gini
Model 5: SES Continuous, Gini, &
Decentralization
Model 6: SES Quintiles, Gini, & Decentralization
Decentralized -6.68** -2.68 Completely (2.08) (2.31)
Constant 464.71*** 475.40*** 601.51*** 625.53*** 586.25*** 615.72*** (0.75) (1.03) (4.53) (6.15) (4.09) (5.67) Observations 228706 228706 228706 228706 228706 228706 R-squared .28 .07 .40 .35 .41 .35 Notes: Standard errors in parentheses. *** p<0.001, ** p<0.01, * p<0.05
Middle SES quintile and centralized countries serve as reference categories. SES missing values mean imputed. Source: IEA – TIMSS 2003.

107
FIGURE 15. SES QUINTILE SLOPES FROM OLS REGRESSION OF TIMSS 2003 MATH SCORES, GNI PER CAPITA, AND GINI COEFFICIENTS

108
FIGURE 16. SES QUINTILE SLOPES FROM OLS REGRESSION OF TIMSS 2003 MATH SCORES, GNI PER CAPITA, GINI COEFFICIENTS, AND DECENTRALIZATION

109
Chapter 5: The Level and Distribution of Teacher Preparation and Opportunities to Learn Across Country Economic Level and Income
Distribution
This Chapter converts the traditional inputs of teacher preparation and opportunities to
learn into outcomes to determine whether or not different types of students have access to
these critical resources. On one hand, students in higher income per capita countries might
have better prepared teachers and more OTL because these countries expend more on their
education systems. On the other hand, Heyneman and Loxely (1983) find that schooling plays
a larger role in lower income per capita countries. This relationship involves achievement
more than access; therefore, I hypothesize that higher income per capita countries will have
better prepared teachers and more OTL. I also originally hypothesized that high SES students
in more-unequal countries have better prepared teachers and more OTL. However, findings
from achievement scores in Chapter 4 suggest that access to these resources might decline for
all students in high inequality countries. Therefore, this chapter tests both the direction of the
relationship (increased or decreased access) as well as the moderate achievement divergences
between low and high SES students found in Chapter 4.
Relating Teacher Preparation to Economic Conditions
I use two different dependent variables for analysis of teacher preparation in TIMSS.
First, I estimate the relationship of economic conditions to teacher preparation using a
composite index that includes: the ISCED attainment levels of teachers, if they obtained a
bachelors degree in mathematics, and if they have a teaching license or certificate. These

110
three variables cover the spectrum of teacher-preparation possibilities, including their overall
preparation, their content knowledge, and their pedagogical preparation. However, this
combined index contains a high level of missing observations (~27 percent); therefore, I also
use the ISCED attainment levels alone as a second dependant variable to uncover whether
results differ between these two measures. This variable has approximately 18 percent of
observations missing, or one-third fewer than the composite teacher preparation index.
In general, the ISCED attainment-only analysis provides results similar to the overall
teacher preparation index results. It shows, however, a tighter grouping of SES quintile slopes
in the figures below. This similarity points to an overall validity in the findings from the two
measures, but it also suggests a need for improvement in TIMSS data collection regarding the
missing observations. I did not perform this analysis for the PISA because the principal
surveys contain high levels of missing data about teacher preparation. Participating PISA
countries have much room for improvement in this area, especially considering the PISA
survey’s lack of data collected directly from teachers.
The Teacher Preparation Index, Student SES, and Country Income in TIMSS
Model 1 in Table 13 shows a significant positive correlation between SES and teacher
preparation. For every increase of one SD in SES, a student’s teacher preparation increases in
the index by around .02 points. As noted in the methodology, the teacher-preparation index
ranges from 1-8, but the observations center heavily between 5 and 6 points on the scale.
Therefore, an increase of .02 points represents a relationship of moderate magnitude between
teacher preparation and SES.

111
The SES quintiles in Model 2 of Table 13 show that teacher preparation and low SES
have a small but statistically significant negative relationship. Accounting only for SES, low
SES students have slightly less-prepared teachers on average than their middle SES peers. On
the other hand, high SES students show the opposite relationship, with a positive, statistically
significant relationship to teacher preparation. High SES students, therefore, have more
prepared teachers than their middle SES counterparts. In aggregate, low SES students have
teachers with 0.1 points less preparation than their high SES peers, without accounting for
country economic factors.
When including country income in Models 3 and 4 of Table 13, the income per capita
is significant and positive, showing that students in wealthier countries have moderately better
prepared teachers. This result suggests that the issue of access differs from the relationship
between schooling and achievement, with access to more-prepared teachers occurring in
higher income per capita countries. In Model 3, the relationship of continuous SES and
teacher preparation remains significant though slightly lower. However, the statistically
significant relationships of low and high SES from Model 2 do not extend into Model 4
although the income per capita does remain positively correlated with the teacher preparation
index. Figure 17 shows the positive relationship between the predicted values of teacher
preparation and country income per capita. The interactions between SES quintiles and GNI
are not significant so the slopes neither diverge nor converge.
The decentralization variables in Models 5 and 6 of Table 13 are significant and
positive, suggesting that students in more countries with more decentralized systems have
better-prepared teachers, on average. In fact, the coefficients are higher than those of SES,
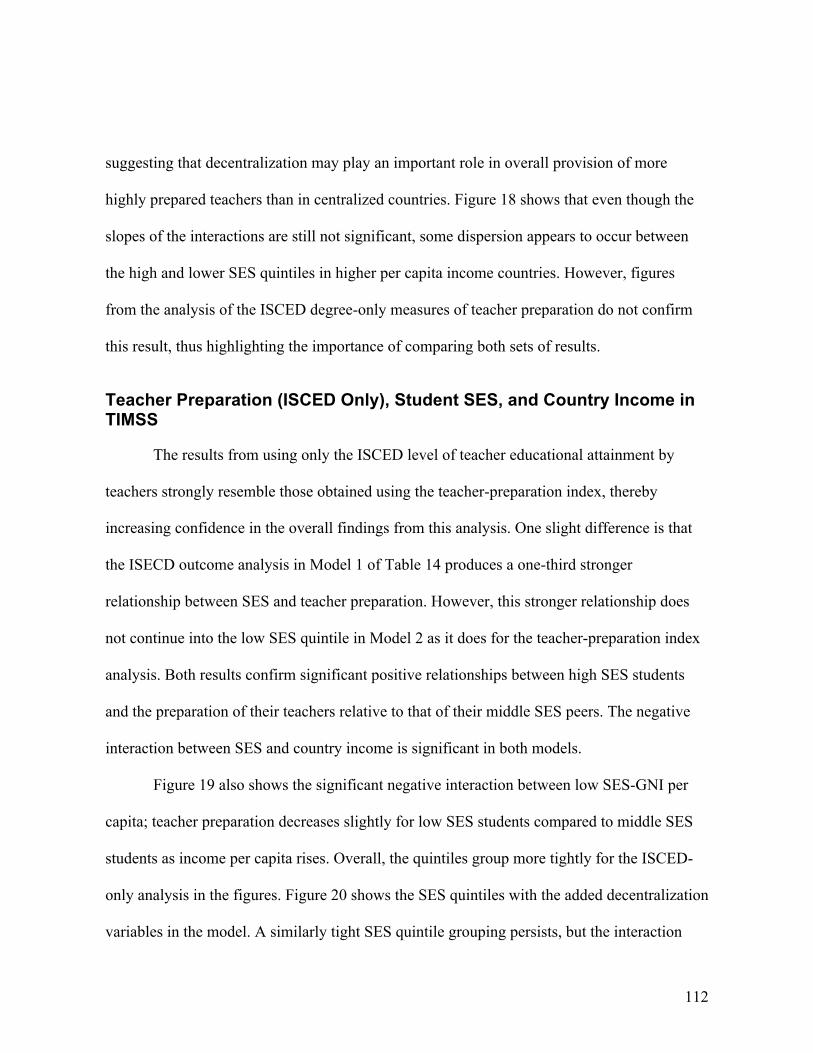
112
suggesting that decentralization may play an important role in overall provision of more
highly prepared teachers than in centralized countries. Figure 18 shows that even though the
slopes of the interactions are still not significant, some dispersion appears to occur between
the high and lower SES quintiles in higher per capita income countries. However, figures
from the analysis of the ISCED degree-only measures of teacher preparation do not confirm
this result, thus highlighting the importance of comparing both sets of results.
Teacher Preparation (ISCED Only), Student SES, and Country Income in TIMSS
The results from using only the ISCED level of teacher educational attainment by
teachers strongly resemble those obtained using the teacher-preparation index, thereby
increasing confidence in the overall findings from this analysis. One slight difference is that
the ISECD outcome analysis in Model 1 of Table 14 produces a one-third stronger
relationship between SES and teacher preparation. However, this stronger relationship does
not continue into the low SES quintile in Model 2 as it does for the teacher-preparation index
analysis. Both results confirm significant positive relationships between high SES students
and the preparation of their teachers relative to that of their middle SES peers. The negative
interaction between SES and country income is significant in both models.
Figure 19 also shows the significant negative interaction between low SES-GNI per
capita; teacher preparation decreases slightly for low SES students compared to middle SES
students as income per capita rises. Overall, the quintiles group more tightly for the ISCED-
only analysis in the figures. Figure 20 shows the SES quintiles with the added decentralization
variables in the model. A similarly tight SES quintile grouping persists, but the interaction

113
between low SES students and income per capita is no longer significant as it was in Model 4.
The coefficients for decentralization are significant in both teacher preparation models, and
they appear to account for the variation in the low SES-GNI per capita interaction from Model
4. Both outcome models show a positive relationship between teacher-preparation and
country income per capita, with significantly higher levels of prepared teachers in classes with
higher SES students.

114
TABLE 13. ESTIMATED OLS COEFFICIENTS OF TIMSS 2003 TEACHER PREPARATION INDEX ON SOCIO-ECONOMIC STATUS, SES QUINTILES, GNI PER CAPITA, AND LEVELS OF DECENTRALIZATION
Selected Independent Variables
Model 1: SES
Continuous
Model 2: SES
Quintiles
Model 3: SES Continuous
& GNI
Model 4: SES Quintiles
& GNI
Model 5: SES Continuous, GNI, &
Decentralization
Model 6: SES Quintiles, GNI, & Decentralization
SES 0.18*** 0.16*** 0.15*** (0.01) (0.01) (0.02) Low SES -0.03* -0.01 -0.01 (0.01) (0.02) (0.02) Mid-low SES -0.02 -0.01 -0.01 (0.01) (0.01) (0.01) Mid-high SES 0.01 0.01 -0.01 (0.01) (0.02) (0.01) High SES 0.07*** 0.04 0.02 (0.02) (0.02) (0.02) GNI 03 0.01*** 0.01*** 0.01*** 0.01*** (0.00) (0.00) (0.00) (0.00) SES x GNI 03 -0.00*** -0.00***
(0.00) (0.00) Low SES 0 0 x GNI 03 (0.00) (0.00) Mid-low SES 0 0 x GNI 03 (0.00) (0.00) Mid-high SES 0 0 x GNI 03 (0.00) (0.00) High SES 0 0 x GNI 03 (0.00) (0.00) Decentralized 0.37*** 0.37***
Management (0.03) (0.03) Decentralized 0.46*** 0.48***
Completely (0.03) (0.03) Table continues on next page.

115
Selected Independent Variables
Model 1: SES
Continuous
Model 2: SES
Quintiles
Model 3: SES Continuous
& GNI
Model 4: SES Quintiles
& GNI
Model 5: SES Continuous, GNI, &
Decentralization
Model 6: SES Quintiles, GNI, & Decentralization
Constant 5.29*** 5.26*** 5.17*** 5.09*** 4.91*** 4.83*** (0.01) (0.02) (0.02) (0.02) (0.02) (0.02) Observations 165331 165331 165331 165331 165331 165331 R-squared 0.07 0.00 0.11 0.08 0.19 0.17 Notes: Standard errors in parentheses. *** p<0.001, ** p<0.01, * p<0.05
Middle SES quintile and centralized countries serve as reference categories. SES missing values mean imputed. GNI per capita measured in thousands of dollars. Source: IEA – TIMSS 2003.

116
FIGURE 17. SES QUINTILE SLOPES FROM OLS REGRESSION OF TIMSS 2003 TEACHER PREPARATION INDEX AND GNI PER CAPITA (2003)

117
FIGURE 18. SES QUINTILE SLOPES FROM OLS REGRESSION OF TIMSS 2003 TEACHER PREPARATION INDEX, GNI PER CAPITA (2003), AND DECENTRALIZATION

118
TABLE 14. ESTIMATED OLS COEFFICIENTS OF TIMSS 2003 TEACHER PREPARATION INDEX (ISCED ONLY) ON SOCIO-ECONOMIC STATUS, SES QUINTILES, GNI PER CAPITA, AND LEVELS OF DECENTRALIZATION
Selected Independent Variables
Model 1: SES
Continuous
Model 2: SES
Quintiles
Model 3: SES Continuous
& GNI
Model 4: SES Quintiles
& GNI
Model 5: SES Continuous, GNI, &
Decentralization
Model 6: SES Quintiles, GNI, & Decentralization
SES 0.29*** 0.27*** 0.26*** (0.01) (0.02) (0.02) Low SES -0.02 0.02 0.01 (0.02) (0.03) (0.02) Mid-low SES -0.01 0.01 0.01 (0.01) (0.02) (0.02) Mid-high SES 0.01 0 -0.02 (0.01) (0.02) (0.02) High SES 0.06** 0.04 0.01 (0.02) (0.03) (0.03) GNI 03 0.02*** 0.02*** 0.02*** 0.02*** (0.00) (0.00) (0.00) (0.00) SES x GNI 03 -0.01*** -0.01***
(0.00) (0.00) Low SES -0.00* 0 x GNI 03 (0.00) (0.00) Mid-low SES 0 0 x GNI 03 (0.00) (0.00) Mid-high SES 0 0 x GNI 03 (0.00) (0.00) High SES 0 0 x GNI 03 (0.00) (0.00) Decentralized 0.49*** 0.50***
Management -0.03 -0.03 Decentralized 0.50*** 0.52***
Completely -0.03 -0.03 Table continues on next page.

119
Selected Independent Variables
Model 1: SES
Continuous
Model 2: SES
Quintiles
Model 3: SES Continuous
& GNI
Model 4: SES Quintiles
& GNI
Model 5: SES Continuous, GNI, &
Decentralization
Model 6: SES Quintiles, GNI, & Decentralization
Constant 4.96*** 5.01*** 4.78*** 4.64*** 4.48*** 4.35*** (0.01) (0.02) (0.02) (0.03) (0.02) (0.03) Observations 208461 208461 208461 208461 208461 208461 R-squared 0.11 0.00 0.17 0.12 0.24 0.19 Notes: Standard errors in parentheses. *** p<0.001, ** p<0.01, * p<0.05
Middle SES quintile and centralized countries serve as reference categories. SES missing values mean imputed. GNI per capita measured in thousands of dollars. Source: IEA – TIMSS 2003.

120
FIGURE 19. SES QUINTILE SLOPES FROM OLS REGRESSION OF TIMSS 2003 TEACHER PREPARATION (ISCED) AND GNI PER CAPITA (2003)

121
FIGURE 20. SES QUINTILE SLOPES FROM OLS REGRESSION OF TIMSS 2003 TEACHER PREP. (ISCED), GNI PER CAPITA (2003), AND DECENTRALIZATION

122
Teacher Preparation, Student SES, Country Income, and Income Inequality in TIMSS
The previous section found a positive correlation between income per capita
and teacher preparation that varied little between high and low SES students. This
section now adds income inequality to the equation to clarify whether students in
more-unequal countries have more or less access to better-prepared teachers. Table 15
provides the results of the relationship between the teacher preparation index and
income inequality in TIMSS. Although SES is significant in Models 1 and 2 above,
SES is no longer significant when adding the Gini coefficient, as Model 3 illustrates.
This finding mirrors the relationship between PISA achievement scores and income
inequality, where the coefficient of SES, known to be an important predictor, is no
longer statistically significant when including the Gini. The Gini coefficient and the
SES-Gini interaction are both significant in this TIMSS model, although the
coefficients are very small. In TIMSS, income inequality seems to correlate somewhat
with the measure of student SES, and both variables are related to teacher preparation,
a finding that also holds true for Model 4.
The main finding of the negative relationship between income inequality and
predicted values for teacher preparation appears in Figure 21. This finding, combined
with Chapter 4 results, shows that, thus far in the study, for both achievement scores
and teacher preparation, countries with higher levels of income inequality have lower-
performing students and less-prepared teachers for students in all SES quintiles. The
figure suggests that the difference in preparation of teachers that higher SES students

123
have shows some increase as income inequality rises, but the SES-Gini interactions
are not significant.
Models 5 and 6 include the decentralization variables, which are again positive
(more decentralization correlates with higher teacher preparation). In Model 5, the
coefficient of linear SES becomes significant again although that significance does not
extend to the coefficients of SES quintiles in Model 6. After accounting for
decentralization, Figure 22 confirms the trends found in Figure 21.
Teacher Preparation (ISCED Only), Student SES, Country Income, and Income Inequality in TIMSS
The results for using ISCED attainment levels alone as the dependent variable
for income inequality show a similar pattern to that found in the country income
analysis. The results for ISCED-only teacher preparation mirror those from the full
teacher preparation index, including a non-significant coefficient of SES when
including income inequality in Model 3 of Table 16. Figure 23 also shows closer
slopes of SES quintiles, as do the ISCED-only figures in the country-income analysis.
Figure 23 as well shows a divergence in SES quintiles as income inequality increases,
a phenomenon somewhat mitigated in Figure 24 after the addition of decentralization
variables. Both figures, however, show an even steeper negative relationship between
teacher preparation and income inequality than the full teacher preparation figures,
they also confirm the main finding that students in more-unequal countries have, on
average, teachers with lower levels of preparation. This study now analyzes student
opportunities to learn to determine whether the same relationships occur between
OTL, economic conditions, and student SES.

124
TABLE 15. ESTIMATED OLS COEFFICIENTS OF TIMSS 2003 TEACHER PREPARATION INDEX ON SOCIO-ECONOMIC STATUS, SES QUINTILES, GNI PER CAPITA, GINI COEFFICIENTS, AND LEVELS OF DECENTRALIZATION
Selected Independent Variables
Model 1: SES
Continuous
Model 2: SES
Quintiles
Model 3: SES Continuous
& Gini
Model 4: SES Quintiles
& Gini
Model 5: SES Continuous, Gini, &
Decentralization
Model 6: SES Quintiles, Gini, & Decentralization
SES 0.18*** 0.05 0.19*** (0.01) (0.05) (0.04) Low SES -0.03* 0.03 -0.01 (0.01) (0.07) (0.06) Mid-low SES -0.02 0.01 0.00 (0.01) (0.05) (0.04) Mid-high SES 0.01 -0.01 -0.03 (0.01) (0.04) (0.04) High SES 0.07*** -0.01 -0.05 (0.02) (0.07) (0.06) GNI 03 0.01*** 0.01*** 0.01*** 0.01*** (0.00) (0.00) (0.00) (0.00) Gini 0.00* 0.00 0.00 -0.01*** (0.00) (0.00) (0.00) (0.00) SES x Gini 0.00 0.00
(0.00) (0.00) Low SES 0.00 0.00 x Gini (0.00) (0.00) Mid-low SES 0.00 0.00 x Gini (0.00) (0.00) Mid-high SES 0.00 0.00 x Gini (0.00) (0.00) High SES 0.00 0.00 x Gini (0.00) (0.00) Decentralized 0.40*** 0.44***
Management (0.03) (0.03) Table continues on next page.

125
Selected Independent Variables
Model 1: SES
Continuous
Model 2: SES
Quintiles
Model 3: SES Continuous
& Gini
Model 4: SES Quintiles
& Gini
Model 5: SES Continuous, Gini, &
Decentralization
Model 6: SES Quintiles, Gini, & Decentralization
Decentralized 0.48*** 0.48*** Completely (0.03) (0.03)
Constant 5.29*** 5.26*** 5.03*** 5.09*** 4.99*** 5.06*** (0.01) (0.02) (0.06) (0.07) (0.06) (0.06) Observations 165331 165331 165331 165331 165331 165331 R-squared 0.07 0.002 0.10 0.08 0.19 0.17 Notes: Standard errors in parentheses. *** p<0.001, ** p<0.01, * p<0.05
Middle SES quintile and centralized countries serve as reference categories. SES missing values mean imputed. Source: IEA – TIMSS 2003.

126
FIGURE 21. SES QUINTILE SLOPES FROM OLS REGRESSION OF TIMSS 2003 TEACHER PREPARATION INDEX, GNI PER CAPITA, AND GINI COEFFICIENTS

127
FIGURE 22. SES QUINTILE SLOPES FROM OLS REGRESSION OF TIMSS 2003 TEACHER PREPARATION INDEX, GNI PER CAPITA, GINI COEFFICIENTS, AND DECENTRALIZATION
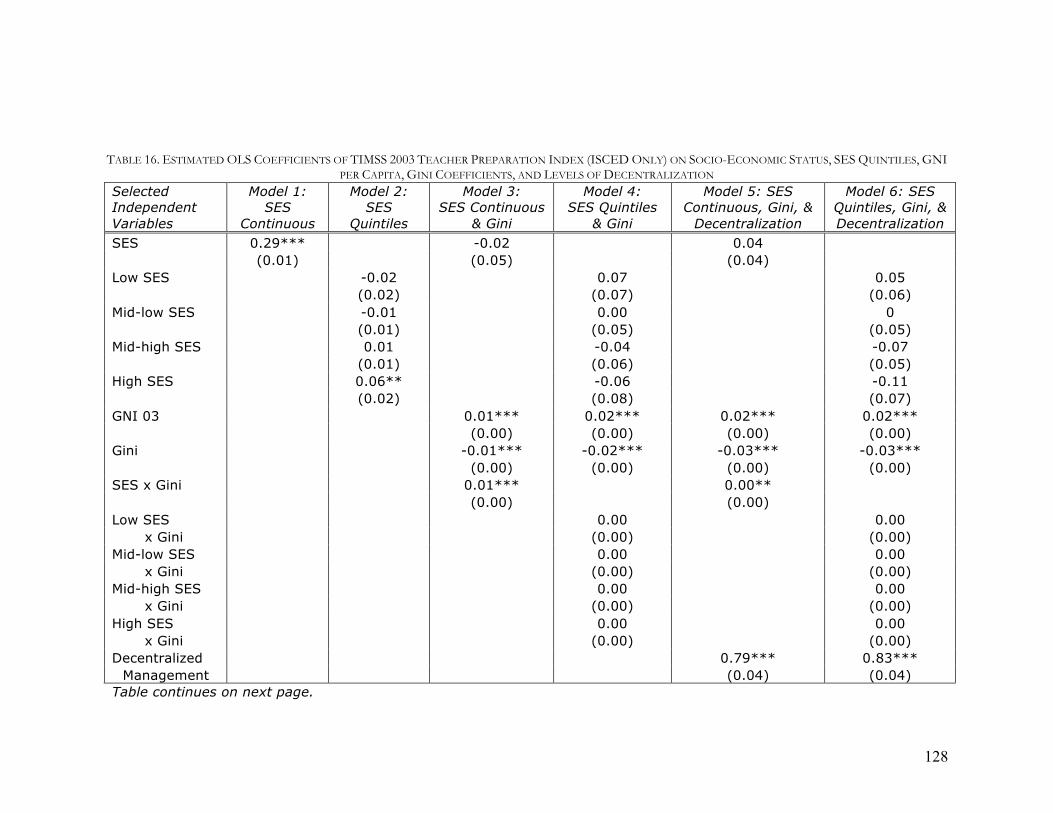
128
TABLE 16. ESTIMATED OLS COEFFICIENTS OF TIMSS 2003 TEACHER PREPARATION INDEX (ISCED ONLY) ON SOCIO-ECONOMIC STATUS, SES QUINTILES, GNI PER CAPITA, GINI COEFFICIENTS, AND LEVELS OF DECENTRALIZATION
Selected Independent Variables
Model 1: SES
Continuous
Model 2: SES
Quintiles
Model 3: SES Continuous
& Gini
Model 4: SES Quintiles
& Gini
Model 5: SES Continuous, Gini, &
Decentralization
Model 6: SES Quintiles, Gini, & Decentralization
SES 0.29*** -0.02 0.04 (0.01) (0.05) (0.04) Low SES -0.02 0.07 0.05 (0.02) (0.07) (0.06) Mid-low SES -0.01 0.00 0 (0.01) (0.05) (0.05) Mid-high SES 0.01 -0.04 -0.07 (0.01) (0.06) (0.05) High SES 0.06** -0.06 -0.11 (0.02) (0.08) (0.07) GNI 03 0.01*** 0.02*** 0.02*** 0.02*** (0.00) (0.00) (0.00) (0.00) Gini -0.01*** -0.02*** -0.03*** -0.03*** (0.00) (0.00) (0.00) (0.00) SES x Gini 0.01*** 0.00**
(0.00) (0.00) Low SES 0.00 0.00 x Gini (0.00) (0.00) Mid-low SES 0.00 0.00 x Gini (0.00) (0.00) Mid-high SES 0.00 0.00 x Gini (0.00) (0.00) High SES 0.00 0.00 x Gini (0.00) (0.00) Decentralized 0.79*** 0.83***
Management (0.04) (0.04) Table continues on next page.

129
Selected Independent Variables
Model 1: SES
Continuous
Model 2: SES
Quintiles
Model 3: SES Continuous
& Gini
Model 4: SES Quintiles
& Gini
Model 5: SES Continuous, Gini, &
Decentralization
Model 6: SES Quintiles, Gini, & Decentralization
Decentralized 0.51*** 0.54*** Completely (0.03) (0.03)
Constant 4.96*** 4.91*** 5.16*** 5.27*** 5.36*** 5.47*** (0.01) (0.02) (0.06) (0.07) (0.05) (0.06) Observations 208461 208461 208461 208461 208461 208461 R-squared 0.11 0.00 0.17 0.13 0.26 0.24 Notes: Standard errors in parentheses. *** p<0.001, ** p<0.01, * p<0.05
Middle SES quintile and centralized countries serve as reference categories. SES missing values mean imputed. Source: IEA – TIMSS 2003.

130
FIGURE 23. SES QUINTILE SLOPES FROM OLS REGRESSION OF TIMSS 2003 TEACHER PREPARATION INDEX (ISCED), GNI PER CAPITA, AND GINI COEFFICIENTS

131
FIGURE 24. SES QUINTILE SLOPES FROM OLS REGRESSION OF TIMSS 2003 TEACHER PREP. INDEX (ISCED), GNI PER CAPITA, GINI COEFFICIENTS, AND DECENTRALIZATION

132
Relating Opportunities to Learn to Economic Conditions As recent research has confirmed, simply being in the classroom is a necessary
but not sufficient condition for students to learn. Schmidt et al. (2001) show that class
time spent on more advanced math topics like algebra and geometry relates to higher
achievement on TIMSS. Building on this research, I examine OTL by the distribution
of student SES to show its relationship to country income and income inequality. I can
then determine if students at different economic levels have systematically different
access to OTL.
Unfortunately, PISA does not collect teacher-level data. Therefore, the OTL
measure of grade level that I employ from PISA shows what is necessary rather than
what is sufficient for student learning. The measure of OTL I use from the PISA
survey is very indirect. It consists of a dichotomous variable with students in grade
nine or below compared to students in grade 10 or above.15 Because PISA tests 15-
year-old students, the majority of the students participating in PISA attend either the
9th or 10th grade. Therefore, collapsing the OTL variable shows whether or not
economic conditions predict student exposure to, in most cases, an additional year of
schooling. In theory, an extra year of high school should increase student exposure to
the mathematics and thinking skills that would correlate with higher PISA scores.
Overall, the grade level measure of OTL is a blunt instrument because it specifies
neither mathematics classes nor the mathematics topics that the TIMSS analysis
15 I do not include countries in PISA with fewer than 10 percent of students in either 9th grade and below or 10th grade and above in this portion of the analysis.
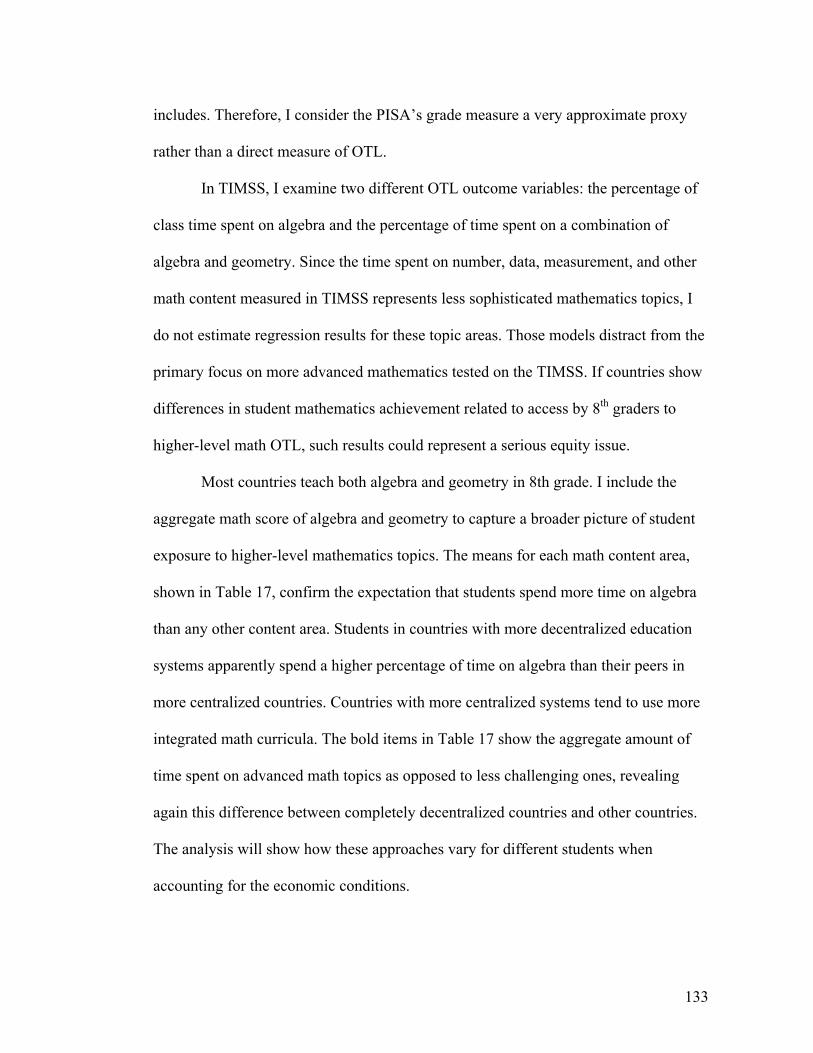
133
includes. Therefore, I consider the PISA’s grade measure a very approximate proxy
rather than a direct measure of OTL.
In TIMSS, I examine two different OTL outcome variables: the percentage of
class time spent on algebra and the percentage of time spent on a combination of
algebra and geometry. Since the time spent on number, data, measurement, and other
math content measured in TIMSS represents less sophisticated mathematics topics, I
do not estimate regression results for these topic areas. Those models distract from the
primary focus on more advanced mathematics tested on the TIMSS. If countries show
differences in student mathematics achievement related to access by 8th graders to
higher-level math OTL, such results could represent a serious equity issue.
Most countries teach both algebra and geometry in 8th grade. I include the
aggregate math score of algebra and geometry to capture a broader picture of student
exposure to higher-level mathematics topics. The means for each math content area,
shown in Table 17, confirm the expectation that students spend more time on algebra
than any other content area. Students in countries with more decentralized education
systems apparently spend a higher percentage of time on algebra than their peers in
more centralized countries. Countries with more centralized systems tend to use more
integrated math curricula. The bold items in Table 17 show the aggregate amount of
time spent on advanced math topics as opposed to less challenging ones, revealing
again this difference between completely decentralized countries and other countries.
The analysis will show how these approaches vary for different students when
accounting for the economic conditions.

134
TABLE 17. MEAN VALUES OF PERCENTAGE OF TIME SPENT IN MATHEMATICS CONTENT AREAS IN TIMSS 2003, BY LEVELS OF CENTRALIZATION
Content Area Centralized Decentralized Management
Decentralized Completely
All TIMSS Countries
Algebra 25.3 31.4 37.0 31.2 Geometry 26.8 20.7 22.9 24.0 Algebra & Geometry 52.1 52.1 59.9 55.2 Number 19.8 22.9 18.1 19.6 Data 11.8 10.3 10.4 11.0 Measurement 10.2 11.4 11.4 10.8 Other Math 6.2 4.0 3.2 4.6 Number, Data, Measurement, and Other Math Combined 47.9 48.6 43.0 45.9 Notes: Estimated means using replicate weights do not sum exactly to 100 percent. Sources: IEA – TIMSS 2003.
Opportunities to Learn, Student SES, and Country Income in PISA
To determine the relationship between grade level and SES in PISA, I estimate
binary logistic regressions using the dichotomous grade measure with each regression
estimating results for students in 10th grade and above. The results in Table 18 show
the odds ratios for students in different SES quintiles of being in 10th grade or above.
In the baseline Model 1, continuous SES is not significant. However, Model 2 shows
significantly lower odds for the lowest SES quintile to have additional years of
schooling compared to the middle SES quintile. Furthermore, students in the highest
quintile are almost 75 percent more likely to have additional schooling than their
middle SES peers. When accounting for country income, the continuous SES variable
in Model 3 becomes significant. In this case, an increase of one SD of SES correlates
with over an 80 percent higher likelihood of a student having at least one additional

135
year of schooling. Although the interaction between SES and GNI per capita is also
highly significant in Model 3, the magnitude is small.
Model 4 accounts for country income and SES quintiles, and the differences
between SES quintiles remain significant. High SES students are nearly twice as likely
to have additional years of schooling than their middle SES counterparts. The
interaction between high SES and income per capita is highly significant and negative,
meaning that high SES students in lower-income countries are more likely to have
more schooling than their middle SES peers and much more schooling than their
lower-income peers. This finding, illustrated in Figure 25, shows a greater gap
between low and high SES students in years of schooling in lower-income countries
than in higher-income countries. The finding is expected, but the very size of the
differences in odds ratios suggests that lower SES students in low-income countries
have less opportunity to learn (at least in terms of years of schooling) than lower SES
students in high- income countries. It is surprising, then, that there is no significant
interaction effect between SES and GNI per capita in the PISA results reported in our
earlier estimates (Table 9). Models 5 and 6, which include the decentralization
variables, show the same overall relationships between SES and years of schooling.
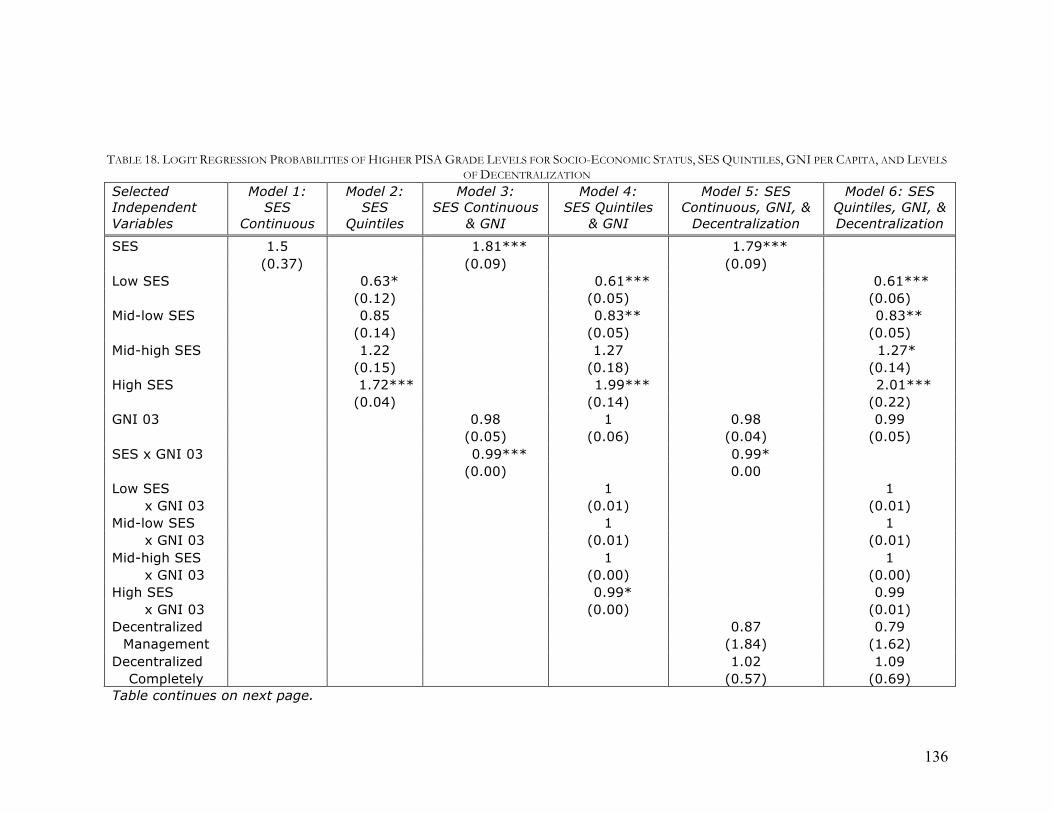
136
TABLE 18. LOGIT REGRESSION PROBABILITIES OF HIGHER PISA GRADE LEVELS FOR SOCIO-ECONOMIC STATUS, SES QUINTILES, GNI PER CAPITA, AND LEVELS OF DECENTRALIZATION
Selected Independent Variables
Model 1: SES
Continuous
Model 2: SES
Quintiles
Model 3: SES Continuous
& GNI
Model 4: SES Quintiles
& GNI
Model 5: SES Continuous, GNI, &
Decentralization
Model 6: SES Quintiles, GNI, & Decentralization
SES 1.5 1.81*** 1.79*** (0.37) (0.09) (0.09) Low SES 0.63* 0.61*** 0.61*** (0.12) (0.05) (0.06) Mid-low SES 0.85 0.83** 0.83** (0.14) (0.05) (0.05) Mid-high SES 1.22 1.27 1.27* (0.15) (0.18) (0.14) High SES 1.72*** 1.99*** 2.01*** (0.04) (0.14) (0.22) GNI 03 0.98 1 0.98 0.99 (0.05) (0.06) (0.04) (0.05) SES x GNI 03 0.99*** 0.99*
(0.00) 0.00 Low SES 1 1 x GNI 03 (0.01) (0.01) Mid-low SES 1 1 x GNI 03 (0.01) (0.01) Mid-high SES 1 1 x GNI 03 (0.00) (0.00) High SES 0.99* 0.99 x GNI 03 (0.00) (0.01) Decentralized 0.87 0.79
Management (1.84) (1.62) Decentralized 1.02 1.09
Completely (0.57) (0.69) Table continues on next page.
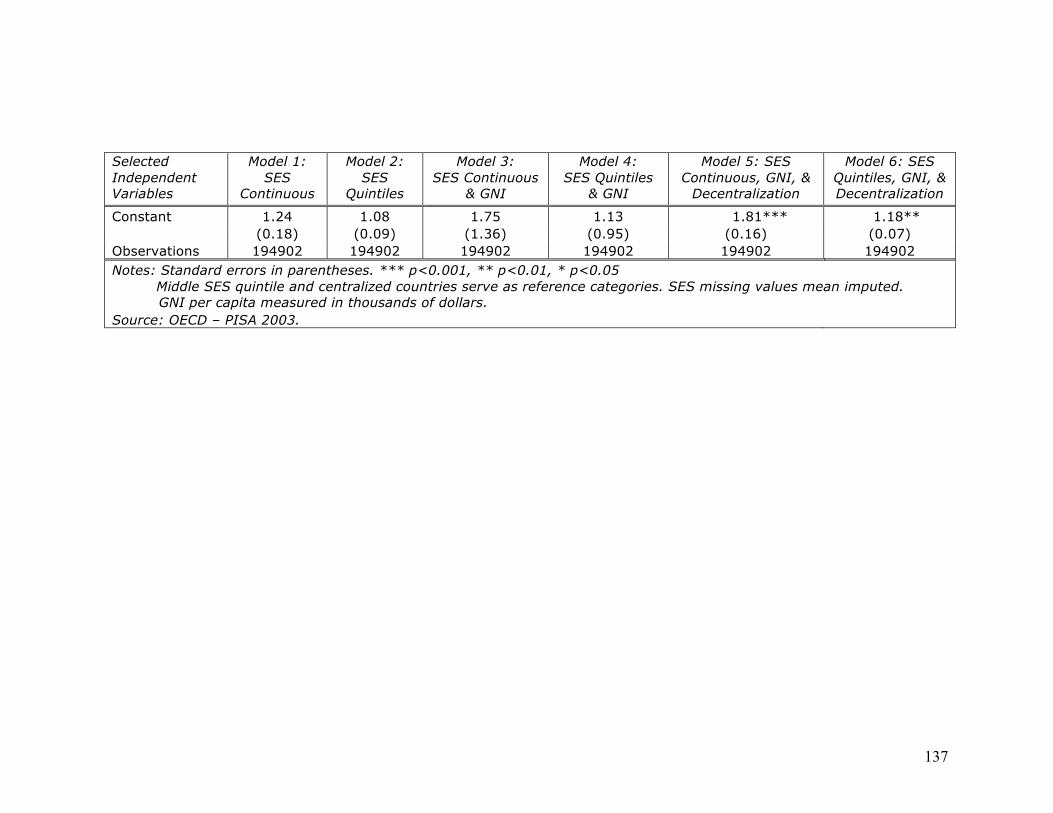
137
Selected Independent Variables
Model 1: SES
Continuous
Model 2: SES
Quintiles
Model 3: SES Continuous
& GNI
Model 4: SES Quintiles
& GNI
Model 5: SES Continuous, GNI, &
Decentralization
Model 6: SES Quintiles, GNI, & Decentralization
Constant 1.24 1.08 1.75 1.13 1.81*** 1.18** (0.18) (0.09) (1.36) (0.95) (0.16) (0.07) Observations 194902 194902 194902 194902 194902 194902 Notes: Standard errors in parentheses. *** p<0.001, ** p<0.01, * p<0.05
Middle SES quintile and centralized countries serve as reference categories. SES missing values mean imputed. GNI per capita measured in thousands of dollars. Source: OECD – PISA 2003.

138
FIGURE 25. SES QUINTILE SLOPES FROM LOGISTIC REGRESSION OF PISA 2003 GRADE LEVEL AND GNI PER CAPITA (2003)

139
FIGURE 26. SES QUINTILE SLOPES FROM LOGISTIC REGRESSION OF PISA 2003 GRADE LEVEL, GNI PER CAPITA (2003), AND DECENTRALIZATION

140
Opportunities to Learn, Student SES, and Income Inequality in PISA
The relationship between the years of schooling and income inequality for PISA
countries shows a similar lack of significant correlations as in the analysis the PISA student
achievement measure. In Table 19, Models 3 and 4 include the Gini coefficient and the SES-
Gini interaction terms, none of which have statistically significant coefficients in these
models. The likelihood of being in higher grades apparently does not vary much across
countries with different income inequality. The Gini coefficient is significant (greater
inequality, lower likelihood of being in a higher grade) but close to 1. Figure 27 and Figure 28
show this negative overall relationship between income inequality and years of schooling,
meaning that students have somewhat less access to schooling overall in more-unequal
countries. Lower SES students are increasingly likely to be in lower grades as income
inequality rises, but this divergence is not statistically significant.

141
TABLE 19. LOGIT REGRESSION PROBABILITIES OF HIGHER PISA GRADE LEVELS FOR SOCIO-ECONOMIC STATUS, SES QUINTILES, GNI PER CAPITA, GINI COEFFICIENTS, AND LEVELS OF DECENTRALIZATION
Selected Independent Variables
Model 1: SES
Continuous
Model 2: SES
Quintiles
Model 3: SES Continuous
& Gini
Model 4: SES Quintiles
& Gini
Model 5: SES Continuous, Gini, &
Decentralization
Model 6: SES Quintiles, Gini, & Decentralization
SES 1.50 0.91 0.91 (0.37) (0.85) (0.92) Low SES 0.63** 0.79 0.79 (0.09) (0.27) (0.18) Mid-low SES 0.85 0.84 0.84 (0.09) (0.23) (0.22) Mid-high SES 1.22 1.08 1.08 (0.15) (0.72) (0.70) High SES 1.72*** 1.24 1.24 (0.07) (1.27) (1.15) GNI 03 0.98 0.99 0.98 0.99 (0.05) (0.06) (0.04) (0.05) Gini 1.00 0.98 1.01 0.98*** (0.06) (0.02) (0.02) 0.01 SES x Gini 1.01 1.02 (0.03) (0.03) Low SES 0.99 0.99 x Gini (0.01) 0.00 Mid-low SES 1.00 1.00 x Gini (0.00) 0.00 Mid-high SES 1.00 1.00 x Gini (0.02) (0.02) High SES 1.01 1.01 x Gini (0.03) (0.02) Decentralized 0.85 0.90
Management (1.59) (1.47) Table continues on next page.

142
Selected Independent Variables
Model 1: SES
Continuous
Model 2: SES
Quintiles
Model 3: SES Continuous
& Gini
Model 4: SES Quintiles
& Gini
Model 5: SES Continuous, Gini, &
Decentralization
Model 6: SES Quintiles, Gini, & Decentralization
Decentralized 1.00 1.07 Completely (0.56) (0.59)
Constant 1.24 1.08 1.58 2.59*** 1.51 2.41** (0.18) (0.08) (2.13) (0.71) (1.17) (0.68) Observations 194902 194902 194902 194902 194902 194902 Notes: Standard errors in parentheses. *** p<0.001, ** p<0.01, * p<0.05 Middle SES quintile and centralized countries serve as reference categories. Source: OECD – PISA 2003.

143
FIGURE 27. SES QUINTILE SLOPES FROM OLS REGRESSION OF PISA 2003 GRADE LEVEL, GNI PER CAPITA, AND GINI COEFFICIENTS

144
FIGURE 28. SES QUINTILE SLOPES FROM OLS REGRESSION OF PISA 2003 GRADE LEVEL. GNI PER CAPITA, GINI COEFFICIENTS, AND DECENTRALIZATION

145
Opportunities to Learn, Student SES, and Country Income in TIMSS
In addition to testing students, TIMSS surveys teachers to find out which math
topics they focus on during class. In this study, I consider these different topics as
representing a student’s opportunity to learn a given topic in mathematics. Math topics
serve a broad example of what occurs in a classroom and do not provide the level of
detail expected in a study of enacted curriculum or pedagogical methods. Previous
studies show that math content does correlate with student achievement (Schmidt, et
al., 2001). If a significant interaction between this measure of OTL and income per
capita or income inequality exists, it could suggest explanations of the diverging
average student performance across SES groups, the higher the income per capita in
the sample of countries. Therefore, in this study, I estimate whether the allocation of
OTL differs by country economic conditions and by student SES.
Algebra
Table 20 shows the relationships between the percentage of class time spent on
algebra, country, and student economic conditions. Model 1 shows a significant
relationship between algebra and student SES. For every SD increase in SES, a student
receives almost 5 percent more math time focused on algebra. Model 2 disaggregates
by SES quintile, showing significantly lower percentages of time spent on algebra for
lower SES students and significantly higher percentages for higher SES students,
relative to middle SES students. When including country income per capita in Model
3, continuous SES remains significant at around four percent of algebra time. For
every increase of $10,000 in country income, time on algebra increases one percent (a

146
rather small increase). The interaction between country income per capita and SES is
not significant in this model, suggesting no significant divergence across SES groups
as income per capita increases.
Model 4 uses the SES quintiles rather than linear SES. The income per
capita*SES interactions for the lower two SES groups and the high SES groups are
significant in this model. The highest SES students also have increasing access to
algebra instruction as country income increases. Figure 29 shows the overall increase
in algebra time as country income per capita increases while also illustrating the
higher relative access for high SES students and the decreased access to time on
algebra for lower SES students. In lower-income countries, the three lowest SES
categories are tightly grouped: a large percentage of the student population receives
less time on algebra than high SES students. As country income increases, lower SES
students show the smallest gains in the amount of time on algebra while the highest
SES students show the largest gains. This finding may help explain why test score
differences are larger across SES groups in higher-income countries (Table 11 and
Figure 13). One possible reason for the increased differences in the fraction of time
spent on algebra across SES groups in higher income countries is that not everyone
reaches the 8th grade in some of the lower-income countries participating in TIMSS.
This would suggest that the students are less homogenous in the high-income
countries and are therefore more likely to be tracked into more widely varied
mathematics course patterns.
When including the decentralization variables in Models 5 and 6, students in
countries with more decentralized systems receive more time on algebra overall: this

147
appears previously in Table 17 and is probably an artifact of the kinds of math
curriculum used in countries with centralized rather than decentralized education
systems. The same trends for the SES quintiles as described above occur when
accounting for decentralization. Furthermore, the two types of decentralization have
large positive coefficients, 8 percent of algebra time for decentralized management
and 10 percent for completely decentralized countries when compared to centralized
countries.
Algebra and Geometry Combined
When examining OTL as the amount of class time spent on algebra and
geometry, a situation similar exists to that of algebra class time with three notable
highlights. First, the magnitudes of the coefficients are greater for the highest SES
students when considering both algebra and geometry than when only examining
algebra (Models 2 and 4 in Table 21). Second, the GNI per capita and the interaction
between continuous SES and the GNI per capita is negative instead of positive,
meaning that SES is less important for math OTL as country income increases.
However, model 4 shows that an important relationship does exist because the lowest
two SES quintiles diverge from the higher SES quintiles, which do not differ
significantly. This third finding, in Figure 31, shows that the divergence between the
slopes of the lower two SES and the higher three SES quintiles means that low SES
students in higher income countries receive more than 10 percent less algebra and
geometry OTL than their high SES peers. This disparity occurs despite a negative
relationship between geometry and country income, which could make the quintile

148
slopes more equal. Although a gap between SES quintiles also exists in lower-income
per capita countries, it is smaller because higher SES students also receive less algebra
and geometry OTL than their counterparts in higher-income per capita countries.
Therefore, both country income and student SES play a role in the types of math OTL
to which students have access. This finding supports the explanation that the
increasing gap between higher and lower SES students as GNI per capita increases
relates to the increased difference in the mathematics offerings for lower and higher
SES students in higher-income countries. However, these distinctions also illustrate
potential issues when comparing diverse student populations from lower and higher
income per capita countries.

149
TABLE 20. ESTIMATED OLS COEFFICIENTS OF TIMSS 2003 OPPORTUNITIES TO LEARN ALGEBRA ON SOCIO-ECONOMIC STATUS, SES QUINTILES, GNI PER CAPITA, AND LEVELS OF DECENTRALIZATION
Selected Independent Variables
Model 1: SES
Continuous
Model 2: SES
Quintiles
Model 3: SES Continuous
& GNI
Model 4: SES Quintiles
& GNI
Model 5: SES Continuous, GNI, &
Decentralization
Model 6: SES Quintiles, GNI, & Decentralization
SES 4.70*** 4.05*** 3.71*** (0.26) (0.30) (0.27) Low SES -1.45*** 0.22 0.17 (0.30) (0.39) (0.35) Mid-low SES -0.56* 0.17 0.18 (0.28) (0.33) (0.29) Mid-high SES 1.56*** 0.82* 0.49 (0.30) (0.36) (0.34) High SES 4.00*** 2.29** 1.63* (0.65) (0.88) (0.81) GNI 03 0.10*** 0.22*** 0.09** 0.19** (0.03) (0.03) (0.03) (0.03) SES x GNI 03 0.01 0.01
(0.02) (0.02) Low SES -0.13*** -0.12*** x GNI 03 (0.02) (0.02) Mid-low SES -0.06** -0.06** x GNI 03 (0.02) (0.02) Mid-high SES 0.05 0.06* x GNI 03 (0.03) (0.03) High SES 0.11** 0.12** x GNI 03 (0.04) (0.04) Decentralized 7.87*** 7.89***
Management (0.88) (0.87) Decentralized 10.34*** 10.76***
Completely (0.59) (0.61) Table continues on next page.

150
Selected Independent Variables
Model 1: SES
Continuous
Model 2: SES
Quintiles
Model 3: SES Continuous
& GNI
Model 4: SES Quintiles
& GNI
Model 5: SES Continuous, GNI, &
Decentralization
Model 6: SES Quintiles, GNI, & Decentralization
Constant 31.91*** 30.60*** 30.50*** 27.81*** 24.99*** 22.52*** (0.34) (0.34) (0.43) (0.43) (0.45) (0.46) Observations 195371 195371 195371 195371 195371 195371 R-squared 0.08 0.01 0.09 0.05 0.17 0.14 Notes: Standard errors in parentheses. *** p<0.001, ** p<0.01, * p<0.05
Middle SES quintile and centralized countries serve as reference categories. SES missing values mean imputed. GNI per capita measured in thousands of dollars. Source: IEA – TIMSS 2003.
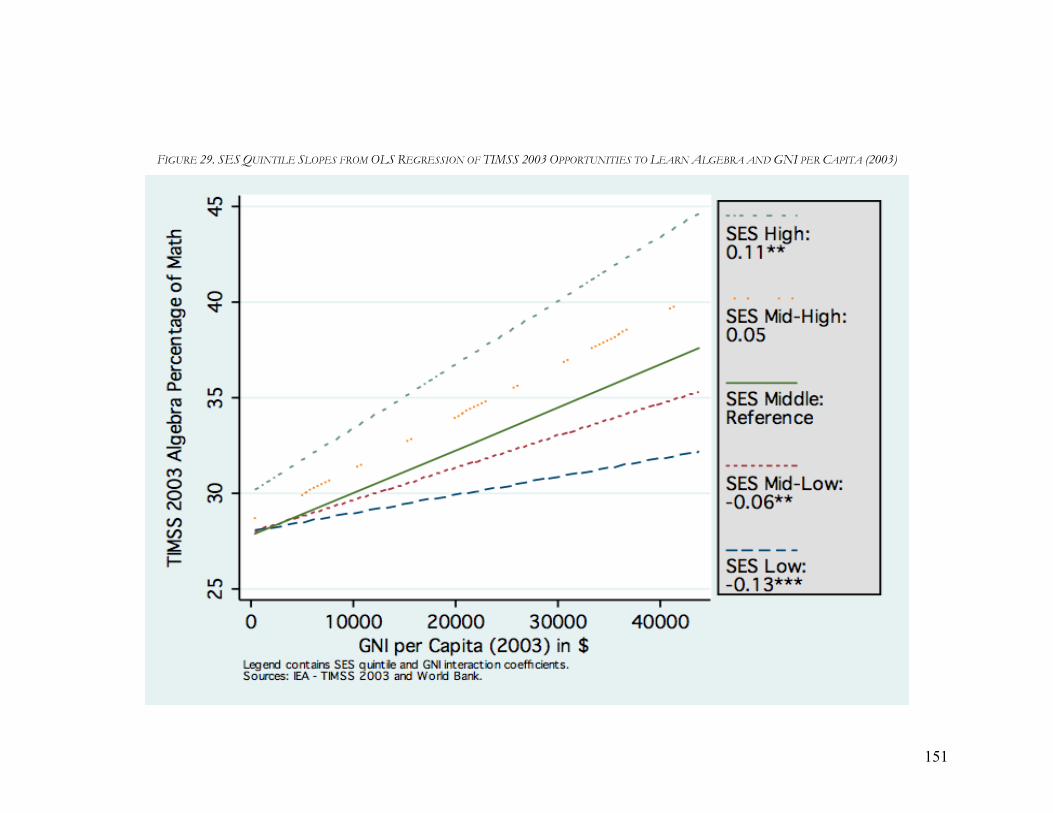
151
FIGURE 29. SES QUINTILE SLOPES FROM OLS REGRESSION OF TIMSS 2003 OPPORTUNITIES TO LEARN ALGEBRA AND GNI PER CAPITA (2003)

152
FIGURE 30. SES QUINTILE SLOPES FROM OLS REGRESSION OF TIMSS 2003 OPPORTUNITIES TO LEARN ALGEBRA, GNI PER CAPITA (2003), AND DECENTRALIZATION

153
TABLE 21. ESTIMATED OLS COEFFICIENTS OF TIMSS 2003 OPPORTUNITIES TO LEARN ALGEBRA AND GEOMETRY ON SOCIO-ECONOMIC STATUS, SES QUINTILES, GNI PER CAPITA, AND LEVELS OF DECENTRALIZATION
Selected Independent Variables
Model 1: SES
Continuous
Model 2: SES
Quintiles
Model 3: SES Continuous
& GNI
Model 4: SES Quintiles
& GNI
Model 5: SES Continuous, GNI, &
Decentralization
Model 6: SES Quintiles, GNI, & Decentralization
SES 5.23*** 6.41*** 6.15*** (0.28) (0.42) (0.38) Low SES -1.03** 0.5 0.44 (0.37) (0.52) (0.49) Mid-low SES -0.4 0.33 0.31 (0.31) (0.40) (0.36) Mid-high SES 1.61*** 1.26** 1.13** (0.33) (0.49) (0.44) High SES 4.18*** 3.13** 2.86** (0.72) (1.12) (1.03) GNI 03 -0.06* 0.10*** -0.11*** 0.03 (0.03) (0.03) (0.03) (0.03) SES x GNI 03 -0.08*** -0.08***
(0.02) (0.02) Low SES -0.12*** -0.12*** x GNI 03 (0.03) (0.03) Mid-low SES -0.06** -0.06** x GNI 03 (0.02) (0.02) Mid-high SES 0.02 0.03 x GNI 03 (0.02) (0.02) High SES 0.07 0.07 x GNI 03 (0.04) (0.04) Decentralized -0.55 -0.52
Management (0.80) (0.80) Decentralized 6.97*** 7.63***
Completely (0.67) (0.73) Table continues on next page.
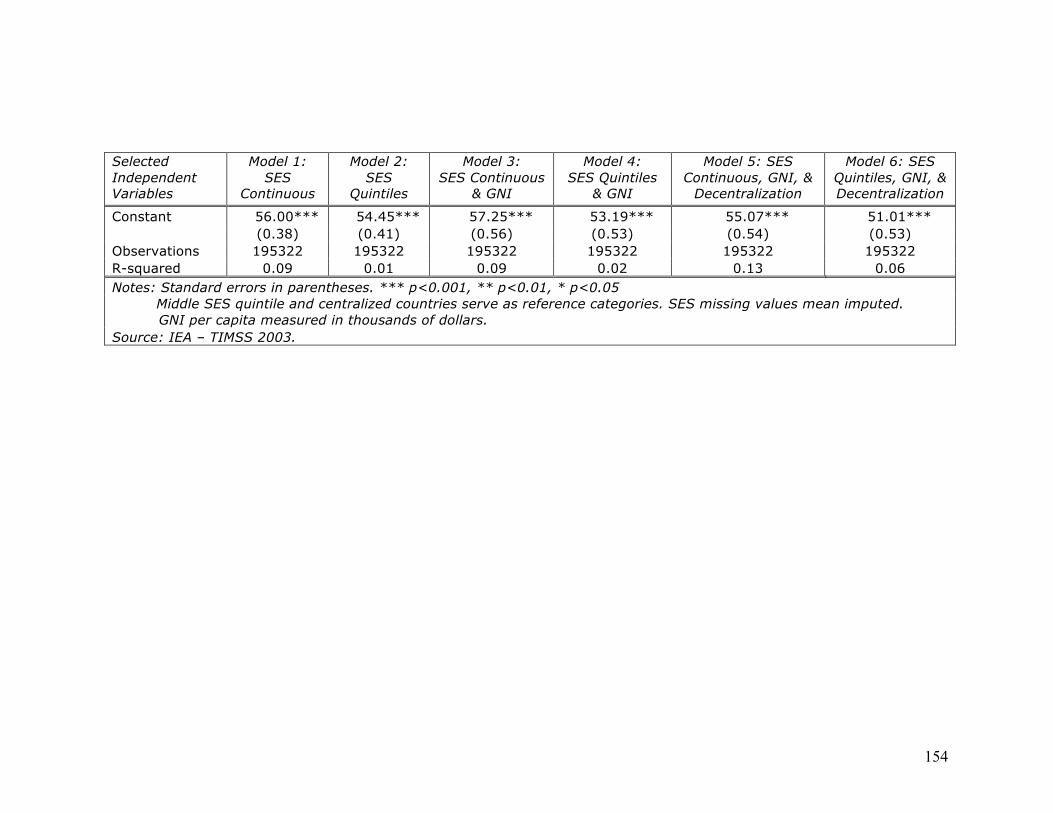
154
Selected Independent Variables
Model 1: SES
Continuous
Model 2: SES
Quintiles
Model 3: SES Continuous
& GNI
Model 4: SES Quintiles
& GNI
Model 5: SES Continuous, GNI, &
Decentralization
Model 6: SES Quintiles, GNI, & Decentralization
Constant 56.00*** 54.45*** 57.25*** 53.19*** 55.07*** 51.01*** (0.38) (0.41) (0.56) (0.53) (0.54) (0.53) Observations 195322 195322 195322 195322 195322 195322 R-squared 0.09 0.01 0.09 0.02 0.13 0.06 Notes: Standard errors in parentheses. *** p<0.001, ** p<0.01, * p<0.05
Middle SES quintile and centralized countries serve as reference categories. SES missing values mean imputed. GNI per capita measured in thousands of dollars. Source: IEA – TIMSS 2003.
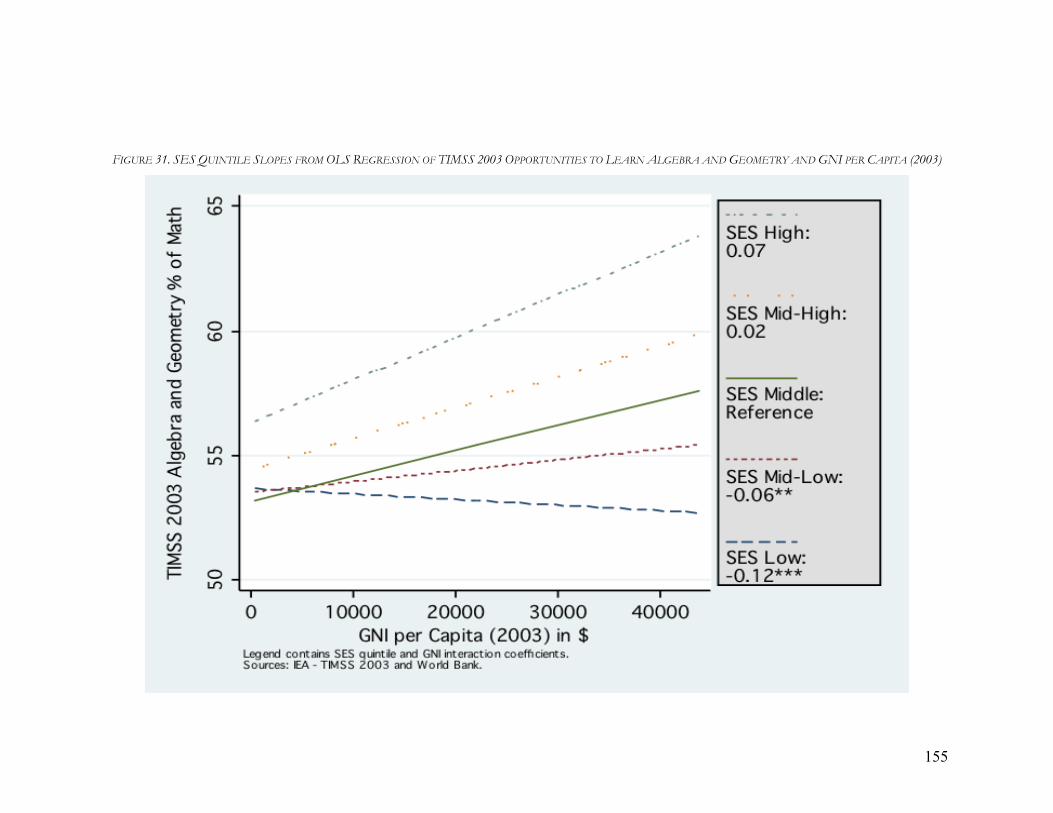
155
FIGURE 31. SES QUINTILE SLOPES FROM OLS REGRESSION OF TIMSS 2003 OPPORTUNITIES TO LEARN ALGEBRA AND GEOMETRY AND GNI PER CAPITA (2003)

156
FIGURE 32. SES QUINTILE SLOPES FROM OLS REGRESSION OF TIMSS 2003 OPPORTUNITIES TO LEARN ALGEBRA AND GEOMETRY, GNI PER CAPITA (2003), AND DECENTRALIZATION

157
Opportunities to Learn, Student SES, Country Income, and Income Inequality in TIMSS
Algebra
The relationship between income inequality and OTL is not as strong as that of
country income and OTL. Using class time spent on algebra as a measure of OTL, the
Gini coefficient is significant and negative in Model 4 of Table 22, but the SES
quintiles are no longer significant, as they are in Model 2. Therefore, country income
dispersion correlates with the variance in SES, exception for the lowest SES quintile.
More-unequal countries, therefore, have slightly less overall OTL in algebra. Model 4
shows that the interaction between low SES and income inequality is significant and
negative, meaning that the lowest SES students receive increasingly less OTL in
algebra than their middle SES peers in countries with more income inequality. Figure
35 and Figure 36 illustrate this increasing difference in the provision of OTL to lower
SES students in more-unequal countries. Finally, decentralized countries again provide
significantly more OTL in algebra than the centralized countries. This result supports
the hypothesis that the increased gap in test scores across SES groups estimated in
Chapter 4 (Table 12) in countries with higher income inequality is associated with
increased differences in the amount of algebra offered to students of different social
classes in countries with greater income inequality.
Algebra and Geometry Combined
Analyzing algebra and geometry as an aggregate OTL measure in relation to
income inequality results in larger negative coefficients for the Gini and for the

158
interaction between continuous SES-Gini (Model 3 in Table 23). Once again,
statistical significance disappears for the main effects of the SES quintiles in Models 4
and 6 but remains the same as for algebra in the lower SES quintile. Given the
increased overall percentage of time spent on both algebra and geometry, the negative
relationship between income inequality and OTL becomes sharper visually in Figure
35 and Figure 36. The overall level of advanced math OTL decreases in countries with
more income inequality while the lowest SES students in more-unequal countries have
increasingly less access compared to their higher SES peers. Again, this suggests that
one reason for increased divergence in test scores across SES groups as country
income inequality rises is the increasingly lower access of lower SES groups to more
advanced math courses in the higher income inequality countries.
Returning to the findings from Chapters 4, higher SES students have
significantly higher performance relative to the middle SES group in more unequal
countries in TIMSS. Chapter 5 results show that lower SES students in more unequal
countries do have access to significantly fewer opportunities to learn in TIMSS. These
results also come from the TIMSS, an assessment that tests the curriculum delivery of
a country. Taken together, they suggest that large disparities in achievement signal an
inequitable delivery of that math curriculum. Although they show a fairly strong
relationship, it is not the strongest possible relationship. For instance, if the lowest
SES students also had significantly lower achievement scores, the potential links
between income inequality, achievement, and OTL would be stronger. Chapter 6 now
examines possible links between teacher preparation, OTL, and student achievement
within individual countries to discover whether the negative correlations between

159
income inequality and educational inputs and outcomes occur at the national level.
The conclusion in Chapter 7 then discusses future research for further clarifying the
relationship between income inequality, student achievement, and OTL.

160
TABLE 22. ESTIMATED OLS COEFFICIENTS OF TIMSS 2003 OPPORTUNITIES TO LEARN ALGEBRA ON SOCIO-ECONOMIC STATUS, SES QUINTILES, GNI PER CAPITA, GINI COEFFICIENTS, AND LEVELS OF DECENTRALIZATION
Selected Independent Variables
Model 1: SES
Continuous
Model 2: SES
Quintiles
Model 3: SES Continuous
& Gini
Model 4: SES Quintiles
& Gini
Model 5: SES Continuous, Gini, &
Decentralization
Model 6: SES Quintiles, Gini, & Decentralization
SES 4.70*** 3.07** 6.24*** (0.26) (1.19) (1.07) Low SES -1.45*** 1.91 1.51 (0.30) (1.19) (1.09) Mid-low SES -0.56* 0.71 0.63 (0.28) (1.06) (0.91) Mid-high SES 1.56*** 0.75 0.20 (0.30) (1.14) (0.98) High SES 4.00*** 0.31 -0.73 (0.65) (2.42) (2.13) GNI 03 0.10*** 0.21*** 0.10*** 0.19*** (0.03) (0.03) (0.03) (0.03) Gini 0.02 -0.09* -0.14*** -0.25*** (0.04) (0.04) (0.04) (0.04) SES x Gini 0.03 -0.07*
(0.03) (0.03) Low SES -0.09** -0.08** x Gini (0.03) (0.03) Mid-low SES -0.03 -0.03 x Gini (0.03) (0.02) Mid-high SES 0.02 0.03 x Gini (0.03) (0.03) High SES 0.09 0.11 x Gini (0.06) (0.06) Decentralized 9.11*** 10.41***
Management (0.89) (0.88) Table continues on next page.

161
Selected Independent Variables
Model 1: SES
Continuous
Model 2: SES
Quintiles
Model 3: SES Continuous
& Gini
Model 4: SES Quintiles
& Gini
Model 5: SES Continuous, Gini, &
Decentralization
Model 6: SES Quintiles, Gini, & Decentralization
Decentralized 10.65*** 10.86*** Completely (0.57) (0.60)
Constant 31.91*** 30.60*** 30.00*** 31.27*** 29.61*** 31.25*** (0.34) (0.34) (1.48) (1.61) (1.46) (1.60) Observations 195371 195371 195371 195371 195371 195371 R-squared 0.08 0.01 0.09 0.05 0.18 0.14 Notes: Standard errors in parentheses. *** p<0.001, ** p<0.01, * p<0.05
Middle SES quintile and centralized countries serve as reference categories. SES missing values mean imputed. Source: IEA – TIMSS 2003.

162
FIGURE 33. SES QUINTILE SLOPES FROM OLS REGRESSION OF TIMSS 2003 OPPORTUNITIES TO LEARN ALGEBRA, GNI PER CAPITA, AND GINI COEFFICIENTS

163
FIGURE 34. SES QUINTILE SLOPES FROM OLS REGRESSION OF TIMSS 2003 OPPORTUNITIES TO LEARN ALGEBRA, GNI PER CAPITA, GINI COEFFICIENTS, AND DECENTRALIZATION

164
TABLE 23. ESTIMATED OLS COEFFICIENTS OF TIMSS 2003 OPPORTUNITIES TO LEARN (ALGEBRA AND GEOMETRY) ON SOCIO-ECONOMIC STATUS, SES QUINTILES, GNI PER CAPITA, GINI COEFFICIENTS, AND LEVELS OF DECENTRALIZATION
Selected Independent Variables
Model 1: SES
Continuous
Model 2: SES
Quintiles
Model 3: SES Continuous
& Gini
Model 4: SES Quintiles
& Gini
Model 5: SES Continuous, Gini, &
Decentralization
Model 6: SES Quintiles, Gini, & Decentralization
SES 5.23*** 11.73*** 14.42*** (0.28) (1.36) (1.29) Low SES -1.03** 1.96 1.66 (0.37) (1.43) (1.35) Mid-low SES -0.40 0.81 0.75 (0.31) (1.36) (1.25) Mid-high SES 1.61*** 1.65 1.23 (0.33) (1.34) (1.20) High SES 4.18*** 2.21 1.43 (0.72) (2.95) (2.69) GNI 03 -0.09** 0.03 -0.10*** 0.02 (0.03) (0.03) (0.03) (0.03) Gini -0.63*** -0.70*** -0.73*** -0.83*** (0.04) (0.05) (0.04) (0.05) SES x Gini -0.18*** -0.27***
(0.03) (0.03) Low SES -0.08* -0.08* x Gini (0.03) (0.03) Mid-low SES -0.03 -0.03 x Gini (0.03) (0.03) Mid-high SES 0.00 0.01 x Gini (0.03) (0.03) High SES 0.05 0.07 x Gini (0.07) (0.06) Decentralized 6.39*** 8.38***
Management (0.79) (0.81) Table continues on next page.

165
Selected Independent Variables
Model 1: SES
Continuous
Model 2: SES
Quintiles
Model 3: SES Continuous
& Gini
Model 4: SES Quintiles
& Gini
Model 5: SES Continuous, Gini, &
Decentralization
Model 6: SES Quintiles, Gini, & Decentralization
Decentralized 8.36*** 8.05*** Completely (0.66) (0.71)
Constant 56.00*** 54.45*** 80.22*** 80.11*** 79.44*** 80.52*** (0.38) (0.41) (1.81) (2.02) (1.74) (1.96) Observations 195322 195322 195322 195322 195322 195322 R-squared 0.07 0.07 0.15 0.10 0.19 0.14 Notes: Standard errors in parentheses. *** p<0.001, ** p<0.01, * p<0.05
Middle SES quintile and centralized countries serve as reference categories. SES missing values mean imputed. Source: IEA – TIMSS 2003.

166
FIGURE 35. SES QUINTILE SLOPES FROM OLS REGRESSION OF TIMSS 2003 OPPORTUNITIES TO LEARN ALGEBRA AND GEOMETRY, GNI PER CAPITA, AND GINI COEFFICIENTS

167
FIGURE 36. SES QUINTILE SLOPES FROM OLS REGRESSION OF TIMSS 2003 OPPORTUNITIES TO LEARN ALGEBRA AND GEOMETRY, GNI PER CAPITA, GINI COEFFICIENTS, AND DECENTRALIZATION

168
Chapter 6. Comparing Achievement Outcomes Between SES Quintiles in High and Low Income per Capita Countries with
Differing Income Distributions The previous two chapters have explored several relationships between
economic conditions and educational factors at the international level. Chapter 4
examines relationships between student math achievement, country wealth, and
country-level income inequality for students with different levels of SES. Confirming
previous research, the results show that country income per capita positively correlates
with student math scores, while income inequality negatively correlates with student
math scores. However, the analysis disproves my hypothesis that students from higher
SES backgrounds in more-unequal countries would receive a larger share of education
resources and consequently outperform their high-SES peers in more-equal countries.
Instead, student performance declined for all SES groups. Therefore, income
inequality correlates negatively with student achievement for all levels of SES
students.
Chapter 5 repeats the above analysis for two inputs of interest in education:
teacher preparation and student opportunities to learn (OTL). In both cases, increased
country income correlates with more-prepared teachers and more opportunities to
learn for students. Conversely, more income inequality in countries relates to less-
prepared teachers overall and fewer opportunities to learn for students. Differences
between high and low SES students are significant for OTL, meaning that low-SES

169
students have less access to class time in the content areas critical to learning higher-
level math skills than their higher SES peers. However, levels of teacher preparation
do not significantly vary between students with different SES internationally, despite
research showing that low SES students often have less-qualified, emergency-
credentialed, or substitute teachers in the United States (Darling–Hammond, 2004).
This chapter now builds on these international results to examine within-
country relationships of student, classroom, and school characteristics to mathematics
achievement. The research question asks whether any systemic patterns of education
provision and achievement emerge in countries with similar economic conditions. For
example, do certain classroom characteristics relate to math achievement in similar
ways in unequal, higher-income countries, such as Hong Kong and the United States?
To answer these types of questions, this analysis examines the results of education
production functions using a type of “case study” method.
Selecting Countries Participating in Both PISA and TIMSS
To identify possible trends, I selected eleven countries participating in both
PISA and TIMSS with varying levels of country income per capita and income
inequality to identify possible trends. Table 24 shows the economic characteristics of
each country selected for this analysis. Table 25 then shows the countries separated
into categories according to their income per capita and income inequality.16 I group
countries into two categories of GNI per capita with low-income countries having less
than $10,000 per capita and high-income countries having more than $20,000 per
16 Gini coefficients are not calculated every year for each country. Therefore, I used the latest available coefficients calculated nearest to 2003.

170
capita. Although these cut points lack a particular basis in empirical findings from
previous research, they do effectively delineate between countries where individuals
receive quite different average yearly earnings. The highest income per capita in the
low-income group is Hungary, with $6,600, while the lowest income per capita of the
high-income group is Italy, with $22,170. Therefore, the income per capita in the
higher-income per capita countries at minimum triples that of low-income per capita
countries, effectively separating these two groups. Since Tunisia is the only low-
income, high-inequality country participating in both PISA and TIMSS in 2003, the
sample of low-income per capita countries is limited to one. However, using more
than one country for each category (except in the last case) allows trends to emerge
among countries with economic similarities while avoiding findings based on data
artifacts or single-country anomalies.
TABLE 24. GROSS NATIONAL INCOME PER CAPITA AND GINI COEFFICIENTS FOR COUNTRIES SELECTED FOR PRODUCTION FUNCTION ANALYSIS
Country GNI per capita
(2003) Gini
Coefficient Gini Year Hungary 6600 27 2002 Slovak Republic 5010 26 1996 Latvia 4450 34 1998 Russia 2590 31 2002 Tunisia 2260 40 2000 Japan 33430 25 1993 Sweden 29520 25 2000 Australia 22840 35 1994 Italy 22170 36 2000 Hong Kong 25590 43 1996 United States 37570 41 2000 Source: World Bank.
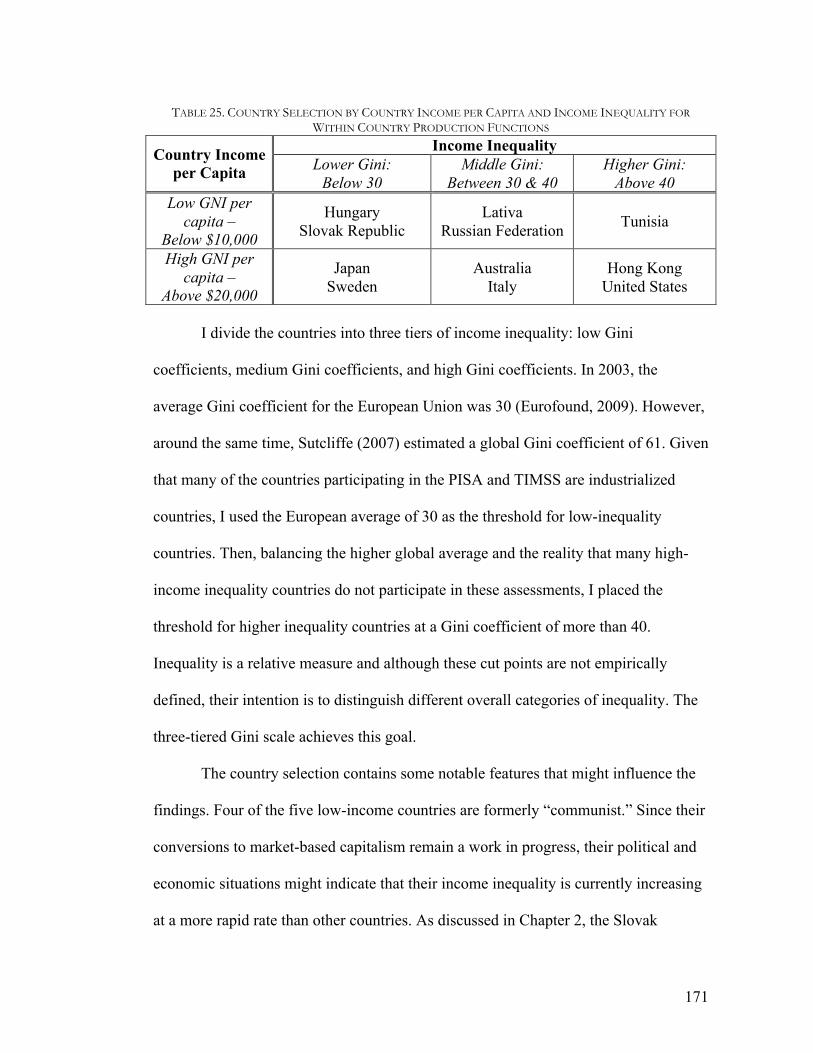
171
TABLE 25. COUNTRY SELECTION BY COUNTRY INCOME PER CAPITA AND INCOME INEQUALITY FOR WITHIN COUNTRY PRODUCTION FUNCTIONS
Income Inequality Country Income per Capita Lower Gini:
Below 30 Middle Gini:
Between 30 & 40 Higher Gini:
Above 40 Low GNI per
capita – Below $10,000
Hungary Slovak Republic
Lativa Russian Federation Tunisia
High GNI per capita –
Above $20,000
Japan Sweden
Australia Italy
Hong Kong United States
I divide the countries into three tiers of income inequality: low Gini
coefficients, medium Gini coefficients, and high Gini coefficients. In 2003, the
average Gini coefficient for the European Union was 30 (Eurofound, 2009). However,
around the same time, Sutcliffe (2007) estimated a global Gini coefficient of 61. Given
that many of the countries participating in the PISA and TIMSS are industrialized
countries, I used the European average of 30 as the threshold for low-inequality
countries. Then, balancing the higher global average and the reality that many high-
income inequality countries do not participate in these assessments, I placed the
threshold for higher inequality countries at a Gini coefficient of more than 40.
Inequality is a relative measure and although these cut points are not empirically
defined, their intention is to distinguish different overall categories of inequality. The
three-tiered Gini scale achieves this goal.
The country selection contains some notable features that might influence the
findings. Four of the five low-income countries are formerly “communist.” Since their
conversions to market-based capitalism remain a work in progress, their political and
economic situations might indicate that their income inequality is currently increasing
at a more rapid rate than other countries. As discussed in Chapter 2, the Slovak

172
Republic did not have a sharp post-Soviet increase in income inequality, giving
credence to the earlier Gini coefficient used in this study. The Gini coefficient for the
other lower income inequality country, Hungary, comes from 2002, very close to the
PISA and TIMSS administration year. Unfortunately, two of the three categories for
lower income per capita countries contain only ex-Soviet bloc countries, meaning that
regional and political history could confound the findings. Expanding the sample in
future studies might improve the generalization of possible trends.
Many of the low-income and higher income inequality countries worldwide do
not participate in these assessments, a restriction on the overall sample. Part I
estimates, therefore, are most likely conservative and larger differences could exist
both within and between countries. Indeed, Sutcliffe (2007) estimates that the global
income inequality is decreasing inter-country but increasing intra-country. This means
that low SES students might have even less access to resources than estimated above,
a hypothesis also tested in this chapter. Furthermore, in this chapter, the right-
censoring of available countries for the Gini coefficient means that patterns in
relationships between math achievement, inputs, and income inequality may not fully
emerge without an expanded dataset. I discuss the potential for continuing this
analysis with future waves of these datasets in the conclusion. For this study, analysis
of the countries selected offers a glimpse into possible relationships outlined above,
but the research agenda requires a more expansive global analysis to garner definitive
findings.

173
Using Production Functions to Identify Cross-National Educational Patterns
For the research question of discerning patterns in educational provision and
achievement in similar countries, two statistical approaches can help identify
correlations between these two elements of education. First, production functions, as
described in Chapter 3, treat schools like firms where given inputs produce outcomes,
usually achievement scores. The theory behind this approach is that any given input
can correlate with the outcome. Therefore, identifying the significant inputs provides
policymakers and practitioners with viable objectives for school reform. The
production function approach employs OLS regression to determine the significance
and magnitude of the relationships between inputs and outputs, which differentiates
between more and less important inputs in a given context.
The second type of analysis, hierarchal linear modeling (HLM), takes into
account the clustered nature of students studying within classrooms which reside in
schools, districts, states, and ultimately, countries. HLM partitions variables from
these different contexts at different analytical levels, allowing researchers to
disaggregate particular school relationships to achievement from those of students, for
instance. Partitioning variance in this manner is one method of determining whether
student SES or classroom and school variables play an important role.
Some drawbacks of HLM are the difficulty of interpreting coefficients;
hierarchal units of analysis that are not primary sampling units (PSU) have
coefficients disaggregated from the PSU coefficients. Therefore, any regression
assumptions violated in an OLS model can be magnified when using HLM. In

174
addition, HLM models can require significant time expenditure (especially for eleven
different countries) while sometimes not providing different information than
production function models. For these reasons, a concurrent HLM analysis is outside
the scope of this study. Instead, a similar OLS technique of variance partitioning is the
analysis of differences between models in coefficient of determination (R2). This
analysis compares the R2 differences between student, classroom, and school models
to determine which sets of relationships are stronger in economically different
countries.
This analysis tests several hypotheses that address the research question of
identifying patterns in educational provision and achievement across countries. Given
the country-level correlations between education and economic conditions in Chapters
4 and 5, I expect that educational inputs correlate more with achievement in low
income inequality countries and that these countries provide more equitable
educational resources for students in both low and high SES quintiles. Conversely, I
expect student SES to correlate more with achievement in high-inequality countries,
with larger differences in achievement between low and high SES students. I
anticipate that classroom and school resources have a smaller role in more-unequal
countries with higher levels of income and a potentially larger role in lower-income
countries.
Previous research informs many of these hypotheses. First, production
functions provide the means for analyzing a major debate between the role of SES and
schooling. The Coleman Report (1966) predicted a strong relationship between SES
and achievement. Conversely, for the TIMSS data on OTL and teacher preparation,

175
studies by Schmidt et al. (1999), and Darling-Hammond (2000) suggest that these
different aspects of schooling would correlate with achievement scores. Heyneman
and Loxley’s (1983) work implies that the results from wealthy countries analyzed in
this chapter would show a stronger relationship between SES and achievement, while
the lower-income countries in the following chapter would show stronger relationships
between school variables and student achievement. However, none of these cited
studies accounts for differences occurring because of differences in income inequality,
when such differences exist. Therefore, in comparing countries with similar income
per capita but varying levels of income inequality, I hypothesize that schooling would
play a larger role for achievement in the more-equal countries, while SES would have
stronger relationship with achievement in more-unequal countries.
These hypotheses, however, tend to dichotomize a more complex situation.
Both schooling and SES likely count for student achievement. Therefore, this research
attempts to disaggregate the factors that have smaller or larger roles for different types
of students. On the one hand, one could reasonably expect low SES students in a high-
inequality country to have multiple challenges to face before and during their school
years, including issues of health, nutrition, etc. (Chiu, 2007). Results might then show
that SES correlates highly with their achievement. However, these same low SES
students often attend sub-par schools, meaning that their performance might
negatively correlate with inputs like teacher preparation and school resources.
Therefore, the discussion of the findings identifies patterns between countries and SES
quintiles with the stipulation that capturing the interactions described above remains a
difficult task both empirically and in the interpretation of results. The production

176
functions in this study do include inputs at the student, classroom, and school level
that show the magnitude of the relationships. Other options for further research
include analyzing models that interact variables between these levels or compare the
production function results with HLM models. However, that research agenda is
outside the scope of this study.
The Relationship of Student Characteristics, Classroom Resources, and School Capacity to Achievement in Economically Different Countries
The analysis in this chapter draws on information from two types of tables.
The first type are summary tables that present final model results organized by the
vectors of student characteristics, classroom resources, and school capacity, both for
entire countries and for the low and high SES quintiles within each country (Table 27
– Table 36). The second type includes tables showing the full production function
results for each country (Table 53 – Table 87). However, because of their very large
number, I relegate these detailed production function results to Appendices 4-7 and
instead focus on whether the results support the hypotheses stated above.
The analysis identifies patterns of similarities and differences between the
country pairs, focusing specifically on three areas: SES, classrooms and schools, and
differences between high and low SES students. First, I examine how the relationship
between SES and achievement differs between country groups. Table 27 and Table 28
present the final model for student characteristics in both high and low GNI per capita
countries in PISA and TIMSS, respectively. I then analyze the relationships between
classroom resources and achievement (Table 29 and Table 30) and school capacity

177
and achievement (Table 31 and Table 32) for all countries. Each of these sets of tables
focuses on one vector of interest, but the results account for all vectors because they
come from the final production functions models presented in the appendices. In short,
classroom resource and school capacity coefficients come from the regressions that
control for SES. Finally, Table 33-Table 36 present results for the relationship of
classroom resources and school capacity for only the low and high SES groups in each
country. These tables help identify disparities within countries in allocating
educational resources. The discussion first identifies the most important variables from
each vector. It then compares the variables and vectors across different types of
countries to test the hypotheses of differences between SES and the role of schooling
between developed and developing countries of differing levels of inequality.
Comparing Student Characteristics Across Countries
As discussed above, I expect to find that student characteristics, particularly
SES, matter more in two types of countries: high-income per capita countries and high
income inequality countries. Instead, the opposite occurs, except in the case of the
United States. Among high-income per capita countries, Hong Kong and Japan have a
smaller SES quintile difference on the PISA. The European countries have similar
SES quintile differences of moderate-high magnitudes. Sweden, known for its
relatively homogenous population, has larger differentiation on test scores across
social class. Sweden contrasts somewhat with Japan, another country with a well-
known homogenous population, with lower differences between SES quintiles. The
United States, a wealthy western, relatively unequal country, has the largest
differences between SES quintiles in both PISA and TIMSS. The U.S. finding

178
partially confirms the hypothesis that income inequality matters for performance
differences across SES quintiles, although the finding is contradicted by the small SES
differences found in Hong Kong.
In low-GNI per capita countries, inequality has the opposite result for SES
quintiles than hypothesized. Low-inequality countries, Hungary and the Slovak
Republic, have the largest SES differences on both PISA and TIMSS, followed by the
middle-inequality countries, Latvia and the Russian Federation, and then the high-
inequality country, Tunisia. These results occur on both PISA and TIMSS. Hungary
and the Slovak Republic have greater achievement inequality across SES groups, a
finding that may reflect trends related to the switch to market economics. Their
increasing privatization of schools in the short term may indicate a longer, time-lagged
movement towards greater income inequality in the future. Therefore, results from the
former Eastern-bloc countries might indicate a trend towards future disparities and
higher levels of income inequality.
Table 26 shows the countries with the smallest and largest achievement
differences between SES quintiles. For both low and high income per capita countries,
the relationships between SES and schooling do not follow a linear trajectory from
low-income inequality to high-income inequality countries. Indeed, the opposite
appears true. Hungary and the Slovak Republic (discussed above), along with the
United States, have the largest achievement differences between SES quintiles. The
two smallest SES differences in achievement occur in the two countries in the highest
tier of income inequality tested here: Hong Kong and Tunisia.

179
TABLE 26. COUNTRIES WITH LARGEST AND SMALLEST DIFFERENCES BETWEEN HIGH AND LOW SES QUINTILE COEFFICIENTS
Larger SES Differences Hungary Slovak Republic United States PISA 0.92 0.86 0.96
TIMSS 0.95 1.0 0.76 Smaller SES Differences Hong Kong Tunisia
PISA 0.32 0.25 TIMSS 0.18 0.26
Source: OECD – PISA 2003; IEA – TIMSS 2003. Upon closer inspection, however, the distribution in Tunisia tilts towards high
SES students; they perform significantly better than other quintiles which have their
own similar performance levels. Given Tunisia’s overall low scores and low income
per capita, these results could reflect a floor effect on the tests where achievement
converges at lower score levels. Also, the lower three SES quintiles of students might
have similar low economic levels as well as similar achievement levels. Hong Kong,
conversely, has a fairly small and even distribution across SES quintiles, suggesting
that other factors play a role, such as classrooms and schools (discussed below).
Finally, the U.S. behaves exactly as predicted—a high-income per capita, high income
inequality country with large achievement differences between SES quintiles. Even
though the U.S. may function as a global outlier in this study, from a domestic policy
perspective, the findings still directly confirm the hypotheses that students’ family
backgrounds correlate heavily with their math achievement in the United States.
These production function results also show that countries such as Sweden,
Hungary, and the Slovak Republic have low Gini coefficients but large achievement
differences between SES quintiles. Theories for the future higher levels of income
inequality in Hungary and the Slovak Republic are presented above, but the current
situation requires attention. The main issue is that achievement differences between

180
low and high SES students likely have different meaning for students in lower Gini
countries when compared to students in higher Gini countries such as the U.S. One
possible explanation is that lower Gini countries focus much more on equalizing
incomes while placing lower priority on achievement equality. It is not as costly
economically and socially for individuals in these countries in low SES quintiles to
have much lower achievement than their counterparts in the high SES quintiles
because many students attend university (between 30-37 percent of the age group
graduates from university in these three countries), and income differences are
relatively small between university and non-university graduates. This situation differs
substantively from the U.S., where a high percentage of people graduate university,
but income differences between graduates and non-graduates remains large. Therefore,
low SES students face a much larger income gap in the U.S. labor market than their
low SES peers in more equal income countries, even though these countries have
similar SES achievement gaps.
For almost all countries, the differences in scores across SES quintiles are quite
similar on both PISA and TIMSS. Many other countries in the analysis show a similar
dispersion of test scores, except for anomalies with smaller differences, like Japan,
Hong Kong, and Tunisia. This result shows a possible geographical proclivity in Asia
towards more-equal performance outcomes that needs confirmation from more
countries. Tunisia has small SES differences but more income inequality; therefore,
other economic and educational forces may contribute to its distribution of education
resources. The differences might occur between the highest SES students and a larger
portion of the lower SES population.

181
Overall, linking SES and income inequality remains a tenuous proposition,
upheld only in specific cases in this study instead of confirming a trend. No strong
evidence exists that greater income inequality leads to greater dispersion in test scores
across SES quintiles. While a higher Gini coefficient relates to lower average test
scores, it does not necessarily lead to dispersion of test scores by SES groups.
Including data from more countries with greater economic differences might confirm
this apparent lack of pattern, or it might show that the U.S. case does signal a
difference in outcomes as income inequality increases.
Among the other student characteristics, age has a negative coefficient in all
countries but Japan on TIMSS. This result most likely shows that older students
perform worse on the TIMSS, possibly due to retention policies since all students are
in the 8th grade. In PISA, age is a very complex issue because students of the same age
attend different grade levels. Finally, many countries have moderate negative
coefficients for females; therefore, girls still had an achievement gap in mathematics
with their male peers in 2003.
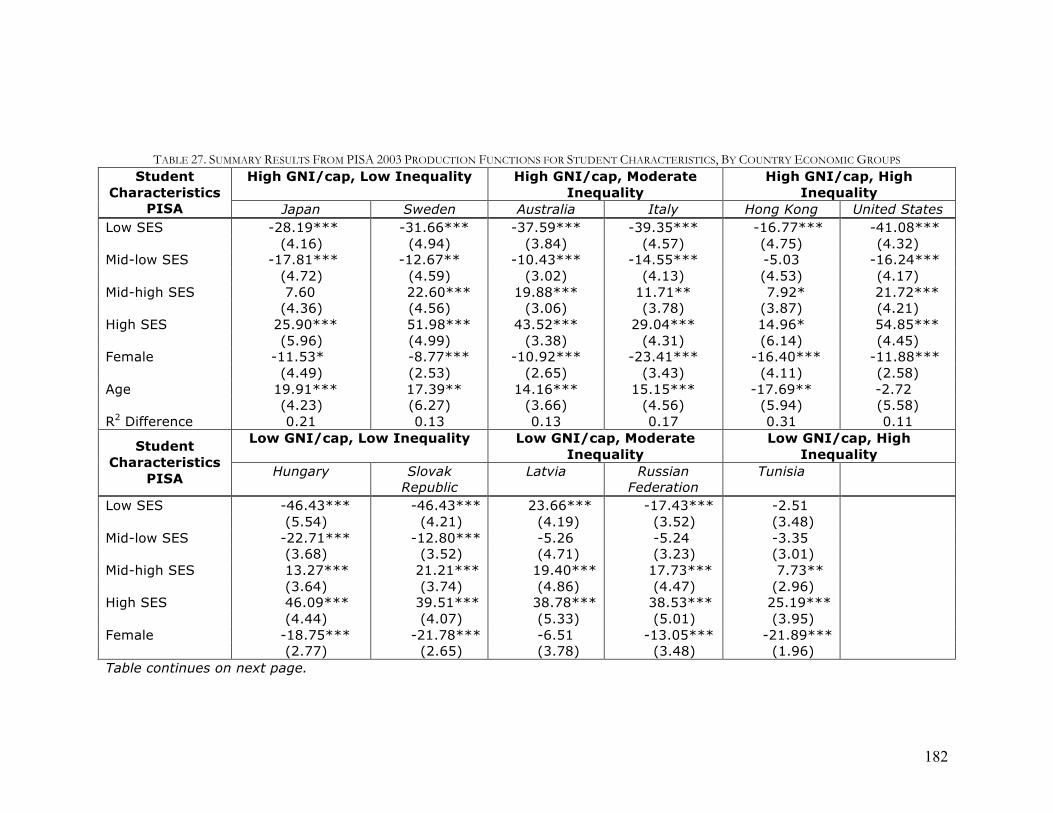
182
TABLE 27. SUMMARY RESULTS FROM PISA 2003 PRODUCTION FUNCTIONS FOR STUDENT CHARACTERISTICS, BY COUNTRY ECONOMIC GROUPS High GNI/cap, Low Inequality High GNI/cap, Moderate
Inequality High GNI/cap, High
Inequality Student
Characteristics PISA Japan Sweden Australia Italy Hong Kong United States
Low SES -28.19*** -31.66*** -37.59*** -39.35*** -16.77*** -41.08*** (4.16) (4.94) (3.84) (4.57) (4.75) (4.32) Mid-low SES -17.81*** -12.67** -10.43*** -14.55*** -5.03 -16.24*** (4.72) (4.59) (3.02) (4.13) (4.53) (4.17) Mid-high SES 7.60 22.60*** 19.88*** 11.71** 7.92* 21.72*** (4.36) (4.56) (3.06) (3.78) (3.87) (4.21) High SES 25.90*** 51.98*** 43.52*** 29.04*** 14.96* 54.85*** (5.96) (4.99) (3.38) (4.31) (6.14) (4.45) Female -11.53* -8.77*** -10.92*** -23.41*** -16.40*** -11.88***
(4.49) (2.53) (2.65) (3.43) (4.11) (2.58) Age 19.91*** 17.39** 14.16*** 15.15*** -17.69** -2.72
(4.23) (6.27) (3.66) (4.56) (5.94) (5.58) R2 Difference 0.21 0.13 0.13 0.17 0.31 0.11
Low GNI/cap, Low Inequality Low GNI/cap, Moderate Inequality
Low GNI/cap, High Inequality Student
Characteristics PISA Hungary Slovak
Republic Latvia Russian
Federation Tunisia
Low SES -46.43*** -46.43*** 23.66*** -17.43*** -2.51 (5.54) (4.21) (4.19) (3.52) (3.48) Mid-low SES -22.71*** -12.80*** -5.26 -5.24 -3.35 (3.68) (3.52) (4.71) (3.23) (3.01) Mid-high SES 13.27*** 21.21*** 19.40*** 17.73*** 7.73** (3.64) (3.74) (4.86) (4.47) (2.96) High SES 46.09*** 39.51*** 38.78*** 38.53*** 25.19*** (4.44) (4.07) (5.33) (5.01) (3.95) Female -18.75*** -21.78*** -6.51 -13.05*** -21.89***
(2.77) (2.65) (3.78) (3.48) (1.96) Table continues on next page.

183
Student Characteristics
PISA
Hungary Slovak Republic
Latvia Russian Federation
Tunisia
Age -23.30*** -30.65*** 20.78*** -19.25*** -4.31 (4.86) (7.30) (4.83) (5.29) (3.61)
R2 Difference 0.14 0.14 0.08 0.12 0.30 Notes: Standard errors in parentheses. *** p<0.001, ** p<0.01, * p<0.05 Middle SES quintile serves as reference category.
R2 difference between complete model and model with only student characteristics. Source: OECD – PISA 2003.

184
TABLE 28. SUMMARY RESULTS FROM TIMSS 2003 PRODUCTION FUNCTIONS FOR STUDENT CHARACTERISTICS, BY COUNTRY ECONOMIC GROUPS High GNI/cap, Low Inequality High GNI/cap, Moderate
Inequality High GNI/cap, High
Inequality Student
Characteristics TIMSS Japan Sweden Australia Italy Hong Kong United States
Low SES -36.21*** -37.46*** -39.44*** -41.86*** -4.97 -40.88*** (3.74) (3.83) (5.24) (4.09) (3.15) (3.62) Mid-low SES -12.69*** -14.62*** -13.73** -18.67*** -3.22 11.63*** (3.27) (4.09) (4.75) (4.20) (3.27) (2.91) Mid-high SES 20.24*** 20.39*** 10.76** 13.03*** 6.51* 18.90*** (3.12) (3.42) (4.06) (3.84) (3.30) (3.14) High SES 38.78*** 38.54*** 23.71*** 30.15*** 17.51*** 35.21*** (3.65) (4.90) (4.80) (4.38) (5.28) (3.90) Female -4.08 -5.05* -8.73 -9.54*** -1.38 -7.88***
(3.83) (2.37) (6.06) (2.71) (4.35) (1.64) Age 7.62* -6.51 -3.94 -16.12*** 5.84*** -12.69***
(3.60) (4.04) (5.01) (3.40) (1.62) (2.17) R2 difference 0.02 0.06 0.11 0.05 0.20 0.10
Low GNI/cap, Low Inequality Low GNI/cap, Moderate Inequality
Low GNI/cap, High Inequality Student
Characteristics TIMSS Hungary Slovak
Republic Latvia Russian
Federation Tunisia
Low SES -50.01*** -53.61*** -21.45*** -32.94*** -1.03 (5.15) (4.64) (5.16) (3.51) (3.62) Mid-low SES -20.42*** -15.04*** -9.37 -12.47** -1.90 (4.48) (3.77) (5.39) (3.86) (2.61) Mid-high SES 16.96*** 21.64*** 11.87* 12.04** 6.96* (3.65) (4.81) (5.22) (3.83) (2.84) High SES 44.78*** 46.04*** 35.10*** 27.76*** 25.96*** (5.29) (4.69) (5.44) (4.29) (3.75) Female -11.12*** -2.99 3.83 1.23 -26.10***
(3.06) (3.45) (2.83) (2.61) (1.73) Table continues on next page.

185
Student Characteristics
TIMSS
Hungary Slovak Republic
Latvia Russian Federation
Tunisia
Age -29.69*** -29.67*** -25.46*** -15.79*** -11.95*** (3.13) (3.69) (3.43) (3.47) (0.85)
R2 difference 0.03 0.04 0.04 0.04 0.04 Notes: Standard errors in parentheses. *** p<0.001, ** p<0.01, * p<0.05
SES missing values mean imputed. Middle SES quintile serves as reference category. R2 difference between complete model and model with only student characteristics.
Source: IEA – TIMSS 2003.

186
Comparing Classroom Resources and School Capacity Across Countries
A similar situation exists with production function results for classroom and
school vectors as with the relationship between SES and achievement. No discernable
pattern emerges that clearly links country income per capita or income inequality with
specific classroom or school variables such as teacher preparation or OTL.
Fortunately, most education researchers understand the complex interactions between
levels of analysis and know that no “silver bullet” solution exists. This section
acknowledges this complexity while discussing significant findings in OTL, teacher
preparation, class size, school resources and size, and community size.
An examination of OTL results shows that the PISA measure of grade level is
significant and positive for eight of eleven countries. Unsurprisingly, students in
higher grades perform better on PISA in all cases. In particular, Italian students in
higher grades score ~0.6 of an SD higher, and, similarly, Tunisian students score more
than 0.8 of an SD higher than their peers in lower grades. In Tunisia, especially, this
result appears to contribute to a higher R2 for schooling on PISA, a result predicted by
Heyneman and Loxely (1983) and discussed below.
In TIMSS, OTL plays an important role in four of the six high income per
capita countries—Sweden, Australia, Hong Kong, and the United States—but has no
significant relationships with achievement in low income per capita countries.
Confirming results from Schmidt et al. (2001), students receiving the top tercile of
instructional time in algebra and geometry in the United States score over 0.6 of an SD
higher than students receiving the lowest tercile of OTL. Countries like Japan,
187
however, might not vary greatly in their provision of OTL, a factor leading to the
variable’s non-significance in the final model.
In low income per capita countries, OTL has no significant relationship to
achievement on TIMSS. This result illustrates a lack of variance for OTL in these
countries and contributes to a larger picture of the lack of classroom and school
relationships in these countries on TIMSS. This finding for classroom and school
results differs between TIMSS and PISA, with low income per capita countries having
a uniform smaller variance for schooling in TIMSS, in contrast to Heyneman and
Loxley’s (1983) findings. Of course, they were dealing with a range of countries with
much lower income than those studied here (except for Tunisia). A more complete
discussion of these differences occurs below.
For class size, the results for PISA show significant negative coefficients for
missing class sizes in nine of eleven countries. Principals at lower-performing schools
are most likely to not report class size.17 Given this possible bias, it is interesting to
note that, on PISA, larger class size correlates with higher achievement in every high
income per capita country. The same is true in Sweden and Australia in TIMSS. In
lower income per capita countries of Hungary and Tunisia, students in larger classes
have lower scores on PISA and TIMSS. These results might simply reflect low
response rates from principals at schools with lower-performing students in large
17 The pattern of significant coefficients for missing data is even greater for class time spent on math, with principals of lower achieving schools in all eleven countries failing to report data on math time in PISA. Therefore, these results are not discussed, as their validity remains questionable and points to data collection issues in PISA’s principal survey.

188
classes. More complete data would be needed to deal with possible selection bias and
to get more definitive results on this policy issue.
The preparation of teachers is another important area for education research.
Chapter 5 shows that students in more-unequal countries have teachers with somewhat
less training. Some results for individual country production functions validate
hypothesized positive relationships between teacher preparation and achievement,
although trends remain less than perfectly correlated. On PISA, students in schools
with more certified teachers have lower achievement scores in Sweden; this could
mean that other teachers have better types of preparation. In Hong Kong, schools with
more teachers having math degrees contain students who score higher on PISA, and
the same holds true in Japan for teachers with pedagogical degrees. On PISA, both
math and pedagogical degrees correlate with higher achievement in Hungary and the
Slovak Republic, although the latter has some data missing on teachers. Overall,
teachers do appear to play a significant role for students in low income inequality
countries in PISA, a finding that somewhat confirms hypotheses that classroom
resources would be more important this type of country.
Analytical results diverge concerning teachers in the TIMSS and PISA. TIMSS
shows fewer significant relationships between teacher preparation and achievement.
Teacher master degrees in math relate to higher student math scores in Hong Kong but
correlate to the unorthodox result of lower student scores in Tunisia. Given that
TIMSS surveys teachers and PISA surveys principals about the percentage of teachers
in their schools, the TIMSS results have more validity because they use data from a
more specific source—teachers. This conceptually decreases the validity in PISA

189
results in this study showing a correlation between teachers and low income inequality
countries. The TIMSS results instead continue to show the importance of classroom
resources in both Hong Kong and Tunisia, a finding not predicted by the hypotheses.
Within the school capacity vector, school resources link to achievement in few
countries, positively correlating in only two high income per capita countries—
Australia and Italy. Paradoxically, school resources relate negatively to achievement
in Hong Kong on both PISA and TIMSS. School resources do not correlate with
achievement in any low income per capita countries on either PISA or TIMSS.
School size is positively correlated to achievement in seven of eleven countries
in PISA. Larger schools might have more resources that lead to higher achievement
scores for students. School size appears correlated to achievement in more countries
than school resources, as measured on PISA; however, the school size results are not
duplicated in TIMSS.
In this study, I have classified community size within the vector of school
capacity because it serves as a proxy for the overall capacity of the community to
contribute to the school environment. I expect the relationship of community size to
achievement to be nonlinear because small communities and large urban centers most
likely distribute the fewest school resources per capita. I hypothesize that this rural
effect would arise more in lower income per capita countries with larger agrarian
populations, while the urban effect would occur in more-unequal countries with larger
numbers of urban poor.
Few countries show significant relationships between achievement and
community size. In Italy on TIMSS and in the U.S. on PISA, students in smaller

190
communities perform better those in large, urban areas. In particular, the former
outperform the latter by more than one-third of an SD in the United States, reflecting a
well-documented inattention to urban students in the U.S. In two lower income per
capita countries, Hungary and the Russian Federation, students in smaller
communities perform lower than their peers in large, urban communities on both PISA
and TIMSS, confirming the hypothesis.
The dearth of relationships between schooling and low income per capita
countries appears to counter the Heyneman and Loxely theory. Further below, I
reanalyze Heyneman and Loxely’s theory in a different manner by comparing R2
differences between student characteristics and the classroom/school final model for
both PISA and TIMSS. The next section, however, compares production function
results between high and low SES quintiles in each country.

191
TABLE 29. SUMMARY RESULTS FROM PISA 2003 PRODUCTION FUNCTIONS FOR CLASSROOM RESOURCES, BY COUNTRY ECONOMIC GROUPS (ONLY SIGNIFICANT COEFFICIENTS REPORTED)
High GNI/cap, Low Inequality
High GNI/cap, Moderate Inequality
High GNI/cap, High Inequality Classroom Resources – PISA
Japan Sweden Australia Italy Hong Kong United States Grade 48.39*** 61.70*** 46.92*** 32.85*** (Grade 10th-12th) (3.51) (4.58) (3.35) (3.41) Math Time 36.13*** 9.32* 8.17** 20.42*** (Middle Tercile) (5.64) (3.77) (2.78) (3.81) Math Time 39.75*** 11.67* -27.66*** (High Tercile) (6.90) (4.54) (3.72) Overall Math Time -31.34*** -46.86*** -57.78*** -28.87*** -58.54*** -52.00*** (Missing) (5.40) (3.72) (3.50) (5.43) (6.04) (4.20) Class Size 44.12*** 29.18*** 18.94*** 9.57* 28.96*** 14.56*** (Middle tercile) (6.71) (4.31) (2.93) (4.80) (4.90) (3.52) Class Size 41.07*** 34.10*** 25.86*** 16.70*** 38.49*** 10.39** (High tercile) (7.69) (4.83) (3.01) (4.68) (7.78) (3.87) Class Size -17.61* -46.04*** -36.53*** -36.03*** -28.19** -27.50***
(Missing) (7.43) (9.62) (5.79) (8.78) (9.06) (5.68) Teacher Certified -11.80* (Middle Tercile) (5.09) Teacher Certified
(High Tercile) Teacher Certified 12.34*
(100 Percent) (4.85) Teacher Certified 20.34* -43.36** 17.59**
(Missing) (8.92) (13.74) (5.50) T. Math Degree 20.19*
(Middle Tercile) (9.82) T. Math Degree
(High Tercile) T. Math Degree
(100 Percent) Table continues on next page.

192
Classroom Resources – PISA Japan Sweden Australia Italy Hong Kong United States
T. Math Degree (Missing)
T. Pedagogy Degree (Middle Tercile)
T. Pedagogy Degree 19.33* (High Tercile) (9.26)
T. Pedagogy Degree (100 Percent)
T. Pedagogy Degree (Missing)
R2 Difference 0.21 0.13 0.13 0.17 0.31 0.11 Low GNI/cap, Low
Inequality Low GNI/cap, Moderate
Inequality Low GNI/cap, High Inequality Classroom Resources – PISA
Hungary Slovak Republic Latvia Russian
Federation Tunisia
Grade 44.69*** 33.32*** 35.51*** 86.59*** (Grade 10th-12th) (3.34) (9.70) (5.15) (4.71) Math time -23.95*** 12.85* 24.29*** (Middle tercile) (4.59) (5.14) (4.57) Math time -13.06** 32.25*** -13.63*** (High tercile) (4.77) (4.55) (3.98) Math Time -47.37*** -66.03*** -26.36*** -44.86*** -27.40*** (Missing) (5.32) (4.57) (6.23) (6.85) (3.80) Class size -13.99** -13.01** -12.70** (Middle tercile) (4.88) (4.69) (4.10) Class size 9.45* -19.69*** (High tercile) (4.59) (4.53) Class Size -15.68* -21.86* -37.45*** -25.27*** (Missing) (7.35) (10.81) (8.84) (3.87) Table continues on next page.

193
Classroom Resources – PISA Hungary Slovak
Republic Latvia Russian Federation Tunisia
Teacher Certified 30.92*** (Middle Tercile) (8.32)
Teacher Certified (High Tercile)
Teacher Certified (100 Percent)
Teacher Certified 23.20** (Missing) (8.71) T. Math Degree 20.90* 14.62*
(100 Percent) (9.84) (6.16) T. Math Degree 19.70* (Missing) (8.92) T. Pedagogy Degree 35.57***
(100 Percent) (8.47) T. Pedagogy Degree 14.24* (Middle Tercile) (6.85) T. Pedagogy Degree (High Tercile) T. Pedagogy Degree 43.09*
(Missing) (17.76) R2 Difference 0.14 0.14 0.08 0.12 0.30 Notes: Standard errors in parentheses. *** p<0.001, ** p<0.01, * p<0.05
R2 difference between complete model and model with only student characteristics. Source: OECD – PISA 2003.

194
TABLE 30. SUMMARY RESULTS FROM TIMSS 2003 PRODUCTION FUNCTIONS FOR CLASSROOM RESOURCES, BY COUNTRY ECONOMIC GROUPS (ONLY SIGNIFICANT COEFFICIENTS REPORTED)
High GNI/cap, Low Inequality
High GNI/cap, Moderate Inequality
High GNI/cap, High Inequality
Classroom Resources
TIMSS Japan Sweden Australia Italy Hong Kong United States % Alg. + Geo. 16.33* 35.58* 23.90* 24.71*** (Middle tercile) (6.51) (14.26) (10.43) (3.87) % Alg. + Geo. 20.35** 46.14** 62.64***
(High tercile) (6.53) (14.16) (5.85) % Alg. + Geo. 60.54*** (Missing) (17.07) Overall Math Time -13.87**
(Upper 50%) (4.43) Class Size 19.25** 31.56** (25-32 students) (6.31) (10.46)
Class Size 38.14*** 73.42***
(33+ students) (8.19) (19.24)
Class Size 111.93* (Missing) (43.91)
T. Math Degree (Required)
T. Math Degree -97.65* (Missing) (41.57)
T. ISCED 5A 22.86* (2nd Degree) (10.90)
T. ISCED 5A (2nd D. Missing) R2 Difference 0.02 0.06 0.11 0.05 0.20 0.10 Table continues on next page.
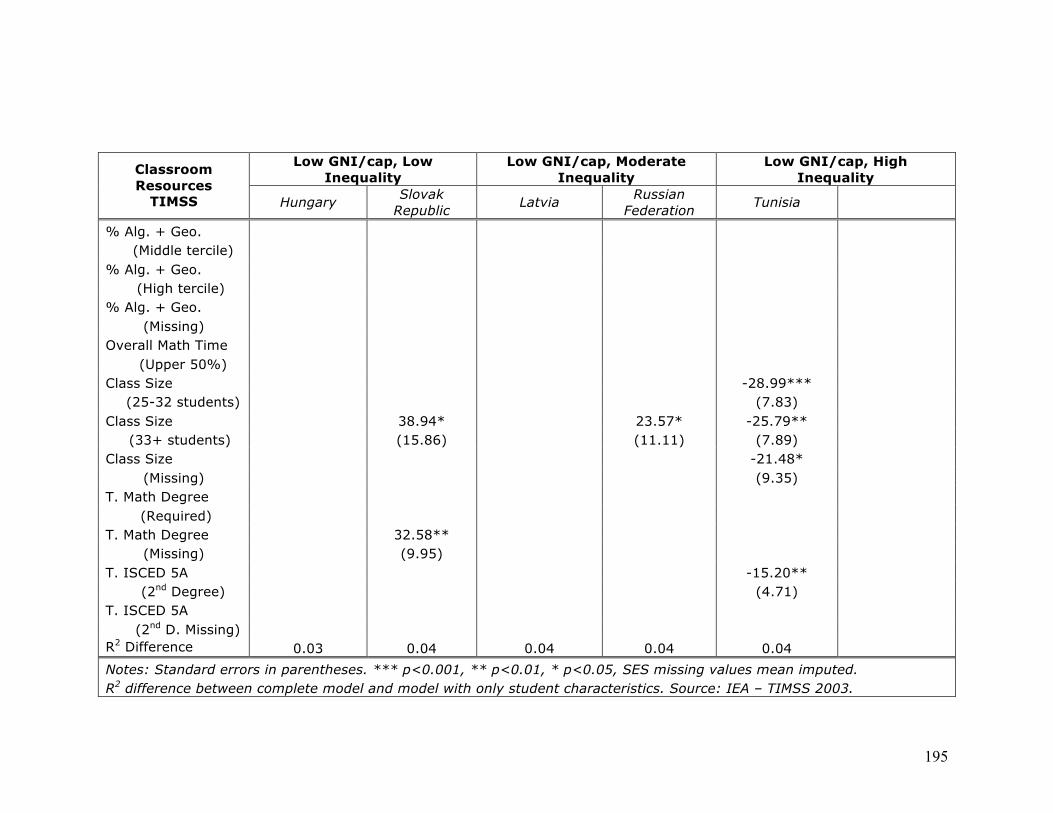
195
Low GNI/cap, Low Inequality
Low GNI/cap, Moderate Inequality
Low GNI/cap, High Inequality Classroom
Resources TIMSS Hungary Slovak
Republic Latvia Russian Federation Tunisia
% Alg. + Geo. (Middle tercile)
% Alg. + Geo. (High tercile)
% Alg. + Geo. (Missing)
Overall Math Time (Upper 50%)
Class Size -28.99*** (25-32 students) (7.83) Class Size 38.94* 23.57* -25.79** (33+ students) (15.86) (11.11) (7.89)
Class Size -21.48*
(Missing) (9.35)
T. Math Degree
(Required)
T. Math Degree 32.58**
(Missing) (9.95)
T. ISCED 5A -15.20**
(2nd Degree) (4.71)
T. ISCED 5A
(2nd D. Missing)
R2 Difference 0.03 0.04 0.04 0.04 0.04
Notes: Standard errors in parentheses. *** p<0.001, ** p<0.01, * p<0.05, SES missing values mean imputed. R2 difference between complete model and model with only student characteristics. Source: IEA – TIMSS 2003.

196
TABLE 31. SUMMARY RESULTS FROM PISA 2003 PRODUCTION FUNCTIONS FOR SCHOOL CAPACITY, BY COUNTRY ECONOMIC GROUPS (ONLY SIGNIFICANT COEFFICIENTS REPORTED)
High GNI/cap, Low Inequality High GNI/cap, Moderate
Inequality High GNI/cap, High
Inequality School Capacity PISA
Japan Sweden Australia Italy Hong Kong United States School Size 32.33** 8.60* 37.45*** (Middle Tercile) (10.18) (3.76) (10.17) School Size 38.49*** 11.30* 16.54* 67.26*** (High Tercile) (9.79) (4.95) (8.06) (14.82) School Size -21.97* (Missing) (10.35) School Resources 17.24* -19.58* (Middle Tercile) (7.60) (8.00)
School Resources 12.05* 17.52* (High Tercile) (5.14) (8.06)
School Resources (Missing)
Population 40.89** (below 3K) (14.39)
Population 37.17** (3K -15K) (12.95)
Population 35.58** (15K – 100K)
Population -21.82* (100K-500K) (10.73)
R2 Difference 0.21 0.13 0.13 0.17 0.31 0.11 Table continues on next page.

197
Low GNI/cap, Low Inequality Low GNI/cap, Moderate Inequality
Low GNI/cap, High Inequality School Capacity
PISA Hungary Slovak Republic Latvia Russian
Federation Tunisia
School Size 19.16** 22.26** (Middle Tercile) (6.63) (8.59) School Size 15.25* 25.17* 25.53** (High Tercile) (7.61) (11.16) (9.29) School Size (Missing) School Resources (Middle Tercile)
School Resources (High Tercile)
School Resources 40.35* (Missing) (19.06)
Population -80.99*** (below 3K) (15.42)
Population -29.39* -32.40** (3K -15K) (10.12)
Population -22.88* (15K – 100K) (11.08)
Population -25.51* (100K - 1000K) (11.96)
R2 Difference 0.14 0.14 0.08 0.12 0.30 Notes: Standard errors in parentheses. *** p<0.001, ** p<0.01, * p<0.05
R2 difference between complete model and model with only student characteristics. Source: OECD – PISA 2003.
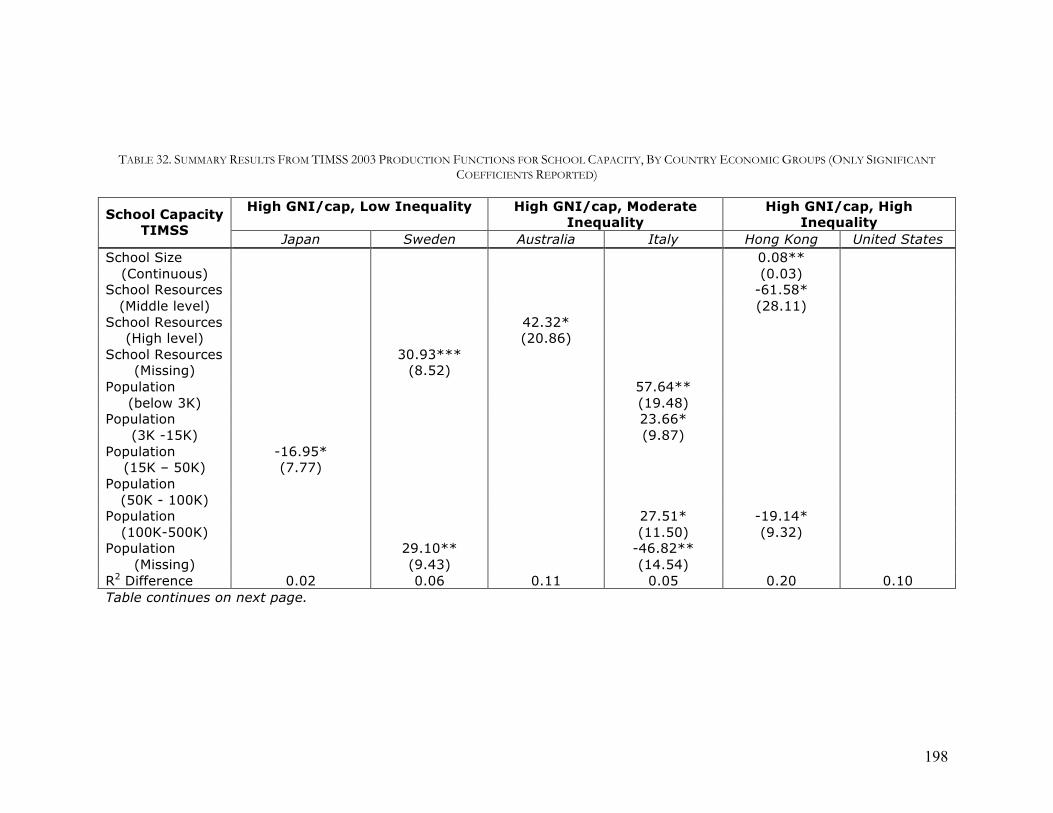
198
TABLE 32. SUMMARY RESULTS FROM TIMSS 2003 PRODUCTION FUNCTIONS FOR SCHOOL CAPACITY, BY COUNTRY ECONOMIC GROUPS (ONLY SIGNIFICANT COEFFICIENTS REPORTED)
High GNI/cap, Low Inequality High GNI/cap, Moderate
Inequality High GNI/cap, High
Inequality School Capacity TIMSS
Japan Sweden Australia Italy Hong Kong United States School Size 0.08**
(Continuous) (0.03) School Resources -61.58*
(Middle level) (28.11) School Resources 42.32*
(High level) (20.86) School Resources 30.93***
(Missing) (8.52) Population 57.64**
(below 3K) (19.48) Population 23.66*
(3K -15K) (9.87) Population -16.95*
(15K – 50K) (7.77) Population
(50K - 100K) Population 27.51* -19.14*
(100K-500K) (11.50) (9.32) Population 29.10** -46.82**
(Missing) (9.43) (14.54) R2 Difference 0.02 0.06 0.11 0.05 0.20 0.10 Table continues on next page.

199
Low GNI/cap, Low Inequality Low GNI/cap, Moderate Inequality
Low GNI/cap, High Inequality School Capacity
TIMSS Hungary Slovak Republic Latvia Russian
Federation Tunisia
School Size (Continuous)
School Resources (Middle level)
School Resources (High level)
School Resources (Missing)
Population -25.02* (below 3K) (11.91)
Population (3K -15K)
Population (15K – 50K)
Population -19.97* (50K - 100K) (9.71)
Population 35.22** (100K-500K) (13.38)
Population (Missing)
R2 Difference 0.03 0.04 0.04 0.04 0.04 Notes: Standard errors in parentheses. *** p<0.001, ** p<0.01, * p<0.05, SES missing values mean imputed.
R2 difference between complete model and model with only student characteristics. Source: IEA – TIMSS 2003.
200
Comparing Classroom Resources and School Capacity Between Low and High SES Quintiles Across Countries
One of the main hypotheses of this study was that students with low and high
levels of SES would have different educational experiences, especially in more-
unequal countries. Findings in Chapters 4 and 5 concerning TIMSS show some
differences but not the expected disparities, either in breadth or direction. This section
more closely examines the differences that do occur through the results from
production functions restricted specifically to the lowest and highest SES quintile
students for the eleven countries selected by their economic conditions. As found
above, conclusive patterns relating economic conditions to low or high SES groups do
not appear, but some interesting differences do emerge for OTL, teacher preparation,
and community size.
Hypotheses for this comparative analysis require understanding the
relationship between multiple factors. One must consider whether the achievement
levels of a low SES student in a more-unequal country would more likely correlate to
the student’s home environment or to classroom resource and school capacity factors.
If one argues that home environment serves as the foundation for a student’s level of
ability to engage effectively in school, one would expect that students from families
providing few extras at home would show strong negative correlations between SES
and achievement. However, these students also often attend under-resourced schools;
therefore, a negative correlation between low SES student achievement and school
resources would also occur. Given these complexities, this analysis seeks patterns of
differences between the two outermost SES groups to uncover possible contributions

201
(or lack thereof) of family background and/or school environment to student math
scores.
In PISA, the grade level measure of OTL does not differ greatly between low
and high SES students, except in Tunisia and the Slovak Republic. High SES students
in Tunisia in higher grades perform over one standard deviation higher than their
peers, while low SES students have scores around three-quarters of an SD higher than
their lower grade peers. More schooling appears to raise scores in Tunisia, and it helps
high SES students somewhat more than their low SES peers. Given Tunisia’s
economic condition with the lowest GNI per capita studied here and its higher level of
income inequality, this result using the coarse measure of grade level shows that
schooling does matter and confirms Heyneman and Loxley’s theory using PISA.
Completing more grade levels also helps the achievement of high SES students, but
not their low SES peers, in the Slovak Republic. This finding suggests that country
level income inequality does not contribute as much as the combination of individual
SES and income per capita. Higher SES students in these two lower income per capita
countries benefit more from more years of schooling than their low SES peers,
according to PISA results.
In TIMSS, increased OTL correlates more with high SES students in the
United States, although missing data somewhat confound this finding. High SES
students show 0.85 of an SD achievement increase when in classrooms in the highest
tercile of algebra and geometry. Their low SES peers receive an achievement boost of
less than half of this amount. Interestingly, the low SES students show score increases
based on overall math time in the U.S. while math time is insignificant for high SES
202
students. Pairing these findings suggests that low SES students in the U.S. benefit
from a broader range of math time, demonstrating a larger dimension of need, while
for high SES students, higher achievement correlates specifically with the content of
their class time.
OTL is significantly and positively correlated with student achievement for
low SES students in three other high income per capita countries: Sweden, Australia,
and Hong Kong. Such OTL results add to the findings about the importance of OTL
from Chapters 4 and 5. Those two chapters show that income inequality negatively
relates to achievement and OTL, and that students from lower SES quintiles have
access to significantly less OTL. The findings in Chapter 6 identify high income per
capita countries, not high income inequality countries, meaning that the findings are
not exactly parallel. Nevertheless, the presence of similar significant findings for OTL
demonstrates the need for further research, which I consider in Chapter 7. As
discussed above, in low income per capita countries, OTL has no significant
relationship to achievement on TIMSS.
An examination of class size shows that high SES students in larger classes
perform better, with no significant missing data, in Japan, Sweden, and Hong Kong.
This counterintuitive finding somewhat confirms the previous section’s finding, even
though tainted by missing values, that larger classes are associated with higher
achievement in high income per capita countries. “Good” schools may attract more
students and fill their classes. Why this is the case remains unclear, but TIMSS results
for Sweden, where both high and low SES students in larger classes have higher test
scores, supports the finding. In PISA, increased class size has a negative effect for low

203
income per capita countries such as Hungary, the Slovak Republic, and Tunisia,
suggesting a different relationship in lower income per capita countries.
Results for the correlation between teacher preparation and achievement show
even fewer significant relationships when one considers only low and high SES
students. In PISA, the results follow no discernable pattern, most likely due to the
missing observations from principals for these variables. In TIMSS, high SES students
having teachers with a math degree have increased achievement scores by around one-
quarter of an SD. High SES students in Hungary similarly benefit from having
teachers with the equivalent of Master’s degrees. Both of these countries have lower
income inequality, slightly confirming the hypothesis that classroom resources would
be more important in countries with presumably more-equal distributions of resources.
In both cases, the higher SES students benefits from the more prepared teachers.
A major difference between low and high SES students could come from the
inequitable distribution of school resources. One method for ascertaining this disparity
could occur through an analysis of bivariate distributional differences. This descriptive
approach would offer a broad picture of distribution without taking achievement into
account. Although this approach is outside the scope of this study, it would prove
useful in future research. Here, the production functions identify the relationship of
school resources to student achievement while accounting for other educational inputs.
In PISA, increased school resources positively relate to math scores for high
SES students in Australia and low SES students in Italy and the Russian Federation.
They negatively correlate with achievement for high SES students in the Slovak
Republic, a surprising finding. Overall, school resources in PISA appear to matter in

204
countries with moderate income inequality, not in countries with higher or lower
income inequality; this finding refutes the hypotheses. In TIMSS, however, school
resources have a strong correlation with achievement in Japan. Low SES students
appear to have two-thirds of an SD lower math scores in schools with more resources,
while their higher SES peers have between one-third and one-half higher test scores
when attending schools with more resources, depending on the number of resources.
Why low SES students would not improve performance remains unclear. What does
become clear, however, is that school resources matter in Japan, as predicted for a low
income inequality country.
On the other hand, school size positively correlates with achievement in Japan
as well as Hong Kong, both high income per capita countries. For both cases, school
size correlates more for low SES than high SES students. School size could, in fact,
reflect a greater concentration of resources. Better schools would then attract more
students, and they tend to be in more urbanized areas as well (except potentially in the
United States). Since these countries have different levels of income inequality, the
results refute hypotheses about this aspect of country economic condition. In low
income per capita countries, school size does not consistently correlate with
achievement in PISA. A similar result occurs in TIMSS where school size slightly
relates to achievement in only two countries.
The relationship between community size and achievement does confirm
hypotheses, albeit only in a few countries. Most notably, in the United States, low SES
students have more than a one-third of an SD higher performance on PISA in smaller
communities than in urban areas. Results for high SES students are not significant,

205
meaning that low SES students in the urban areas have significantly lower test scores,
a finding replicated throughout domestic U.S. education research. On TIMSS, low
SES students in smaller communities also outperform their urban peers in Italy, a
country with moderate income inequality. In Japan, the opposite occurs, with high
SES students from smaller communities having lower math scores. Thus as inequality
rises, student performance appears to shift from urban centers to smaller communities,
potentially tracking demographic effects of inequality as urban areas neglect their low
SES students.
The results of comparing production functions between low and high SES
groups show some differences in the two groups, but reveal no major patterns across
countries with different levels of income inequality. However, OTL and teacher
preparation matter more for high SES students in a few countries, somewhat
confirming the hypothesis that schooling has a greater influence on students with the
benefit of strong family foundations. Meanwhile, community size matters for low SES
students, with students from smaller communities performing better in the U.S., but
having lower scores in countries with lower income per capita. The results for
community size offer the most basic confirmation of unequal educational
environments in countries with more income inequality, but the finding is limited to
only one country, the United States. Therefore, the U.S. could function as a global
educational and economic outlier, a possibility analyzed in the next section that
examines differences in the variance estimated for student and classroom/school
production functions.

206
TABLE 33. SUMMARY RESULTS FROM PISA 2003 PRODUCTION FUNCTIONS FOR CLASSROOM RESOURCES, BY COUNTRY ECONOMIC GROUPS AND LOW AND HIGH SES QUINTILES (ONLY SIGNIFICANT COEFFICIENTS REPORTED)
High GNI/cap, Low Inequality High GNI/cap, Moderate Inequality High GNI/cap, High Inequality
Japan Sweden Australia Italy Hong Kong United States
Classroom Resources
PISA Low SES High SES Low SES High SES Low SES High SES Low SES High SES Low SES High SES Low SES High SES
Grade 54.08*** 46.31*** 53.75*** 57.04*** 53.85*** 51.42*** 35.80*** 22.88**
(10th – 12th) (7.09) (8.13) (7.78) (10.91) (5.54) (7.44) (5.59) (7.17)
Math time 29.45*** 40.55*** 22.39** 27.11***
(Middle Tercile) (7.73) (10.29) (8.08) (7.17)
Math time 57.22*** -19.98* 14.18* 26.15*** -23.59** -27.62**
(High Tercile) (12.17) (7.88) (5.74) (7.64) (7.51) (8.58)
Math time 43.42*** -49.75*** -49.86*** -59.69*** -61.48*** 25.70* -57.86*** -64.03*** -45.14*** -42.53**
(Missing) (9.68) (7.62) (8.87) (8.12) (6.90) (10.02) (9.47) (15.00) (8.23) (12.99)
Class size 43.59*** 40.88*** 38.51*** 16.37* 15.58* 13.37** 30.18*** 31.54** 23.63**
(Middle Tercile) (9.02) (10.52) (7.81) (8.29) (6.10) (5.09) (9.12) (10.28) (8.43)
Class size 24.30* 45.03*** 35.34*** 34.74*** 25.16*** 17.48*** 33.48*** 35.68** 17.89*
(High Tercile) (11.97) (13.52) (7.29) (9.14) (5.89) (5.09) (8.64) (11.35) (7.19)
Class size -26.38* -47.67** -58.87*** -51.10** -63.42*** -19.72* -49.92*
(Missing) (11.73) (18.02) (14.60) (16.55) (13.93) (9.51) (19.83)
Table continues on next page.

207
High GNI/cap, Low Inequality High GNI/cap, Moderate Inequality High GNI/cap, High Inequality
Japan Sweden Australia Italy Hong Kong United States Classroom Resources
PISA Low SES High SES Low SES High SES Low SES High SES Low SES High SES Low SES High SES Low SES High SES
Teacher Certified
(Middle Tercile)
Teacher Certified
(High Tercile)
Teacher Certified 24.48*
(100 percent) (10.76)
Teacher Cert -16.54 -79.71* -39.44** -30.50* 16.67*
(Missing) (33.16) (34.51) (14.14) (16.79) (8.01)
T. Pedagogy Degree
(Middle Tercile)
T. Pedagogy Degree
38.39*
(High Tercile) (18.52)
T. Pedagogy Degree
-15.84* -30.64*
(100 percent) (6.83) (12.58)
T. Pedagogy Degree
(Missing)
Table continues on next page.

208
High GNI/cap, Low Inequality High GNI/cap, Moderate Inequality High GNI/cap, High Inequality
Japan Sweden Australia Italy Hong Kong United States Classroom Resources
PISA Low SES High SES Low SES High SES Low SES High SES Low SES High SES Low SES High SES Low SES High SES
T. Math Degree
(100 percent)
T. Math Degree
(Middle Tercile)
T. Math Degree 25.32**
(High Tercile) (8.39)
T. Math Degree 13.00* -43.44*
(Missing) (5.97) (21.75)
R-Squared 0.26 0.21 0.15 0.15 0.18 0.15 0.22 0.15 0.38 0.31 0.19 0.08
Table continues on next page.

209
Low GNI/cap, Low Inequality Low GNI/cap, Moderate Inequality Low GNI/cap, High Inequality
Hungary Slovak Republic Latvia Russian Federation Tunisia Classroom Resources
PISA Low SES High SES Low SES High SES Low SES High SES Low SES High SES Low SES High SES
Grade 50.51*** 41.83*** 27.06* 34.00*** 35.38*** 77.72*** 102.94***
(10th – 12th) (6.83) (7.82) (10.58) (8.66) (8.23) (9.79) (8.83)
Math time -19.97* -26.70*** 20.30*
(Middle Tercile) (9.93) (8.00) (8.01)
Math time -29.78** 30.49*** 37.05*** -25.04**
(High Tercile) (9.34) (8.22) (8.50) (7.71)
Math time -41.70*** -54.06*** -60.18*** -63.50*** -51.29*** -24.32* -27.79** -20.70**
(Missing) (11.47) (12.58) (8.81) (9.55) (10.84) (11.41) (8.96) (6.66)
Class size -15.00** -16.56*
(Middle Tercile) (5.54) (6.72)
Class size -29.25** -25.78** -21.46**
(High Tercile) (8.90) (8.51) (7.49)
Class size -39.29* -32.77* -50.44* -76.57** -29.69*** -18.36*
(Missing) (18.21) (15.98) (23.81) (23.34) (7.15) (8.39)
Table continues on next page.

210
Low GNI/cap, Low Inequality Low GNI/cap, Moderate Inequality Low GNI/cap, High Inequality
Hungary Slovak Republic Latvia Russian Federation Tunisia Classroom Resources
PISA Low SES High SES Low SES High SES Low SES High SES Low SES High SES Low SES High SES
Teacher Certified 35.39***
(Middle Tercile) (10.08)
Teacher Certified
(High Tercile)
Teacher Certified
(100 percent)
Teacher Cert 43.65***
(Missing) (11.96)
T. Pedagogy Degree
(Middle Tercile)
T. Pedagogy Degree
(High Tercile)
T. Pedagogy Degree
46.08**
(100 percent) (14.48)
T. Pedagogy Degree
(Missing)
Table continues on next page.

211
Low GNI/cap, Low Inequality Low GNI/cap, Moderate Inequality Low GNI/cap, High Inequality
Hungary Slovak Republic Latvia Russian Federation Tunisia Classroom Resources
PISA Low SES High SES Low SES High SES Low SES High SES Low SES High SES Low SES High SES
T. Math Degree 20.15*
(100 percent) (8.30)
T. Math Degree
(Middle Tercile)
T. Math Degree
(High Tercile)
T. Math Degree 45.84***
(Missing) (13.81)
R-Squared 0.20 0.24 0.18 0.21 0.10 0.10 0.13 0.16 0.26 0.36
Notes: Standard errors in parentheses. *** p<0.001, ** p<0.01, * p<0.05
R2 difference between complete model and model with only student characteristics. Source: OECD – PISA 2003.

212
TABLE 34. SUMMARY RESULTS FROM TIMSS 2003 PRODUCTION FUNCTIONS FOR CLASSROOM RESOURCES, BY COUNTRY ECONOMIC GROUPS AND LOW AND HIGH SES QUINTILES (ONLY SIGNIFICANT COEFFICIENTS REPORTED)
High GNI/cap, Low Inequality High GNI/cap, Moderate Inequality High GNI/cap, High Inequality
Japan Sweden Australia Italy Hong Kong United States Classroom Resources
TIMSS Low SES High SES Low SES High SES Low SES High SES Low SES High SES Low SES High SES Low SES High SES
% Alg. + Geo. 42.22* 32.05* 14.75* 39.49***
(Middle tercile) (17.28) (12.73) (6.06) (8.97)
% Alg. + Geo. 21.02* 39.85* 37.08*** 85.65***
(High tercile) (9.78) (18.00) (7.84) (10.22)
% Alg. + Geo. 65.59* 61.09** 36.68* 39.88*
(Missing) (28.75) (21.67) (16.04) (17.64)
Overall Math Time
19.36* -24.68* 16.62**
(Upper 50%) (7.65) (10.94) (5.91)
Class Size 22.71* 32.78** 37.87**
(25-32 students) (9.62) (12.49) (12.96)
Class Size 61.36*** 25.81* 79.21*** 100.19*
(33+ students) (14.71) (13.10) (21.74) (38.95)
Table continues on next page.

213
High GNI/cap, Low Inequality High GNI/cap, Moderate Inequality High GNI/cap, High Inequality
Japan Sweden Australia Italy Hong Kong United States Classroom Resources
TIMSS Low SES High SES Low SES High SES Low SES High SES Low SES High SES Low SES High SES Low SES High SES
Class Size 34.26*** 133.17* 33.35***
(Missing) (9.41) (55.89) (10.00)
T. Math Degree 27.39**
(Required) (9.88)
T. Math Degree -120.43** -139.36*
(Missing) (46.59) (58.65)
T. ISCED 5A
(2nd Degree)
T. ISCED 5A -36.92* -34.86*
(2nd D. Missing) (18.78) (16.53)
R-Squared 0.06 0.09 0.10 0.07 0.15 0.14 0.10 0.12 0.25 0.17 0.08 0.19
Table continues on next page.

214
Low GNI/cap, Low Inequality Low GNI/cap, Moderate Inequality Low GNI/cap, High Inequality
Hungary Slovak Republic Latvia Russian Federation Tunisia Classroom Resources
TIMSS Low SES High SES Low SES High SES Low SES High SES Low SES High SES Low SES High SES
% Alg. + Geo.
(Middle tercile)
% Alg. + Geo.
(High tercile)
% Alg. + Geo.
(Missing)
Overall Math Time
16.99* 14.79*
(Upper 50%) (7.55) (7.44)
Class Size -44.97**
(25-32 students) (16.49)
Class Size 70.38** 30.62** -43.51*
(33+ students) (21.97) (11.77) (17.17)
Class Size 76.66** -49.09* -38.44*
(Missing) (27.61) (22.64) (17.66)
T. Math Degree
(Required)
Table continues on next page.

215
Low GNI/cap, Low Inequality Low GNI/cap, Moderate Inequality Low GNI/cap, High Inequality
Hungary Slovak Republic Latvia Russian Federation Tunisia Classroom Resources
TIMSS Low SES High SES Low SES High SES Low SES High SES Low SES High SES Low SES High SES
T. Math Degree 62.69*** 23.71*
(Missing) (15.27) (10.25)
T. ISCED 5A 28.75** -18.18**
(2nd Degree) (10.20) (6.53)
T. ISCED 5A
(2nd D. Missing)
R-Squared 0.04 0.12 0.04 0.13 0.08 0.06 0.08 0.07 0.04 0.08
Notes: Standard errors in parentheses. ***p<0.001, **p<0.01, *p<0.05, SES missing values mean imputed. R2 difference between complete model and model with only student characteristics.
Source: IEA – TIMSS 2003.

216
TABLE 35. SUMMARY RESULTS FROM PISA 2003 PRODUCTION FUNCTIONS FOR SCHOOL CAPACITY, BY COUNTRY ECONOMIC GROUPS AND LOW AND HIGH SES QUINTILES (ONLY SIGNIFICANT COEFFICIENTS REPORTED)
High GNI/cap, Low Inequality High GNI/cap, Moderate Inequality High GNI/cap, High Inequality
Japan Sweden Australia Italy Hong Kong United States School Capacity PISA
Low SES High SES Low SES High SES Low SES High SES Low SES High SES Low SES High SES Low SES High SES
School Size 30.01** 47.73***
(Middle Tercile) (10.39) (11.45)
School Size 44.31*** 35.30* 74.62*** 52.15***
(High Tercile) (11.20) (16.69) (17.49) (15.37)
School Size
(Missing)
School Resources 26.56**
(Middle tercile) (9.51)
School Resources 12.81* 29.06**
(High Tercile) (6.18) (10.20)
School Resources
(Missing)
Table continues on next page.

217
High GNI/cap, Low Inequality High GNI/cap, Moderate Inequality High GNI/cap, High Inequality
Japan Sweden Australia Italy Hong Kong United States School Capacity PISA
Low SES High SES Low SES High SES Low SES High SES Low SES High SES Low SES High SES Low SES High SES
Population 42.74**
(below 3K) (16.23)
Population 45.08**
(3K -15K) (14.77)
Population 34.59*
(15K – 100K) (13.70)
Population
(100K - 1000K)
R-Squared 0.26 0.21 0.15 0.15 0.18 0.15 0.22 0.15 0.38 0.31 0.19 0.08
Table continues on next page.

218
Low GNI/cap, Low Inequality Low GNI/cap, Moderate Inequality Low GNI/cap, High Inequality
Hungary Slovak Republic Latvia Russian Federation Tunisia School Capacity PISA
Low SES High SES Low SES High SES Low SES High SES Low SES High SES Low SES High SES
School Size 29.24* -29.33*** 33.45**
(Middle Tercile) (11.51) (7.98) (12.34)
School Size 32.78** 25.80*
(High Tercile) (11.06) (11.03)
School Size 72.09** 53.96*
(Missing) (22.08) (25.76)
School Resources
(Middle tercile)
School Resources -19.45* 26.82*
(High Tercile) (8.92) (13.45)
School Resources 51.58*
(Missing) (23.49)
Population -
82.63*** -44.72*
(below 3K) (20.17) (18.41)
Population -48.34** -38.46**
(3K -15K) (16.54) (13.32)
Table continues on next page.

219
Low GNI/cap, Low Inequality Low GNI/cap, Moderate Inequality Low GNI/cap, High Inequality
Hungary Slovak Republic Latvia Russian Federation Tunisia School Capacity
PISA
Low SES High SES Low SES High SES Low SES High SES Low SES High SES Low SES High SES
Population
(15K – 100K)
Population -30.99**
(100K - 1000K) (10.27)
R-Squared 0.20 0.24 0.18 0.21 0.10 0.10 0.13 0.16 0.26 0.36
Notes: Standard errors in parentheses. ***p<0.0001, **p<0.01, *p<0.05. R2 difference between complete model and model with only student characteristics.
Source: OECD – PISA 2003.

220
TABLE 36. SUMMARY RESULTS FROM TIMSS 2003 PRODUCTION FUNCTIONS FOR SCHOOL CAPACITY, BY COUNTRY ECONOMIC GROUPS AND LOW AND HIGH SES QUINTILES (ONLY SIGNIFICANT COEFFICIENTS REPORTED)
High GNI/cap, Low Inequality High GNI/cap, Moderate Inequality High GNI/cap, High Inequality
Japan Sweden Australia Italy Hong Kong United States School Capacity TIMSS
Low SES High SES Low SES High SES Low SES High SES Low SES High SES Low SES High SES Low SES High SES
School Size 0.04*
(Continuous) (0.02)
School Resources -66.15*** 32.98* -64.09*
(Middle level) (11.01) (15.34) (26.53)
School Resources -69.41*** 46.68** 71.78*
(High level) (11.06) (16.43) (33.49)
School Resources 72.87***
(Missing) (19.95)
Population 78.45** 71.96*
(below 3K) (28.41) (32.98)
Population 47.30*
(3K -15K) (18.76)
Table continues on next page.

221
High GNI/cap, Low Inequality High GNI/cap, Moderate Inequality High GNI/cap, High Inequality
Japan Sweden Australia Italy Hong Kong United States School Capacity TIMSS
Low SES High SES Low SES High SES Low SES High SES Low SES High SES Low SES High SES Low SES High SES
Population -24.10*
(15K – 50K) (11.90)
Population
(50K - 100K)
Population 59.99* -24.02*
(100K-500K) (27.74) (10.12)
Population 65.40** -94.00*
(Missing) (24.65) (40.88)
R-Squared 0.06 0.09 0.10 0.07 0.15 0.14 0.10 0.12 0.25 0.17 0.08 0.19
Table continues on next page.

222
Low GNI/cap, Low Inequality Low GNI/cap, Moderate Inequality Low GNI/cap, High Inequality
Hungary Slovak Republic Latvia Russian Federation Tunisia School Capacity
TIMSS
Low SES High SES Low SES High SES Low SES High SES Low SES High SES Low SES High SES
School Size -0.04*
(Continuous) (0.02)
School Resources 21.97*
(Middle level) (10.67)
School Resources
(High level)
School Resources
(Missing)
Population -29.47*
(below 3K) (13.12)
Population -36.46*
(3K -15K) (17.75)
Population
(15K – 50K)
Population
(50K - 100K)
Table continues on next page.

223
Low GNI/cap, Low Inequality Low GNI/cap, Moderate Inequality Low GNI/cap, High Inequality
Hungary Slovak Republic Latvia Russian Federation Tunisia School Capacity
TIMSS
Low SES High SES Low SES High SES Low SES High SES Low SES High SES Low SES High SES
Population 51.07**
(100K-500K) (18.05)
Population 70.20*
(Missing) (30.31)
R-Squared 0.04 0.12 0.04 0.13 0.08 0.06 0.08 0.07 0.04 0.08
Notes: Standard errors in parentheses. ***p<0.001, **p<0.01, *p<0.05, SES missing values imputed. R2 difference between complete model and model with only student characteristics.
Source: IEA – TIMSS 2003.
224
Comparing Production Function Results Between PISA and TIMSS
In many cases in this analysis, results from PISA and TIMSS have confirmed
one another. This section discusses areas where these results converge and diverge for
country level production functions, with a particular focus on the differences in
variance explained (R2) by these models. Analysis of the R2 differences between
models offers information about which types of variables correlate more with
achievement. This approach helps here because of the large number of variables and
countries from which no definitive pattern emerged in the analysis above. However,
R2 measures can have bias issues if the explanatory variables are not random,
requiring caution in the interpretation (Helland, 1987). In this study, the coefficient
analysis above is more important and it is referenced below when comparing the tests,
but the R2 differences do provide some results worthy of consideration.
First, when comparing results between PISA and TIMSS, the differences
between SES quintile coefficients remain fairly close with the exception of Japan,
confirming the accuracy of the majority of the SES quintiles differences. For the
higher income per capita countries, the SES quintile differences appear smaller overall
in TIMSS than in PISA. This could result from different country samples or
differences in the SES measures. The less comprehensive SES measure on TIMSS
might not capture as much variance as that of PISA. In both tests, Hong Kong has very
small differences between SES groups, while the US has very large differences. One
possibility is that the high levels of inequality in Hong Kong might not appear in test
scores because more equitable schooling mediates income inequality. Furthermore,

225
Hong Kong, a financial hub with a relatively small population, has a long right tail of
income distribution. This contrasts with the more institutionalized income inequality
over a much larger population in the United States. Japan also has less test score
disparity for SES in TIMSS. These results could reflect more-equal educational
distribution in Asian countries, a topic discussed in the R2 analysis below.
In terms of classrooms, OTL appears to play a larger role than teacher
preparation in both PISA and TIMSS. In PISA, the basic grade level measure is
significant in many countries since students do better with more years of schooling.
The more sophisticated measure of OTL on TIMSS provides a different story, where
OTL as a function of class time on advanced math topics relates to higher achievement
in high income per capita countries but not in their lower income per capita
counterparts. This finding counters the Heyneman-Loxely theory that schooling
matters more in lower income per capita countries and is supported by the analysis of
model variance.
The R2 analysis reveals some patterns that do not exactly replicate the patterns
of significant coefficients. School resources are less predictive in TIMSS than in
PISA, an interesting finding given that school measures are more precise in TIMSS.
Table 37 shows the smallest and largest R2 differences in PISA. The United States,
Latvia, and the Russian Federation have smaller differences, meaning that student
characteristics, mainly SES, account for the majority of the model variance. In Japan,
Hong Kong, and Tunisia, classrooms and schools appear to have more influence on
PISA scores. The countries within each group have neither income per capita nor

226
income inequality in common. Furthermore, on PISA, student math scores in two of
the three countries with high income inequality relate more to schooling than SES.
This finding contradicts the hypothesis that student characteristics matter more
when income distribution is greater within a country. Some possible explanations
exist. First, in Tunisia, the main predictor of student achievement is grade level. This
does suggest that schooling matters in an unequal country, and also confirms the
Heyneman-Loxely theory that schooling matters more in lower income per capita
countries. Furthermore, as previously discussed, the Tunisian distribution of test
scores favors the high SES instead of being evenly distributed, indicating a clustering
effect in the bottom sixty percent of the population that could compress SES
differentials because so many students might not receive proper educational resources.
TABLE 37. COUNTRIES WITH SMALLEST AND LARGEST R2 DIFFERENCES BETWEEN COEFFICIENTS OF STUDENT CHARACTERISTICS AND CLASSROOM/SCHOOL VECTORS IN PISA
United States Latvia Russian Federation Smaller R2
Differences 0.11 0.08 0.12 Japan Hong Kong Tunisia Larger R2
Differences 0.21 0.31 0.30 Notes: OECD – PISA 2003.
Hong Kong has a small, consistent achievement distribution across SES, and
school factors appear to predict more variance than student characteristics. These
results, considered in conjunction with similar results on PISA in Japan, might show
that Asian countries focus more on schooling and that SES has less of a relationship to
achievement in these two environments. Japan might not vary much in the distribution
of OTL on TIMSS, which could account for a lower model variance for classroom
resources and offers a good example of how R2 analyses can mislead if other
possibilities remain unconsidered. However, without any lower income per capita
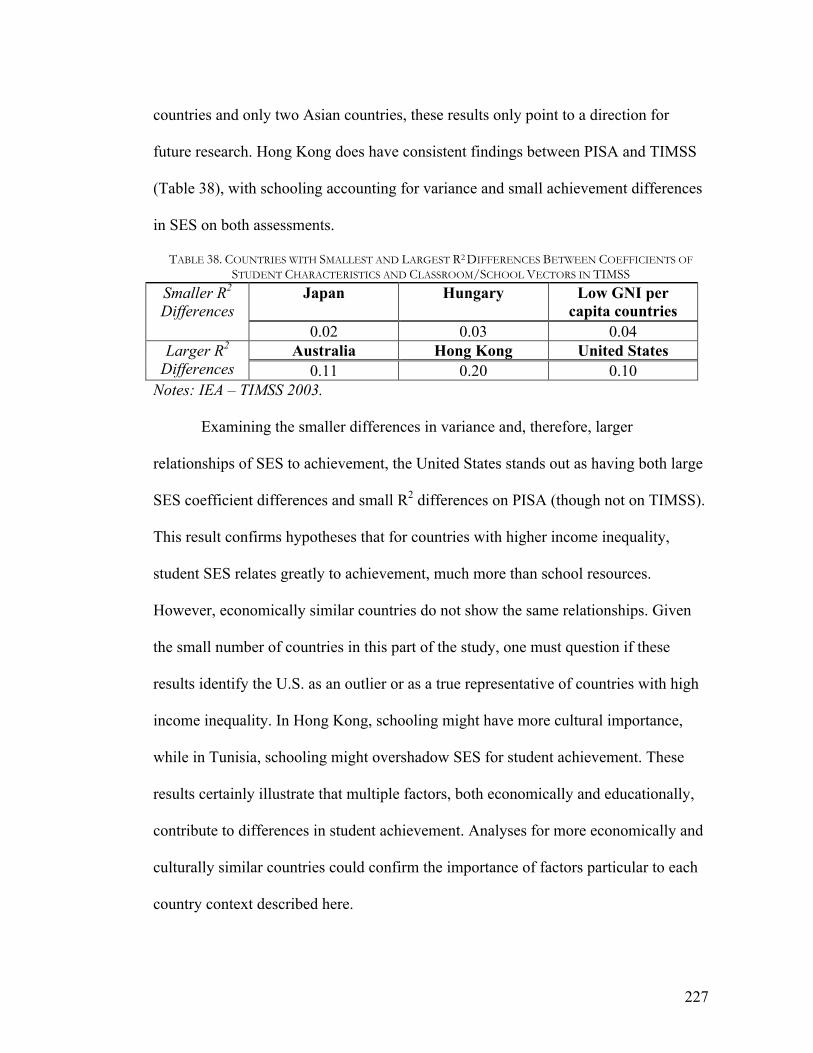
227
countries and only two Asian countries, these results only point to a direction for
future research. Hong Kong does have consistent findings between PISA and TIMSS
(Table 38), with schooling accounting for variance and small achievement differences
in SES on both assessments.
TABLE 38. COUNTRIES WITH SMALLEST AND LARGEST R2 DIFFERENCES BETWEEN COEFFICIENTS OF STUDENT CHARACTERISTICS AND CLASSROOM/SCHOOL VECTORS IN TIMSS
Japan Hungary Low GNI per capita countries
Smaller R2
Differences 0.02 0.03 0.04
Australia Hong Kong United States Larger R2
Differences 0.11 0.20 0.10 Notes: IEA – TIMSS 2003.
Examining the smaller differences in variance and, therefore, larger
relationships of SES to achievement, the United States stands out as having both large
SES coefficient differences and small R2 differences on PISA (though not on TIMSS).
This result confirms hypotheses that for countries with higher income inequality,
student SES relates greatly to achievement, much more than school resources.
However, economically similar countries do not show the same relationships. Given
the small number of countries in this part of the study, one must question if these
results identify the U.S. as an outlier or as a true representative of countries with high
income inequality. In Hong Kong, schooling might have more cultural importance,
while in Tunisia, schooling might overshadow SES for student achievement. These
results certainly illustrate that multiple factors, both economically and educationally,
contribute to differences in student achievement. Analyses for more economically and
culturally similar countries could confirm the importance of factors particular to each
country context described here.

228
To further complicate the issue, the TIMSS results diverge from PISA for five
of the six countries with the smallest and largest model variance differences. The main
finding from comparing R2 differences in the TIMSS comes from Japan and the low
income per capita countries, all of which appear to have small levels of variance
between classroom and school factors and achievement. In Japan’s case, given the
countries high overall scores, a lack of variance across classrooms and schools most
likely means that most students receive good educational resources.
This assumption does not seem viable across the lower income per capita
countries, unless they uniformly provide fewer educational resources. Furthermore,
the finding contradicts the Heyneman-Loxley theory about the important role of
schooling in low income per capita countries. However, the expansion of schooling in
the intervening years between these studies might change the overall importance of
schooling as a distinguishing factor (Baker, et al., 2002). Furthermore, countries in this
study all reside in the upper half of the global GNI per capita distribution, further
substantiating the probable evolution of SES as a main predictor of student
achievement in these emerging economies with potentially increasing income
inequality.
Finally, one interesting point is that differences in model variance, either small
or large, occur more often in countries with lower or higher levels of income
inequality. This finding potentially suggests that these outlying countries have
differing distributions of resources that interact with educational policy environments
in ways that favor either individual SES or school influence. This study does not find
concrete evidence supporting one position. Therefore, substantiating such a claim

229
requires more research that includes more economically different countries and better
data (especially on SES in TIMSS and teachers and schools in PISA). Nevertheless,
the results here do point to a complex but potentially intriguing relationship between
achievement, SES, schools, and income inequality. The conclusion in Chapter 7
summarizes findings across the three chapters and offers further suggestions for more
research to disentangle the complicated interactions between economic conditions,
student SES, and educational factors.

230
Chapter 7. Conclusions, Policy Recommendations, and Directions for Future Research
This study focuses on testing whether increased income inequality at the
country level would mirror increasing disparities between low and high SES students
for educational inputs and outcomes. For the most part, results have disproved this
hypothesis, but in ways that actually have broader policy implications. Proving this
hypothesis would have meant that more-unequal countries need to address the
educational prospects of their lowest SES students, an always difficult political
proposition. However, results here suggest increased income inequality has deleterious
education consequences for students of all SES groups. Even students with strong
family foundations, on average, do not perform as well, do not have as well-prepared
teachers, and do not have as many opportunities to learn as their peers in more-equally
distributed income countries.
Certainly, higher income per capita relates positively to these educational
factors, and, therefore, students in these countries have better educational prospects. In
addition, country-level conditions such as centralization and other unaccounted-for
variables relate to educational factors. The country-level analyses demonstrate that
country-specific factors particularly influence the educational context, although a
selection of more and more-varied countries might reveal stronger patterns between
countries. Despite these important caveats, the relationship between income inequality
and education remains. At a fundamental level, the findings suggest that government
economic polices leading to increased income inequality could negatively impact

231
education systems and the development of future human capital in such countries. This
chapter summarizes the findings leading to this conclusion and offers directions for
future research to further examine the issue.
Relationships between Economic Conditions, Student SES, and Student Achievement Chapter 4 analyzes the relationships between income per capita, income
inequality, student SES, and student achievement for both PISA and TIMSS. Results
for estimating the relationship between income per capita and achievement confirm
previous research. As income per capita increases, student achievement also increases
for lower and higher SES students. Despite this increase, achievement differences
between low and high SES students remain quite large, almost one SD on PISA and
almost three-quarters of an SD on TIMSS. In TIMSS, lower SES students have
increasingly lower achievement scores compared to their higher SES peers as income
per capita increases. TIMSS samples countries with a larger spectrum of economic
differences, a factor possibly contributing to this finding. Also, psychometrically,
TIMSS tests a country’s mathematics curriculum delivery. This finding, therefore,
implies that lower SES students do not have access to or receive the same curricular
opportunities as their higher SES peers in higher income per capita countries, a finding
confirmed further below.
Adding income inequality to the model causes PISA and TIMSS results to
diverge somewhat. Most importantly, however, increasing income inequality relates
negatively to student achievement on both tests even while controlling for income per
capita. On PISA, country-level income inequality interacts with SES in a strange

232
manner that partially negates the SES significance despite evidence that SES strongly
correlates with achievement. Reasons for this finding remain unclear.
In TIMSS, the relationship between income inequality and achievement is
straightforward. Increasing income inequality correlates significantly with lower test
scores in all models. Furthermore, high SES students have increasingly higher scores
than their lower SES peers as income inequality increases. This finding partially
confirms the hypothesis of increasing differences between SES quintiles, but country
income inequality supersedes the relationship of SES to achievement and relates
negatively to achievement for students in all SES quintiles.
These findings suggest that high levels of income inequality in a country offer
few educational benefits. In TIMSS, low SES students could have higher scores either
by attending schools in higher income per capita countries or countries with lower
income inequality. Country economic policies could probably more readily ameliorate
the latter economic situation before the former, although in historical terms, we may
be entering an era in which more political leaders try to correct the increased
inequality of incomes over the past thirty years. However, while this potential solution
addresses income inequality directly, the under-theorized Gini coefficient might
actually serve as a proxy for other country level factors that correlate negatively with
student achievement.
The theory of social capital contains one possible explanation for the
relationships between individual and country inequality. Fukuyama (2002) asserts that
social capital has no agreed-upon definition and defines it as the “shared norms or
values that promote social cooperation, instantiated in actual social relationships” (p.

233
27). Social capital focuses on the network of relationships that an individual accesses
and uses in addition to the material and cultural resources outlined by Bourdieu and
Passeron (1977) and reflected in student SES. Expanding on the individual idea of
social capital, countries also demonstrate, through their level of national investment in
education, the level of value they place on education as social capital for the country.
In education, the country and student levels interact, as this study has shown.
Countries with lower investment in social capital in general (and education in
particular) might implicitly foster lower levels of student performance, either for
certain SES groups or as a whole.
The social capital explanation is nested within a larger theoretical discussion
about why student achievement appears to decrease almost uniformly for different
SES quintiles as income inequality increases. Essentially, the mean achievement levels
decrease as income inequality increases. Different levels of social capital at the
national level serve as a plausible explanation for a state failure to demonstrate the
importance of high quality education in its population and to then facilitate it.
Examining the interaction from the student perspective, social capital theory suggests
a positive feedback loop in which students think they are performing at high levels,
but because of low national mean achievement, their performance suffers in
international comparisons. This achievement “ceiling effect” could work in tandem
with national investment in social capital to discourage higher achievement. The next
section further examines how education operates as a microcosm of national social
capital by discussing the analysis of state provision and student access to critical
educational inputs.

234
Relationships between Economic Conditions, Student SES, and Teacher Preparation Teacher preparation in TIMSS relates positively to income per capita. Students
in wealthier countries and students in more decentralized education systems have
moderately better teachers. Furthermore, higher SES students appear to have higher
numbers of better-prepared teachers in all figures, although the differences between
SES quintiles are not statistically significant. Like the results for student achievement,
teacher preparation correlates negatively with income inequality for all students, even
when accounting for income per capita. These results do not diverge by student SES
but do confirm the overall negative correlation between income inequality and
educational inputs.
Relationships between Economic Conditions, Student SES, and Opportunities to Learn The results for the relationship between opportunities to learn and economic
conditions confirm those from teacher preparation and student achievement. In PISA,
this study uses only grade level as a coarse proxy for OTL by employing a binomial
logit regression for students in 9th grade and below or 10th grade and above. The
findings for lower income per capita countries show, as expected, that high SES
students are more likely to have more schooling. However, the large size of the
differences in the odds-ratios suggests that lower SES students in lower income per
capita countries have significantly fewer opportunities to learn. In PISA, income
inequality interacts strangely with SES, eliminating significance levels for both
variables. This result mirrors the similar pattern with PISA achievement scores and

235
income inequality, further suggesting an anomaly with the PISA country sample
because the phenomenon occurs in multiple cases. The figures for PISA’s OTL
measure do show a negative relationship between OTL and increasing income
inequality significantly and negatively relates to OTL, but only slightly. These results
modestly confirm the relationship of income inequality and educational factors found
in other analyses in the study.
The TIMSS measure of OTL focuses specifically on content taught in math
classes, comprising the percentage of class time spent on algebra or algebra and
geometry. These two subjects are the most advanced math topics for eighth graders
and increasing exposure to these OTL measures correlates with higher student
performance (Schmidt, et al., 2001). In this study, higher SES students have increasing
access to OTL as country income per capita increases. This increase is fairly uniform
and quite large, meaning that higher SES students in higher income per capita
countries receive much more OTL. Lower SES students in both lower and higher
income per capita countries receive less OTL than their higher SES peers and this
difference is especially strong in higher income per capita countries, where high SES
students receive much more OTL.
The correlation between income inequality and OTL is not as strong as that
between income per capita and OTL in TIMSS. Income inequality appears to correlate
with SES is some cases, making the SES coefficients not significant in a manner
similar to some of the PISA results. However, income inequality does negatively
correlate with OTL. Furthermore, the lowest SES students receive increasingly less
OTL as income inequality increases. This point is crucial because it connects the

236
research on student achievement to research on OTL. Chapter 4 shows an increasing
gap in test scores across SES groups in countries with higher income inequality. These
OTL results therefore reveal the corollary of increased differences in the amount of
algebra and geometry offered to students of different social classes in countries with
greater income inequality. While other factors remain important, income inequality in
this case relates negatively both to OTL and student achievement with increasing
disparities across student SES groups.
Educational Comparisons between Economically Different Countries
The individual country production functions test three different types of
relationships in education: student achievement with SES, student achievement with
classroom and school factors, and differences between high and low SES students in
these areas. These analyses involve countries with different levels of income per capita
and income inequality. The first hypothesis is that student characteristics, particularly
SES, matter more in two types of countries: high income per capita countries and
those with higher income inequality. The corresponding second hypothesis is that
school factors matter more in lower income per capita countries, the Heyneman-
Loxely effect, and those countries with lower income inequality. The hypotheses for
low and high SES students are less explicit because both SES and schooling might
matter for both types of students. Instead, the goal of building the models is to identify
similarities and differences in patterns of student achievement for the two different
SES quintiles. Finally, the difference in results between PISA and TIMSS provides the
impetus for suggesting better data collection and future directions for research.

237
Given the larger distributions of income in countries with more income
inequality, family background could have a large relationship with the education
prospects for a student. Results from the United States confirm this hypothesis, but no
discernable pattern emerges across different countries for this relationship. Even
though the U.S. may function as a global outlier in this study, from a domestic policy
perspective, the findings still directly confirm the hypotheses that students’ family
backgrounds correlate heavily with their math achievement in the United States. The
other countries with more income inequality, Hong Kong and Tunisia, have small
student achievement differences between SES quintiles. Both countries have different
contexts that might contribute to possible explanations.
First, Hong Kong’s government published an analysis of the limitations of the
Gini coefficient for accurately capturing the distribution of income (Chuen, 2007). The
report makes three main points: 1) an aging population has contributed to elderly low-
income households; 2) globalization has increased wages for skilled workers in this
Asian financial hub; and 3) the Gini coefficient sometimes does not include post-tax
figures, therefore failing to properly account for Hong Kong’s redistributive taxation
system (Chuen, 2007). The post-tax point made by Hong Kong’s government supports
other discussions in this study about the difficulty of making “apples to apples”
comparisons using income inequality because of the different national taxation and
income redistribution policies. On the other hand, since the government published the
report, it could be self-serving rather than an accurate portrait of Hong Kong’s
situation. Points one and two appear to contribute to inequality in some form, while
point three seems potentially to have more validity. For the purposes of this study,

238
Hong Kong might not represent a truly high income inequality country because it does
redistribute some wealth and invests in its education system as shown in the
significant relationships between schooling and student achievement.
Tunisia has the different issue of access to secondary schools. SES does not
appear to have a prominent role in predicting achievement, but students in higher
grades have significantly better achievement scores on PISA. UNICEF’s (2008)
figures show an increase in net secondary enrollment from the 1980’s, but it plateaus
in this decade just above 60 percent of students. Since PISA tests 15 year-olds in
school, so the test results could contain selection bias in their demonstration of the
increased benefits of OTL for students attending more years of school in Tunisia.
Therefore, number of years of schooling apparently has a larger role than SES in
Tunisia, a finding that might repeat in an examination of other countries with similarly
low income per capita. This might make identifying the role of income inequality
more difficult in the broader set of countries that will most likely participate in future
international assessments.
On the other hand, two countries with low levels of income inequality showed
large achievement disparities between their low and high SES students. Hungary and
the Slovak Republic, along with the United States, have the largest achievement
differences between SES quintiles. Both countries transitioned to market capitalism in
the 1990s, so these differences in achievement might result from increasing disparities
in the provision of education resources. Furthermore, the SES differences might
portend higher levels of income inequality as this generation of students enters the
labor market with their larger variations in preparation through the education system.
239
When examining the differences between SES quintiles, countries with low
income inequality such as Hungary, the Slovak Republic, and Sweden have larger
differences, on par with a high inequality country, the United States. However, these
similar achievement gaps have different meanings for students in these low inequality
countries.. Those countries appear to prioritize equalizing income through government
policy ahead of decreasing the SES achievement gap. However, the repercussions for
low-performing, low SES students are mitigated because they are equally likely to
graduate from university as in the U.S., yet participate in a labor market that
distributes income more equally than in the U.S. Therefore, low SES students face a
much larger income gap in the U.S. labor market than their low SES peers in more
equal income countries, even though these countries have similar SES achievement
gaps.
Production function analyses of the relationships between student achievement,
classroom resources, and school capacity reveal something every educator knows:
there is no “silver bullet” in education. Different elements of each vector relate
significantly to achievement in different countries. Furthermore, in this analysis, these
relationships generally do not correlate with income inequality or income per capita,
with the possible exception of OTL. In TIMSS, OTL significantly relates to
achievement in four of the six high income per capita countries—Sweden, Australia,
Hong Kong, and the United States. However, OTL has no significant relationships
with achievement in low income per capita countries, refuting Heyneman and
Loxely’s theory. Combining this finding with the international comparisons showing
that higher SES students receive more OTL demonstrates the need for better

240
distribution of OTL in higher income per capita countries. This might also be true for
lower income per capita countries that lack the larger amount of variation found in the
higher income per capita countries and do not show relationships in the individual
production functions.
The results of comparing production functions between low and high SES
groups show some differences in the two groups but reveal no major patterns across
countries with different levels of income inequality. OTL and teacher preparation
relate to student achievement more for higher SES students in some countries, but
these countries do not have similar economic conditions. The most important finding
for SES differences occurs in the United States where low SES students have more
than a one-third of an SD higher performance on PISA in smaller communities than in
urban areas while high SES students show no significant differences. This confirms
U.S. research showing the lower achievement of urban low SES students.
This study notes similarities and differences between PISA and TIMSS at
various points. PISA and TIMSS have different results in the amount of variance
explained by student and school factors for every country except Hong Kong. The
uniformity of results showing the importance of schooling in Hong Kong points to two
possible conclusions. On the one hand, Hong Kong might not exemplify high income
inequality countries and indeed might be inaccurately measured as having high levels
of inequality. On the other hand, results from Hong Kong might show that making
education a priority in a high income inequality country is possible and can have
results as its high overall achievement and its small achievement differences between
SES quintiles show. PISA and TIMSS confirm results in this one case.

241
In other situations, results differ between PISA and TIMSS and these
disparities might stem from differences in the data. This study examines teacher
preparation only in TIMSS because PISA lacks sufficient data for such an analysis.
Furthermore, PISA only includes teacher information aggregated at the principal level,
impeding true classroom level analyses. But then the SES variable for TIMSS is not as
complete as that in PISA. These differences demonstrate that both datasets have
diverse strengths and weaknesses with each having areas of data collection that need
improvement. In addition to these observations, the next section offers more complete
suggestions for future research.
Suggestions for Future Research
This section proposes two avenues for future research: one building on this
study by using the same data, and another, broader in scope, that would employ other
data to address questions that remain after this study. In this study, the U.S. follows
the predicted hypotheses closely but also appears as a global outlier. Therefore, the
questions regarding the relationship between income inequality and education might
exist in more countries like the U.S., or the U.S. might have features making it distinct
from all other countries. Using the 2003 PISA and TIMSS data, one research
possibility would include combining the countries into larger groups with more or less
income inequality (disregarding their participation in both PISA and TIMSS) and
estimating production functions for each of these larger groups even though the
sample size might be small. In years since 2003, more countries have participated in

242
TIMSS and PISA testing, a benefit that might enlarge the sample size. Furthermore,
these countries might have economic characteristics either not studied here or not
considered in depth in this study, such as low levels of income per capita and high
income inequality like Tunisia.
As discussed above, income inequality most likely serves as a proxy for
multiple national factors potentially falling under the umbrella of national social
capital. Therefore, in addition to more countries, the analyses might include other
measures of dispersion at the national level. Including other measures of dispersion
might better illustrate the mechanisms undergirding the negative correlation between
income inequality and achievement. Potential important measures include the percent
expenditure of GDP per capita on education and other measures of government
distribution of expenditures. OTL is another variable this study shows to be important.
Including it as a predictor in the international analysis alongside country level
economic conditions would offer further information about how countries allocate this
particular educational resource.
From a methodological perspective, some options might prove useful for better
discerning the relationships between country economic conditions, student SES, and
factors of educational quality. First, the multiple levels in this study lend themselves to
analysis using hierarchical linear modeling (HLM). While not used in this study for
reasons previously noted, comparing the results of an HLM analysis to the production
function results would most likely strengthen any conclusions and might yield
different results and findings.

243
Next, a comparison of the different levels of school resources provided for low
and high SES students would provide more specific information about educational
contexts for these students. For the country level production functions, the classroom
and school resource variables show some interesting relationships within countries
that this study did not analyze in detail. The levels of resources provision and their
distribution offer a window into different government policies on education. First,
univariate and bivariate analyses could show differences in the dispersion of resources
within countries. Then, between countries, including more variables in the
international analysis might allow countries with little internal variation but overall
low or high distribution to influence the relationship between income inequality and
achievement. This analysis might simply involve the inclusion of the resource
variables at the national level or could become a larger project of estimating
production functions in an international analysis. Other data in addition to PISA and
TIMSS data might also augment such an analysis, especially government per capita
expenditure on education.
Further research could also employ more methods to differentiate between the
SES quintiles in student performance. In plotting the SES-Gini interaction slopes, this
study assumes that these slopes are linear when they are likely curved. One possible
solution for this issue is the use of linear splines to segment the slopes for every five
or 10 points of the Gini. This approach would possibly reduce the influence of
outlying countries with higher Gini coefficients on the overall slope. Possible
variations in slopes might indicate bands of countries in which income inequality
plays a larger role for student achievement. For instance, the relationship between Gini
244
and achievement might be similar for SES quintiles or smaller for lower income
inequality countries, then larger for larger income inequality countries.
Finally, the process of conceptualizing and completing this study has
uncovered the difficulty of correlating income inequality and educational outcomes.
This goal also is only an intermediary step towards the “gold standard” of
understanding causal links between the two environments. Although some potential
natural experiments exist, linking two different sectors of a national picture causally
likely remains impossible. For instance, within the U.S., ex-President Bush’s tax cuts
in 2001 represent a policy shift that has exacerbated income inequality (Kamin &
Shapiro, 2004). Therefore, tracking education data before and after this regressive
redistributive policy might more concretely reveal the relationship between income
inequality and education. The issue remains, however, that tax policy and educational
outcomes exist in different spheres with a variety of intervening variables; making a
causal link, while desirable, does not appear possible. Nevertheless, a trend is might be
apparent in the U.S. since the U.S. has shown decreasing average scores on PISA
across the last three testing administrations, a time following these tax cuts and
increased income disparities. However, the relationship of this achievement trend to
income inequality remains unknown.
Internationally, the fall of communism represents a shift in policy for ex-soviet
states. This study reveals interesting findings about some of these countries,
particularly the surprisingly high differences in student achievement between SES
quintiles in two low-income inequality countries, Hungary and the Slovak Republic.
Further research here and in seemingly similar situations (if they exist) might aid

245
research on an international level. Since education, however, is a long-term process for
students,, economic policy shifts now might not manifest themselves in education
systems until a new generation of students participates over an unknown length of
time. Despite these challenges, however, this study shows that considering the role of
income inequality in education is important given current economic contexts, and it
correlates negatively with multiple aspects of educational quality. Surprisingly, this
negative correlation occurs for low and high SES students alike, a finding that should
make governments rethink their approaches to income distribution. Finally,
governments need to help both high and low SES students by offering them better
teachers and opportunities to learn to students, thereby increasing their levels of
achievement and better preparing for their participation in future society.

246
Appendices

247
Appendix 1: Student Achievement International Comparison Tables for PISA and TIMSS TABLE 39. ESTIMATED OLS COEFFICIENTS OF PISA 2003 MATH ACHIEVEMENT SCORES ON SOCIO-ECONOMIC STATUS, SES QUINTILES, GNI PER CAPITA,
AND COUNTRY FIXED EFFECTS Selected Independent Variables
Model 1: SES
Continuous
Model 2: SES
Quintiles
Model 3: SES Continuous
& GNI
Model 4: SES Quintiles
& GNI
Model 5: SES Continuous &
Country Dummies
Model 6: SES Quintiles &
Country Dummies
SES 46.30*** 40.69*** 37.89*** (13.27) (7.17) (1.69) Low SES -47.73*** -46.76*** -45.92*** (2.80) (5.76) (6.79) Mid-low SES -17.87*** -17.52*** -17.50*** (2.68) (1.98) (1.46) Mid-high SES 20.04*** 19.75*** 19.60*** (1.60) (1.39) (1.77) High SES 55.11*** 54.21*** 54.41*** (9.58) (7.37) (6.78) GNI 03 1.49*** 2.45* (0.37) (1.00) Country Fixed No No No No Yes Yes
Effects Constant 493.50*** 484.14*** 464.80*** 438.48*** 472.69*** 480.95*** (37.47) (57.44) (40.54) (63.51) (2.37) (3.14) Observations 2271772 271772 271772 271772 271772 271772 R-squared 0.22 0.11 0.25 0.20 0.36 0.35 Notes: Standard errors in parentheses. *** p<0.001, ** p<0.01, * p<0.05 Middle SES quintile and centralized countries serve as reference categories. GNI per capita measured in thousands of dollars. Source: OECD – PISA 2003.

248
TABLE 40. ESTIMATED OLS COEFFICIENTS OF PISA 2003 MATH ACHIEVEMENT SCORES ON SOCIO-ECONOMIC STATUS, SES QUINTILES, GNI PER CAPITA, GINI COEFFICIENTS, AND COUNTRY FIXED EFFECTS
Selected Independent Variables
Model 1: SES
Continuous
Model 2: SES
Quintiles
Model 3: SES Continuous
& Gini
Model 4: SES Quintiles
& Gini
Model 5: SES Continuous &
Country Dummies
Model 6: SES Quintiles &
Country Dummies
SES 46.30*** 38.40*** 37.89**** (13.27) (3.64) (1.69) Low SES 47.73*** -46.54*** -45.92* (2.80) (7.27) (6.79) Mid-low SES 17.87*** -17.63*** -17.50*** (2.68) (1.53) (1.46) Mid-high SES 20.04*** 19.72*** 19.60*** (1.60) (1.42) (1.77) High SES 55.11*** 54.34*** 54.41*** (9.58) (8.54) (6.78) GNI 03 1.21*** 1.79 (0.20) (1.08) Gini -1.34 -2.64 (2.65) (1.46) Country Fixed No No No No Yes Yes
Effects Constant 493.50*** 484.14*** 515.22*** 540.60*** 472.69*** 480.95*** (37.47) (57.44) (70.20) (8.48) (2.37) (3.14) Observations 271772 271772 271772 21772 271772 271772 R-squared 0.22 0.21 0.25 0.23 0.36 0.35 Notes: Standard errors in parentheses. *** p<0.001, ** p<0.01, * p<0.05
Middle SES quintile and centralized countries serve as reference categories. Source: OECD – PISA 2003.

249
TABLE 41. ESTIMATED OLS COEFFICIENTS OF TIMSS 2003 MATH ACHIEVEMENT SCORES ON SOCIO-ECONOMIC STATUS, SES QUINTILES, GNI PER CAPITA, AND COUNTRY FIXED EFFECTS
Selected Independent Variables
Model 1: SES
Continuous
Model 2: SES
Quintiles
Model 3: SES Continuous
& GNI
Model 4: SES Quintiles
& GNI
Model 5: SES Continuous &
Country Dummies
Model 6: SES Quintiles &
Country Dummies
SES 58.47*** 48.23*** 34.37*** (0.90) (0.85) (0.68) Low SES -32.92*** -31.32*** -32.51*** (1.22) (1.15) (0.97) Mid-low SES -13.12*** -12.51*** -12.81*** (1.31) (1.30) (1.03) Mid-high SES 21.20*** 19.60*** 19.23*** (1.55) (1.45) (1.24) High SES 52.32*** 49.31*** 49.51*** (2.35) (2.22) (1.79) GNI 03 1.73*** 3.05*** (0.07) (0.07) Country Fixed No No No No Yes Yes
Effects Constant 464.71*** 453.16*** 440.38*** 413.08*** 450.05 454.51 (0.75) (1.51) (1.22) (1.81) (327.47) (338.16) Observations 228706 228706 228706 228706 228706 228706 R-squared 0.28 0.07 0.33 0.22 0.53 0.53 Notes: Standard errors in parentheses. *** p<0.001, ** p<0.01, * p<0.05 Middle SES quintile and centralized countries serve as reference categories. SES missing values mean imputed. GNI per capita measured in thousands of dollars. Source: IEA – TIMSS 2003.

250
TABLE 42. OLS REGRESSION OF TIMSS 2003 MATH ACHIEVEMENT SCORES ON SOCIO-ECONOMIC STATUS, SES QUINTILES, GNI PER CAPITA, GINI COEFFICIENTS, AND COUNTRY FIXED EFFECTS
Selected Independent Variables
Model 1: SES
Continuous
Model 2: SES
Quintiles
Model 3: SES Continuous
& Gini
Model 4: SES Quintiles
& Gini
Model 5: SES Continuous &
Country Dummies
Model 6: SES Quintiles &
Country Dummies
SES 58.47*** 41.83*** 34.37*** (0.90) (0.82) (0.68) Low SES 32.92*** -32.42*** -32.51*** (1.22) (1.01) (0.97) Mid-low SES 13.12*** -12.96*** -12.81*** (1.31) (1.16) (1.03) Mid-high SES 21.20*** 20.33*** 19.23*** (1.55) (1.30) (1.24) High SES 52.32*** 50.70*** 49.51*** (2.35) (1.98) (1.79) GNI 03 1.60*** 2.65*** (0.07) (0.07) Gini -4.28*** -5.35*** (0.11) (0.12) Country Fixed No No No No Yes Yes
Effects Constant 464.71*** 453.16*** 602.07*** 619.56*** 450.05 454.51 (0.75) (1.51) (4.56) (5.03) (327.47) (338.16) Observations 228706 228706 228706 228706 228706 228706 R-squared 0.28 0.07 0.40 0.35 0.53 0.53 Notes: Standard errors in parentheses. *** p<0.001, ** p<0.01, * p<0.05
Middle SES quintile and centralized countries serve as reference categories. SES missing values mean imputed. Source: IEA – TIMSS 2003.

251
Appendix 2: Teacher Preparation International Comparison Tables for TIMSS TABLE 43. ESTIMATED OLS COEFFICIENTS OF TIMSS 2003 TEACHER PREPARATION INDEX ON SOCIO-ECONOMIC STATUS, SES QUINTILES, GNI PER CAPITA,
AND COUNTRY FIXED EFFECTS Selected Independent Variables
Model 1: SES
Continuous
Model 2: SES
Quintiles
Model 3: SES Continuous
& GNI
Model 4: SES Quintiles
& GNI
Model 5: SES Continuous &
Country Dummies
Model 6: SES Quintiles &
Country Dummies
SES 0.18*** 0.13*** 0.03*** (0.01) (0.01) (0.01) Low SES -0.03* -0.02 -0.03** (0.01) (0.01) (0.01) Mid-low SES -0.02 -0.01 -0.02 (0.01) (0.01) (0.01) Mid-high SES 0.01 0.01 0.00 (0.01) (0.01) (0.01) High SES 0.07*** 0.05** 0.04* (0.02) (0.02) (0.02) GNI 03 0.01*** 0.01*** 0.00 0.00 Country Fixed No No No No Yes Yes
Effects Constant 5.29*** 5.26*** 5.16*** 5.09*** 4.84** 4.84** (0.01) (0.02) (0.02) (0.02) (1.52) (1.57) Observations 165331 165331 165331 165331 165331 165331 R-squared 0.07 0.00 0.10 0.08 0.31 0.31 Notes: Standard errors in parentheses. *** p<0.001, ** p<0.01, * p<0.05
Middle SES quintile and centralized countries serve as reference categories. SES missing values mean imputed. GNI per capita measured in thousands of dollars. Source: IEA – TIMSS 2003.

252
TABLE 44. ESTIMATED OLS COEFFICIENTS OF TIMSS 2003 TEACHER PREPARATION INDEX (ISCED ONLY) ON SOCIO-ECONOMIC STATUS, SES QUINTILES, GNI PER CAPITA, AND COUNTRY FIXED EFFECTS
Selected Independent Variables
Model 1: SES
Continuous
Model 2: SES
Quintiles
Model 3: SES Continuous
& GNI
Model 4: SES Quintiles
& GNI
Model 5: SES Continuous &
Country Dummies
Model 6: SES Quintiles &
Country Dummies
SES 0.29*** 0.20*** 0.03*** (0.01) (0.01) (0.01) Low SES -0.02 -0.01 -0.03* (0.02) (0.02) (0.01) Mid-low SES -0.01 0.00 -0.01 (0.01) (0.01) (0.01) Mid-high SES 0.01 0.00 0.01 (0.01) (0.01) (0.01) High SES 0.06** 0.04 0.05** (0.02) (0.02) (0.02) GNI 03 0.01*** 0.02*** (0.00) (0.00) Country Fixed No No No No Yes Yes
Effects Constant 4.96*** 4.91*** 4.76*** 4.65*** 4.87*** 4.88*** (0.01) (0.02) (0.02) (0.03) (1.31) (1.32) Observations 208461 208461 208461 208461 208461 208461 R-squared 0.11 0.00 0.16 0.12 0.52 0.52 Notes: Standard errors in parentheses. *** p<0.001, ** p<0.01, * p<0.05
Middle SES quintile and centralized countries serve as reference categories. SES missing values mean imputed. GNI per capita measured in thousands of dollars. Source: IEA – TIMSS 2003.

253
TABLE 45. ESTIMATED OLS COEFFICIENTS OF TIMSS 2003 TEACHER PREPARATION INDEX ON SOCIO-ECONOMIC STATUS, SES QUINTILES, GNI PER CAPITA, GINI COEFFICIENTS, AND COUNTRY FIXED EFFECTS
Selected Independent Variables
Model 1: SES
Continuous
Model 2: SES
Quintiles
Model 3: SES Continuous
& Gini
Model 4: SES Quintiles
& Gini
Model 5: SES Continuous &
Country Dummies
Model 6: SES Quintiles &
Country Dummies SES 0.18*** 0.13*** 0.03*** (0.01) (0.01) (0.01) Low SES -0.03* -0.02 -0.03** (0.01) (0.01) (0.01) Mid-low SES -0.02 -0.01 -0.02 (0.01) (0.01) (0.01) Mid-high SES 0.01 0.01 0.00 (0.01) (0.01) (0.01) High SES 0.07*** 0.05** 0.04* (0.02) (0.02) (0.02) GNI 03 0.01*** 0.01*** (0.00) (0.00) Gini 0.00* 0.00* (0.00) (0.00) Country Fixed No No No No Yes Yes
Effects Constant 5.29*** 5.26*** 5.04*** 5.09*** 4.84** 4.84** (0.01) (0.02) (0.07) (0.06) (1.52) (1.57) Observations 165331 165331 165331 165331 165331 165331 R-squared 0.07 0.00 0.10 0.08 0.31 0.31 Notes: Standard errors in parentheses. *** p<0.001, ** p<0.01, * p<0.05
Middle SES quintile and centralized countries serve as reference categories. SES missing values mean imputed. Source: IEA – TIMSS 2003.

254
TABLE 46. ESTIMATED OLS COEFFICIENTS OF TIMSS 2003 TEACHER PREPARATION INDEX (ISCED ONLY) ON SOCIO-ECONOMIC STATUS, SES QUINTILES, GNI PER CAPITA, GINI COEFFICIENTS, AND COUNTRY FIXED EFFECTS
Selected Independent Variables
Model 1: SES
Continuous
Model 2: SES
Quintiles
Model 3: SES Continuous
& Gini
Model 4: SES Quintiles
& Gini
Model 5: SES Continuous &
Country Dummies
Model 6: SES Quintiles &
Country Dummies SES 0.29*** 0.18*** 0.03*** (0.01) (0.01) (0.01) Low SES -0.02 -0.01 -0.03* (0.02) (0.02) (0.01) Mid-low SES -0.01 0.00 -0.01 (0.01) (0.01) (0.01) Mid-high SES 0.01 0.00 0.01 (0.01) (0.01) (0.01) High SES 0.06** 0.04* 0.05** (0.02) (0.02) (0.02) GNI 03 0.01*** 0.02*** (0.00) (0.00) Gini -0.01*** -0.02*** (0.00) (0.00) Country Fixed No No No No Yes Yes
Effects Constant 4.96*** 4.91*** 5.19*** 5.26*** 4.87*** 4.88*** (0.01) (0.02) (0.06) (0.06) (1.31) (1.32) Observations 208461 208461 208461 208461 208461 208461 R-squared 0.11 0.00 0.17 0.13 0.52 0.52 Notes: Standard errors in parentheses. *** p<0.001, ** p<0.01, * p<0.05
Middle SES quintile and centralized countries serve as reference categories. SES missing values mean imputed. Source: IEA – TIMSS 2003.

255
Appendix 3: Opportunities to Learn International Comparison Tables for PISA and TIMSS TABLE 47. LOGIT REGRESSION PROBABILITIES OF HIGHER PISA GRADE LEVELS FOR SOCIO-ECONOMIC STATUS, SES QUINTILES, GNI PER CAPITA, AND
COUNTRY FIXED EFFECTS Selected Independent Variables
Model 1: SES
Continuous
Model 2: SES
Quintiles
Model 3: SES Continuous
& GNI
Model 4: SES Quintiles
& GNI
Model 5: SES Continuous &
Country Dummies
Model 6: SES Quintiles &
Country Dummies
SES 1.5 1.59*** 1.56*** (0.37) (0.06) (0.04) Low SES 0.63* 0.63*** 0.57*** (0.12) (0.08) (0.06) Mid-low SES 0.85 0.85 0.83* (0.14) (0.08) (0.07) Mid-high SES 1.22 1.22 1.27 (0.15) (0.15) (0.19) High SES 1.72*** 1.73*** 1.91*** (0.04) (0.07) (0.09) GNI 03 0.99 1.00 (0.05) (0.06) Country Fixed No No No No Yes Yes
Effects Constant 1.24 1.08 1.64 1.15 1.89*** 2.09*** (0.18) (0.09) (1.25) (0.93) (0.14) (0.22) Observations 194902 194902 194902 194902 194902 194902 Notes: Standard errors in parentheses. *** p<0.001, ** p<0.01, * p<0.05 Middle SES quintile and centralized countries serve as reference categories. GNI per capita measured in thousands of dollars. Source: OECD – PISA 2003.

256
TABLE 48. LOGIT REGRESSION PROBABILITIES OF HIGHER PISA GRADE LEVELS FOR SOCIO-ECONOMIC STATUS, SES QUINTILES, GNI PER CAPITA, GINI COEFFICIENTS, AND COUNTRY FIXED EFFECTS
Selected Independent Variables
Model 1: SES
Continuous
Model 2: SES
Quintiles
Model 3: SES Continuous
& Gini
Model 4: SES Quintiles
& Gini
Model 5: SES Continuous &
Country Dummies
Model 6: SES Quintiles &
Country Dummies
SES 1.50 1.57** 1.59*** (0.37) (0.05) (0.04) Low SES 0.63** 0.63*** 0.57*** (0.09) (0.08) (0.06) Mid-low SES 0.85 0.85 0.83* (0.09) (0.09) (0.07) Mid-high SES 1.22 1.22 1.27 (0.15) (0.14) (0.19) High SES 1.72*** 1.73*** 1.91*** (0.07) (0.09) (0.09) GNI 03 0.98 0.99 (0.05) (0.06) Gini 0.99 0.98 (0.04) (0.03) Country Fixed No No No No Yes Yes
Effects Constant 1.24 1.08 1.99 2.50 1.89*** 2.09*** (0.18) (0.08) (1.90) (1.26) (0.14) (0.22) Observations 194902 194902 194902 194902 194902 194902 Notes: Standard errors in parentheses. *** p<0.001, ** p<0.01, * p<0.05 Middle SES quintile and centralized countries serve as reference categories. Source: OECD – PISA 2003.

257
TABLE 49. ESTIMATED OLS COEFFICIENTS OF TIMSS 2003 OPPORTUNITIES TO LEARN (ALGEBRA) ON SOCIO-ECONOMIC STATUS, SES QUINTILES, GNI PER CAPITA, AND COUNTRY FIXED EFFECTS
Selected Independent Variables
Model 1: SES
Continuous
Model 2: SES
Quintiles
Model 3: SES Continuous
& GNI
Model 4: SES Quintiles
& GNI
Model 5: SES Continuous &
Country Dummies
Model 6: SES Quintiles &
Country Dummies
SES 4.70*** 4.10*** 1.69*** (0.26) (0.24) (0.19) Low SES -1.45*** -1.30*** -1.47*** (0.30) (0.31) (0.25) Mid-low SES -0.56* -0.51 -0.54** (0.28) (0.27) (0.19) Mid-high SES 1.56*** 1.43*** 0.99*** (0.30) (0.29) (0.24) High SES 4.00*** 3.77*** 2.86*** (0.65) 0.10*** (0.65) (0.44) GNI 03 (0.03) 0.22*** (0.03) Country Fixed No No No No Yes Yes
Effects Constant 31.91*** 30.60*** 30.52*** 27.90*** 25.61*** 25.60*** (0.34) (0.34) (0.41) (0.42) (4.95) (5.44) Observations 195371 195371 185371 195371 195371 195371 R-squared 0.08 0.09 0.09 0.05 0.36 0.36 Notes: Standard errors in parentheses. *** p<0.001, ** p<0.01, * p<0.05
Middle SES quintile and centralized countries serve as reference categories. SES missing values mean imputed. GNI per capita measured in thousands of dollars. Source: IEA – TIMSS 2003.

258
TABLE 50. ESTIMATED OLS COEFFICIENTS OF TIMSS 2003 OPPORTUNITIES TO LEARN (ALGEBRA) ON SOCIO-ECONOMIC STATUS, SES QUINTILES, GNI PER CAPITA, GINI COEFFICIENTS, AND COUNTRY FIXED EFFECTS
Selected Independent Variables
Model 1: SES
Continuous
Model 2: SES
Quintiles
Model 3: SES Continuous
& Gini
Model 4: SES Quintiles
& Gini
Model 5: SES Continuous &
Country Dummies
Model 6: SES Quintiles &
Country Dummies SES 4.70*** 4.11*** 1.69*** (0.26) (0.24) (0.19) Low SES -1.45*** -1.32*** -1.47*** (0.30) (0.31) (0.25) Mid-low SES -0.56* -0.52 -0.54** (0.28) (0.27) (0.19) Mid-high SES 1.56*** 1.44*** 0.99*** (0.30) (0.29) (0.24) High SES 4.00*** 3.79*** 2.86*** (0.65) (0.64) (0.44) GNI 03 0.10*** 0.21*** (0.03) (0.03) Gini 0.01 -0.09* (0.03) (0.04) Country Fixed No No No No Yes Yes
Effects Constant 31.91*** 30.60*** 30.14*** 31.41*** 25.61*** 25.60*** (0.34) (0.34) (1.41) (1.53) (4.95) (5.44) Observations 195371 195371 195371 195371 195371 195371 R-squared 0.08 0.01 0.09 0.05 0.36 0.36 Notes: Standard errors in parentheses. *** p<0.001, ** p<0.01, * p<0.05
Middle SES quintile and centralized countries serve as reference categories. SES missing values mean imputed. Source: IEA – TIMSS 2003.

259
TABLE 51. ESTIMATED OLS COEFFICIENTS OF TIMSS 2003 OPPORTUNITIES TO LEARN (ALGEBRA AND GEOMETRY) ON SOCIO-ECONOMIC STATUS, SES QUINTILES, GNI PER CAPITA, AND COUNTRY FIXED EFFECTS
Selected Independent Variables
Model 1: SES
Continuous
Model 2: SES
Quintiles
Model 3: SES Continuous
& GNI
Model 4: SES Quintiles
& GNI
Model 5: SES Continuous &
Country Dummies
Model 6: SES Quintiles &
Country Dummies
SES 5.23*** 5.67*** 1.74*** (0.28) (0.32) (0.17) Low SES -1.03** -0.97** -1.41*** (0.37) (0.37) (0.26) Mid-low SES -0.40 -0.38 -0.45* (0.31) (0.31) (0.18) Mid-high SES 1.61*** 1.56*** 1.01*** (0.33) (0.33) (0.22) High SES 4.18*** 4.09*** 3.01*** (0.72) (0.73) (0.38) GNI 03 -0.08* 0.08** (0.03) (0.03) Country Fixed No No No No Yes Yes
Effects Constant 56.00*** 54.45*** 57.01*** 53.42*** 52.43* 52.37* (0.38) (0.41) (0.54) (0.50) (23.26) (22.69) Observations 195322 195322 195322 195322 195322 195322 R-squared 0.09 0.01 0.09 0.01 0.43 0.43 Notes: Standard errors in parentheses. *** p<0.001, ** p<0.01, * p<0.05
Middle SES quintile and centralized countries serve as reference categories. SES missing values mean imputed. GNI per capita measured in thousands of dollars. Source: IEA – TIMSS 2003.

260
TABLE 52. ESTIMATED OLS COEFFICIENTS OF TIMSS 2003 OPPORTUNITIES TO LEARN (ALGEBRA AND GEOMETRY) ON SOCIO-ECONOMIC STATUS, SES QUINTILES, GNI PER CAPITA, GINI COEFFICIENTS, AND COUNTRY FIXED EFFECTS
Selected Independent Variables
Model 1: SES
Continuous
Model 2: SES
Quintiles
Model 3: SES Continuous
& Gini
Model 4: SES Quintiles
& Gini
Model 5: SES Continuous &
Country Dummies
Model 6: SES Quintiles &
Country Dummies SES 5.23*** 4.81*** 1.74*** (0.28) (0.30) (0.17) Low SES -1.03** -1.17*** -1.41*** (0.37) (0.35) (0.26) Mid-low SES -0.40 -0.46 -0.45* (0.31) (0.29) (0.18) Mid-high SES 1.61*** 1.68*** 1.01*** (0.33) (0.29) (0.22) High SES 4.18*** 4.27*** 3.01*** (0.72) (0.69) (0.38) GNI 03 -0.09** 0.03 (0.03) (0.03) Gini -0.59*** -0.71*** (0.04) (0.04) Country Fixed No No No No Yes Yes
Effects Constant 56.00*** 54.45*** 79.26*** 80.64*** 52.43* 52.37* (0.38) (0.41) (1.77) (1.91) (23.26) (22.69) Observations 195322 195322 195322 195322 195322 195322 R-squared 0.09 0.01 0.14 0.10 0.43 0.43 Notes: Standard errors in parentheses. *** p<0.001, ** p<0.01, * p<0.05
Middle SES quintile and centralized countries serve as reference categories. SES missing values mean imputed. Source: IEA – TIMSS 2003.
261
Appendix 4: Production Function Results for High GNI Per Capita Countries Participating in Both PISA AND TIMSS
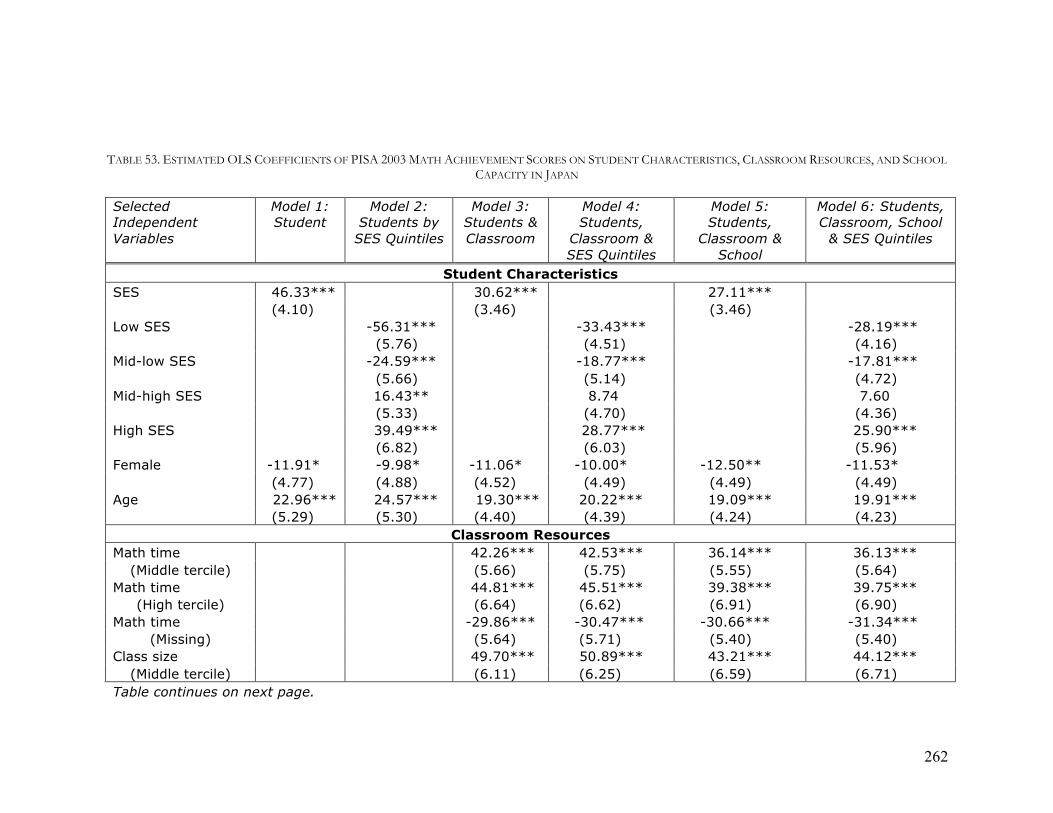
262
TABLE 53. ESTIMATED OLS COEFFICIENTS OF PISA 2003 MATH ACHIEVEMENT SCORES ON STUDENT CHARACTERISTICS, CLASSROOM RESOURCES, AND SCHOOL CAPACITY IN JAPAN
Selected Independent Variables
Model 1: Student
Model 2: Students by
SES Quintiles
Model 3: Students & Classroom
Model 4: Students,
Classroom & SES Quintiles
Model 5: Students,
Classroom & School
Model 6: Students, Classroom, School
& SES Quintiles
Student Characteristics SES 46.33*** 30.62*** 27.11*** (4.10) (3.46) (3.46) Low SES -56.31*** -33.43*** -28.19*** (5.76) (4.51) (4.16) Mid-low SES -24.59*** -18.77*** -17.81*** (5.66) (5.14) (4.72) Mid-high SES 16.43** 8.74 7.60 (5.33) (4.70) (4.36) High SES 39.49*** 28.77*** 25.90*** (6.82) (6.03) (5.96) Female -11.91* -9.98* -11.06* -10.00* -12.50** -11.53*
(4.77) (4.88) (4.52) (4.49) (4.49) (4.49) Age 22.96*** 24.57*** 19.30*** 20.22*** 19.09*** 19.91***
(5.29) (5.30) (4.40) (4.39) (4.24) (4.23) Classroom Resources
Math time 42.26*** 42.53*** 36.14*** 36.13*** (Middle tercile) (5.66) (5.75) (5.55) (5.64)
Math time 44.81*** 45.51*** 39.38*** 39.75*** (High tercile) (6.64) (6.62) (6.91) (6.90)
Math time -29.86*** -30.47*** -30.66*** -31.34*** (Missing) (5.64) (5.71) (5.40) (5.40)
Class size 49.70*** 50.89*** 43.21*** 44.12*** (Middle tercile) (6.11) (6.25) (6.59) (6.71)
Table continues on next page.
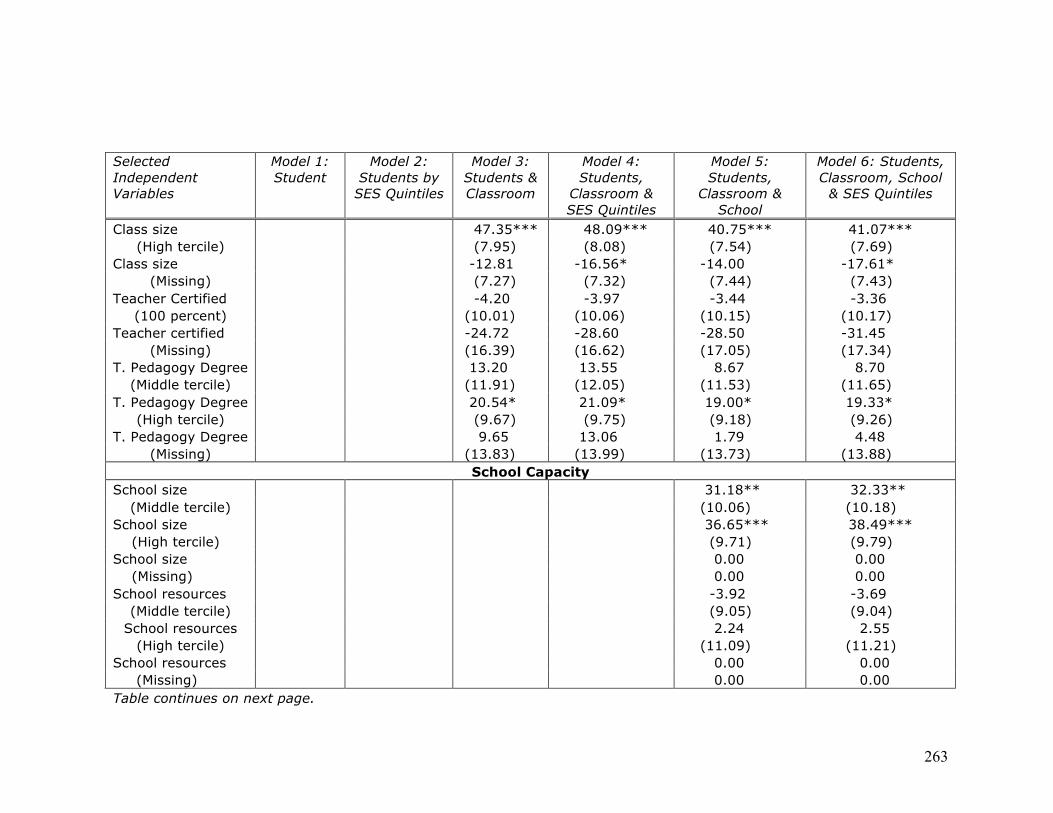
263
Selected Independent Variables
Model 1: Student
Model 2: Students by
SES Quintiles
Model 3: Students & Classroom
Model 4: Students,
Classroom & SES Quintiles
Model 5: Students,
Classroom & School
Model 6: Students, Classroom, School
& SES Quintiles
Class size 47.35*** 48.09*** 40.75*** 41.07*** (High tercile) (7.95) (8.08) (7.54) (7.69)
Class size -12.81 -16.56* -14.00 -17.61* (Missing) (7.27) (7.32) (7.44) (7.43)
Teacher Certified -4.20 -3.97 -3.44 -3.36 (100 percent) (10.01) (10.06) (10.15) (10.17)
Teacher certified -24.72 -28.60 -28.50 -31.45 (Missing) (16.39) (16.62) (17.05) (17.34)
T. Pedagogy Degree 13.20 13.55 8.67 8.70 (Middle tercile) (11.91) (12.05) (11.53) (11.65)
T. Pedagogy Degree 20.54* 21.09* 19.00* 19.33* (High tercile) (9.67) (9.75) (9.18) (9.26)
T. Pedagogy Degree 9.65 13.06 1.79 4.48 (Missing) (13.83) (13.99) (13.73) (13.88)
School Capacity School size 31.18** 32.33**
(Middle tercile) (10.06) (10.18) School size 36.65*** 38.49*** (High tercile) (9.71) (9.79) School size 0.00 0.00 (Missing) 0.00 0.00 School resources -3.92 -3.69
(Middle tercile) (9.05) (9.04) School resources 2.24 2.55
(High tercile) (11.09) (11.21) School resources 0.00 0.00 (Missing) 0.00 0.00 Table continues on next page.

264
Selected Independent Variables
Model 1: Student
Model 2: Students by
SES Quintiles
Model 3: Students & Classroom
Model 4: Students,
Classroom & SES Quintiles
Model 5: Students,
Classroom & School
Model 6: Students, Classroom, School
& SES Quintiles
Population 0.00 0.00 (below 3K) 0.00 0.00
Population 21.63 23.45 (3K -15K) (23.38) (23.61)
Population 7.39 8.18 (15K – 100K) (11.68) (11.78)
Population 11.24 12.03 (100K - 1,000K) (10.30) (10.42)
Constant 181.03* 155.74 183.38** 167.48* 165.68* 150.02* (83.59) (84.23) (70.15) (70.30) (66.81) (66.74) Observations 4670 4706 4670 4706 4670 4706 R-squared 0.12 0.11 0.30 0.30 0.32 0.32 Notes: Standard errors in parentheses. *** p<0.001, ** p<0.01, * p<0.05 Middle SES quintile, Grades 7-9, lowest terciles or observations below 100%, and populations over 1,000,000 serve as reference categories. Source: OECD – PISA 2003.

265
TABLE 54. ESTIMATED OLS COEFFICIENTS OF TIMSS 2003 MATH ACHIEVEMENT SCORES ON STUDENT CHARACTERISTICS, CLASSROOM RESOURCES, AND SCHOOL CAPACITY IN JAPAN
Selected Independent Variables
Model 1: Student
Model 2: Students by
SES Quintiles
Model 3: Students & Classroom
Model 4: Students,
Classroom & SES Quintiles
Model 5: Students,
Classroom & School
Model 6: Students, Classroom, School
& SES Quintiles
Student Characteristics SES 29.76*** 28.95*** 28.04*** (1.53) (1.41) (1.44) Low SES -39.03*** -38.18*** -36.21*** (3.58) (3.69) (3.74) Mid-low SES -14.12*** -13.15*** -12.69*** (3.24) (3.21) (3.27) Mid-high SES 20.87*** 20.45*** 20.24*** (3.11) (3.24) (3.12) High SES 41.61*** 39.61*** 38.78*** (3.88) (3.61) (3.65) Female -2.44 -2.82 -3.62 -4.06 -3.61 -4.08
(5.25) (5.42) (4.01) (4.20) (3.68) (3.83) Age 7.68* 7.68 7.91* 7.77* 7.73* 7.62*
(3.80) (3.99) (3.55) (3.71) (3.45) (3.60) Classroom Resources
% Alg. + Geo. 2.03 -0.31 1.91 -0.56 (Middle tercile) (4.23) (4.57) (4.93) (5.30)
% Alg. + Geo. -2.24 -2.61 -4.11 -4.69 (High tercile) (4.12) (4.26) (4.24) (4.40)
% Alg. + Geo. 31.06 31.67 29.23 29.42 (Missing) (23.91) (24.52) (22.61) (23.10)
Table continues on next page.

266
Selected Independent Variables
Model 1: Student
Model 2: Students by
SES Quintiles
Model 3: Students & Classroom
Model 4: Students,
Classroom & SES Quintiles
Model 5: Students,
Classroom & School
Model 6: Students, Classroom, School
& SES Quintiles
Overall Math Time 9.72 4.51 9.11* 3.99 (Upper 50%) (5.00) (5.34) (4.40) (4.62)
Class Size -2.06 -3.41 -1.11 -2.41 (25-32 students) (9.64) (9.22) (14.09) (12.14)
Class Size 7.70 7.40 3.77 2.96 (33+ students) (8.44) (8.09) (13.08) (11.28)
T. Math Degree 15.06 17.00 12.07 13.65 (Required) (9.06) (10.27) (7.79) (8.78)
T. ISCED 5A 11.32** 10.57* 9.31 8.44 (2nd Degree) (4.38) (4.66) (5.09) (5.40)
School Capacity School Size 0.01 0.02
(Continuous) (0.01) (0.01) School Resources 8.43 9.23
(Middle level) (9.14) (9.48) School Resources 15.36 16.97
(High level) (9.84) (10.33) School Resources 10.47 15.15
(Missing) (20.70) (23.64) Population -19.31 -21.55
(below 3K) (31.40) (32.71) Population -8.28 -9.11
(3K -15K) (10.30) (10.94) Population -15.63* -16.95*
(15K – 50K) (7.33) (7.77) Population -14.56 -15.07
(50K - 100K) (8.78) (9.22) Table continues on next page.

267
Selected Independent Variables
Model 1: Student
Model 2: Students by
SES Quintiles
Model 3: Students & Classroom
Model 4: Students,
Classroom & SES Quintiles
Model 5: Students,
Classroom & School
Model 6: Students, Classroom, School
& SES Quintiles
Population -5.92 -6.22 (100K-500K) (8.20) (8.73)
Population -2.96 -6.54 (Missing) (10.36) (13.11)
Constant 460.63*** 458.96*** 435.90*** 440.13*** 432.13*** 434.26*** (55.21) (58.24) (51.25) (53.09) (53.96) (55.35) Observations 4778 4778 4778 4778 4757 4757 R-squared 0.14 0.12 0.15 0.14 0.16 0.14 Notes: Standard errors in parentheses. *** p<0.001, ** p<0.01, * p<0.05 SES mean imputed. Middle SES quintile, lowest terciles or observations below 100%, and populations over 500,000 serve as reference categories. Source: IEA – TIMSS 2003.
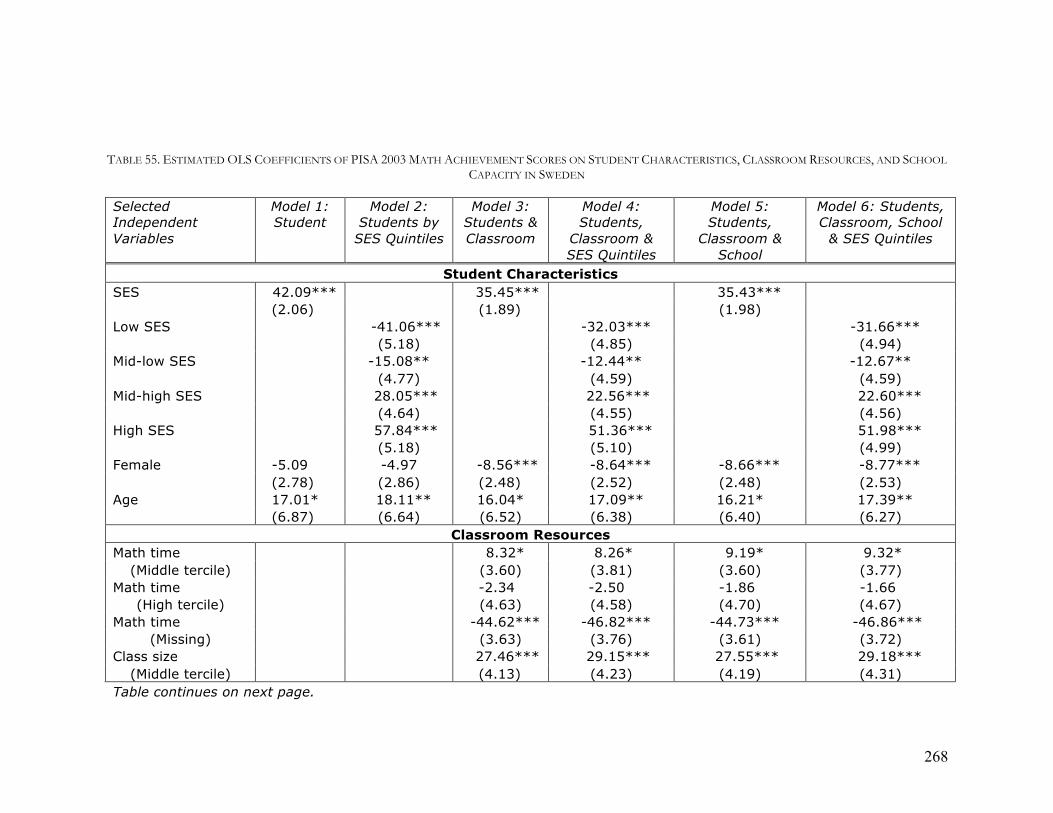
268
TABLE 55. ESTIMATED OLS COEFFICIENTS OF PISA 2003 MATH ACHIEVEMENT SCORES ON STUDENT CHARACTERISTICS, CLASSROOM RESOURCES, AND SCHOOL CAPACITY IN SWEDEN
Selected Independent Variables
Model 1: Student
Model 2: Students by
SES Quintiles
Model 3: Students & Classroom
Model 4: Students,
Classroom & SES Quintiles
Model 5: Students,
Classroom & School
Model 6: Students, Classroom, School
& SES Quintiles
Student Characteristics SES 42.09*** 35.45*** 35.43*** (2.06) (1.89) (1.98) Low SES -41.06*** -32.03*** -31.66*** (5.18) (4.85) (4.94) Mid-low SES -15.08** -12.44** -12.67** (4.77) (4.59) (4.59) Mid-high SES 28.05*** 22.56*** 22.60*** (4.64) (4.55) (4.56) High SES 57.84*** 51.36*** 51.98*** (5.18) (5.10) (4.99) Female -5.09 -4.97 -8.56*** -8.64*** -8.66*** -8.77***
(2.78) (2.86) (2.48) (2.52) (2.48) (2.53) Age 17.01* 18.11** 16.04* 17.09** 16.21* 17.39**
(6.87) (6.64) (6.52) (6.38) (6.40) (6.27) Classroom Resources
Math time 8.32* 8.26* 9.19* 9.32* (Middle tercile) (3.60) (3.81) (3.60) (3.77)
Math time -2.34 -2.50 -1.86 -1.66 (High tercile) (4.63) (4.58) (4.70) (4.67)
Math time -44.62*** -46.82*** -44.73*** -46.86*** (Missing) (3.63) (3.76) (3.61) (3.72)
Class size 27.46*** 29.15*** 27.55*** 29.18*** (Middle tercile) (4.13) (4.23) (4.19) (4.31)
Table continues on next page.

269
Selected Independent Variables
Model 1: Student
Model 2: Students by
SES Quintiles
Model 3: Students & Classroom
Model 4: Students,
Classroom & SES Quintiles
Model 5: Students,
Classroom & School
Model 6: Students, Classroom, School
& SES Quintiles
Class size 32.77*** 34.39*** 32.55*** 34.10*** (High tercile) (4.81) (4.95) (4.70) (4.83)
Class size -46.66*** -48.18*** -45.02*** -46.04*** (Missing) (9.91) (10.02) (9.62) (9.62)
Teacher Certified -11.44* -13.52* -10.21* -11.80* (Middle tercile) (4.96) (5.26) (4.94) (5.09)
Teacher Certified -0.72 -1.33 1.03 0.50 (High tercile) (4.99) (5.15) (5.38) (5.51)
Teacher certified -12.36 -13.51 -13.58 -14.64 (Missing) (7.55) (7.91) (8.35) (8.91)
T. Pedagogy Degree -6.28 -7.55 -3.92 -4.99 (Middle tercile) (5.08) (5.36) (5.25) (5.52)
T. Pedagogy Degree -0.98 -0.55 -1.06 -0.76 (High tercile) (5.09) (5.17) (5.28) (5.45)
T. Pedagogy Degree -1.48 -1.43 0.21 0.32 (Missing) (4.94) (5.15) (5.65) (5.86)
T. Math Degree 1.37 0.83 2.18 1.57 (Middle tercile) (4.73) (5.08) (4.91) (5.24)
T. Math Degree 5.72 6.61 7.96 8.92 (High tercile) (5.23) (5.34) (5.62) (5.73)
T. Math Degree -8.34 -9.46 -5.26 -6.08 (Missing) (6.45) (6.80) (6.77) (7.07)
School Capacity School size 8.05* 8.60*
(Middle tercile) (3.55) (3.76) School size 9.18 9.87
(High tercile) (4.91) (5.11) Table continues on next page.

270
Selected Independent Variables
Model 1: Student
Model 2: Students by
SES Quintiles
Model 3: Students & Classroom
Model 4: Students,
Classroom & SES Quintiles
Model 5: Students,
Classroom & School
Model 6: Students, Classroom, School
& SES Quintiles
School size 1.69 0.85 (Missing) (8.40) (8.57)
School resources -1.95 -2.03 (Middle tercile) (5.64) (5.73)
School resources 2.61 3.75 (High tercile) (5.37) (5.42)
School resources 0.00 0.00 (Missing) 0.00 0.00
Population -7.55 -6.66 (below 3K) (7.98) (8.18)
Population -4.32 -3.98 (3K -15K) (7.05) (7.44)
Population -11.36 -10.68 (15K – 100K) (7.83) (8.07)
Population -19.56 -21.82* (100K - 1,000K) (10.30) (10.73)
Constant 233.97* 220.93* 252.40* 239.96* 250.40* 234.59* (107.78) (103.68) (104.21) (101.57) (103.53) (101.02) Observations 4585 4623 4585 4623 4585 4623 R-squared 0.16 0.13 0.26 0.25 0.26 0.26 Notes: Standard errors in parentheses. *** p<0.001, ** p<0.01, * p<0.05 Middle SES quintile, Grades 7-9, lowest terciles or observations below 100%, and populations over 1,000,000 serve as reference categories. Source: OECD – PISA 2003.
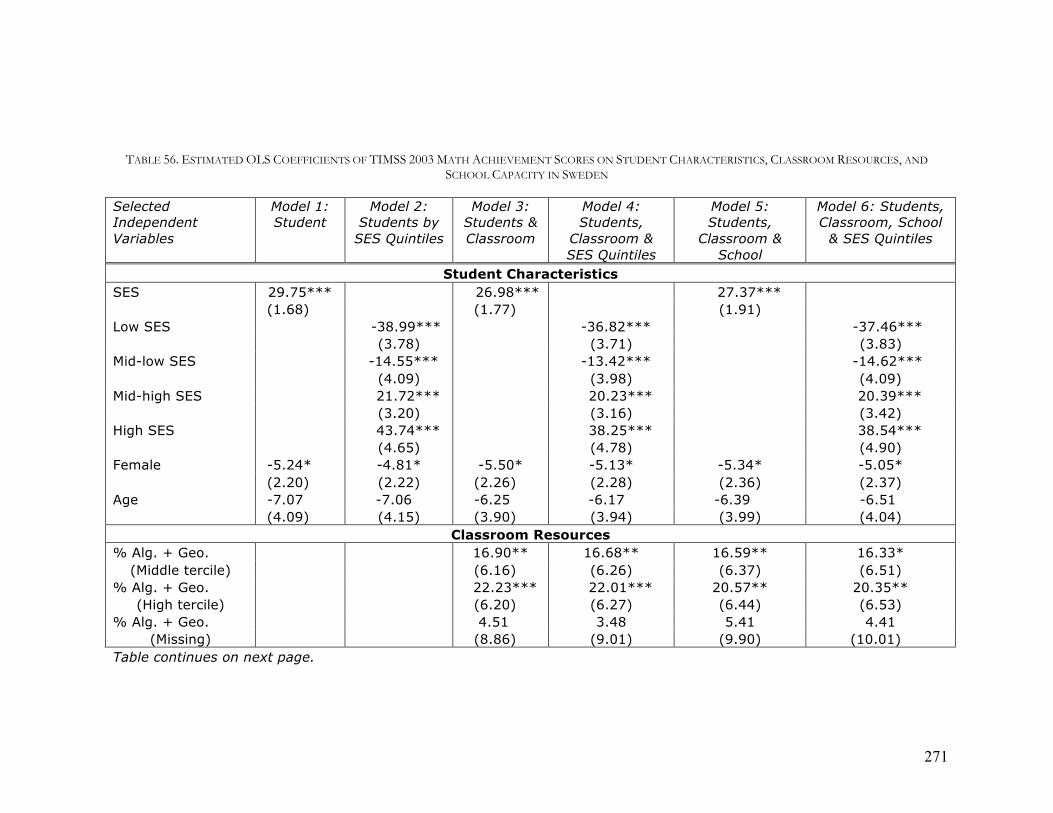
271
TABLE 56. ESTIMATED OLS COEFFICIENTS OF TIMSS 2003 MATH ACHIEVEMENT SCORES ON STUDENT CHARACTERISTICS, CLASSROOM RESOURCES, AND SCHOOL CAPACITY IN SWEDEN
Selected Independent Variables
Model 1: Student
Model 2: Students by
SES Quintiles
Model 3: Students & Classroom
Model 4: Students,
Classroom & SES Quintiles
Model 5: Students,
Classroom & School
Model 6: Students, Classroom, School
& SES Quintiles
Student Characteristics SES 29.75*** 26.98*** 27.37*** (1.68) (1.77) (1.91) Low SES -38.99*** -36.82*** -37.46*** (3.78) (3.71) (3.83) Mid-low SES -14.55*** -13.42*** -14.62*** (4.09) (3.98) (4.09) Mid-high SES 21.72*** 20.23*** 20.39*** (3.20) (3.16) (3.42) High SES 43.74*** 38.25*** 38.54*** (4.65) (4.78) (4.90) Female -5.24* -4.81* -5.50* -5.13* -5.34* -5.05*
(2.20) (2.22) (2.26) (2.28) (2.36) (2.37) Age -7.07 -7.06 -6.25 -6.17 -6.39 -6.51
(4.09) (4.15) (3.90) (3.94) (3.99) (4.04) Classroom Resources
% Alg. + Geo. 16.90** 16.68** 16.59** 16.33* (Middle tercile) (6.16) (6.26) (6.37) (6.51)
% Alg. + Geo. 22.23*** 22.01*** 20.57** 20.35** (High tercile) (6.20) (6.27) (6.44) (6.53)
% Alg. + Geo. 4.51 3.48 5.41 4.41 (Missing) (8.86) (9.01) (9.90) (10.01)
Table continues on next page.

272
Selected Independent Variables
Model 1: Student
Model 2: Students by
SES Quintiles
Model 3: Students & Classroom
Model 4: Students,
Classroom & SES Quintiles
Model 5: Students,
Classroom & School
Model 6: Students, Classroom, School
& SES Quintiles
Overall Math Time -11.90** -14.04** -11.51** -13.87** (Upper 50%) (4.30) (4.29) (4.39) (4.43)
Class Size 20.03*** 20.76*** 18.52** 19.25** (25-32 students) (5.30) (5.37) (6.25) (6.31)
Class Size 36.68*** 37.85*** 36.74*** 38.14*** (33+ students) (8.71) (8.55) (8.23) (8.19)
Class Size -4.62 -4.58 -6.13 -6.15 (Missing) (10.95) (11.20) (10.98) (11.20)
T. Math Degree -0.63 -0.30 -2.07 -1.80 (Required) (7.15) (7.22) (7.31) (7.40)
T. Math Degree -4.66 -5.34 -5.89 -6.72 (Missing) (17.19) (17.15) (16.54) (16.44)
T. ISCED 5A 9.47 9.61 11.94* 12.09 (2nd Degree) (5.87) (5.99) (6.05) (6.21)
T. ISCED 5A 14.56 16.95 7.49 9.66 (2nd D. Missing) (17.51) (17.11) (16.96) (16.52)
School Capacity School Size 0.00 0.00
(Continuous) (0.02) (0.02) School Resources -2.70 -2.98
(High level) (5.53) (5.68) School Resources 30.94*** 30.93***
(Missing) (8.57) (8.52) Population 4.78 5.28
(below 3K) (13.76) (13.84) Population -2.22 -1.88
(3K -15K) (9.43) (9.72) Table continues on next page.

273
Selected Independent Variables
Model 1: Student
Model 2: Students by
SES Quintiles
Model 3: Students & Classroom
Model 4: Students,
Classroom & SES Quintiles
Model 5: Students,
Classroom & School
Model 6: Students, Classroom, School
& SES Quintiles
Population 1.21 0.77 (15K – 50K) (9.15) (9.44)
Population 6.73 6.56 (50K - 100K) (12.49) (12.59)
Population 3.49 3.53 (100K-500K) (9.05) (9.26)
Population 27.80** 29.10** (Missing) (9.33) (9.43)
Constant 605.78*** 603.14*** 575.92*** 573.26*** 577.03*** 577.35*** (61.09) (62.00) (59.72) (60.20) (63.63) (64.30) Observations 4422 4422 4422 4422 4129 4129 R-squared 0.17 0.16 0.22 0.21 0.23 0.22 Notes: Standard errors in parentheses. *** p<0.001, ** p<0.01, * p<0.05 SES mean imputed. Middle SES quintile, lowest terciles or observations below 100%, and populations over 500,000 serve as reference categories. Source: IEA – TIMSS 2003.

274
TABLE 57. ESTIMATED OLS COEFFICIENTS OF PISA 2003 MATH ACHIEVEMENT SCORES ON STUDENT CHARACTERISTICS, CLASSROOM RESOURCES, AND SCHOOL CAPACITY IN AUSTRALIA
Selected Independent Variables
Model 1: Student
Model 2: Students by
SES Quintiles
Model 3: Students & Classroom
Model 4: Students,
Classroom & SES Quintiles
Model 5: Students,
Classroom & School
Model 6: Students, Classroom, School
& SES Quintiles
Student Characteristics SES 42.26*** 35.62*** 33.57*** (2.15) (1.77) (1.79) Low SES -47.20*** -39.33*** -37.59*** (5.72) (3.97) (3.84) Mid-low SES -10.48** -11.04*** -10.43*** (3.42) (3.07) (3.02) Mid-high SES 26.61*** 21.14*** 19.88*** (3.68) (3.16) (3.06) High SES 55.12*** 46.89*** 43.52*** (4.17) (3.36) (3.38) Female -5.63 -5.12 -10.90*** -10.98*** -10.88*** -10.92***
(2.96) (3.01) (2.60) (2.60) (2.65) (2.65) Age 22.42*** 21.80*** 15.17*** 14.35*** 14.86*** 14.16***
(3.80) (3.86) (3.87) (3.94) (3.57) (3.66) Classroom Resources
Grade 48.98*** 49.54*** 47.84*** 48.39*** (10th – 12th) (3.72) (3.72) (3.50) (3.51)
Math time 7.51* 7.56* 8.46** 8.17** (Middle tercile) (3.11) (3.00) (2.83) (2.78)
Math time -0.17 -0.25 -0.29 -0.49 (High tercile) (3.87) (3.66) (3.65) (3.49)
Math time -57.82*** -57.94*** -57.65*** -57.78*** (Missing) (3.66) (3.48) (3.62) (3.50)
Table continues on next page.

275
Selected Independent Variables
Model 1: Student
Model 2: Students by
SES Quintiles
Model 3: Students & Classroom
Model 4: Students,
Classroom & SES Quintiles
Model 5: Students,
Classroom & School
Model 6: Students, Classroom, School
& SES Quintiles
Class size 19.53*** 20.02*** 18.64*** 18.94*** (Middle tercile) (3.19) (3.17) (2.95) (2.93)
Class size 26.12*** 26.86*** 25.29*** 25.86*** (High tercile) (3.34) (3.28) (3.05) (3.01)
Class size -35.78*** -36.78*** -35.50*** -36.53*** (Missing) (5.65) (5.90) (5.56) (5.79)
Teacher Certified 10.87 9.9 8.5 7.68 (100 percent) (9.60) (9.42) (7.95) (7.94)
Teacher certified 21.39 21.02 20.72* 20.34* (Missing) (11.01) (10.76) (9.07) (8.92)
T. Pedagogy Degree -7.57 -7.08 -8.83 -8.19 (100 percent) (4.69) (4.68) (4.89) (4.87)
T. Pedagogy Degree 2.25 2.48 1.19 1.76 (Missing) (6.05) (6.22) (6.07) (6.20)
T. Math Degree -1.94 -1.48 -3.13 -3.02 (Middle tercile) (5.71) (5.61) (5.35) (5.39)
T. Math Degree 9.5 10.11 7.44 7.96 (High tercile) (6.32) (6.29) (5.90) (5.84)
T. Math Degree 0.82 1.06 0.99 0.84 (Missing) (5.22) (5.10) (4.93) (4.99)
School Capacity School size 8.36 9.34
(Middle tercile) (5.18) (5.27) School size 9.43 11.30*
(High tercile) (4.89) (4.95) School size -24.43* -21.97*
(Missing) (11.44) (10.35) Table continues on next page

276
Selected Independent Variables
Model 1: Student
Model 2: Students by
SES Quintiles
Model 3: Students & Classroom
Model 4: Students,
Classroom & SES Quintiles
Model 5: Students,
Classroom & School
Model 6: Students, Classroom, School
& SES Quintiles
School resources 0.08 -0.28 (Middle tercile) (4.74) (4.89)
School resources 12.37* 12.05* (High tercile) (5.19) (5.14)
School resources 0 0 (Missing) (4.69) 0.00
Population -7.1 -5.16 (below 3K) (8.97) (9.20)
Population -3.14 -2.68 (3K -15K) (5.49) (5.50)
Population -4.18 -3.62 (15K – 100K) (5.14) (5.22)
Population -0.13 -1.31 (100K - 1,000K) (5.80) (5.88)
Constant 164.80** 178.20** 221.93*** 238.57*** 224.07*** 238.20*** (59.87) (60.27) (62.39) (63.19) (55.86) (56.97) Observations 12388 12550 12388 12550 12388 12550 R-squared 0.14 0.13 0.25 0.25 0.26 0.26 Notes: Standard errors in parentheses. *** p<0.001, ** p<0.01, * p<0.05 Middle SES quintile, Grades 7-9, lowest terciles or observations below 100%, and populations over 1,000,000 serve as reference categories. Source: OECD – PISA 2003.
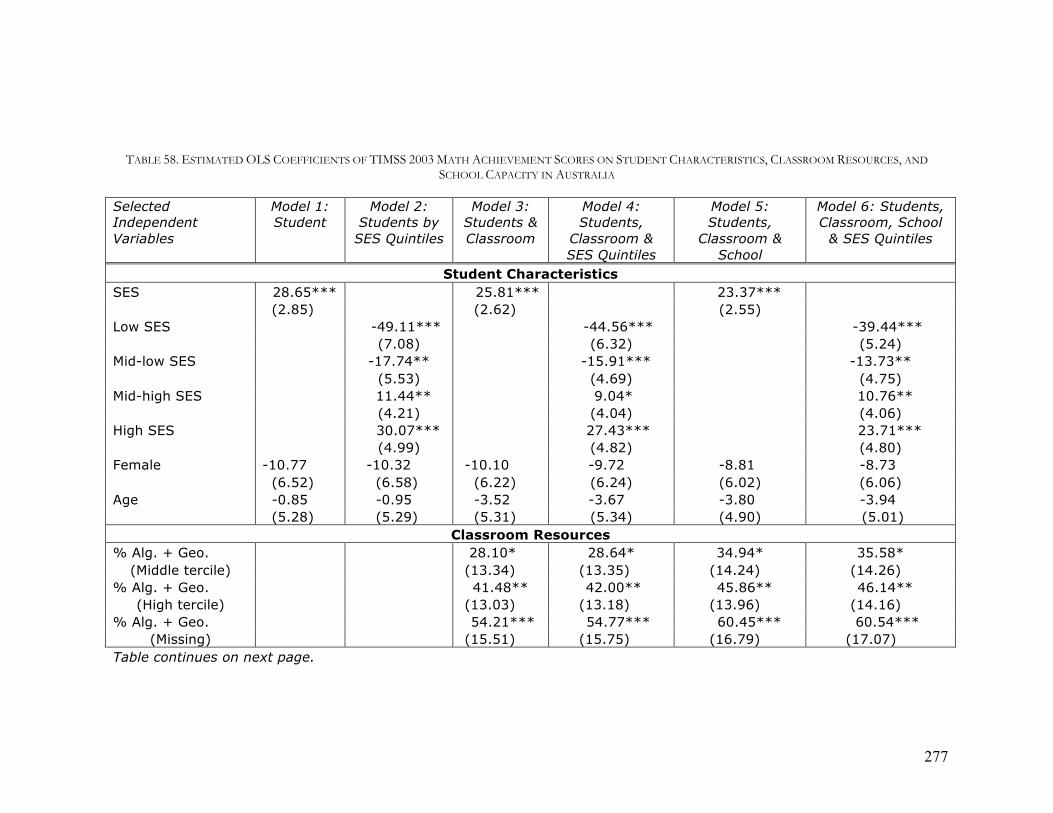
277
TABLE 58. ESTIMATED OLS COEFFICIENTS OF TIMSS 2003 MATH ACHIEVEMENT SCORES ON STUDENT CHARACTERISTICS, CLASSROOM RESOURCES, AND SCHOOL CAPACITY IN AUSTRALIA
Selected Independent Variables
Model 1: Student
Model 2: Students by
SES Quintiles
Model 3: Students & Classroom
Model 4: Students,
Classroom & SES Quintiles
Model 5: Students,
Classroom & School
Model 6: Students, Classroom, School
& SES Quintiles
Student Characteristics SES 28.65*** 25.81*** 23.37*** (2.85) (2.62) (2.55) Low SES -49.11*** -44.56*** -39.44*** (7.08) (6.32) (5.24) Mid-low SES -17.74** -15.91*** -13.73** (5.53) (4.69) (4.75) Mid-high SES 11.44** 9.04* 10.76** (4.21) (4.04) (4.06) High SES 30.07*** 27.43*** 23.71*** (4.99) (4.82) (4.80) Female -10.77 -10.32 -10.10 -9.72 -8.81 -8.73
(6.52) (6.58) (6.22) (6.24) (6.02) (6.06) Age -0.85 -0.95 -3.52 -3.67 -3.80 -3.94
(5.28) (5.29) (5.31) (5.34) (4.90) (5.01) Classroom Resources
% Alg. + Geo. 28.10* 28.64* 34.94* 35.58* (Middle tercile) (13.34) (13.35) (14.24) (14.26)
% Alg. + Geo. 41.48** 42.00** 45.86** 46.14** (High tercile) (13.03) (13.18) (13.96) (14.16)
% Alg. + Geo. 54.21*** 54.77*** 60.45*** 60.54*** (Missing) (15.51) (15.75) (16.79) (17.07)
Table continues on next page.

278
Selected Independent Variables
Model 1: Student
Model 2: Students by
SES Quintiles
Model 3: Students & Classroom
Model 4: Students,
Classroom & SES Quintiles
Model 5: Students,
Classroom & School
Model 6: Students, Classroom, School
& SES Quintiles
Overall Math Time -12.53 -12.98 -13.58 -13.75 (Upper 50%) (8.62) (8.67) (8.39) (8.46)
Class Size 37.18*** 37.75*** 31.00** 31.56** (25-32 students) (10.05) (10.14) (10.34) (10.46)
Class Size 9.47 10.45 10.36 11.21 (33+ students) (23.22) (23.07) (26.01) (26.06)
Class Size 27.81* 28.45* 21.71 23.04 (Missing) (13.58) (13.46) (14.30) (14.16)
T. Math Degree 1.65 2.32 0.96 1.85 (Required) (9.79) (9.93) (11.58) (11.76)
T. Math Degree -16.83 -17 -7.52 -7.39 (Missing) (21.57) (21.03) (31.10) (30.32)
T. ISCED 5A -6.6 -6.6 -6.8 -6.68 (2nd Degree) (9.39) (9.45) (10.55) (10.61)
T. ISCED 5A -26.75 -28.05* -35.06 -36.16 (2nd D. Missing) (14.69) (14.08) (21.63) (20.22)
School Capacity School Size 0.01 0.01
(Continuous) (0.01) (0.01) School Resources 32.27 34.23
(Middle level) (18.30) (19.34) School Resources 39.92* 42.32*
(High level) (19.79) (20.86) School Resources 49.58 51.53
(Missing) (36.84) (38.06) Table continues on next page.

279
Selected Independent Variables
Model 1: Student
Model 2: Students by
SES Quintiles
Model 3: Students & Classroom
Model 4: Students,
Classroom & SES Quintiles
Model 5: Students,
Classroom & School
Model 6: Students, Classroom, School
& SES Quintiles
Population 11.88 10.36 (below 3K) (16.27) (16.61)
Population 2.6 2.53 (3K -15K) (16.58) (16.81)
Population -12.41 -13.53 (15K – 50K) (13.57) (13.64)
Population 21.65 20.51 (50K - 100K) (21.50) (21.53)
Population -2.44 -2.54 (100K-500K) (12.63) (12.82)
Population -34.04 -35.62 (Missing) (18.77) (18.51)
Constant 523.28*** 529.68*** 514.51*** 520.27*** 476.63*** 479.46*** (73.44) (73.40) (72.48) (72.68) (70.75) (71.92) Observations 4820 4820 4820 4820 4363 4363 R-squared 0.13 0.11 0.21 0.20 0.23 0.22 Notes: Standard errors in parentheses. *** p<0.001, ** p<0.01, * p<0.05 SES mean imputed. Middle SES quintile, lowest terciles or observations below 100%, and populations over 500,000 serve as reference categories. Source: IEA – TIMSS 2003.

280
TABLE 59. ESTIMATED OLS COEFFICIENTS OF PISA 2003 MATH ACHIEVEMENT SCORES ON STUDENT CHARACTERISTICS, CLASSROOM RESOURCES, AND SCHOOL CAPACITY IN ITALY
Selected Independent Variables
Model 1: Student
Model 2: Students by
SES Quintiles
Model 3: Students & Classroom
Model 4: Students,
Classroom & SES Quintiles
Model 5: Students,
Classroom & School
Model 6: Students, Classroom, School
& SES Quintiles
Student Characteristics SES 34.32*** 25.67*** 25.03*** (1.95) (1.89) (1.98) Low SES -57.89*** -41.54*** -39.35*** (4.83) (4.73) (4.57) Mid-low SES -22.50*** -15.05*** -14.55*** (4.82) (4.21) (4.13) Mid-high SES 13.60** 10.88** 11.71** (4.37) (3.92) (3.78) High SES 36.16*** 28.91*** 29.04*** (5.08) (4.49) (4.31) Female -16.10** -15.88** -24.87*** -25.25*** -23.03*** -23.41***
(5.01) (4.99) (3.55) (3.52) (3.44) (3.43) Age 18.64*** 18.67*** 14.90** 14.97** 15.06*** 15.15***
(5.05) (5.14) (4.61) (4.63) (4.53) (4.56) Classroom Resources
Grade 61.45*** 63.33*** 59.84*** 61.70*** (10th – 12th) (4.68) (4.70) (4.53) (4.58)
Math time 23.30*** 22.56*** 21.08*** 20.42*** (Middle tercile) (3.86) (3.84) (3.80) (3.81)
Math time 13.23** 12.67** 12.19** 11.67* (High tercile) (4.40) (4.45) (4.48) (4.54)
Math time -28.24*** -28.99*** -28.18*** -28.87*** (Missing) (5.53) (5.51) (5.43) (5.43)
Table continues on next page.
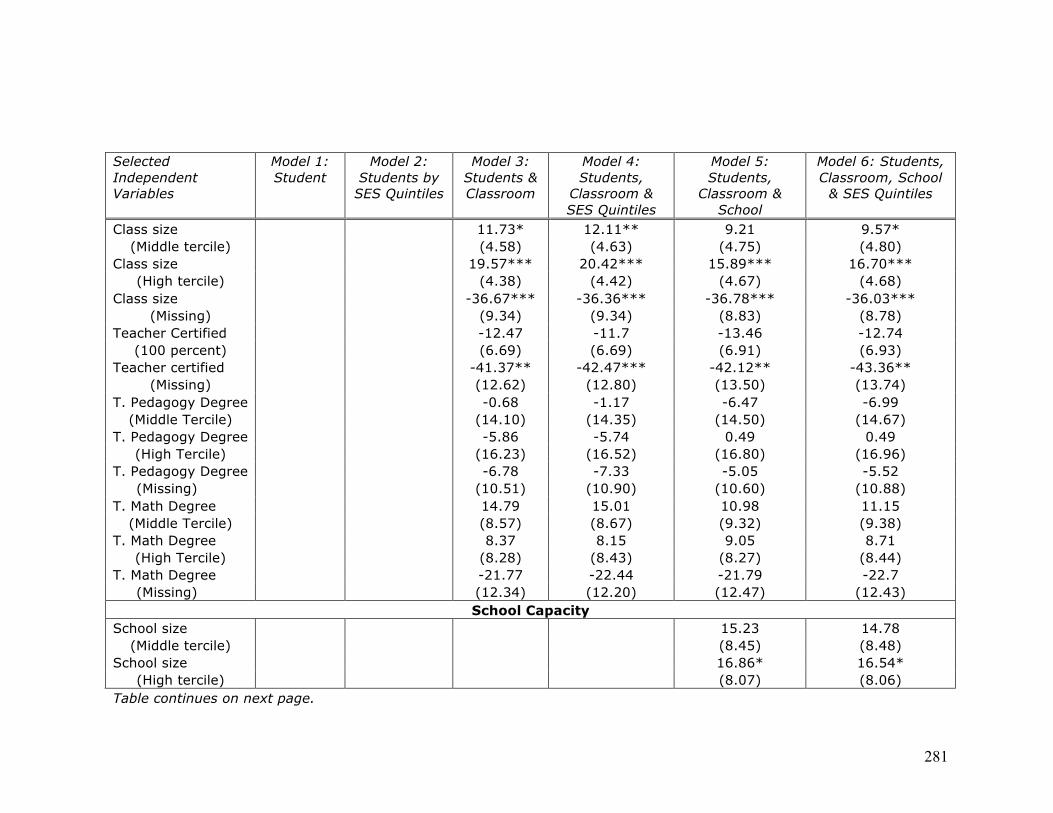
281
Selected Independent Variables
Model 1: Student
Model 2: Students by
SES Quintiles
Model 3: Students & Classroom
Model 4: Students,
Classroom & SES Quintiles
Model 5: Students,
Classroom & School
Model 6: Students, Classroom, School
& SES Quintiles
Class size 11.73* 12.11** 9.21 9.57* (Middle tercile) (4.58) (4.63) (4.75) (4.80)
Class size 19.57*** 20.42*** 15.89*** 16.70*** (High tercile) (4.38) (4.42) (4.67) (4.68)
Class size -36.67*** -36.36*** -36.78*** -36.03*** (Missing) (9.34) (9.34) (8.83) (8.78)
Teacher Certified -12.47 -11.7 -13.46 -12.74 (100 percent) (6.69) (6.69) (6.91) (6.93)
Teacher certified -41.37** -42.47*** -42.12** -43.36** (Missing) (12.62) (12.80) (13.50) (13.74)
T. Pedagogy Degree -0.68 -1.17 -6.47 -6.99 (Middle Tercile) (14.10) (14.35) (14.50) (14.67)
T. Pedagogy Degree -5.86 -5.74 0.49 0.49 (High Tercile) (16.23) (16.52) (16.80) (16.96)
T. Pedagogy Degree -6.78 -7.33 -5.05 -5.52 (Missing) (10.51) (10.90) (10.60) (10.88) T. Math Degree 14.79 15.01 10.98 11.15
(Middle Tercile) (8.57) (8.67) (9.32) (9.38) T. Math Degree 8.37 8.15 9.05 8.71
(High Tercile) (8.28) (8.43) (8.27) (8.44) T. Math Degree -21.77 -22.44 -21.79 -22.7 (Missing) (12.34) (12.20) (12.47) (12.43)
School Capacity School size 15.23 14.78
(Middle tercile) (8.45) (8.48) School size 16.86* 16.54*
(High tercile) (8.07) (8.06) Table continues on next page.

282
Selected Independent Variables
Model 1: Student
Model 2: Students by
SES Quintiles
Model 3: Students & Classroom
Model 4: Students,
Classroom & SES Quintiles
Model 5: Students,
Classroom & School
Model 6: Students, Classroom, School
& SES Quintiles
School size -5.19 -6.84 (Missing) (17.15) (16.78) School resources 17.12* 17.24*
(Middle tercile) (7.47) (7.60) School resources 17.34* 17.52*
(High tercile) (7.98) (8.06) School resources 0.49 0.87
(Missing) (16.60) (16.87) Population 30.11 28.14
(below 3K) (17.10) (17.10) Population 23.09 22.87
(3K -15K) (14.62) (14.66) Population 14.1 13.7
(15K – 100K) (12.03) (12.12) Population 23.9 24.35
(100K - 1,000K) (12.26) (12.46) Constant 185.22* 189.99* 192.38** 192.95** 154.68* 154.74* (79.88) (81.46) (73.67) (74.36) (70.36) (70.95) Observations 11606 11638 11606 11638 11606 11638 R-squared 0.15 0.13 0.29 0.28 0.30 0.30 Notes: Standard errors in parentheses. *** p<0.001, ** p<0.01, * p<0.05 Middle SES quintile, Grades 7-9, lowest terciles or observations below 100%, and populations over 1,000,000 serve as reference categories. Source: OECD – PISA 2003.
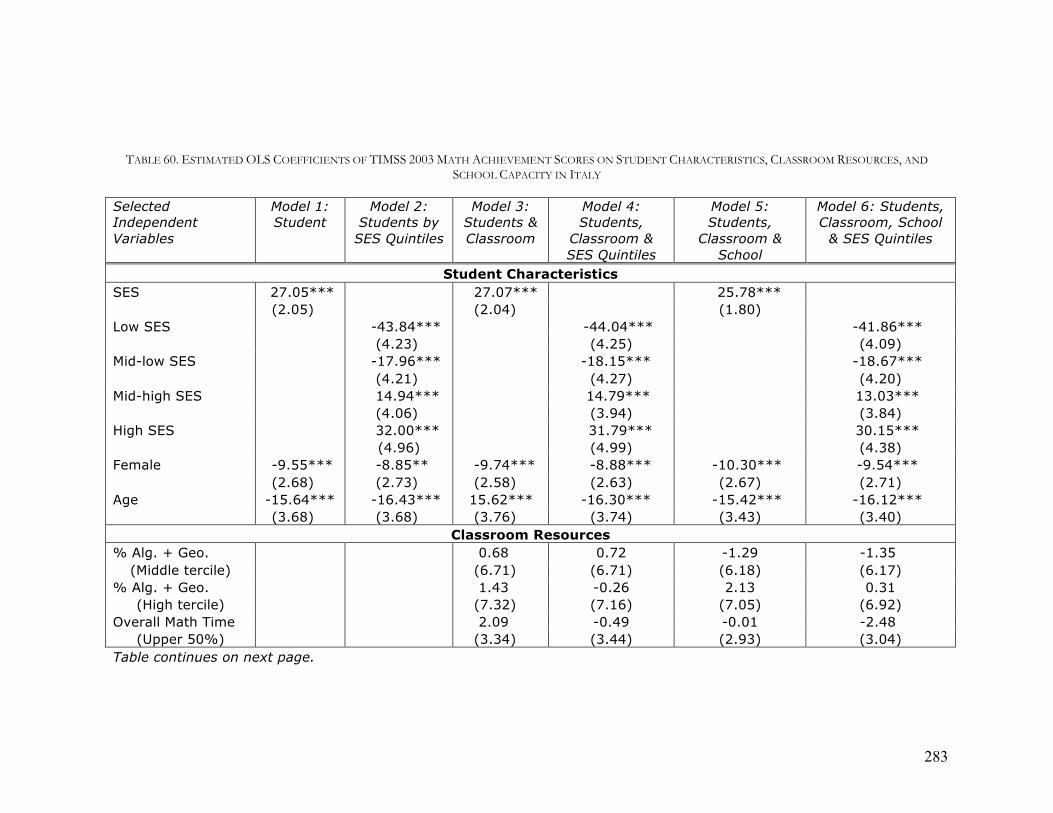
283
TABLE 60. ESTIMATED OLS COEFFICIENTS OF TIMSS 2003 MATH ACHIEVEMENT SCORES ON STUDENT CHARACTERISTICS, CLASSROOM RESOURCES, AND SCHOOL CAPACITY IN ITALY
Selected Independent Variables
Model 1: Student
Model 2: Students by
SES Quintiles
Model 3: Students & Classroom
Model 4: Students,
Classroom & SES Quintiles
Model 5: Students,
Classroom & School
Model 6: Students, Classroom, School
& SES Quintiles
Student Characteristics SES 27.05*** 27.07*** 25.78*** (2.05) (2.04) (1.80) Low SES -43.84*** -44.04*** -41.86*** (4.23) (4.25) (4.09) Mid-low SES -17.96*** -18.15*** -18.67*** (4.21) (4.27) (4.20) Mid-high SES 14.94*** 14.79*** 13.03*** (4.06) (3.94) (3.84) High SES 32.00*** 31.79*** 30.15*** (4.96) (4.99) (4.38) Female -9.55*** -8.85** -9.74*** -8.88*** -10.30*** -9.54***
(2.68) (2.73) (2.58) (2.63) (2.67) (2.71) Age -15.64*** -16.43*** 15.62*** -16.30*** -15.42*** -16.12***
(3.68) (3.68) (3.76) (3.74) (3.43) (3.40) Classroom Resources
% Alg. + Geo. 0.68 0.72 -1.29 -1.35 (Middle tercile) (6.71) (6.71) (6.18) (6.17)
% Alg. + Geo. 1.43 -0.26 2.13 0.31 (High tercile) (7.32) (7.16) (7.05) (6.92)
Overall Math Time 2.09 -0.49 -0.01 -2.48 (Upper 50%) (3.34) (3.44) (2.93) (3.04)
Table continues on next page.

284
Selected Independent Variables
Model 1: Student
Model 2: Students by
SES Quintiles
Model 3: Students & Classroom
Model 4: Students,
Classroom & SES Quintiles
Model 5: Students,
Classroom & School
Model 6: Students, Classroom, School
& SES Quintiles
Class Size -2.75 -2.65 1.16 1.15 (25-32 students) (7.64) (7.67) (8.05) (7.97)
Class Size -7.01 -8.13 -1.95 -3.16 (Missing) (14.95) (15.73) (14.46) (15.22)
T. Math Degree 1.94 2.64 4.88 5.67 (Required) (8.35) (8.22) (10.57) (10.54)
T. Math Degree -69.41 -69.31 -98.08* -97.65* (Missing) (55.72) (54.75) (42.42) (41.57)
T. ISCED 5A -8.97 -9.46 -8.60 -9.17 (2nd Degree) (13.80) (13.32) (12.32) (11.95)
T. ISCED 5A 18.23 17.55 30.66 30.13 (2nd D. Missing) (85.52) (84.06) (58.55) (57.23)
School Capacity School Size 0.02 0.02
(Continuous) (0.01) (0.01) School Resources 19.28 18.93
(Middle level) (26.98) (24.93) School Resources 34.81 34.68
(High level) (27.30) (25.27) Population 58.45** 57.64**
(below 3K) (19.53) (19.48) Population 23.98* 23.66*
(3K -15K) (9.87) (9.87) Population 6.41 5.43
(15K – 50K) (10.68) (10.68) Population 20.60 20.36
(50K - 100K) (11.21) (11.21) Table continues on next page.

285
Selected Independent Variables
Model 1: Student
Model 2: Students by
SES Quintiles
Model 3: Students & Classroom
Model 4: Students,
Classroom & SES Quintiles
Model 5: Students,
Classroom & School
Model 6: Students, Classroom, School
& SES Quintiles
Population 27.82* 27.51* (100K-500K) (11.86) (11.50)
Population -44.68** -46.82** (Missing) (14.61) (14.54)
Constant 705.86*** 719.43*** 704.40*** 717.06*** 644.01*** 658.53*** (52.07) (52.20) (56.54) (56.33) (62.49) (61.19) Observations 4299 4299 4299 4299 4277 4277 R-squared 0.14 0.14 0.15 0.14 0.19 0.19 Notes: Standard errors in parentheses. *** p<0.001, ** p<0.01, * p<0.05 SES mean imputed. Middle SES quintile, lowest terciles or observations below 100%, and populations over 500,000 serve as reference categories. Source: IEA – TIMSS 2003.

286
TABLE 61. ESTIMATED OLS COEFFICIENTS OF PISA 2003 MATH ACHIEVEMENT SCORES ON STUDENT CHARACTERISTICS, CLASSROOM RESOURCES, AND SCHOOL CAPACITY IN HONG KONG
Selected Independent Variables
Model 1: Student
Model 2: Students by
SES Quintiles
Model 3: Students & Classroom
Model 4: Students,
Classroom & SES Quintiles
Model 5: Students,
Classroom & School
Model 6: Students, Classroom, School
& SES Quintiles
Student Characteristics
SES 31.14***
20.10*** 14.67*** (2.93) (2.73) (2.78) Low SES -33.94*** -20.92*** -16.77*** (5.36) (4.99) (4.75) Mid-low SES -10.51* -6.82 -5.03 (4.83) (4.61) (4.53) Mid-high SES 16.14** 12.09** 7.92* (5.05) (3.85) (3.87) High SES 35.93*** 22.79*** 14.96* (6.50) (6.24) (6.14) Female -6.62 -5.61 -16.65*** -16.46*** -16.56*** -16.40***
(5.41) (5.60) (4.63) (4.72) (4.03) (4.11) Age 28.88*** 27.59*** -13.47* -14.88* -16.30** -17.69**
(6.04) (6.28) (6.14) (6.25) (5.85) (5.94) Classroom Resources
Grade 46.81*** 47.73*** 46.03*** 46.92*** (10th – 12th) (3.46) (3.47) (3.23) (3.35)
Math time -5.68 -5.93 -4.03 -4.24 (Middle tercile) (3.74) (3.75) (3.43) (3.44)
Math time -7.58* -7.42* -5.88 -5.76 (High tercile) (3.77) (3.78) (3.87) (3.89)
Math time -65.13*** -66.08*** -57.67*** -58.54*** (Missing) (5.74) (5.73) (5.82) (6.04)
Table continues on next page.

287
Selected Independent Variables
Model 1: Student
Model 2: Students by
SES Quintiles
Model 3: Students & Classroom
Model 4: Students,
Classroom & SES Quintiles
Model 5: Students,
Classroom & School
Model 6: Students, Classroom, School
& SES Quintiles
Class size 39.08*** 39.00*** 29.37*** 28.96*** (Middle tercile) (5.31) (5.33) (4.96) (4.90)
Class size 57.83*** 58.49*** 38.33*** 38.49*** (High tercile) (6.32) (6.29) (7.72) (7.78)
Class size -25.59* -25.45* -28.15** -28.19** (Missing) (10.63) (10.10) (9.69) (9.06)
Teacher Certified 10.76 11.26 4.22 4.55 (Middle tercile) (12.12) (12.24) (10.56) (10.71)
Teacher Certified 10.43 10.90 4.36 4.53 (High tercile) (12.18) (12.30) (10.60) (10.68)
Teacher certified 5.47 3.48 -33.54 -35.98 (Missing) (21.66) (21.77) (23.57) (23.67)
T. Pedagogy Degree 11.23 11.49 6.78 7.05 (Middle tercile) (10.41) (10.53) (9.57) (9.68)
T. Pedagogy Degree 23.67 24.28 16.07 16.63 (High tercile) (12.42) (12.47) (11.71) (11.83)
T. Pedagogy Degree 16.11 16.24 16.95 17.04 (Missing) (19.27) (19.55) (17.41) (17.59)
T. Math Degree 18.03 18.46 19.65* 20.19* (Middle tercile) (10.23) (10.42) (9.65) (9.82)
T. Math Degree 18.59 19.65 16.07 17.05 (High tercile) (12.29) (12.40) (13.25) (13.35)
T. Math Degree 13.15 13.59 8.74 9.05 (Missing) (13.81) (13.92) (11.89) (12.01)
School Capacity School size 37.36*** 37.45***
(Middle tercile) (10.13) (10.17) Table continues on next page.

288
Selected Independent Variables
Model 1: Student
Model 2: Students by
SES Quintiles
Model 3: Students & Classroom
Model 4: Students,
Classroom & SES Quintiles
Model 5: Students,
Classroom & School
Model 6: Students, Classroom, School
& SES Quintiles
School size 66.33*** 67.26*** (High tercile) (14.47) (14.82)
School size -17.55 -17.86 (Missing) (12.53) (12.78)
School resources -19.07* -19.58* (Middle tercile) (7.89) (8.00)
School resources -18.10 -18.48 (High tercile) (10.86) (11.08)
School resources 0.00 0.00 (Missing) 0.00 0.00
Constant 121.52 115.77 718.22*** 722.25*** 753.43*** 762.80*** (94.26) (97.82) (94.91) (96.53) (91.22) (91.96) Observations 4447 4477 4447 4477 4447 4477 R-squared 0.07 0.06 0.30 0.30 0.37 0.37 Notes: Standard errors in parentheses. *** p<0.001, ** p<0.01, * p<0.05 Middle SES quintile, Grades 7-9, lowest terciles or observations below 100%, and populations over 1,000,000 serve as reference categories. Source: OECD – PISA 2003.

289
TABLE 62. ESTIMATED OLS COEFFICIENTS OF TIMSS 2003 MATH ACHIEVEMENT SCORES ON STUDENT CHARACTERISTICS, CLASSROOM RESOURCES, AND SCHOOL CAPACITY IN HONG KONG
Selected Independent Variables
Model 1: Student
Model 2: Students by
SES Quintiles
Model 3: Students & Classroom
Model 4: Students,
Classroom & SES Quintiles
Model 5: Students,
Classroom & School
Model 6: Students, Classroom, School
& SES Quintiles
Student Characteristics SES 14.33*** 13.36*** 8.68*** (2.05) (2.06) (2.26) Low SES -9.22* -6.58* -4.97 (3.62) (3.12) (3.15) Mid-low SES -6.92 -4.55 -3.22 (3.58) (3.27) (3.27) Mid-high SES 9.30* 10.36** 6.51* (3.79) (3.33) (3.30) High SES 27.74*** 27.85*** 17.51*** (5.12) (5.39) (5.28) Female 1.86 1.9 0.64 0.69 -1.41 -1.38
(4.34) (4.42) (4.07) (4.12) (4.32) (4.35) Age -6.70*** -7.38*** -5.73*** -6.41*** -5.44*** -5.84***
(1.83) (1.82) (1.60) (1.61) (1.61) (1.62) Classroom Resources
% Alg. + Geo. 19.79* 20.02* 23.70* 23.90* (Middle tercile) (9.70) (9.77) (10.41) (10.43)
% Alg. + Geo. 6.04 5.74 14.34 14.20 (High tercile) (10.96) (11.01) (10.95) (10.98)
% Alg. + Geo. 2.91 2.80 24.11 24.17 (Missing) (22.11) (22.45) (15.64) (15.74)
Table continues on next page.

290
Selected Independent Variables
Model 1: Student
Model 2: Students by
SES Quintiles
Model 3: Students & Classroom
Model 4: Students,
Classroom & SES Quintiles
Model 5: Students,
Classroom & School
Model 6: Students, Classroom, School
& SES Quintiles
Overall Math Time 3.29 3.37 3.70 3.78 (Upper 50%) (8.44) (8.51) (9.21) (9.25)
Overall Math Time 0.00 0.00 0.00 0.00 (Missing) 0.00 0.00 0.00 0.00
Class Size 8.83 8.69 21.79 21.85 (25-32 students) (33.04) (33.03) (29.04) (28.91)
Class Size 81.52** 81.76** 73.32*** 73.42*** (33+ students) (26.84) (26.85) (19.44) (19.24)
Class Size 106.04*** 104.74** 112.52** 111.93* (Missing) (30.64) (32.37) (42.15) (43.91)
T. Math Degree 2.91 3.01 6.00 6.04 (Required) (7.65) (7.71) (8.20) (8.23)
T. Math Degree 14.59 14.35 10.08 9.75 (Missing) (20.63) (21.00) (27.99) (28.29)
T. ISCED 5A 15.81 15.91 22.80* 22.86* (2nd Degree) (9.55) (9.66) (10.81) (10.90)
T. ISCED 5A 35.31 35.61 9.58 9.47 (2nd D. Missing) (23.06) (21.80) (31.12) (30.55)
School Capacity School Size 0.08** 0.08**
(Continuous) (0.03) (0.03) School Resources -60.41* -61.58*
(Middle level) (28.94) (28.11) School Resources -51.78 -52.72
(High level) (28.17) (27.35) School Resources 0.65 -0.52
(Missing) (40.75) (40.02) Table continues on next page.

291
Selected Independent Variables
Model 1: Student
Model 2: Students by
SES Quintiles
Model 3: Students & Classroom
Model 4: Students,
Classroom & SES Quintiles
Model 5: Students,
Classroom & School
Model 6: Students, Classroom, School
& SES Quintiles
Population -27.75 -27.46 (15K – 50K) (27.31) (27.54)
Population -22.45 -22.53 (50K - 100K) (27.91) (28.06)
Population -19.07* -19.14* (100K-500K) (9.26) (9.32)
Population -2.96 -3.06 (Missing) (17.31) (17.32)
Constant 81.89*** 687.56*** 577.25*** 581.28*** 556.00*** 558.42*** (25.56) (25.68) (36.52) (36.15) (55.15) (54.71) Observations 4966 4966 4966 4966 4643 4643 R-squared 0.05 0.05 0.17 0.17 0.25 0.25 Notes: Standard errors in parentheses. *** p<0.001, ** p<0.01, * p<0.05 SES mean imputed. Middle SES quintile, lowest terciles or observations below 100%, and populations over 500,000 serve as reference categories. Source: IEA – TIMSS 2003.

292
TABLE 63. ESTIMATED OLS COEFFICIENTS OF PISA 2003 MATH ACHIEVEMENT SCORES ON STUDENT CHARACTERISTICS, CLASSROOM RESOURCES, AND SCHOOL CAPACITY IN THE UNITED STATES
Selected Independent Variables
Model 1: Student
Model 2: Students by
SES Quintiles
Model 3: Students & Classroom
Model 4: Students,
Classroom & SES Quintiles
Model 5: Students,
Classroom & School
Model 6: Students, Classroom, School
& SES Quintiles
Student Characteristics SES 45.37*** 37.87*** 36.73*** (1.57) (1.41) (1.61) Low SES -53.63*** -43.60*** -41.08*** (4.62) (4.21) (4.32) Mid-low SES -19.53*** -16.67*** -16.24*** (4.54) (4.36) (4.17) Mid-high SES 28.55*** 22.20*** 21.72*** (4.59) (4.19) (4.21) High SES 65.65*** 55.79*** 54.85*** (4.89) (4.34) (4.45) Female -9.49*** -9.51*** -11.78*** -12.02*** -11.71*** -11.88***
(2.66) (2.60) (2.63) (2.59) (2.61) (2.58) Age 19.96*** 20.26*** -3.79 -4.00 -2.50 -2.72
(4.94) (5.01) (5.59) (5.71) (5.49) (5.58) Classroom Resources
Grade 33.53*** 34.67*** 31.69*** 32.85*** (10th – 12th) (3.49) (3.58) (3.32) (3.41)
Math time -6.35 -7.72 -4.85 -6.27 (Middle tercile) (4.13) (4.47) (4.04) (4.33)
Math time -28.25*** -28.48*** -27.37*** -27.66*** (High tercile) (3.81) (3.97) (3.58) (3.72)
Math time -53.03*** -54.13*** -50.80*** -52.00*** (Missing) (4.26) (4.36) (4.13) (4.20)
Table continues on next page.

293
Selected Independent Variables
Model 1: Student
Model 2: Students by
SES Quintiles
Model 3: Students & Classroom
Model 4: Students,
Classroom & SES Quintiles
Model 5: Students,
Classroom & School
Model 6: Students, Classroom, School
& SES Quintiles
Class size 14.40*** 15.24*** 13.61*** 14.56*** (Middle tercile) (3.63) (3.64) (3.53) (3.52)
Class size 9.20* 10.27* 9.14* 10.39** (High tercile) (4.05) (4.02) (3.90) (3.87)
Class size -32.06*** -28.37*** -31.29*** -27.50*** (Missing) (5.45) (5.63) (5.52) (5.68)
Teacher Certified 14.03** 14.61** 12.00* 12.34* (100 percent) (4.91) (4.94) (4.73) (4.85)
Teacher certified 15.35** 15.11** 18.26*** 17.59** (Missing) (5.18) (5.32) (5.43) (5.50)
T. Math Degree 5.43 5.91 5.09 5.63 (100 percent) (4.60) (4.64) (4.67) (4.74)
T. Math Degree -12.25* -13.28* -4.78 -5.97 (Missing) (5.39) (5.66) (5.35) (5.61)
School Capacity School size 2.90 2.48
(Middle tercile) (5.92) (5.93) School size 11.41 10.15
(High tercile) (6.68) (6.77) School size 14.37 14.76
(Missing) (12.53) (12.83) School resources -0.85 -0.86
(Middle tercile) (4.88) (5.00) School resources 3.88 5.02
(High tercile) (5.22) (5.34) School resources 8.03 7.93
(Missing) (14.04) (14.14) Table continues on next page.

294
Selected Independent Variables
Model 1: Student
Model 2: Students by
SES Quintiles
Model 3: Students & Classroom
Model 4: Students,
Classroom & SES Quintiles
Model 5: Students,
Classroom & School
Model 6: Students, Classroom, School
& SES Quintiles
Population 41.30** 40.89** (below 3K) (14.40) (14.39)
Population 37.47** 37.17** (3K -15K) (12.97) (12.95)
Population 35.44** 35.58** (15K – 100K) (12.43) (12.45)
Population 18.91 19.62 (100K - 1,000K) (12.94) (13.08)
Constant 159.16* 161.65* 518.59*** 527.72*** 462.24*** 471.25*** (78.16) (79.72) (87.89) (90.35) (90.23) (92.12) Observations 5391 5455 5389 5453 5389 5453 R-squared 0.20 0.19 0.29 0.29 0.30 0.30 Notes: Standard errors in parentheses. *** p<0.001, ** p<0.01, * p<0.05 Middle SES quintile, Grades 7-9, lowest terciles or observations below 100%, and populations over 1,000,000 serve as reference categories. Source: OECD – PISA 2003.

295
TABLE 64. ESTIMATED OLS COEFFICIENTS OF TIMSS 2003 MATH ACHIEVEMENT SCORES ON STUDENT CHARACTERISTICS, CLASSROOM RESOURCES, AND SCHOOL CAPACITY IN THE UNITED STATES
Selected Independent Variables
Model 1: Student
Model 2: Students by
SES Quintiles
Model 3: Students & Classroom
Model 4: Students,
Classroom & SES Quintiles
Model 5: Students,
Classroom & School
Model 6: Students, Classroom, School
& SES Quintiles
Student Characteristics SES 34.83*** 29.07*** 27.78*** (1.69) (1.61) (1.69) Low SES -48.87*** -42.31*** -40.88*** (3.69) (3.39) (3.62) Mid-low SES -16.57*** -12.69*** -11.63*** (2.89) (2.59) (2.91) Mid-high SES 23.88*** 20.22*** 18.90*** (3.10) (2.85) (3.14) High SES 48.64*** 37.62*** 35.21*** (3.98) (3.62) (3.90) Female -8.74*** -9.14*** -8.89*** -9.21*** -7.66*** -7.88***
(1.72) (1.74) (1.53) (1.53) (1.62) (1.64) Age -15.92*** -16.90*** 13.66*** -14.36*** -12.22*** -12.69***
(2.18) (2.22) (2.14) (2.19) (2.12) (2.17) Classroom Resources
% Alg. + Geo. 25.06*** 24.77*** 25.11*** 24.71*** (Middle tercile) (3.71) (3.83) (3.73) (3.87)
% Alg. + Geo. 64.16*** 64.19*** 62.67*** 62.64*** (High tercile) (5.58) (5.75) (5.71) (5.85)
% Alg. + Geo. 26.98 27.52 20.90 21.47 (Missing) (14.04) (14.50) (14.41) (14.71)
Table continues on next page.

296
Selected Independent Variables
Model 1: Student
Model 2: Students by
SES Quintiles
Model 3: Students & Classroom
Model 4: Students,
Classroom & SES Quintiles
Model 5: Students,
Classroom & School
Model 6: Students, Classroom, School
& SES Quintiles
Overall Math Time 4.07 4.54 4.33 4.93 (Upper 50%) (5.02) (5.13) (5.35) (5.45)
Class Size -0.66 -0.76 0.25 0.42 (25-32 students) (4.38) (4.48) (5.46) (5.57)
Class Size 2.29 2.69 5.66 6.54 (33+ students) (9.25) (9.41) (9.30) (9.48)
Class Size 6.41 5.82 11.79 11.88 (Missing) (9.33) (9.50) (10.46) (10.62)
T. Math Degree -7.24 -7.90 -7.37 -7.92 (Required) (5.13) (5.24) (5.00) (5.14)
T. Math Degree -5.44 -5.21 -3.76 -4.24 (Missing) (16.71) (16.94) (17.37) (17.52)
T. ISCED 5A -8.08 -7.88 -6.25 -5.99 (2nd Degree) (4.35) (4.46) (4.50) (4.60)
T. ISCED 5A -30.34 -31.49 -16.03 -16.52 (2nd D. Missing) (16.12) (16.51) (16.41) (16.75)
School Capacity School Size 0.01 0.01
(Continuous) (0.01) (0.01) School Resources 0.29 -2.72
(Middle level) (14.17) (13.35) School Resources 7.70 4.95
(High level) (14.38) (13.60) School Resources 0.00 0.00
(Missing) 0.00 0.00 Table continues on next page.

297
Selected Independent Variables
Model 1: Student
Model 2: Students by
SES Quintiles
Model 3: Students & Classroom
Model 4: Students,
Classroom & SES Quintiles
Model 5: Students,
Classroom & School
Model 6: Students, Classroom, School
& SES Quintiles
Population 15.12 15.72 (below 3K) (11.34) (11.52)
Population 4.34 4.12 (3K -15K) (9.44) (9.72)
Population 5.78 5.91 (15K – 50K) (9.42) (9.59)
Population 4.85 5.36 (50K - 100K) (10.44) (10.58)
Population -14.02 -13.96 (100K-500K) (11.17) (11.45)
Population 16.15 17.54 (Missing) (15.26) (16.30)
Constant 734.94*** 747.75*** 681.22*** 691.31*** 644.04*** 653.90*** (31.48) (32.19) (30.41) (31.19) (35.55) (35.47) Observations 8909 8909 8909 8909 7544 7544 R-squared 0.21 0.19 0.30 0.29 0.30 0.29 Notes: Standard errors in parentheses. *** p<0.001, ** p<0.01, * p<0.05 SES mean imputed. Middle SES quintile, lowest terciles or observations below 100%, and populations over 500,000 serve as reference categories. Source: IEA – TIMSS 2003.

298
Appendix 5: Production Function Results for Low GNI Per Capita Countries Participating in Both PISA AND TIMSS

299
TABLE 65. ESTIMATED OLS COEFFICIENTS OF PISA 2003 MATH ACHIEVEMENT SCORES ON STUDENT CHARACTERISTICS, CLASSROOM RESOURCES, AND SCHOOL CAPACITY IN HUNGARY
Selected Independent Variables
Model 1: Student
Model 2: Students by
SES Quintiles
Model 3: Students & Classroom
Model 4: Students,
Classroom & SES Quintiles
Model 5: Students,
Classroom & School
Model 6: Students, Classroom, School
& SES Quintiles
Student Characteristics SES 54.87*** 41.84*** 36.73*** (2.25) (2.38) (2.39) Low SES -70.92*** -53.84*** -46.43*** (6.00) (5.75) (5.54) Mid-low SES -34.05*** -25.34*** -22.71*** (4.36) (3.80) (3.68) Mid-high SES 22.94*** 15.86*** 13.27*** (3.92) (3.57) (3.64) High SES 67.84*** 51.95*** 46.09*** (5.06) (4.41) (4.44) Female -6.12* -6.72** 17.26*** -17.97*** -18.07*** -18.75***
(2.66) (2.57) (2.78) (2.74) (2.79) (2.77) Age 17.51*** 17.41*** -22.16*** -22.84*** -22.77*** -23.30***
(3.80) (3.67) (5.06) (4.92) (5.04) (4.86) Classroom Resources
Grade 45.27*** 45.86*** 44.29*** 44.69*** (10th – 12th) (3.33) (3.24) (3.45) (3.34)
Math time 1.38 1.43 2.38 2.47 (Middle tercile) (4.05) (4.13) (3.90) (3.97)
Math time -7.32 -8.17 -3.59 -4.09 (High tercile) (5.30) (5.40) (5.52) (5.63)
Math time 54.68*** -56.19*** -46.36*** -47.37*** (Missing) (5.46) (5.36) (5.34) (5.32)
Table continues on next page.

300
Selected Independent Variables
Model 1: Student
Model 2: Students by
SES Quintiles
Model 3: Students & Classroom
Model 4: Students,
Classroom & SES Quintiles
Model 5: Students,
Classroom & School
Model 6: Students, Classroom, School
& SES Quintiles
Class size -17.76*** -18.67*** -13.46** -13.99** (Middle tercile) (4.71) (4.69) (4.94) (4.88)
Class size -11.90 -12.38* -11.42 -11.87 (High tercile) (6.20) (6.11) (6.23) (6.17)
Class size -26.30** -27.91*** -15.08 -15.68* (Missing) (8.34) (8.07) (7.76) (7.35)
Teacher Certified 1.77 3.25 -1.81 -0.83 (100 percent) (8.13) (8.33) (9.36) (9.46)
Teacher certified -5.33 -5.05 -8.04 -7.65 (Missing) (15.00) (14.80) (18.07) (17.83)
T. Pedagogy Degree 32.18*** 32.12*** 35.55*** 35.57*** (100 percent) (7.52) (7.67) (8.32) (8.47)
T. Pedagogy Degree 18.07 20.17 12.04 14.30 (Missing) (16.49) (16.49) (17.34) (17.33)
T. Math Degree 22.18* 21.70* 20.90* 20.90* (100 percent) (8.86) (8.99) (9.75) (9.84)
T. Math Degree 15.10 13.67 15.47 14.80 (Missing) (10.65) (10.85) (10.51) (10.68)
School size 19.52** 19.16** (Middle tercile) (6.63) (6.63)
School size 15.05* 15.25* (High tercile) (7.62) (7.61)
School Capacity School size 2.61 -0.71
(Missing) (24.81) (24.64) School resources -5.72 -6.13
(Middle tercile) (8.01) (8.12) Table continues on next page.

301
Selected Independent Variables
Model 1: Student
Model 2: Students by
SES Quintiles
Model 3: Students & Classroom
Model 4: Students,
Classroom & SES Quintiles
Model 5: Students,
Classroom & School
Model 6: Students, Classroom, School
& SES Quintiles
School resources 1.25 1.20 (High tercile) (7.30) (7.34)
School resources -8.20 -9.76 (Missing) (30.92) (31.12)
Population -75.38*** -80.99*** (below 3K) (15.32) (15.42)
Population -27.31* -29.39* (3K -15K) (12.00) (11.90)
Population -6.45 -7.21 (15K – 100K) (9.03) (8.96)
Population -8.52 -9.27 (100K - 1,000K) (9.13) (9.23)
Constant 221.15*** 221.01*** 813.80*** 823.61*** 821.90*** 830.27*** (59.87) (58.08) (79.35) (77.08) (81.74) (78.94) Observations 4743 4764 4743 4764 4743 4764 R-squared 0.27 0.26 0.38 0.37 0.41 0.40 Notes: Standard errors in parentheses. *** p<0.001, ** p<0.01, * p<0.05 Middle SES quintile, Grades 7-9, lowest terciles or observations below 100%, and populations over 1,000,000 serve as reference categories. Source: OECD – PISA 2003.

302
TABLE 66. ESTIMATED OLS COEFFICIENTS OF TIMSS 2003 MATH ACHIEVEMENT SCORES ON STUDENT CHARACTERISTICS, CLASSROOM RESOURCES, AND SCHOOL CAPACITY IN HUNGARY
Selected Independent Variables
Model 1: Student
Model 2: Students by
SES Quintiles
Model 3: Students & Classroom
Model 4: Students,
Classroom & SES Quintiles
Model 5: Students,
Classroom & School
Model 6: Students, Classroom, School
& SES Quintiles
Student Characteristics SES 39.26*** 37.33*** 35.40*** (1.73) (1.76) (1.74) Low SES -55.46*** -52.16*** -50.01*** (5.11) (5.30) (5.15) Mid-low SES -23.18*** -21.41*** -20.42*** (4.32) (4.48) (4.48) Mid-high SES 18.45*** 18.21*** 16.96*** (3.75) (3.72) (3.65) High SES 53.39*** 49.83*** 44.78*** (4.63) (4.82) (5.29) Female -10.14*** -11.17*** -9.94*** -11.02*** -10.06*** -11.12***
(2.78) (2.87) (2.81) (2.89) (2.99) (3.06) Age -25.72*** -29.25*** -25.87*** -29.38*** -26.44*** -29.69***
(3.00) (3.09) (2.86) (2.95) (3.06) (3.13) Classroom Resources
% Alg. + Geo. 2.94 3.10 2.88 2.78 (Middle tercile) (4.57) (4.86) (4.66) (4.94)
% Alg. + Geo. 0.71 0.05 2.13 1.64 (High tercile) (5.74) (6.06) (5.59) (5.82)
% Alg. + Geo. 14.72* 14.20* 14.39* 12.93 (Missing) (6.29) (6.88) (6.74) (7.04)
Table continues on next page.

303
Selected Independent Variables
Model 1: Student
Model 2: Students by
SES Quintiles
Model 3: Students & Classroom
Model 4: Students,
Classroom & SES Quintiles
Model 5: Students,
Classroom & School
Model 6: Students, Classroom, School
& SES Quintiles
Overall Math Time 9.43* 5.01 11.14* 7.28 (Upper 50%) (4.72) (5.05) (4.40) (4.68)
Class Size 8.49 9.65 6.95 7.57 (25-32 students) (5.33) (5.58) (6.29) (6.64)
Class Size 20.20 22.34 15.10 16.14 (33+ students) (15.45) (15.92) (12.71) (13.51)
Class Size -3.83 -9.49 -8.95 -15.30 (Missing) (12.49) (12.07) (13.84) (12.63)
T. Math Degree -0.59 -7.80 -2.26 -8.98 (Required) (11.49) (44.93) (25.52) (55.72)
T. Math Degree 0.00 0.00 0.00 0.00 (Missing) (18.46) (49.64) (11.43) (48.15)
T. ISCED 5A 15.36** 16.03** 11.74 11.82 (2nd Degree) (5.75) (5.94) (6.22) (6.40)
T. ISCED 5A 0.00 0.00 0.00 0.00 (2nd D. Missing) (0.00) (0.00) (0.00) (0.00)
School Capacity School Size 0.00 0.00
(Continuous) (0.01) (0.01) School Resources -5.72 -10.63
(Middle level) (9.50) (10.14) School Resources -5.80 -9.28
(High level) (9.68) (10.39) School Resources 5.93 2.19
(Missing) (15.63) (15.01) Population -20.26 -25.02*
(below 3K) (11.29) (11.91) Table continues on next page.

304
Selected Independent Variables
Model 1: Student
Model 2: Students by
SES Quintiles
Model 3: Students & Classroom
Model 4: Students,
Classroom & SES Quintiles
Model 5: Students,
Classroom & School
Model 6: Students, Classroom, School
& SES Quintiles
Population -18.42 -22.06 (3K -15K) (12.50) (12.80)
Population -6.49 -7.48 (15K – 50K) (11.59) (11.77)
Population -5.08 -5.46 (50K - 100K) (14.06) (14.37)
Population -7.83 -8.57 (100K-500K) (12.36) (12.76)
Population 0.00 0.00 (Missing) (0.00) (0.00)
Constant 909.37*** 962.28*** 901.32*** 962.25*** 925.94*** 990.22*** (43.49) (44.93) (40.88) (62.43) (48.91) (73.32) Observations 3329 3329 3329 3329 3139 3139 R-squared 0.30 0.27 0.31 0.28 0.32 0.30 Notes: Standard errors in parentheses. *** p<0.001, ** p<0.01, * p<0.05 SES mean imputed. Middle SES quintile, lowest terciles or observations below 100%, and populations over 500,000 serve as reference categories. Source: IEA – TIMSS 2003.

305
TABLE 67. ESTIMATED OLS COEFFICIENTS OF PISA 2003 MATH ACHIEVEMENT SCORES ON STUDENT CHARACTERISTICS, CLASSROOM RESOURCES, AND SCHOOL CAPACITY IN THE SLOVAK REPUBLIC
Selected Independent Variables
Model 1: Student
Model 2: Students by
SES Quintiles
Model 3: Students & Classroom
Model 4: Students,
Classroom & SES Quintiles
Model 5: Students,
Classroom & School
Model 6: Students, Classroom, School
& SES Quintiles
Student Characteristics SES 53.18*** 40.56*** 37.84*** (2.62) (2.44) (2.36) Low SES -67.43*** -49.96*** -46.43*** (4.77) (4.42) (4.21) Mid-low SES -20.43*** -15.09*** -12.80*** (3.76) (3.59) (3.52) Mid-high SES 26.12*** 21.72*** 21.21*** (4.23) (3.78) (3.74) High SES 56.04*** 42.76*** 39.51*** (4.93) (4.15) (4.07) Female 16.86*** -17.01*** 22.19*** -22.51*** -21.53*** -21.78***
(3.12) (3.16) (2.75) (2.79) (2.65) (2.65) Age 2.29 2.18 -26.66*** -28.77*** -28.60*** -30.65***
(6.93) (7.05) (7.34) (7.30) (7.33) (7.30) Classroom Resources
Grade 23.73** 27.34** 30.24** 33.32*** (10th – 12th) (8.38) (8.66) (9.36) (9.70)
Math time -23.83*** -23.85*** -23.80*** -23.95*** (Middle tercile) (4.61) (4.52) (4.60) (4.59)
Math time -14.62** -13.64** -13.77** -13.06** (High tercile) (4.48) (4.64) (4.60) (4.77)
Math time -67.34*** -67.35*** -66.01*** -66.03*** (Missing) (4.81) (4.80) (4.55) (4.57)
Table continues on next page.

306
Selected Independent Variables
Model 1: Student
Model 2: Students by
SES Quintiles
Model 3: Students & Classroom
Model 4: Students,
Classroom & SES Quintiles
Model 5: Students,
Classroom & School
Model 6: Students, Classroom, School
& SES Quintiles
Class size 18.31*** -18.71*** -13.09** -13.01** (Middle tercile) (4.39) (4.48) (4.64) (4.69)
Class size 12.47** 12.87** 9.11* 9.45* (High tercile) (4.40) (4.48) (4.49) (4.59)
Class size -16.83 -16.5 -22.02* -21.86* (Missing) (12.79) (12.75) (11.16) (10.81)
Teacher Certified 29.50*** 30.63*** 29.49*** 30.92*** (Middle tercile) (7.65) (7.74) (8.28) (8.32)
Teacher Certified 14.20 14.35 14.11 14.53 (High tercile) (7.58) (7.60) (7.46) (7.50)
Teacher certified 18.51* 19.85* 21.59* 23.20** (Missing) (8.58) (8.76) (8.60) (8.71)
T. Pedagogy Degree 14.24* 15.27* 13.07 14.24* (Middle tercile) (6.75) (6.82) (6.83) (6.85)
T. Pedagogy Degree 3.21 5.57 5.76 7.99 (High tercile) (6.99) (7.48) (7.56) (8.01)
T. Pedagogy Degree 11.76 12.39 9.26 9.67 (Missing) (13.84) (14.02) (13.51) (13.72)
T. Math Degree 16.34** 17.26** 13.83* 14.62* (100 percent) (6.03) (6.12) (6.14) (6.16)
T. Math Degree 17.09 17.28 19.14* 19.70* (Missing) (8.86) (9.17) (8.83) (8.92)
School Capacity School size -8.89 -8.45
(Middle tercile) (7.24) (7.27) School size -2.07 -1.01
(High tercile) (5.74) (5.79) Table continues on next page.
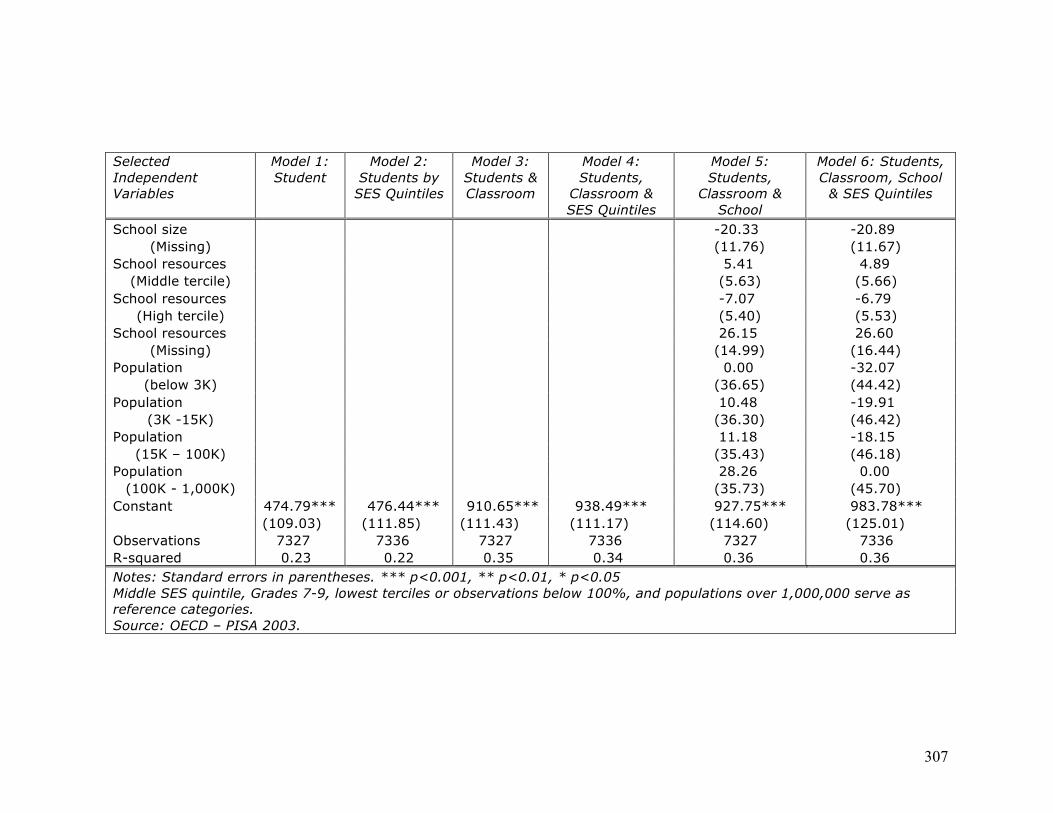
307
Selected Independent Variables
Model 1: Student
Model 2: Students by
SES Quintiles
Model 3: Students & Classroom
Model 4: Students,
Classroom & SES Quintiles
Model 5: Students,
Classroom & School
Model 6: Students, Classroom, School
& SES Quintiles
School size -20.33 -20.89 (Missing) (11.76) (11.67)
School resources 5.41 4.89 (Middle tercile) (5.63) (5.66)
School resources -7.07 -6.79 (High tercile) (5.40) (5.53)
School resources 26.15 26.60 (Missing) (14.99) (16.44)
Population 0.00 -32.07 (below 3K) (36.65) (44.42)
Population 10.48 -19.91 (3K -15K) (36.30) (46.42)
Population 11.18 -18.15 (15K – 100K) (35.43) (46.18)
Population 28.26 0.00 (100K - 1,000K) (35.73) (45.70)
Constant 474.79*** 476.44*** 910.65*** 938.49*** 927.75*** 983.78*** (109.03) (111.85) (111.43) (111.17) (114.60) (125.01) Observations 7327 7336 7327 7336 7327 7336 R-squared 0.23 0.22 0.35 0.34 0.36 0.36 Notes: Standard errors in parentheses. *** p<0.001, ** p<0.01, * p<0.05 Middle SES quintile, Grades 7-9, lowest terciles or observations below 100%, and populations over 1,000,000 serve as reference categories. Source: OECD – PISA 2003.

308
TABLE 68. ESTIMATED OLS COEFFICIENTS OF TIMSS 2003 MATH ACHIEVEMENT SCORES ON STUDENT CHARACTERISTICS, CLASSROOM RESOURCES, AND SCHOOL CAPACITY IN THE SLOVAK REPUBLIC
Selected Independent Variables
Model 1: Student
Model 2: Students by
SES Quintiles
Model 3: Students & Classroom
Model 4: Students,
Classroom & SES Quintiles
Model 5: Students,
Classroom & School
Model 6: Students, Classroom, School
& SES Quintiles
Student Characteristics SES 38.95*** 38.06*** 35.90*** -53.61*** (1.58) (1.63) (1.75) (4.64) Low SES -55.96*** -55.39*** -15.04*** (4.78) (4.62) (3.77) Mid-low SES -15.85*** -15.93*** 21.64*** (3.84) (3.79) (4.81) Mid-high SES 24.27*** 23.78*** 46.04*** (4.63) (4.60) (4.69) High SES 53.23*** 50.87*** -2.99 (4.63) (4.36) (3.45) Female -2.83 -2.85 -3.69 -3.72 -2.99 -29.67***
(3.38) (3.38) (3.40) (3.41) (3.46) (3.69) Age -27.20*** -29.30*** 27.75*** -29.74*** -27.79*** -53.61***
(3.65) (3.70) (3.68) (3.72) (3.63) (4.64) Classroom Resources % Alg. + Geo. 3.96 4.74 4.07 4.27
(Middle tercile) (5.72) (5.93) (5.82) (5.96) % Alg. + Geo. 7.30 7.44 6.03 5.62
(High tercile) (6.67) (6.84) (6.88) (7.03) % Alg. + Geo. -1.11 -1.46 -1.90 -3.25
(Missing) (10.12) (11.29) (13.10) (14.94) Table continues on next page.

309
Selected Independent Variables
Model 1: Student
Model 2: Students by
SES Quintiles
Model 3: Students & Classroom
Model 4: Students,
Classroom & SES Quintiles
Model 5: Students,
Classroom & School
Model 6: Students, Classroom, School
& SES Quintiles
Overall Math Time 11.67* 10.76 11.85* 11.46 (Upper 50%) (5.47) (5.59) (5.91) (5.98)
Overall Math Time 0.00 0.00 0.00 0.00 (Missing) 0.00 0.00 0.00 0.00
Class Size 6.83 7.06 4.48 4.80 (25-32 students) (5.39) (5.51) (5.98) (6.12)
Class Size 36.04* 38.64** 35.95* 38.94* (33+ students) (14.22) (14.63) (15.45) (15.86)
Class Size 11.94 13.22 40.69 45.09 (Missing) (18.29) (20.77) (32.07) (37.93)
T. Math Degree 10.78 12.89 -0.54 0.60 (Required) (24.19) (24.52) (24.07) (24.91)
T. Math Degree 35.09*** 34.44*** 33.84*** 32.58** (Missing) (6.57) (6.97) (9.74) (9.95)
T. ISCED 5A -15.01* -16.27* -12.52 -13.36 (2nd Degree) (7.52) (7.67) (7.48) (7.69)
T. ISCED 5A -54.46 -59.60 -54.34 -58.31 (2nd D. Missing) (49.99) (55.02) (52.32) (56.26)
School Capacity School Size 0.02 0.01
(Continuous) (0.01) (0.01) School Resources -9.32 -9.23
(Middle level) (9.59) (9.53) School Resources -10.09 -10.51
(High level) (11.60) (11.65) School Resources -3.76 -2.26
(Missing) (19.48) (19.84) Table continues on next page.

310
Selected Independent Variables
Model 1: Student
Model 2: Students by
SES Quintiles
Model 3: Students & Classroom
Model 4: Students,
Classroom & SES Quintiles
Model 5: Students,
Classroom & School
Model 6: Students, Classroom, School
& SES Quintiles
Population 1.58 -2.56 (below 3K) (37.15) (38.23)
Population -6.14 -10.37 (3K -15K) (37.41) (38.54)
Population 10.22 7.65 (15K – 50K) (36.69) (37.87)
Population 14.76 14.01 (50K - 100K) (37.58) (38.74)
Population 10.93 10.93 (100K-500K) (36.26) (37.24)
Population 54.91 56.87 (Missing) (42.41) (44.72)
Constant 904.70*** 933.06*** 900.19*** 927.63*** 896.37*** 927.30*** (52.58) (52.96) (53.14) (53.71) (63.24) (64.42) Observations 4215 4215 4215 4215 4190 4190 R-squared 0.24 0.23 0.27 0.25 0.28 0.27 Notes: Standard errors in parentheses. *** p<0.001, ** p<0.01, * p<0.05 SES mean imputed. Middle SES quintile, lowest terciles or observations below 100%, and populations over 500,000 serve as reference categories. Source: IEA – TIMSS 2003.

311
TABLE 69. ESTIMATED OLS COEFFICIENTS OF PISA 2003 MATH ACHIEVEMENT SCORES ON STUDENT CHARACTERISTICS, CLASSROOM RESOURCES, AND SCHOOL CAPACITY IN LATVIA
Selected Independent Variables
Model 1: Student
Model 2: Students by
SES Quintiles
Model 3: Students & Classroom
Model 4: Students,
Classroom & SES Quintiles
Model 5: Students,
Classroom & School
Model 6: Students, Classroom, School
& SES Quintiles
Student Characteristics SES 37.66*** 31.00*** 30.54*** (2.28) (2.20) (2.28) Low SES -33.64*** -25.05*** -23.66*** (4.73) (4.15) (4.19) Mid-low SES -7.61 -5.99 -5.26 (5.00) (4.71) (4.71) Mid-high SES 23.15*** 19.48*** 19.40*** (4.94) (4.88) (4.86) High SES 43.71*** 38.61*** 38.78*** (5.92) (5.40) (5.33) Female -2.85 -2.26 -6.08 -6.05 -6.61 -6.51
(3.97) (3.97) (3.84) (3.79) (3.84) (3.78) Age 21.04** 21.31*** 21.19*** 21.81*** 20.23*** 20.78***
(6.45) (6.23) (5.47) (5.36) (4.91) (4.83) Classroom Resources
Math time 12.44* 12.85* 12.27* 12.85* (Middle tercile) (5.09) (5.32) (4.92) (5.14)
Math time 9.89* 10.04* 9.01 9.27 (High tercile) (5.01) (5.09) (4.80) (4.94)
Math time -24.90*** -26.19*** -25.19*** -26.36*** (Missing) (6.40) (6.38) (6.30) (6.23)
Class size 13.36* 14.25* 7.33 7.35 (Middle tercile) (6.56) (6.34) (5.96) (5.97)
Table continues on next page.

312
Selected Independent Variables
Model 1: Student
Model 2: Students by
SES Quintiles
Model 3: Students & Classroom
Model 4: Students,
Classroom & SES Quintiles
Model 5: Students,
Classroom & School
Model 6: Students, Classroom, School
& SES Quintiles
Class size 22.40** 23.93*** 12.87 12.98 (High tercile) (6.97) (6.79) (6.93) (6.96)
Class size -33.18*** -34.01*** -36.14*** -37.45*** (Missing) (9.52) (9.32) (9.09) (8.84)
Teacher Certified 4.62 4.34 3.81 3.54 (Middle tercile) (7.26) (7.33) (7.05) (7.10)
Teacher Certified 2.11 2.08 1.41 1.25 (High tercile) (7.01) (7.00) (7.45) (7.42)
Teacher certified -7.41 -7.42 -9.54 -9.73 (Missing) (12.34) (12.28) (10.83) (10.83)
T. Pedagogy Degree 0.09 0.58 -1.37 -0.88 (Middle tercile) (7.98) (7.96) (8.11) (8.08)
T. Pedagogy Degree 10.6 11.04 7.18 7.66 (High tercile) (8.04) (8.02) (8.32) (8.26)
T. Pedagogy Degree -3.96 -4.24 -8.34 -8.58 (Missing) (14.62) (14.29) (11.92) (11.67)
T. Math Degree 6.15 6.05 7.32 7.57 (100 percent) (9.80) (9.62) (9.44) (9.20)
T. Math Degree -7.45 -7.21 -5.25 -4.59 (Missing) (8.43) (8.31) (8.92) (8.69)
School Capacity School size 10.91 12.11
(Middle tercile) (9.89) (9.68) School size 24.25* 25.17*
(High tercile) (11.33) (11.16) School size 32.37 33.22
(Missing) (18.47) (18.27) Table continues on next page.

313
Selected Independent Variables
Model 1: Student
Model 2: Students by
SES Quintiles
Model 3: Students & Classroom
Model 4: Students,
Classroom & SES Quintiles
Model 5: Students,
Classroom & School
Model 6: Students, Classroom, School
& SES Quintiles
School resources -5.13 -5.46 (Middle tercile) (6.84) (6.78)
School resources 1.57 1.08 (High tercile) (9.98) (9.82)
School resources 0.00 0.00 (Missing) (0.00) (0.00)
Population 0.00 0.00 (below 3K) (10.07) (9.11)
Population -5.98 -5.30 (3K -15K) (11.06) (9.97)
Population -0.18 0.94 (15K – 100K) (12.63) (10.87)
Population -10.33 -8.48 (100K - 1,000K) (13.18) (12.07)
Constant 146.96 142.61 133.40 121.97 149.26 137.31 (100.99) (97.37) (85.11) (83.90) (77.03) (77.65) Observations 4595 4626 4595 4626 4595 4626 R-squared 0.11 0.10 0.17 0.17 0.18 0.18 Notes: Standard errors in parentheses. *** p<0.001, ** p<0.01, * p<0.05 Middle SES quintile, Grades 7-9, lowest terciles or observations below 100%, and populations over 1,000,000 serve as reference categories. Source: OECD – PISA 2003.

314
TABLE 70. ESTIMATED OLS COEFFICIENTS OF TIMSS 2003 MATH ACHIEVEMENT SCORES ON STUDENT CHARACTERISTICS, CLASSROOM RESOURCES, AND SCHOOL CAPACITY IN LATVIA
Selected Independent Variables
Model 1: Student
Model 2: Students by
SES Quintiles
Model 3: Students & Classroom
Model 4: Students,
Classroom & SES Quintiles
Model 5: Students,
Classroom & School
Model 6: Students, Classroom, School
& SES Quintiles
Student Characteristics SES 20.21*** 19.41*** 19.62*** (1.92) (1.88) (1.79) Low SES -24.75*** -23.23*** -21.45*** (4.89) (4.86) (5.16) Mid-low SES -11.69* -11.15* -9.37 (5.15) (5.22) (5.39) Mid-high SES 9.68* 9.95* 11.87* (4.74) (4.74) (5.22) High SES 34.15*** 32.86*** 35.10*** (5.51) (5.42) (5.44) Female 4.19 4.27 3.97 4.03 3.64 3.83
(2.82) (2.81) (2.78) (2.76) (2.83) (2.83) Age -24.57*** -25.55*** 23.33*** -24.31*** -24.33*** -25.46***
(3.67) (3.62) (3.48) (3.45) (3.44) (3.43) Classroom Resources
% Alg. + Geo. 3.86 4.00 1.69 1.66 (Middle tercile) (7.08) (7.27) (7.18) (7.32)
% Alg. + Geo. 12.68 12.17 10.71 10.15 (High tercile) (9.35) (9.45) (9.76) (9.86)
% Alg. + Geo. -2.55 -2.27 -10.04 -9.94 (Missing) (11.69) (11.90) (11.14) (11.32)
Table continues on next page.

315
Selected Independent Variables
Model 1: Student
Model 2: Students by
SES Quintiles
Model 3: Students & Classroom
Model 4: Students,
Classroom & SES Quintiles
Model 5: Students,
Classroom & School
Model 6: Students, Classroom, School
& SES Quintiles
Overall Math Time -0.99 -2.45 0.66 -0.90 (Upper 50%) (4.38) (4.47) (4.98) (5.10)
Class Size 12.14* 12.85* 6.06 6.42 (25-32 students) (5.83) (5.92) (9.47) (9.57)
Class Size 6.91 7.57 11.14 10.89 (33+ students) (8.94) (8.81) (18.80) (18.81)
Class Size 11.91 12.13 3.21 3.00 (Missing) (13.45) (13.63) (14.67) (14.83)
T. Math Degree -7.99 -7.80 -1.79 -1.53 (Required) (7.50) (7.59) (7.73) (7.85)
T. Math Degree -18.32 -17.64 -4.41 -3.50 (Missing) (12.48) (12.01) (12.72) (13.01)
T. ISCED 5A 0.00 0.00 0.00 0.00 (2nd Degree) 0.00 0.00 0.00 0.00
T. ISCED 5A 15.57 15.19 18.33 17.84 (2nd D. Missing) (13.99) (13.72) (13.94) (14.12)
School Capacity School Size 0.00 0.00
(Continuous) (0.01) (0.01) School Resources 20.62* 19.55
(Middle level) (10.42) (10.19) School Resources 17.78 17.01
(High level) (14.76) (14.84) School Resources 13.94 14.52
(Missing) (22.92) (22.96) Table continues on next page.

316
Selected Independent Variables
Model 1: Student
Model 2: Students by
SES Quintiles
Model 3: Students & Classroom
Model 4: Students,
Classroom & SES Quintiles
Model 5: Students,
Classroom & School
Model 6: Students, Classroom, School
& SES Quintiles
Population -7.37 -6.19 (below 3K) (11.68) (12.10)
Population 1.52 2.29 (3K -15K) (9.63) (9.83)
Population 13.70 14.32 (15K – 50K) (10.90) (10.98)
Population 0.61 0.32 (50K - 100K) (12.54) (13.17)
Population 34.29** 35.22** (100K-500K) (13.23) (13.38)
Population 0.00 0.00 (Missing) 0.00 0.00
Constant 878.25*** 891.34*** 855.33*** 868.19*** 853.20*** 866.24*** (54.84) (53.34) (51.77) (50.82) (58.99) (58.64) Observations 3652 3652 3652 3652 3347 3347 R-squared 0.12 0.12 0.14 0.14 0.16 0.16 Notes: Standard errors in parentheses. *** p<0.001, ** p<0.01, * p<0.05 SES mean imputed. Middle SES quintile, lowest terciles or observations below 100%, and populations over 500,000 serve as reference categories. Source: IEA – TIMSS 2003.

317
TABLE 71. ESTIMATED OLS COEFFICIENTS OF PISA 2003 MATH ACHIEVEMENT SCORES ON STUDENT CHARACTERISTICS, CLASSROOM RESOURCES, AND SCHOOL CAPACITY IN THE RUSSIAN FEDERATION
Selected Independent Variables
Model 1: Student
Model 2: Students by
SES Quintiles
Model 3: Students & Classroom
Model 4: Students,
Classroom & SES Quintiles
Model 5: Students,
Classroom & School
Model 6: Students, Classroom, School
& SES Quintiles
Student Characteristics SES 38.77*** 31.21*** 27.46*** (2.28) (2.38) (2.47) Low SES -28.83*** -20.13*** -17.43*** (3.62) (3.42) (3.52) Mid-low SES -7.80* -6.19 -5.24 (3.68) (3.17) (3.23) Mid-high SES 21.29*** 19.33*** 17.73*** (5.29) (4.70) (4.47) High SES 52.10*** 44.01*** 38.53*** (5.36) (5.15) (5.01) Female -7.80 -7.90 -11.60** -11.75** -12.87*** -13.05***
(4.09) (4.12) (3.77) (3.81) (3.45) (3.48) Age 4.25 4.77 -20.87*** -21.33*** -18.97*** -19.25***
(5.60) (5.53) (5.04) (5.03) (5.26) (5.29) Classroom Resources
Grade 36.06*** 37.22*** 34.61*** 35.51*** (10th – 12th) (4.96) (5.00) (5.07) (5.15)
Math time 25.06*** 25.43*** 24.00*** 24.29*** (Middle tercile) (5.10) (5.14) (4.53) (4.57)
Math time 32.10*** 32.31*** 32.10*** 32.25*** (High tercile) (4.75) (4.76) (4.56) (4.55)
Math time -42.34*** -44.64*** -42.58*** -44.86*** (Missing) (6.39) (6.72) (6.49) (6.85)
Table continues on next page.

318
Selected Independent Variables
Model 1: Student
Model 2: Students by
SES Quintiles
Model 3: Students & Classroom
Model 4: Students,
Classroom & SES Quintiles
Model 5: Students,
Classroom & School
Model 6: Students, Classroom, School
& SES Quintiles
Class size 10.64** 11.02** -0.16 -0.27 (Middle tercile) (4.00) (4.05) (4.24) (4.29)
Class size 6.54 7.32 -3.54 -3.39 (High tercile) (7.12) (7.22) (6.35) (6.49)
Class size -16.12 -16.9 -21.55 -22.48 (Missing) (15.06) (14.33) (14.39) (13.76)
Teacher Certified 4.73 4.77 2.13 2.13 (100 percent) (7.42) (7.51) (7.22) (7.32)
Teacher certified -40.20** -40.93** -30.13 -30.61 (Missing) (15.21) (15.49) (19.40) (19.67)
T. Pedagogy Degree 1.93 2.28 1.17 1.28 (Middle tercile) (9.36) (9.41) (8.11) (8.17)
T. Pedagogy Degree 6.05 6.53 2.89 3.11 (High tercile) (7.75) (7.83) (7.34) (7.41)
T. Pedagogy Degree 56.70*** 58.73*** 41.71* 43.09* (Missing) (12.49) (12.44) (17.78) (17.76)
T. Math Degree -10.62 -10.80 -9.25 -9.42 (100 percent) (7.09) (7.19) (7.87) (7.97)
T. Math Degree -0.12 0.07 4.46 4.98 (Missing) (19.14) (19.46) (22.52) (22.85)
School Capacity School size 21.79* 22.26**
(Middle tercile) (8.53) (8.59) School size 25.43** 25.53**
(High tercile) (9.14) (9.29) School size 13.88 13.86
(Missing) (11.33) (11.32) Table continues on next page.

319
Selected Independent Variables
Model 1: Student
Model 2: Students by
SES Quintiles
Model 3: Students & Classroom
Model 4: Students,
Classroom & SES Quintiles
Model 5: Students,
Classroom & School
Model 6: Students, Classroom, School
& SES Quintiles
School resources 1.10 0.99 (Middle tercile) (7.20) (7.35)
School resources 17.75 17.83 (High tercile) (11.11) (11.22)
School resources 39.54* 40.35* (Missing) (19.07) (19.06)
Population -21.06 -22.80 (below 3K) (13.85) (13.98)
Population -31.98** -32.40** (3K -15K) (9.96) (10.12)
Population -22.02* -22.88* (15K – 100K) (10.94) (11.08)
Population -25.37* -25.51* (100K - 1,000K) (11.72) (11.96)
Constant 408.87*** 390.90*** 766.24*** 762.91*** 746.32*** 742.28*** (87.66) (86.57) (79.82) (80.00) (80.98) (81.95) Observations 5959 5973 5959 5973 5959 5973 R-squared 0.10 0.10 0.19 0.19 0.22 0.22 Notes: Standard errors in parentheses. *** p<0.001, ** p<0.01, * p<0.05 Middle SES quintile, Grades 7-9, lowest terciles or observations below 100%, and populations over 1,000,000 serve as reference categories. Source: OECD – PISA 2003.

320
TABLE 72. ESTIMATED OLS COEFFICIENTS OF TIMSS 2003 MATH ACHIEVEMENT SCORES ON STUDENT CHARACTERISTICS, CLASSROOM RESOURCES, AND SCHOOL CAPACITY IN THE RUSSIAN FEDERATION
Selected Independent Variables
Model 1: Student
Model 2: Students by
SES Quintiles
Model 3: Students & Classroom
Model 4: Students,
Classroom & SES Quintiles
Model 5: Students,
Classroom & School
Model 6: Students, Classroom, School
& SES Quintiles
Student Characteristics SES 24.68*** 24.08*** 22.23*** (1.78) (1.91) (1.75) Low SES -36.92*** -35.77*** -32.94*** (3.81) (3.60) (3.51) Mid-low SES -14.92*** -14.17*** -12.47** (3.91) (4.03) (3.86) Mid-high SES 13.74*** 13.37*** 12.04** (3.88) (3.90) (3.83) High SES 32.07*** 31.16*** 27.76*** (4.50) (4.47) (4.29) Female 1.23 1.21 1.45 1.50 0.53 1.23
(2.61) (2.66) (2.59) (2.65) (2.46) (2.61) Age -15.79*** -16.95*** -16.20*** -17.18*** -15.38*** -15.79***
(3.47) (3.45) (3.24) (3.23) (3.33) (3.47) Classroom Resources
% Alg. + Geo. 5.35 6.03 6.00 6.51 (Middle tercile) (5.93) (5.97) (6.13) (6.19)
% Alg. + Geo. -2.39 -1.37 -2.89 -1.90 (High tercile) (6.87) (6.90) (6.43) (6.40)
% Alg. + Geo. 40.28 41.72 44.34 45.43 (Missing) (28.90) (29.78) (29.09) (29.56)
Table continues on next page.
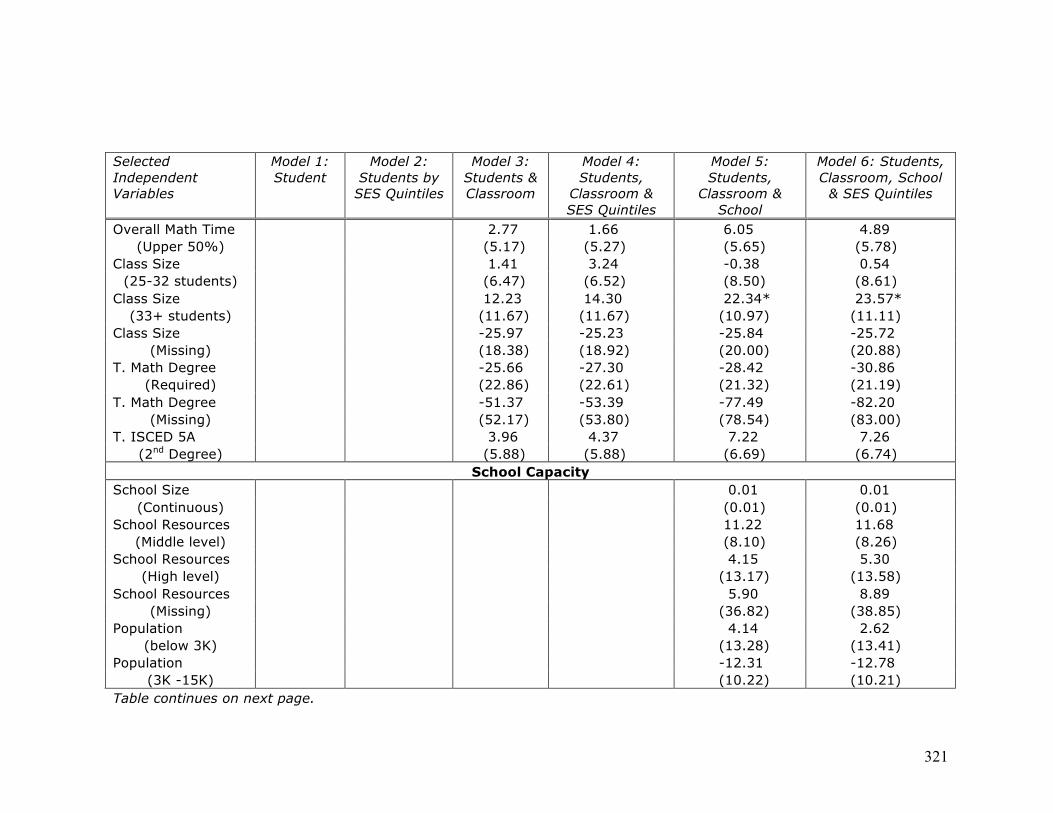
321
Selected Independent Variables
Model 1: Student
Model 2: Students by
SES Quintiles
Model 3: Students & Classroom
Model 4: Students,
Classroom & SES Quintiles
Model 5: Students,
Classroom & School
Model 6: Students, Classroom, School
& SES Quintiles
Overall Math Time 2.77 1.66 6.05 4.89 (Upper 50%) (5.17) (5.27) (5.65) (5.78)
Class Size 1.41 3.24 -0.38 0.54 (25-32 students) (6.47) (6.52) (8.50) (8.61)
Class Size 12.23 14.30 22.34* 23.57* (33+ students) (11.67) (11.67) (10.97) (11.11)
Class Size -25.97 -25.23 -25.84 -25.72 (Missing) (18.38) (18.92) (20.00) (20.88)
T. Math Degree -25.66 -27.30 -28.42 -30.86 (Required) (22.86) (22.61) (21.32) (21.19)
T. Math Degree -51.37 -53.39 -77.49 -82.20 (Missing) (52.17) (53.80) (78.54) (83.00)
T. ISCED 5A 3.96 4.37 7.22 7.26 (2nd Degree) (5.88) (5.88) (6.69) (6.74)
School Capacity School Size 0.01 0.01
(Continuous) (0.01) (0.01) School Resources 11.22 11.68
(Middle level) (8.10) (8.26) School Resources 4.15 5.30
(High level) (13.17) (13.58) School Resources 5.90 8.89
(Missing) (36.82) (38.85) Population 4.14 2.62
(below 3K) (13.28) (13.41) Population -12.31 -12.78
(3K -15K) (10.22) (10.21) Table continues on next page.

322
Selected Independent Variables
Model 1: Student
Model 2: Students by
SES Quintiles
Model 3: Students & Classroom
Model 4: Students,
Classroom & SES Quintiles
Model 5: Students,
Classroom & School
Model 6: Students, Classroom, School
& SES Quintiles
Population -13.76 -14.23 (15K – 50K) (9.96) (10.03)
Population -19.02* -19.97* (50K - 100K) (9.61) (9.71)
Population 4.48 4.58 (100K-500K) (9.55) (9.67)
Population -2.24 -1.94 (Missing) (29.54) (29.88)
Constant 732.96*** 750.54*** 757.20*** 772.25*** 732.41*** 746.18*** (49.10) (48.46) (50.21) (50.16) (52.04) (51.18) Observations 4678 4678 4678 4678 4606 4606 R-squared 0.14 0.13 0.16 0.15 0.18 0.17 Notes: Standard errors in parentheses. *** p<0.001, ** p<0.01, * p<0.05 SES mean imputed. Middle SES quintile, lowest terciles or observations below 100%, and populations over 500,000 serve as reference categories. Source: IEA – TIMSS 2003.

323
TABLE 73. ESTIMATED OLS COEFFICIENTS OF PISA 2003 MATH ACHIEVEMENT SCORES ON STUDENT CHARACTERISTICS, CLASSROOM RESOURCES, AND SCHOOL CAPACITY IN TUNISIA
Selected Independent Variables
Model 1: Student
Model 2: Students by
SES Quintiles
Model 3: Students & Classroom
Model 4: Students,
Classroom & SES Quintiles
Model 5: Students,
Classroom & School
Model 6: Students, Classroom, School
& SES Quintiles
Student Characteristics SES 24.09*** 9.94*** 9.37*** (2.40) (1.44) (1.34) Low SES -15.68*** -3.77 -2.51 (4.53) (3.65) (3.48) Mid-low SES -13.27*** -4.12 -3.35 (3.88) (3.10) (3.01) Mid-high SES 19.71*** 7.98** 7.73** (3.76) (3.01) (2.96) High SES 61.71*** 26.10*** 25.19*** (7.66) (4.31) (3.95) Female -12.11*** -11.67*** -22.08*** -21.95*** -22.04*** -21.89***
(2.25) (2.34) (1.92) (1.96) (1.93) (1.96) Age 9.22* 6.80 -2.53 -3.88 -3.01 -4.31
(4.64) (4.74) (3.67) (3.64) (3.63) (3.61) Classroom Resources
Grade 89.11*** 89.72*** 86.09*** 86.59*** (10th – 12th) (4.51) (4.47) (4.72) (4.71)
Math time -5.49 -5.86 -4.68 -5.00 (Middle tercile) (3.89) (3.91) (3.99) (4.01)
Math time 14.10*** -14.34*** -13.45*** -13.63*** (High tercile) (3.91) (3.94) (3.99) (3.98)
Math time 26.64*** -27.35*** -26.72*** -27.40*** (Missing) (3.87) (3.86) (3.82) (3.80)
Table continues on next page.

324
Selected Independent Variables
Model 1: Student
Model 2: Students by
SES Quintiles
Model 3: Students & Classroom
Model 4: Students,
Classroom & SES Quintiles
Model 5: Students,
Classroom & School
Model 6: Students, Classroom, School
& SES Quintiles
Class size -12.40** -12.82** -12.32** -12.70** (Middle tercile) (4.24) (4.25) (4.11) (4.10)
Class size -17.99*** -18.26*** -19.36*** -19.69*** (High tercile) (4.62) (4.62) (4.53) (4.53)
Class size -24.01*** -24.71*** -24.56*** -25.27*** (Missing) (4.11) (4.12) (3.85) (3.87)
Teacher Certified 1.27 2.10 0.38 1.31 (100 percent) (6.22) (6.32) (6.34) (6.45)
Teacher certified 4.91 5.20 4.11 4.47 (Missing) (5.83) (5.92) (5.72) (5.82)
T. Math Degree -1.24 -1.62 0.00 -0.22 (100 percent) (3.89) (3.85) (4.05) (4.06)
T. Math Degree -10.43 -9.64 -11.32 -10.84 (Missing) (9.94) (10.06) (10.33) (10.47)
School Capacity School size -4.92 -5.18
(Middle tercile) (5.37) (5.45) School size 2.95 2.71
(High tercile) (6.23) (6.31) School size -10.69 -10.56
(Missing) (12.70) (12.55) School resources 2.80 2.37
(Middle tercile) (5.68) (5.69) School resources -3.63 -4.16
(High tercile) (5.16) (5.18) School resources 0.00 0.00
(Missing) 0.00 0.00 Table continues on next page.

325
Selected Independent Variables
Model 1: Student
Model 2: Students by
SES Quintiles
Model 3: Students & Classroom
Model 4: Students,
Classroom & SES Quintiles
Model 5: Students,
Classroom & School
Model 6: Students, Classroom, School
& SES Quintiles
Population -7.21 -8.70 (below 3K) (12.02) (12.10)
Population -7.17 -8.72 (3K -15K) (9.95) (10.16)
Population 1.54 0.77 (15K – 100K) (10.56) (10.81)
Population -1.80 -2.05 (100K - 1,000K) (12.54) (12.74)
Constant 251.04*** 246.29** 412.13*** 414.84*** 423.63*** 427.36*** (74.26) (75.46) (58.90) (58.69) (61.70) (61.45) Observations 4707 4720 4707 4720 4707 4720 R-squared 0.14 0.13 0.43 0.42 0.43 0.43 Notes: Standard errors in parentheses. *** p<0.001, ** p<0.01, * p<0.05 Middle SES quintile, Grades 7-9, lowest terciles or observations below 100%, and populations over 1,000,000 serve as reference categories. Source: OECD – PISA 2003.

326
TABLE 74. ESTIMATED OLS COEFFICIENTS OF TIMSS 2003 MATH ACHIEVEMENT SCORES ON STUDENT CHARACTERISTICS, CLASSROOM RESOURCES, AND SCHOOL CAPACITY IN TUNISIA
Selected Independent Variables
Model 1: Student
Model 2: Students by
SES Quintiles
Model 3: Students & Classroom
Model 4: Students,
Classroom & SES Quintiles
Model 5: Students,
Classroom & School
Model 6: Students, Classroom, School
& SES Quintiles
Student Characteristics SES 12.99*** 11.74*** 10.37*** (1.66) (1.49) (1.42) Low SES -2.26 -0.45 -1.03 (3.74) (3.57) (3.62) Mid-low SES -1.82 -1.05 -1.90 (2.54) (2.46) (2.61) Mid-high SES 9.11*** 8.58** 6.96* (2.73) (2.66) (2.84) High SES 32.67*** 30.47*** 25.96*** (4.44) (4.05) (3.75) Female -25.52*** -25.55*** -25.76*** -25.80*** -26.06*** -26.10***
(1.83) (1.83) (1.82) (1.83) (1.73) (1.73) Age -11.90*** -12.15*** -11.75*** -11.97*** -11.72*** -11.95***
(0.92) (0.94) (0.90) (0.90) (0.85) (0.85) Classroom Resources
% Alg. + Geo. 1.62 1.90 1.47 1.87 (Middle tercile) (3.67) (3.69) (4.32) (4.34)
% Alg. + Geo. 5.61 5.94 5.25 5.71 (High tercile) (4.28) (4.34) (4.19) (4.25)
% Alg. + Geo. -4.93 -3.79 -3.87 -2.76 (Missing) (5.76) (5.70) (6.40) (6.46)
Table continues on next page.

327
Selected Independent Variables
Model 1: Student
Model 2: Students by
SES Quintiles
Model 3: Students & Classroom
Model 4: Students,
Classroom & SES Quintiles
Model 5: Students,
Classroom & School
Model 6: Students, Classroom, School
& SES Quintiles
Overall Math Time 4.19 3.72 2.04 1.47 (Upper 50%) (3.31) (3.24) (3.23) (3.17)
Class Size -22.67** -22.79** -28.44*** -28.99*** (25-32 students) (7.70) (7.76) (7.72) (7.83)
Class Size -17.24* -16.93* -25.61** -25.79** (33+ students) (7.20) (7.18) (7.86) (7.89)
Class Size -15.52 -15.83 -20.52* -21.48* (Missing) (8.24) (8.27) (9.30) (9.35)
T. Math Degree -1.44 -1.17 -2.06 -1.78 (Required) (4.33) (4.32) (3.74) (3.72)
T. Math Degree 1.36 1.31 10.80 10.06 (Missing) (8.95) (8.63) (10.20) (9.93)
T. ISCED 5A -15.71** -15.88** -15.04** -15.20** (2nd Degree) (5.06) (5.06) (4.75) (4.71)
T. ISCED 5A -9.52 -9.93 -4.54 -4.86 (2nd D. Missing) (8.41) (8.27) (8.63) (8.57)
School Capacity School Size 0.00 0.00
(Continuous) (0.01) (0.01) School Resources 6.18 6.03
(Middle level) (5.29) (5.25) School Resources 12.73 13.02
(High level) (7.88) (7.80) School Resources 1.74 1.97
(Missing) (9.01) (8.98) Table continues on next page.
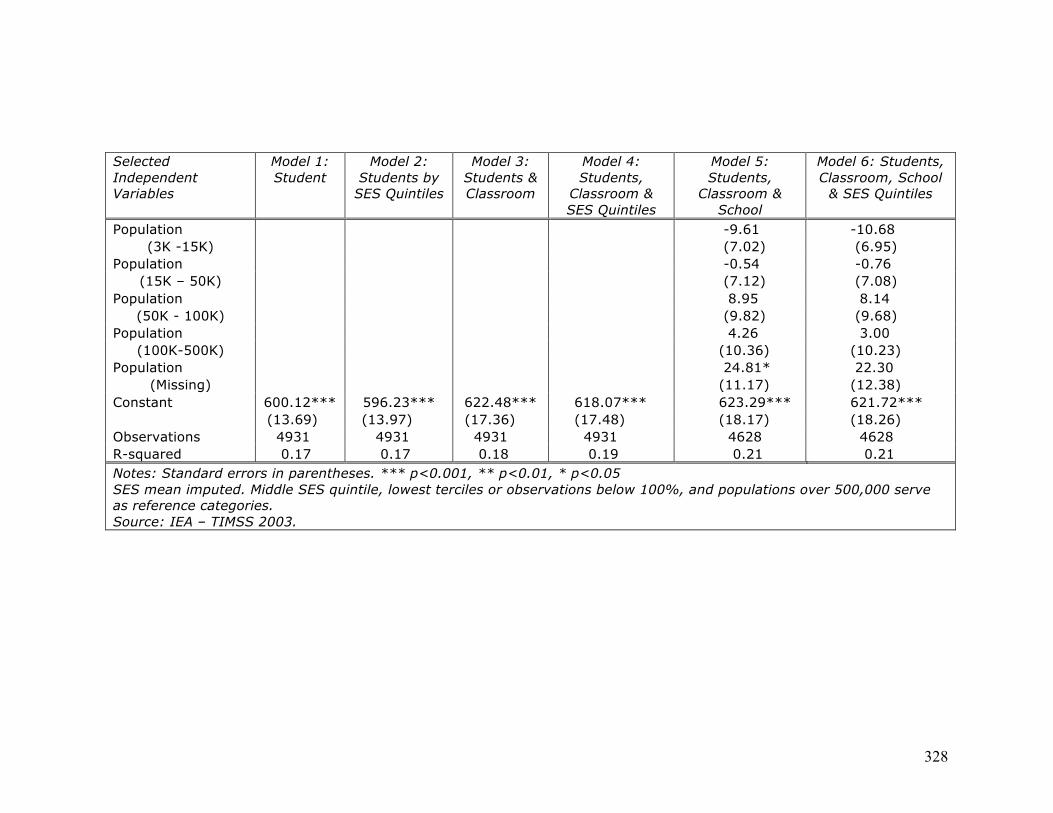
328
Selected Independent Variables
Model 1: Student
Model 2: Students by
SES Quintiles
Model 3: Students & Classroom
Model 4: Students,
Classroom & SES Quintiles
Model 5: Students,
Classroom & School
Model 6: Students, Classroom, School
& SES Quintiles
Population -9.61 -10.68 (3K -15K) (7.02) (6.95)
Population -0.54 -0.76 (15K – 50K) (7.12) (7.08)
Population 8.95 8.14 (50K - 100K) (9.82) (9.68)
Population 4.26 3.00 (100K-500K) (10.36) (10.23)
Population 24.81* 22.30 (Missing) (11.17) (12.38)
Constant 600.12*** 596.23*** 622.48*** 618.07*** 623.29*** 621.72*** (13.69) (13.97) (17.36) (17.48) (18.17) (18.26) Observations 4931 4931 4931 4931 4628 4628 R-squared 0.17 0.17 0.18 0.19 0.21 0.21 Notes: Standard errors in parentheses. *** p<0.001, ** p<0.01, * p<0.05 SES mean imputed. Middle SES quintile, lowest terciles or observations below 100%, and populations over 500,000 serve as reference categories. Source: IEA – TIMSS 2003.
329
Appendix 6: Production Function Results for High GNI Per Capita Countries Participating in Both PISA AND TIMSS, by High and Low
SES Quintiles
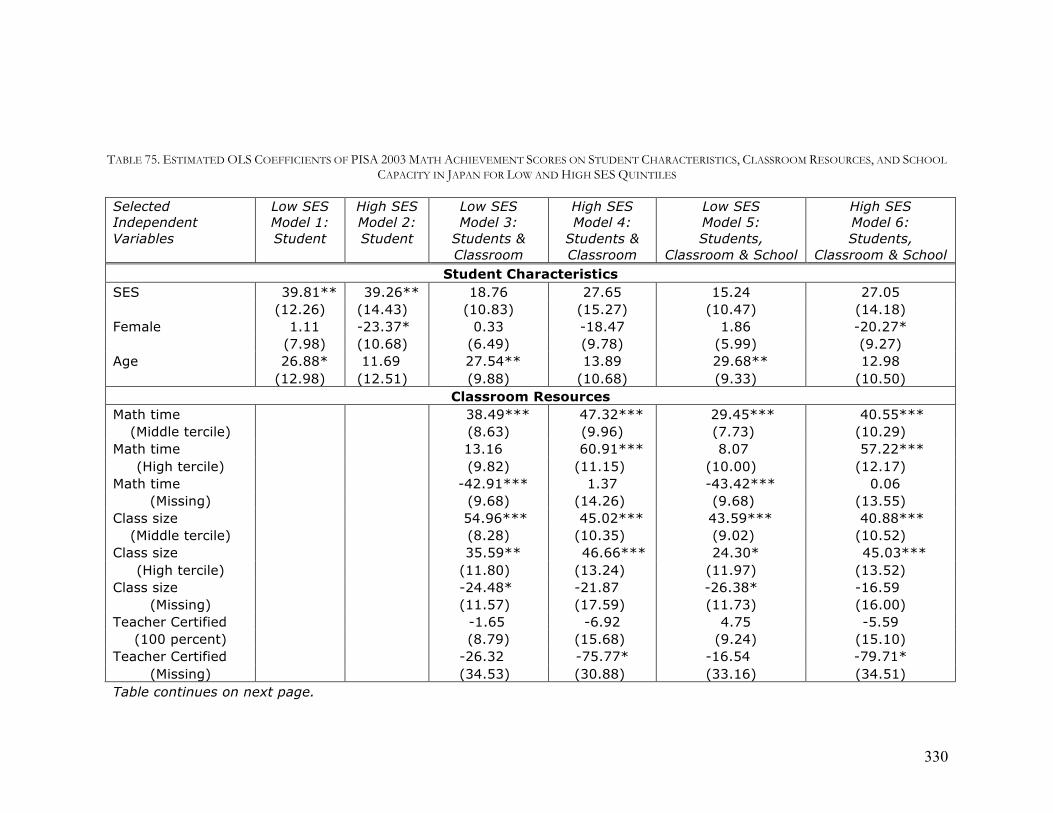
330
TABLE 75. ESTIMATED OLS COEFFICIENTS OF PISA 2003 MATH ACHIEVEMENT SCORES ON STUDENT CHARACTERISTICS, CLASSROOM RESOURCES, AND SCHOOL CAPACITY IN JAPAN FOR LOW AND HIGH SES QUINTILES
Selected Independent Variables
Low SES Model 1: Student
High SES Model 2: Student
Low SES Model 3:
Students & Classroom
High SES Model 4:
Students & Classroom
Low SES Model 5: Students,
Classroom & School
High SES Model 6: Students,
Classroom & School Student Characteristics
SES 39.81** 39.26** 18.76 27.65 15.24 27.05 (12.26) (14.43) (10.83) (15.27) (10.47) (14.18) Female 1.11 -23.37* 0.33 -18.47 1.86 -20.27*
(7.98) (10.68) (6.49) (9.78) (5.99) (9.27) Age 26.88* 11.69 27.54** 13.89 29.68** 12.98
(12.98) (12.51) (9.88) (10.68) (9.33) (10.50) Classroom Resources
Math time 38.49*** 47.32*** 29.45*** 40.55*** (Middle tercile) (8.63) (9.96) (7.73) (10.29)
Math time 13.16 60.91*** 8.07 57.22*** (High tercile) (9.82) (11.15) (10.00) (12.17)
Math time -42.91*** 1.37 -43.42*** 0.06 (Missing) (9.68) (14.26) (9.68) (13.55)
Class size 54.96*** 45.02*** 43.59*** 40.88*** (Middle tercile) (8.28) (10.35) (9.02) (10.52)
Class size 35.59** 46.66*** 24.30* 45.03*** (High tercile) (11.80) (13.24) (11.97) (13.52)
Class size -24.48* -21.87 -26.38* -16.59 (Missing) (11.57) (17.59) (11.73) (16.00)
Teacher Certified -1.65 -6.92 4.75 -5.59 (100 percent) (8.79) (15.68) (9.24) (15.10)
Teacher Certified -26.32 -75.77* -16.54 -79.71* (Missing) (34.53) (30.88) (33.16) (34.51)
Table continues on next page.

331
Selected Independent Variables
Low SES Model 1: Student
High SES Model 2: Student
Low SES Model 3:
Students & Classroom
High SES Model 4:
Students & Classroom
Low SES Model 5: Students,
Classroom & School
High SES Model 6: Students,
Classroom & School T. Pedagogy Degree 22.46 0.55 21.26 -1.49
(Middle tercile) (12.27) (19.42) (12.61) (18.17) T. Pedagogy Degree 12.95 23.57 10.01 24.29
(High tercile) (9.86) (16.99) (11.24) (15.48) T. Pedagogy Degree 14.19 3.58 7.27 -5.64
(Missing) (24.23) (22.62) (21.46) (22.27) School Capacity
School size 30.01** 31.22 (Middle tercile) (10.39) (19.24)
School size 44.31*** 35.30* (High tercile) (11.20) (16.69)
School size 0.00 0.00 (Missing) 0.00 0.00
School resources 1.09 (15.75) (Middle tercile) (9.72) (12.45)
School resources (10.57) 1.89 (High tercile) (13.80) (14.06)
School resources 0.00 0.00 (Missing) 0.00 0.00
Population 0.00 0.00 (below 3K) 0.00 0.00
Population 15.85 28.55 (3K -15K) (25.19) (34.83)
Population 20.15 -1.27 (15K – 100K) (13.14) (17.90)
Population 2.25 14.28 (100K - 1,000K) (10.96) (16.63)
Table continues on next page.

332
Selected Independent Variables
Low SES Model 1: Student
High SES Model 2: Student
Low SES Model 3:
Students & Classroom
High SES Model 4:
Students & Classroom
Low SES Model 5: Students,
Classroom & School
High SES Model 6: Students,
Classroom & School Constant 100.82 368.11 41.19 273.28 -16.48 265.82 (204.69) (198.70) (158.18) (169.79) (150.55) (172.08) Observations 941 922 941 922 941 922 R-squared 0.03 0.03 0.26 0.21 0.29 0.24 Notes: Standard errors in parentheses. *** p<0.001, ** p<0.01, * p<0.05 Middle SES quintile, Grades 7-9, lowest terciles or observations below 100%, and populations over 1,000,000 serve as reference categories. Source: OECD – PISA 2003.

333
TABLE 76. ESTIMATED OLS COEFFICIENTS OF TIMSS 2003 MATH ACHIEVEMENT SCORES ON STUDENT CHARACTERISTICS, CLASSROOM RESOURCES, AND SCHOOL CAPACITY IN JAPAN FOR LOW AND HIGH SES QUINTILES
Selected Independent Variables
Low SES Model 1: Student
High SES Model 2: Student
Low SES Model 3:
Students & Classroom
High SES Model 4:
Students & Classroom
Low SES Model 5: Students,
Classroom & School
High SES Model 6: Students,
Classroom & School Student Characteristics
SES 28.83*** 34.85*** 32.57*** 33.89*** 33.21*** 32.29*** (6.73) (6.34) (6.95) (8.22) (7.40) (7.53) Female -3.58 0.64 -2.58 -5.16 -1.95 -5.99
(5.90) (12.78) (5.76) (7.41) (5.82) (6.57) Age -6.67 -0.18 -6.36 0.32 -5.49 -0.03
(10.30) (7.21) (9.95) (6.25) (10.16) (6.52) Classroom Resources
% Alg. + Geo. -1.50 11.29 -1.46 14.38 -1.50 11.29 (Middle tercile) (6.88) (8.47) (7.17) (8.78) (6.88) (8.47)
% Alg. + Geo. -0.57 0.88 -1.67 -2.28 -0.57 0.88 (High tercile) (7.19) (7.48) (7.26) (8.10) (7.19) (7.48)
% Alg. + Geo. 9.59 65.59* 9.01 63.19* 9.59 65.59* (Missing) (11.14) (28.75) (12.30) (25.51) (11.14) (28.75)
Overall Math Time 19.36* 6.26 19.42* 2.53 19.36* 6.26 (Upper 50%) (7.65) (8.77) (7.85) (7.68) (7.65) (8.77)
Class Size 3.26 17.77 6.49 15.84 3.26 17.77 (25-32 students) (11.79) (16.84) (14.99) (18.08) (11.79) (16.84)
Class Size -1.29 25.17 1.64 18.36 -1.29 25.17 (33+ students) (9.62) (15.48) (14.53) (17.37) (9.62) (15.48)
T. Math Degree 9.85 27.39** 10.25 16.41 9.85 27.39** (Required) (12.34) (9.88) (12.16) (10.21) (12.34) (9.88)
T. ISCED 5A -7.18 28.32 -8.12 22.63 -7.18 28.32 (2nd Degree) (6.37) (17.60) (7.23) (21.80) (6.37) (17.60)
Table continues on next page.

334
Selected Independent Variables
Low SES Model 1: Student
High SES Model 2: Student
Low SES Model 3:
Students & Classroom
High SES Model 4:
Students & Classroom
Low SES Model 5: Students,
Classroom & School
High SES Model 6: Students,
Classroom & School School Capacity
School Size -0.01 0.02 (Continuous) (0.02) (0.02)
School Resources -66.15*** 32.98* (Middle level) (11.01) (15.34)
School Resources -69.41*** 46.68** (High level) (11.06) (16.43)
School Resources -77.01 23.14 (Missing) (117.79) (40.97)
Population 10.51 0.00 (below 3K) (25.81) 0.00
Population -7.89 -7.11 (3K -15K) (12.59) (16.37)
Population -8.91 -24.10* (15K – 50K) (9.25) (11.90)
Population -0.36 -31.09 (50K - 100K) (7.20) (16.66)
Population -0.55 -19.87 (100K-500K) (7.52) (11.74)
Population 11.86 -21.52 (Missing) (21.12) (17.90)
Constant 666.89*** 563.97*** 668.32*** 497.11*** 727.70*** 480.90*** (147.71) (106.41) (144.39) (87.35) (148.40) (92.56) Observations 946 946 940 959 959 957 R-squared 0.03 0.03 0.04 0.09 0.09 0.13 Table continues on next page.

335
Selected Independent Variables
Low SES Model 1: Student
High SES Model 2: Student
Low SES Model 3:
Students & Classroom
High SES Model 4:
Students & Classroom
Low SES Model 5: Students,
Classroom & School
High SES Model 6: Students,
Classroom & School Notes: Standard errors in parentheses. *** p<0.001, ** p<0.01, * p<0.05 SES mean imputed. Middle SES quintile, lowest terciles or observations below 100%, and populations over 500,000 serve as reference categories. Source: IEA – TIMSS 2003.

336
TABLE 77. ESTIMATED OLS COEFFICIENTS OF PISA 2003 MATH ACHIEVEMENT SCORES ON STUDENT CHARACTERISTICS, CLASSROOM RESOURCES, AND SCHOOL CAPACITY IN SWEDEN FOR LOW AND HIGH SES QUINTILES
Selected Independent Variables
Low SES Model 1: Student
High SES Model 2: Student
Low SES Model 3:
Students & Classroom
High SES Model 4:
Students & Classroom
Low SES Model 5: Students,
Classroom & School
High SES Model 6: Students,
Classroom & School Student Characteristics
SES 51.28*** 40.01*** 41.20*** 32.40** 39.39*** 32.87** (6.62) (10.86) (6.02) (9.89) (5.78) (10.03) Female -1.02 2.93 -5.08 -0.89 -5.36 -0.51
(6.35) (6.80) (5.95) (6.37) (6.06) (6.35) Age 17.70 18.46 15.70 15.88 16.02 15.37
(13.13) (13.61) (11.30) (12.51) (11.35) (12.01) Classroom Resources
Math time -5.52 14.02 -3.93 13.66 (Middle tercile) (8.82) (8.29) (8.54) (9.23)
Math time -21.07** 1.62 -19.98* -0.8 (High tercile) (7.80) (8.12) (7.88) (8.16)
Math time -50.66*** -48.59*** -49.75*** -49.86*** (Missing) (7.75) (8.71) (7.62) (8.87)
Class size 39.16*** 17.68* 38.51*** 16.37* (Middle tercile) (7.68) (8.28) (7.81) (8.29)
Class size 35.21*** 35.52*** 35.34*** 34.74*** (High tercile) (7.13) (9.04) (7.29) (9.14)
Class size -47.81** -35.72 -47.67** -39.67 (Missing) (18.26) (19.62) (18.02) (20.40)
Teacher Certified -20.31* -8.34 -16.4 -7.16 (Middle tercile) (9.46) (9.47) (9.68) (9.14)
Teacher Certified -8.00 9.60 -4.11 11.48 (High tercile) (7.97) (10.38) (8.70) (10.33)
Table continues on next page.
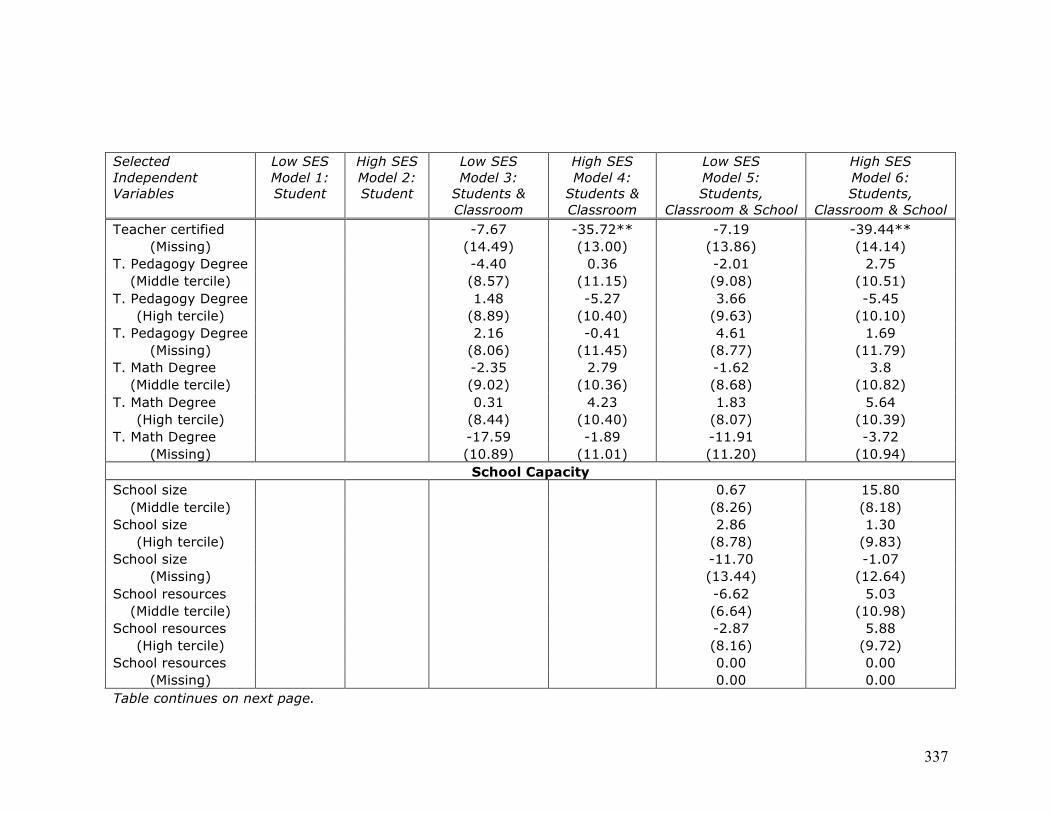
337
Selected Independent Variables
Low SES Model 1: Student
High SES Model 2: Student
Low SES Model 3:
Students & Classroom
High SES Model 4:
Students & Classroom
Low SES Model 5: Students,
Classroom & School
High SES Model 6: Students,
Classroom & School Teacher certified -7.67 -35.72** -7.19 -39.44**
(Missing) (14.49) (13.00) (13.86) (14.14) T. Pedagogy Degree -4.40 0.36 -2.01 2.75
(Middle tercile) (8.57) (11.15) (9.08) (10.51) T. Pedagogy Degree 1.48 -5.27 3.66 -5.45
(High tercile) (8.89) (10.40) (9.63) (10.10) T. Pedagogy Degree 2.16 -0.41 4.61 1.69
(Missing) (8.06) (11.45) (8.77) (11.79) T. Math Degree -2.35 2.79 -1.62 3.8
(Middle tercile) (9.02) (10.36) (8.68) (10.82) T. Math Degree 0.31 4.23 1.83 5.64
(High tercile) (8.44) (10.40) (8.07) (10.39) T. Math Degree -17.59 -1.89 -11.91 -3.72
(Missing) (10.89) (11.01) (11.20) (10.94) School Capacity
School size 0.67 15.80 (Middle tercile) (8.26) (8.18)
School size 2.86 1.30 (High tercile) (8.78) (9.83)
School size -11.70 -1.07 (Missing) (13.44) (12.64)
School resources -6.62 5.03 (Middle tercile) (6.64) (10.98)
School resources -2.87 5.88 (High tercile) (8.16) (9.72)
School resources 0.00 0.00 (Missing) 0.00 0.00
Table continues on next page.

338
Selected Independent Variables
Low SES Model 1: Student
High SES Model 2: Student
Low SES Model 3:
Students & Classroom
High SES Model 4:
Students & Classroom
Low SES Model 5: Students,
Classroom & School
High SES Model 6: Students,
Classroom & School Population -10.04 -10.08
(below 3K) (18.12) (16.62) Population -4.97 -12.98
(3K -15K) (17.41) (15.41) Population -10.78 -22.03
(15K – 100K) (17.65) (14.77) Population -28.71 -6.69
(100K - 1,000K) (22.10) (17.88) Constant 234.38 211.79 279.01 253.39 280.01 265.29 (205.80) (212.31) (179.08) (196.03) (180.58) (191.22) Observations 917 917 917 917 917 917 R-squared 0.09 0.02 0.24 0.16 0.24 0.17 Notes: Standard errors in parentheses. *** p<0.001, ** p<0.01, * p<0.05 Middle SES quintile, Grades 7-9, lowest terciles or observations below 100%, and populations over 1,000,000 serve as reference categories. Source: OECD – PISA 2003.

339
TABLE 78. ESTIMATED OLS COEFFICIENTS OF TIMSS 2003 MATH ACHIEVEMENT SCORES ON STUDENT CHARACTERISTICS, CLASSROOM RESOURCES, AND SCHOOL CAPACITY IN SWEDEN FOR LOW AND HIGH SES QUINTILES
Selected Independent Variables
Low SES Model 1: Student
High SES Model 2: Student
Low SES Model 3:
Students & Classroom
High SES Model 4:
Students & Classroom
Low SES Model 5: Students,
Classroom & School
High SES Model 6: Students,
Classroom & School Student Characteristics
SES 18.80*** 27.74** 14.63** 25.08** 13.40** 21.07* (5.10) (9.73) (4.78) (9.26) (4.89) (8.48) Female -5.98 -7.93 -4.84 -9.09 -3.43 -8.98
(5.45) (5.33) (5.19) (5.22) (5.40) (5.41) Age -18.08 -1.02 -17.67 -0.71 -20.24* -1.21
(10.06) (9.01) (9.23) (8.70) (9.50) (8.71) Classroom Resources
% Alg. + Geo. 16.41 13.50 15.54 14.64 (Middle tercile) (10.29) (10.21) (9.92) (10.16)
% Alg. + Geo. 23.80* 14.66 21.02* 15.58 (High tercile) (9.80) (10.42) (9.78) (9.50)
% Alg. + Geo. 12.25 1.42 12.33 4.32 (Missing) (13.65) (16.15) (14.95) (17.26)
Overall Math Time -14.60 -5.48 -13.86 -5.78 (Upper 50%) (7.87) (7.57) (8.25) (7.13)
Class Size 23.31** 14.97* 22.71* 12.45 (25-32 students) (7.49) (7.37) (9.62) (7.92)
Class Size 64.53*** 19.41 61.36*** 25.81* (33+ students) (14.52) (11.68) (14.71) (13.10)
Class Size -16.38 -6.85 -18.98 -13.38 (Missing) (11.04) (25.09) (11.66) (21.26)
Table continues on next page.

340
Selected Independent Variables
Low SES Model 1: Student
High SES Model 2: Student
Low SES Model 3:
Students & Classroom
High SES Model 4:
Students & Classroom
Low SES Model 5: Students,
Classroom & School
High SES Model 6: Students,
Classroom & School T. Math Degree -6.01 -5.80 -6.85 -7.58
(Required) (9.57) (9.81) (10.55) (10.00) T. Math Degree -11.15 18.96 -14.47 15.99
(Missing) (23.51) (18.36) (22.96) (20.01) T. ISCED 5A 5.51 9.89 9.89 9.31
(2nd Degree) (9.48) (7.58) (9.99) (7.95) T. ISCED 5A 28.95 -37.38* 13.73 -36.92*
(2nd D. Missing) (22.74) (17.66) (23.05) (18.78) School Capacity
School Size 0.00 0.00 (Continuous) (0.03) (0.02)
School Resources -6.33 5.23 (High level) (9.43) (7.15)
School Resources 72.87*** -5.86 (Missing) (19.95) (16.54)
Population 15.95 15.76 (below 3K) (29.42) (20.33)
Population 18.50 -4.58 (3K -15K) (25.10) (10.24)
Population 13.27 -1.56 (15K – 50K) (25.69) (10.92)
Population 13.18 25.65 (50K - 100K) (27.80) (13.94)
Population 11.45 5.62 (100K-500K) (23.55) (9.44)
Population 65.40** -13.38 (Missing) (24.65) (13.52)
Table continues on next page.

341
Selected Independent Variables
Low SES Model 1: Student
High SES Model 2: Student
Low SES Model 3:
Students & Classroom
High SES Model 4:
Students & Classroom
Low SES Model 5: Students,
Classroom & School
High SES Model 6: Students,
Classroom & School Constant 755.82*** 520.69*** 733.39*** 507.71*** 757.04*** 517.50*** (150.51) (137.57) (141.31) (135.75) (153.54) (135.51) Observations 859 890 859 890 801 856 R-squared 0.03 0.01 0.11 0.06 0.13 0.08 Notes: Standard errors in parentheses. *** p<0.001, ** p<0.01, * p<0.05 SES mean imputed. Middle SES quintile, lowest terciles or observations below 100%, and populations over 500,000 serve as reference categories. Source: IEA – TIMSS 2003.

342
TABLE 79. ESTIMATED OLS COEFFICIENTS OF PISA 2003 MATH ACHIEVEMENT SCORES ON STUDENT CHARACTERISTICS, CLASSROOM RESOURCES, AND SCHOOL CAPACITY IN AUSTRALIA FOR LOW AND HIGH SES QUINTILES
Selected Independent Variables
Low SES Model 1: Student
High SES Model 2: Student
Low SES Model 3:
Students & Classroom
High SES Model 4:
Students & Classroom
Low SES Model 5: Students,
Classroom & School
High SES Model 6: Students,
Classroom & School Student Characteristics
SES 16.63 49.56*** 10.91 39.07*** 10.02 36.36*** (11.47) (7.93) (9.65) (7.16) (8.72) (7.08) Female -6.24 0.22 -12.00* -7.00 -13.04** -5.12
(5.35) (5.31) (4.85) (4.54) (4.69) (4.78) Age 32.86** 19.43** 19.12** 11.22 18.51** 12.11
(12.27) (7.24) (6.82) (7.33) (5.89) (7.25) Classroom Resources
Grade 54.78*** 47.23*** 54.08*** 46.31*** (10th – 12th) (7.17) (8.15) (7.09) (8.13)
Math time 5.03 4.63 4.71 3.83 (Middle tercile) (7.12) (4.81) (6.24) (4.75)
Math time -8.90 14.43* -9.67 14.18* (High tercile) (7.74) (5.82) (7.48) (5.74)
Math time -59.54*** -61.51*** -59.69*** -61.48*** (Missing) (8.19) (7.16) (8.12) (6.90)
Class size 17.12* 13.97** 15.58* 13.37** (Middle tercile) (7.01) (5.34) (6.10) (5.09)
Class size 28.22*** 16.79*** 25.16*** 17.48*** (High tercile) (6.89) (5.09) (5.89) (5.09)
Class size -21.35 -58.49*** -21.04 -58.87*** (Missing) (10.96) (15.05) (10.78) (14.60)
Teacher Certified 26.49 14.59 24.48* 14.57 (100 percent) (14.03) (11.66) (10.76) (11.99)
Table continues on next page.

343
Selected Independent Variables
Low SES Model 1: Student
High SES Model 2: Student
Low SES Model 3:
Students & Classroom
High SES Model 4:
Students & Classroom
Low SES Model 5: Students,
Classroom & School
High SES Model 6: Students,
Classroom & School Teacher certified 19.27 24.68 15.89 24.69
(Missing) (17.47) (14.24) (16.35) (14.06) T. Pedagogy Degree -1.89 -14.33* -1.69 -15.84*
(100 percent) (6.99) (6.84) (7.31) (6.83) T. Pedagogy Degree -9.77 10.57 -9.13 7.38
(Missing) (11.67) (7.92) (11.29) (7.82) T. Math Degree -1.22 6.09 -2.09 4.24
(Middle tercile) (8.63) (8.65) (8.82) (8.03) T. Math Degree 1.84 29.89*** 3.59 25.32**
(High tercile) (9.70) (8.94) (9.54) (8.39) T. Math Degree -0.95 15.00* -1.07 13.00*
(Missing) (9.71) (6.31) (9.18) (5.97) School Capacity
School size 12.43 7.68 (Middle tercile) (6.68) (6.79)
School size 13.16 7.03 (High tercile) (7.65) (7.09)
School size 12.06 0 (Missing) (17.94) 0.00
School resources -2.37 10.75 (Middle tercile) (7.00) (6.01)
School resources 9.35 12.81* (High tercile) (8.39) (6.18) School resources 0 0
(Missing) (4.52) 0.00 Population 5.76 14.91
(below 3K) (17.10) (19.23) Table continues on next page.
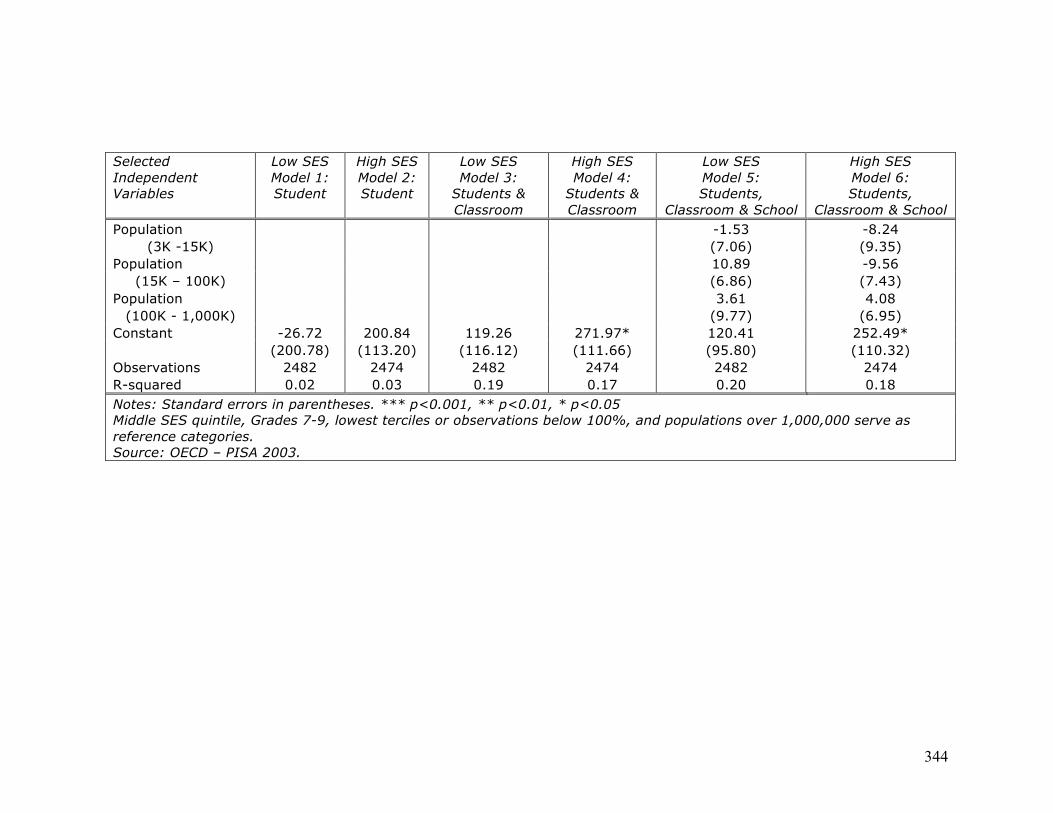
344
Selected Independent Variables
Low SES Model 1: Student
High SES Model 2: Student
Low SES Model 3:
Students & Classroom
High SES Model 4:
Students & Classroom
Low SES Model 5: Students,
Classroom & School
High SES Model 6: Students,
Classroom & School Population -1.53 -8.24
(3K -15K) (7.06) (9.35) Population 10.89 -9.56
(15K – 100K) (6.86) (7.43) Population 3.61 4.08
(100K - 1,000K) (9.77) (6.95) Constant -26.72 200.84 119.26 271.97* 120.41 252.49* (200.78) (113.20) (116.12) (111.66) (95.80) (110.32) Observations 2482 2474 2482 2474 2482 2474 R-squared 0.02 0.03 0.19 0.17 0.20 0.18 Notes: Standard errors in parentheses. *** p<0.001, ** p<0.01, * p<0.05 Middle SES quintile, Grades 7-9, lowest terciles or observations below 100%, and populations over 1,000,000 serve as reference categories. Source: OECD – PISA 2003.

345
TABLE 80. ESTIMATED OLS COEFFICIENTS OF TIMSS 2003 MATH ACHIEVEMENT SCORES ON STUDENT CHARACTERISTICS, CLASSROOM RESOURCES, AND SCHOOL CAPACITY IN AUSTRALIA FOR LOW AND HIGH SES QUINTILES
Selected Independent Variables
Low SES Model 1: Student
High SES Model 2: Student
Low SES Model 3:
Students & Classroom
High SES Model 4:
Students & Classroom
Low SES Model 5: Students,
Classroom & School
High SES Model 6: Students,
Classroom & School Student Characteristics
SES 38.72*** 34.89** 33.05*** 28.16* 33.36*** 34.08** (7.51) (13.44) (7.02) (11.85) (7.43) (13.06) Female -19.66* -7.77 -16.69 -9.83 -15.26 -6.88
(9.80) (9.35) (9.64) (8.40) (11.94) (8.11) Age 0.26 -15.75 2.81 -20.16* -4.04 -18.52*
(6.61) (9.03) (7.08) (8.46) (5.75) (8.56) Classroom Resources
% Alg. + Geo. 34.56* 18.50 42.22* 22.86 (Middle tercile) (14.25) (17.38) (17.28) (21.17)
% Alg. + Geo. 35.63 30.38* 39.85* 31.20 (High tercile) (18.33) (15.29) (18.00) (18.38)
% Alg. + Geo. 43.77 44.25 61.09** 42.58 (Missing) (26.69) (29.28) (21.67) (30.83)
Overall Math Time -7.60 -27.83** -3.62 -24.68* (Upper 50%) (11.58) (10.55) (9.60) (10.94)
Class Size 48.70*** 30.33* 32.78** 37.87** (25-32 students) (14.50) (13.55) (12.49) (12.96)
Class Size 31.66 -8.41 9.45 4.48 (33+ students) (26.03) (23.31) (35.93) (21.81)
Class Size 34.67 14.37 28.76 15.44 (Missing) (24.43) (17.19) (23.62) (19.26)
Table continues on next page.
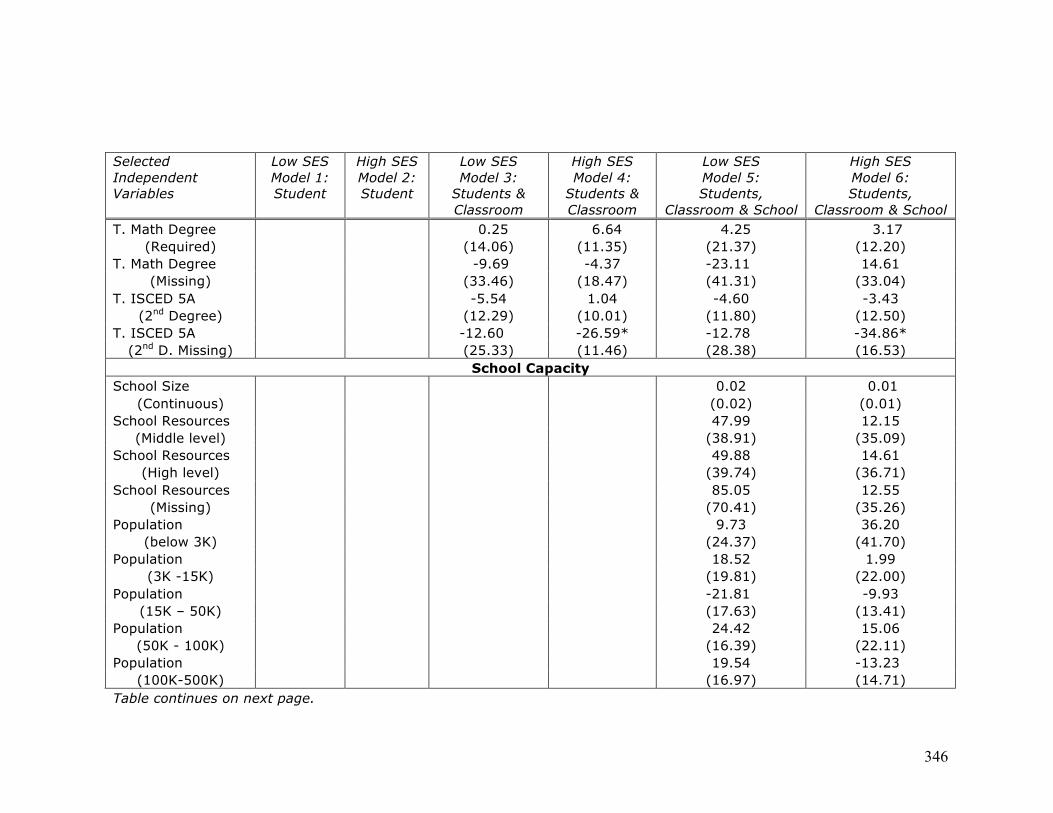
346
Selected Independent Variables
Low SES Model 1: Student
High SES Model 2: Student
Low SES Model 3:
Students & Classroom
High SES Model 4:
Students & Classroom
Low SES Model 5: Students,
Classroom & School
High SES Model 6: Students,
Classroom & School T. Math Degree 0.25 6.64 4.25 3.17
(Required) (14.06) (11.35) (21.37) (12.20) T. Math Degree -9.69 -4.37 -23.11 14.61
(Missing) (33.46) (18.47) (41.31) (33.04) T. ISCED 5A -5.54 1.04 -4.60 -3.43
(2nd Degree) (12.29) (10.01) (11.80) (12.50) T. ISCED 5A -12.60 -26.59* -12.78 -34.86*
(2nd D. Missing) (25.33) (11.46) (28.38) (16.53) School Capacity
School Size 0.02 0.01 (Continuous) (0.02) (0.01)
School Resources 47.99 12.15 (Middle level) (38.91) (35.09)
School Resources 49.88 14.61 (High level) (39.74) (36.71)
School Resources 85.05 12.55 (Missing) (70.41) (35.26)
Population 9.73 36.20 (below 3K) (24.37) (41.70)
Population 18.52 1.99 (3K -15K) (19.81) (22.00)
Population -21.81 -9.93 (15K – 50K) (17.63) (13.41)
Population 24.42 15.06 (50K - 100K) (16.39) (22.11)
Population 19.54 -13.23 (100K-500K) (16.97) (14.71)
Table continues on next page.

347
Selected Independent Variables
Low SES Model 1: Student
High SES Model 2: Student
Low SES Model 3:
Students & Classroom
High SES Model 4:
Students & Classroom
Low SES Model 5: Students,
Classroom & School
High SES Model 6: Students,
Classroom & School Population -20.16 -59.89
(Missing) (28.17) (32.11) Constant 524.27*** 716.71*** 428.37*** 752.90*** 455.07*** 701.02*** (92.73) (125.31) (100.69) (119.29) (88.73) (138.90) Observations 941 978 941 978 828 892 R-squared 0.07 0.03 0.16 0.13 0.22 0.17 Notes: Standard errors in parentheses. *** p<0.001, ** p<0.01, * p<0.05 SES mean imputed. Middle SES quintile, lowest terciles or observations below 100%, and populations over 500,000 serve as reference categories. Source: IEA – TIMSS 2003.

348
TABLE 81. ESTIMATED OLS COEFFICIENTS OF PISA 2003 MATH ACHIEVEMENT SCORES ON STUDENT CHARACTERISTICS, CLASSROOM RESOURCES, AND SCHOOL CAPACITY IN ITALY FOR LOW AND HIGH SES QUINTILES
Selected Independent Variables
Low SES Model 1: Student
High SES Model 2: Student
Low SES Model 3:
Students & Classroom
High SES Model 4:
Students & Classroom
Low SES Model 5: Students,
Classroom & School
High SES Model 6: Students,
Classroom & School Student Characteristics
SES 57.65*** 21.35** 38.88*** 19.96** 38.60*** 19.30** (6.06) (8.23) (5.99) (7.28) (5.83) (6.62) Female -9.05 -27.80*** -21.64*** -24.81*** -20.68*** -22.27***
(8.32) (7.04) (6.29) (5.44) (6.26) (5.19) Age 19.27 28.26* 13.75 28.50* 13.34 31.30**
(10.40) (12.55) (9.24) (11.41) (9.15) (10.28) Classroom Resources
Grade 56.12*** 56.31*** 53.75*** 57.04*** (10th – 12th) (8.29) (11.68) (7.78) (10.91)
Math time 25.85** 28.78*** 22.39** 27.11*** (Middle tercile) (8.23) (6.69) (8.08) (7.17)
Math time 7.97 27.83*** 4.83 26.15*** (High tercile) (9.36) (7.65) (8.76) (7.64)
Math time -23.98* -17.05 -25.70* -13.73 (Missing) (10.57) (10.10) (10.02) (9.90)
Class size -1.68 11.12 -4.00 12.03 (Middle tercile) (7.13) (8.37) (7.14) (7.75)
Class size 18.29** 4.67 13.39 1.85 (High tercile) (6.00) (6.70) (7.24) (6.27)
Class size -54.62** -29.89 -51.10** -30.72 (Missing) (18.70) (17.00) (16.55) (15.86)
Teacher Certified -19.35* -6.22 -18.59 -8.26 (100 percent) (9.44) (9.61) (9.49) (10.06)
Table continues on next page.

349
Selected Independent Variables
Low SES Model 1: Student
High SES Model 2: Student
Low SES Model 3:
Students & Classroom
High SES Model 4:
Students & Classroom
Low SES Model 5: Students,
Classroom & School
High SES Model 6: Students,
Classroom & School Teacher Certified -26.49 -35.02* -33.50* -22.01
(Missing) (15.74) (16.64) (16.79) (19.27) T. Pedagogy Degree -21.51 7.76 -27.72 3.75
(Middle tercile) (17.08) (16.13) (15.82) (18.76) T. Pedagogy Degree -32.97 22.37 -22.52 38.39*
(High tercile) (20.76) (17.15) (21.82) (18.52) T. Pedagogy Degree -29.97* 11.43 -30.64* 16.25
(Missing) (12.70) (11.27) (12.58) (14.05) T. Math Degree 23.51 -0.65 24.88 -11.48
(Middle tercile) (12.51) (10.89) (13.12) ( 11.88) T. Math Degree 10.72 4.63 15.73 2.26
(High tercile) (11.13) (10.16) (11.54) (9.39) T. Math Degree 4.46 -51.89* 6.69 -43.44*
(Missing) (13.58) (24.59) (16.21) (21.75) School Capacity
School size 21.98 14.24 (Middle tercile) (11.67) (10.32)
School size 21.57 20.23 (High tercile) (11.43) (11.42)
School size 25.84 14.02 (Missing) (18.71) (47.08)
School resources 26.56** -3.16 (Middle tercile) (9.51) (11.14)
School resources 29.06** -10.49 (High tercile) (10.20) (12.61)
School resources 37.30 -98.51 (Missing) (19.86) (66.66)
Table continues on next page.

350
Selected Independent Variables
Low SES Model 1: Student
High SES Model 2: Student
Low SES Model 3:
Students & Classroom
High SES Model 4:
Students & Classroom
Low SES Model 5: Students,
Classroom & School
High SES Model 6: Students,
Classroom & School Population 47.40 -13.96
(below 3K) (27.91) (36.94) Population 16.56 32.42
(3K -15K) (20.99) (20.22) Population 15.85 9.47
(15K – 100K) (19.14) (17.37) Population 23.99 23.32
(100K - 1,000K) (20.10) (16.66) Constant 200.29 51.73 252 -25.94 214.71 -94.86 (161.98) (198.97) (145.65) (181.96) (145.00) (161.71) Observations 2323 2305 2323 2305 2323 2305 R-squared 0.07 0.04 0.25 0.16 0.29 0.19 Notes: Standard errors in parentheses. *** p<0.001, ** p<0.01, * p<0.05 Middle SES quintile, Grades 7-9, lowest terciles or observations below 100%, and populations over 1,000,000 serve as reference categories. Source: OECD – PISA 2003.

351
TABLE 82. ESTIMATED OLS COEFFICIENTS OF TIMSS 2003 MATH ACHIEVEMENT SCORES ON STUDENT CHARACTERISTICS, CLASSROOM RESOURCES, AND SCHOOL CAPACITY IN ITALY FOR LOW AND HIGH SES QUINTILES
Selected Independent Variables
Low SES Model 1: Student
High SES Model 2: Student
Low SES Model 3:
Students & Classroom
High SES Model 4:
Students & Classroom
Low SES Model 5: Students,
Classroom & School
High SES Model 6: Students,
Classroom & School Student Characteristics
SES 31.78*** 9.75 30.19*** 11.30 31.56*** 9.06 (6.77) (7.13) (6.73) (6.93) (6.22) (7.00) Female -6.78 -20.08*** -7.20 -19.92*** -10.05 -18.05**
(5.79) (5.50) (5.61) (5.59) (5.19) (5.88) Age -17.08** -2.29 -16.06** -2.47 -17.00** -0.96
(6.26) (8.99) (6.04) (8.83) (5.66) (7.38) Classroom Resources
% Alg. + Geo. -14.67 11.53 -14.68 8.19 (Middle tercile) (8.75) (12.83) (8.33) (9.40)
% Alg. + Geo. -13.91 9.81 -4.89 11.70 (High tercile) (11.97) (8.61) (9.17) (8.84)
Overall Math Time 8.15 1.24 2.00 -0.94 (Upper 50%) (6.29) (7.23) (5.57) (6.85)
Class Size -20.52 8.83 -12.86 11.07 (25-32 students) (11.70) (9.27) (11.43) (9.12)
Class Size 18.51 -14.57 34.26*** -10.15 (Missing) (10.99) (16.85) (9.41) (17.19)
T. Math Degree -7.96 -2.14 -5.45 4.32 (Required) (15.72) (17.43) (15.03) (17.38)
T. Math Degree -85.38 -89.21 -120.43** -139.36* (Missing) (54.82) (77.09) (46.59) (58.65)
T. ISCED 5A -43.44 15.57 -32.03 14.95 (2nd Degree) (33.52) (13.29) (26.07) (11.01)
Table continues on next page.

352
Selected Independent Variables
Low SES Model 1: Student
High SES Model 2: Student
Low SES Model 3:
Students & Classroom
High SES Model 4:
Students & Classroom
Low SES Model 5: Students,
Classroom & School
High SES Model 6: Students,
Classroom & School T. ISCED 5A 30.71 45.37 41.56 58.85
(2nd D. Missing) (67.42) (180.36) (50.97) (116.89) School Capacity
School Size 0.04* 0.01 (Continuous) (0.02) (0.02)
School Resources 13.93 60.37 (Middle level) (17.39) (32.78)
School Resources 20.74 71.78* (High level) (19.03) (33.49)
Population 78.45** 71.96* (below 3K) (28.41) (32.98)
Population 47.30* 3.06 (3K -15K) (18.76) (10.35)
Population 23.96 -20.31 (15K – 50K) (20.34) (11.93)
Population 27.60 12.37 (50K - 100K) (18.99) (14.18)
Population 59.99* -1.70 (100K-500K) (27.74) (11.86)
Population -5.89 -94.00* (Missing) (26.02) (40.88)
Constant 725.92*** 548.77*** 731.22*** 541.04*** 662.87*** 443.23*** (89.32) (127.78) (88.55) (130.53) (89.56) (116.25) Observations 862 855 862 855 859 850 R-squared 0.05 0.02 0.09 0.05 0.15 0.14 Notes: Standard errors in parentheses. *** p<0.001, ** p<0.01, * p<0.05 SES mean imputed. Middle SES quintile, lowest terciles or observations below 100%, and populations over 500,000 serve as reference categories. Source: IEA – TIMSS 2003.

353
TABLE 83. ESTIMATED OLS COEFFICIENTS OF PISA 2003 MATH ACHIEVEMENT SCORES ON STUDENT CHARACTERISTICS, CLASSROOM RESOURCES, AND SCHOOL CAPACITY IN HONG KONG FOR LOW AND HIGH SES QUINTILES
Selected Independent Variables
Low SES Model 1: Student
High SES Model 2: Student
Low SES Model 3:
Students & Classroom
High SES Model 4:
Students & Classroom
Low SES Model 5: Students,
Classroom & School
High SES Model 6: Students,
Classroom & School Student Characteristics
SES 29.61** 39.15*** 19.73* 27.17*** 11.85 23.24** (10.58) (8.37) (9.13) (7.44) (9.21) (7.42) Female -3.15 -5.60 -17.65* -14.18 -16.62* -14.7
(8.33) (9.53) (7.63) (7.88) (6.46) (7.78) Age 32.11* 31.76** -7.29 -20.77 -15.60 -24.56*
(13.63) (10.05) (13.06) (11.49) (12.39) (11.58) Classroom Resources
Grade 51.56*** 54.58*** 53.85*** 51.42*** (10th – 12th) (6.24) (7.76) (5.54) (7.44)
Math time 9.66 -14.52 8.29 -12.91 (Middle tercile) (10.11) (7.66) (9.22) (7.10)
Math time -13.38 -0.07 -12.76 1.46 (High tercile) (9.72) (7.86) (8.89) (7.29)
Math time -64.75*** -71.74*** -57.86*** -64.03*** (Missing) (9.43) (16.95) (9.47) (15.00)
Class size 39.65*** 38.09*** 30.18*** 31.54** (Middle tercile) (9.56) (10.52) (9.12) (10.28)
Class size 58.89*** 46.30*** 33.48*** 35.68** (High tercile) (9.74) (11.46) (8.64) (11.35)
Class size -55.39*** -39.19 -63.42*** -39.44 (Missing) (13.61) (22.77) (13.93) (22.40)
Teacher Certified 27.72 1.51 17.26 -3.10 (Middle tercile) (15.00) (16.29) (13.20) (15.08)
Table continues on next page.

354
Selected Independent Variables
Low SES Model 1: Student
High SES Model 2: Student
Low SES Model 3:
Students & Classroom
High SES Model 4:
Students & Classroom
Low SES Model 5: Students,
Classroom & School
High SES Model 6: Students,
Classroom & School Teacher Certified 16.07 8.78 7.14 -1.43
(High tercile) (15.14) (15.88) (12.87) (14.18) Teacher certified 40.79 93.10* -5.50 56.28
(Missing) (31.65) (37.57) (29.25) (44.10) T. Pedagogy Degree 5.83 7.81 6.31 1.75
(Middle tercile) (14.61) (14.62) (12.46) (14.47) T. Pedagogy Degree 20.25 0.93 13.89 -4.77
(High tercile) (16.88) (15.42) (14.77) (14.46) T. Pedagogy Degree 22.44 -14.77 19.34 -0.48
(Missing) (27.67) (15.99) (19.68) (19.64) T. Math Degree 3.88 27.38 6.10 20.88
(Middle tercile) (14.73) (17.73) (13.84) (15.77) T. Math Degree 11.67 29.58 6.34 24.93
(High tercile) (15.41) (19.06) (14.01) (19.04) T. Math Degree -4.16 33.30 -0.81 19.96
(Missing) (17.83) (17.24) (14.67) (16.16) School Capacity
School size 47.73*** 19.40 (Middle tercile) (11.45) (15.36)
School size 74.62*** 52.15*** (High tercile) (17.49) (15.37)
School size -15.85 -35.56 (Missing) (18.32) (21.27)
School resources -6.71 -17.55 (Middle tercile) (10.98) (10.26)
School resources -10.07 -27.19 (High tercile) (12.67) (16.93)
Table continues on next page.

355
Selected Independent Variables
Low SES Model 1: Student
High SES Model 2: Student
Low SES Model 3:
Students & Classroom
High SES Model 4:
Students & Classroom
Low SES Model 5: Students,
Classroom & School
High SES Model 6: Students,
Classroom & School School resources 0.00 0.00
(Missing) 0.00 0.00 Constant 63.84 68.72 620.85** 830.57*** 724.96*** 895.84*** (220.29) (156.50) (210.35) (175.22) (199.77) (179.76) Observations 908 888 908 888 908 888 R-squared 0.02 0.04 0.32 0.30 0.40 0.35 Notes: Standard errors in parentheses. *** p<0.001, ** p<0.01, * p<0.05 Middle SES quintile, Grades 7-9, lowest terciles or observations below 100%, and populations over 1,000,000 serve as reference categories. Source: OECD – PISA 2003.

356
TABLE 84. ESTIMATED OLS COEFFICIENTS OF TIMSS 2003 MATH ACHIEVEMENT SCORES ON STUDENT CHARACTERISTICS, CLASSROOM RESOURCES, AND SCHOOL CAPACITY IN HONG KONG FOR LOW AND HIGH SES QUINTILES
Selected Independent Variables
Low SES Model 1: Student
High SES Model 2: Student
Low SES Model 3:
Students & Classroom
High SES Model 4:
Students & Classroom
Low SES Model 5: Students,
Classroom & School
High SES Model 6: Students,
Classroom & School Student Characteristics
SES 6.70 20.04** 6.55 20.45** 3.40 15.64* (5.20) (6.19) (4.93) (6.31) (5.42) (6.27) Female 2.93 6.17 -0.06 5.77 -0.58 4.93
(6.16) (7.37) (5.70) (7.11) (5.96) (7.43) Age -5.37* -10.96* -4.31 -8.21 -4.54* -8.06
(2.51) (4.93) (2.34) (4.94) (2.25) (5.48) Classroom Resources
% Alg. + Geo. 29.25* 1.47 32.05* 11.89 (Middle tercile) (12.26) (12.94) (12.73) (16.50)
% Alg. + Geo. 8.69 3.06 14.54 14.58 (High tercile) (13.11) (13.00) (13.32) (15.09)
% Alg. + Geo. 15.23 4.75 36.68* 26.86 (Missing) (16.12) (49.05) (16.04) (35.47)
Overall Math Time 8.8 -2.84 6.16 -2.77 (Upper 50%) (9.77) (10.72) (11.13) (10.80)
Overall Math Time 0.00 0.00 0.00 0.00 (Missing) 0.00 0.00 0.00 0.00
Class Size 1.68 57.76 9.77 82.02 (25-32 students) (33.69) (72.75) (31.07) (64.42)
Class Size 86.04** 104.06* 79.21*** 100.19* (33+ students) (28.46) (52.11) (21.74) (38.95)
Class Size 116.85 115.63* 109.8 133.17* (Missing) (116.30) (56.42) (110.55) (55.89)
Table continues on next page.

357
Selected Independent Variables
Low SES Model 1: Student
High SES Model 2: Student
Low SES Model 3:
Students & Classroom
High SES Model 4:
Students & Classroom
Low SES Model 5: Students,
Classroom & School
High SES Model 6: Students,
Classroom & School T. Math Degree -1.54 4.10 -0.70 2.54
(Required) (9.36) (8.48) (9.59) (9.56) T. Math Degree 1.06 20.41 -10.25 21.44
(Missing) (15.64) (21.26) (21.44) (29.07) T. ISCED 5A 17.73 10.99 23.21 10.01
(2nd Degree) (10.98) (11.41) (12.86) (18.02) T. ISCED 5A 20.13 26.64 -6.08 7.77
(2nd D. Missing) (10.96) (26.83) (16.69) (36.03) School Capacity
School Size 0.07 0.05 (Continuous) (0.04) (0.03)
School Resources -72.31 -64.09* (Middle level) (73.70) (26.53)
School Resources -73.09 -46.97 (High level) (72.57) (25.79)
School Resources -5.71 -7.66 (Missing) (74.86) (48.42)
Population -34.69 -23.32 (15K – 50K) (26.46) (55.41)
Population -17.50 -18.33 (50K - 100K) (22.50) (41.04)
Population -16.56 -24.02* (100K-500K) (12.26) (10.12)
Population -23.19 9.32 (Missing) (26.76) (24.67)
Table continues on next page.

358
Selected Independent Variables
Low SES Model 1: Student
High SES Model 2: Student
Low SES Model 3:
Students & Classroom
High SES Model 4:
Students & Classroom
Low SES Model 5: Students,
Classroom & School
High SES Model 6: Students,
Classroom & School Constant 656.73*** 733.85*** 544.50*** 588.69*** 558.16*** 593.76*** (34.26) (72.70) (44.54) (93.96) (102.48) (100.12) Observations 993 993 993 993 946 898 R-squared 0.01 0.04 0.20 0.12 0.26 0.21 Notes: Standard errors in parentheses. *** p<0.001, ** p<0.01, * p<0.05 SES mean imputed. Middle SES quintile, lowest terciles or observations below 100%, and populations over 500,000 serve as reference categories. Source: IEA – TIMSS 2003.
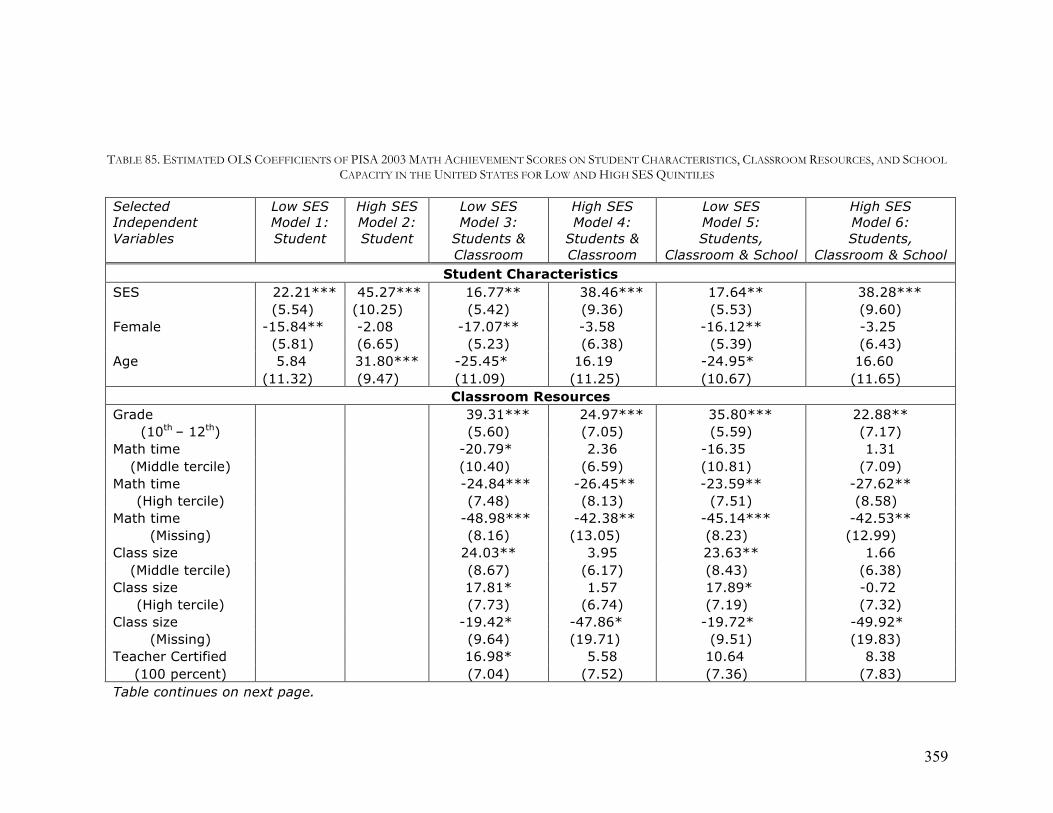
359
TABLE 85. ESTIMATED OLS COEFFICIENTS OF PISA 2003 MATH ACHIEVEMENT SCORES ON STUDENT CHARACTERISTICS, CLASSROOM RESOURCES, AND SCHOOL CAPACITY IN THE UNITED STATES FOR LOW AND HIGH SES QUINTILES
Selected Independent Variables
Low SES Model 1: Student
High SES Model 2: Student
Low SES Model 3:
Students & Classroom
High SES Model 4:
Students & Classroom
Low SES Model 5: Students,
Classroom & School
High SES Model 6: Students,
Classroom & School Student Characteristics
SES 22.21*** 45.27*** 16.77** 38.46*** 17.64** 38.28*** (5.54) (10.25) (5.42) (9.36) (5.53) (9.60) Female -15.84** -2.08 -17.07** -3.58 -16.12** -3.25
(5.81) (6.65) (5.23) (6.38) (5.39) (6.43) Age 5.84 31.80*** -25.45* 16.19 -24.95* 16.60
(11.32) (9.47) (11.09) (11.25) (10.67) (11.65) Classroom Resources
Grade 39.31*** 24.97*** 35.80*** 22.88** (10th – 12th) (5.60) (7.05) (5.59) (7.17)
Math time -20.79* 2.36 -16.35 1.31 (Middle tercile) (10.40) (6.59) (10.81) (7.09)
Math time -24.84*** -26.45** -23.59** -27.62** (High tercile) (7.48) (8.13) (7.51) (8.58)
Math time -48.98*** -42.38** -45.14*** -42.53** (Missing) (8.16) (13.05) (8.23) (12.99)
Class size 24.03** 3.95 23.63** 1.66 (Middle tercile) (8.67) (6.17) (8.43) (6.38)
Class size 17.81* 1.57 17.89* -0.72 (High tercile) (7.73) (6.74) (7.19) (7.32)
Class size -19.42* -47.86* -19.72* -49.92* (Missing) (9.64) (19.71) (9.51) (19.83)
Teacher Certified 16.98* 5.58 10.64 8.38 (100 percent) (7.04) (7.52) (7.36) (7.83)
Table continues on next page.

360
Selected Independent Variables
Low SES Model 1: Student
High SES Model 2: Student
Low SES Model 3:
Students & Classroom
High SES Model 4:
Students & Classroom
Low SES Model 5: Students,
Classroom & School
High SES Model 6: Students,
Classroom & School Teacher certified 13.39 14.34 18.73 16.67*
(Missing) (9.37) (7.93) (9.93) (8.01) T. Math Degree 8.11 16.56* 7.65 12.61
(100 percent) (8.12) (6.61) (7.93) (7.64) T. Math Degree -14.94 -7.56 0.46 -10.95
(Missing) (8.07) (8.48) (8.17) (10.64) School Capacity
School size 4.14 -0.21 (Middle tercile) (9.74) (9.57)
School size 11.82 13.77 (High tercile) (11.58) (11.78)
School size 19.38 8.62 (Missing) (19.60) (12.49)
School resources 7.53 0.28 (Middle tercile) (7.53) (7.23)
School resources 7.95 -2.51 (High tercile) (8.37) (7.98)
School resources -6.51 15.71 (Missing) (18.44) (16.27)
Population 42.74** 10.79 (below 3K) (16.23) (18.20)
Population 45.08** 21.81 (3K -15K) (14.77) (15.50)
Population 34.59* 19.90 (15K – 100K) (13.70) (15.05)
Population 13.97 11.90 (100K - 1,000K) (12.99) (16.04)
Table continues on next page.

361
Selected Independent Variables
Low SES Model 1: Student
High SES Model 2: Student
Low SES Model 3:
Students & Classroom
High SES Model 4:
Students & Classroom
Low SES Model 5: Students,
Classroom & School
High SES Model 6: Students,
Classroom & School Constant 361.95* -26.89 835.49*** 209.29 789.78*** 184.78 (178.71) (149.30) (172.73) (178.27) (166.01) (181.71) Observations 1079 1078 1079 1078 1079 1078 R-squared 0.03 0.04 0.19 0.11 0.22 0.12 Notes: Standard errors in parentheses. *** p<0.001, ** p<0.01, * p<0.05 Middle SES quintile, Grades 7-9, lowest terciles or observations below 100%, and populations over 1,000,000 serve as reference categories. Source: OECD – PISA 2003.

362
TABLE 86. ESTIMATED OLS COEFFICIENTS OF TIMSS 2003 MATH ACHIEVEMENT SCORES ON STUDENT CHARACTERISTICS, CLASSROOM RESOURCES, AND SCHOOL CAPACITY IN THE UNITED STATES FOR LOW AND HIGH SES QUINTILES
Selected Independent Variables
Low SES Model 1: Student
High SES Model 2: Student
Low SES Model 3:
Students & Classroom
High SES Model 4:
Students & Classroom
Low SES Model 5: Students,
Classroom & School
High SES Model 6: Students,
Classroom & School Student Characteristics
SES 27.50***
37.67*** 25.07*** 35.12*** 22.99*** 34.11**
(4.12) 10.35) (3.96) (9.85) (4.42) (10.67) Female -7.43 -0.83 -5.99 -6.70 -4.28 -5.54
(4.12) (4.11) (3.87) (4.08) (3.96) (4.28) Age 17.25*** -4.74 -16.41*** -5.26 -15.45*** -4.15
(4.42) (4.45) (4.25) (4.66) (4.01) (4.88) Classroom Resources
% Alg. + Geo. 18.34** 37.19*** 14.75* 39.49*** (Middle tercile) (5.71) (8.48) (6.06) (8.97)
% Alg. + Geo. 41.26*** 88.16*** 37.08*** 85.65*** (High tercile) (7.86) (10.24) (7.84) (10.22)
% Alg. + Geo. 20.67 61.44*** 8.3 39.88* (Missing) (17.45) (17.95) (18.31) (17.64)
Overall Math Time 14.57* -3.71 16.62** -2.34 (Upper 50%) (5.90) (8.60) (5.91) (10.00)
Class Size -5.98 4.55 -2.41 4.59 (25-32 students) (6.19) (7.77) (6.27) (8.97)
Class Size -9.11 16.41 -3.43 13.04 (33+ students) (14.55) (13.90) (15.94) (13.88)
Class Size 12.86 6.48 33.35*** 13.62 (Missing) (11.76) (10.82) (10.00) (13.18)
Table continues on next page.
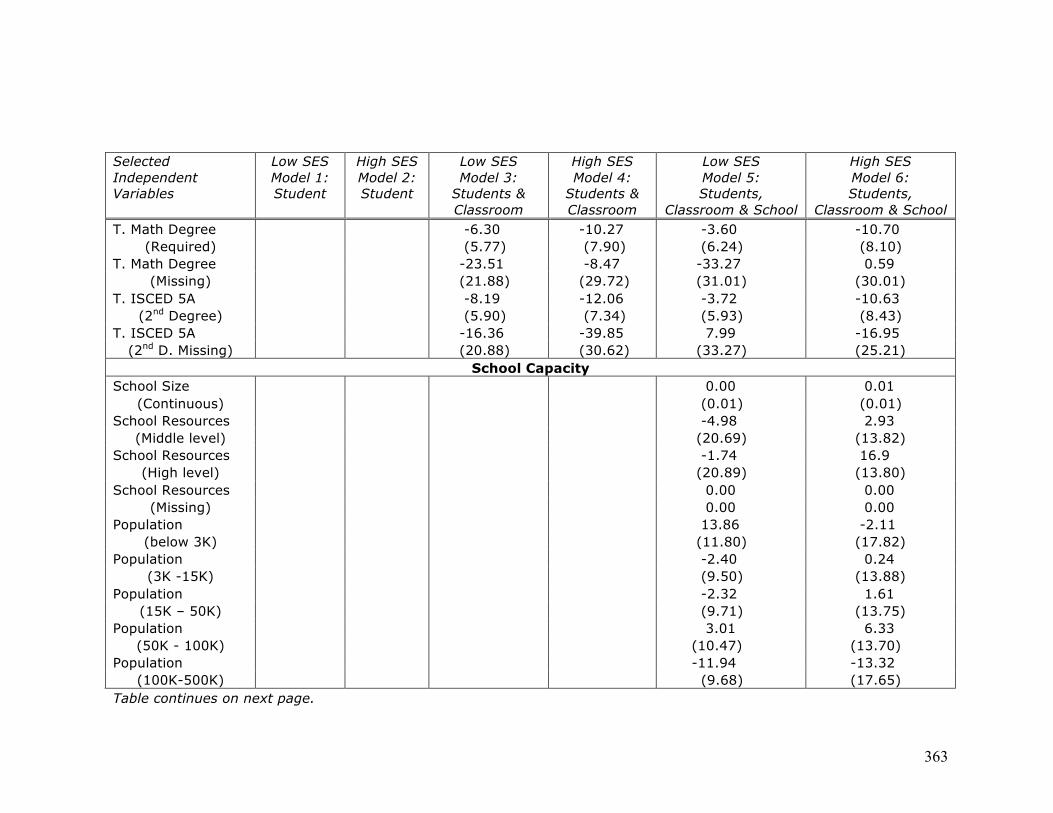
363
Selected Independent Variables
Low SES Model 1: Student
High SES Model 2: Student
Low SES Model 3:
Students & Classroom
High SES Model 4:
Students & Classroom
Low SES Model 5: Students,
Classroom & School
High SES Model 6: Students,
Classroom & School T. Math Degree -6.30 -10.27 -3.60 -10.70
(Required) (5.77) (7.90) (6.24) (8.10) T. Math Degree -23.51 -8.47 -33.27 0.59
(Missing) (21.88) (29.72) (31.01) (30.01) T. ISCED 5A -8.19 -12.06 -3.72 -10.63
(2nd Degree) (5.90) (7.34) (5.93) (8.43) T. ISCED 5A -16.36 -39.85 7.99 -16.95
(2nd D. Missing) (20.88) (30.62) (33.27) (25.21) School Capacity
School Size 0.00 0.01 (Continuous) (0.01) (0.01)
School Resources -4.98 2.93 (Middle level) (20.69) (13.82)
School Resources -1.74 16.9 (High level) (20.89) (13.80)
School Resources 0.00 0.00 (Missing) 0.00 0.00
Population 13.86 -2.11 (below 3K) (11.80) (17.82)
Population -2.40 0.24 (3K -15K) (9.50) (13.88)
Population -2.32 1.61 (15K – 50K) (9.71) (13.75)
Population 3.01 6.33 (50K - 100K) (10.47) (13.70)
Population -11.94 -13.32 (100K-500K) (9.68) (17.65)
Table continues on next page.
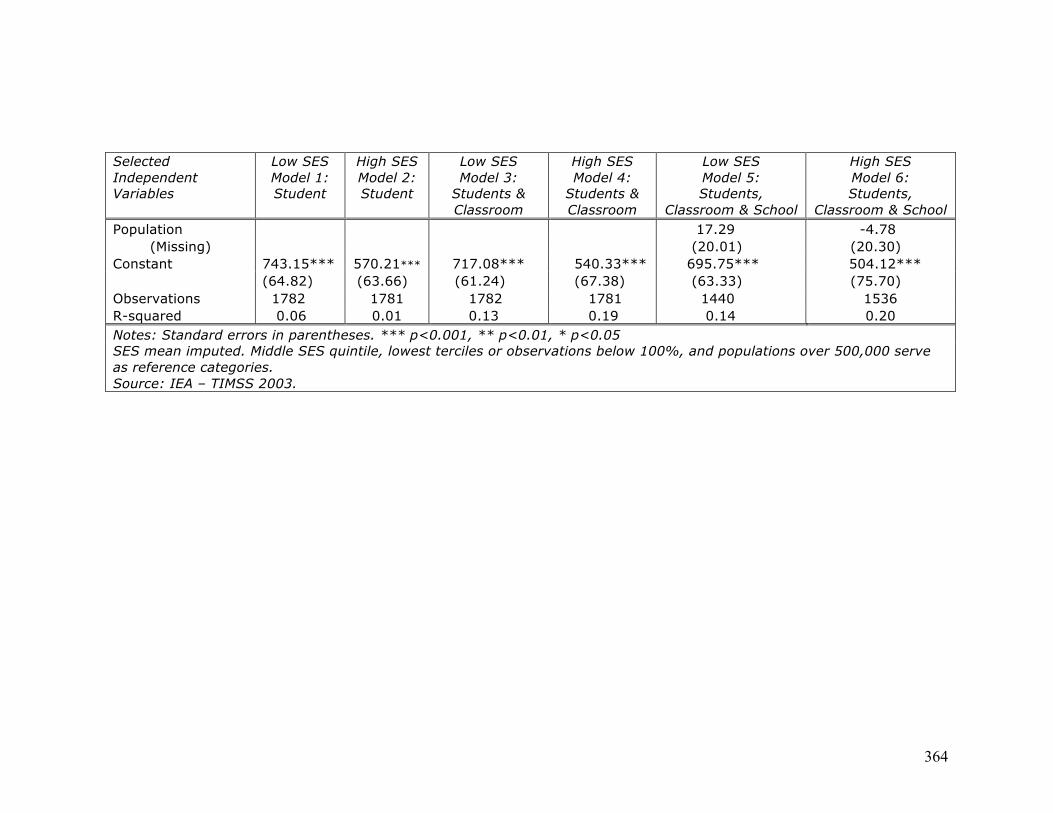
364
Selected Independent Variables
Low SES Model 1: Student
High SES Model 2: Student
Low SES Model 3:
Students & Classroom
High SES Model 4:
Students & Classroom
Low SES Model 5: Students,
Classroom & School
High SES Model 6: Students,
Classroom & School Population 17.29 -4.78
(Missing) (20.01) (20.30) Constant 743.15*** 570.21*** 717.08*** 540.33*** 695.75*** 504.12*** (64.82) (63.66) (61.24) (67.38) (63.33) (75.70) Observations 1782 1781 1782 1781 1440 1536 R-squared 0.06 0.01 0.13 0.19 0.14 0.20 Notes: Standard errors in parentheses. *** p<0.001, ** p<0.01, * p<0.05 SES mean imputed. Middle SES quintile, lowest terciles or observations below 100%, and populations over 500,000 serve as reference categories. Source: IEA – TIMSS 2003.
365
Appendix 7: Production Function Results for Low GNI Per Capita Countries Participating in Both PISA AND TIMSS, by High and Low
SES Quintiles

366
TABLE 87. ESTIMATED OLS COEFFICIENTS OF PISA 2003 MATH ACHIEVEMENT SCORES ON STUDENT CHARACTERISTICS, CLASSROOM RESOURCES, AND SCHOOL CAPACITY IN HUNGARY FOR LOW AND HIGH SES QUINTILES
Selected Independent Variables
Low SES Model 1: Student
High SES Model 2: Student
Low SES Model 3:
Students & Classroom
High SES Model 4:
Students & Classroom
Low SES Model 5: Students,
Classroom & School
High SES Model 6: Students,
Classroom & School Student Characteristics
SES 51.16*** 29.31** 37.68*** 15.40 28.30*** 12.79 (7.55) (9.31) (7.74) (9.06) (8.08) (8.59) Female -12.73* -9.43 -21.52*** -25.07*** -23.65*** -27.03***
(5.91) (6.10) (6.22) (6.09) (6.34) (6.40) Age 15.09 29.39*** -16.4 -15.95 -18.96 -10.34
(10.35) (8.45) (11.10) (11.98) (11.19) (11.77) Classroom Resources
Grade 50.59*** 45.82*** 50.51*** 41.83*** (10th – 12th) (7.09) (7.89) (6.83) (7.82)
Math time -1.36 9.87 0.05 11.72 (Middle tercile) (9.37) (6.45) (8.71) (6.27)
Math time -9.72 16.13 -2.76 15.79 (High tercile) (9.74) (9.07) (9.94) (10.08)
Math time -52.74*** -56.32*** -41.70*** -54.06*** (Missing) (11.55) (12.38) (11.47) (12.58)
Class size -2.38 -19.71** -1.33 -14.33 (Middle tercile) (11.84) (7.23) (10.99) (7.50)
Class size 20.63 -37.68*** 16.94 -29.25** (High tercile) (13.01) (8.00) (12.29) (8.90)
Class size -8.08 -11.70 7.69 -5.94 (Missing) (15.94) (21.48) (14.88) (19.53)
Teacher Certified -6.28 11.50 -10.07 6.74 (100 percent) (13.55) (16.90) (14.26) (17.36)
Table continues on next page.

367
Selected Independent Variables
Low SES Model 1: Student
High SES Model 2: Student
Low SES Model 3:
Students & Classroom
High SES Model 4:
Students & Classroom
Low SES Model 5: Students,
Classroom & School
High SES Model 6: Students,
Classroom & School Teacher certified -25.83 30.74 -23.15 21.23
(Missing) (16.60) (32.14) (17.60) (28.18) T. Pedagogy Degree 18.34 45.10** 26.43 46.08**
(100 percent) (14.71) (14.35) (15.56) (14.48) T. Pedagogy Degree 13.47 3.76 4.87 8.20
(Missing) (19.70) (31.75) (17.48) (27.76) T. Math Degree 14.13 65.84** 21.14 41.75
(100 percent) (14.34) (23.00) (16.04) (26.05) T. Math Degree 10.66 46.21 12.75 21.69
(Missing) (16.56) (25.93) (14.45) (26.38) School Capacity
School size 5.36 29.24* (Middle tercile) (11.42) (11.51)
School size -0.10 32.78** (High tercile) (13.19) (11.06)
School size -27.32 72.09** (Missing) (22.69) (22.08)
School resources -10.27 -1.87 (Middle tercile) (12.73) (11.93)
School resources 1.67 10.99 (High tercile) (11.14) (10.21)
School resources -19.70 -55.38 (Missing) (26.20) (28.75)
Population -82.63*** 0.00 (below 3K) (20.17) 0.00
Population -48.34** -16.18 (3K -15K) (16.54) (18.62)
Table continues on next page.
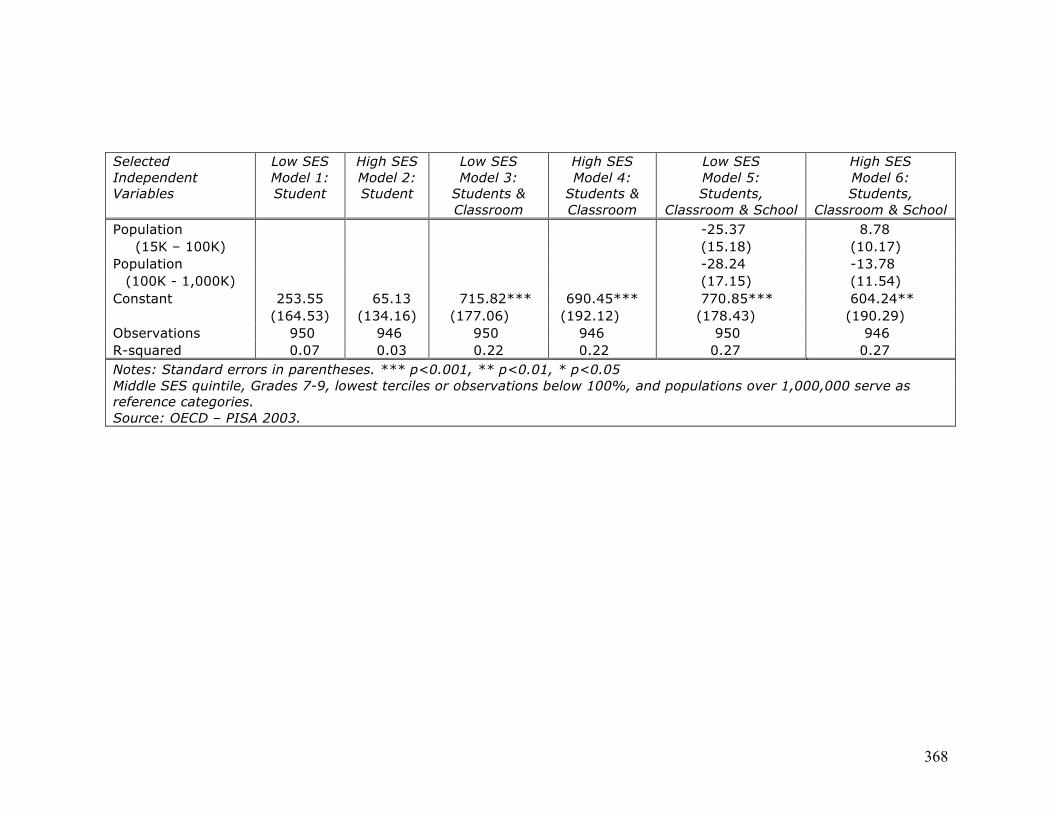
368
Selected Independent Variables
Low SES Model 1: Student
High SES Model 2: Student
Low SES Model 3:
Students & Classroom
High SES Model 4:
Students & Classroom
Low SES Model 5: Students,
Classroom & School
High SES Model 6: Students,
Classroom & School Population -25.37 8.78
(15K – 100K) (15.18) (10.17) Population -28.24 -13.78
(100K - 1,000K) (17.15) (11.54) Constant 253.55 65.13 715.82*** 690.45*** 770.85*** 604.24** (164.53) (134.16) (177.06) (192.12) (178.43) (190.29) Observations 950 946 950 946 950 946 R-squared 0.07 0.03 0.22 0.22 0.27 0.27 Notes: Standard errors in parentheses. *** p<0.001, ** p<0.01, * p<0.05 Middle SES quintile, Grades 7-9, lowest terciles or observations below 100%, and populations over 1,000,000 serve as reference categories. Source: OECD – PISA 2003.

369
TABLE 88. ESTIMATED OLS COEFFICIENTS OF TIMSS 2003 MATH ACHIEVEMENT SCORES ON STUDENT CHARACTERISTICS, CLASSROOM RESOURCES, AND SCHOOL CAPACITY IN HUNGARY FOR LOW AND HIGH SES QUINTILES
Selected Independent Variables
Low SES Model 1: Student
High SES Model 2: Student
Low SES Model 3:
Students & Classroom
High SES Model 4:
Students & Classroom
Low SES Model 5: Students,
Classroom & School
High SES Model 6: Students,
Classroom & School Student Characteristics
SES 45.83*** 46.91** 45.96*** 45.16* 46.10*** 45.23* (6.11) (17.32) (5.91) (17.58) (5.68) (18.42) Female -11.40 -12.35 -10.66 -13.17* -11.90 -12.12
(6.60) (6.45) (6.52) (6.06) (6.67) (6.70) Age -24.23*** -14.14 -23.83*** -17.92* -24.34*** -15.59*
(4.38) (8.20) (4.65) (7.77) (4.64) (7.70) Classroom Resources
% Alg. + Geo. 9.50 -2.65 9.72 -5.47 (Middle tercile) (6.90) (10.02) (7.69) (8.96)
% Alg. + Geo. 2.13 2.26 1.24 2.05 (High tercile) (8.62) (10.32) (8.10) (9.20)
% Alg. + Geo. 11.52 4.29 8.05 3.06 (Missing) (11.92) (17.75) (12.46) (18.02)
Overall Math Time 5.27 13.36 4.36 16.99* (Upper 50%) (9.28) (7.57) (9.70) (7.55)
Class Size -4.51 15.36 1.44 11.65 (25-32 students) (7.24) (8.45) (8.96) (9.58)
Class Size 8.05 16.35 10.85 16.53 (33+ students) (15.52) (26.28) (22.48) (21.27)
Class Size 0.90 -15.5 4.67 -16.22 (Missing) (14.44) (21.64) (17.67) (23.38)
T. Math Degree 0.00 0.00 -6.29 0.00 (Required) (183.07) (226.39) (25.07) (188.41)
Table continues on next page.
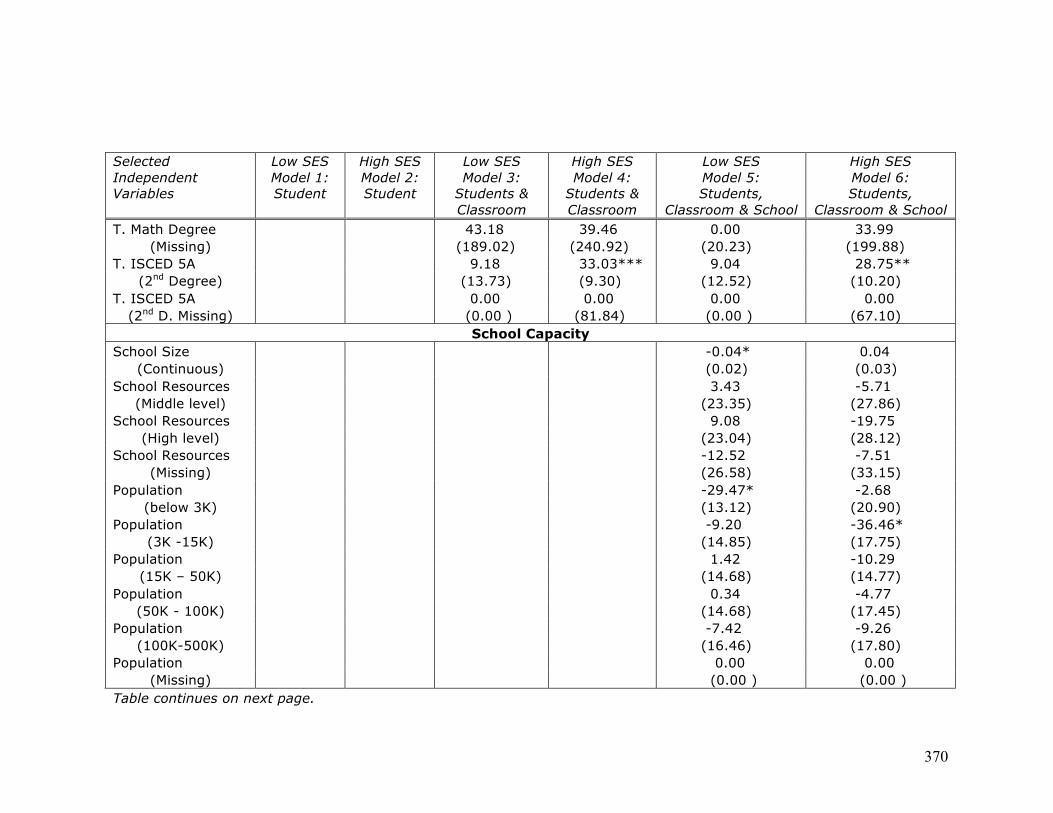
370
Selected Independent Variables
Low SES Model 1: Student
High SES Model 2: Student
Low SES Model 3:
Students & Classroom
High SES Model 4:
Students & Classroom
Low SES Model 5: Students,
Classroom & School
High SES Model 6: Students,
Classroom & School T. Math Degree 43.18 39.46 0.00 33.99
(Missing) (189.02) (240.92) (20.23) (199.88) T. ISCED 5A 9.18 33.03*** 9.04 28.75**
(2nd Degree) (13.73) (9.30) (12.52) (10.20) T. ISCED 5A 0.00 0.00 0.00 0.00
(2nd D. Missing) (0.00 ) (81.84) (0.00 ) (67.10) School Capacity
School Size -0.04* 0.04 (Continuous) (0.02) (0.03)
School Resources 3.43 -5.71 (Middle level) (23.35) (27.86)
School Resources 9.08 -19.75 (High level) (23.04) (28.12)
School Resources -12.52 -7.51 (Missing) (26.58) (33.15)
Population -29.47* -2.68 (below 3K) (13.12) (20.90)
Population -9.20 -36.46* (3K -15K) (14.85) (17.75)
Population 1.42 -10.29 (15K – 50K) (14.68) (14.77)
Population 0.34 -4.77 (50K - 100K) (14.68) (17.45)
Population -7.42 -9.26 (100K-500K) (16.46) (17.80)
Population 0.00 0.00 (Missing) (0.00 ) (0.00 )
Table continues on next page.
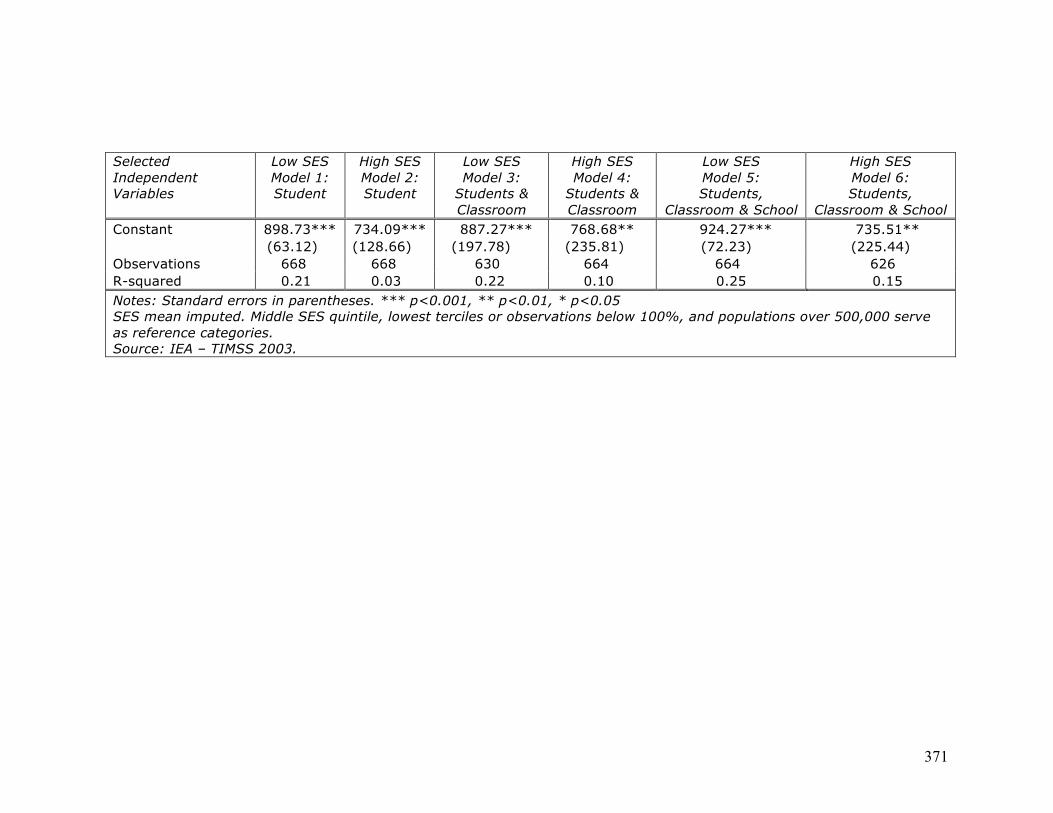
371
Selected Independent Variables
Low SES Model 1: Student
High SES Model 2: Student
Low SES Model 3:
Students & Classroom
High SES Model 4:
Students & Classroom
Low SES Model 5: Students,
Classroom & School
High SES Model 6: Students,
Classroom & School Constant 898.73*** 734.09*** 887.27*** 768.68** 924.27*** 735.51** (63.12) (128.66) (197.78) (235.81) (72.23) (225.44) Observations 668 668 630 664 664 626 R-squared 0.21 0.03 0.22 0.10 0.25 0.15 Notes: Standard errors in parentheses. *** p<0.001, ** p<0.01, * p<0.05 SES mean imputed. Middle SES quintile, lowest terciles or observations below 100%, and populations over 500,000 serve as reference categories. Source: IEA – TIMSS 2003.

372
TABLE 89. ESTIMATED OLS COEFFICIENTS OF PISA 2003 MATH ACHIEVEMENT SCORES ON STUDENT CHARACTERISTICS, CLASSROOM RESOURCES, AND SCHOOL CAPACITY IN THE SLOVAK REPUBLIC FOR LOW AND HIGH SES QUINTILES
Selected Independent Variables
Low SES Model 1: Student
High SES Model 2: Student
Low SES Model 3:
Students & Classroom
High SES Model 4:
Students & Classroom
Low SES Model 5: Students,
Classroom & School
High SES Model 6: Students,
Classroom & School Student Characteristics
SES 52.36*** 40.53*** 35.40*** 27.13** 32.04*** 23.21** (9.65) (9.10) (8.40) (8.46) (8.26) (8.16) Female -25.53*** -11.88* -29.21*** -17.60*** -28.30*** -17.59***
(5.28) (5.69) (4.76) (5.03) (4.95) (5.08) Age -2.06 -4.86 -22.86 -27.55 -28.25* -26.79
(12.25) (13.97) (12.85) (16.88) (12.51) (16.23) Classroom Resources
Grade 24.94 19.70 34.08 27.06* (10th – 12th) (15.25) (10.94) (17.93) (10.58)
Math time -18.76 -26.46** -19.97* -26.70*** (Middle tercile) (9.97) (8.89) (9.93) (8.00)
Math time -2.60 -27.93** -2.05 -29.78** (High tercile) (7.97) (10.27) (7.77) (9.34)
Math time -60.75*** -67.51*** -60.18*** -63.50*** (Missing) (8.89) (10.05) (8.81) (9.55)
Class size -20.03*** -13.80 -15.00** -1.07 (Middle tercile) (5.86) (8.91) (5.54) (7.86)
Class size 20.05* 1.94 15.09 -1.37 (High tercile) (9.61) (6.67) (9.30) (6.07)
Class size -35.17 14.57 -39.29* 11.94 (Missing) (19.01) (30.50) (18.21) (29.78)
Teacher Certified 1.47 41.74** 1.73 35.39*** (Middle tercile) (13.51) (12.70) (14.22) (10.08)
Table continues on next page.

373
Selected Independent Variables
Low SES Model 1: Student
High SES Model 2: Student
Low SES Model 3:
Students & Classroom
High SES Model 4:
Students & Classroom
Low SES Model 5: Students,
Classroom & School
High SES Model 6: Students,
Classroom & School Teacher Certified 11.46 20.46 8.69 20.61
(High tercile) (11.13) (14.30) (12.36) (11.76) Teacher certified 6.72 36.98* 6.37 43.65***
(Missing) (14.43) (15.00) (15.23) (11.96) T. Pedagogy Degree 8.95 11.83 6.69 7.82
(Middle tercile) (9.93) (11.10) (10.15) (9.84) T. Pedagogy Degree 3.55 0.48 7.82 1.48
(High tercile) (13.41) (11.40) (14.54) (10.42) T. Pedagogy Degree -15.89 12.60 -16.88 1.37
(Missing) (25.11) (18.57) (24.73) (16.64) T. Math Degree 21.99** 7.71 20.15* -0.73
(100 percent) (7.84) (10.81) (8.30) (10.24) T. Math Degree 41.72** -2.98 45.84*** -7.38
(Missing) (14.71) (16.68) (13.81) (14.80) School Capacity
School size -13.46 -29.33*** (Middle tercile) (11.37) (7.98)
School size -4.99 -0.85 (High tercile) (8.36) (7.56)
School size -18.71 -42.84 (Missing) (14.76) (25.21)
School resources 3.21 0.68 (Middle tercile) (9.36) (8.05)
School resources -2.55 -19.45* (High tercile) (11.35) (8.92)
School resources 30.53 53.62 (Missing) (19.51) (22.68)
Table continues on next page.
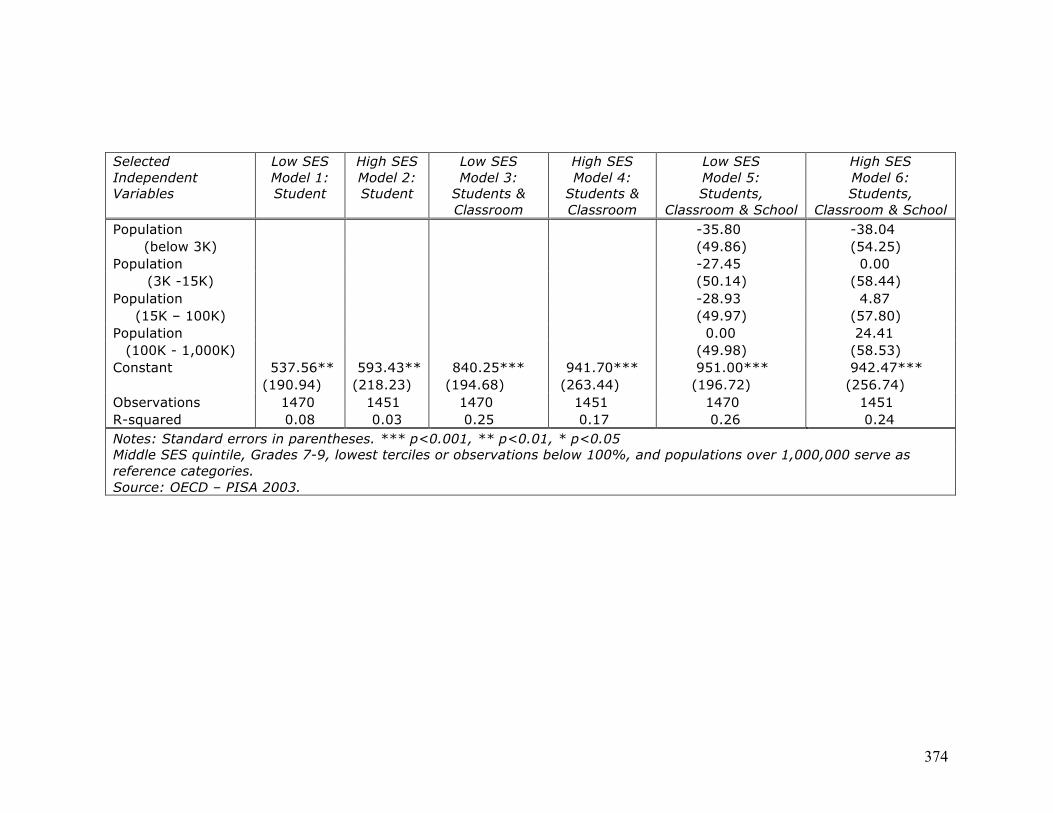
374
Selected Independent Variables
Low SES Model 1: Student
High SES Model 2: Student
Low SES Model 3:
Students & Classroom
High SES Model 4:
Students & Classroom
Low SES Model 5: Students,
Classroom & School
High SES Model 6: Students,
Classroom & School Population -35.80 -38.04
(below 3K) (49.86) (54.25) Population -27.45 0.00
(3K -15K) (50.14) (58.44) Population -28.93 4.87
(15K – 100K) (49.97) (57.80) Population 0.00 24.41
(100K - 1,000K) (49.98) (58.53) Constant 537.56** 593.43** 840.25*** 941.70*** 951.00*** 942.47*** (190.94) (218.23) (194.68) (263.44) (196.72) (256.74) Observations 1470 1451 1470 1451 1470 1451 R-squared 0.08 0.03 0.25 0.17 0.26 0.24 Notes: Standard errors in parentheses. *** p<0.001, ** p<0.01, * p<0.05 Middle SES quintile, Grades 7-9, lowest terciles or observations below 100%, and populations over 1,000,000 serve as reference categories. Source: OECD – PISA 2003.

375
TABLE 90. ESTIMATED OLS COEFFICIENTS OF TIMSS 2003 MATH ACHIEVEMENT SCORES ON STUDENT CHARACTERISTICS, CLASSROOM RESOURCES, AND SCHOOL CAPACITY IN THE SLOVAK REPUBLIC FOR LOW AND HIGH SES QUINTILES
Selected Independent Variables
Low SES Model 1: Student
High SES Model 2: Student
Low SES Model 3:
Students & Classroom
High SES Model 4:
Students & Classroom
Low SES Model 5: Students,
Classroom & School
High SES Model 6: Students,
Classroom & School Student Characteristics
SES 36.72*** 40.13*** 34.95*** 37.38*** 33.36*** 29.12** (7.13) (10.41) (7.33) (10.31) (7.24) (9.74) Female -3.83 -3.36 -4.32 -3.08 -4.52 -2.92
(6.35) (7.89) (6.56) (8.16) (6.56) (8.40) Age -27.98*** -29.61** -29.76*** -30.24** -30.25*** -28.45**
(5.49) (10.48) (5.35) (9.79) (5.50) (8.95) Classroom Resources
% Alg. + Geo. 12.09 4.33 10.43 -7.81 (Middle tercile) (8.39) (8.81) (8.87) (9.07)
% Alg. + Geo. 8.33 13.96 5.95 2.82 (High tercile) (11.05) (10.46) (11.21) (11.30)
% Alg. + Geo. 36.02 26.60 31.95 4.33 (Missing) (26.43) (25.82) (17.31) (24.26)
Overall Math Time 13.40 4.71 14.79* 10.90 (Upper 50%) (6.86) (8.72) (7.44) (9.36)
Overall Math Time 0.00 0.00 0.00 0.00 (Missing) 0.00 0.00 0.00 0.00
Class Size 6.35 14.56 4.25 15.79 (25-32 students) (8.63) (10.79) (9.66) (11.61)
Class Size 20.5 66.19** 20.51 70.38** (33+ students) (13.11) (21.29) (15.16) (21.97)
Class Size 21.26 23.47 36.09 76.66** (Missing) (17.20) (61.17) (63.58) (27.61)
Table continues on next page.

376
Selected Independent Variables
Low SES Model 1: Student
High SES Model 2: Student
Low SES Model 3:
Students & Classroom
High SES Model 4:
Students & Classroom
Low SES Model 5: Students,
Classroom & School
High SES Model 6: Students,
Classroom & School T. Math Degree -16.21 15.88 -37.67 10.03
(Required) (27.14) (61.17) (24.19) (57.45) T. Math Degree 58.92*** 36.91* 62.69*** 33.98
(Missing) (12.64) (14.63) (15.27) (17.79) T. ISCED 5A -16.59 -14.76 -14.37 -10.70
(2nd Degree) (9.94) (18.24) (10.06) (19.32) T. ISCED 5A -24.20 -145.70 -25.01 -128.55
(2nd D. Missing) (33.33) (134.01) (41.97) (116.36) School Capacity
School Size 0.01 -0.02 (Continuous) (0.02) (0.02)
School Resources -8.94 -11.69 (Middle level) (11.64) (17.25)
School Resources -1.20 -14.01 (High level) (15.71) (19.47)
School Resources 14.47 14.21 (Missing) (13.91) (47.87)
Population -17.07 -17.20 (below 3K) (75.94) (33.31)
Population -23.76 -7.03 (3K -15K) (75.00) (34.46)
Population -16.25 8.18 (15K – 50K) (74.41) (33.79)
Population 8.97 26.71 (50K - 100K) (76.22) (33.01)
Population -18.31 15.84 (100K-500K) (76.90) (31.08)
Table continues on next page.

377
Selected Independent Variables
Low SES Model 1: Student
High SES Model 2: Student
Low SES Model 3:
Students & Classroom
High SES Model 4:
Students & Classroom
Low SES Model 5: Students,
Classroom & School
High SES Model 6: Students,
Classroom & School Population 0.00 70.20*
(Missing) 0.00 (30.31) Constant 907.23*** 935.14*** 915.90*** 926.06*** 939.07*** 928.11*** (74.78) (147.95) (72.82) (137.53) (108.00) (144.14) Observations 846 840 846 840 839 836 R-squared 0.11 0.06 0.14 0.14 0.15 0.19 Notes: Standard errors in parentheses. *** p<0.001, ** p<0.01, * p<0.05 SES mean imputed. Middle SES quintile, lowest terciles or observations below 100%, and populations over 500,000 serve as reference categories. Source: IEA – TIMSS 2003.
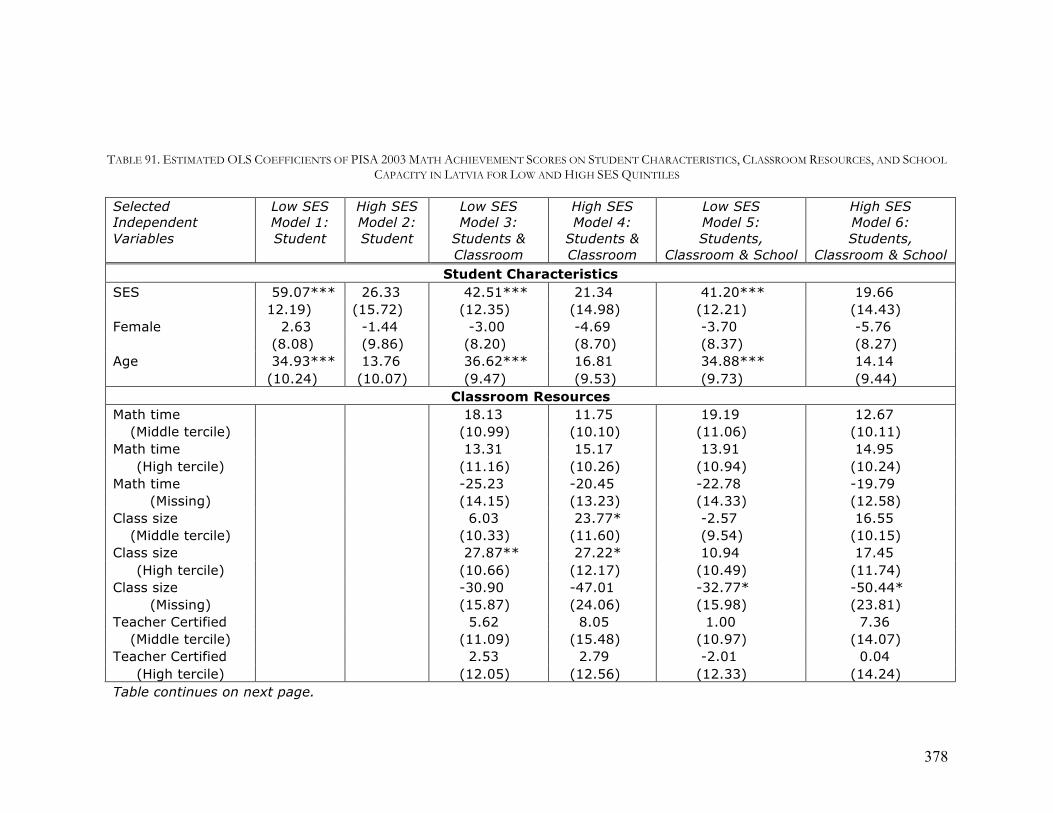
378
TABLE 91. ESTIMATED OLS COEFFICIENTS OF PISA 2003 MATH ACHIEVEMENT SCORES ON STUDENT CHARACTERISTICS, CLASSROOM RESOURCES, AND SCHOOL CAPACITY IN LATVIA FOR LOW AND HIGH SES QUINTILES
Selected Independent Variables
Low SES Model 1: Student
High SES Model 2: Student
Low SES Model 3:
Students & Classroom
High SES Model 4:
Students & Classroom
Low SES Model 5: Students,
Classroom & School
High SES Model 6: Students,
Classroom & School Student Characteristics
SES 59.07*** 26.33 42.51*** 21.34 41.20*** 19.66 12.19) (15.72) (12.35) (14.98) (12.21) (14.43) Female 2.63 -1.44 -3.00 -4.69 -3.70 -5.76
(8.08) (9.86) (8.20) (8.70) (8.37) (8.27) Age 34.93*** 13.76 36.62*** 16.81 34.88*** 14.14
(10.24) (10.07) (9.47) (9.53) (9.73) (9.44) Classroom Resources
Math time 18.13 11.75 19.19 12.67 (Middle tercile) (10.99) (10.10) (11.06) (10.11)
Math time 13.31 15.17 13.91 14.95 (High tercile) (11.16) (10.26) (10.94) (10.24)
Math time -25.23 -20.45 -22.78 -19.79 (Missing) (14.15) (13.23) (14.33) (12.58)
Class size 6.03 23.77* -2.57 16.55 (Middle tercile) (10.33) (11.60) (9.54) (10.15)
Class size 27.87** 27.22* 10.94 17.45 (High tercile) (10.66) (12.17) (10.49) (11.74)
Class size -30.90 -47.01 -32.77* -50.44* (Missing) (15.87) (24.06) (15.98) (23.81)
Teacher Certified 5.62 8.05 1.00 7.36 (Middle tercile) (11.09) (15.48) (10.97) (14.07)
Teacher Certified 2.53 2.79 -2.01 0.04 (High tercile) (12.05) (12.56) (12.33) (14.24)
Table continues on next page.

379
Selected Independent Variables
Low SES Model 1: Student
High SES Model 2: Student
Low SES Model 3:
Students & Classroom
High SES Model 4:
Students & Classroom
Low SES Model 5: Students,
Classroom & School
High SES Model 6: Students,
Classroom & School Teacher certified -5.69 -8.63 -13.95 -15.27
(Missing) (13.03) (20.77) (13.61) (17.99) T. Pedagogy Degree -4.06 -3.90 -3.75 -5.32
(Middle tercile) (10.80) (15.10) (10.35) (15.34) T. Pedagogy Degree 4.74 7.98 1.57 3.18
(High tercile) (12.29) (14.79) (12.90) (15.53) T. Pedagogy Degree -14.67 -17.78 -18.19 -20.05
(Missing) (12.45) (20.92) (13.11) (18.40) T. Math Degree 9.31 5.04 10.10 8.43
(100 percent) (14.42) (15.30) (14.26) (15.09) T. Math Degree -14.26 -5.84 -11.39 -2.64
(Missing) (12.50) (16.51) (11.94) (16.16) School Capacity
School size 4.10 22.95 (Middle tercile) (10.74) (17.80)
School size 22.86 30.40 (High tercile) (12.66) (17.53)
School size -2.22 53.96* (Missing) (21.99) (25.76)
School resources 5.02 -12.00 (Middle tercile) (9.15) (11.68)
School resources 7.32 8.00 (High tercile) (12.14) (15.81)
School resources 0.00 0.00 (Missing) (0.00 ) (0.00)
Population -3.74 2.36 (below 3K) (15.35) (16.00)
Table continues on next page.

380
Selected Independent Variables
Low SES Model 1: Student
High SES Model 2: Student
Low SES Model 3:
Students & Classroom
High SES Model 4:
Students & Classroom
Low SES Model 5: Students,
Classroom & School
High SES Model 6: Students,
Classroom & School Population 6.13 0.00
(3K -15K) (13.57) (13.69) Population 10.03 -2.76
(15K – 100K) (15.46) (18.02) Population 0.00 -14.72
(100K - 1,000K) (13.14) (19.82) Constant -57.64 274.75 -97.41 210.43 -74.41 251.39 (164.69) (157.04) (150.58) (157.27) (155.83) (155.79) Observations 920 916 920 916 920 916 R-squared 0.07 0.01 0.16 0.09 0.17 0.11 Notes: Standard errors in parentheses. *** p<0.001, ** p<0.01, * p<0.05 Middle SES quintile, Grades 7-9, lowest terciles or observations below 100%, and populations over 1,000,000 serve as reference categories. Source: OECD – PISA 2003.

381
TABLE 92. ESTIMATED OLS COEFFICIENTS OF TIMSS 2003 MATH ACHIEVEMENT SCORES ON STUDENT CHARACTERISTICS, CLASSROOM RESOURCES, AND SCHOOL CAPACITY IN LATVIA FOR LOW AND HIGH SES QUINTILES
Selected Independent Variables
Low SES Model 1: Student
High SES Model 2: Student
Low SES Model 3:
Students & Classroom
High SES Model 4:
Students & Classroom
Low SES Model 5: Students,
Classroom & School
High SES Model 6: Students,
Classroom & School Student Characteristics
SES 2.53*** 9.55 20.56*** 10.31 22.35*** 21.10 (6.22) (12.28) (6.20) (11.95) (6.77) (13.29) Female 5.43 -1.18 2.92 -0.33 6.96 -3.06
(6.03) (6.36) (5.98) (6.21) (5.70) (6.50) Age -17.64** 27.87*** -16.33** -29.24*** -16.61** -30.22***
(5.46) (7.41) (5.08) (7.58) (5.60) (6.24) Classroom Resources
% Alg. + Geo. 0.73 8.49 -1.19 5.20 (Middle tercile) (8.20) (10.62) (8.93) (11.51)
% Alg. + Geo. 1.00 27.25 4.20 20.98 (High tercile) (14.57) (16.40) (13.74) (15.83)
% Alg. + Geo. -10.60 1.05 -19.7 -5.94 (Missing) (15.00) (19.21) (14.69) (21.13)
Overall Math Time -7.88 -4.80 -4.37 -0.01 (Upper 50%) (7.23) (9.24) (7.81) (9.64)
Class Size 19.47* 6.88 7.60 7.12 (25-32 students) (9.26) (10.44) (14.08) (13.51)
Class Size 7.61 1.60 12.83 6.32 (33+ students) (10.92) (13.12) (14.05) (17.46)
Class Size 3.78 21.21 -9.55 15.74 (Missing) (12.19) (18.12) (16.96) (20.91)
Table continues on next page.

382
Selected Independent Variables
Low SES Model 1: Student
High SES Model 2: Student
Low SES Model 3:
Students & Classroom
High SES Model 4:
Students & Classroom
Low SES Model 5: Students,
Classroom & School
High SES Model 6: Students,
Classroom & School T. Math Degree -17.07 10.82 -9.00 16.72
(Required) (9.84) (13.75) (8.69) (12.96) T. Math Degree -37.89* 4.65 -21.42 8.51
(Missing) (16.86) (14.78) (24.97) (18.71) T. ISCED 5A 0.00 0.00 0.00 0.00
(2nd Degree) 0.00 0.00 0.00 0.00 T. ISCED 5A 50.05** -5.30 40.65 28.16
(2nd D. Missing) (16.86) (30.36) (26.86) (37.19) School Capacity
School Size 0.00 -0.01 (Continuous) (0.02) (0.02)
School Resources 21.97* -1.04 (Middle level) (10.67) (17.55)
School Resources 14.20 -10.01 (High level) (17.36) (22.80)
School Resources 21.18 -1.21 (Missing) (16.37) (20.04)
Population -3.75 -8.77 (below 3K) (13.49) (25.26)
Population 7.20 2.03 (3K -15K) (12.74) (19.44)
Population 18.05 2.30 (15K – 50K) (14.90) (12.64)
Population 4.22 -3.01 (50K - 100K) (15.31) (17.09)
Population 51.07** 33.36 (100K-500K) (18.05) (27.32)
Table continues on next page.

383
Selected Independent Variables
Low SES Model 1: Student
High SES Model 2: Student
Low SES Model 3:
Students & Classroom
High SES Model 4:
Students & Classroom
Low SES Model 5: Students,
Classroom & School
High SES Model 6: Students,
Classroom & School Population 0.00 0.00
(Missing) 0.00 0.00 Constant 777.93*** 949.45*** 764.08*** 947.41*** 743.66*** 958.93*** (82.14) (111.26) (76.15) (109.18) (93.66) (95.48) Observations 732 730 732 730 664 678 R-squared 0.05 0.04 0.09 0.06 0.13 0.10 Notes: Standard errors in parentheses. *** p<0.001, ** p<0.01, * p<0.05 SES mean imputed. Middle SES quintile, lowest terciles or observations below 100%, and populations over 500,000 serve as reference categories. Source: IEA – TIMSS 2003.

384
TABLE 93. ESTIMATED OLS COEFFICIENTS OF PISA 2003 MATH ACHIEVEMENT SCORES ON STUDENT CHARACTERISTICS, CLASSROOM RESOURCES, AND SCHOOL CAPACITY IN THE RUSSIAN FEDERATION FOR LOW AND HIGH SES QUINTILES
Selected Independent Variables
Low SES Model 1: Student
High SES Model 2: Student
Low SES Model 3:
Students & Classroom
High SES Model 4:
Students & Classroom
Low SES Model 5: Students,
Classroom & School
High SES Model 6: Students,
Classroom & School Student Characteristics
SES 61.16*** 36.87** 39.84*** 31.25** 36.77*** 22.28* (10.34) (12.95) (10.18) (11.75) (10.57) (10.47) Female -8.31 -9.99 -10.91 -12.02 -11.37 -15.49**
(6.21) (7.09) (6.45) (7.00) (6.47) (5.76) Age 14.20 -9.69 -7.22 -36.83** -7.01 -36.38**
(10.59) (11.58) (10.25) (12.56) (10.47) (12.87) Classroom Resources
Grade 32.26*** 38.92*** 34.00*** 35.38*** (10th – 12th) (8.52) (8.58) (8.66) (8.23)
Math time 14.77 20.24* 14.51 20.30* (Middle tercile) (7.85) (8.07) (7.75) (8.01)
Math time 31.56*** 35.40*** 30.49*** 37.05*** (High tercile) (8.63) (9.07) (8.22) (8.50)
Math time -51.58*** -27.70* -51.29*** -24.32* (Missing) (10.27) (11.90) (10.84) (11.41)
Class size 8.38 9.45 3.10 -6.71 (Middle tercile) (8.03) (8.40) (8.62) (7.88)
Class size 6.81 2.70 1.69 -8.90 (High tercile) (10.41) (9.96) (11.18) (8.98)
Class size 15.71 -67.27** 12.38 -76.57** (Missing) (31.66) (24.00) (29.36) (23.34)
Teacher Certified 6.97 -1.63 5.77 -4.20 (100 percent) (10.14) (9.09) (9.79) (9.46)
Table continues on next page.

385
Selected Independent Variables
Low SES Model 1: Student
High SES Model 2: Student
Low SES Model 3:
Students & Classroom
High SES Model 4:
Students & Classroom
Low SES Model 5: Students,
Classroom & School
High SES Model 6: Students,
Classroom & School Teacher certified -14.70 -46.28* -28.85 -15.73
(Missing) (23.36) (22.63) (35.42) (27.17) T. Pedagogy Degree 0.23 2.79 0.96 -1.38
(Middle tercile) (11.66) (11.11) (10.50) (8.45) T. Pedagogy Degree -1.56 7.12 -4.09 -0.60
(High tercile) (11.75) (9.99) (11.59) (9.61) T. Pedagogy Degree 33.89 57.92*** 38.49 17.37
(Missing) (23.82) (13.05) (37.53) (18.25) T. Math Degree -8.27 -10.35 -8.78 -7.80
(100 percent) (8.88) (8.71) (9.99) (7.85) T. Math Degree -15.89 20.64 -7.51 32.98
(Missing) (19.14) (27.09) (21.18) (28.33) School Capacity
School size 23.03 33.45** (Middle tercile) (11.89) (12.34)
School size 25.80* 22.77 (High tercile) (11.03) (12.06)
School size 11.78 24.84 (Missing) (14.66) (18.59)
School resources 5.53 1.11 (Middle tercile) (9.67) (8.61)
School resources 26.82* 19.36 (High tercile) (13.45) (14.78)
School resources 23.67 51.58* (Missing) (45.80) (23.49)
Population -7.10 -44.72* (below 3K) (16.83) (18.41)
Table continues on next page.

386
Selected Independent Variables
Low SES Model 1: Student
High SES Model 2: Student
Low SES Model 3:
Students & Classroom
High SES Model 4:
Students & Classroom
Low SES Model 5: Students,
Classroom & School
High SES Model 6: Students,
Classroom & School Population -28.94 -38.46**
(3K -15K) (14.92) (13.32) Population -22.00 -22.29
(15K – 100K) (13.77) (13.54) Population -20.08 -30.99**
(100K - 1,000K) (16.42) (10.27) Constant 276.45 634.78*** 567.66*** 1,023.68*** 560.78*** 1,037.73*** (167.25) (178.74) (159.91) (195.48) (160.88) (198.87) Observations 1228 1174 1228 1174 1228 1174 R-squared 0.04 0.02 0.14 0.12 0.17 0.18 Notes: Standard errors in parentheses. *** p<0.001, ** p<0.01, * p<0.05 Middle SES quintile, Grades 7-9, lowest terciles or observations below 100%, and populations over 1,000,000 serve as reference categories. Source: OECD – PISA 2003.

387
TABLE 94. ESTIMATED OLS COEFFICIENTS OF TIMSS 2003 MATH ACHIEVEMENT SCORES ON STUDENT CHARACTERISTICS, CLASSROOM RESOURCES, AND SCHOOL CAPACITY IN THE RUSSIAN FEDERATION FOR LOW AND HIGH SES QUINTILES
Selected Independent Variables
Low SES Model 1: Student
High SES Model 2: Student
Low SES Model 3:
Students & Classroom
High SES Model 4:
Students & Classroom
Low SES Model 5: Students,
Classroom & School
High SES Model 6: Students,
Classroom & School Student Characteristics
SES 21.60** 36.02** 21.08** 28.33** 22.19*** 23.90* (6.93) (11.10) (6.61) (10.49) (5.37) (10.10) Female 0.42 5.65 2.68 7.16 2.68 5.44
(4.59) (4.96) (4.36) (4.84) (4.21) (4.78) Age -16.24** 18.57** -16.61** -16.48* -14.78** -14.89*
(5.81) (6.99) (6.09) (6.42) (5.33) (6.91) Classroom Resources
% Alg. + Geo. -6.44 12.64 -6.49 13.80 (Middle tercile) (8.17) (9.14) (8.68) (8.62)
% Alg. + Geo. -6.80 5.75 -2.31 3.94 (High tercile) (10.89) (8.87) (10.25) (8.73)
% Alg. + Geo. 53.38 22.65 47.43 44.42 (Missing) (35.62) (24.14) (34.31) (41.00)
Overall Math Time 0.39 11.26 7.09 9.50 (Upper 50%) (8.91) (7.67) (9.19) (7.18)
Overall Math Time 0.00 0.00 (Missing) 0.00 0.00
Class Size -5.70 8.63 -9.20 1.22 (25-32 students) (10.41) (9.08) (12.28) (10.81)
Class Size -36.62 25.88* 12.75 30.62** (33+ students) (23.49) (11.22) (24.72) (11.77)
Class Size -25.99 -49.58* -26.03 -49.09* (Missing) (20.47) (20.99) (23.87) (22.64)
Table continues on next page.

388
Selected Independent Variables
Low SES Model 1: Student
High SES Model 2: Student
Low SES Model 3:
Students & Classroom
High SES Model 4:
Students & Classroom
Low SES Model 5: Students,
Classroom & School
High SES Model 6: Students,
Classroom & School T. Math Degree -35.76 -39.11 -36.67 -53.12
(Required) (35.96) (50.03) (34.09) (63.70) T. Math Degree 14.84 -86.47 -42.51 -131.60
(Missing) (50.37) (103.07) (63.27) (151.63) T. ISCED 5A 9.76 6.89 13.09 9.41
(2nd Degree) (8.51) (7.40) (8.49) (7.85) T. ISCED 5A 0.00 0.00
(2nd D. Missing) 0.00 0.00 School Capacity
School Size 0.01 0.02 (Continuous) (0.02) (0.02)
School Resources 13.43 15.64 (Middle level) (13.20) (9.31)
School Resources -1.59 13.83 (High level) (20.93) (15.15)
School Resources 23.97 -20.48 (Missing) (57.42) (69.20)
Population 2.42 0.55 (below 3K) (22.52) (17.28)
Population -8.97 -21.67 (3K -15K) (18.07) (13.17)
Population -16.96 -15.04 (15K – 50K) (17.96) (15.28)
Population -5.62 -26.51 (50K - 100K) (21.40) (14.07)
Population 22.43 0.67 (100K-500K) (16.22) (9.76)
Table continues on next page.
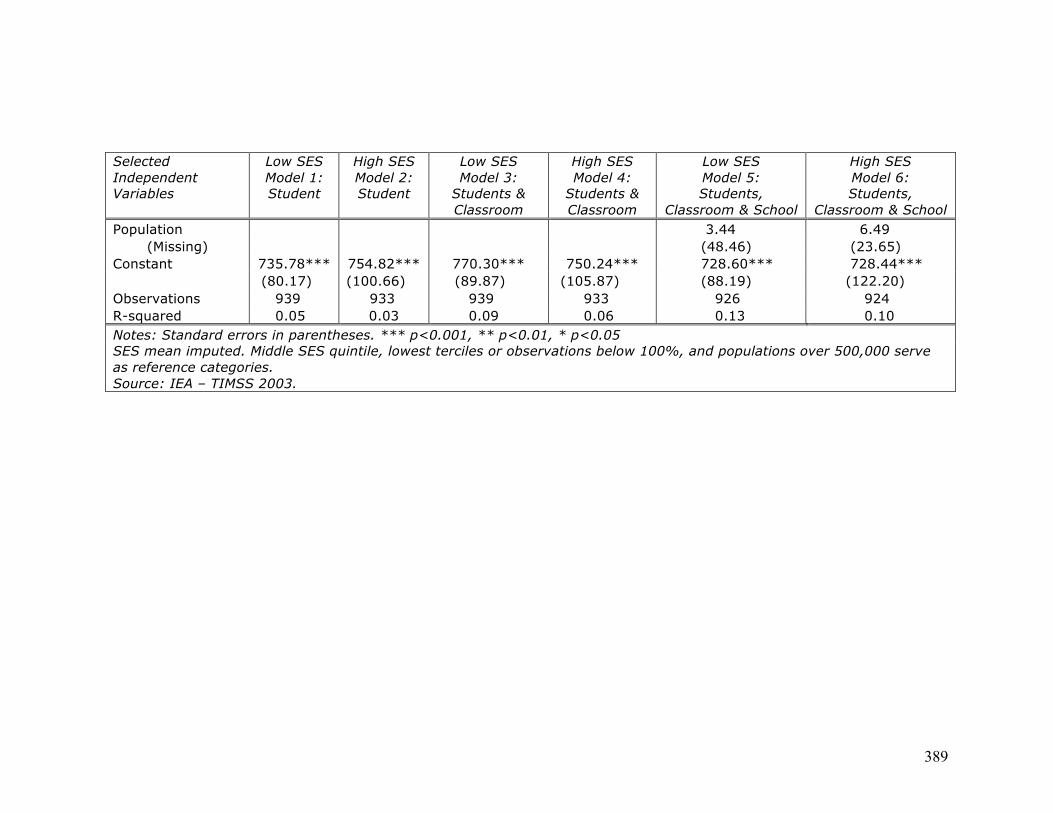
389
Selected Independent Variables
Low SES Model 1: Student
High SES Model 2: Student
Low SES Model 3:
Students & Classroom
High SES Model 4:
Students & Classroom
Low SES Model 5: Students,
Classroom & School
High SES Model 6: Students,
Classroom & School Population 3.44 6.49
(Missing) (48.46) (23.65) Constant 735.78*** 754.82*** 770.30*** 750.24*** 728.60*** 728.44*** (80.17) (100.66) (89.87) (105.87) (88.19) (122.20) Observations 939 933 939 933 926 924 R-squared 0.05 0.03 0.09 0.06 0.13 0.10 Notes: Standard errors in parentheses. *** p<0.001, ** p<0.01, * p<0.05 SES mean imputed. Middle SES quintile, lowest terciles or observations below 100%, and populations over 500,000 serve as reference categories. Source: IEA – TIMSS 2003.

390
TABLE 95. ESTIMATED OLS COEFFICIENTS OF PISA 2003 MATH ACHIEVEMENT SCORES ON STUDENT CHARACTERISTICS, CLASSROOM RESOURCES, AND SCHOOL CAPACITY IN TUNISIA FOR LOW AND HIGH SES QUINTILES
Selected Independent Variables
Low SES Model 1: Student
High SES Model 2: Student
Low SES Model 3:
Students & Classroom
High SES Model 4:
Students & Classroom
Low SES Model 5: Students,
Classroom & School
High SES Model 6: Students,
Classroom & School Student Characteristics
SES 12.72* 54.03*** 6.58 27.05*** 6.60 26.95*** (4.96) (7.56) (4.64) (5.28) (4.69) (5.22) Female -18.12*** -1.16 -26.20*** -15.43** -27.09*** -15.58**
(4.65) (6.59) (4.37) (5.38) (4.19) (5.35) Age 19.09* 1.57 8.06 -9.76 7.40 -9.53
(9.61) (11.33) (8.16) (8.27) (8.11) (8.40) Classroom Resources
Grade 79.76*** 104.50*** 77.72*** 102.94*** (10th – 12th) (8.48) (8.45) (9.79) (8.83)
Math time -5.60 -5.68 -5.55 -3.02 (Middle tercile) (7.66) (7.44) (7.89) (7.81)
Math time -11.19 -28.64*** -10.98 -25.04** (High tercile) (8.51) (8.13) (8.57) (7.71)
Math time -27.65** -22.25** -27.79** -20.70** (Missing) (8.74) (6.93) (8.96) (6.66)
Class size -15.62** -15.98 -16.56* -8.18 (Middle tercile) (5.82) (9.09) (6.72) (7.47)
Class size -22.90** -26.56** -25.78** -21.46** (High tercile) (7.77) (9.00) (8.51) (7.49)
Class size -29.03*** -19.55* -29.69*** -18.36* (Missing) (6.91) (8.68) (7.15) (8.39)
Teacher Certified -1.90 5.46 -4.97 4.65 (100 percent) (9.41) (13.20) (9.42) (12.69)
Table continues on next page.

391
Selected Independent Variables
Low SES Model 1: Student
High SES Model 2: Student
Low SES Model 3:
Students & Classroom
High SES Model 4:
Students & Classroom
Low SES Model 5: Students,
Classroom & School
High SES Model 6: Students,
Classroom & School Teacher certified 0.01 7.54 -0.09 6.73
(Missing) (8.23) (10.66) (8.41) (9.92) T. Math Degree -8.22 9.04 -7.32 6.15
(100 percent) (5.56) (7.96) (6.22) (7.85) T. Math Degree -4.25 -6.05 -7.07 -12.40
(Missing) (13.77) (15.33) (13.77) (16.28) School Capacity
School size 2.72 -16.96 (Middle tercile) (6.26) (10.46)
School size 10.45 -12.90 (High tercile) (7.80) (10.46)
School size 18.22 -38.50 (Missing) (15.06) (20.77)
School resources 4.91 6.97 (Middle tercile) (7.28) (10.22)
School resources 0.39 -9.27 (High tercile) (8.74) (10.01)
School resources 0.00 0.00 (Missing) 0.00 0.00
Population 7.95 -9.63 (below 3K) (19.77) (23.80)
Population 2.11 -13.58 (3K -15K) (12.52) (19.17)
Population 4.81 5.74 (15K – 100K) (13.56) (18.75)
Population 10.79 -3.84 (100K - 1,000K) (22.08) (19.92)
Table continues on next page.
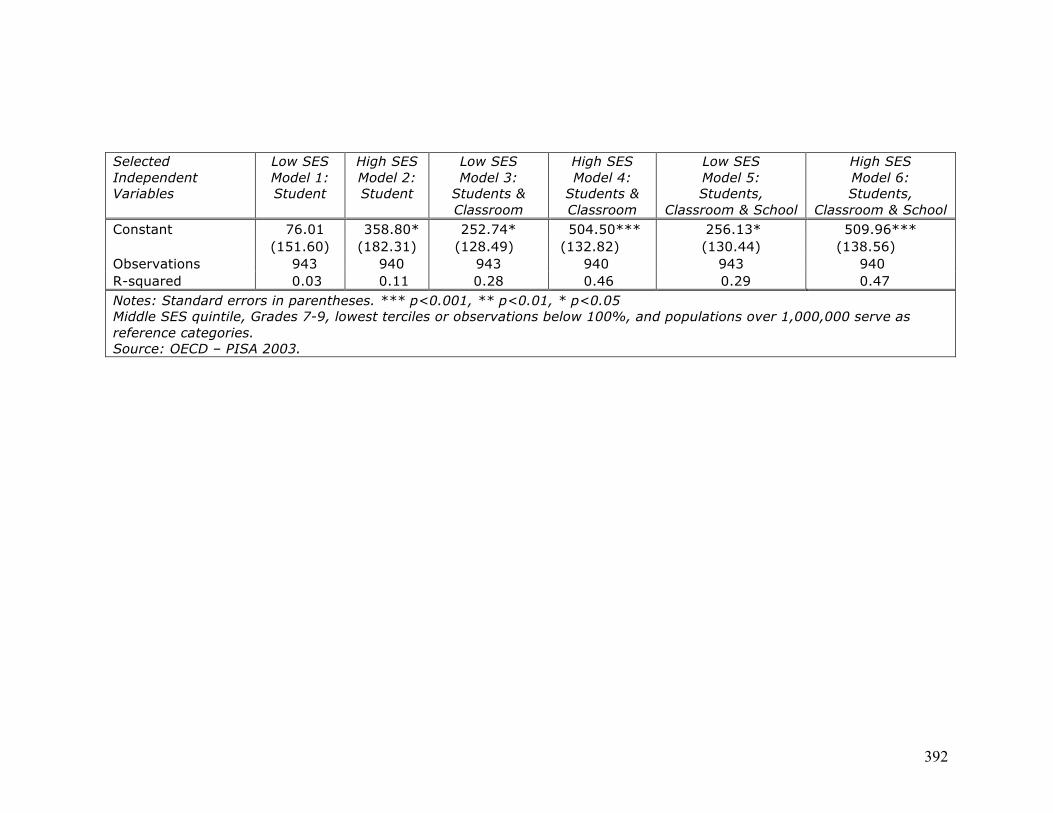
392
Selected Independent Variables
Low SES Model 1: Student
High SES Model 2: Student
Low SES Model 3:
Students & Classroom
High SES Model 4:
Students & Classroom
Low SES Model 5: Students,
Classroom & School
High SES Model 6: Students,
Classroom & School Constant 76.01 358.80* 252.74* 504.50*** 256.13* 509.96*** (151.60) (182.31) (128.49) (132.82) (130.44) (138.56) Observations 943 940 943 940 943 940 R-squared 0.03 0.11 0.28 0.46 0.29 0.47 Notes: Standard errors in parentheses. *** p<0.001, ** p<0.01, * p<0.05 Middle SES quintile, Grades 7-9, lowest terciles or observations below 100%, and populations over 1,000,000 serve as reference categories. Source: OECD – PISA 2003.

393
TABLE 96. ESTIMATED OLS COEFFICIENTS OF TIMSS 2003 MATH ACHIEVEMENT SCORES ON STUDENT CHARACTERISTICS, CLASSROOM RESOURCES, AND SCHOOL CAPACITY IN TUNISIA FOR LOW AND HIGH SES QUINTILES
Selected Independent Variables
Low SES Model 1: Student
High SES Model 2: Student
Low SES Model 3:
Students & Classroom
High SES Model 4:
Students & Classroom
Low SES Model 5: Students,
Classroom & School
High SES Model 6: Students,
Classroom & School Student Characteristics
SES 1.52 27.59*** 0.59 26.49*** 0.53 23.35*** (5.30) (6.49) (5.29) (5.85) (5.37) (6.01) Female -31.64*** -14.98*** -31.88*** -16.09*** -31.62*** -15.80***
(3.49) (3.88) (3.60) (3.80) (3.63) (3.51) Age -7.68*** -24.03*** -7.71*** -23.68*** -7.54*** -21.97***
(1.80) (2.57) (1.77) (2.42) (1.75) (2.18) Classroom Resources
% Alg. + Geo. 9.50* -1.47 9.55 -0.93 (Middle tercile) (4.49) (7.50) (5.06) (7.52)
% Alg. + Geo. 3.51 6.41 3.89 3.94 (High tercile) (5.99) (7.95) (6.58) (7.31)
% Alg. + Geo. 3.69 -7.05 3.78 -6.03 (Missing) (10.02) (9.16) (13.44) (10.01)
Overall Math Time -1.00 13.46* -2.54 8.68 (Upper 50%) (4.77) (6.81) (4.93) (7.28)
Class Size -4.81 -32.83* -8.35 -44.97** (25-32 students) (9.88) (14.14) (11.52) (16.49)
Class Size 3.90 -27.86 -0.09 -43.51* (33+ students) (9.39) (15.67) (11.18) (17.17)
Class Size 4.66 -24.50 2.52 -38.44* (Missing) (11.02) (15.29) (13.98) (17.66)
Table continues on next page.

394
Selected Independent Variables
Low SES Model 1: Student
High SES Model 2: Student
Low SES Model 3:
Students & Classroom
High SES Model 4:
Students & Classroom
Low SES Model 5: Students,
Classroom & School
High SES Model 6: Students,
Classroom & School T. Math Degree 0.00 -8.29 0.17 -11.58
(Required) (5.55) (6.39) (5.85) (6.22) T. Math Degree 13.84 -4.76 23.71* 5.07
(Missing) (9.95) (9.35) (10.25) (12.72) T. ISCED 5A -5.22 -21.42** -7.09 -18.18**
(2nd Degree) (6.35) (6.85) (6.81) (6.53) T. ISCED 5A 7.43 -12.98 7.94 -9.14
(2nd D. Missing) (12.53) (23.98) (14.92) (21.21) School Capacity
School Size 00.00 0.00 (Continuous) (0.01) (0.01)
School Resources 12.75 -1.54 (Middle level) (7.80) (13.32)
School Resources 21.95 6.99 (High level) (11.46) (15.49)
School Resources 3.01 -8.33 (Missing) (17.19) (15.06)
Population -7.76 -13.64 (3K -15K) (10.33) (12.11)
Population -2.08 2.05 (15K – 50K) (10.49) (12.14)
Population -0.30 16.18 (50K - 100K) (15.15) (14.44)
Population 3.74 3.39 (100K-500K) (31.77) (16.00)
Table continues on next page.

395
Selected Independent Variables
Low SES Model 1: Student
High SES Model 2: Student
Low SES Model 3:
Students & Classroom
High SES Model 4:
Students & Classroom
Low SES Model 5: Students,
Classroom & School
High SES Model 6: Students,
Classroom & School Population 4.94 23.19
(Missing) (22.60) (18.81) Constant 531.16*** 751.22*** 528.19*** 784.93*** 524.63*** 778.30*** (29.28) (38.84) (32.26) (42.14) (31.98) (43.86) Observations 991 986 991 986 931 929 R-squared 0.11 0.18 0.13 0.22 0.15 0.26 Notes: Standard errors in parentheses. *** p<0.001, ** p<0.01, * p<0.05 SES mean imputed. Middle SES quintile, lowest terciles or observations below 100%, and populations over 500,000 serve as reference categories. Source: IEA – TIMSS 2003.

396
References Alderson, A., & Nielsen, F. (2002). Globalization and the Great-Turn: Income
Inequality Trends in 16 OECD Countries. American Journal of Sociology, 197(5), 1244-1299.
Baker, D., Goesling, B., & LeTendre, G. (2002). Socioeconomic Status, School Quality, and National Economic Development: A Cross-National Analysis of the "Heyneman-Loxley Effect" on Mathematics and Science Achievement. Comparative Education Review, 46(3), 291-312.
Baker, D., & LeTendre, G. (2005). National Differences, Global Similarities: World Culture and the Future of Schooling. Stanford, CA: Stanford University Press.
Berne, R., & Stiefel, L. (1984). The Measurement of Equity in School Finance: Conceptual, Methodological, and Empirical Dimensions. Baltimore: The Johns Hopkins University Press.
Boedo, H. (2006). Former Communist Countries and their transition to Capitalism. Virginia Economics Online Papers. Retrieved from http://people.virginia.edu/~hjm5p/pdfs/communistweb.pdf
Bourdieu, P. (1977). Cultural Reproduction and Social Reproduction. In J. Karabel & A. H. Halsey (Eds.), Power and Ideology in Education (pp. 487-511). New York: Oxford University Press.
Bourdieu, P., & Passeron, J.-C. (1977). Reproduction in Education, Society, and Culture (R. Nice, Trans.). London: Sage Publications.
Bracey, G. (2003). PIRLS before the press. Phi Delta Kappan, 84(10), 795. Breen, R., Luijkx, R., Müller, W., & Pollak, R. (2005). Non-persistent inequality in
educational attainment: Evidence from eight European countries. Paper presented at the Start-Up Workshop of the EDUC Research Theme of the 6th EU Framework Network of Excellence "Economic Change, Quality of Life & Social Cohesion (EQUALSOC)”. Retrieved from http://www.ncbi.nlm.nih.gov/entrez/query.fcgi?db=pubmed&cmd=Retrieve&dopt=AbstractPlus&list_uids=13036903475856607867related:ewp9iaNi7LQJ
Buchmann, C. (2002). Measuring family background in international studies of education: Conceptual issues and Methodological Challenges. In A. C. P. a. A. Gamoran (Ed.), Methodological Advances in Cross-National Surveys of Educational Achievement, (Vol. National Research Council, Board on International Comparative Studies in Education). Washington, DC: National Academy Press.
Buchmann, C. (2003, June 30). Measuring Family Background: Conceptual issues and Methodological Challenges: A Presentation.
Carnoy, M. (1995). Benefits of Improving the Quality of Education. In M. Carnoy (Ed.), International encyclopedia of economics of education, 2nd ed. (pp. 154-158). Tarrytown, NY: Pergamon.
Carnoy, M., Marshall, J., & Socias, M. (2004). How do school inputs influence math scores? A comparative approach. Stanford: Stanford University School of Education.

397
Chiu, M. (2007). Familes , Economies, Cultures, and Science Achievement in 41 Countries: Country-, School-, and Student-Level Analyses. Journal of Family Psychology, 21(3), 510-519.
Chiu, M., & Khoo, L. (2005). Effects of resources, inequality, and privilege bias on achievement: Country, school, and student level analyses. American Educational Research Journal, 42(4), 575-603.
Chiu, M. M., & Khoo, L. (2005). Effects of Resources, Inequality, and Privilege Bias on Achievement: Country, School and Student Level Analyses. American Educational Research Journal, Vol. 42(No. 4), pp. 575–603.
Chuen, K. (2007). Income Distribution of Hong Kong and the Gini Coefficient. Retrieved February 11, 2010, from http://www.cop.gov.hk/eng/pdf/Income%20Distribution%20of%20HK%20and%20the%20Gini%20Coefficient.pdf
Coleman, J. (1966). Equality of Educational Opportunity. Washington, DC: US Department of Education, National Center for Education Statistics.
Coleman, J. (1987). Families and Schools. Educational Researcher, 16(6), 32-38. Darling–Hammond, L. (2000). Teacher Quality and Student Achievement: A Review
of State Policy Evidence. Education Policy Analysis Archives, 8(1). Darling–Hammond, L. (2004). Inequality and the Right to Learn: Access to Qualified
Teachers in California’s Public Schools. Teachers College Record, 106(10), 1936-1966.
Eurofound. (2009). Eurlife: Gini Index. Retrieved August 13, 2009: http://www.eurofound.europa.eu/areas/qualityoflife/eurlife/index.php?template=3&radioindic=158&idDomain=3
Fukuyama, F. (2002). Social Capital and Development: The Coming Agenda. SAIS Review, 22(1), 23-37.
Gini, C. (1912). Variabilita e Mutabilita. Bologna. Gonzales, P., Williams, T., Jocelyn, L., Roey, S., Kastberg, D., & Brenwald, S.
(2008). Mathematics and Science Achievement of U.S. Fourth- and Eighth-Grade Students in an International Context. Washington, D.C.: National Center for Education Statistics, Institute of Education Sciences, U.S. Department of Education.
Gregorio, J. d., & Wha-Lee, J. (2002). Education and Income Inequality: New Evidence from Cross-Country Data. Review of Income and Health, 48(3).
Guthrie, J. W., & Rothstein, R. (1999). Enabling Adequacy to Achieve Reality: Translating Adequacy into State School Finance Arrangements. In N. R. C. Committee on Education Finance, National Academy of Sciences (Ed.), Equity and Adequacy. Washington D.C.: National Academy Press.
Hanushek, E. A. (1986). The economics of schooling: Production and efficiency in the public schools. Journal of Economic Literature, XXIV(3), 1141-1178.
Heistad, D., & Spicuzza, R. (2003). Beyond Zip code analyses: What good measurement has to offer and how it can enhance the instructional delivery to all students? Paper presented at the American Education Research Association.
Helland, I. S. (1987). On the Interpretation and Use of R2 in Regression Analysis. Biometrics, 43(1), 61-69.

398
Heyneman, S., & Loxley, W. (1983). The effect of primary-school quality on academic achievement across twenty-nine high-and low-income countries. American Journal of Sociology, 88(6), 1162-1194.
Hong Kong Legislative Council Secretariat. (2005). Fact Sheet - Gini Coefficient. Hong Kong: Research and Library Services Division.
Kamin, D., & Shapiro, I. (2004). Studies Shed New Light on Effects of Administration's Tax Cuts. Washington, DC: Center on Budget and Policy Priorities.
Lamont, M., & Lareau, A. (1988). Cultural Capital: Allusions, Gaps and Glissandos in Recent Theoretical Developments. Sociological Theory, 6(2 (Autumn, 1988)), 153-168.
Levin, H. M. (1980). Educational Production Theory and Teacher Inputs. In C. E. Bidwell & D. M. Windham (Eds.), The analysis of educational productivity, Vol. II: Issues in Macroanalysis (pp. 203-231). Cambridge, MA: Ballinger Publishing.
Levin, H. M. (1995). Raising educational productivity. In C. M. (Ed.), International encyclopedia of economics of education, 2nd ed. (pp. 283-291). Tarrytown, NY: Pergamon.
Litchfield, J. A. (1999). Inequality: Methods and Tools. Retrieved from http://www.worldbank.org/poverty
Lytton, H., & Pyryt, M. (1998). Predictors of Achievement in Basic Skills: A Canadian Effective Schools Study Canadian Journal of Education / Revue canadienne de l'éducation, 23(3), 281-301.
Ma, X. (2001). Stability of socio-economic gaps in mathematics and science achievement among Canadian schools. Canadian Journal of Education/Revue canadienne de l'education, 26(1), 97-118.
Ma, X., & Klinger, D. (2000). Hierarchical linear modelling of student and school effects on academic achievement. Canadian Journal of Education/Revue canadienne de l'education, 25(1), 41-55.
Marks, G., Cresswell, J., & Ainley, J. (2006). Explaining socioeconomic inequalities in student achievement: The role of home and school factors. Educational Research and Evaluation, 12(2), 105-128.
Martin, M. (2005). TIMSS 2003 user guide for the international database. Chestnut Hill, MA: TIMSS & PIRLS International Study Center, Lynch School of Education, Boston College.
Martin, M., Mullis, I., & Chrostowski, S. (2004). TIMSS 2003 Technical Report: Findings From IEA’s Trends in International Mathematics and Science Study at the Fourth and Eighth Grades. Chestnut Hill, MA: TIMSS & PIRLS International Study Center, Lynch School of Education, Boston College.
McKinsey & Company. (2009). Detailed findings on the economic impact of the achievement gap in America's schools: McKinsey & Company.
Merton, R. K. (1957). Social Theory and Social Structure (Revised edition ed.). Glencoe, IL: Free Press.
Mullis, I. V., Martin, M., Smith, T. A., Garden, R. A., Gonzales, E., Chrostowski, S., et al. (2003). TIMSS assessment frameworks and specifications 2003 (2nd
399
Edition). Chestnut Hill, MA: TIMSS & PIRLS International Study Center, Lynch School of Education, Boston College.
Mullis, I. V. S., Martin, M. O., González, E. J., & Chrostowski, S. J. (2004). TIMSS 2003 International Mathematics Report: Findings from IEA's Trends in International Mathematics and Science Study at the Eighth and Fourth Grades. Chestnut Hill, MA: Boston College.
Mullis, I. V. S., Martin, M. O., Gonzalez, E. J., Chrostowski, S. J., International Association for the Evaluation of Educational Achievement., & Boston Coll. Chestnut Hill MA. (2004). TIMSS 2003 International Mathematics Report: Findings from IEA's Trends in International Mathematics and Science Study at the Fourth and Eighth Grades (No. ED494650): National Center for Education Statistics (DHEW), Washington, DC.
Murnane, R. J. (1975). The impact of school resources on the learning of inner city children. Cambridge, Mass.: Ballinger Pub. Co.
OECD. (2001). Knowledge and Skills for Life: First Results from the OECD Programme for International Student Assessment (PISA) 2000. Paris, France: Organisation for Economic Co-operation and Development.
OECD. (2003). First Results from PISA 2003. Paris, France: OECD. OECD. (2004). Learning for Tomorrow's World: First Results from Pisa 2003. Paris,
France: Organization for Economic Cooperation and Development. OECD. (2005). PISA 2003 Technical Report. Paris, France: Organization for
Economic Cooperation and Development. PISA. (2001). Knowledge and skills for life : first results from the OECD Programme
for International Student Assessment (PISA) 2000. Paris: Organisation for Economic Co-operation and Development.
Roscigno, V., & Ainsworth-Darnell, J. (1999). Race, cultural capital, and educational resources: Persistent inequalities and achievement returns. Sociology of Education, 72(3), 125-178.
Rothstein, R. (2004). Class and Schools. New York: Economic Policy Institute and Teachers College.
Samuelson, P. A., & Nordhaus, W. D. (2001). Economics (17th ed.). Boston, Mass.: McGraw-Hill.
Schleicher, A. (1999). Measuring student knowledge and skills: a new framework for assessment. Paris: Organisation for Economic Co-operation and Development.
Schmidt, W. H., McKnight, C. C., Cogan, L. S., & Jakwerth, P. M. (1999). Facing the Consequences: Using TIMSS for a Closer Look at U.S. Mathematics and Science Education. Dordrecht, Netherlands: Kluwer Academic Publishers.
Schmidt, W. H., McKnight, C. C., Houang, R. T., Wang, H., Wiley, D. E., Cogan, L. S., et al. (2001). Why Schools Matter: A Cross-National Comparison of Curriculum and Learning. The Jossey-Bass Education Series (No. ED460093): National Science Foundation, Arlington, VA.
Schneider, T. (2008). Social Inequality in Educational Participation in the German School System in a Longitudinal Perspective: Pathways into and out of the most Prestigious School Track. European Sociological Review, 24(4), 511.

400
Schulz, W. (2005). Mathematics Self-Efficacy and Student Expectations: Results from PISA 2003. Paper presented at the Annual Meetings of the American Educational Research Association. Retrieved from http://www.ncbi.nlm.nih.gov/entrez/query.fcgi?db=pubmed&cmd=Retrieve&dopt=AbstractPlus&list_uids=11801510116186455802related:-v54cOxix6MJ
Sherman, J. D., & Poirier, J. M. (2007). Educational Equity and Public Policy: Comparing Results from 16 Countries. Washington D.C.: UNESCO Institute for Statistics.
Sutcliffe, B. (2007). Postscript to the article ‘World inequality and globalization’ (Oxford Review of Economic Policy, Spring 2004). Retrieved August 13, 2009, from World Bank: http://siteresources.worldbank.org/INTDECINEQ/Resources/PSBSutcliffe.pdf
TIMSS. (2005). TIMSS 2003 User Guide for the International Database. Chestnut Hill, MA: International Association for the Evaluation of Educational Achievement (IEA).
Turner, J. D. (1996). The state and the school : an international perspective. London ; Washington, D.C.: Falmer Press.
UNICEF. (2008). Education statistics: Tunisia. Retrieved February 11, 2010, from http://www.childinfo.org/files/MENA_Tunisia.pdf
Van den Broeck, A., Opdenakker, M., Hermans, D., & Damme, J. (2003). Socioeconomic status and student achievement in a multilevel model of Flemish TIMSS-1999 data: The Importance of a Parent Questionnaire. Studies in Educational Evaluation, 29, 177-190.
Willms, J. D. (2003). Ten Hypotheses about Socioeconomic Gradients and Community Differences in Children’s Developmental Outcomes. Gatineau, Quebec, Canada Applied Research Branch, Strategic Policy, Human Resources Development Canada.
World Bank. (2007). Measuring Inequality. Retrieved from http://go.worldbank.org/3SLYUTVY00
World Bank. (2008). World Bank Data Overview - Methodologies. Retrieved February 11, 2008, from http://data.worldbank.org/about/data-overview/methodologies