how firms borrow in international bond markets: … · securities regulation and market...
TRANSCRIPT

HOW FIRMS BORROW IN INTERNATIONAL BOND MARKETS:SECURITIES REGULATION AND MARKET SEGMENTATION
Alberto Fuertes and José María Serena
Documentos de Trabajo N.º 1603
2016

HOW FIRMS BORROW IN INTERNATIONAL BOND MARKETS: SECURITIES
REGULATION AND MARKET SEGMENTATION

(*) The authors acknowledge Mirko Abbritti, Peter Backe, Carmen Broto, Branimir Gruic, Ángel Estrada, Ingo Fender, Ignacio Hernando, Pilar L’Hotellerie-Fallois, Philip Lane, José Manuel Marqués, Luis Molina, Pedro del Río, Carlos Serrano, Liliana Rojas-Suárez, Sergio Schmuckler and Vlad Sushko, and participants at the VIII Emerging Economics Workshop, Banco de España Research Seminar, Oxford University-IFABS Conference on Corporate Finance, and IDB- Financial Stability and Development (FSD) Group Seminar for helpful comments and suggestions; and Ana Arencibia for research assistance. The authors’ views need not coincide with those of the Banco de España or the Eurosystem. Corresponding authors: [email protected], [email protected].
Documentos de Trabajo. N.º 1603
2016
Alberto Fuertes and José María Serena (*)
BANCO DE ESPAÑA
HOW FIRMS BORROW IN INTERNATIONAL BOND MARKETS:
SECURITIES REGULATION AND MARKET SEGMENTATION

The Working Paper Series seeks to disseminate original research in economics and fi nance. All papers have been anonymously refereed. By publishing these papers, the Banco de España aims to contribute to economic analysis and, in particular, to knowledge of the Spanish economy and its international environment.
The opinions and analyses in the Working Paper Series are the responsibility of the authors and, therefore, do not necessarily coincide with those of the Banco de España or the Eurosystem.
The Banco de España disseminates its main reports and most of its publications via the Internet at the following website: http://www.bde.es.
Reproduction for educational and non-commercial purposes is permitted provided that the source is acknowledged.
© BANCO DE ESPAÑA, Madrid, 2016
ISSN: 1579-8666 (on line)

Abstract
We investigate how fi rms in emerging economies choose among the different international
bond markets: global, US144A and Eurobond markets. By exploiting the connection
between the market of issuance and regulatory disclosure of information, we show that
fi rms with poorer credit quality, less ability to absorb fl otation costs and more informational
asymmetries issue debt in US144A and Eurobond markets, where regulation is lighter and
information is less public. On the contrary, fi rms issuing global bonds – subject to full SEC
requirements – are fi nancially sounder and larger. This exercise also shows that, following
the global crisis, fi rms are more likely to tap less regulated debt markets. The results are
supported by descriptive evidence, univariate non-parametric analyses, and conditional and
multinomial logit analyses. To research the issue, we have constructed a novel dataset
containing information on fi rms’ debt securities issuance and their fi nancial accounts for the
period 2000-2014. To account for fi rms’ complex structures, we look at the balance sheet
of the guarantor of debt, which need not be the issuing company. The dataset comprises
3,944 debt securities, guaranteed by fi rms of 36 emerging economies, which amount to a
total of 1.2 USD trillion in debt issued.
Keywords: bond markets, securities regulation, debt choice, Rule 144, Eurobond, Global bond.
JEL classifi cation: G15, G18, G32.
Resumen
En este trabajo se investiga cómo las empresas no fi nancieras de mercados emergentes
eligen entre los diferentes mercados internacionales de bonos para fi nanciarse: el mercado
global, el US144A y el mercado de eurobonos. Utilizando la relación entre el mercado de
emisión y los requerimientos regulatorios de información de cada mercado, se concluye que
las empresas con menor calidad crediticia, menor capacidad para absorber los costes de
fl otación y con mayores asimetrías de información emiten deuda en el mercado US144A y
en el de eurobonos, donde la regulación es más laxa y la información menos pública. Por el
contrario, las empresas que emiten bonos en el mercado global, sujeto a la regulación de la
SEC, presentan mejores condiciones fi nancieras y son más grandes. También se concluye
que tras la crisis fi nanciera global las empresas tienden más a emitir deuda en los mercados
menos regulados. Los resultados se basan en evidencia descriptiva, análisis univariante no
paramétrico y análisis multivariante utilizando un logit multinomial. Para realizar este trabajo
hemos elaborado una nueva base de datos que incluye información sobre las emisiones de
deuda de las empresas y su información fi nanciera para el período 2000-2014. Debido a la
compleja estructura de fi nanciación de muchas empresas, analizamos las hojas de balance
de la empresa que garantiza la deuda, que puede no ser la entidad emisora. La base de
datos incluye 3.944 bonos, garantizados por empresas de 36 economías emergentes y
acumulando un total de 1,2 miles de millones de dólares.
Palabras clave: mercados internacionales de bonos, decisiones de fi nanciación, regulación
de mercados de capitales, eurobonos, bonos globales, mercado US144A.
Códigos JEL: G15, G18, G32.

BANCO DE ESPAÑA 7 DOCUMENTO DE TRABAJO N.º 1603
1. Introduction
The post-crisis international financial markets are defined by the transition towards market-based financing. Emerging economies firms are obtaining substantial amounts of funding from international bond markets and they are managing to do so at long maturities (Shin (2013))2. This easy access to debt-markets is attributed to global financial conditions (Lo Duca et al. (2015), Ayala et al. (2015), Feyen et al. (2015)). Among the lenders, non-bank institutions have stepped into the provision of credit, in a context of low returns on traditional assets. Overall, the process is deemed to pose significant risks for international financial stability: borrowers could be raising too much debt and lenders could be underestimating the risk. However, there is considerable uncertainty about the actual credit risks and the characteristics of firms raising funds in international markets (Gruic et al. (2014), Chui et al. (2014)). Research has been limited by lacking firm-level information. Though, existing analyses suggest that there is significant dispersion in leverage, profitability, risk of financial distress, or quality of assets (Fuertes and Serena (2014); chart I.1. in Annex I). The evidence suggests that different borrowers are acceding different debt-markets: some firms have healthy balance-sheets; others have much poorer credit quality.
Overall, this raises far-reaching questions. Which firms issue debt securities in each of the different bond markets? Do firms’ choices depend on their credit quality, or on the degree of informational asymmetries between firms and non-bank lenders? Finally, are there any changes after the global financial crisis?
These issues remain obscured as studies related to post-crisis market based financing consider all international corporate bonds as being issued in a single market. Quite the opposite, there is a wide range –the Yankee, Samurai, Global, or Eurobond markets, to name a few. Indeed, a bond market is a specific environment in which borrowers issue securities, and investors acquire them, subject to a given regulation and using a specific electronic platform. Since international bond markets exhibit different regulations, they might attract different investors and firms. On these grounds, international bond markets can be classified in four groups: the foreign bond market, the global bond market, the US 144A bond market and the Eurobond market. Foreign and global bond markets are strictly regulated. The regulation of the US 144A bond market is much lighter and the Eurobond market is an offshore market where debt-securities are not subject to any local regulation. Debt-securities regulation requires firms to provide public, timely and accurate information on firms’ financial statements. Thus, in the latter two markets, investors need to screen privately borrowers’ credit quality, delving into their financial accounts, income statements, or strategic plans. Their differences in regulation make these markets distinct in terms of volume, quality, and timeliness of public information; the type of investors able to invest in each market; and the underlying liquidity of the securities.
In this paper we investigate how firms choose among the existing international bond markets. Using univariate analyses, we find that firms borrowing in less regulated markets have lower credit quality, less ability to absorb high flotation costs, and exhibit more informational asymmetries. On the other hand, global bonds –subject to SEC
2 The terms bond and debt-securities refer to fixed-income securities; we prefer the second one, since the first suggests there is
homogeneity within this class of securities (while there is not). 3For instance, a Mexican firm issuing a bond in the US; in contrast, a firm domiciled in the US issuing a debt security in the US, is
carrying out a US domestic placement. The popular distinction between domestic and international debt markets reflects the relationship

BANCO DE ESPAÑA 8 DOCUMENTO DE TRABAJO N.º 1603
requirements- are issued by larger and high-quality firms. Next, we investigate firms’ incremental debt choice among existing international debt-securities markets using multivariate models. The results of ordinal, and multinomial logit models confirm that firms with less ability to absorb high flotation costs and suffering informational asymmetries are more likely to issue debt in less regulated markets. We also find that after the global financial crisis, firms’ propensity to issue debts in US 144A and Eurobond markets has increased. Finally, firms are more likely to issue debt in regulated markets during periods of risk aversion and volatility.
To investigate the issue, we have constructed a unique database comprising firm-level and deal-specific information for all emerging economies firms active in international markets during the period 2000-2014. Our database is built around the firms guarantying the debt-securities, which need not be the issuer companies. Debt-guarantors are the entities which would be liable in case of distress. The database contains information on firms’ financial accounts, corporate structure, and non-financial information as well as on the type of debt-securities issued. Overall, there is information for 1,584 firms, which issue a total of 3,944 securities, for a total amount of 1.2 USD trillion. The database covers unlisted firms, firms listed in local exchanges, and firms cross-listed in the US.
This article makes several contributions to the literature on the choice of debt type. To our knowledge, this is the first study that analyzes the firm´s debt choice decision among all options available in international capital markets, focusing on the different regulatory regimes of each market. Besides, our paper is the first one analyzing the choice of debt type treating firms as consolidated entities, in line with the newest standards in international finance (Bruno and Shin (2015), Adjveiv et al. (2015)).
Our findings are related to previous literature analyzing the firm´s choice between public and private debt. Blackwell and Kindell (1988) show that firms with low flotation costs and low agency costs tend to issue public bonds instead of private bonds. Similarly, we find that firms with access to the global market, where bonds are public, face lower flotation costs and lower agency costs (less informational asymmetries). Esho et all. (1999) obtain similar results using data on bank loans (a type of private debt) and corporate bonds (foreign bonds and Eurobonds). Other studies find that firms with poor credit quality rely mostly on private debt (Denis and Mihov (2003), Arena (2010), Chaplinsky and Ramchand (2004)). Our results are somehow mixed in this regard. The univariate analysis confirms that firms with access to the global market have better financial conditions. On the other hand, the multivariate analysis does not show that sounder firms tend to issue debt in the global market, after taking into account other factors.
Though, comparing our results with previous empirical findings is tricky due to several reasons: first, our paper focuses on the choice among all available bond markets, while most of previous literature delved into the choice between private - bank loans- and public debt –corporate bonds-, without exploiting the differences in the latter. Similar to us, Gao (2011) and Resnick (2012) use datasets that include all type of international bonds but they do not analyze the determinants of the decision choice among all different alternatives. Finally, by examining emerging market firms and covering the period 2000-2014, we are able to exploit a rich heterogeneity at the firm-level.

BANCO DE ESPAÑA 9 DOCUMENTO DE TRABAJO N.º 1603
The rest of the paper is structured as follows. Section 2 discusses theoretically how firms choose among international debt-securities markets; and presents the variables used to empirically investigate their choice. In section 3 we describe our database, and present the univariate analysis. In section 4 we present the multivariate analysis of firms’ incremental debt choice. Finally, in section 5 we summarize the main conclusions.
2. Background
2.1. Regulation of international bond markets and public information: foreign, global, US144A and Eurobond markets
There are different international bond markets. Bonds are considered issued in an international market when the issuer is not domiciled in the jurisdiction (BIS-ECB-IMF (2015)) 3. Accordingly, international bonds are those in which the issuer is subject to a non-local regulation. Thus, it is small wonder that the regulation of international bond markets differs substantially: international bonds can be either strictly regulated by a foreign local rule, subject to specific local rules, or be unregulated in offshore markets. The aim of regulation is, quoting IOSCO, to ensure “full disclosure of information material to investors”; this is the mechanism to “protect investors, maintain fair, efficient and transparent markets, and seek to address systemic risks” (IOSCO (2010)) Overall, this implies that there are noticeable differences in the volume, quality, and timeliness of public information, depending on the bond market the firm chooses.
On these grounds, international bond markets can be classified in four groups: the foreign bond market, the global market, the US144A rule bond market, and the Eurobond market. Foreign and global bond markets are public debt markets. They are tightly regulated, and issuers are required to disclose publicly financial information, fulfilling detailed and often burdensome regulatory requirements. Investors cannot influence the design of the security, which is offered on a take-it-or-leave-it basis. Accordingly, debt-securities are fairly standardized, and more liquid than otherwise. The risks of investment in these firms are often assessed through an external rating agency: investors do not screen privately the quality of the firm, nor monitor ex-post managers’ decisions. There are many bondholders, and do not have expertise in liquidating firms; their losses in an event of financial distress are expectedly larger. The US rule 144A and the Eurobond market are institutional/wholesale and private bond markets. They are subject to lighter regulation. Borrowers disclose privately information to a narrower set of informed potential lenders, which include institutional investors -such as insurance companies or pension funds. These lenders have expertise in dealing with informational asymmetries surrounding the firm value and agency problems. They might require firms to include covenants or options to mitigate adverse selection or moral hazard problems. Debt-securities are less standardized and henceforth less liquid. Also, the role of external credit agencies is far less important. In an event of
3For instance, a Mexican firm issuing a bond in the US; in contrast, a firm domiciled in the US issuing a debt security in the US, is
carrying out a US domestic placement. The popular distinction between domestic and international debt markets reflects the relationship between the residence of debt issuer and the market of issuance location. Following this convention, domestic debt issuances are placements by resident issuers in their home-countries.

BANCO DE ESPAÑA 10 DOCUMENTO DE TRABAJO N.º 1603
distress, liquidation is more efficient since lenders have expertise and have designed provisions to cope with it.
The differences in public information of international bond markets have been investigated in previous studies. Most research had compared either Yankee (US foreign) and US144 bonds (Chaplinsky and Ramchand (2004), Fenn (2001), Esho et al. (1999), Arena (2011), Gomes and Phillips (2011)) or Yankee and Eurobonds (Miller and Puthenpurackal (2001)). In this article we add to the few papers that cover all markets (Gao (2011) and Resnick (2012)).
The main features of these markets are described in table 1. Foreign bonds are issuances by non-resident firms in a given local market. These deals are referred to with nicknames related to the corresponding local market of issuance (Yankee, Samurai, etc)4. For instance, a firm domiciled in Mexico issuing a debt-security in the US public debt market, subject to the US regulatory standards is classified as a Yankee bond. Regulation requires firms issuing in these markets to provide substantial public
4 They are called Yankee bond, if they are issued in the US local market; Samurai, for debt-securities in the Japanese local market; Bulldog refers to issuances in the UK local market; and so on. In terms of debt-securities regulation, foreign and domestic debt-placements are very similar; their only difference is that foreign debt-placements are carried out by firms incorporated overseas, while domestic debt-placements are accomplished by resident firms. Regulators can make minor distinctions between domestic and foreign firms, but overall face same similar requirements. That is, foreign firms issuing Yankee debt-securities are subject to similar SEC regulatory requirements than US firms.
Foreign bond market
(e.g.,Yankee)
Global bond market
US Rule 144 A bond market
Eurodollar bond market
Type of offering
INSTITUTIONAL/WHOLESALE
OFFERING
INSTITUTIONAL/WHOLESALE OFFERING &
PRIVATE
RegulationUS regulation, SEC
rule 144A exemptions
MIFID & exchange-regulated
Disclosure requirements
Medium Medium/Low
Sales restrictions
Yes Yes
Type of investors
QIB QIB
US regulation, SEC full regulation
High. Firms need to file form 20-K; financial accounts using US GAAP.
No
No restrictions; includes retail investors
Source: own elaboration; see also Gao (2011).
Table 1. Markets of international debt-securities issuances. Main features
PUBLIC OFFERING
Description
Non-resident public offering in a foreign
local market; Yankee, non-US firm in US public
market.
Public offering in at least one foreign local market; we
assume it involves placement in US
US institutional offering, following
rule 144A
EU institutional offering &private offshore offering

BANCO DE ESPAÑA 11 DOCUMENTO DE TRABAJO N.º 1603
information. The disclosure of information reduces the asymmetry of information and gives access to a broad pool of non-sophisticated investors. US debt-securities regulation constitutes a relevant example5. The requirements are ruled by the Securities Act of 1933, which requires SEC registration. The process is lengthy and particularly burdensome for foreign firms, since firms have to file their financial accounts using the US GAAP. Global bonds are debt-securities publicly placed by non-resident firms in at least one local market. A Mexican-firm issuing a debt-security simultaneously in the US and Japanese debt market is issuing a global bond. Global bonds are often very large. Thus firms aiming to raise large volumes of funds can target different pools of investors. But, in terms of regulation, they are similar to foreign bonds: typically, global bonds place at least one tranche in the US, so are fully-subject to the SEC requirements. Similar to Yankee bonds or US domestic public-debt placements, there is public information available.
Overall, global and foreign bond markets share many features: investors dispose public and high-quality information; they do not need any specific technology to monitor borrowers’ credit quality and retail investors are able to buy and trade these securities. Thus, the investors’ base is much atomized, and securities are relatively standardized. The underlying assets are liquid, and there is a secondary market for them. The importance of foreign bond placements has faded over time, so in the paper we will emphasize firms’ choice between global and institutional/wholesale securities markets.
Debt securities issued under the US Rule 144A constitute another market. It is a specific and very relevant one. The 144A private placement market developed after the Securities Exchange Commission introduced in 1990 the Rule 144A. Rule 144A created a second-tier market for both US and non-US firms. Firms issuing under the US Rule 144A are subject to much softer requirements on the quality, volume, and frequency of financial accounts disclosure. Rule 144A allows trading these debt-securities among “qualified institutional buyers” (QIB). Non-US firms became very active in this market, since the SEC requirements to issue in the US public markets were particularly burdensome for them6. Rule 144A debt-securities have low liquidity, and a substantial fraction of international investors is banned from investing in them. Thus, it has features of non-bank private debt (Chaplinsky and Ramchand (2004), Fenn (2001), Esho et al. (1999), Arena (2011), Gomes and Phillips (2011)).
Finally, the last international debt-market firms have available is the Eurobond market. Eurobonds are debt securities in which investors need own technology to monitor borrowers’ risks. In terms of existing regulation, Eurobonds are totally different from each of the other markets described: debt securities are not subject to any local jurisdiction (Esho et al. (2001), Miller and Puthenpurackal (2002)). Indeed, the Eurobond market developed to bypass the existing local jurisdictions. SEC rules imply that Eurobonds cannot be sold in US capital markets: bonds are bearer, and are not registered in the SEC, as Yankee or global bonds are; they are not either subject to the 144A Rule regulatory requirements. Eurobonds markets are necessarily less liquid, and the pool of potential investors is limited to sophisticated institutional investors.
5 Registration is a process in which firms provide a description of the company, of the security offered for sale, the management of the company and the firm financial statements. The firm will need to file every year the form 20-F, in which are requested to provide standardized financial information. Other local legislations are deemed to share similar features. 6 Frequently they are not listed in the US, and firms need to provide additional information, or adapt their financial statements to the US GAAP. This contrasts with the much softer requirements of information disclosure of 144A private placements.
BANCO DE ESPAÑA 12 DOCUMENTO DE TRABAJO N.º 1603
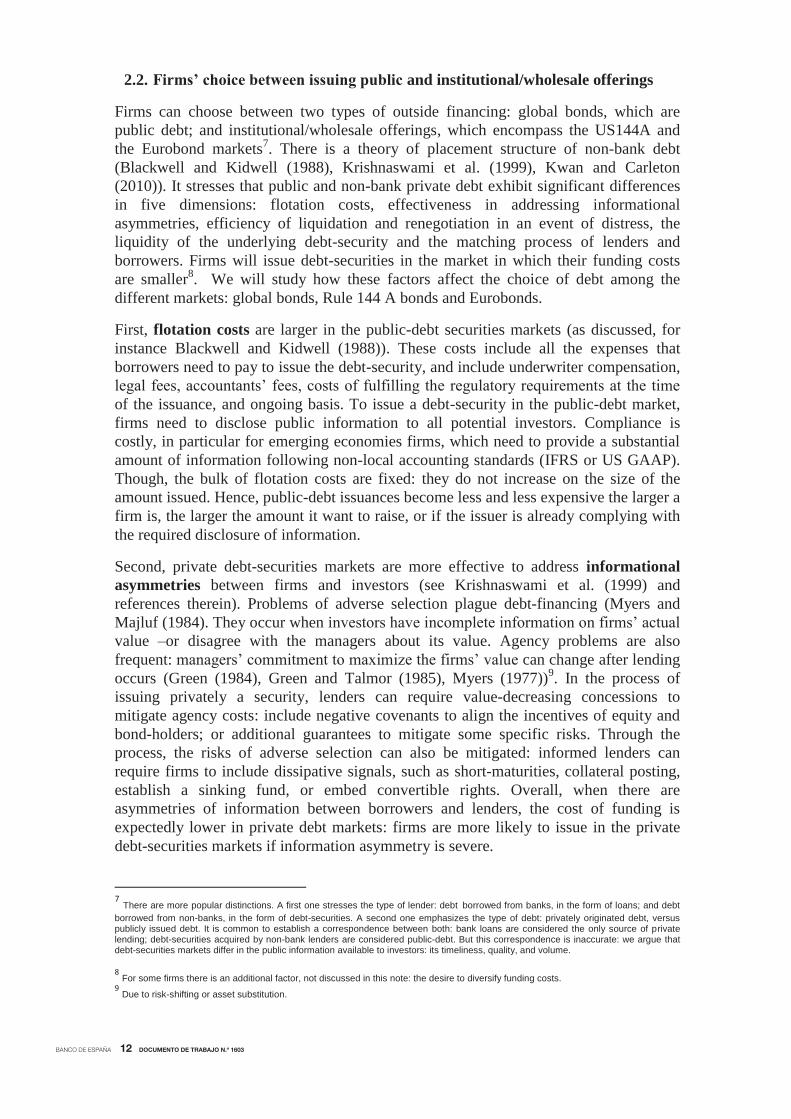
2.2. Firms’ choice between issuing public and institutional/wholesale offerings
Firms can choose between two types of outside financing: global bonds, which are public debt; and institutional/wholesale offerings, which encompass the US144A and the Eurobond markets7. There is a theory of placement structure of non-bank debt (Blackwell and Kidwell (1988), Krishnaswami et al. (1999), Kwan and Carleton (2010)). It stresses that public and non-bank private debt exhibit significant differences in five dimensions: flotation costs, effectiveness in addressing informational asymmetries, efficiency of liquidation and renegotiation in an event of distress, the liquidity of the underlying debt-security and the matching process of lenders and borrowers. Firms will issue debt-securities in the market in which their funding costs are smaller8. We will study how these factors affect the choice of debt among the different markets: global bonds, Rule 144 A bonds and Eurobonds.
First, flotation costs are larger in the public-debt securities markets (as discussed, for instance Blackwell and Kidwell (1988)). These costs include all the expenses that borrowers need to pay to issue the debt-security, and include underwriter compensation, legal fees, accountants’ fees, costs of fulfilling the regulatory requirements at the time of the issuance, and ongoing basis. To issue a debt-security in the public-debt market, firms need to disclose public information to all potential investors. Compliance is costly, in particular for emerging economies firms, which need to provide a substantial amount of information following non-local accounting standards (IFRS or US GAAP). Though, the bulk of flotation costs are fixed: they do not increase on the size of the amount issued. Hence, public-debt issuances become less and less expensive the larger a firm is, the larger the amount it want to raise, or if the issuer is already complying with the required disclosure of information.
Second, private debt-securities markets are more effective to address informational asymmetries between firms and investors (see Krishnaswami et al. (1999) and references therein). Problems of adverse selection plague debt-financing (Myers and Majluf (1984). They occur when investors have incomplete information on firms’ actual value –or disagree with the managers about its value. Agency problems are also frequent: managers’ commitment to maximize the firms’ value can change after lending occurs (Green (1984), Green and Talmor (1985), Myers (1977))9. In the process of issuing privately a security, lenders can require value-decreasing concessions to mitigate agency costs: include negative covenants to align the incentives of equity and bond-holders; or additional guarantees to mitigate some specific risks. Through the process, the risks of adverse selection can also be mitigated: informed lenders can require firms to include dissipative signals, such as short-maturities, collateral posting, establish a sinking fund, or embed convertible rights. Overall, when there are asymmetries of information between borrowers and lenders, the cost of funding is expectedly lower in private debt markets: firms are more likely to issue in the private debt-securities markets if information asymmetry is severe.
7 There are more popular distinctions. A first one stresses the type of lender: debt borrowed from banks, in the form of loans; and debt borrowed from non-banks, in the form of debt-securities. A second one emphasizes the type of debt: privately originated debt, versus publicly issued debt. It is common to establish a correspondence between both: bank loans are considered the only source of private lending; debt-securities acquired by non-bank lenders are considered public-debt. But this correspondence is inaccurate: we argue that debt-securities markets differ in the public information available to investors: its timeliness, quality, and volume. 8 For some firms there is an additional factor, not discussed in this note: the desire to diversify funding costs. 9 Due to risk-shifting or asset substitution.
BANCO DE ESPAÑA 13 DOCUMENTO DE TRABAJO N.º 1603
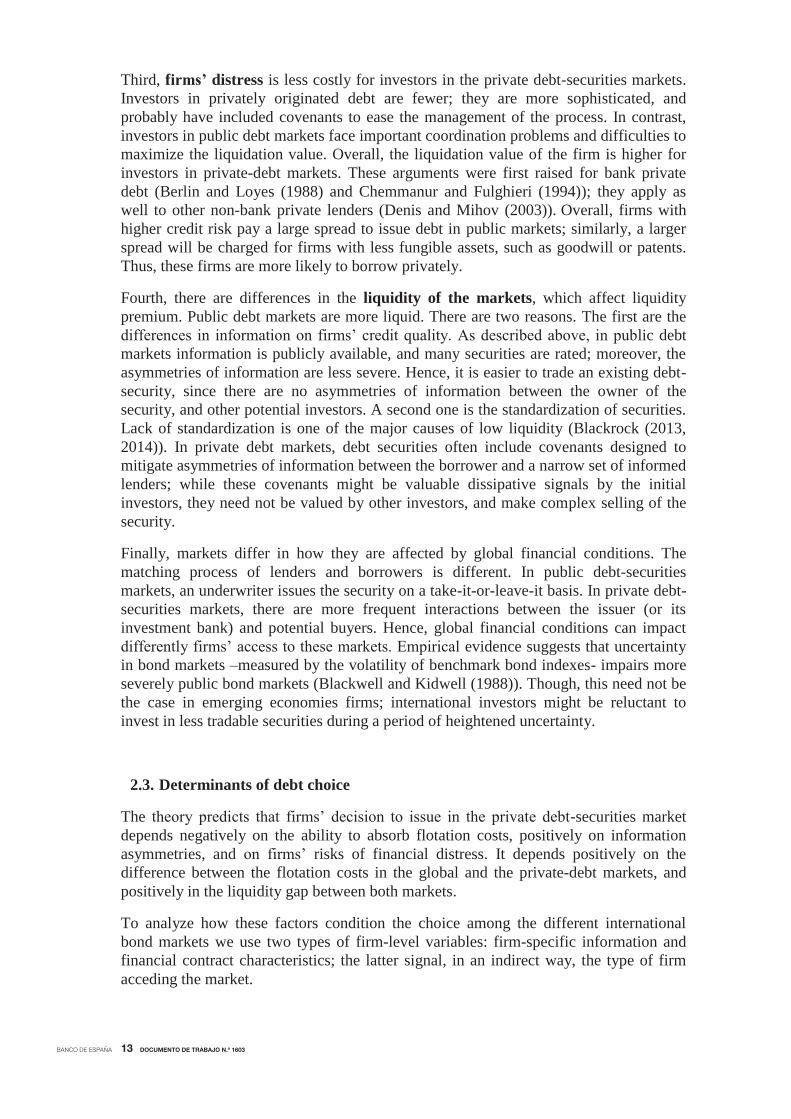
Third, firms’ distress is less costly for investors in the private debt-securities markets. Investors in privately originated debt are fewer; they are more sophisticated, and probably have included covenants to ease the management of the process. In contrast, investors in public debt markets face important coordination problems and difficulties to maximize the liquidation value. Overall, the liquidation value of the firm is higher for investors in private-debt markets. These arguments were first raised for bank private debt (Berlin and Loyes (1988) and Chemmanur and Fulghieri (1994)); they apply as well to other non-bank private lenders (Denis and Mihov (2003)). Overall, firms with higher credit risk pay a large spread to issue debt in public markets; similarly, a larger spread will be charged for firms with less fungible assets, such as goodwill or patents. Thus, these firms are more likely to borrow privately.
Fourth, there are differences in the liquidity of the markets, which affect liquidity premium. Public debt markets are more liquid. There are two reasons. The first are the differences in information on firms’ credit quality. As described above, in public debt markets information is publicly available, and many securities are rated; moreover, the asymmetries of information are less severe. Hence, it is easier to trade an existing debt-security, since there are no asymmetries of information between the owner of the security, and other potential investors. A second one is the standardization of securities. Lack of standardization is one of the major causes of low liquidity (Blackrock (2013, 2014)). In private debt markets, debt securities often include covenants designed to mitigate asymmetries of information between the borrower and a narrow set of informed lenders; while these covenants might be valuable dissipative signals by the initial investors, they need not be valued by other investors, and make complex selling of the security.
Finally, markets differ in how they are affected by global financial conditions. The matching process of lenders and borrowers is different. In public debt-securities markets, an underwriter issues the security on a take-it-or-leave-it basis. In private debt-securities markets, there are more frequent interactions between the issuer (or its investment bank) and potential buyers. Hence, global financial conditions can impact differently firms’ access to these markets. Empirical evidence suggests that uncertainty in bond markets –measured by the volatility of benchmark bond indexes- impairs more severely public bond markets (Blackwell and Kidwell (1988)). Though, this need not be the case in emerging economies firms; international investors might be reluctant to invest in less tradable securities during a period of heightened uncertainty.
2.3. Determinants of debt choice
The theory predicts that firms’ decision to issue in the private debt-securities market depends negatively on the ability to absorb flotation costs, positively on information asymmetries, and on firms’ risks of financial distress. It depends positively on the difference between the flotation costs in the global and the private-debt markets, and positively in the liquidity gap between both markets.
To analyze how these factors condition the choice among the different international bond markets we use two types of firm-level variables: firm-specific information and financial contract characteristics; the latter signal, in an indirect way, the type of firm acceding the market.

BANCO DE ESPAÑA 14 DOCUMENTO DE TRABAJO N.º 1603
a) Flotation costs: to measure flotation costs we include the amount raised by the firm: the larger the amount, the lower the fixed flotation cost relative to the total proceeds. As an alternative, we include the firm size, measured by its total assets (Denis and Mihov (2003), Kwan and Carleton (2010), Blackwell and Kidwell (1988), Krishnaswami et al. (1999)). Incidentally, flotation costs can be lower for firms which are already complying with the disclosure requirements imposed by securities regulation. These requirements represent a substantial amount of the total flotation costs in Global bond markets, and are considered particularly burdensome for non-US firms (Gao (2011)). Firms whose equity is cross-listed in US exchange markets are already complying with SEC requirements. Hence, we use as a proxy of ability to absorb flotation costs the existence of exchange-listed ADRs (American Depositary Receipts). Finally, we use firms’ reporting GAAP. Firms reporting the financial statements with their local GAAP cannot issue debt in regulated international capital markets, unless they provide supplementary information using IFRS or US GAAP. This creates an additional cost of issuing a debt-security in the global bond market.
b) Financial contracting costs due to informational asymmetries: to measure informational asymmetries, we include the following variables. First, we gauge the actual value of firms’ assets including the ratio of fixed assets to total assets (Denis and Mihov (2003)). Holding everything else equal, lenders face less uncertainty investing in firms with a higher proportion of fixed assets. Hence, firms with a higher proportion of fixed assets to total assets are less likely to issue debt in the institutional/wholesale markets (Eurobond and US 144A).
Second, firms with severe informational asymmetries will not find useful to improve the quality of public information: only sophisticated investors will be able to gauge the actual value of the firm. To measure firms’ willingness to improve the quality of public
Firm-specific features Variables (expected sign) Description
Flotation Costs Firm total assets (-)
Amount issued (-)US American Depositary Receipt (-) 1 if firm is cross-listed in US through ADRLocal GAAP (+) 1 if firm files using a local GAAP
Informational Asymmetries Fixed assets to total assets (-)
Firm total assets (-)Local GAAP (+) 1 if firm files using a local GAAPCredit rating on the debt-security (-) 1 if firms issues bonds with credit rating (any)Bond with convertible rights (+) 1 if firm issues bonds withs convertible rights5-year growth in firm total assets (+)
Bond Maturity (-)Liquidation & renegotiation Altman score (-) 1 if Altman score is below 1.21 (distress zone)
Bond with sinking fund (+) 1 if firm issues bonds with sinking fundFixed assets to total assets (-)
VIX (+/-) Average VIX in 20 working days before issuance
MOVE (+/-) Average MOVE in 20 working days before issuanceBond holders rights (+) 1 if firm issues bonds with sinking fund put option, or convertible rightsBond with call option (-) 1 if firm issues bonds with call optionBond with put option (+) 1 if firm issues bonds with put option
Table 2. Financing costs. Main variables and expected impact on likehood firms issue through institutional/wholesale offering
Primary market efficiency and global conditions
General
BANCO DE ESPAÑA 15 DOCUMENTO DE TRABAJO N.º 1603
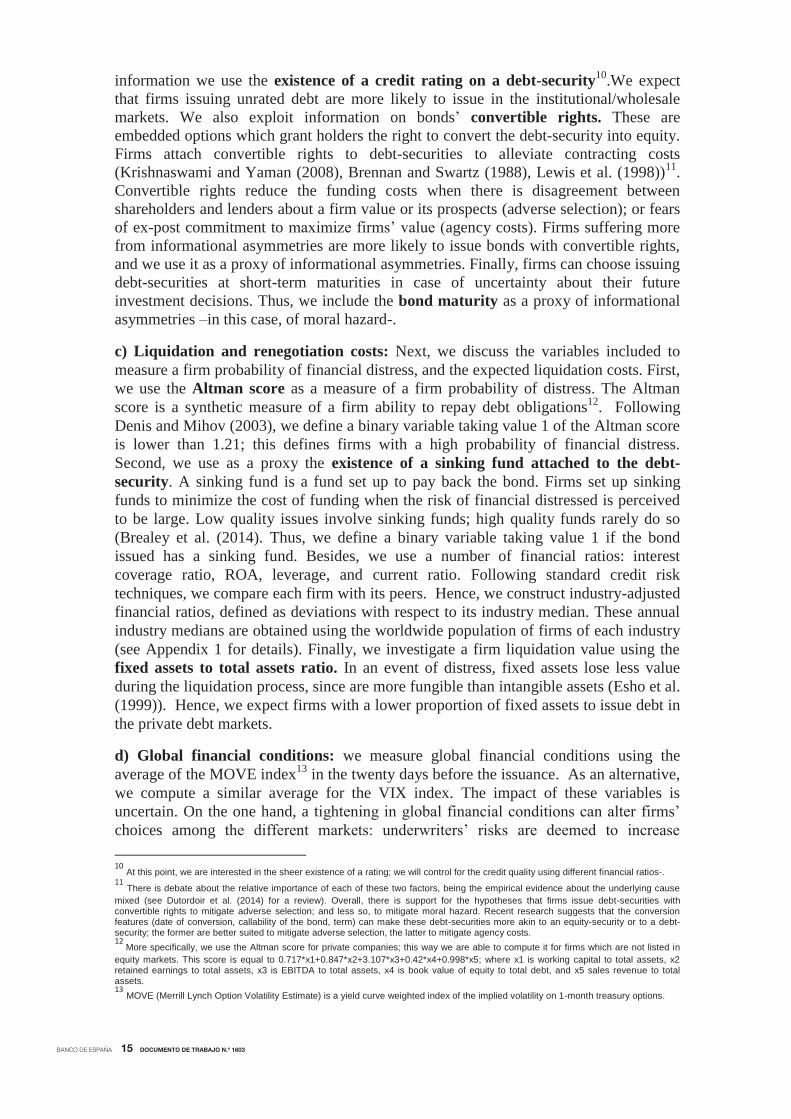
information we use the existence of a credit rating on a debt-security10.We expect that firms issuing unrated debt are more likely to issue in the institutional/wholesale markets. We also exploit information on bonds’ convertible rights. These are embedded options which grant holders the right to convert the debt-security into equity. Firms attach convertible rights to debt-securities to alleviate contracting costs (Krishnaswami and Yaman (2008), Brennan and Swartz (1988), Lewis et al. (1998))11. Convertible rights reduce the funding costs when there is disagreement between shareholders and lenders about a firm value or its prospects (adverse selection); or fears of ex-post commitment to maximize firms’ value (agency costs). Firms suffering more from informational asymmetries are more likely to issue bonds with convertible rights, and we use it as a proxy of informational asymmetries. Finally, firms can choose issuing debt-securities at short-term maturities in case of uncertainty about their future investment decisions. Thus, we include the bond maturity as a proxy of informational asymmetries –in this case, of moral hazard-.
c) Liquidation and renegotiation costs: Next, we discuss the variables included to measure a firm probability of financial distress, and the expected liquidation costs. First, we use the Altman score as a measure of a firm probability of distress. The Altman score is a synthetic measure of a firm ability to repay debt obligations12. Following Denis and Mihov (2003), we define a binary variable taking value 1 of the Altman score is lower than 1.21; this defines firms with a high probability of financial distress. Second, we use as a proxy the existence of a sinking fund attached to the debt-security. A sinking fund is a fund set up to pay back the bond. Firms set up sinking funds to minimize the cost of funding when the risk of financial distressed is perceived to be large. Low quality issues involve sinking funds; high quality funds rarely do so (Brealey et al. (2014). Thus, we define a binary variable taking value 1 if the bond issued has a sinking fund. Besides, we use a number of financial ratios: interest coverage ratio, ROA, leverage, and current ratio. Following standard credit risk techniques, we compare each firm with its peers. Hence, we construct industry-adjusted financial ratios, defined as deviations with respect to its industry median. These annual industry medians are obtained using the worldwide population of firms of each industry (see Appendix 1 for details). Finally, we investigate a firm liquidation value using the fixed assets to total assets ratio. In an event of distress, fixed assets lose less value during the liquidation process, since are more fungible than intangible assets (Esho et al. (1999)). Hence, we expect firms with a lower proportion of fixed assets to issue debt in the private debt markets.
d) Global financial conditions: we measure global financial conditions using the average of the MOVE index13 in the twenty days before the issuance. As an alternative, we compute a similar average for the VIX index. The impact of these variables is uncertain. On the one hand, a tightening in global financial conditions can alter firms’ choices among the different markets: underwriters’ risks are deemed to increase 10 At this point, we are interested in the sheer existence of a rating; we will control for the credit quality using different financial ratios-. 11 There is debate about the relative importance of each of these two factors, being the empirical evidence about the underlying cause mixed (see Dutordoir et al. (2014) for a review). Overall, there is support for the hypotheses that firms issue debt-securities with convertible rights to mitigate adverse selection; and less so, to mitigate moral hazard. Recent research suggests that the conversion features (date of conversion, callability of the bond, term) can make these debt-securities more akin to an equity-security or to a debt-security; the former are better suited to mitigate adverse selection, the latter to mitigate agency costs. 12
More specifically, we use the Altman score for private companies; this way we are able to compute it for firms which are not listed in equity markets. This score is equal to 0.717*x1+0.847*x2+3.107*x3+0.42*x4+0.998*x5; where x1 is working capital to total assets, x2 retained earnings to total assets, x3 is EBITDA to total assets, x4 is book value of equity to total debt, and x5 sales revenue to total assets. 13 MOVE (Merrill Lynch Option Volatility Estimate) is a yield curve weighted index of the implied volatility on 1-month treasury options.

BANCO DE ESPAÑA 16 DOCUMENTO DE TRABAJO N.º 1603
disproportionally in public offerings, thus making more convenient issuing in institutional/wholesale markets (Blackwell and Kidwell (1988)). Though, existing evidence is mixed so-far (Kwan and Carleton (2010)). On the other hand, issuances in institutional/wholesale markets take less time, and firms can choose better the market-timing; this argument suggests it is less likely to see firms issuing in US144A or Eurobond during periods of high volatility, since they can more easily avoid placing bonds in such circumstances.
3. Dataset
3.1. A micro-level database for macrofinancial analysis
We gather all the debt-securities issued in international markets during the period 2000-2014, and guaranteed by emerging economies firms. We cover 36 countries of four emerging economies regions: Emerging Asia, Latin America, Emerging Europe, and Africa and Middle East14. We have obtained the database using Bloomberg. To carry out the analysis, we construct a firm-year database, using the deal-level information.
The database has three defining features. First, it is built around the firms guaranteeing the debt-securities, instead of the issuer entities; this allows mimicking properly the risk-analysis carried out by international investors when deciding to invest in a given debt-security. Second, the debt-securities information contains bonds from the foreign market, global market, US 144 A market and Eurobond market. . Finally, the firm-level information is comprehensive and contains the debt-securities guaranteed by unlisted firms, firms listed in local exchanges, and firms cross-listed also in US exchanges.
Overall, these three features make our database comprehensive and entirely consistent: it contains 3,944 debt-securities, issued by 1,584 firms in the period 2000-2014, which make up a total amount of 1.2 USD trillion.
3.2. A criterion: analyzing firms that guarantee the debt-securities
The organizational structures of emerging economies firms have become very complex. Firms have affiliates incorporated all over the world. But these affiliates have different degrees of financial autonomy relative to their parent institutions: some are fully-supported, while others are fully-independent; some other receive explicit guarantees in specific financial operations.
Our purpose is to mimic the risk-analysis carried out by international investors; this is key to understand firms’ choices of market of issuance as they depend on the yield international investors require. We assume investors price the risk of investing in a debt-security analyzing the firm guaranteeing it: legally, it is the entity liable in case of distress. This criterion is superior to the other two alternatives: the analysis of the issuer-firm, or the parent company.
14 Latin America includes Argentina, Brazil, Chile, Colombia, Ecuador, Mexico, Peru, and Venezuela; Emerging Europe includes Bulgaria, Belarus, Bosnia, Croatia, Estonia, Hungary, Latvia, Lithuania, Poland, Romania, Russia, Serbia, Slovakia, Slovenia, Turkey, Ukraine; Africa & Middle East includes Egypt, Morocco, Nigeria, Saudi Arabia, South Africa, UAE. Emerging Asia includes India, Indonesia, Malaysia, Philippines, Thailand, and South Korea.

BANCO DE ESPAÑA 17 DOCUMENTO DE TRABAJO N.º 1603
Accordingly, we obtain all debt-securities guaranteed by emerging economies firms, following a previous contribution (Fuertes and Serena (2014)). We are the first to use this criterion, although the importance of assigning deals to the firm guaranteeing the debt-security had already been suggested (Esho, Lam, and Sharpe (2001)). Due to problems to match systematically the debt-security with the underlying firm-level data, previous papers had decided to use a more conservative approach and focus only on observations in which debt-issuers and debt-guarantors coincide.
Instead, we use the following rule: if a debt-security is issued by an entity, and guaranteed by another, we match the deal with the corresponding information of the firm guaranteeing it. We interpret the issuer-entity is transferring upstream its risk to the guarantor. This criterion applies to all issuer-entities: non-financial affiliates and offshore/onshore financial vehicles. If, alternatively, an entity issues debt without explicit guarantee of another company, we use the issuer information. Most probably, the issuer will be a non-financial affiliate, fully-independent from its parent company15.
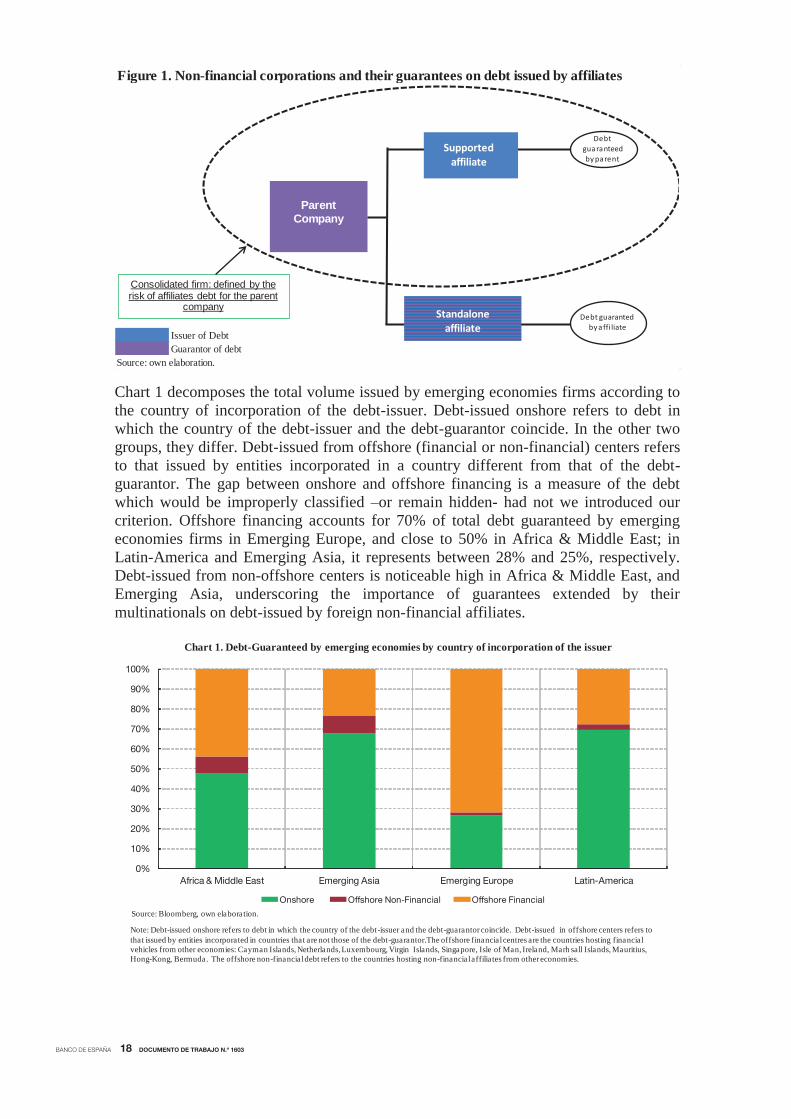
Figure 1 provides an example in which a company guarantees the debt-securities issued by a non-financial affiliate and a financial vehicle; these entities can be incorporated domestically or overseas. This company has a second non-financial affiliate, which is financially independent: the debt-securities it issues do not receive any explicit guarantee.
This criterion prevents two problems. Firstly, it ensures gathering systematically all the debt-guaranteed by emerging economies firms: we obtain information on all debt whose financial risks lay in an emerging economy16. Secondly, the criterion mimics the investment decision process of international investors, since the focus lies on the entity backing the debt-securities. For the purpose of understanding firms’ choices, it is important to mirror their approach.
The organizational structures of emerging economies firms have two features which reinforce the importance of using this criterion. First, firms use financial vehicles to issue securities in international markets17. In these cases, investors price the risk analyzing the guarantors of the debt. Second, emerging economies firms’ have large non-financial affiliates incorporated all over the world, with different degrees of autonomy from their controlling interest18. Some are financially independent, but others transfer upstream their risk to other companies (most probably to their parent companies). Only if a non-financial affiliate’s debt is guaranteed by another company, we match the debt-security with the firm-level information of the latter.
15 There are two options: it can be an emerging economy firm, and be in our sample; alternatively, it can be an advanced economy firm, and be excluded from it. 16 Standalone affiliates of advanced/emerging economies companies incorporated in an emerging/advanced economy are treated as emerging/advanced economies firms. Had we used the country of incorporation of the debt-issuer or the ultimate parent company, we would have tracked incorrectly emerging economies funding patterns. For example, Jaguar-Land Rover is a standalone affiliate incorporated in an advance economy (UK) with an emerging economy firm as its parent company (Tata Motors from India). Jaguar-Land Rover guarantees its own debt and its issuances are not included in our data base. On the contrary, Kansas City Southern de México is a standalone affiliate incorporated in Mexico with its parent being a US company. We then include issuances from Kansas City Southern de México in our data base. 17 Table II.1 in Annex II contains a list of these financial vehicles. Some of them are ad-hoc special purpose vehicles, while others are financial affiliates, regularly involved in obtaining funding for their group. 18 Table II.2 Annex II shows a list of emerging economies affiliates all over the world, which include well known trade-marks as Jaguar-Land Rover, Vale Canada, or Novelis.
BANCO DE ESPAÑA 18 DOCUMENTO DE TRABAJO N.º 1603
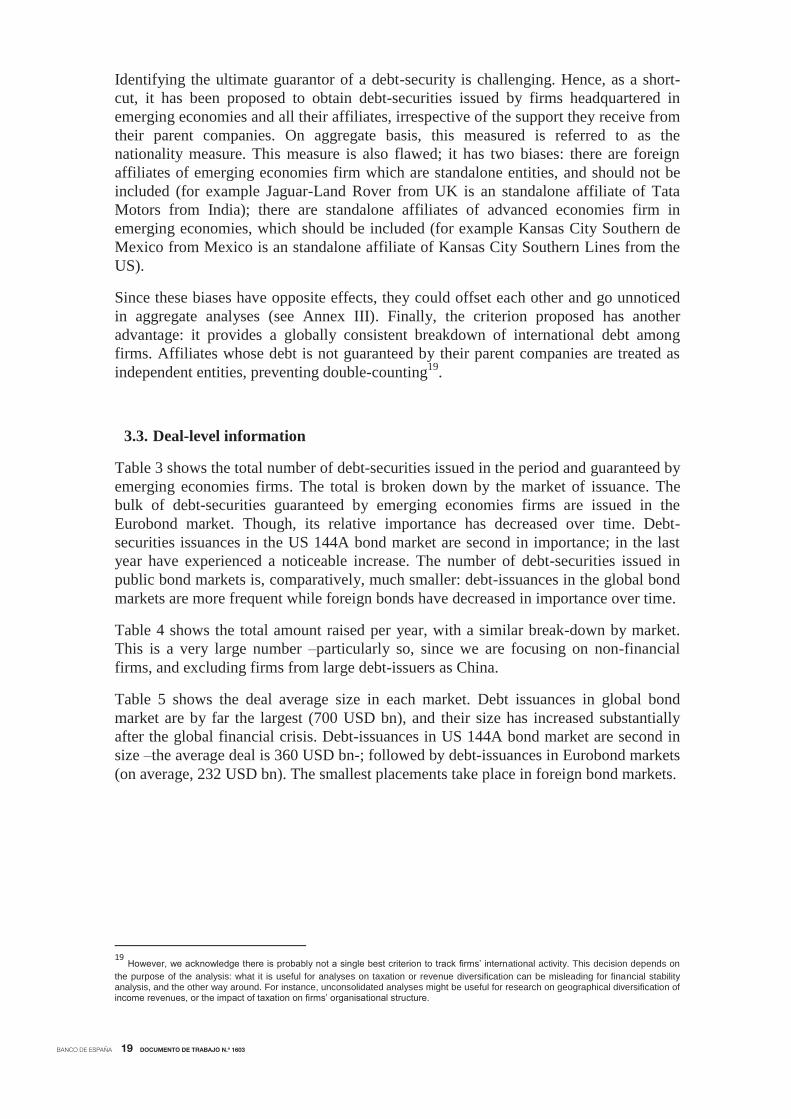
Chart 1 decomposes the total volume issued by emerging economies firms according to the country of incorporation of the debt-issuer. Debt-issued onshore refers to debt in which the country of the debt-issuer and the debt-guarantor coincide. In the other two groups, they differ. Debt-issued from offshore (financial or non-financial) centers refers to that issued by entities incorporated in a country different from that of the debt-guarantor. The gap between onshore and offshore financing is a measure of the debt which would be improperly classified –or remain hidden- had not we introduced our criterion. Offshore financing accounts for 70% of total debt guaranteed by emerging economies firms in Emerging Europe, and close to 50% in Africa & Middle East; in Latin-America and Emerging Asia, it represents between 28% and 25%, respectively. Debt-issued from non-offshore centers is noticeable high in Africa & Middle East, and Emerging Asia, underscoring the importance of guarantees extended by their multinationals on debt-issued by foreign non-financial affiliates.
Issuer of DebtGuarantor of debt
Source: own elaboration.
Figure 1. Non-financial corporations and their guarantees on debt issued by affiliates
Parent Company
Supported affiliate
Standaloneaffiliate
Debtguaranteed by parent
Debt guarantedby affi liate
Consolidated firm: defined by the risk of affiliates debt for the parent
company
0%
10%
20%
30%
40%
50%
60%
70%
80%
90%
100%
Africa & Middle East Emerging Asia Emerging Europe Latin-America
Onshore Offshore Non-Financial Offshore Financial
Source: Bloomberg, own elaboration.
Chart 1. Debt-Guaranteed by emerging economies by country of incorporation of the issuer
Note: Debt-issued onshore refers to debt in which the country of the debt-issuer and the debt-guarantor coincide. Debt-issued in offshore centers refers to that issued by entities incorporated in countries that are not those of the debt-guarantor.The offshore financial centres are the countries hosting financial vehicles from other economies: Cayman Islands, Netherlands, Luxembourg, Virgin Islands, Singapore, Isle of Man, Ireland, Marh sall Islands, Mauritius, Hong-Kong, Bermuda. The offshore non-financial debt refers to the countries hosting non-financial affiliates from other economies.
BANCO DE ESPAÑA 19 DOCUMENTO DE TRABAJO N.º 1603
Identifying the ultimate guarantor of a debt-security is challenging. Hence, as a short-cut, it has been proposed to obtain debt-securities issued by firms headquartered in emerging economies and all their affiliates, irrespective of the support they receive from their parent companies. On aggregate basis, this measured is referred to as the nationality measure. This measure is also flawed; it has two biases: there are foreign affiliates of emerging economies firm which are standalone entities, and should not be included (for example Jaguar-Land Rover from UK is an standalone affiliate of Tata Motors from India); there are standalone affiliates of advanced economies firm in emerging economies, which should be included (for example Kansas City Southern de Mexico from Mexico is an standalone affiliate of Kansas City Southern Lines from the US).
Since these biases have opposite effects, they could offset each other and go unnoticed in aggregate analyses (see Annex III). Finally, the criterion proposed has another advantage: it provides a globally consistent breakdown of international debt among firms. Affiliates whose debt is not guaranteed by their parent companies are treated as independent entities, preventing double-counting19.
3.3. Deal-level information
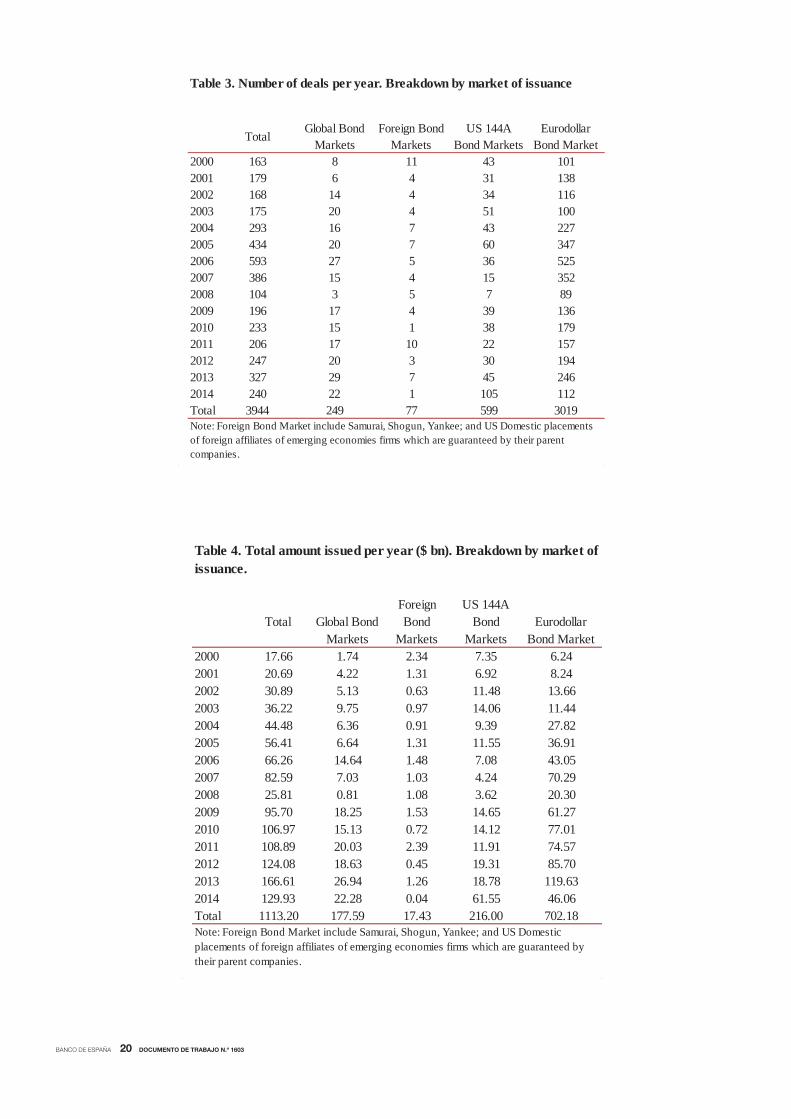
Table 3 shows the total number of debt-securities issued in the period and guaranteed by emerging economies firms. The total is broken down by the market of issuance. The bulk of debt-securities guaranteed by emerging economies firms are issued in the Eurobond market. Though, its relative importance has decreased over time. Debt-securities issuances in the US 144A bond market are second in importance; in the last year have experienced a noticeable increase. The number of debt-securities issued in public bond markets is, comparatively, much smaller: debt-issuances in the global bond markets are more frequent while foreign bonds have decreased in importance over time.
Table 4 shows the total amount raised per year, with a similar break-down by market. This is a very large number –particularly so, since we are focusing on non-financial firms, and excluding firms from large debt-issuers as China.
Table 5 shows the deal average size in each market. Debt issuances in global bond market are by far the largest (700 USD bn), and their size has increased substantially after the global financial crisis. Debt-issuances in US 144A bond market are second in size –the average deal is 360 USD bn-; followed by debt-issuances in Eurobond markets (on average, 232 USD bn). The smallest placements take place in foreign bond markets.
19 However, we acknowledge there is probably not a single best criterion to track firms’ international activity. This decision depends on the purpose of the analysis: what it is useful for analyses on taxation or revenue diversification can be misleading for financial stability analysis, and the other way around. For instance, unconsolidated analyses might be useful for research on geographical diversification of income revenues, or the impact of taxation on firms’ organisational structure.
BANCO DE ESPAÑA 20 DOCUMENTO DE TRABAJO N.º 1603
Total Global Bond
MarketsForeign Bond
MarketsUS 144A
Bond MarketsEurodollar
Bond Market2000 163 8 11 43 1012001 179 6 4 31 1382002 168 14 4 34 1162003 175 20 4 51 1002004 293 16 7 43 2272005 434 20 7 60 3472006 593 27 5 36 5252007 386 15 4 15 3522008 104 3 5 7 892009 196 17 4 39 1362010 233 15 1 38 1792011 206 17 10 22 1572012 247 20 3 30 1942013 327 29 7 45 2462014 240 22 1 105 112Total 3944 249 77 599 3019
Table 3. Number of deals per year. Breakdown by market of issuance
Note: Foreign Bond Market include Samurai, Shogun, Yankee; and US Domestic placements of foreign affiliates of emerging economies firms which are guaranteed by their parent companies.
Total Global Bond Markets
Foreign Bond
Markets
US 144A Bond
MarketsEurodollar
Bond Market2000 17.66 1.74 2.34 7.35 6.242001 20.69 4.22 1.31 6.92 8.242002 30.89 5.13 0.63 11.48 13.662003 36.22 9.75 0.97 14.06 11.442004 44.48 6.36 0.91 9.39 27.822005 56.41 6.64 1.31 11.55 36.912006 66.26 14.64 1.48 7.08 43.052007 82.59 7.03 1.03 4.24 70.292008 25.81 0.81 1.08 3.62 20.302009 95.70 18.25 1.53 14.65 61.272010 106.97 15.13 0.72 14.12 77.012011 108.89 20.03 2.39 11.91 74.572012 124.08 18.63 0.45 19.31 85.702013 166.61 26.94 1.26 18.78 119.632014 129.93 22.28 0.04 61.55 46.06Total 1113.20 177.59 17.43 216.00 702.18Note: Foreign Bond Market include Samurai, Shogun, Yankee; and US Domestic placements of foreign affiliates of emerging economies firms which are guaranteed by their parent companies.
Table 4. Total amount issued per year ($ bn). Breakdown by market of issuance.

BANCO DE ESPAÑA 21 DOCUMENTO DE TRABAJO N.º 1603
Chart 2 displays the total amount raised by region, and breaks it down by year. Latin-American firms have guaranteed debt-securities for an amount of more than 600 USD bn; Emerging Asian firms are second in importance, and have guaranteed 250 USD bn, while Emerging Europe and Africa & Middle East stand as third and fourth, with a total of 250 and 171 USD bn.
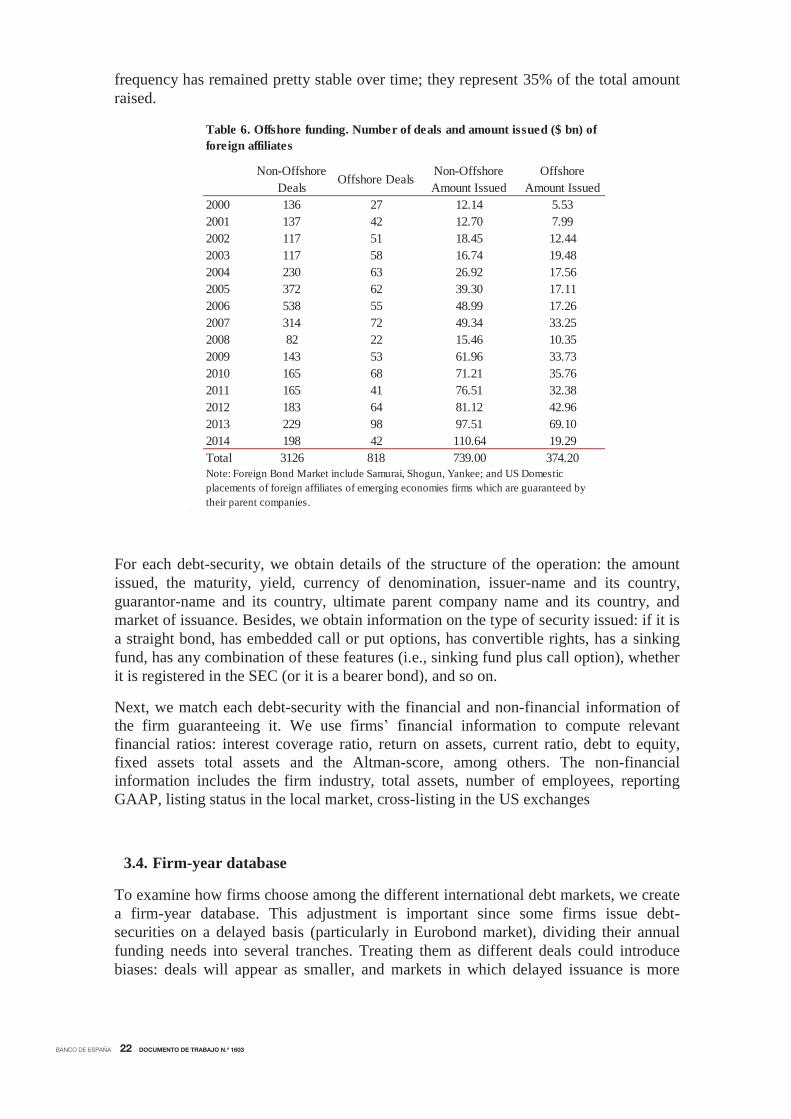
Finally, table 6 breaks the deals down by the country of incorporation of the debt-issuer, complementing information shown in chart 1. Onshore deals are those in which the country of incorporation coincides with the country of the guarantor; offshore deals are those in which they are different. Offshore deals represent 20% of the total, and their
Total Average Global Bond
MarketsForeign Bond
MarketsUS 144A Bond
MarketsEurodollar
Bond Market2000 108.37 216.96 212.47 170.89 61.822001 115.58 703.22 326.29 223.30 59.722002 183.88 366.39 156.54 337.54 117.762003 206.95 487.75 242.37 275.59 114.372004 151.82 397.61 130.37 218.41 122.542005 129.99 331.84 187.74 192.56 106.372006 111.73 542.29 296.01 196.72 82.012007 213.97 468.97 256.36 282.94 199.682008 248.18 271.47 215.35 516.82 228.112009 488.26 1073.26 383.20 375.76 450.482010 459.09 1008.39 715.00 371.46 430.232011 528.60 1178.37 238.61 541.17 474.962012 502.36 931.55 149.78 643.54 441.732013 509.51 929.13 179.31 417.26 486.322014 543.64 1012.87 40.72 586.17 414.94Total Average 282.32 713.22 226.31 360.60 232.67Note: Foreign Bond Market include Samurai, Shogun, Yankee; and US Domestic placements of foreign affiliates of emerging economies firms which are guaranteed by their parent companies.
Table 5. Average amount issued per year ($ mm). Breakdown by market of issuance.
0
20
40
60
80
100
120
140
160
180
2000 2001 2002 2003 2004 2005 2006 2007 2008 2009 2010 2011 2012 2013 2014
Latin America Emerging Asia Africa & Middle East Emerging Europe
USD bln
Source: Bloomberg, own elaboration.
Chart 2. Debt-guaranteed by emerging economies firms. Breakdown by region.
Note: breakdown by country of risk (nationality of the firm guaranteeing the debt -security).
BANCO DE ESPAÑA 22 DOCUMENTO DE TRABAJO N.º 1603
frequency has remained pretty stable over time; they represent 35% of the total amount raised.
For each debt-security, we obtain details of the structure of the operation: the amount issued, the maturity, yield, currency of denomination, issuer-name and its country, guarantor-name and its country, ultimate parent company name and its country, and market of issuance. Besides, we obtain information on the type of security issued: if it is a straight bond, has embedded call or put options, has convertible rights, has a sinking fund, has any combination of these features (i.e., sinking fund plus call option), whether it is registered in the SEC (or it is a bearer bond), and so on.
Next, we match each debt-security with the financial and non-financial information of the firm guaranteeing it. We use firms’ financial information to compute relevant financial ratios: interest coverage ratio, return on assets, current ratio, debt to equity, fixed assets total assets and the Altman-score, among others. The non-financial information includes the firm industry, total assets, number of employees, reporting GAAP, listing status in the local market, cross-listing in the US exchanges
3.4. Firm-year database
To examine how firms choose among the different international debt markets, we create a firm-year database. This adjustment is important since some firms issue debt-securities on a delayed basis (particularly in Eurobond market), dividing their annual funding needs into several tranches. Treating them as different deals could introduce biases: deals will appear as smaller, and markets in which delayed issuance is more
Non-Offshore Deals
Offshore DealsNon-Offshore Amount Issued
Offshore Amount Issued
2000 136 27 12.14 5.532001 137 42 12.70 7.992002 117 51 18.45 12.442003 117 58 16.74 19.482004 230 63 26.92 17.562005 372 62 39.30 17.112006 538 55 48.99 17.262007 314 72 49.34 33.252008 82 22 15.46 10.352009 143 53 61.96 33.732010 165 68 71.21 35.762011 165 41 76.51 32.382012 183 64 81.12 42.962013 229 98 97.51 69.102014 198 42 110.64 19.29Total 3126 818 739.00 374.20
Table 6. Offshore funding. Number of deals and amount issued ($ bn) of foreign affiliates
Note: Foreign Bond Market include Samurai, Shogun, Yankee; and US Domestic placements of foreign affiliates of emerging economies firms which are guaranteed by their parent companies.

BANCO DE ESPAÑA 23 DOCUMENTO DE TRABAJO N.º 1603
frequent would become overrepresented. Similar methodological decisions have been taken in previous research (Esho et al. (2001)).
Thus, for each firm, we map all the debt-securities issued in a given year into a single observation. If a firm issues only once, the annual observation coincides with the deal-level observation described in the previous sub-section. But if a firm issues several times in a given year, we need construct a single observation. We describe in Annex I our procedure.
Once we have constructed a firm-level database, we classify firms according to the market in which they issue. Firms might issue in more than one market in a given year. This creates a distinction between firms issuing in a single market, and those issuing in at least two –the switchers-.
There are different reasons behind a firm’ choice. Firms may choose the market to minimize their costs of issuance but they may also want to broaden the investor base: different markets attract different investors, so some firms –in particular, firms with large funding needs- might choose to issue in two markets to tap different pools of funding.
Thus, we use the following assumption to classify firms: firms which, in a given year, switch between the Global bond market and the institutional/wholesale markets find more cost effective the public bond market and they switch to diversify their investor base. This assumption is sensible; there are economies of scale in issuing debt in public-debt markets, so firms switching to institutional/wholesale securities markets will be looking to broaden their investor base.
Accordingly, we classify firms in two main groups: firms able to issue in the public debt-securities market, and firms which cannot. The group of firms without access to the public debt-securities markets is further broken down in three sub-groups: firms issuing debt only in the US144A private debt market; firms issuing only in the Eurobond market, and firms issuing in both markets.
Table 7 shows the number of firms issuing in each market by year. The total number of firm-year observations is 2,761; by construction, this number is smaller than the number of deals, underscoring that some firms issue more than one security each year (an average of 1.2 deals per year).
There are 142 firms which, in a given year, are able to issue in the global bond market, 51 firms have access to the foreign bond market, and the remaining 2,568 do not have access to the public debt-securities markets20. Among them, there are 2,163 firms which, in a given year, issue only in the Eurobond market; 311 issue only in the US144A bond market; and 94 accede simultaneously to both markets.
The group of firms which have access to foreign bond markets and do not issue in the global bond market is small. Moreover, the Yankee market has faded since the enforcement of US regulation with the passage of the Sarbanes-Oxley Act in 2002 (Gao (2011).
20 In Annex I we provide further details on switchers: there are 67 firms which, in a given year, issue simultaneously in the global bond market at any private debt-securities markets; these firms are larger than firms acceding only the global bond market (the non-switchers).

BANCO DE ESPAÑA 24 DOCUMENTO DE TRABAJO N.º 1603
3.5. Univariate analysis. Deal characteristics and firms’ features in global and institutional/wholesale markets
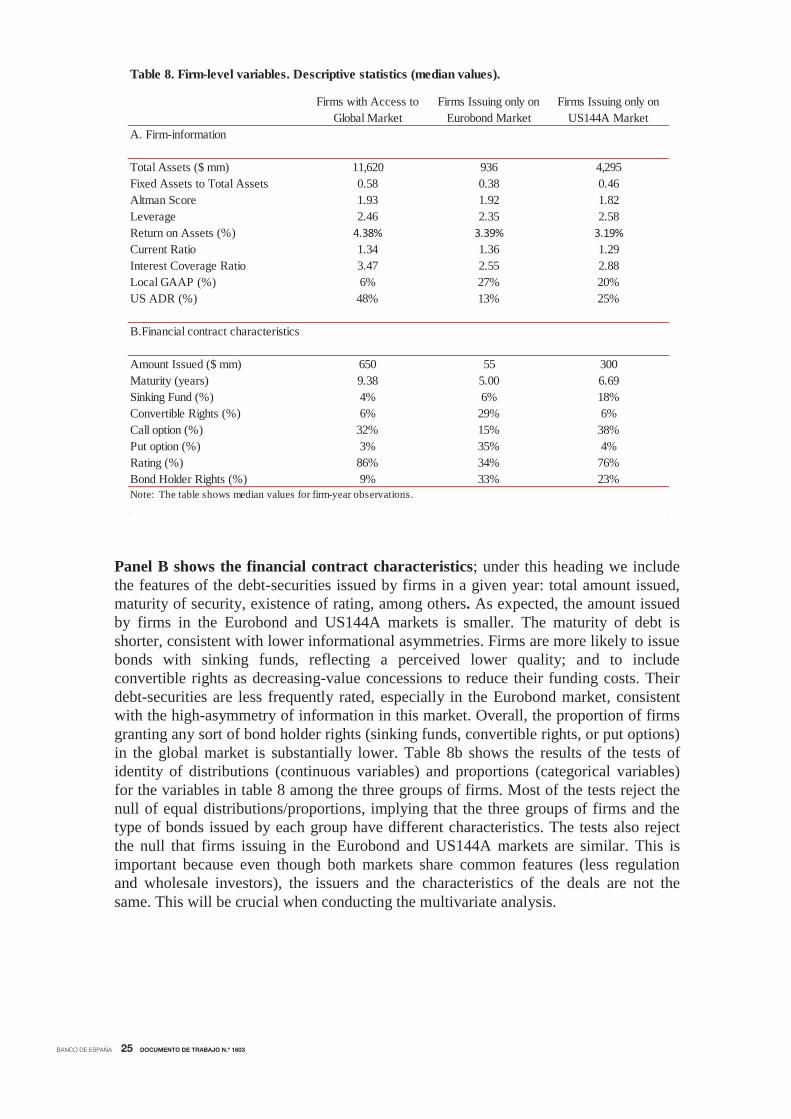
Next, we compare the characteristics of the deals and the type of borrowers among the global (public) and institutional/wholesale markets. We use descriptive statistics, kernel estimation, and tests of stochastic dominance. Table 8 shows descriptive statistics. All variables shown are firm-specific. They can be classified in two groups: firm-information; and variables related to the type of financial contracts that firms subscribe. We refer to them as financial contract characteristics; they include measures of the type of debt-securities and are a valuable source of information of firms’ credit quality, which reflects how lenders assess their risk.
Panel A reports firm-information. Firms guaranteeing debt issued in institutional/wholesale debt-securities markets are smaller and are less frequently cross-listed in the US through ADR. This is consistent with our expectation: firms with more capacity to absorb flotation costs will issue debt in public debt markets. Firms without access to the global market show more severe informational asymmetries: have a lower proportion of fixed assets to total assets, and are more likely to report their financial statements using a local GAAP.
Also, firms issuing debt only in institutional/wholesale markets seem to have weaker financial conditions. They show lower profitability (ROA) and less capacity to pay interest expenses (ICR). Overall, firms without access to the global market show worst financial conditions.
Table 7. Number of firms active in international debt markets.
Total Access to
Global Bond Market
Access to Foreign Bond
Market
Eurodollar Bond
Market
US144A Bond
Market
Simultaneously in both
2000 116 6 8 76 18 82001 136 5 4 107 14 62002 113 10 2 80 15 62003 110 11 2 64 27 62004 218 12 5 174 18 92005 301 10 5 255 21 102006 400 10 3 370 10 72007 310 11 3 283 10 32008 88 3 4 75 5 12009 139 12 4 91 28 42010 164 8 1 125 26 42011 141 10 5 110 10 62012 152 12 0 119 14 72013 210 10 4 167 23 62014 163 12 1 67 72 11Total 2,761 142 51 2,163 311 94
Public debt-securities markets Private debt-securities markets
Note: Firm-year observations are classified in mutually exclusive groups, depending on the market of issuance. Access to global bond markets includes firms which issue at least once in the global bond market; access to foreign bond markets includes firms which issue at least once in the foreign bond market (and do not belong to the previous group). As for firms without access to public debt-securities are markets, are classified in three groups: firms issuing only in Eurodollar, only in US144A, and firms issuing simultaneously in both.
BANCO DE ESPAÑA 25 DOCUMENTO DE TRABAJO N.º 1603
Panel B shows the financial contract characteristics; under this heading we include the features of the debt-securities issued by firms in a given year: total amount issued, maturity of security, existence of rating, among others. As expected, the amount issued by firms in the Eurobond and US144A markets is smaller. The maturity of debt is shorter, consistent with lower informational asymmetries. Firms are more likely to issue bonds with sinking funds, reflecting a perceived lower quality; and to include convertible rights as decreasing-value concessions to reduce their funding costs. Their debt-securities are less frequently rated, especially in the Eurobond market, consistent with the high-asymmetry of information in this market. Overall, the proportion of firms granting any sort of bond holder rights (sinking funds, convertible rights, or put options) in the global market is substantially lower. Table 8b shows the results of the tests of identity of distributions (continuous variables) and proportions (categorical variables) for the variables in table 8 among the three groups of firms. Most of the tests reject the null of equal distributions/proportions, implying that the three groups of firms and the type of bonds issued by each group have different characteristics. The tests also reject the null that firms issuing in the Eurobond and US144A markets are similar. This is important because even though both markets share common features (less regulation and wholesale investors), the issuers and the characteristics of the deals are not the same. This will be crucial when conducting the multivariate analysis.
Firms with Access to Global Market
Firms Issuing only on Eurobond Market
Firms Issuing only on US144A Market
A. Firm-information
Total Assets ($ mm) 11,620 936 4,295Fixed Assets to Total Assets 0.58 0.38 0.46Altman Score 1.93 1.92 1.82Leverage 2.46 2.35 2.58Return on Assets (%) 4.38% 3.39% 3.19%Current Ratio 1.34 1.36 1.29Interest Coverage Ratio 3.47 2.55 2.88Local GAAP (%) 6% 27% 20%US ADR (%) 48% 13% 25%
B.Financial contract characteristics
Amount Issued ($ mm) 650 55 300Maturity (years) 9.38 5.00 6.69Sinking Fund (%) 4% 6% 18%Convertible Rights (%) 6% 29% 6%Call option (%) 32% 15% 38%Put option (%) 3% 35% 4%Rating (%) 86% 34% 76%Bond Holder Rights (%) 9% 33% 23%
Table 8. Firm-level variables. Descriptive statistics (median values).
Note: The table shows median values for firm-year observations.

BANCO DE ESPAÑA 26 DOCUMENTO DE TRABAJO N.º 1603
Chart 3 plots the density function of a number of variables for different types of firms: firms with access to global bond market; firms issuing debt only in the Eurobond market and firms issuing debt only in the US144A market. Visual inspection suggests that firms with access to global bond markets are larger, have a better ratio of fixed assets to total assess and issue at longer maturities. These firms also have better interest coverage ratios and larger ROA. Firms issuing only in the Eurobond market are smaller and have lower ratio of fixed assets than those in the US144A market. Finally, we further analyze these apparent relations conducting empirical tests of stochastic dominance for the distributions of different variables among the three groups of firms (see Annex V for a description). Unlike test of equality of distributions, these tests rank unequivocally independent distributions; for instance, they determine if the distribution of firms with access to global the bond market have larger assets than the firms in any of the other two groups at any level of total assets. The results of the analysis are shown in the third column of table 9. They confirm the different features of each group of issuers. Firms with access to global markets are larger, have a higher fixed assets ratio and issue larger amounts at longer maturities. This is also true for those firms only issuing in the US144A market compared to firms issuing only in the Eurobond market (see table 9-Panel C). Regarding financial conditions, firms with access to global markets show better balance-sheet ratios overall. Issuers in the US144A market seem to have more deteriorated ratios.
Table 8b. Tests of identity of distributions/proportions. Null is identity. (Z-values)
Global Issuers vs. Eurobond Issuers
Global Issuers vs. UA144A Issuers
Eurobond Issuers vs. US144A Issuers
A. Firm-information
Total Assets ($ mm) -10.41*** -4.41*** 9.20***Fixed Assets to Total Assets -6.62*** -2.84*** 4.18***Altman Score 0.71 -0.34 -1.54Leverage -0.80 1.53 3.06***Return on Assets (%) -1.98*** -1.36 0.71Current Ratio 0.30 -1.07 -2.08***Interest Coverage Ratio -2.76*** -1.21 1.93**Local GAAP (%) 5.62*** 3.84*** -2.73***US ADR (%) -11.19*** -4.74*** 5.76***
B.Financial contract characteristics
Amount Issued ($ mm) -12.06*** -4.82*** 14.34***Maturity (years) -11.24*** -4.23*** 7.88***Sinking Fund (%) 0.73 4.02*** 8.03***Convertible Rights (%) 5.85*** -0.23 -8.71***Call option (%) -5.04*** 1.35 9.70***Put option (%) 7.84*** 0.71 -10.89***Rating (%) -12.45*** -2.43*** 14.21***Bond Holder Rights (%) 5.98*** 3.60*** -3.47***Note: Global Issuers refer to those firms with access to the global market Eurobond (US144A) issuers refer to firms issuing only in the eurobond (US144A) market. The table shows median values for firm-year observations. Test of identity of distributions: Wilkoxon rank-sum test for continuous variables; tests of equality of proportions for categorical variables. Table shows the z-values, *, **, and *** denote statistical significance at 10%, 5%, and 1%, respectively.

BANCO DE ESPAÑA 27 DOCUMENTO DE TRABAJO N.º 1603
SOURCE: Bloomberg and own calculations. Global: firms with access to Global market. Eurobond: Firms only issuing Eurobonds. US144a: Firms only issuing US144a bonds.Charts show estimated kernel density functions for different periods . We use the "Epanechnikov" kernel function and the “optimal” window width (the one thatminimizes the mean integrated square error). Robustness checks using different kernel functions and window widths show similar qualitative results . To controlfor the potential in�uence of outliers, we exclude observations in the 1% from upper and lower tails of the distribution.
Chart 3. Kernel density function estimation
1. Total assets 2. Ratio fixed assets
3. Maturity 4. Leverage
5. Return on assets 6. Interest coverage ratio
0
0.00005
0.0001
0.00015
0.0002
0.00025
Global Eurobond US144a
0
0.002
0.004
0.006
0.008
0.01
0.012
0.014
0.016
0.018
0 16 32 48 64 80 96
Global Eurobond US144a
0
0.025
0.05
0.075
0.1
0.125
0.15
0.175
0.2
0.225
0 3 6 9 12 15 18 21 24
Global Eurobond US144a
0
0.05
0.1
0.15
0.2
0.25
0.3
0.35
0.4
0.45
0.5
0.55
0.6
0.65
1 2 3 4 5 6 7 8
Global Eurobond US144a
0
0.01
0.02
0.03
0.04
0.05
0.06
0.07
0.08
0.09
-20 -17 -14 -11 -8 -5 -2 1 4 7 10 13 16 19 22 25 28
Global Eurobond US144a
0
0.02
0.04
0.06
0.08
0.1
0.12
0.14
0 3 6 9 12 15 18 21
Global Eurobond US144a

BANCO DE ESPAÑA 28 DOCUMENTO DE TRABAJO N.º 1603
The analysis of the distributions of firm-level information confirms that differences in the type of firms acceding to each market are not random. They suggest that poorer credit quality, more severe informational asymmetries, and less ability to cope with high flotation costs, lead firms to issue in the institutional/wholesale markets. Though, we cannot claim causality. Differences in the distributions can stem from an unobserved variable. For instance, larger firms have easier access to the global bond market; if firm
Test GLOBAL SD1 EUROBOND
Test EUROBOND SD1 GLOBAL
SD1 SD1
Total Assets 1.000 0.000***
Fixed Assets to Total Assets 1.000 0.000***
Altman Score 0.404 0.739
Leverage 0.123 0.005***
Return on Assets 0.915 0.018**
Current Ratio 0.561 0.806
Interest Coverage Ratio 0.771 0.004***
Amount Issued 1.000 0.000***
Maturity 1.000 0.000***
Test GLOBAL SD1 US144A BONDS
Test US144A BONDS SD1 GLOBAL
SD1 SD1
Total Assets 0.997 0.000***
Fixed Assets to Total Assets 1.000 0.004***
Altman Score 0.800 0.215
Leverage 0.068** 0.816
Return on Assets 0.725 0.028**
Current Ratio 0.937 0.308
Interest Coverage Ratio 0.727 0.110
Amount Issued 0.944 0.000***
Maturity 0.916 0.000***
Test EUROBOND SD1 US144A
Test US144A SD1 EUROBOND
SD1 SD1
Total Assets 0.000*** 0.985
Fixed Assets to Total Assets 0.000*** 0.978
Altman Score 0.988 0.087*
Leverage 0.000*** 1.000
Return on Assets 0.093* 0.686
Current Ratio 0.986 0.059*
Interest Coverage Ratio 0.007 0.931
Amount Issued 0.000*** 0.994
Maturity 0.000*** 0.664Source: own elaboration
*, **, and *** denote rejecting the nul l of SD at the s igni ficance level of 10%, 5%, and 1%, respectively.
B- Global vs. US144A
C- Eurobond vs. US144A
EUROBOND
Table 9. Tests of stochastic dominance in EMEs NFCs. 2000-2014 (p-values)
SD1: distribution preferred.
GLOBAL
GLOBAL
-
A- Global vs. Eurobond
GLOBAL
-
GLOBAL
GLOBAL
GLOBAL
SD1: distribution preferred.
GLOBAL
GLOBAL
-
GLOBAL
GLOBAL
-
-
GLOBAL
GLOBAL
SD1: distribution preferred.
US144a
US144a
EUROBOND
EUROBOND
US144A
EUROBOND
US144a
US144a
US144a

BANCO DE ESPAÑA 29 DOCUMENTO DE TRABAJO N.º 1603
size is positively correlated with cross-listing in the US through ADR, the unconditional distribution can lead to erroneous inference about the impact of cross-listing on firms’ choices.
The univariate analysis, although lacking any causality assessment, provides important information to analyze the risks for financial stability. It shows that firms tapping institutional/wholesale markets have weaker financial conditions and need to introduce different covenants on their issuances to protect bond holders. Moreover, it shows that institutional/wholesale debt markets, which have increased its size remarkably after the global financial crisis, are populated by issuers with higher credit risk.
4. Multivariate Analysis of Firms’ Choice of Market of Issuance
In this section we investigate firms’ incremental debt choice among their existing options in international debt-securities markets. Conditional on their decision to issue a debt-security in an international market, they can choose between the global, the US144A, and the Eurobond markets. Thus, this exercise focuses on the marginal decision of firms, reporting the results of multinomial logit regressions and ordered logit regression. This type of estimation has already being used in previous literature analyzing the determinants of the debt choice (Denis and Mihov (2003), Altunbas et al. (2009), Esho and Sharpe (2001)). All independent variables are firm-specific. Common factors are captured by the intercept and the time dummies.
4.1. Multinomial Logit.
Given the results obtained from the univariate analysis we need to treat the three groups of firms separately and study how firms choose among the three alternative options: global bond market (baseline option), US144A and Eurobond markets. We fit a multinomial logit to do so. This specification allows for potential differences in the slope of the coefficient and relaxes the proportional odd ratios assumption that holds in an ordered logit specification. In the first model, we include only the financial contracting variables, and use 2,579 firm-year observations; in Table 10 we report the odd ratios (see table VI.1 for the coefficients). In the second model, we include the firm-variables as well, and we use 1,193 firm-year observations. These are the main results.
First, the decision to issue in the global bond market depends positively on the total amount issued; but it is not a determinant on firms’ choice for the US144A bond market. Not being cross-listed in the US exchanges through ADRs implies firms are more likely to issue securities in both the US144A and Eurobond markets. Firm size has a negative impact on the decision to issue in the Eurobond and in the US 144A bond market. Overall, flotation costs impact on firms’ choices: the amount issued, and the firm size, introduce a wedge between firms; those large enough will issue in the global bond market.

BANCO DE ESPAÑA 30 DOCUMENTO DE TRABAJO N.º 1603
Second, informational asymmetries are a key factor behind firms’ choice of US144A and Eurobond markets; but are evident in different financial contract characteristics. Firms issuing unrated debt are more likely to enter the Eurobond market; this is not a significant factor behind firms issuing in the US144A bond market. On the other hand, firms granting bondholders rights (sinking fund, convertible rights, any combination of them and other embedded options) are more likely to enter institutional/wholesale markets. Bond maturities impact negatively on firms’ decision to issue debt in any of the two institutional/wholesale markets and the ratio of fixed assets to total assets is not significant. Third, firms with higher risk of financial distress are less likely to issue debt in the Eurobond market. This may indicate that having healthy financial ratios is more relevant for the small firms issuing in the Eurobond market than for the large and well-
Including Firm-InformationVARIABLES US144A Eurobond US144A Eurobond
Amount Issued 1.082 0.742***[0.112] [0.070]
Term 0.945*** 0.925*** 0.953** 0.927***[0.015] [0.015] [0.020] [0.021]
Local GAAP 3.375*** 3.144*** 3.323** 2.867**[1.388] [1.206] [1.603] [1.297]
ADR 0.410*** 0.408*** 0.591* 0.489***[0.103] [0.094] [0.164] [0.119]
MOVE Index 0.996 0.988*** 0.998 0.990*[0.004] [0.004] [0.006] [0.006]
Rated Security 0.824 0.311*** 0.477 0.148***[0.324] [0.109] [0.273] [0.077]
Bond Holder Right 2.325** 1.682 3.776** 2.845*[0.813] [0.543] [2.318] [1.679]
No Financial Info 1.143 1.098[0.296] [0.264]
Market Based 1.633* 1.553* 1.794* 1.816**[0.412] [0.365] [0.567] [0.534]
Firm Assets 0.794** 0.794**[0.086] [0.079]
Fixed Assets to Total Assets 0.996 0.996[0.007] [0.006]
Altman score <1.21 1.264 0.589*[0.420] [0.184]
Constant 3.237* 601.206*** 7.115** 937.763***[2.011] [343.495] [6.922] [856.538]
Observations 2,579 2,579 1,193 1,193Robust standard errors in brackets*** p<0.01, ** p<0.05, * p<0.1
Table 10. Determinants of market of issuance of debt-securities. Multinomial Logit. Odd Ratios
Financial Contracting Features
Note: multivariate logit, base outcome is firm being able to issue in global bond market; 1 if firm issues only in US144A; and 2 if firm issues only in Eurobond market.

BANCO DE ESPAÑA 31 DOCUMENTO DE TRABAJO N.º 1603
known firms with access to the global market. The opposite happens with firms issuing in the USD144A market; firms with higher risk of financial distress tend to issue in that market although the coefficient is not significant. Market volatility makes firms less likely to issue in the Eurobond market. This is consistent with firms being better able to choose the market-timing in institutional/wholesale markets. Finally, firms are more likely to issue in both types of institutional/wholesale debt-securities markets after the global financial crisis –the market based dummy has a negative and similar impact in both columns.
Table 11 shows the marginal effects for the multinomial logit. They show the change in the probability of issuing in a given market after a standard deviation change in continuous variables, and a unit change in categorical variables. By construction, the sum of the three changes is zero. The last row shows the baseline values, or frequency of firms issuing in each of these markets.
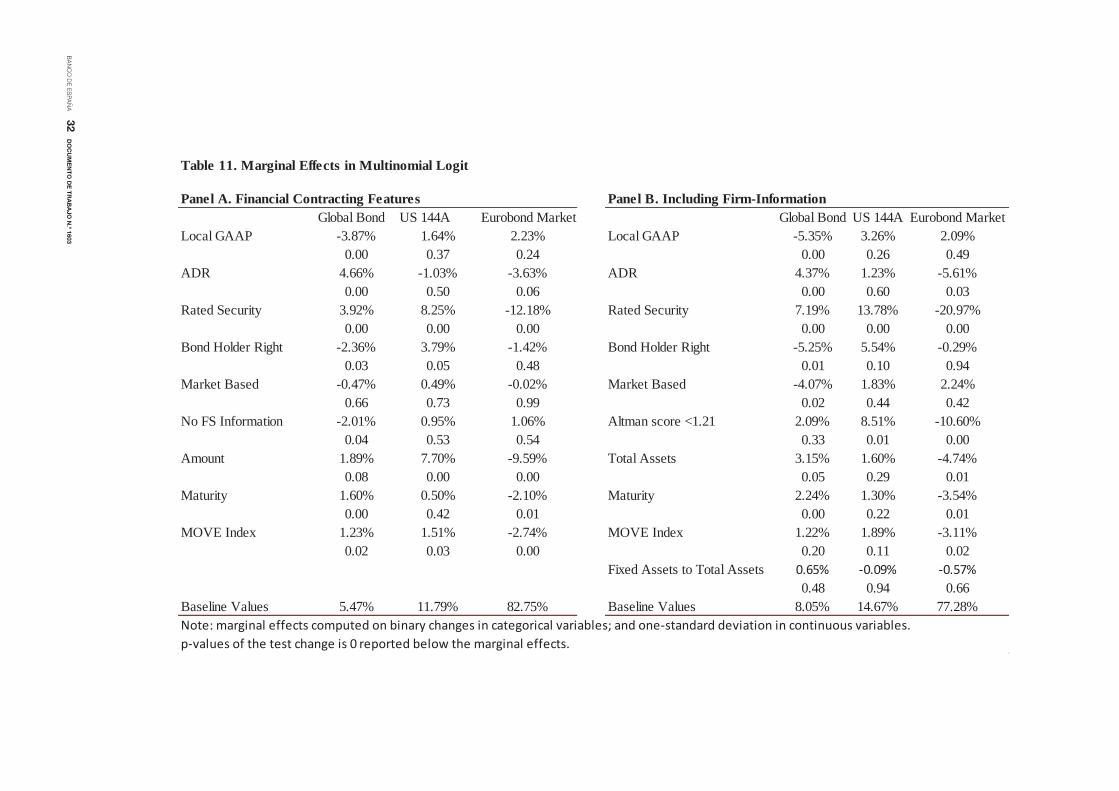
BA
NC
O D
E E
SP
AÑ
A32
DO
CU
ME
NT
O D
E T
RA
BA
JO
N.º 1
603
Table 11. Marginal Effects in Multinomial Logit
Panel A. Financial Contracting Features Panel B. Including Firm-InformationGlobal Bond US 144A Eurobond Market Global Bond US 144A Eurobond Market
Local GAAP -3.87% 1.64% 2.23% Local GAAP -5.35% 3.26% 2.09%0.00 0.37 0.24 0.00 0.26 0.49
ADR 4.66% -1.03% -3.63% ADR 4.37% 1.23% -5.61%0.00 0.50 0.06 0.00 0.60 0.03
Rated Security 3.92% 8.25% -12.18% Rated Security 7.19% 13.78% -20.97%0.00 0.00 0.00 0.00 0.00 0.00
Bond Holder Right -2.36% 3.79% -1.42% Bond Holder Right -5.25% 5.54% -0.29%0.03 0.05 0.48 0.01 0.10 0.94
Market Based -0.47% 0.49% -0.02% Market Based -4.07% 1.83% 2.24%0.66 0.73 0.99 0.02 0.44 0.42
No FS Information -2.01% 0.95% 1.06% Altman score <1.21 2.09% 8.51% -10.60%0.04 0.53 0.54 0.33 0.01 0.00
Amount 1.89% 7.70% -9.59% Total Assets 3.15% 1.60% -4.74%0.08 0.00 0.00 0.05 0.29 0.01
Maturity 1.60% 0.50% -2.10% Maturity 2.24% 1.30% -3.54%0.00 0.42 0.01 0.00 0.22 0.01
MOVE Index 1.23% 1.51% -2.74% MOVE Index 1.22% 1.89% -3.11%0.02 0.03 0.00 0.20 0.11 0.02
Fixed Assets to Total Assets 0.65% -0.09% -0.57%0.48 0.94 0.66
Baseline Values 5.47% 11.79% 82.75% Baseline Values 8.05% 14.67% 77.28%Note: marginal effects computed on binary changes in categorical variables; and one-standard deviation in continuous variables.p-values of the test change is 0 reported below the marginal effects.
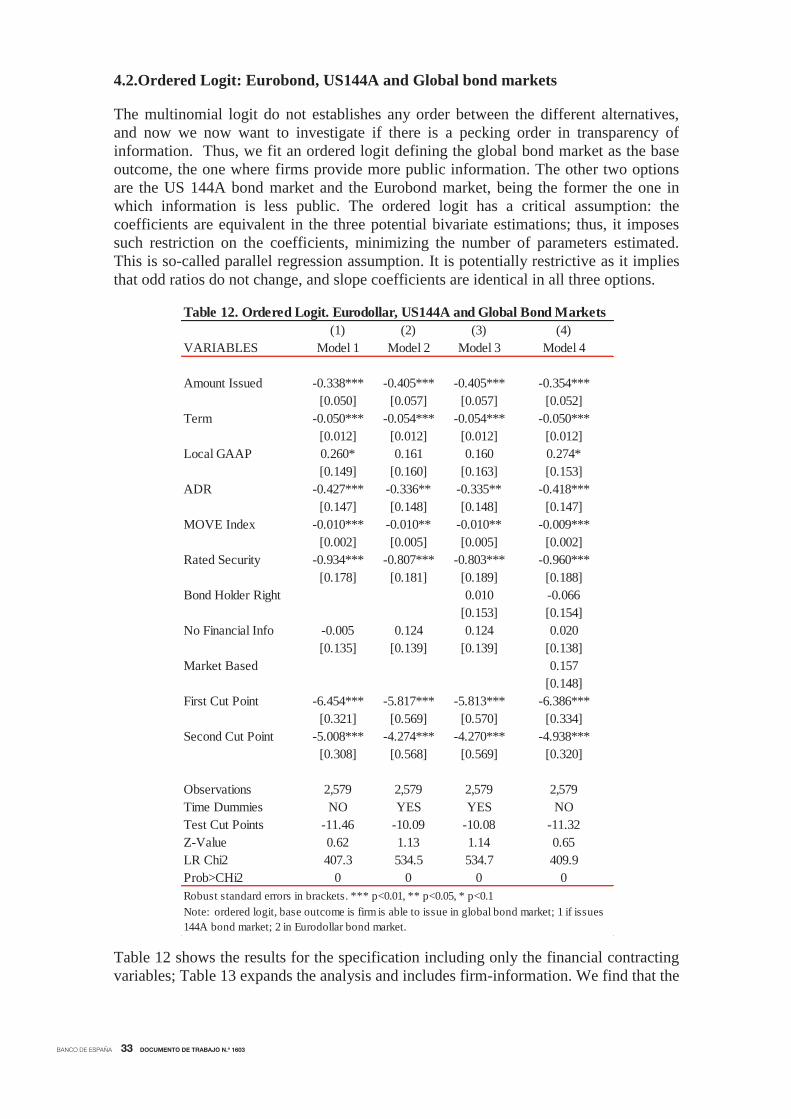
BANCO DE ESPAÑA 33 DOCUMENTO DE TRABAJO N.º 1603
4.2.Ordered Logit: Eurobond, US144A and Global bond markets
The multinomial logit do not establishes any order between the different alternatives, and now we now want to investigate if there is a pecking order in transparency of information. Thus, we fit an ordered logit defining the global bond market as the base outcome, the one where firms provide more public information. The other two options are the US 144A bond market and the Eurobond market, being the former the one in which information is less public. The ordered logit has a critical assumption: the coefficients are equivalent in the three potential bivariate estimations; thus, it imposes such restriction on the coefficients, minimizing the number of parameters estimated. This is so-called parallel regression assumption. It is potentially restrictive as it implies that odd ratios do not change, and slope coefficients are identical in all three options.
Table 12 shows the results for the specification including only the financial contracting variables; Table 13 expands the analysis and includes firm-information. We find that the
(1) (2) (3) (4)VARIABLES Model 1 Model 2 Model 3 Model 4
Amount Issued -0.338*** -0.405*** -0.405*** -0.354***[0.050] [0.057] [0.057] [0.052]
Term -0.050*** -0.054*** -0.054*** -0.050***[0.012] [0.012] [0.012] [0.012]
Local GAAP 0.260* 0.161 0.160 0.274*[0.149] [0.160] [0.163] [0.153]
ADR -0.427*** -0.336** -0.335** -0.418***[0.147] [0.148] [0.148] [0.147]
MOVE Index -0.010*** -0.010** -0.010** -0.009***[0.002] [0.005] [0.005] [0.002]
Rated Security -0.934*** -0.807*** -0.803*** -0.960***[0.178] [0.181] [0.189] [0.188]
Bond Holder Right 0.010 -0.066[0.153] [0.154]
No Financial Info -0.005 0.124 0.124 0.020[0.135] [0.139] [0.139] [0.138]
Market Based 0.157[0.148]
First Cut Point -6.454*** -5.817*** -5.813*** -6.386***[0.321] [0.569] [0.570] [0.334]
Second Cut Point -5.008*** -4.274*** -4.270*** -4.938***[0.308] [0.568] [0.569] [0.320]
Observations 2,579 2,579 2,579 2,579Time Dummies NO YES YES NOTest Cut Points -11.46 -10.09 -10.08 -11.32Z-Value 0.62 1.13 1.14 0.65LR Chi2 407.3 534.5 534.7 409.9Prob>CHi2 0 0 0 0
Table 12. Ordered Logit. Eurodollar, US144A and Global Bond Markets
Robust standard errors in brackets. *** p<0.01, ** p<0.05, * p<0.1Note: ordered logit, base outcome is firm is able to issue in global bond market; 1 if issues 144A bond market; 2 in Eurodollar bond market.

BANCO DE ESPAÑA 34 DOCUMENTO DE TRABAJO N.º 1603
less able to cope with high flotation costs a firm is, the more probable they opt to access institutional/wholesale markets (negative sign of amount issued); and firms with higher asymmetries of information will head towards less public markets (Local GAAP, term, rated security).
Next, we run tests of model specification. First we run a test of identity of the cut points (also known as thresholds). The test does not reject the null hypothesis is that the two cut points identified are different. Though, the brant tests reject the parallel regression assumption. All together, the results suggest the three choices are different: US 144A and Eurobond markets are two different options firms have available. Though, the differences between the US 144A and Eurobond markets are not constant across variables: the results of the brant tests suggest the slope coefficients are different in the bivariate logits; the restrictions on coefficients imposed by the ordered logit are too restrictive.
(1) (2) (3) (4) (5)Model 1 Model 2 Model 3 Model 4 Model 5
Firm Assets -0.182*** -0.193*** -0.130*** -0.144*** -0.140***[0.041] [0.045] [0.051] [0.048] [0.050]
Term -0.061*** -0.067*** -0.064*** -0.056*** -0.056***[0.016] [0.017] [0.018] [0.017] [0.017]
Local GAAP 0.193 0.118 0.108 0.187 0.189[0.175] [0.186] [0.197] [0.184] [0.184]
ADR -0.436*** -0.337** -0.345** -0.427*** -0.432***[0.154] [0.155] [0.159] [0.158] [0.160]
MOVE Index -0.009*** -0.015*** -0.017*** -0.007** -0.007**[0.003] [0.006] [0.006] [0.003] [0.003]
Rated Security -1.397*** -1.444*** -1.392*** -1.391*** -1.380***[0.221] [0.231] [0.233] [0.225] [0.227]
Bond Holder Right -0.168 -0.045 0.097 -0.005 -0.000[0.201] [0.206] [0.221] [0.225] [0.225]
Market Based 0.326* 0.309[0.189] [0.192]
Altman score <1.21 -0.352** -0.407*** -0.391**[0.155] [0.151] [0.157]
Fixed assets to Total Assets -0.001[0.004]
First Cut Point -6.381*** -6.185*** -5.909*** -5.903*** -5.872***[0.406] [0.703] [0.800] [0.470] [0.483]
Second Cut Point -5.066*** -4.779*** -4.445*** -4.535*** -4.504***[0.397] [0.703] [0.799] [0.460] [0.473]
Observations 1,536 1,536 1,195 1,195 1,193Time Dummies NO YES YES NO NOLR Chi2 246.0 349.4 262.1 170.1 170.3Prob>CHi2 0 0 0 0 0Brant 0.00150 3.61e-09 8.91e-08 0.00578 0.0101
Table 13. Ordered Logit. Including Firm-Information. Eurodollar, US144A and Global Bond Markets
Robust standard errors in brackets. *** p<0.01, ** p<0.05, * p<0.1Note: ordered logit, base outcome is firm is able to issue in global bond market; 1 if issues 144A bond market; 2 in Eurodollar bond market.

BA
NC
O D
E E
SP
AÑ
A35
DO
CU
ME
NT
O D
E T
RA
BA
JO
N.º 1
603
A.Financial Contracting Features B.Including Financial RatiosGlobal Bond US 144A Eurobond Market Global Bond US 144A Eurobond Market
Local GAAP -1.25% -1.88% 3.13% Local GAAP -1.27% -1.49% 2.76%0.06 0.07 0.06 0.29 0.31 0.30
ADR 2.20% 3.06% -5.26% ADR 3.10% 3.55% -6.65%0.01 0.01 0.01 0.01 0.01 0.01
Rated Security 4.09% 7.31% -11.40% Rated Security 7.62% 11.78% -19.40%0.00 0.00 0.00 0.00 0.00 0.00
Bond Holder Right 0.33% 0.46% -0.79% Bond Holder Right 0.00% 0.00% -0.01%0.67 0.67 0.67 1.00 1.00 1.00
Market Based -0.10% -0.14% 0.24% Market Based -2.17% -2.41% 4.58%0.88 0.89 0.89 0.12 0.10 0.10
No Financial Statement -0.76% -1.07% 1.83% Altman score <1.21 2.76% 3.07% -5.83%0.29 0.28 0.28 0.02 0.01 0.01
Amount 4.42% 4.98% -9.40% Firm Assets 2.55% 2.55% -5.10%0.00 0.00 0.00 0.01 0.00 0.01
Maturity 1.15% 1.52% -2.67% Maturity 2.09% 2.13% -4.22%0.00 0.00 0.00 0.00 0.00 0.00
MOVE Index 1.21% 1.60% -2.81% MOVE Index 1.36% 1.43% -2.79%0.00 0.00 0.00 0.05 0.04 0.04
Fixed Assets to Total Assets 0.18% 0.20% -0.38%0.77 0.77 0.77
Baseline Values 6% 12% 83% Baseline Values 8% 15% 77%Note: marginal effects computed on binary changes in categorical variables; and one-standard deviation in continuous variables.p-values of the test change is 0 reported below the marginal effects.
Table 14. Marginal Effects in Ordered Logit

BANCO DE ESPAÑA 36 DOCUMENTO DE TRABAJO N.º 1603
Table 14 reports the marginal effects. By construction, the change in the probability of choosing the outer options (Global bond market, as the more public debt-market; and Eurobond market, as the less public debt-market) have opposite signs, and the sign of the inner option –the US 144A bond market- is uncertain; and the sum of the three changes is zero. When the ability to absorb flotation cost improves (larger amount, existence of an ADR), the probability that a firm chooses the US144A bond market increases; similarly, if informational asymmetries decrease (rated securities, maturities, bond-holder rights, local GAAP) firms switch from the Eurobond to the US144A market. An increase in firms’ risk of financial distress (Altman score below 1.21) has a similar impact: the probability that a firm chooses the Eurobond market decreases at the expenses of the US144A. Overall, this suggests a migration of firms from the Eurobond market to the inner option; this way confirming that US144A and Eurobond are more akin between them, than US144A and global bond markets are.
4.3.Generalized ordered logit.
In the previous section we found that the brant tests reject the parallel regression assumption of the ordered logit. This assumption states that the odd-ratios are constant across all alternatives –i.e., there is a single set of coefficients for all covariates. The rejection of this hypothesis suggests that the restrictions of the ordinal logit model are too stringent. Though, this does not rule out the existence of an ordinal raking between the three primary bond markets. To investigate this possibility, we fit a generalized ordered logit. This estimation method does not impose ex-ante any restriction on the coefficients between the different choices; it tests their existence, estimating restricted and unrestricted models sequentially for each of the variables. Overall, the estimator is flexible enough to nest the multinomial and the ordinal models as particular cases. The results are shown in table 14. Marginal effects are shown in table 15. In the first model, we do not include firms’ financial variables (columns 1 and 2).
The results suggest that the differences between the odd-ratios of Global bond issuers and US144A issuers with respect to Eurobond issuers are related to the cost of fulfilling with the reporting standards of US public offerings. More formally, the iterative estimation identifies that the parallel regression assumption does not hold for maturity, local GAAP, and ADR21. When including balance-sheet variables, the restrictions are not imposed on local GAAP and total assets. Overall, the results show that the ranking between the three primary markets is not linear in several dimensions related with informational asymmetries and ability to cope with regulatory requirements of public offerings. Indeed, global issuers are identified as more different than the joint group of US144A and Eurobond issuers. More specifically, having a local GAAP makes unlikely than a firm issues in the Global bond market; it does not make a difference, when it comes to explain the choice between US144A and Eurobond. Similarly, the effect of ADR decreases: it is quite important in explaining the choice between Global and the other markets; less so for the choice between US144A and Eurobonds. And, when we include financial ratios, we find a similar effect for total assets.
21 Overall, the generalized ordered model estimates 13 parameters; it is more parsimonious than the multinomial model (which estimates 21), and less so than the ordinal model (which has just 11, at the cost of imposing restrictive relations between them)
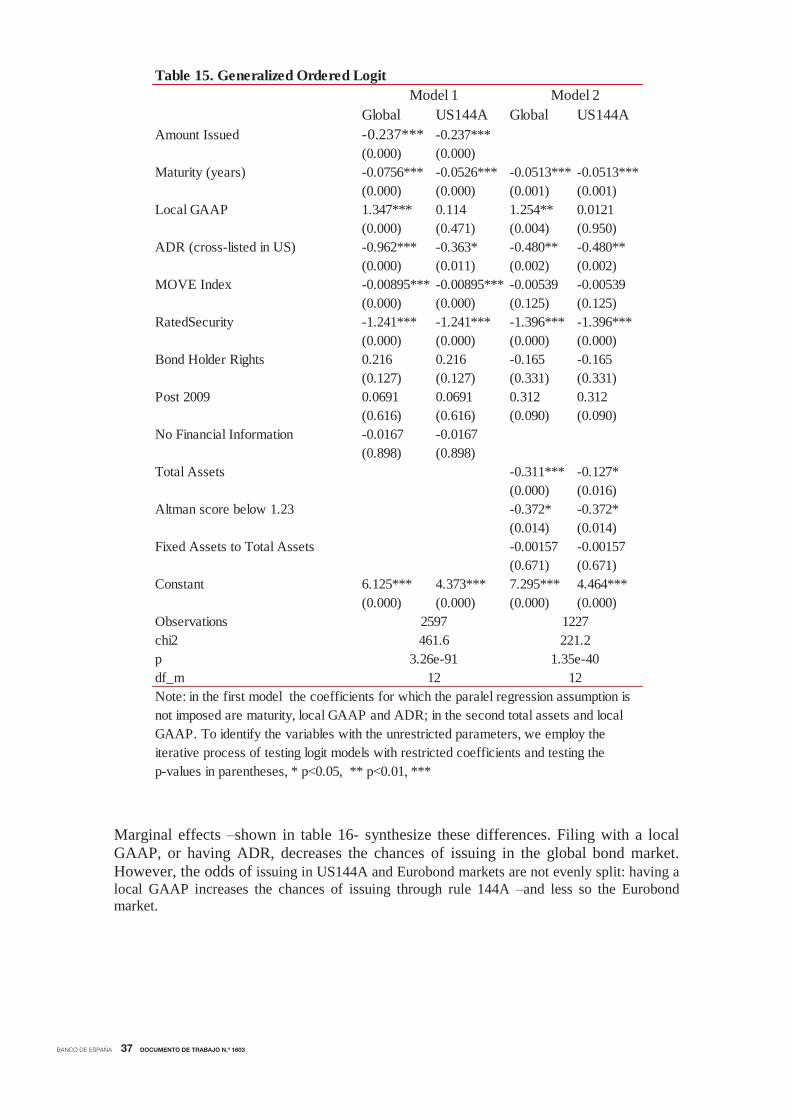
BANCO DE ESPAÑA 37 DOCUMENTO DE TRABAJO N.º 1603
Marginal effects –shown in table 16- synthesize these differences. Filing with a local GAAP, or having ADR, decreases the chances of issuing in the global bond market. However, the odds of issuing in US144A and Eurobond markets are not evenly split: having a local GAAP increases the chances of issuing through rule 144A –and less so the Eurobond market.
Table 15. Generalized Ordered Logit
Global US144A Global US144AAmount Issued -0.237*** -0.237***
(0.000) (0.000)Maturity (years) -0.0756*** -0.0526*** -0.0513*** -0.0513***
(0.000) (0.000) (0.001) (0.001)Local GAAP 1.347*** 0.114 1.254** 0.0121
(0.000) (0.471) (0.004) (0.950)ADR (cross-listed in US) -0.962*** -0.363* -0.480** -0.480**
(0.000) (0.011) (0.002) (0.002)MOVE Index -0.00895*** -0.00895*** -0.00539 -0.00539
(0.000) (0.000) (0.125) (0.125)RatedSecurity -1.241*** -1.241*** -1.396*** -1.396***
(0.000) (0.000) (0.000) (0.000)Bond Holder Rights 0.216 0.216 -0.165 -0.165
(0.127) (0.127) (0.331) (0.331)Post 2009 0.0691 0.0691 0.312 0.312
(0.616) (0.616) (0.090) (0.090)No Financial Information -0.0167 -0.0167
(0.898) (0.898)Total Assets -0.311*** -0.127*
(0.000) (0.016)Altman score below 1.23 -0.372* -0.372*
(0.014) (0.014)Fixed Assets to Total Assets -0.00157 -0.00157
(0.671) (0.671)Constant 6.125*** 4.373*** 7.295*** 4.464***
(0.000) (0.000) (0.000) (0.000)Observationschi2pdf_m
p-values in parentheses, * p<0.05, ** p<0.01, ***
12
Model 1 Model 2
Note: in the first model the coefficients for which the paralel regression assumption is not imposed are maturity, local GAAP and ADR; in the second total assets and local GAAP. To identify the variables with the unrestricted parameters, we employ the iterative process of testing logit models with restricted coefficients and testing the
2597461.6
3.26e-9112
1227221.2
1.35e-40

BANCO DE ESPAÑA 38 DOCUMENTO DE TRABAJO N.º 1603
4.4.Robustness checks
As we mentioned when analyzing the decision of issuing debt, firms may choose to tap less regulated markets due to the speed of issuance or the need to diversify their funding sources, even though they are able to cope with the regulatory requirements imposed by a public offering. We take into account these circumstances by excluding firms which have ever issued a global bond in our sample from the US144a or Eurobond issuers. Indeed, these firms might be still subject to ongoing disclosure requirements due to previous global bond issues. Many of the features which make them able to comply with regulatory requirements are likely to hold over time –reporting GAAP, existence of a US ADR. The results are robust to the exclusion of these firms, consistent with our priors (see table VI.2 in the Appendix). We also examine the differences between the two types of firms which have access to the Global bond market: the switchers and non-switchers. We have argued that switchers should be classified as firms which access to the Global bond market. We conjecture that fact that simultaneously issuing in another market is related to their other advantages –as described above, speed of issuance, bespoke financing conditions, funding diversification-, and not to a sudden or temporary inability to issue in the
Table 16. Robustness checks. Multinomial Logit. Generalized Ordered Logit. Marginal Effects
Global US144A Eurobond Global US144A EurobondLocal GAAP -4.32% 2.99% 1.33% -5.89% 6.30% -0.40%
0.00 0.09 0.47 0.00 0.02 0.89ADR 5.14% -0.55% -4.59% 3.26% 4.25% -7.51%
0.00 0.71 0.02 0.00 0.00 0.00Rated Security 4.73% 10.44% -15.17% 6.90% 12.80% -19.70%
0.00 0.00 0.00 0.00 0.00 0.00Bond Holder Right -1.03% -1.63% 2.66% 0.95% 1.20% -2.15%
0.14 0.13 0.14 0.38 0.38 0.38Market Based -0.31% -0.51% 0.82% -2.08% -2.58% 4.66%
0.62 0.62 0.62 0.09 0.08 0.08Infrastructure Firm -0.41% -0.66% 1.07% -3.93% -5.38% 9.31%
0.59 0.59 0.59 0.00 0.00 0.00No Financial Statement 0.07% 0.11% -0.18%
0.91 0.91 0.91Altman score <1.21 3.44% 4.27% -7.71%
0.00 0.00 0.00Amount 2.49% 3.62% -6.10%
0.00 0.00 0.00Maturity 1.63% 1.17% -2.79% 1.77% 2.09% -3.86%
0.00 0.02 0.00 0.00 0.00 0.00MOVE Index 1.11% 1.70% -2.81% 1.00% 1.22% -2.23%
0.00 0.00 0.00 0.11 0.09 0.10Firm assets 6.10% -1.21% -4.89%
0.00 0.48 0.01Fixed assets to total assets 0.67% 0.82% -1.49%
0.27 0.26 0.26Baseline Values 5.56% 11.82% 82.63% 8.12% 14.50% 77.38%
Panel B. Including Financial Ratios
Note: in the first model, the coefficients for which the paralel regression assumption is not imposed are maturity, local GAAP, and ADR; in the second, total assets and local GAAP
Panel A. Financial Contract Features
Global bond market. Consistent with our expectations, the non-parametric analysis suggests that switchers are larger and sounder than non-switchers (tableVI.3. in the
BANCO DE ESPAÑA 39 DOCUMENTO DE TRABAJO N.º 1603
Appendix). They are statistically different in some dimensions: larger size, higher ratio of fixed assets to total assets, higher profitability, and better Altman score. Though, they seem to invest less, signaling they are more mature companies. 5. Conclusion
In this paper we have investigated how non-financial borrowers of emerging economies choose among the existing international bond markets: global, US144A, and Eurobond markets. First, we have shown that monitoring the entities guaranteeing the debt-securities is key to prevent biases. Thus, to carry out the analysis, we have matched data on debt-securities, with the corresponding firm-level information on the firm-guaranteeing it. This way we have accomplished a comprehensive database of 3,944 debt-securities and over 1.2 USD trillion.
We have discussed how the regulation of international debt markets is uneven: global and foreign bond markets are strictly regulated; the regulation of the US 144A and in particular the Eurobond market is much lighter. The results of univariate and multivariate analyses confirm corporate finance theory predictions: firms of poorer credit quality, less ability to absorb high flotation costs, and exhibiting more informational asymmetries, tend to issue in the less regulated debt markets. This implies that credit risks are more severe in the US144A and the Eurobond markets. Moreover, the propensity to issue in these markets has increased after the global financial crisis. This can reflect the reduction in liquidity in public debt markets after the global financial crisis.
These results have far-reaching policy implications. They suggest that there is a two-tier system of regulation in international debt markets. The sizable regulatory gap implies that only very large and sound firms, with low informational asymmetries, find convenient to issue in public bond markets. Reforms aimed at making easier the access to public debt markets could be helpful. Local regulators could enhance firms’ access to global bond markets by converging towards international reporting standards. Regulators in key jurisdictions could collaborate to reduce the costs that issuing in the public bond market has for foreign firms.
This paper leaves unanswered some questions for further research. A first one has to do with the role of local debt markets. The development of local bond markets could either foster or restrain the access to international debt markets. Well-developed local bond markets reduce the need to obtain external financing. But they imply more familiarity with bond-financing, and thus could ease access to external markets. Moreover, if local markets are developed, regulators could have very demanding country-specific regulation -such as a local reporting GAAP; thus, local firms might find costly to raise funds in the fully-regulated international debt markets, and head towards the Eurobond market. The second question has to do with advanced economies firms and their access to international debt markets. Do they follow the same pattern? These economics differ in the stringency of local surveillance, legal systems, and institutions. More stringent local surveillance could imply less reliance in regulated debt markets. However, firms in advanced economies might have easier access to these markets, due to lower informational asymmetries, better legal systems and institutions. At the end of the day, these are empirical questions which deserve further analyses. Answering them is key to understand the risks that market-based financing poses for global financial stability.

BANCO DE ESPAÑA 40 DOCUMENTO DE TRABAJO N.º 1603
References
1. Avdjiev, S., R. McCauley, and H. Shin (2015), “Breaking free of the triple coincidence in international finance”, BIS Working Paper No.524
2. Bruno, V. and H. Shin (2015), “Global dollar credit and carry trades: a firm-level analysis”, BIS Working Paper No.510
3. Allen, F., R. Brealey, S. Myers (2013), “Principles of Corporate Finance”, Mcgraw-Hill
4. Altunbas, Y., A. Kara, and D. Marqués-Ibañez (2009), “Large debt financing: Syndicated loans versus corporate bonds”, ECB Working Paper Nº 1028
5. Anderson, G. (1996), “Non-parametric tests of Stochastic Dominance in Income Distribution”, Econometrica, Vol 64. 5.
6. Arena, M. (2011), “The Corporate Choice between Public Debt, Bank Loans, Traditional Private Debt Placements, and 144A Debt Issues”, Review of Quantitative Finance and Accounting vol 36
7. Ayala, D., M. Nedeljkovi, and C. Saborowski (2015), “What Slice of the Pie? The Corporate Bond Market Boom in Emerging Economies”, IMF Working Paper Nº 15/148
8. Avdjiev, S., M. Chui, and H. Shin, “Non-financial corporations from emerging market economies and capital flows”, BIS Quarterly Review, December 2014
9. Barrett, G. and S.G.Donald (2003), “Consistent Tests for Stochastic Dominance”, Econometrica, vol 71. No.1 (January 2003), 71-104
10. Berlin, M. and J. Loyes (1988), “Bond covenants and delegated monitoring”, Journal of Finance 43 397-412
11. BIS-ECB-IMF (2015), “Handbook of Securities Statistics” IMF
12. Brennan, M. and E. Swartz (1988), “The case for convertibles”, Journal of Applied Corporated Finance Volume 1, Issue 2, pages 55–64, Summer 1988
13. Ceballos, F., T. Didier, and S. Schmukler, “How Much Do Developing Economies Rely on Private Capital Markets?”, Mimeo.
BANCO DE ESPAÑA 41 DOCUMENTO DE TRABAJO N.º 1603
14. Chaplinsky, S. and L. Ramchand (2004), “The Impact of SEC Rule 144A on Corporate Debt Issuance by International Firms”, the Journal of Business, vol 77. Noº4
15. Chemmanur, T. and P. Fulghieri (1994), “Reputation, renegotiation, and the choice between bank loans and publicly traded debt”, Review of Financial Studies 7, 475-506
16. Chui, M., I. Fender, and V. Suskho (2014), “Risk related to EME corporate balance sheets: the role of leverage and currency mismatch”, BIS Quarterly Review, September 2014
17. Davidson, R. and J-Y. Duclos (2000), “Statistical Inference for Stochastic Dominance and for the Measurement of Poverty and Inequality”, Econometrica, Vol 88 No.6 (November 2000)
18. Denis, D. and V. Mihov (2003), “The choice among bank-debt, non-bank private debt, and public debt: evidence from new corporate borrowing”, Journal of Financial Economics 70 (2003) 3-28
19. Diamond, D. “Monitoring and Reputation: the Choice between Bank Loans and Directly Placed Debt”, Journal of Political Economy Vol. 99, No. 4 (Aug., 1991), pp. 689-721
20. Didier, T. R. Levine, and S. Schmuckler (2014), “Capital Market Financing, Firm Growth, Firm Size Distribution”, NBER Working Paper nº 20336
21. Dutordoir, M., C. Lewis, J. Seward, and C. Veld (2014), “What we do and do not know about convertible bond financing”, Journal of Corporate Finance 24 3-20
22. Esho, N., Y.Lam, and G. Sharpe (2001), “Choice of Financing Source in International Debt Markets”, Journal of Financial Intermediation 10 276-305
23. Fenn, G.W (2000), “Speed of issuance and the adequacy of disclosure in the 144A high-yield debt market”, Journal of Financial Economics 56
24. Feyen, E., S. Gosh, K. Kibuuka, S. Farazi, “Global Liquidity and External Bond Issuance in Emerging Economies and Developing Economies”, mimeo
25. Fuertes, A. and J.M. Serena (2014), “Firms financial soundness and access to capital markets”, Financial Stability Review Banco de España nº 27
26. Gao, Y. (2011), “The Sarbanes-Oxley Act and the Choice of Bond Market by Foreign Firms”, Journal of Accounting Research vol 49
27. Gomes, A. and G. Phillips (2012), “Why do public firms issue private and public securities?” Journal of Financial Intermediation 21

BANCO DE ESPAÑA 42 DOCUMENTO DE TRABAJO N.º 1603
28. Green, R. (1984), “Investment incentives, debt, and warrants”, Journal of Financial Economics 13 115-136
29. Green, R. and E. Talmor (1986), “Asset substitution and the agency costs of debt financing”, Journal of Banking and Finance 10, 391-399
30. Gruic, B., C. Upper, A. Villar, “What does the sectoral classification of offshore affiliates tell us about risks?”, Box 1, BIS Quarterly Review, December 2014
31. Gruic, B. and P. Wooldridge (2013), “Who is issuing international bonds denominated in emerging market currencies?”, Box 2, BIS Quarterly Review December 2013
32. Krishnaswami, S. and D. Yaman (2008), “The role of convertible bonds in alleviating contracting costs”, The Quarterly Review of Economics and Finance 48 792-816
33. Kwan, S., and W. Carleton (2010), “Financial contracting and the choice between private placements and publicly offered bonds”, Journal of Money, Credit and Finance Vol 42. No.5
34. Lewis, C., R. Rogalski, and J. Seward (1998), “Understanding the Design of Convertible Debt”, Journal of Applied Corporate Finance
35. Lo Duca, M., G. Nicoletti, and A. Vidal Martinez (2014), “Global bond corporate issuance: What role for US quantitative easing?” ECB Working Paper N1 1649 March 2014
36. McCauley, R., C. Upper, and A.Villar (2013), “Emerging market debt securities issuance in offshore centres”, Box 2, BIS Quarterly Review, September 2013
37. Miller, D. and J. J. Puthenpurackal (2002), “The Costs, Wealth Effects, and Determinants of International Capital Raising: Evidence from Public Yankee Bonds”, Journal of Financial Intermediation 11
38. Myers, S. and N. Majluf (1984), “Corporate financing and investment decisions
when firms have information that investors do not have”, Journal of Financial Economics 13 187-221
39. Myers, S. (1977), “Determinants of corporate borrowing, Journal of Financial
Economics 5 147-175
40. Pagan, A., Ullah, A. (1999), “Nonparametric econometrics” Cambridge University Press
41. Rajan, R.(1992), “Insiders and Outsiders: The Choice between Informed and Arm’s-
Length Debt” The Journal of Finance –Vol XLVII, No. 4 September 1992

BANCO DE ESPAÑA 43 DOCUMENTO DE TRABAJO N.º 1603
42. Resnick, B. (2012), “Investor yield and gross underwriting spread comparisons among US dollar domestic, Yankee, Eurobond, and global bonds”, Journal of International Money and Finance 31
43. Scott Long, J. and J. Freese (2014), “Regression Models for Categorical Dependent Variables Using Stata, Third Edition”, Stata Press.
44. Shin, H. (2013), “The Second Phase of Global Liquidity and its Impact on Emerging Economies” Keynote address at the Federal Reserve Bank of San Francisco Asia Economic Policy Conference
45. Rodrigues Bastos, F., H. Kamil, and B. Sutton (2014), “Corporate Financing Trends and Balance-Sheet Risks in Latin America: Taking Stock of “The Bon(d)anza”, IMF Working Paper Nº 15/10.
46. Shin, H. (2014), “The changing face of financial intermediation”, Lecture at the BIS 84th Annual General Meeting
47. Turner, P. (2014), “The global long-term interest rate, financial risks and policy choices in EMEs”, BIS Working Paper nº 441
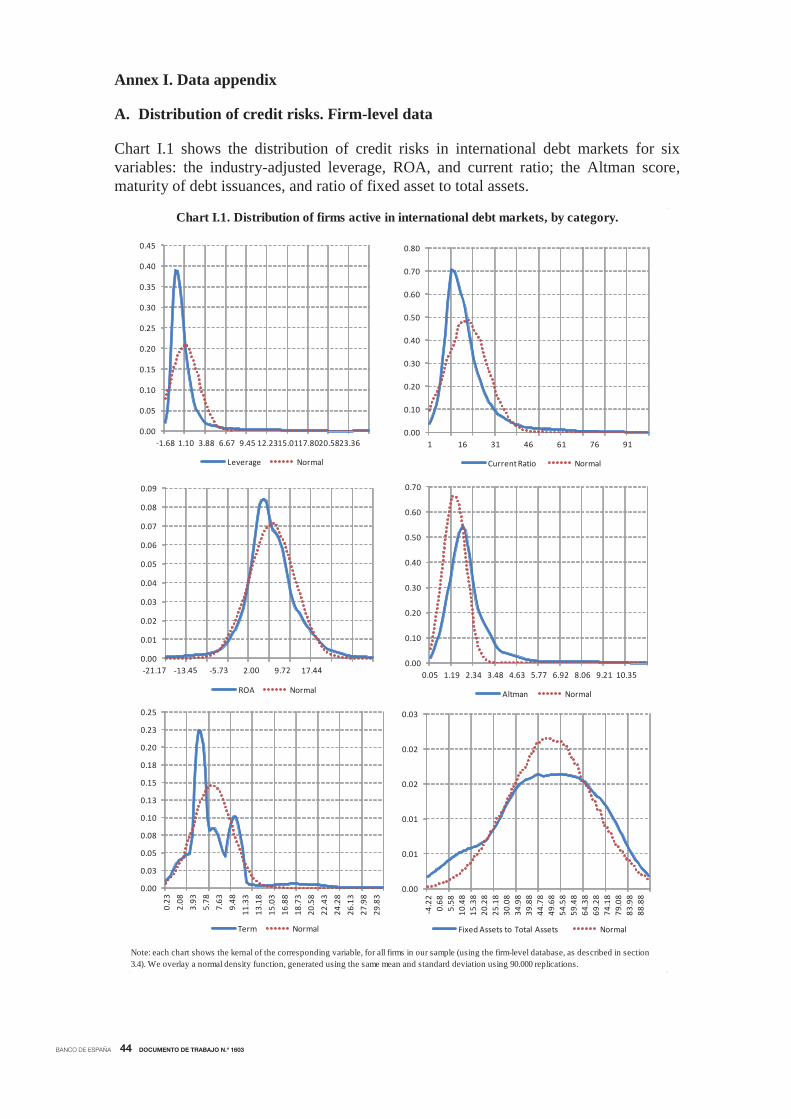
BANCO DE ESPAÑA 44 DOCUMENTO DE TRABAJO N.º 1603
Annex I. Data appendix
A. Distribution of credit risks. Firm-level data
Chart I.1 shows the distribution of credit risks in international debt markets for six variables: the industry-adjusted leverage, ROA, and current ratio; the Altman score, maturity of debt issuances, and ratio of fixed asset to total assets.
Note: each chart shows the kernal of the corresponding variable, for all firms in our sample (using the firm-level database, as described in section 3.4). We overlay a normal density function, generated using the same mean and standard deviation using 90.000 replications.
Chart I.1. Distribution of firms active in international debt markets, by category.
0.00
0.05
0.10
0.15
0.20
0.25
0.30
0.35
0.40
0.45
-1.68 1.10 3.88 6.67 9.45 12.2315.0117.8020.5823.36
Leverage Normal
0.00
0.10
0.20
0.30
0.40
0.50
0.60
0.70
0.80
1 16 31 46 61 76 91
Current Ratio Normal
0.00
0.01
0.02
0.03
0.04
0.05
0.06
0.07
0.08
0.09
ROA Normal
0.00
0.10
0.20
0.30
0.40
0.50
0.60
0.70
0.05 1.19 2.34 3.48 4.63 5.77 6.92 8.06 9.21 10.35
Altman Normal
0.00
0.03
0.05
0.08
0.10
0.13
0.15
0.18
0.20
0.23
0.25
0.23
2.08
3.93
5.78
7.63
9.48
11.3
313
.18
15.0
316
.88
18.7
320
.58
22.4
324
.28
26.1
327
.98
29.8
3
Term Normal
0.00
0.01
0.01
0.02
0.02
0.03
-4.2
20.
685.
5810
.48
15.3
820
.28
25.1
830
.08
34.9
839
.88
44.7
849
.68
54.5
859
.48
64.3
869
.28
74.1
879
.08
83.9
888
.88
Fixed Assets to Total Assets Normal

BANCO DE ESPAÑA 45 DOCUMENTO DE TRABAJO N.º 1603
All variables are winsorized at percentiles 1 and 99. We overlay a normal-density function. Density functions are non-normal and exhibit dispersion. In the case of leverage and current ratio, they are highly asymmetric, since the variable is censored at zero; density functions are slightly skewed to the left for the ROA and the Altman score. In the case of the ratio of fixed assets to total assets, the function is highly mesokurtic, underscoring fat tails.
B. Description of variables
Table I.1 describes the firm-level variables. The information is obtained using Bloomberg; the ultimate source are the financial statements filed by firms.
Table I.2. summarizes the deal-level variables. A key variable is the Ticker Parent: it is the fundamental company ticker associated to each security, and identifies the company guaranteeing it. It need not be the issuer company, nor the ultimate parent company of the issuer. All firm-level variables listed in table I.1 are obtained for this company.
Variable DescriptionTotal Assets Logarithm of total assets
Altman Score
We compute the Altman score for private companies: 0.717*x1+0.847*x2+3.107*x3+0.42*x4+0.998*x5; where x1 is working capital to total assets, x2 is retained earnings to total assets, x3 is EBITDA to total assets, x4 is book value of equity to total debt, x5 is sales revenue to total assets.
Dummy Altman <1.21Binary variable takes value 1 if the firm has an Altman score lower than 1.21
Fixed Assets to Total Assets Winsorized at percentiles 1% and 99%
LeverageLeverage is Total Assets to Common Equity. We winsorize it at percentiles 1% and 99%. Deviation with respect to the worlwide industry-median; industry defined using Bloomberg Industries.
Return on Assets ROA is EBITDA to Assets. We winsorize it at percentiles 1% and 99%. Deviation with respect to the worlwide industry-median; industry defined using Bloomberg Industries.
Current RatioCurrent ratio is the ratio of liquid assets to toWinsorized at percentiles 1% and 99%. Deviation with respect to the worlwide industry-median; industry defined using Bloomberg Industries.
Interest Coverage RatioWinsorized at percentiles 1% and 99%. Deviation with respect to the worlwide industry-median; industry defined using Bloomberg Industries.
Accounting StandardCategorical variable with firm accounting standard. We construct a binary variable takes value 1 if the firm reports using a local GAAP (all GAAPs excluding US GAAP and IFRS are considered local).
US ADR Categorical variable which describes the US exchanges in which a firm is cross listed. We construct a binary variable taking value 1 if the firm is cross-listed in a US exchange (excluding OTC exchanges).
Listing Status Binary variables takes value 1 if the firm is listed in a local exchange. Source: own elaboration.
Table I.1. Description of firm-level variables
Note: variables are accedded using Bloomberg; ultimate source are financial statements filed by firms.
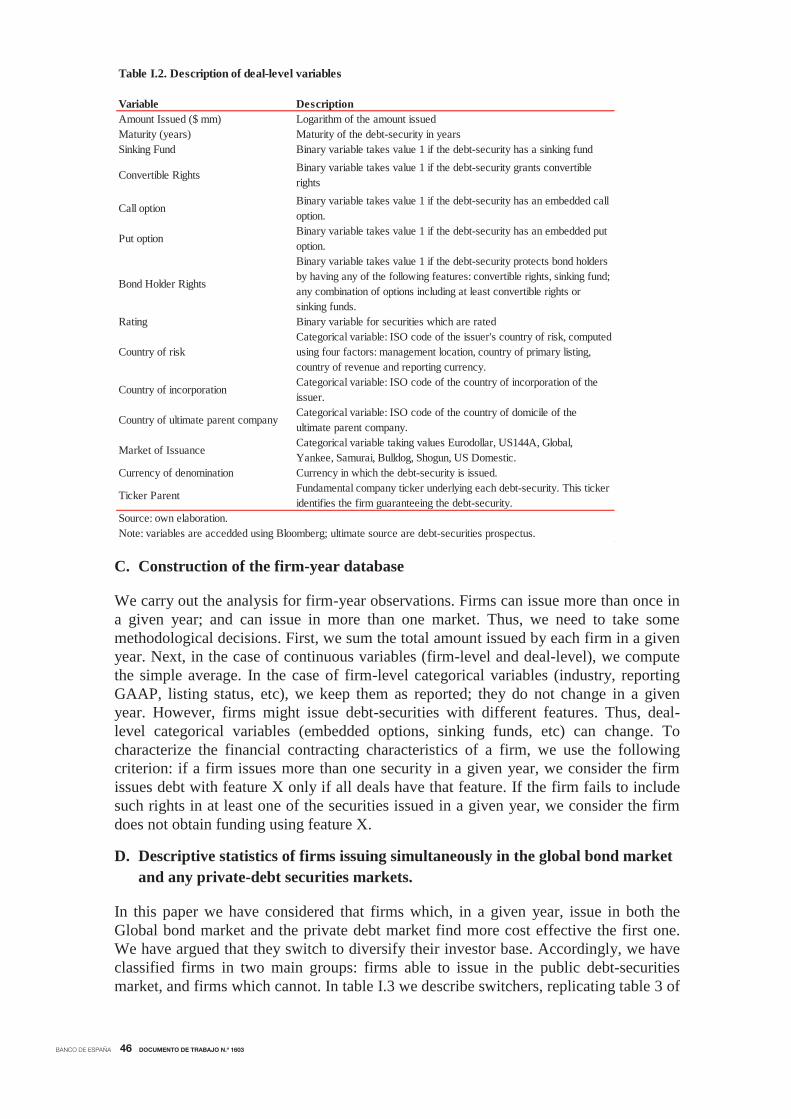
BANCO DE ESPAÑA 46 DOCUMENTO DE TRABAJO N.º 1603
C. Construction of the firm-year database
We carry out the analysis for firm-year observations. Firms can issue more than once in a given year; and can issue in more than one market. Thus, we need to take some methodological decisions. First, we sum the total amount issued by each firm in a given year. Next, in the case of continuous variables (firm-level and deal-level), we compute the simple average. In the case of firm-level categorical variables (industry, reporting GAAP, listing status, etc), we keep them as reported; they do not change in a given year. However, firms might issue debt-securities with different features. Thus, deal-level categorical variables (embedded options, sinking funds, etc) can change. To characterize the financial contracting characteristics of a firm, we use the following criterion: if a firm issues more than one security in a given year, we consider the firm issues debt with feature X only if all deals have that feature. If the firm fails to include such rights in at least one of the securities issued in a given year, we consider the firm does not obtain funding using feature X.
D. Descriptive statistics of firms issuing simultaneously in the global bond market and any private-debt securities markets.
In this paper we have considered that firms which, in a given year, issue in both the Global bond market and the private debt market find more cost effective the first one. We have argued that they switch to diversify their investor base. Accordingly, we have classified firms in two main groups: firms able to issue in the public debt-securities market, and firms which cannot. In table I.3 we describe switchers, replicating table 3 of
Variable DescriptionAmount Issued ($ mm) Logarithm of the amount issuedMaturity (years) Maturity of the debt-security in yearsSinking Fund Binary variable takes value 1 if the debt-security has a sinking fund
Convertible RightsBinary variable takes value 1 if the debt-security grants convertible rights
Call optionBinary variable takes value 1 if the debt-security has an embedded call option.
Put optionBinary variable takes value 1 if the debt-security has an embedded put option.
Bond Holder Rights
Binary variable takes value 1 if the debt-security protects bond holders by having any of the following features: convertible rights, sinking fund; any combination of options including at least convertible rights or sinking funds.
Rating Binary variable for securities which are rated
Country of riskCategorical variable: ISO code of the issuer's country of risk, computed using four factors: management location, country of primary listing, country of revenue and reporting currency.
Country of incorporationCategorical variable: ISO code of the country of incorporation of the issuer.
Country of ultimate parent companyCategorical variable: ISO code of the country of domicile of the ultimate parent company.
Market of IssuanceCategorical variable taking values Eurodollar, US144A, Global, Yankee, Samurai, Bulldog, Shogun, US Domestic.
Currency of denomination Currency in which the debt-security is issued.
Ticker ParentFundamental company ticker underlying each debt-security. This ticker identifies the firm guaranteeing the debt-security.
Source: own elaboration.
Table I.2. Description of deal-level variables
Note: variables are accedded using Bloomberg; ultimate source are debt-securities prospectus.
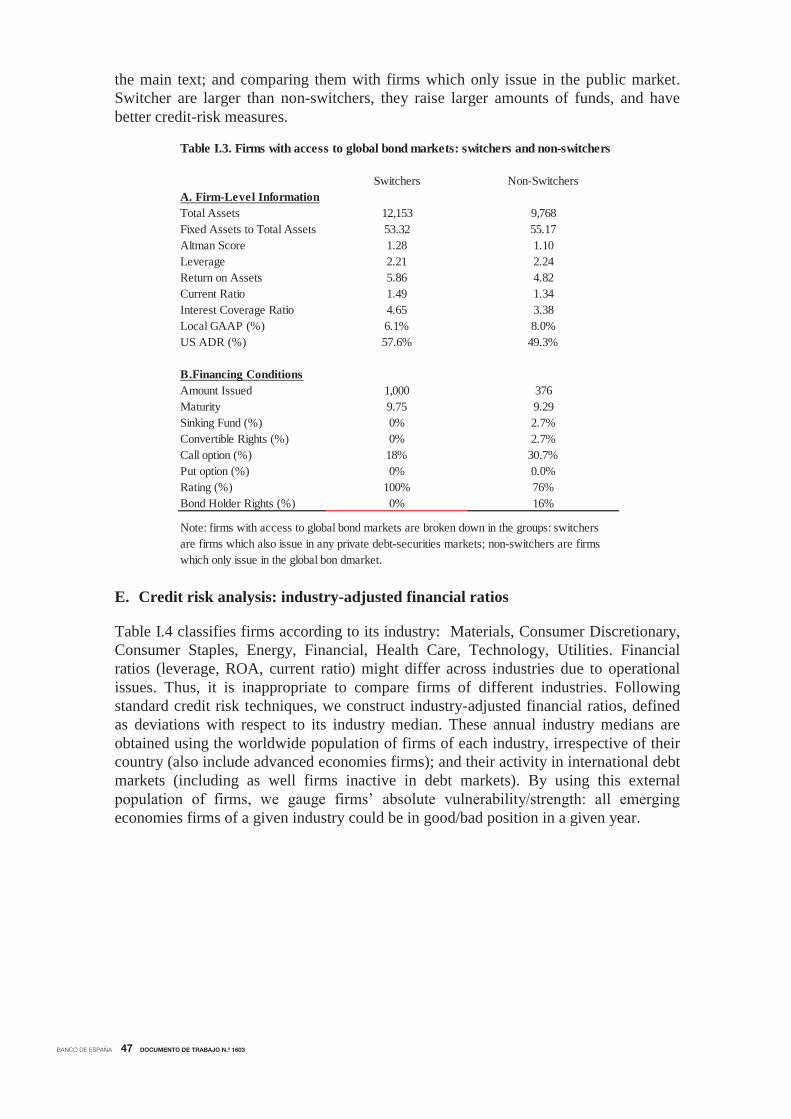
BANCO DE ESPAÑA 47 DOCUMENTO DE TRABAJO N.º 1603
the main text; and comparing them with firms which only issue in the public market. Switcher are larger than non-switchers, they raise larger amounts of funds, and have better credit-risk measures.
E. Credit risk analysis: industry-adjusted financial ratios
Table I.4 classifies firms according to its industry: Materials, Consumer Discretionary, Consumer Staples, Energy, Financial, Health Care, Technology, Utilities. Financial ratios (leverage, ROA, current ratio) might differ across industries due to operational issues. Thus, it is inappropriate to compare firms of different industries. Following standard credit risk techniques, we construct industry-adjusted financial ratios, defined as deviations with respect to its industry median. These annual industry medians are obtained using the worldwide population of firms of each industry, irrespective of their country (also include advanced economies firms); and their activity in international debt markets (including as well firms inactive in debt markets). By using this external population of firms, we gauge firms’ absolute vulnerability/strength: all emerging economies firms of a given industry could be in good/bad position in a given year.
Table I.3. Firms with access to global bond markets: switchers and non-switchers
Switchers Non-SwitchersA. Firm-Level InformationTotal Assets 12,153 9,768Fixed Assets to Total Assets 53.32 55.17Altman Score 1.28 1.10Leverage 2.21 2.24Return on Assets 5.86 4.82Current Ratio 1.49 1.34Interest Coverage Ratio 4.65 3.38Local GAAP (%) 6.1% 8.0%US ADR (%) 57.6% 49.3%
B.Financing ConditionsAmount Issued 1,000 376Maturity 9.75 9.29Sinking Fund (%) 0% 2.7%Convertible Rights (%) 0% 2.7%Call option (%) 18% 30.7%Put option (%) 0% 0.0%Rating (%) 100% 76%Bond Holder Rights (%) 0% 16%
Note: firms with access to global bond markets are broken down in the groups: switchers are firms which also issue in any private debt-securities markets; non-switchers are firms which only issue in the global bon dmarket.

BANCO DE ESPAÑA 48 DOCUMENTO DE TRABAJO N.º 1603
Panel A.Number of FirmsPublic Debt-
Securities MarketsPrivate Debt-
Securities MarketsUS 144A Market Eurodollar Market
27 310 46 249Communications 38 325 36 276ConsumerDiscretionary 5 388 32 345ConsumerStaples 12 275 36 231Energy 25 231 57 163Financial 0 15 4 10HealthCare 0 68 3 65Industrial 21 557 45 498Technology 2 154 8 145Utilities 12 213 42 151
Panel B.Amount IssuedPublic Debt-
Securities MarketsPrivate Debt-
Securities MarketsUS 144 Market Eurodollar Market
Materials 26,865 126,440 22,270 92,243Communications 67,361 76,302 15,110 48,082ConsumerDiscretionary 1,729 61,358 11,205 43,634ConsumerStaples 8,550 69,354 12,994 48,169Energy 161,255 232,958 42,472 171,180Financial 0 4,619 775 3,144HealthCare 0 5,028 183 4,845Industrial 15,242 103,808 15,486 77,868Technology 460 8,242 1,863 5,295Utilities 9,237 102,154 21,125 63,621Note: firms classified using Bloomberg Industries sectoral grouping.
Table I.4. Number of firms and amount issued by industries
F. Data gaps in firms’ financial statements information
Our database contains information on unlisted firms (private companies). This sets it apart from some traditional data sources for the analysis of firms’ balance-sheets, such Thomson Reuters WorldScope and S&P Capital IQ’s Compustat Global. These databases cover between 90%-95% of global market capitalization and they also provide historical data on inactive publicly held companies (those which have merged, liquidated or become privately held)22. They offer almost no information on unlisted firms.
Unlike these traditional data sources, we have firm-information for some non-listed firms. Table I.5 shows the coverage. It is better for firms issuing debt-securities in public debt-markets, but remains good enough in US144A and Eurobond markets. Besides, we have financial contract characteristics for all firms. In all estimations, we have controlled for the potential biases of lacking firm-information, and our findings are robust.
22 They have been used in a number of recent studies on firms’ soundness (for instance, IMF (2014A, 2014B, 2014C), Morgan Stanley
(2013)).
Public Debt-Securities Markets
Institutional/Wholesale Markets
US 144A Market
Eurodollar Market
Firm-information 77.46% 58.61% 62.06% 57.84%Firms listed in local exchanges 57.75% 50.78% 52.41% 50.49%Source: own elaboration
Table I.5. Data Gaps in Firm-information. Percentage of firms with data.
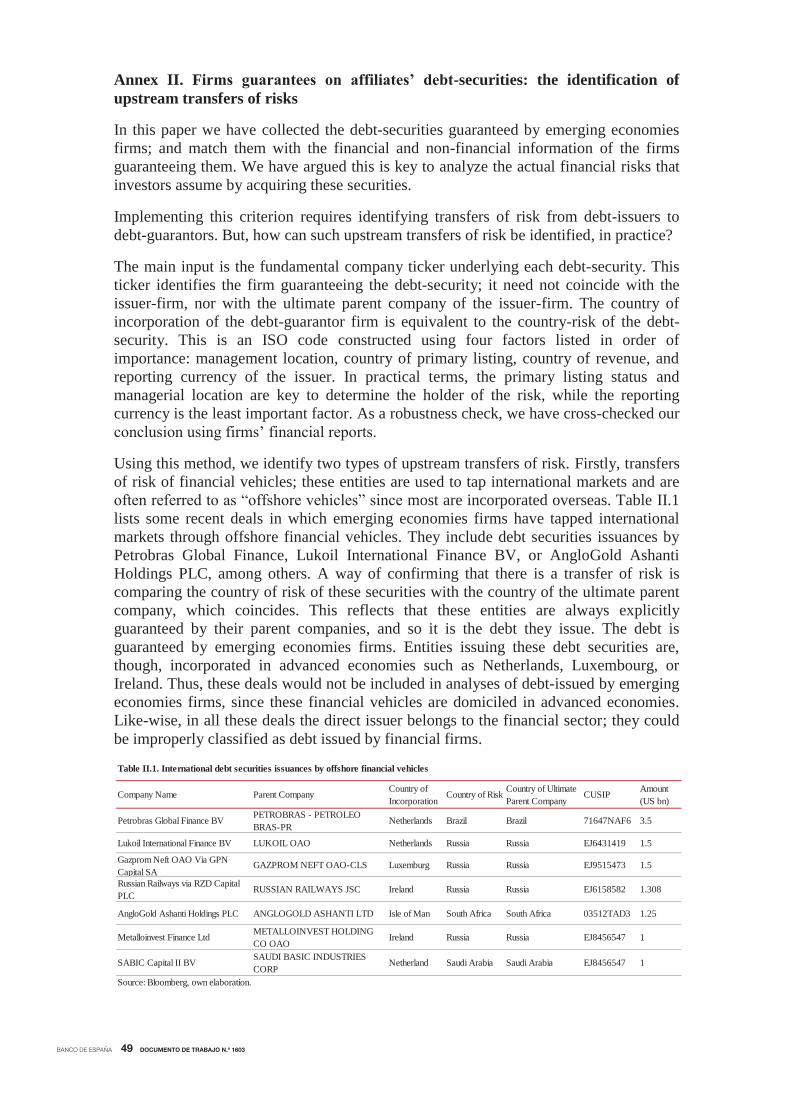
BANCO DE ESPAÑA 49 DOCUMENTO DE TRABAJO N.º 1603
Annex II. Firms guarantees on affiliates’ debt-securities: the identification of upstream transfers of risks
In this paper we have collected the debt-securities guaranteed by emerging economies firms; and match them with the financial and non-financial information of the firms guaranteeing them. We have argued this is key to analyze the actual financial risks that investors assume by acquiring these securities.
Implementing this criterion requires identifying transfers of risk from debt-issuers to debt-guarantors. But, how can such upstream transfers of risk be identified, in practice?
The main input is the fundamental company ticker underlying each debt-security. This ticker identifies the firm guaranteeing the debt-security; it need not coincide with the issuer-firm, nor with the ultimate parent company of the issuer-firm. The country of incorporation of the debt-guarantor firm is equivalent to the country-risk of the debt-security. This is an ISO code constructed using four factors listed in order of importance: management location, country of primary listing, country of revenue, and reporting currency of the issuer. In practical terms, the primary listing status and managerial location are key to determine the holder of the risk, while the reporting currency is the least important factor. As a robustness check, we have cross-checked our conclusion using firms’ financial reports.
Using this method, we identify two types of upstream transfers of risk. Firstly, transfers of risk of financial vehicles; these entities are used to tap international markets and are often referred to as “offshore vehicles” since most are incorporated overseas. Table II.1 lists some recent deals in which emerging economies firms have tapped international markets through offshore financial vehicles. They include debt securities issuances by Petrobras Global Finance, Lukoil International Finance BV, or AngloGold Ashanti Holdings PLC, among others. A way of confirming that there is a transfer of risk is comparing the country of risk of these securities with the country of the ultimate parent company, which coincides. This reflects that these entities are always explicitly guaranteed by their parent companies, and so it is the debt they issue. The debt is guaranteed by emerging economies firms. Entities issuing these debt securities are, though, incorporated in advanced economies such as Netherlands, Luxembourg, or Ireland. Thus, these deals would not be included in analyses of debt-issued by emerging economies firms, since these financial vehicles are domiciled in advanced economies. Like-wise, in all these deals the direct issuer belongs to the financial sector; they could be improperly classified as debt issued by financial firms.
Company Name Parent Company Country of Incorporation
Country of Risk Country of Ultimate Parent Company
CUSIP Amount(US bn)
Petrobras Global Finance BV PETROBRAS - PETROLEO BRAS-PR
Netherlands Brazil Brazil 71647NAF6 3.5
Lukoil International Finance BV LUKOIL OAO Netherlands Russia Russia EJ6431419 1.5
Gazprom Neft OAO Via GPN Capital SA
GAZPROM NEFT OAO-CLS Luxemburg Russia Russia EJ9515473 1.5
Russian Railways via RZD Capital PLC
RUSSIAN RAILWAYS JSC Ireland Russia Russia EJ6158582 1.308
AngloGold Ashanti Holdings PLC ANGLOGOLD ASHANTI LTD Isle of Man South Africa South Africa 03512TAD3 1.25
Metalloinvest Finance Ltd METALLOINVEST HOLDING CO OAO
Ireland Russia Russia EJ8456547 1
SABIC Capital II BV SAUDI BASIC INDUSTRIES CORP
Netherland Saudi Arabia Saudi Arabia EJ8456547 1
Source: Bloomberg, own elaboration.
Table II.1. International debt securities issuances by offshore financial vehicles

BANCO DE ESPAÑA 50 DOCUMENTO DE TRABAJO N.º 1603
Secondly, non-financial affiliates can also transfer upstream risk to their parent companies. This happens when their debt is guaranteed by its parent companies. Albeit less frequent, this is not rare. Table 4 lists a number of debt securities issuances in which the risk of non-financial affiliate’s debt issuances is transferred to parent companies. There are relevant examples. For instance, JBS Investment GmbH is an Austrian affiliate of a Brazilian company, whose debt is guaranteed by its parent company, JBS S.A; therefore the risks are transferred upstream to Brazil. Rolta LLC is a US affiliate of an Indian firm, Rolta India, which guarantees its debt; similarly, the risk is transferred to its parent.
These transfers of risk can be sizable. In some companies, most of the international debt-securities they guarantee have been issued by affiliates incorporated overseas. We show two relevant examples in figure 2, Petroleos Brasileiros SA (Petrobras), and Vale SA. For each company, the chart shows a stylized organizational structure, the outstanding guaranteed debt, broken down by issuer entity; we show as well the country of incorporation of each entity.
The bulk of the debt securities guaranteed by Petrobras have been issued by its offshore financial affiliates: PiFcO and Petrobras Global Finance. The outstanding volume of the Global Notes issued by PiFcO amounts for 26.9 bn US$; outstanding debt securities issued by Petrobras Global Finance BV reaches 15 bn US$. Petrobras guarantees all debt issued by these financial vehicles. This transfer of risk is also explicit in the prospectus which Petrobras’ affiliates file with the SEC when they issue debt-securities. PGF issues debt securities using shelf registration; in the Rule 424(b) Prospectus Supplement filed in January 2015, PGF Netherlands is described as a company whose business is “to issue debt securities in the international capital markets to finance Petrobras’ operations.”23; the securities issued by PGF are described as “fully and unconditionally guaranteed by Petrobras”. This is an example in which the entities issuing the debt –Petrobras’ affiliates PiFcO and PGF-, and the entity holding the risk –the parent company, Petrobras-, do not coincide.
Vale SA, the large mining Brazilian company, constitutes a second example. Panel B shows that the bulk of its debt securities has been issued by Vale Overseas Ltd, an offshore vehicle domiciled in the Cayman Islands. Vale SA has a large non-financial affiliate in Canada, Vale Canada Ltd (Canada’s second largest mining company); despite not being very active in international debt markets, it has two outstanding debt securities, which amount for 0.400 USD bn. Finally, Vale SA owns Samarco, the
Company Name Parent Company Country of Incorporation
Country of Risk Country of Ultimate Parent Company
CUSIP Amount (US bn)
JBS Investment GmbH JBS SA Austria Brazil Brazil 46611DAA3 1
OAS Investments GmbH CMP Participacoes Austria Brazil Brazil 67089RAA1 0.875
PT Portugal SGPS SA Telemar Patcipacoes (OI SA) Portugal Brazil Brazil EJ2496895 0.491
Sappi Papier Holdings GmbH Sappi Ltd. Austria South Africa South Africa 803071AC3 0.4
Rolta LLC Rolta India Ltd. United States India India 775793AA0 0.2
Source: Bloomberg, own elaboration.
Table II.2. International debt securities issuances of affiliates and guaranteed by parent companies
23 Moreover, “PGF does not currently have any operations, revenues or assets other than those related to the issuance, administration and repayment of its debt securities.” It is also interesting that among the risk factors described in the SEC filing, there are very country-specific issues concerning the Brazilian economy. For instance, historical restrictions to capital outflows in Brazil and some specificities of Brazilian law (“Restrictions on the movement of capital out of Brazil may impair your ability to receive payments and the guaranties and restrict Petrobras’ ability to make payments to PGF in US dollar”; also “Petrobras would be required to pay judgements of Brazilian courts enforcing its obligations under the guaranties only in reais”). Needless to say, there are no references to Dutch-specific risk factors.

BANCO DE ESPAÑA 51 DOCUMENTO DE TRABAJO N.º 1603
Brazilian subsidiary, whose outstanding debt amounts for 3.3 USD bn. Vale SA guarantees these debt securities (it guarantees as well outstanding loans of Vale Canada, although we are focusing on debt securities); henceforth, it backs the risk of its affiliates’ activity in international debt markets. Both examples underscore the importance of the financial soundness of the firms guaranteeing debt, and the biases which can be incurred delving into the credit risk of the issuer-firm.
Annex III. List of emerging economies’ foreign affiliates with explicit guarantees
Table III.1 lists some financial vehicles used by emerging economies corporations to issue debt-securities in international debt markets. They are selected randomly for companies headquartered in Brazil, Russia, Mexico, or South Africa. Most financial vehicles are offshore affiliates –i.e., are incorporated overseas-. Cayman Islands, Luxembourg, and Ireland, stand as countries of incorporation.
Issuer of the debt Guarantor of the debt
Issuer of the debt Guarantor of the debt
Note: the chart shows only outstanding debt (not loans).
Vale Canada Ltd Canada 0.4 bn US$
Source: Bloomberg, Standard&Poors, Fitch Ratings, Vale annual report 2013, Petrobras annual report 2013, own elaboration.
Other Subsidiaries Brazil and offshore 36.5 bn US$
B. Vale SA Brasil
Vale Overseas Ltd. Cayman Islands 11.5 bn US$
Vale SA Brazil Samarco Mineracao SA Brazil 3.342 bn US$
Figure 2. Upstream transfer of risks. Organizational structure, debt-issuers, and debt-guarantors
A. Petroleo Brasileiro (PETROBRAS SA)
Petrobras International Finance Company (PIFCO) Cayman Islands 26.9 bn US$
Petrobras SA Brazil Petrobras Global Finance BV (PGF) Netherlands
15 bn US$
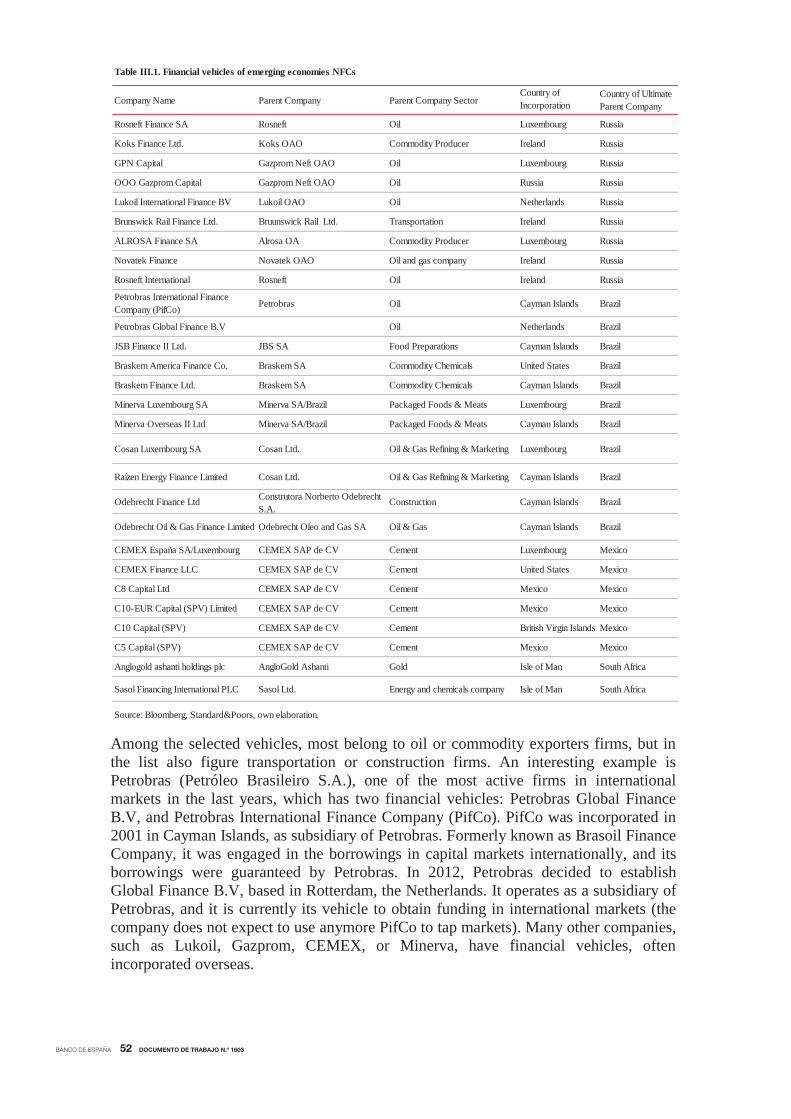
BANCO DE ESPAÑA 52 DOCUMENTO DE TRABAJO N.º 1603
Among the selected vehicles, most belong to oil or commodity exporters firms, but in the list also figure transportation or construction firms. An interesting example is Petrobras (Petróleo Brasileiro S.A.), one of the most active firms in international markets in the last years, which has two financial vehicles: Petrobras Global Finance B.V, and Petrobras International Finance Company (PifCo). PifCo was incorporated in 2001 in Cayman Islands, as subsidiary of Petrobras. Formerly known as Brasoil Finance Company, it was engaged in the borrowings in capital markets internationally, and its borrowings were guaranteed by Petrobras. In 2012, Petrobras decided to establish Global Finance B.V, based in Rotterdam, the Netherlands. It operates as a subsidiary of Petrobras, and it is currently its vehicle to obtain funding in international markets (the company does not expect to use anymore PifCo to tap markets). Many other companies, such as Lukoil, Gazprom, CEMEX, or Minerva, have financial vehicles, often incorporated overseas.
Company Name Parent Company Parent Company SectorCountry of Incorporation
Country of Ultimate Parent Company
Rosneft Finance SA Rosneft Oil Luxembourg Russia
Koks Finance Ltd. Koks OAO Commodity Producer Ireland Russia
GPN Capital Gazprom Neft OAO Oil Luxembourg Russia
OOO Gazprom Capital Gazprom Neft OAO Oil Russia Russia
Lukoil International Finance BV Lukoil OAO Oil Netherlands Russia
Brunswick Rail Finance Ltd. Bruunswick Rail Ltd. Transportation Ireland Russia
ALROSA Finance SA Alrosa OA Commodity Producer Luxembourg Russia
Novatek Finance Novatek OAO Oil and gas company Ireland Russia
Rosneft International Rosneft Oil Ireland Russia
Petrobras International Finance Company (PifCo) Petrobras Oil Cayman Islands Brazil
Petrobras Global Finance B.V Oil Netherlands Brazil
JSB Finance II Ltd. JBS SA Food Preparations Cayman Islands Brazil
Braskem America Finance Co. Braskem SA Commodity Chemicals United States Brazil
Braskem Finance Ltd. Braskem SA Commodity Chemicals Cayman Islands Brazil
Minerva Luxembourg SA Minerva SA/Brazil Packaged Foods & Meats Luxembourg Brazil
Minerva Overseas II Ltd Minerva SA/Brazil Packaged Foods & Meats Cayman Islands Brazil
Cosan Luxembourg SA Cosan Ltd. Oil & Gas Refining & Marketing Luxembourg Brazil
Raízen Energy Finance Limited Cosan Ltd. Oil & Gas Refining & Marketing Cayman Islands Brazil
Odebrecht Finance Ltd Construtora Norberto Odebrecht S.A.
Construction Cayman Islands Brazil
Odebrecht Oil & Gas Finance Limited Odebrecht Oleo and Gas SA Oil & Gas Cayman Islands Brazil
CEMEX España SA/Luxembourg CEMEX SAP de CV Cement Luxembourg Mexico
CEMEX Finance LLC CEMEX SAP de CV Cement United States Mexico
C8 Capital Ltd CEMEX SAP de CV Cement Mexico Mexico
C10-EUR Capital (SPV) Limited CEMEX SAP de CV Cement Mexico Mexico
C10 Capital (SPV) CEMEX SAP de CV Cement British Virgin Islands Mexico
C5 Capital (SPV) CEMEX SAP de CV Cement Mexico Mexico
Anglogold ashanti holdings plc AngloGold Ashanti Gold Isle of Man South Africa
Sasol Financing International PLC Sasol Ltd. Energy and chemicals company Isle of Man South Africa
Source: Bloomberg, Standard&Poors, own elaboration.
Table III.1. Financial vehicles of emerging economies NFCs

BANCO DE ESPAÑA 53 DOCUMENTO DE TRABAJO N.º 1603
Table III.2 list a few affiliates of firms headquartered in India, Brazil, Mexico, South Africa and Russia. These affiliates are incorporated in countries as disparate as United States, United Kingdom, and Canada.
Indian firms figure prominently in this list, reflecting the noticeable process of cross-border takeovers since the late 2000s. This process was driven, to an important extent, by large-scale mergers and acquisitions. Hindalco Industries is an interesting example. Hindalco Industries is an aluminum manufacturing company owned by Aditya Birla Group, and founded in 1958. In 2007, it acquired Novelis Inc., an American industrial aluminum company, for 6 USD bn. Novelis is now a US-subsidiary of an Indian multinational, and part of its chain of production and sales of aluminum and copper in India and internationally. A second colourful story is that of Tata Motors Ltd., another large Indian company. Founded in 1946, it is part of the Tata Group, and manufactures and sells commercial and passenger vehicles in India. It used to have several subsidiares. In 2008, Tata Motors Ltd paid 2.5 USD bn for Jaguar Land Rover. This acquisition was a milestone in the history of the company, and Jaguar-Land Rover is currently the company's largest subsidiary24. We could add a great many of examples of emerging economies firms’ affiliates all over the world25. These affiliates might also be tapping international debt markets, in a context of easy access to international debt markets.
Company Name Parent Company Country of Incorporation Company
Country of Ultimate Parent Company
Acquisition date
Sappi Papier Holding GmbH Sappi Ltd. Austria South Africa n.a.
Steinhoff Finance Holding GmbH Steinhoff International Holdings Ltd. Austria South Africa n.a.
Zain Africa BV Bharti Airtel Ltd Netherlands India n.a.
Novelis Inc Hindalco Industries Ltd. United States India n.a.
Imperial Energy Corp. PLC ONGC Videsh Ltd. Russia India n.a.
Jaguar; Land-Rover Tata Motors Ltd. United Kingdom India n.a.
General Chemical Industrial Products Inc. Tata Chemicals United States India n.a.
Tata Steek UK Holdings Ltd. Tata Steel United Kingdom India n.a.
Pilgrim's Pride Corporation JBS SA United States Brazil n.a.
Vale Canada SA Vale SA Canada Brazil n.a.
Gerdau Ameristeel US Inc. Gerdau United States Brazil n.a.
CEMEX España SA CEMEX SAP de CV Spain Mexico n.a.
Canada Bread Company, Limited Grupo Bimbo S.A.B. de C.V. Canada Mexico 2014
Severstal Columbus, LLC PAO Severstal United States Russia n.a.
JMC Steel Novolipetsk Steel United States Russia 2014
Table III.2. Foreign affiliates of emerging economies firms
Source: Bloomberg, Standard&Poors, own elaboration.
24 Headquartered in United Kingdom, it sells luxury utility vehicles and sedans across the world, contributing to over 90% of Tata Motors'
consolidated EBITDA. 25 For instance, Tata Chemicals, another company of the Tata Group, acquired General Chemical Industrial Products Inc. in 2008, paying 1
USD bn for the company. Now, this company manufactures and sells soda ash in the United States, a raw material in the production of various glass products, and exports its products to markets primarily in Asia, Europe, and Latin America. This company, founded in 1968, is known since 2011 as Tata Chemicals North America Inc. was formerly known as General Chemical Industrial Products Inc. and changed its name to Tata Chemicals North America Inc. in April 2011.

BANCO DE ESPAÑA 54 DOCUMENTO DE TRABAJO N.º 1603
Annex IV. Debt issued by firms headquartered in emerging economies and all its affiliates (nationality measure). Potential biases.
The exercise of collecting debt-guaranteed by emerging economies firms is demanding. As a short-cut, it is tempting to collect the debt-securities issued by firms headquartered in emerging economies and all their affiliates; and to match the debt-security data with the ultimate parent company information. On an aggregate basis, the debt compiled using this criterion is referred to as the “nationality measure”.
This criterion removes the need to identify transfers of risk. However, it can bias significantly the results: not all affiliates transfer upstream their risk to their parent companies; some non-financial corporations’ affiliates are standalone entities, which issue debt without guarantees from their parent companies. There are two cases.
First, there are affiliates incorporated in emerging economies which are standalone entities; their debt issuances are not guaranteed by their parent companies. There are a few in our database. For instance, Kansas City Southern de México; it is an affiliate of Kansas City Southern Lines, a US-headquartered company26. The parent company does not guarantee the debt issued by Kansas City Southern de México; thus, it is an independent firm. This has several implications. On the one hand, this affiliate shall be treated as an emerging economy firm, even if it is owned by a US company, as happens in this example.27 The financial risks of their activities lay in emerging economies. However, this debt would be missed if it is complied for firms headquartered in emerging economies and all its affiliates. On the other, the debt-security data should not be matched with the ultimate parent company information: international investors analyze the risk of investing in the foreign-owned affiliate; thus, it is important to retrieve its financial and non-financial information, and not that of its ultimate parent company.
Second, an emerging economy company might not guarantee all the debt-securities issued by its foreign-owned affiliates. Table IV.1 lists some debt-securities issued by foreign-affiliates of emerging economies firms, which are not guaranteed. Examples include Jaguar Land Rover, Pilgrims’ Pride, Novelis, among others. Novelis is a US–nonfinancial affiliate of Hindalco, an Indian company. Pilgrim Pride is a US–nonfinancial affiliate of JBS, the Brazilian food producer. In both cases, the debt-securities issued by foreign-owned affiliates is not guaranteed by their parent companies; the telltale sign there is not a risk transfer is that the country of risk assigned to these securities is equivalent to the country of incorporation of the subsidiary (and different to the ultimate parent company country). The controlling interest of these affiliates -in India and Brazil, respectively- does not guarantee their foreign-owned affiliates’ debt-securities. Debt-securities issued by these entities should not be considered in our analysis.
26 The number of these foreign-owned, independent affiliates, operating in emerging economies is not large in the case of
non-financial corporations. Though, there are many other examples. For instance, in Mexico Concesionaria Mexiquense SA, an independent subsidiary of Obrascón Huarte Lain, S.A, a Spanish company; SatMex, the Mexican telecommunication company, was acquired by the French firm Eutelsat in 2014, but its country of risk remains Mexican. 27 These affiliates are integrated with their parent companies in some relevant dimensions, such as revenues or profits, but
not in terms of financial stability risks: they retain the risk.

BANCO DE ESPAÑA 55 DOCUMENTO DE TRABAJO N.º 1603
Firms’ financial reports support our decision. Jaguar Land Rover Automotive PLC (JLR) is an interesting example, since it is very active in international debt markets. Figure IV.1 shows its organizational structure; it is incorporated in United Kingdom as a subsidiary of Tata Motors, an Indian firm. JLR has several outstanding notes (debt securities), with different maturities, and a revolving credit facility. These liabilities have been subscribed by JLR, and guaranteed by its holding. The parent company, Tata Motors, does not guarantee them. There is no upstream transfer of risk. When deciding to price the risk of acquiring JLR debt-securities, international investors will look at JLR financial and non-financial information. We treat JLR as an UK company; thus, it
Company Name Parent Company Country of Incorporation
Country of Risk Country of Ultimate Parent Company
CUSIP Amount (US bn)
Jaguar Land Rover Automotive PLC
Tata Motors Ltd. United Kingdom
United Kingdom India EK0498676 0.65
Novelis Inc. Hindalco Industries United States United States India 67000XAL0 1.1
Rain CII Carbon LLC /CII Carbon Corp. Rain Industries Ltd. United States United States India EJ4718106 0.4
Moy Park Bondco PLC Marfrig Global FoodUnited Kingdom United Kingdom Brazil EK2879899 0.33
Springs Industries Inc. Cia de Tecidos do Norte de Minas
United States United States Brazil 851783AB6 0.47
WPE International Cooperatief UA Venti SA Brazil Brazil Luxembourg 92935NAA4 0.39
Pilgrim's Pride Corp. JBS SA United States United States Brazil 72147KAB4 0.49
Table IV.1. International debt securities issuances of affiliates not guaranteed by parent companies
Source: Bloomberg, own elaboration.
Guarantor of the debt
Issuer of the debt
Parent company
Source: Jaguar Land Rover Overview, November 2014; own elaboration.
Figure IV.1 Financially independent affiliates. Organizational structure of Jaguar Land Rover, affiliate of Tata Motors LTD.
Tata Motors LtdINDIA
TML Holdings PTE Ltd(SINGAPORE)
Jaguar Land Rover Automotive PLC
UNITED KINGDOM
Jaguar Land RoverHoldings Limited
UNITED KINGDOM
Jaguar Land RoverLimited
UNITED KINGDOM
$700m Notes due 2018£500m Notes due 2020$410m Notes due 2021£400m Notes due 2022$500m Notes due 2023$500m Notes due 2019
£1,325mn Revolving credit facility (RCF)
Jaguar Land Rover -NSC (CHINA)
National Sales Companies
JaguarLand Rover North America LLC and Jaguar Land Rover Exports Ltd
Jaguar Land Rover Russia
(NSC)
Chery Jaguar Land Rover Automotive
Co.Ltd
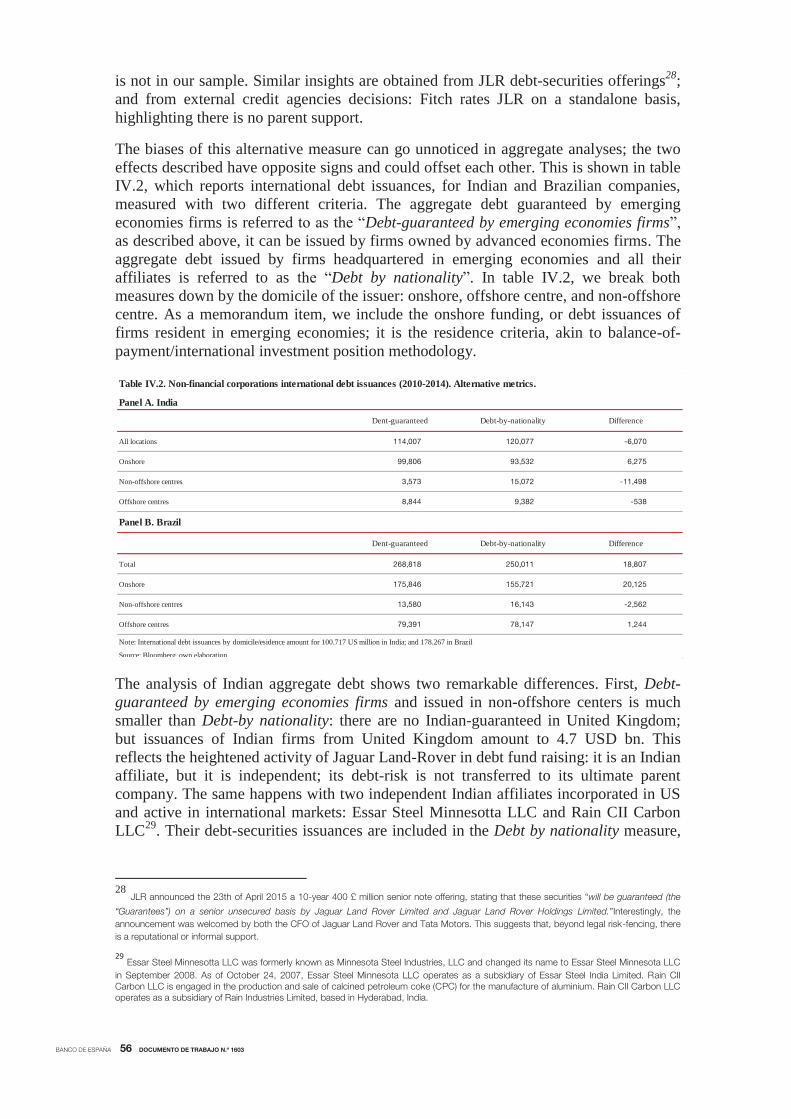
BANCO DE ESPAÑA 56 DOCUMENTO DE TRABAJO N.º 1603
is not in our sample. Similar insights are obtained from JLR debt-securities offerings28; and from external credit agencies decisions: Fitch rates JLR on a standalone basis, highlighting there is no parent support.
The biases of this alternative measure can go unnoticed in aggregate analyses; the two effects described have opposite signs and could offset each other. This is shown in table IV.2, which reports international debt issuances, for Indian and Brazilian companies, measured with two different criteria. The aggregate debt guaranteed by emerging economies firms is referred to as the “Debt-guaranteed by emerging economies firms”, as described above, it can be issued by firms owned by advanced economies firms. The aggregate debt issued by firms headquartered in emerging economies and all their affiliates is referred to as the “Debt by nationality”. In table IV.2, we break both measures down by the domicile of the issuer: onshore, offshore centre, and non-offshore centre. As a memorandum item, we include the onshore funding, or debt issuances of firms resident in emerging economies; it is the residence criteria, akin to balance-of-payment/international investment position methodology.
The analysis of Indian aggregate debt shows two remarkable differences. First, Debt-guaranteed by emerging economies firms and issued in non-offshore centers is much smaller than Debt-by nationality: there are no Indian-guaranteed in United Kingdom; but issuances of Indian firms from United Kingdom amount to 4.7 USD bn. This reflects the heightened activity of Jaguar Land-Rover in debt fund raising: it is an Indian affiliate, but it is independent; its debt-risk is not transferred to its ultimate parent company. The same happens with two independent Indian affiliates incorporated in US and active in international markets: Essar Steel Minnesotta LLC and Rain CII Carbon LLC29. Their debt-securities issuances are included in the Debt by nationality measure,
28 JLR announced the 23th of April 2015 a 10-year 400 £ million senior note offering, stating that these securities “will be guaranteed (the
“Guarantees”) on a senior unsecured basis by Jaguar Land Rover Limited and Jaguar Land Rover Holdings Limited.”Interestingly, the
announcement was welcomed by both the CFO of Jaguar Land Rover and Tata Motors. This suggests that, beyond legal risk-fencing, there
is a reputational or informal support. 29 Essar Steel Minnesotta LLC was formerly known as Minnesota Steel Industries, LLC and changed its name to Essar Steel Minnesota LLC
in September 2008. As of October 24, 2007, Essar Steel Minnesota LLC operates as a subsidiary of Essar Steel India Limited. Rain CII Carbon LLC is engaged in the production and sale of calcined petroleum coke (CPC) for the manufacture of aluminium. Rain CII Carbon LLC operates as a subsidiary of Rain Industries Limited, based in Hyderabad, India.
Panel A. India
Dent-guaranteed Debt-by-nationality Difference
All locations 114,007 120,077 -6,070
Onshore 99,806 93,532 6,275
Non-offshore centres 3,573 15,072 -11,498
Offshore centres 8,844 9,382 -538
Panel B. Brazil
Dent-guaranteed Debt-by-nationality Difference
Total 268,818 250,011 18,807
Onshore 175,846 155,721 20,125
Non-offshore centres 13,580 16,143 -2,562
Offshore centres 79,391 78,147 1,244
Source: Bloomberg, own elaboration.
Table IV.2. Non-financial corporations international debt issuances (2010-2014). Alternative metrics.
Note: International debt issuances by domicile/esidence amount for 100.717 US million in India; and 178.267 in Brazil

BANCO DE ESPAÑA 57 DOCUMENTO DE TRABAJO N.º 1603
but excluded in the Debt-guaranteed by emerging economies firms.30 The activity of these affiliates does not pose risks for financial stability in India. Second, this reduction in aggregate debt is partially offset by debt issued by foreign affiliates operating in India and not guaranteed by their parent companies. For the sake of financial stability analysis, they are Indian companies; hence, they are included in the Debt-guaranteed by emerging economies firms’ measure. They are not included in the Debt by nationality measure, since their parent company is not Indian.
All together, our measure renders a lower volume of external debt in India. But this result is country-specific. The opposite happens in Brazil: the Debt-guaranteed by emerging economies firms is higher than the Debt by nationality. The reason is that the two biases have different size. In Brazil the amount issued by foreign companies operating in Brazil and not guaranteed by their parent company is remarkable. This more than offsets the debt issued by independent Brazilian affiliates in the US. Finally, it is worth mentioning that in Brazil a non-negligible fraction of debt is issued by companies domiciled outside the home country, mostly reflecting financing raised in offshore centers.
The differences seem small in absolute terms, but are important. Existing differences reflect differences in the type of firms included. But their credit risks can differ markedly, henceforth biasing the conclusions. These differences might be non-random. More worrisome, they can remain hidden in country-aggregate measures of debt, since the two biases can offset each other.
To shed more light on this, in chart IV.2 we show the international debt issuances in the period 2010-2014 by firms in each of the four largest economies: Brazil, Russia, Mexico, and India. Debt has been aggregated using three measures: Debt-guaranteed by emerging economies firms; Debt by Nationality; and Debt by residence/domicile.
30
There are also a number of Brazilian affiliates in the US which are independent from their parent companies, in terms of risk, and active in
international markets. These are Pilgrim’s Pride Corp and Springs Industries IncSprings Global, Inc. It operates as a subsidiary of Springs Global Participações S.A. It .manufactures, markets, and distributes home textile and furnishing products. Pilgrim’s Pride Corp is a subsidiary of JBS USA Holdings, Inc
0
50
100
150
200
250
300
BRAZIL RUSSIA MEXICO INDIA
Debt-guaranteed by emerging economies firms
Debt-by nationality
Debt by residence/domicile
USD bln
Source: Bloomberg, own elaboration.
Chart IV.1. Emerging economies non-financial corporations. Different metrics of international debt issuances.

BANCO DE ESPAÑA 58 DOCUMENTO DE TRABAJO N.º 1603
The flaws of the last measure are well-known, and we focus on the comparison between the first two. Both measures are similar in all countries. But this should not be comforting: sizable biases are hidden, since domestic firms have standalone affiliates overseas, and there are standalone foreign affiliates operating in these countries. Hence, beneath similar aggregate measures there are different firms. And these firms can differ in dimensions relevant to understand their access to international debt markets: ability to absorb flotation costs, informational asymmetries, or risks of financial distress. As a result, empirical results could suffer fatal flaws.

BANCO DE ESPAÑA 59 DOCUMENTO DE TRABAJO N.º 1603
Annex V. Univariate analyses. Tests for stochastic dominance. Further results.
We aim to use a criterion capable to characterize the whole distribution of our variables of interest, setting an order of preference between the different groups of firms for each of these variables. This exercise cannot be done using just descriptive statistics such as the mean, the variance or different percentiles. It cannot be done either by characterizing the density function using non-parametric methods such as kernel-estimation because this approach does not provide an order of preference between distributions.
We go one step further by using the concept of stochastic dominance to set an order of preference among different groups of firms depending on their balance-sheet characteristics and financing conditions. This concept has been mostly used in the literature of wealth and income inequality (Davidson and Duclos (2000)) as well as in financial economics.
Let G and F be the cumulative distribution functions (CDFs) from two populations. Then, weak first order stochastic dominance (hereafter SD1) of G over F corresponds to
for all This inequality establishes a strong condition regarding the characteristics of the different groups of firms. For instance, if we analyze the variable ROA, G SD1 F means that for any level of ROA “z”, the proportion of firms with ROA greater than “z” is at least as large in the group associated to G as it is in group associated to F.
Davidson and Duclos (2000) suggested an approach based on tests of inequality constraints to build up test of stochastic dominance. The main problem of this approach is that comparisons are made at a fixed number of arbitrarily chosen points, introducing the possibility of test inconsistency. We will follow the approach developed by Barret and Donald (2003), which considers tests of stochastic dominance of any pre-specified order that are based on Kolmogorov-Smirnov type test that compare the objects at all points. The objects being compared are partial integrals, and since these objects are compared at all points in the range of our variable of interest, the tests have the potential of being consistent tests for the full set of restrictions implied by stochastic dominance.

BANCO DE ESPAÑA 60 DOCUMENTO DE TRABAJO N.º 1603
Annex VI. Multivariate analysis and robustness checks. Further results.
Including Financial RatiosVARIABLES (1) (2) (1) (2)
Amount Issued 0.079 -0.299***[0.104] [0.095]
Term -0.056*** -0.078*** -0.049** -0.076***[0.016] [0.016] [0.021] [0.022]
Local GAAP 1.217*** 1.145*** 1.201** 1.053**[0.411] [0.384] [0.482] [0.452]
ADR -0.892*** -0.896*** -0.526* -0.715***[0.251] [0.230] [0.277] [0.242]
MOVE Index -0.004 -0.012*** -0.002 -0.010*[0.004] [0.004] [0.006] [0.006]
Rated Security -0.194 -1.166*** -0.74 -1.914***[0.394] [0.349] [0.573] [0.520]
Bond Holder Right 0.844** 0.52 1.329** 1.046*[0.350] [0.323] [0.614] [0.590]
No Financial Info 0.134 0.094[0.258] [0.240]
Market Based 0.490* 0.440* 0.585* 0.597**[0.252] [0.235] [0.316] [0.294]
Firm Assets -0.231** -0.231**[0.108] [0.099]
Fixed Assets to Total Assets -0.004 -0.004[0.007] [0.006]
Altman score <1.21 0.234 -0.530*[0.332] [0.313]
Constant 1.175* 6.399*** 1.962** 6.843***[0.621] [0.571] [0.973] [0.913]
Observations 2,579 2,579 1,193 1,193Time Dummies NO NO NO NOLR Chi2 445.3 445.3 175.4 175.4Prob>CHi2 0 0 0 0Degrees Freedom 18 18 20 20
Table VI.1 Determinants of market of issuance of debt-securities. Multinomial Logit. Coefficients
Financial Contracting Features
Robust standard errors in brackets*** p<0.01, ** p<0.05, * p<0.1Note: multivariate logit, base outcome is firm being able to issue in global bond market; 1 if firm issues only in US144A; and 2 if firm issues only in Eurobond market.

BANCO DE ESPAÑA 61 DOCUMENTO DE TRABAJO N.º 1603
(1) (2) (3) (4)
VARIABLES US 144A Eurobond US 144A EurobondAmount Issued 1.053 0.824**
[0.109] [0.067]Bond: Maturity (years) 0.941*** 0.903*** 0.949** 0.904***
[0.018] [0.016] [0.023] [0.021]Local GAAP -excluding IFRS/US GAAP 4.597*** 3.673*** 4.444*** 3.342***
[1.875] [1.412] [2.086] [1.498]ADR (cross-listed in US) 0.388*** 0.333*** 0.559** 0.394***
[0.102] [0.079] [0.163] [0.099]MOVE Index at issuance 0.994 0.989*** 0.995 0.991*
[0.004] [0.004] [0.006] [0.006]RatedSecurity 0.606 0.206*** 0.386* 0.113***
[0.234] [0.066] [0.202] [0.051]Bonds include any bond-holder rights 1.111 1.202 0.964 0.825
[0.296] [0.283] [0.297] [0.229]No financial information 1.279 1.213
[0.344] [0.298]Post 2009 1.997*** 1.616** 2.588*** 2.295***
[0.526] [0.392] [0.861] [0.714]Firm Assets 0.821** 0.775***
[0.078] [0.069]Fixed Assets to Total Assets (ratio) 0.999 0.997
[0.007] [0.006]Altman score < 1.21 0.658 0.461***
[0.185] [0.117]Constant 4.290** 417.141*** 43.991*** 3,186.359***
[2.573] [226.441] [44.634] [3,071.415]
Observations 2,439 2,439 1,116 1,116Time Dummies NO NO NO NOLR Chi2 437.4 437.4 181.5 181.5Prob>CHi2 0 0 0 0Degrees Freedom 18 18 20 20Robust standard errors in brackets*** p<0.01, ** p<0.05, * p<0.1
Table VI.2 Robustness checks. Multinomial Logit. Controlling for previous access
Financial Contracting Features Including Financial Ratios
Note: multivariate logit, base outcome is firm is able to issue in global bond market; firms with previous access to global bonds are removed from outcomes US144A, and Eurobond
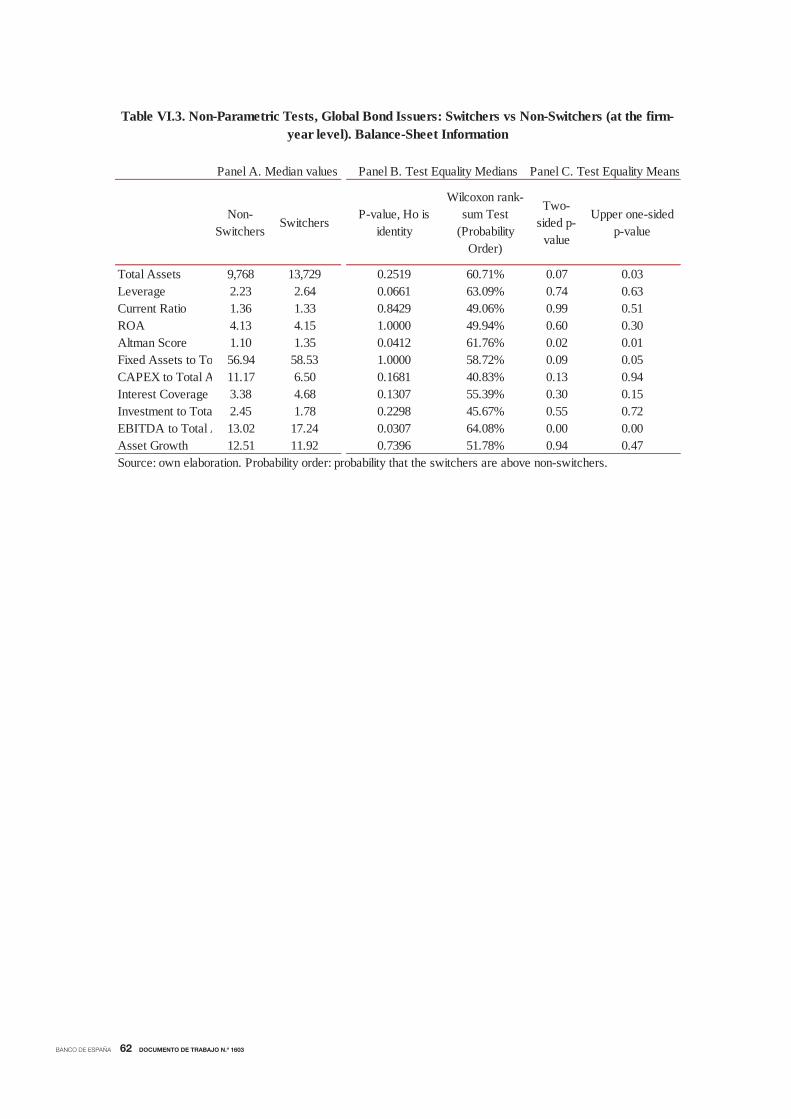
BANCO DE ESPAÑA 62 DOCUMENTO DE TRABAJO N.º 1603
Non-Switchers
SwitchersP-value, Ho is
identity
Wilcoxon rank-sum Test
(Probability Order)
Two-sided p-
value
Upper one-sided p-value
Total Assets 9,768 13,729 0.2519 60.71% 0.07 0.03Leverage 2.23 2.64 0.0661 63.09% 0.74 0.63Current Ratio 1.36 1.33 0.8429 49.06% 0.99 0.51ROA 4.13 4.15 1.0000 49.94% 0.60 0.30Altman Score 1.10 1.35 0.0412 61.76% 0.02 0.01Fixed Assets to Tot 56.94 58.53 1.0000 58.72% 0.09 0.05CAPEX to Total A 11.17 6.50 0.1681 40.83% 0.13 0.94Interest Coverage R 3.38 4.68 0.1307 55.39% 0.30 0.15Investment to Tota 2.45 1.78 0.2298 45.67% 0.55 0.72EBITDA to Total A 13.02 17.24 0.0307 64.08% 0.00 0.00Asset Growth 12.51 11.92 0.7396 51.78% 0.94 0.47Source: own elaboration. Probability order: probability that the switchers are above non-switchers.
Table VI.3. Non-Parametric Tests, Global Bond Issuers: Switchers vs Non-Switchers (at the firm-year level). Balance-Sheet Information
Panel A. Median values Panel B. Test Equality Medians Panel C. Test Equality Means

BANCO DE ESPAÑA PUBLICATIONS
WORKING PAPERS
1416 DIEGO J. PEDREGAL, JAVIER J. PÉREZ and A. JESÚS SÁNCHEZ-FUENTES: A toolkit to strengthen government
budget surveillance.
1417 J. IGNACIO CONDE-RUIZ, and CLARA I. GONZÁLEZ: From Bismarck to Beveridge: the other pension reform in Spain.
1418 PABLO HERNÁNDEZ DE COS, GERRIT B. KOESTER, ENRIQUE MORAL-BENITO and CHRISTIANE NICKEL:
Signalling fi scal stress in the euro area: a country-specifi c early warning system.
1419 MIGUEL ALMUNIA and DAVID LÓPEZ-RODRÍGUEZ: Heterogeneous responses to effective tax enforcement:
evidence from Spanish fi rms.
1420 ALFONSO R. SÁNCHEZ: The automatic adjustment of pension expenditures in Spain: an evaluation of the 2013
pension reform.
1421 JAVIER ANDRÉS, ÓSCAR ARCE and CARLOS THOMAS: Structural reforms in a debt overhang.
1422 LAURA HOSPIDO and ENRIQUE MORAL-BENITO: The public sector wage premium in Spain: evidence from
longitudinal administrative data.
1423 MARÍA DOLORES GADEA-RIVAS, ANA GÓMEZ-LOSCOS and GABRIEL PÉREZ-QUIRÓS: The Two Greatest. Great
Recession vs. Great Moderation.
1424 ENRIQUE MORAL-BENITO and OLIVER ROEHN: The impact of fi nancial (de)regulation on current account balances.
1425 MAXIMO CAMACHO and JAIME MARTINEZ-MARTIN: Real-time forecasting US GDP from small-scale factor models.
1426 ALFREDO MARTÍN OLIVER, SONIA RUANO PARDO and VICENTE SALAS FUMÁS: Productivity and welfare: an
application to the Spanish banking industry.
1427 JAVIER ANDRÉS and PABLO BURRIEL: Infl ation dynamics in a model with fi rm entry and (some) heterogeneity.
1428 CARMEN BROTO and LUIS MOLINA: Sovereign ratings and their asymmetric response to fundamentals.
1429 JUAN ÁNGEL GARCÍA and RICARDO GIMENO: Flight-to-liquidity fl ows in the euro area sovereign debt crisis.
1430 ANDRÈ LEMELIN, FERNANDO RUBIERA-MOROLLÓN and ANA GÓMEZ-LOSCOS: Measuring urban agglomeration.
A refoundation of the mean city-population size index.
1431 LUIS DÍEZ-CATALÁN and ERNESTO VILLANUEVA: Contract staggering and unemployment during the Great Recession:
evidence from Spain.
1501 LAURA HOSPIDO and EVA MORENO-GALBIS: The Spanish productivity puzzle in the Great Recession.
1502 LAURA HOSPIDO, ERNESTO VILLANUEVA and GEMA ZAMARRO: Finance for all: the impact of fi nancial literacy training
in compulsory secondary education in Spain.
1503 MARIO IZQUIERDO, JUAN F. JIMENO and AITOR LACUESTA: Spain: from immigration to emigration?
1504 PAULINO FONT, MARIO IZQUIERDO and SERGIO PUENTE: Real wage responsiveness to unemployment in Spain:
asymmetries along the business cycle.
1505 JUAN S. MORA-SANGUINETTI and NUNO GAROUPA: Litigation in Spain 2001-2010: Exploring the market
for legal services.
1506 ANDRES ALMAZAN, ALFREDO MARTÍN-OLIVER and JESÚS SAURINA: Securitization and banks’ capital structure.
1507 JUAN F. JIMENO, MARTA MARTÍNEZ-MATUTE and JUAN S. MORA-SANGUINETTI: Employment protection legislation
and labor court activity in Spain.
1508 JOAN PAREDES, JAVIER J. PÉREZ and GABRIEL PEREZ-QUIRÓS: Fiscal targets. A guide to forecasters?
1509 MAXIMO CAMACHO and JAIME MARTINEZ-MARTIN: Monitoring the world business cycle.
1510 JAVIER MENCÍA and ENRIQUE SENTANA: Volatility-related exchange traded assets: an econometric investigation.
1511 PATRICIA GÓMEZ-GONZÁLEZ: Financial innovation in sovereign borrowing and public provision of liquidity.
1512 MIGUEL GARCÍA-POSADA and MARCOS MARCHETTI: The bank lending channel of unconventional monetary policy:
the impact of the VLTROs on credit supply in Spain.
1513 JUAN DE LUCIO, RAÚL MÍNGUEZ, ASIER MINONDO and FRANCISCO REQUENA: Networks and the dynamics of
fi rms’ export portfolio.
1514 ALFREDO IBÁÑEZ: Default near-the-default-point: the value of and the distance to default.
1515 IVÁN KATARYNIUK and JAVIER VALLÉS: Fiscal consolidation after the Great Recession: the role of composition.
1516 PABLO HERNÁNDEZ DE COS and ENRIQUE MORAL-BENITO: On the predictability of narrative fi scal adjustments.
1517 GALO NUÑO and CARLOS THOMAS: Monetary policy and sovereign debt vulnerability.
1518 CRISTIANA BELU MANESCU and GALO NUÑO: Quantitative effects of the shale oil revolution.
1519 YAEL V. HOCHBERG, CARLOS J. SERRANO and ROSEMARIE H. ZIEDONIS: Patent collateral, investor commitment
and the market for venture lending.

1520 TRINO-MANUEL ÑÍGUEZ, IVAN PAYA, DAVID PEEL and JAVIER PEROTE: Higher-order risk preferences, constant
relative risk aversion and the optimal portfolio allocation.
1521 LILIANA ROJAS-SUÁREZ and JOSÉ MARÍA SERENA: Changes in funding patterns by Latin American banking systems:
how large? how risky?
1522 JUAN F. JIMENO: Long-lasting consequences of the European crisis.
1523 MAXIMO CAMACHO, DANILO LEIVA-LEON and GABRIEL PEREZ-QUIROS: Country shocks, monetary policy
expectations and ECB decisions. A dynamic non-linear approach.
1524 JOSÉ MARÍA SERENA GARRALDA and GARIMA VASISHTHA: What drives bank-intermediated trade fi nance?
Evidence from cross-country analysis.
1525 GABRIELE FIORENTINI, ALESSANDRO GALESI and ENRIQUE SENTANA: Fast ML estimation of dynamic bifactor
models: an application to European infl ation.
1526 YUNUS AKSOY and HENRIQUE S. BASSO: Securitization and asset prices.
1527 MARÍA DOLORES GADEA, ANA GÓMEZ-LOSCOS and GABRIEL PEREZ-QUIROS: The Great Moderation in historical
perspective. Is it that great?
1528 YUNUS AKSOY, HENRIQUE S. BASSO, RON P. SMITH and TOBIAS GRASL: Demographic structure and
macroeconomic trends.
1529 JOSÉ MARÍA CASADO, CRISTINA FERNÁNDEZ and JUAN F. JIMENO: Worker fl ows in the European Union during
the Great Recession.
1530 CRISTINA FERNÁNDEZ and PILAR GARCÍA PEREA: The impact of the euro on euro area GDP per capita.
1531 IRMA ALONSO ÁLVAREZ: Institutional drivers of capital fl ows.
1532 PAUL EHLING, MICHAEL GALLMEYER, CHRISTIAN HEYERDAHL-LARSEN and PHILIPP ILLEDITSCH: Disagreement
about infl ation and the yield curve.
1533 GALO NUÑO and BENJAMIN MOLL: Controlling a distribution of heterogeneous agents.
1534 TITO BOERI and JUAN F. JIMENO: The unbearable divergence of unemployment in Europe.
1535 OLYMPIA BOVER: Measuring expectations from household surveys: new results on subjective probabilities of future
house prices.
1536 CRISTINA FERNÁNDEZ, AITOR LACUESTA, JOSÉ MANUEL MONTERO and ALBERTO URTASUN: Heterogeneity
of markups at the fi rm level and changes during the great recession: the case of Spain.
1537 MIGUEL SARMIENTO and JORGE E. GALÁN: The infl uence of risk-taking on bank effi ciency: evidence from Colombia.
1538 ISABEL ARGIMÓN, MICHEL DIETSCH and ÁNGEL ESTRADA: Prudential fi lters, portfolio composition and capital ratios
in European banks.
1539 MARIA M. CAMPOS, DOMENICO DEPALO, EVANGELIA PAPAPETROU, JAVIER J. PÉREZ and ROBERTO RAMOS:
Understanding the public sector pay gap.
1540 ÓSCAR ARCE, SAMUEL HURTADO and CARLOS THOMAS: Policy spillovers and synergies in a monetary union.
1601 CHRISTIAN CASTRO, ÁNGEL ESTRADA and JORGE MARTÍNEZ: The countercyclical capital buffer in Spain:
an analysis of key guiding indicators.
1602 TRINO-MANUEL ÑÍGUEZ and JAVIER PEROTE: Multivariate moments expansion density: application of the dynamic
equicorrelation model.
1603 ALBERTO FUERTES and JOSÉ MARÍA SERENA: How fi rms borrow in international bond markets: securities regulation
and market segmentation
Unidad de Servicios AuxiliaresAlcalá, 48 - 28014 Madrid
E-mail: [email protected]