how incentives shape strategy: the role of cmo and ceo ... · role of chief marketing officers...
TRANSCRIPT
“How Incentives Shape Strategy: The Role of CMO and CEO Equity Compensation in
Inducing Marketing Myopia” © Martin Artz and Natalie Mizik; Report Summary © 2018
Marketing Science Institute
MSI working papers are distributed for the benefit of MSI corporate and academic members
and the general public. Reports are not to be reproduced or published in any form or by any means, electronic or mechanical, without written permission.
Marketing Science Institute Working Paper Series 2018 Report No. 18-105
How Incentives Shape Strategy: The Role of CMO and
CEO Equity Compensation in Inducing Marketing Myopia
Martin Artz and Natalie Mizik
Report Summary
Myopic management is a serious problem and a threat to firms because it entails inefficient
decision making, which leads to a decline in future firm performance. In this study, Martin Artz
and Natalie Mizik examine the role personal compensation incentives of CMOs and CEOs play
in inducing myopic marketing management.
They combine data from multiple sources (ExecuComp, Center for Research in Security Prices
[CRSP], Compustat, and Thomson Reuters Insider Filing Data Feed). Their sample covers all
public firms in these databases from 1993-2014. Their analyses use multiple methods designed to
identify causal effects (e.g., inverse probability weighted regression adjustment, Heckman
selection bias correction, endogenous treatment effects, control function, difference-in-
differences), which allows for a causal interpretation of findings.
Findings
CEO equity incentives are largely unrelated to the incidence and severity of myopic marketing
management. CMO equity compensation, on the other hand, is highly predictive of the incidence
and severity of myopic marketing management.
Contrary to the arguments that the presence of a CMO in the organization can help maintain
customer focus and support for marketing departments, CMOs not only fail to prevent myopia,
but further exacerbate the problem as the market-based (i.e., equity) portion of their personal
compensation increases.
Further, consistent with the CMO’s personal enrichment motivation, CMOs take advantage of
artificially inflated stock valuation by exercising more stock options and selling more of their
personal equity holdings in the years when myopic marketing management occurs and is more
severe.
Implications
In contrast to a popular pessimistic view in the marketing literature questioning the ability of
CMOs to influence firm strategy, these findings suggest CMOs have a significant influence on
marketing budgets and firm strategy. However, this study also challenges the belief in the CMO
as a central force to mitigate marketing resource misallocation and as the dominant advocate for
a long-run-focused marketing strategy.
On the contrary, these findings suggest that CMOs enable myopic marketing management and
seek to derive personal gain when it occurs. They highlight the pitfalls and limitations of
overreliance on equity in managerial compensation packages: Equity compensation can create
perverse incentives for managers in their functional domain to engage in myopic practices.
What are the solutions to the myopic management problem? One proposal suggests firms should
pay their executives based on stock price performance but defer the payout until after the
executive’s retirement in order to reduce the effects of equity compensation and provide optimal
investment incentives during the latter part of the CEO’s tenure. Another proposal calls for tying
executive compensation to long-run-oriented performance metrics (e.g., customer satisfaction or
Marketing Science Institute Working Paper Series 1

brand equity). Yet another proposal advocates expanding disclosure of value-relevant non-
financial performance indicators to curtail myopic management.
In April 2015, the SEC issued a “pay versus performance” proposal (it has just been moved from
the 2017 SEC rulemaking agenda to the long-term action list by the new administration) to
require greater disclosure on compensation and to draw a direct link to performance
(http://www.sec.gov/news/pressrelease/2015-78.html). Under this proposal, companies would be
required to disclose the relationship between executive pay and a company’s financial
performance and to report executive compensation relative to their financial performance and
relative to their peer group of firms. Will this solution help remedy the problem? The answer
remains to be seen.
Martin Artz is Associate Professor of Management Accounting and Control at the Frankfurt
School of Finance & Management, Germany. Natalie Mizik is Professor of Marketing and J.
Gary Shansby Endowed Chair in Marketing Strategy, Foster School of Business, University of
Washington.
Acknowledgments
The authors thank seminar participants at Goethe University, INSEAD, Northwestern University,
Marketing Science Conference (Atlanta), Marketing Strategy Meets Wall Street Conference
(Singapore), Theory + Practice in Marketing Conference (Kellogg School of Management),
University of Georgia, University of Mannheim, University of Washington, and Washington
State University for helpful comments. The first author gratefully acknowledges support from
the Julius-Paul-Stiegler Memorial Foundation at the University of Mannheim.
Marketing Science Institute Working Paper Series 2

INTRODUCTION
The economic crisis of 2008 put a bright spotlight on executive compensation and its effects on the
behavior of top management teams (TMTs). The critics have pointed to the unprecedented escalation
in executive compensation, drawing a direct link to deteriorating business ethics, widespread excesses
and abuses of power, and the lack of regard for customers’ and shareholders’ welfare (Ferguson,
Beck, and Bolt 2010). Executive pay has quickly become the subject of public and media attention
and heated debates in the US Congress. In 2010, the Dodd-Frank Wall Street Reform and Consumer
Protection Act was signed into law. It included several important new rules to govern executive pay at
large public companies, for example, requiring large public companies to give shareholders a vote on
executive pay.
There has also been an explosion of research on managerial incentives and behavior in
academic literature. Research in marketing and accounting has documented that under certain
conditions, firms engage in earnings management (through accounting accruals and real activity
manipulation) to temporarily inflate earnings, and such manipulation has significant negative
consequences for the firm (Cohen and Zarowin 2010; Kothari at al. 2016, Bereskin et al. 2018).
Standard economic models suggest that private managerial incentives play a significant role in
inducing such behaviors. Specifically, theoretical models show that an overemphasis on stock price in
managerial evaluation and compensation can induce myopic management and/ or accounting
manipulation (e.g., Bizjak, Brickley, and Coles 1993; Croker and Slemrod 2007).
Accounting research has seen a surge of interest in studying the links between executive
compensation and accounting “irregularities” (i.e., accrual-based earnings manipulation). These
studies find support for the conclusions from the theoretical economic models: equity incentives
motivate executives to manipulate accounting information (Cheng and Warfield 2005; Bergstresser
and Philippon 2006; Jiang, Petroni, and Wang 2010).
Marketing Science Institute Working Paper Series 3

In the marketing literature there has also been an increased interest in studying the effects of
executive compensation (e.g., Bansal et al. 2016; Currim at al. 2012; Chakravarty and Grewal 2016).
Some authors have suggested that executive equity compensation might serve to reduce myopic
management such as cutting marketing spending to artificially inflate earnings (Currim at al. 2012;
Luo et al. 2012; Chakravarti and Grewal 2016). We investigate this proposition in detail. Further, the
role of chief marketing officers (CMOs) in preventing (or inducing) marketing myopia and the impact
of CMO compensation on myopic marketing management are unknown. These two key aspects—the
CMO compensation–myopic marketing management link and the relative role of CMOs in inducing
marketing myopia—are the focus of our study.
Specifically, we examine the role personal compensation incentives of a CMO and CEO play
in inducing myopic marketing management. We find that CEO equity incentives are largely unrelated
to the incidence and severity of myopic marketing management. CMO equity compensation, on the
other hand, is highly predictive of the incidence and severity of myopic marketing management.
Contrary to a common belief articulated in the marketing literature that the presence of a CMO in the
organization helps maintain customer focus, support funding for marketing departments, and ensure
consistent marketing strategy, we find CMOs not only fail to prevent myopia, but further exacerbate
the problem as the market-based (equity) portion of their personal compensation package increases.
Our analyses utilizing multiple methods designed to identify causal effects (e.g., inverse probability
weighted regression adjustment, Heckman selection bias correction, endogenous treatment effects,
control function, difference-in-differences) allow for a causal interpretation of these findings. Further,
we find that CMOs seek to benefit financially and take advantage of inflated equity valuation.
Consistent with the CMO’s personal enrichment motivation we find that CMOs exercise more stock
options and sell more of their personal equity holdings in the years when myopic management takes
place (i.e., when stock valuation is artificially inflated).
Marketing Science Institute Working Paper Series 4
EXECUTIVE COMPENSATION AND STRATEGIC BEHAVIOR
The Evolution of Academic Thought on Managerial Compensation
Economic research on managerial compensation has focused on the need to align managers’
incentives with those of the firm owner’s. The trajectory of the theoretical thought on the topic
closely parallels the contemporary issues and economic problems of the particular era.
In the 1980s and early 1990s, academics, shareholders, and activist groups pointed to the fact
that the pay practices established in the United States in the 1960s and 1970s were unsuitable for the
new economic reality and the dynamics of the 1980s and 1990s as the shareholder value creation
became more dependent on the organizational embrace of innovation and entrepreneurship. Most
academic and practitioners’ criticism of executive pay structure at the time emphasized the lack of
meaningful rewards for superior performance and penalties for failure. Both academics and
practitioners argued for the need to establish a closer link between pay and performance and to create
incentives to mitigate managerial risk aversion (Murphy 1999). This notion resulted in calls for tying
executive pay directly to changes in shareholder wealth to increase the sensitivity of executive pay to
stock price performance. The proliferation of the stock-based and stock options compensation
followed.
Equity-based compensation provides a direct link between managerial rewards and appreciation
of share price. Because the value of options increases with stock price volatility, executives holding
stock options have greater incentives to undertake riskier investments. Analytical models show that
option plans reduce agency costs because they incentivize long-term focus and mitigate executives’
risk aversion (Hirshleifer and Suh 1992). Empirical research confirms this finding—managers who
receive more stock-based compensation invest more in risky projects (Gormley, Matsa, and Milbourn
2013; Rajgopal and Shevlin 2002).
Early empirical studies investigating the effects of introducing equity incentives in executive
pay showed a significant positive effect on firm performance. For example, Brickley, Bhagat, and
Marketing Science Institute Working Paper Series 5
Lease (1985) reported a 2.4% abnormal stock return in the event study of firms adopting stock-based
compensation plans. Similarly, DeFusco, Johnson, and Zorn (1990) reported a .68% return for a two-
day event window and a 4.0% positive abnormal return when they included the potential leakage
period prior to the event in the analysis.
Yermack (1997) also reported that stock price increases tend to coincide with executive stock
option grants, even when these grants are not publicly announced. All these findings are consistent
with the predictions of the economic theory: tying managerial compensation to stock market
performance improves managerial incentives and reduces agency costs. Yermack (1997), however,
points out an alternative, more sinister, explanation that is also consistent with these findings:
executives push stock-based compensation through before positive news become public or before
they engage in manipulation of the stock price (also see Aboody and Kasznik 2000).
A new perspective on the equity-based compensation emerged at the turn of the 21st century: it
was now blamed for excessive risk-taking (Bebchuk and Fried 2006). The highly publicized
accounting scandals of the early 2000s further reinforced this perception and a new trend emerged—a
shift away from the stock options and toward restricted stock grants and cash bonuses. The Economist
(April 15, 2004, p.71) noted that the shareholders have finally “woken up to the perverse effects on
executive behavior of corporate pay, and especially of stock options,” and reported that the proportion
of compensation from stock options in 2004 reached its lowest level in seven years.1
Recently, however, some researchers have suggested that equity-based compensation may be
beneficial not only because it discourages risk aversion, but also because it may curb executive
opportunism and reduce myopic management (Currim et al. 2012; Luo et al. 2012). We seek to
investigate this proposition in detail. In the following section, we review relevant arguments in the
economic theory related to managerial compensation.
1 The use of stock options has further declined since that report, primarily due to the change in the accounting regulations that required expensing of the stock options starting in June 2005, which made options more costly for the firms to use in compensation.
Marketing Science Institute Working Paper Series 6

Compensation Effects in Incomplete Information Markets
In the theoretical models with standard assumptions of efficient markets and rational expectations, if
managers care about stock prices, they act in the best interests of the shareholders and make firm
value–maximizing business decisions. Standard efficient market models advocating equity-based
compensation relied on the assumption of perfect information, that is, full observability of managerial
actions, and the investors and managers having identical information. However, with the introduction
of information asymmetries into the standard model, the predictions and implications of equity-based
compensation for shareholder welfare change dramatically. Managers with private information about
the firm that is not available to the stock market or managers able to take unobservable actions may
engage in misreporting (i.e., accounting manipulation) or myopic management (i.e., real activity
manipulation) to maximize their personal compensation rather than to maximize firm value. That is,
under imperfect information, stock-price-based compensation contracts may create perverse
incentives for the managers.
(1) Myopic management: models and evidence. Hidden action models demonstrate the phenomenon
of myopic management (e.g., Narayanan 1985; Stein 1989). They start with the basic assumptions of
rationality, efficient markets, earnings persistence, and managerial utility function depending on the
stock price. Under these four assumptions, managers make efficient decisions and act in the best
interests of the owners (shareholders). Then, Stein (1989), for example, allows managers to take
actions (shift future income into the present, at some cost) that are not perfectly observable by the
owners. The owners can observe the distorted earnings but cannot decompose them into the “true”
and “borrowed” components. Under these conditions, managers have a higher discount rate than that
justified by cost-of-capital considerations (as it would be in the absence of asymmetric information).
This higher discount rate leads to an overemphasis on immediate performance outcomes. Stein (1989)
shows that the extent of myopia increases with the importance managers place on the current-term
stock price.
Marketing Science Institute Working Paper Series 7
Bizjak, Brickley, and Coles (1993) and Benmelech, Kandel, and Veronesi (2010) develop
private information models in which managers have better information about the value of the firm’s
investment opportunities. The investment choices managers make affect cash flows in the future. The
market does not have the same information as the managers about the value of the projects when the
project is undertaken. But by observing the future cash flows or dividends as they materialize
following an investment, the market eventually learns and becomes fully informed about investment
value. In this setting, an overemphasis on current stock price can prompt managers to manipulate the
market’s inferences about firm prospects through observable (however suboptimal) investment
choices. Bizjak et al. (1993) show that managers are more likely to engage in myopic manipulation as
the significance they attach to the current stock price (relative to future profits and future stock price)
increases. Benmelech et al. (2010) similarly find that managers facing equity-based compensation
incentives forego profitable investment opportunities in order to inflate current dividends. However,
because this myopic strategy cannot be maintained forever, at some point in the future, the true state
is revealed and the stock price declines sharply. Both models show that the more managerial
remuneration depends on current stock price, the more likely myopic behaviors are to occur.
Empirical research in marketing and accounting has documented that myopia indeed occurs in
practice (Roychowdhury 2006), can take various forms (Ahearne et al. 2016; Chapman and
Steenburgh 2010; Moorman et al. 2012; Wies and Moorman 2015), and has significant negative
performance consequences (Cohen and Zarowin 2010; Kothari et al. 2016; Kurt and Hulland 2013;
Mizik 2010). The role of the CMO and of the CMO personal compensation in inducing marketing
myopia, however, has not been examined.
Firms can artificially inflate earnings through accounting manipulation (mis-reporting) and/ or
real activity manipulation (myopic management). Because research into the drivers of myopic
management is rather scarce, we turn to a related and well-established stream of literature on financial
mis-reporting for insights.
Marketing Science Institute Working Paper Series 8

(2) Misreporting performance data: models and evidence. Bar-Gill and Bebchuk (2002), Crocker
and Slemrod (2007), and Goldman and Slezak (2006) model managerial incentives to truthfully report
firm performance. They show that performance-based compensation can induce managers to
misreport performance by engaging in accounting manipulation. Numerous empirical studies
examining the role of equity compensation find that it is significantly associated with accounting
earnings manipulation. For example, Cheng and Warfield (2005) report a positive association
between stock-based compensation and the magnitude of abnormal accruals (i.e., discretionary
components in reported earnings). They also find earnings are less informative (i.e., viewed by the
market as being less predictive of the future) in firms with higher stock-based executive
compensation. Bergstresser and Philippon (2006) find the use of discretionary accruals to manipulate
reported earnings is more pronounced in firms in which CEO compensation is tied to stock-based
incentives.
In sum, both the theoretical and the empirical evidence on accounting-based earnings
manipulation suggest that the extent of manipulation increases with the portion of market-based (i.e.,
equity) compensation in executive pay packages.
The Role of Different Members on the Top Management Team
Most of the empirical studies have focused on the role of CEO compensation, but more recent
research is turning its attention to the other members of the TMT. Several authors have argued that
the lower-level officers can be more influential in their domain than the CEOs. The incentives of the
CFOs, for example, may play a more prominent role in decisions requiring advanced financial
expertise. Jiang, Petroni, and Wang (2010) argue that because the CFO’s primary responsibility is
financial reporting, CFO equity incentives should play a stronger role than those of the CEO in
inducing accounting-based earnings management. Consistent with this argument, the authors find that
the accruals and the likelihood of beating analyst forecasts (i.e., two alternative proxies for
accounting-based earnings management) are more sensitive to CFO than to CEO equity incentives.
Marketing Science Institute Working Paper Series 9

Similarly, Kim, Li, and Zhang (2011) report that the sensitivity of the CFO’s portfolio value to stock
price changes is more strongly associated with the risk of future stock price crash (i.e., evidence of
potential stock price manipulation, Benmelech et al. 2010) than that of a CEO.
The empirical evidence on the link between equity incentives and myopic marketing
management is lacking, and CMOs have not received attention in research investigating the effects of
compensation structure on TMT behavior and firm strategy. The economics literature of incomplete
information unequivocally predicts a greater extent of myopic behaviors as managers’ interest in the
current stock price increases, and extending the logic of Jiang, Petroni, and Wang (2010) to marketing
domain would suggest that CMOs might have greater responsibility than other executives for myopic
marketing management. This logic, however, runs contrary to the views on the role and power of
CMOs dominant in the marketing literature.
THE ROLE OF THE CMO
CMO Power and the Scope of Responsibilities
One popular (pessimistic) view contends that the influence of marketing within organizations is
waning. Supporters of this view refer to an often-cited SpencerStewart study (Welch 2004) reporting
that CMO tenures typically last about 23 months.2 Most notably, Webster, Malter, and Ganesan
(2005) declare that the marketing function is in steep decline in many organizations. They highlight
(a) the inability of marketers to document marketing’s contribution to the bottom line, (b) an
emphasis on short-term revenues, market share, and stock price, and (c) a shift in channel power as
the primary causes for this trend. The authors argue the question now is not how to rebuild a
marketing center, but rather how to disperse marketing competence across the organization. They call
for building a “small [marketing] ‘center of excellence’” and argue this center “should not be
responsible for developing or implementing marketing strategies,” but rather “it should be the
repository for expert knowledge about the customers and it should manage process for developing and
2 Our data show the average CMO tenure at 5.4 years (about 65 months), just a year shorter than that of a COO.
Marketing Science Institute Working Paper Series 10
disseminating that knowledge” (pp. 42, 43). Under this view, the CMOs are unrelated to myopic
management because they are neither responsible for nor capable of directly influencing firm strategy.
In sharp contrast to this view, an alternative (optimistic) view (e.g., Aaker 2008; Jaworski 2011;
Feng, Morgan, Rego 2015) touts the rising power of the CMOs. Marketers’ credibility and power
comes from owning customer knowledge and market intelligence, and with the ever-increasing
market complexity, the influence of marketing is only bound to increase. Understanding, managing,
and responding to market complexity requires highly specialized capabilities and skills, which are
outside the scope of competency of generalist marketers at the SBU (strategic business unit) level.
Supporters of this view advocate building and strengthening the central marketing group with the key
responsibility of overseeing marketing strategy, and they put the CMO at the center of this structure.
Aaker (2008) views the CMO as the central force to mitigate marketing resource misallocation, create
more coherent and linked marketing strategies, leverage success, and improve communication and
cooperation within organization. He argues that without a centrally driven discipline, internal resource
allocation is driven by politics, and firm resources are often diverted to the largest, rather than the
most promising, areas and markets. Under this view, CMOs are directly responsible for and capable
of preventing myopic marketing management.
Practitioners tend to support the optimistic view. Dahlstrom et al. (2014) note a proliferation of
C-suite titles that include a component of marketing, and argue that the role of CMOs has been
elevated in recent years. Neff (2010) too trumpets the increasing power of the CMOs. He finds the
new crop of CMOs is centralizing control over communications, brand-building, PR, design, market
research, and digital. He argues these new-generation CMOs are leading a significant change and are
becoming far more prevalent, successful, and powerful than their predecessors.
Empirical Evidence on the Role and Effects of CMOs
Most academic studies of CMOs focus on the effect of CMOs on firm performance and typically
report that it is positive (e.g., Germann at al. 2015). Several studies examined the CMO characteristics
Marketing Science Institute Working Paper Series 11

(origin, education, marketing and industry experience) and report their impact on firm value (Wang et
al. 2015), likelihood of external funding for new ventures (Homburg et al. 2014), and show how the
effect varies depending on environmental and firm-specific factors (Nath and Mahajan 2008, 2011;
Boyd et al. 2010).
Bansal et al. (2016) and Kim at al. (2016) are the only studies we know to systematically
examine the determinants of CMO compensation and link it to firm performance. The authors find
that CMOs employed at firms with high advertising and R&D intensity, and operating in competitive
product markets, command larger amounts of total compensation and that a greater proportion of their
compensation is market-based. Bansal et al. (2016) also report that the absolute deviations in the
compensation elements of top marketing executives from their predicted level (which serves as the
authors’ proxy for optimal compensation) have a symmetric negative association with firm
performance as measured by contemporaneous ROA, earnings surprises, and annualized stock
returns. Kim et al. (2016), on the other hand, report a positive linear association between CMO equity
incentives and the market value of the firm.
The studies linking CMO compensation and myopic practices are lacking. Currim et al. (2012)
and Chakravarty and Grewal (2016) studies are, to the best of our knowledge, the only to examine the
effects of TMT compensation on firm marketing strategy.3 Specifically, Currim et al. (2012) examine
risk aversion as related to R&D and advertising spending. The authors find that increases in equity-to-
bonus compensation ratios of the top five TMT members have a positive association with increases in
risky and uncertain projects—advertising and R&D spending as a percentage of sales. This finding is
fully consistent with the predictions of economic theory: equity-based compensation reduces risk
3 Other marketing researchers have examined some marketing aspects related to TMT compensation. For example, Tavassoli, Sorescu, and Chandy (2014) examine total compensation packages of top executives and find that firms with strong brands pay their executives less than other firms and that this effect is stronger for CEOs and younger executives. O’Connell and O’Sullivan (2011) study the impact of customer satisfaction on CEO bonuses and equity compensation. Luo, Homburg, and Wieseke (2012) suggest the reverse link: equity-based CEO compensation is the driver of customer satisfaction because CEOs invest more in long-term relations with customers and internal employees.
Marketing Science Institute Working Paper Series 12
aversion. Based on their findings, the authors take a step further to suggest that equity-based
compensation schemes to incentivize long-term orientation may also mitigate myopic management of
resources. They argue that “equity-based compensation is a motivational tool that can encourage
longer-term orientation, discourage myopic management of resources or short-term opportunism” (p.
36). That is, executives’ equity pay may help decrease myopic marketing management. Chakravarty
and Grewal (2016) consider and find a positive moderating effect of the current-year bonus-to-equity
ratio in the CEO compensation (i.e., the inverse of the Currim et al. 2012 focal metric) on propensity
to cut advertising and R&D spending. Consistent with Currim et al. (2012) propositions, the authors
suggest that CEO bonus (rather than current-year equity award) induces short-term orientation and
increases propensity to myopically cut advertising and R&D.
In sum, the optimistic view on the role and power of CMOs has greater empirical support and
appears to dominate in more recent discussions. Under this optimistic view, CMOs are responsible for
and capable of directly influencing firm strategy and curtailing myopic marketing management.
Moreover, because it encourages long-term orientation, CMO equity compensation is argued to
motivate CMOs to reduce myopic marketing management.
HYPOTHESES
The CMO is a top firm executive with the primary responsibilities for overseeing the overall
marketing strategy in the organization, for gathering, analyzing, and disseminating market
intelligence, and for defining and shaping marketing philosophy and process (Aaker 2008; Court
2007; Jaworski 2011). All these responsibilities are the key inputs into the top decision-making and
strategy setting within the firm. As such, the mere presence of a CMO in TMT can potentially reduce
the extent of myopic marketing:
Hypothesis 1 (H1): The presence of a CMO in a firm reduces the extent of myopic marketing management.
Under the pessimistic view on CMOs there would be no effect of CMO presence because
CMOs have no power to affect strategy. But under the positive view of CMOs dominating marketing
Marketing Science Institute Working Paper Series 13
literature, CMOs are responsible for and capable of stemming myopic marketing management and,
therefore, this effect would be negative—that is, CMO presence would help curb marketing myopia.
Economic theory predicts that managers with high equity incentives are motivated to
artificially inflate earnings to increase stock price value and correspondingly their personal
compensation. They may do so by engaging in myopic marketing management:
Hypothesis 2 (H2): The more executive compensation depends on equity, the greater the extent of myopic marketing management.
CEOs have the greatest influence on strategic decisions and a final decision authority
(Finkelstein and Hambrick 1996). However, the CMOs have immediate control over and
responsibility for managing marketing budgets and assets. As such, they might be in a better position
than other members of the TMT, including the CEO, to affect myopic marketing management. This
argument suggests the following hypothesis:
Hypothesis 3 (H3): CMO equity incentives have a greater association with myopic marketing management than those of the CEO.
Under the standard economic theory, the effect of CMO compensation on the extent of myopic
marketing management would be positive—that is, CMO equity compensation would induce more
marketing myopia. Under the positive view on CMOs, the effect would be negative—that is, CMO
equity pay (reflecting CMO power) would curb myopia. These two views contrast the importance and
priority CMOs attach to the demands and responsibilities of their job (to oversee marketing strategy
and to advocate for and support marketing functions) versus their personal financial gain. If CMOs
are enabling myopic marketing management, their equity incentives would play a stronger role in
inducing myopic marketing management than those of other executives (e.g., CEOs).
Further, if we find evidence consistent with CMOs inducing myopic marketing management,
(i.e., H2 and H3 hold, and H3 effect is positive) we would also expect CMOs to try benefit financially
from this manipulation. If managers deliberately engage in myopic marketing management to inflate
firm valuation, then, anticipating an inevitable future decline in stock price, they would seek to
Marketing Science Institute Working Paper Series 14

capitalize on the situation. That is, CMOs would seek to take advantage of inflated stock prices and
sell more of their equity holdings in the years when earnings and firm valuation are artificially
inflated through myopic marketing management:
Hypothesis 4 (H4): The CMOs take advantage of artificially inflated equity valuations in the years when myopic marketing management occurs and sell more of their equity holdings than in other years.
Even if CMOs are not driving marketing myopia (i.e., H3 does not hold) we may still find
CMOs accelerating divesting of their equity holdings in the years when myopic marketing
management takes place. While CMOs may not be powerful and may not be able to affect firm
strategy, they might be better informed and/or they might have better insight about the future negative
consequences of marketing myopia than other members of TMT. This insight would motivate them to
opportunistically take advantage of the inflated equity valuation and sell their personal equity
holdings.
DATA SAMPLE AND MEASURES
Data Sources
We combine data from multiple sources for our study. Executive compensation and options exercise
data come from the ExecuComp database, stock returns from the Center for Research in Security
Prices (CRSP), accounting data from Compustat, and insider-trading data from the Thomson Reuters
Insider Filing Data Feed (IFDF). Our sample covers all public firms in these databases in the 1993-
2014 period. We limit the sample to firms reporting Net Income, SGA, R&D, and positive values for
Total Assets, Sales, Employees, and Book Value of Equity. We winsorize the data at the 1% level to
restrict the influence of outliers. We exclude firms in the utility (SIC 4400–5000), financial (SIC
6000–7000), and public administration (SIC 9000-9900) sectors because these firms operate in highly
regulated environment with accounting rules that differ substantially from those in other industries.
All variable definitions are in the Appendix. We describe key research constructs and their
measurement below.
Marketing Science Institute Working Paper Series 15

Measuring the Extent of Myopic Marketing Management: Incidence and Severity
(1) Identifying Myopic Marketing Management with Secondary Data
Myopic behaviors are not directly observable or measurable and as such require forming indicators
for inferring whether myopic management has occurred. Past research has established econometric
methods for identifying the incidence of myopic management (e.g., Kothari et al. 2016) and we
closely follow this literature. Incidence is a binary indicator reflecting whether or not a firm likely
engaged in myopic management in a given year. A firm is classified as potentially myopic if it shows
a positive earnings surprise (unexpectedly high earnings) and a simultaneous negative surprise
(unexpected cut) in marketing spending.
Because a direct clean measure of marketing spending is not available in financial reports, we
undertake analyses using three different proxies for marketing myopia to test our hypothesis. The first
is a proxy for myopic marketing and R&D management (MMRD) introduced in Mizik (2010). The
second is myopic marketing management (MMKT) proposed in Mizik and Jacobson (2007). The
third is myopic advertising management (MADV). The three measures differ in how closely they
capture marketing-related spending and the CMO control over this spending:
(1) Myopic Marketing and R&D Management (MMRD) measure considers both marketing and R&D
cuts at the time of unexpectedly high earnings and, as such, reflects a more widespread myopic
behavior in the firm (Mizik 2010). While this measure fully captures marketing spending, it is broader
and captures more than myopic marketing management. Other TMT members, such as the CEO,
typically have greater control over R&D expenses and CMO influence is likely to be less pronounced.
As such, we might see greater association of CEO incentives and a weaker support for H3 with this
measure.
(2) Myopic Marketing Management (MMKT) measure only considers marketing spending and
earnings (i.e., does not consider R&D cuts) and, as such, is closer to better capturing the marketing-
related myopia (Mizik and Jacobson, 2007). It is based on selling, general, and administrative
Marketing Science Institute Working Paper Series 16
expenditures (SGA) minus R&D expenditures (MKT=SG&A-R&D). It covers all marketing
spending. While it is still broader than “pure” marketing (it includes non-marketing SGA items that
are outside of the CMO control), we might see stronger CMO findings with MMKT than with the
MMRD metric.
(3) Myopic Advertising Management (MADV) measure is based on advertising and is a very narrow
proxy for marketing-related spending. Clearly, marketing encompasses many other expense
categories, not just advertising. As such, a cut in advertising is a likely, but not a guaranteed, evidence
of myopic marketing management. A cut to advertising might occur when a firm is re-balancing its
marketing budget and shifting advertising dollars into other marketing expense categories (e.g.,
promotions, free sampling, loyalty programs, etc.) Under a re-balancing scenario, MADV might
indicate myopia, but MMKT would correctly indicate no myopia. Nevertheless, analyses of MADV
are insightful as we would expect a CMO to have tighter control over advertising compared to the
expense categories included in MMRD and in MMKT measures and would expect other executives to
have no or little effect on advertising-based myopic marketing management.
It is worthwhile examining all three measures for establishing confidence in our findings: While
no proxy is perfect, as a set, these three measures provide insights into the extent of myopic
marketing management and the scope of CMO association with it.
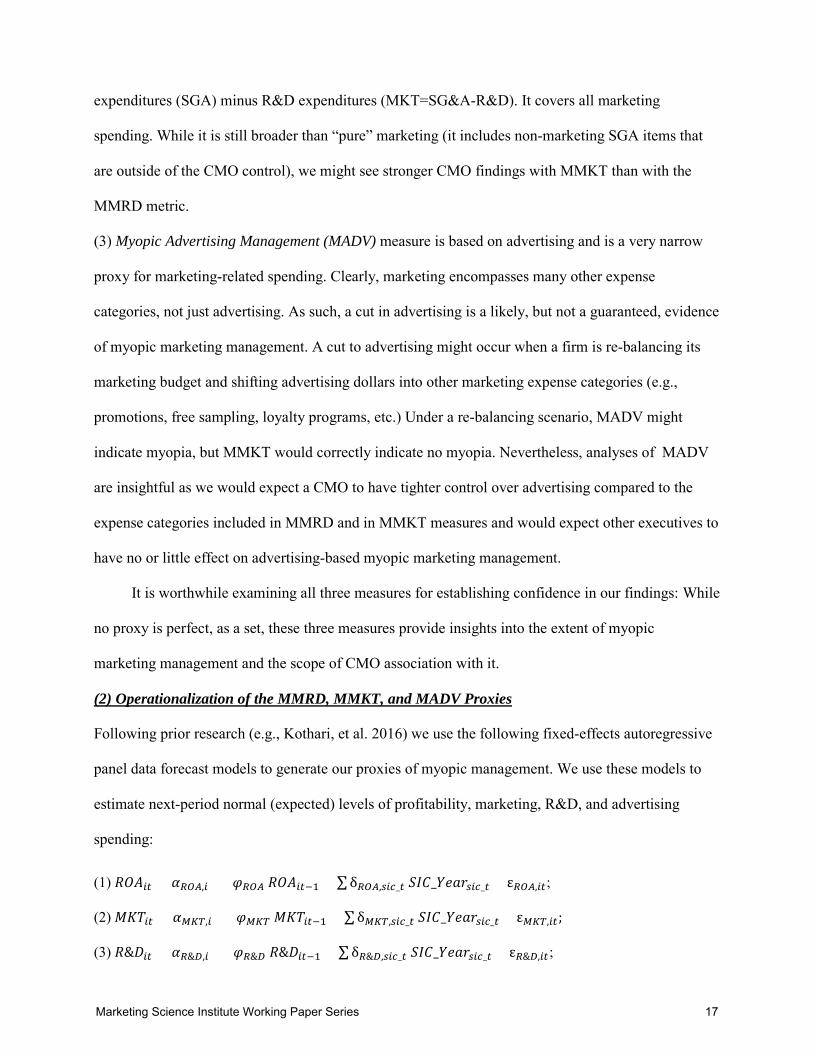
(2) Operationalization of the MMRD, MMKT, and MADV Proxies
Following prior research (e.g., Kothari, et al. 2016) we use the following fixed-effects autoregressive
panel data forecast models to generate our proxies of myopic management. We use these models to
estimate next-period normal (expected) levels of profitability, marketing, R&D, and advertising
spending:
(1) 𝑅𝑅𝑅𝑅𝑅𝑅𝑖𝑖𝑖𝑖 = 𝛼𝛼𝑅𝑅𝑅𝑅𝑅𝑅,𝑖𝑖 + 𝜑𝜑𝑅𝑅𝑅𝑅𝑅𝑅 𝑅𝑅𝑅𝑅𝑅𝑅𝑖𝑖𝑖𝑖−1 + ∑δ𝑅𝑅𝑅𝑅𝑅𝑅,𝑠𝑠𝑖𝑖𝑠𝑠_𝑖𝑖 𝑆𝑆𝑆𝑆𝑆𝑆_𝑌𝑌𝑌𝑌𝑌𝑌𝑌𝑌𝑠𝑠𝑖𝑖𝑠𝑠_𝑖𝑖 + ε𝑅𝑅𝑅𝑅𝑅𝑅,𝑖𝑖𝑖𝑖;
(2) 𝑀𝑀𝑀𝑀𝑀𝑀𝑖𝑖𝑖𝑖 = 𝛼𝛼𝑀𝑀𝑀𝑀𝑀𝑀,𝑖𝑖 + 𝜑𝜑𝑀𝑀𝑀𝑀𝑀𝑀 𝑀𝑀𝑀𝑀𝑀𝑀𝑖𝑖𝑖𝑖−1 + ∑δ𝑀𝑀𝑀𝑀𝑀𝑀,𝑠𝑠𝑖𝑖𝑠𝑠_𝑖𝑖 𝑆𝑆𝑆𝑆𝑆𝑆_𝑌𝑌𝑌𝑌𝑌𝑌𝑌𝑌𝑠𝑠𝑖𝑖𝑠𝑠_𝑖𝑖 + ε𝑀𝑀𝑀𝑀𝑀𝑀,𝑖𝑖𝑖𝑖;
(3) 𝑅𝑅&𝐷𝐷𝑖𝑖𝑖𝑖 = 𝛼𝛼𝑅𝑅&𝐷𝐷,𝑖𝑖 + 𝜑𝜑𝑅𝑅&𝐷𝐷 𝑅𝑅&𝐷𝐷𝑖𝑖𝑖𝑖−1 + ∑δ𝑅𝑅&𝐷𝐷,𝑠𝑠𝑖𝑖𝑠𝑠_𝑖𝑖 𝑆𝑆𝑆𝑆𝑆𝑆_𝑌𝑌𝑌𝑌𝑌𝑌𝑌𝑌𝑠𝑠𝑖𝑖𝑠𝑠_𝑖𝑖 + ε𝑅𝑅&𝐷𝐷,𝑖𝑖𝑖𝑖;
Marketing Science Institute Working Paper Series 17
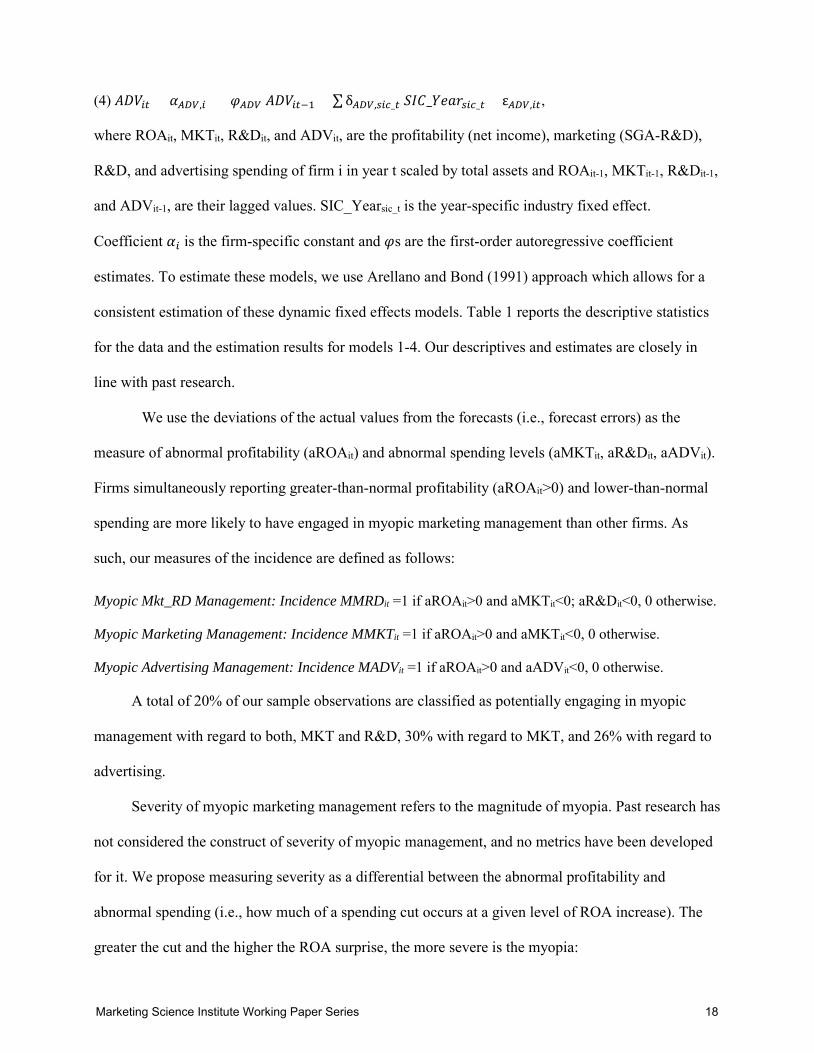
(4) 𝑅𝑅𝐷𝐷𝐴𝐴𝑖𝑖𝑖𝑖 = 𝛼𝛼𝑅𝑅𝐷𝐷𝐴𝐴,𝑖𝑖 + 𝜑𝜑𝑅𝑅𝐷𝐷𝐴𝐴 𝑅𝑅𝐷𝐷𝐴𝐴𝑖𝑖𝑖𝑖−1 + ∑δ𝑅𝑅𝐷𝐷𝐴𝐴,𝑠𝑠𝑖𝑖𝑠𝑠_𝑖𝑖 𝑆𝑆𝑆𝑆𝑆𝑆_𝑌𝑌𝑌𝑌𝑌𝑌𝑌𝑌𝑠𝑠𝑖𝑖𝑠𝑠_𝑖𝑖 + ε𝑅𝑅𝐷𝐷𝐴𝐴,𝑖𝑖𝑖𝑖,
where ROAit, MKTit, R&Dit, and ADVit, are the profitability (net income), marketing (SGA-R&D),
R&D, and advertising spending of firm i in year t scaled by total assets and ROAit-1, MKTit-1, R&Dit-1,
and ADVit-1, are their lagged values. SIC_Yearsic_t is the year-specific industry fixed effect.
Coefficient 𝛼𝛼𝑖𝑖 is the firm-specific constant and 𝜑𝜑s are the first-order autoregressive coefficient
estimates. To estimate these models, we use Arellano and Bond (1991) approach which allows for a
consistent estimation of these dynamic fixed effects models. Table 1 reports the descriptive statistics
for the data and the estimation results for models 1-4. Our descriptives and estimates are closely in
line with past research.
We use the deviations of the actual values from the forecasts (i.e., forecast errors) as the
measure of abnormal profitability (aROAit) and abnormal spending levels (aMKTit, aR&Dit, aADVit).
Firms simultaneously reporting greater-than-normal profitability (aROAit>0) and lower-than-normal
spending are more likely to have engaged in myopic marketing management than other firms. As
such, our measures of the incidence are defined as follows:
Myopic Mkt_RD Management: Incidence MMRDit =1 if aROAit>0 and aMKTit<0; aR&Dit<0, 0 otherwise.
Myopic Marketing Management: Incidence MMKTit =1 if aROAit>0 and aMKTit<0, 0 otherwise.
Myopic Advertising Management: Incidence MADVit =1 if aROAit>0 and aADVit<0, 0 otherwise.
A total of 20% of our sample observations are classified as potentially engaging in myopic
management with regard to both, MKT and R&D, 30% with regard to MKT, and 26% with regard to
advertising.
Severity of myopic marketing management refers to the magnitude of myopia. Past research has
not considered the construct of severity of myopic management, and no metrics have been developed
for it. We propose measuring severity as a differential between the abnormal profitability and
abnormal spending (i.e., how much of a spending cut occurs at a given level of ROA increase). The
greater the cut and the higher the ROA surprise, the more severe is the myopia:
Marketing Science Institute Working Paper Series 18
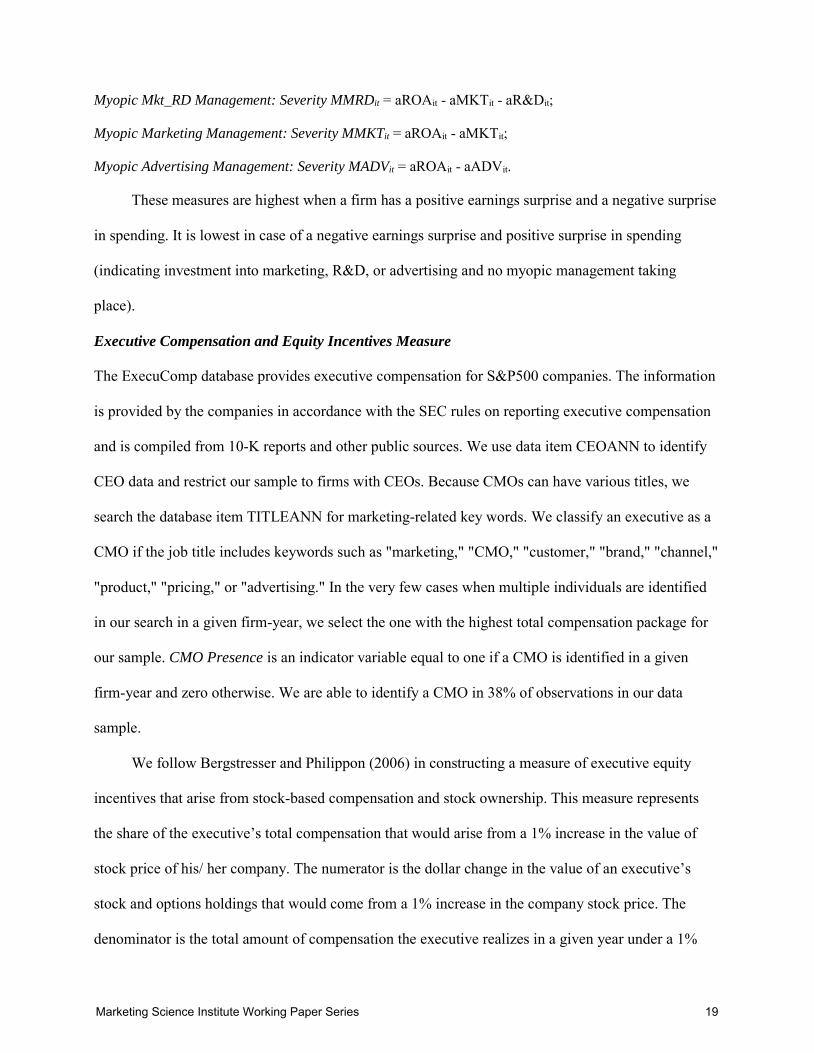
Myopic Mkt_RD Management: Severity MMRDit = aROAit - aMKTit - aR&Dit;
Myopic Marketing Management: Severity MMKTit = aROAit - aMKTit;
Myopic Advertising Management: Severity MADVit = aROAit - aADVit.
These measures are highest when a firm has a positive earnings surprise and a negative surprise
in spending. It is lowest in case of a negative earnings surprise and positive surprise in spending
(indicating investment into marketing, R&D, or advertising and no myopic management taking
place).
Executive Compensation and Equity Incentives Measure
The ExecuComp database provides executive compensation for S&P500 companies. The information
is provided by the companies in accordance with the SEC rules on reporting executive compensation
and is compiled from 10-K reports and other public sources. We use data item CEOANN to identify
CEO data and restrict our sample to firms with CEOs. Because CMOs can have various titles, we
search the database item TITLEANN for marketing-related key words. We classify an executive as a
CMO if the job title includes keywords such as "marketing," "CMO," "customer," "brand," "channel,"
"product," "pricing," or "advertising." In the very few cases when multiple individuals are identified
in our search in a given firm-year, we select the one with the highest total compensation package for
our sample. CMO Presence is an indicator variable equal to one if a CMO is identified in a given
firm-year and zero otherwise. We are able to identify a CMO in 38% of observations in our data
sample.
We follow Bergstresser and Philippon (2006) in constructing a measure of executive equity
incentives that arise from stock-based compensation and stock ownership. This measure represents
the share of the executive’s total compensation that would arise from a 1% increase in the value of
stock price of his/ her company. The numerator is the dollar change in the value of an executive’s
stock and options holdings that would come from a 1% increase in the company stock price. The
denominator is the total amount of compensation the executive realizes in a given year under a 1%
Marketing Science Institute Working Paper Series 19
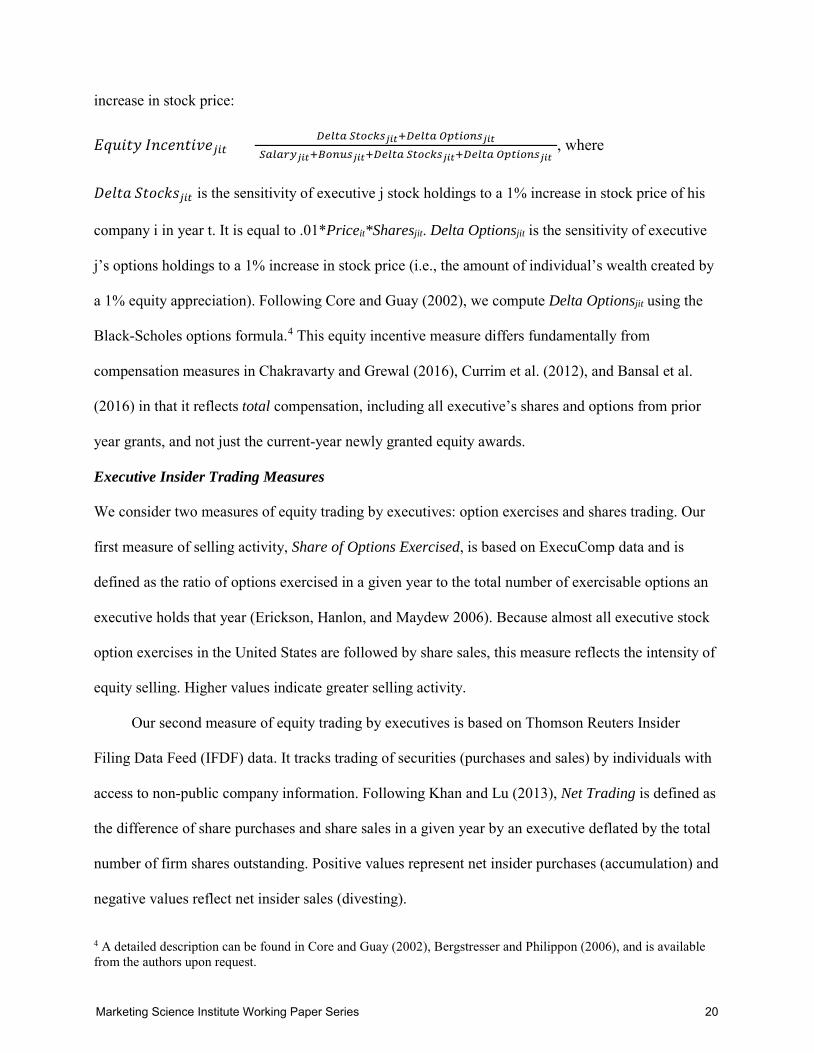
increase in stock price:
𝐸𝐸𝐸𝐸𝐸𝐸𝐸𝐸𝐸𝐸𝐸𝐸 𝑆𝑆𝐼𝐼𝐼𝐼𝑌𝑌𝐼𝐼𝐸𝐸𝐸𝐸𝐼𝐼𝑌𝑌𝑗𝑗𝑖𝑖𝑖𝑖 = 𝐷𝐷𝐷𝐷𝐷𝐷𝑖𝑖𝐷𝐷 𝑆𝑆𝑖𝑖𝑆𝑆𝑠𝑠𝑆𝑆𝑠𝑠𝑗𝑗𝑗𝑗𝑗𝑗+𝐷𝐷𝐷𝐷𝐷𝐷𝑖𝑖𝐷𝐷 𝑅𝑅𝑝𝑝𝑖𝑖𝑖𝑖𝑆𝑆𝑝𝑝𝑠𝑠𝑗𝑗𝑗𝑗𝑗𝑗(𝑆𝑆𝐷𝐷𝐷𝐷𝐷𝐷𝑆𝑆𝑆𝑆𝑗𝑗𝑗𝑗𝑗𝑗+𝐵𝐵𝑆𝑆𝑝𝑝𝐵𝐵𝑠𝑠𝑗𝑗𝑗𝑗𝑗𝑗+𝐷𝐷𝐷𝐷𝐷𝐷𝑖𝑖𝐷𝐷 𝑆𝑆𝑖𝑖𝑆𝑆𝑠𝑠𝑆𝑆𝑠𝑠𝑗𝑗𝑗𝑗𝑗𝑗+𝐷𝐷𝐷𝐷𝐷𝐷𝑖𝑖𝐷𝐷 𝑅𝑅𝑝𝑝𝑖𝑖𝑖𝑖𝑆𝑆𝑝𝑝𝑠𝑠𝑗𝑗𝑗𝑗𝑗𝑗)
, where
𝐷𝐷𝑌𝑌𝐷𝐷𝐸𝐸𝑌𝑌 𝑆𝑆𝐸𝐸𝑆𝑆𝐼𝐼𝑆𝑆𝑆𝑆𝑗𝑗𝑖𝑖𝑖𝑖 is the sensitivity of executive j stock holdings to a 1% increase in stock price of his
company i in year t. It is equal to .01*Priceit*Sharesjit. Delta Optionsjit is the sensitivity of executive
j’s options holdings to a 1% increase in stock price (i.e., the amount of individual’s wealth created by
a 1% equity appreciation). Following Core and Guay (2002), we compute Delta Optionsjit using the
Black-Scholes options formula.4 This equity incentive measure differs fundamentally from
compensation measures in Chakravarty and Grewal (2016), Currim et al. (2012), and Bansal et al.
(2016) in that it reflects total compensation, including all executive’s shares and options from prior
year grants, and not just the current-year newly granted equity awards.
Executive Insider Trading Measures
We consider two measures of equity trading by executives: option exercises and shares trading. Our
first measure of selling activity, Share of Options Exercised, is based on ExecuComp data and is
defined as the ratio of options exercised in a given year to the total number of exercisable options an
executive holds that year (Erickson, Hanlon, and Maydew 2006). Because almost all executive stock
option exercises in the United States are followed by share sales, this measure reflects the intensity of
equity selling. Higher values indicate greater selling activity.
Our second measure of equity trading by executives is based on Thomson Reuters Insider
Filing Data Feed (IFDF) data. It tracks trading of securities (purchases and sales) by individuals with
access to non-public company information. Following Khan and Lu (2013), Net Trading is defined as
the difference of share purchases and share sales in a given year by an executive deflated by the total
number of firm shares outstanding. Positive values represent net insider purchases (accumulation) and
negative values reflect net insider sales (divesting).
4 A detailed description can be found in Core and Guay (2002), Bergstresser and Philippon (2006), and is available from the authors upon request.
Marketing Science Institute Working Paper Series 20

Descriptive Statistics
We summarize the definition and measurement for all control variables in the Appendix. We consider
a comprehensive set of control variables. This list includes controls used in prior research on
accounting misreporting and myopic management, executive compensation, insider trading, and
CMO characteristics. Tables 2 and 3 provide descriptive statistics for our sample and Table 3 Panel B
presents pairwise correlations. They show our sample characteristics are closely in line with those in
prior studies (e.g., Jiang, Petroni, and Wang 2010; Kim, Li, and Zhang 2011).
As reported in Table 2, CMOs are present among top paid executives in approximately 38% of
the observations in the sample (compared to CFOs in 88% and COOs in 52%). A closer analysis of
our data reveals an increase in CMO prominence over the years: whereas only about 27% of the firms
had a CMO on their TMT in 1993 (the first year of our data sample), CMO presence increases to and
hovers at about 41% in the 2000-2014 period. Further, we find that CMO salary, bonus, and equity
incentives are considerably lower than those of the CEOs, but are rather comparable to those of
CFOs. Contrary to an often cited statistic of CMOs having a short 23-months tenure, we find that an
average CMO tenure in our sample is 5.4 years (65 months), compared to 6.46 for COO, 7.74 for
CFO, and 8.26 years for CEO.5 In sum, we find CMOs are increasingly prevalent in TMTs and while
their compensation is lower than that of CEOs, it is rather comparable to that of other top executives.
Further, we find no evidence to support the claim that CMO tenures are very short.
RESEARCH DESIGN
Testing Hypothesis 1: CMO Presence
H1 suggests that CMO presence in an organization can reduce the extent of myopic marketing
5 The 23-months statement originates with the 2004, 2005, and 2006 SpencerStewart studies (e.g., Welch 2004). A follow-up CMO tenure study by SpencerStewart conducted in 2011 reported a 42-month average CMO tenure and attributed it to “the fact that CMOs have firmly established themselves among their peers in the C-suite" (SpencerStewart, May 24, 2011). The most recent estimate is again at 42-months (SpencerStewart, March 2017, https://www.spencerstuart.com/research-and-insight/chief-marketing-officer-average-tenure-drops-to-42-months). These estimates are clearly much lower than the 65-months average for the public US firms derived from the SEC filings.
Marketing Science Institute Working Paper Series 21

management. Results of basic regressions (logit for incidence, OLS for severity) with a dummy
variable for CMO presence suggest that CMO presence is not associated with either the incidence or
severity of myopia for any of our three myopia proxies. A concern with this basic approach is that
these models and their estimates might suffer from selection bias leading to erroneous inferences
about the effect.
Selection bias occurs when the potential outcome (myopic behavior) for those assigned or self-
selected to the “treatment group” (CMO present) differs in a systematic way from those who are
assigned or self-selected into the “control” or “no-treatment group” (Rossi 2017). Firm’s choice of
employing a CMO with a pay rate among its top-paid executives may be not random, but rather
driven by firm-specific and/or environmental factors. If the same factors are also associated with
myopic management, basic models ignoring this issue could suffer from selection bias.
A large stream of literature on causal inference in economics offers tools for dealing with
selection issues (Angrist and Pischke 2009; Imbens and Rubin 2015).6 One popular estimator for
addressing potential selection issues is the inverse probability weighted regression adjustment
(IPWRA). Imbens and Wooldridge (2009) specifically advocate combining propensity score
weighting with regression adjustment because of the desirable resulting properties of this estimator.
The method is consistent, asymptotically efficient, doubly-robust (i.e., only one of the two models,
the selection or the regression adjustment, must be correctly specified to consistently estimate the
treatment effects), and performs well in small samples (Busso et al. 2014; Imbens and Rubin, 2015).
Comparative tests of alternative treatment effects estimators tend to show IPWRA superiority over
IPW and over matching methods (Busso et al. 2014; Gordon et al. 2017).
The IPWRA approach models both, the outcome and the treatment (selection), and consists of
two steps. First, a selection model is developed to predict the likelihood of a firm employing a CMO.
6 We refer the reader to an excellent summary by Imbens and Wooldridge (2009) who review the foundations and recent advancements in the econometrics of causal effects estimation and offer practical recommendations to empiricists.
Marketing Science Institute Working Paper Series 22
Then, the outcomes are conditioned on the probability of CMO presence. That is, the observations on
the outcome variable are weighted by the inverse of the probability that it is observed. The inverse
probability weighting, in effect, adjusts the data to create a pseudo-population such that there is no
confounding on observables and the weighted averages reflect averages in the true population, thus
eliminating selection bias.
(1) Selection Model for CMO Presence. We follow Hirano and Imbens (2001) and Imbens and Rubin
(2015) for finding appropriate specification for the propensity score model. That is, we assemble a
large set of potentially relevant factors and use a logit specification (probit generates statistically
identical results) and a step-wise approach, setting the significance threshold at 10% with clustered
standard errors, to identify relevant factors.
We begin to assemble our set of potential explanatory factors for CMO Presence with the set of
factors reported in the CMO literature (e.g., Bansal et al. 2016, Nath and Mahajan 2008): Advertising,
R&D, Capital Expenditure, Size, Market-to-Book, Leverage, Stock Return Volatility, CEO Tenure,
Insider CEO, COO Presence, Firm Diversification, Competition, and Industry Use of CMO. Next, we
add variables that, in our opinion, logically complement the initial set. We add CFO Presence, CFO
Tenure, and COO Tenure to complete the initial set; and we add CMO Presence in the Prior Year
because we expect CMO Presence to persist over time. Finally, we include all variables potentially
affecting the outcomes we are investigating (myopia) that are entering the second stage of the
estimation (regression adjustment) and are not already included on the list above. Inclusion of all
second-stage variables is advised by Busso et al. (2014, p.897) who assess performance of various
estimators and specifications of treatment effects models and conclude that researchers should include
any covariates believed to influence the outcome variable (second stage) into the propensity score
model (first stage) because doing so provides “insurance against bad bias.” That is, our initial set also
includes the following factors explaining myopia from the second stage of the estimation: CEO
Equity Incentive, Abnormal Accruals, Annual Stock Return, Sales Volatility, and Year fixed effects.
Marketing Science Institute Working Paper Series 23
Only a few of the factors we consider for our CMO Presence (selection) model are relevant in
our sample. Our final selection model has the following form:
(5) CMO Presenceit = α0+ α1CMO Presenceit-1 + α2Industry CMO Presenceit + α3Leverageit-1
+ α4Stock Return Volatilityit-1 + α5Competitionit-1 + τtYeart + 𝜀𝜀𝑖𝑖𝑖𝑖.
Table 4 reports estimates of model 5. All included factors have expected signs. Consistent with
past research we find that Industry CMO Presence (the proportion of other firms in the same two-digit
SIC industry employing a CMO), Competition, and Stock Return Volatility have positive signs and
Leverage is negatively associated with CMO presence. We also find that our addition, CMO Presence
in the Prior Year, is positive and, by far, the most prominent factor accounting for most of the
explanatory power in the model. None of the other factors we consider are relevant in our sample.
(2) IPWRA Models to Test the Effect of CMO Presence. We use propensity scores computed in step
one to weigh our observations in the regression models explaining the incidence and severity of
myopia. That is, each observation is weighted by the inverse probability that a CMO is present in the
TMT. We use logit specification for Incidence models and linear specification for Severity models.
Equation 6 summarizes our models for incidence and severity of myopia:
(6) Incidence/Severity Myopiait = β0+β1CMO Presenceit+β2CEO Equity Incentiveit-1
+β3Abnormal Accrualsit +β4Sizeit-1+β5Market-to-Bookit-1+ β6Leverageit-1
+β7Annual Stock Returnit-1 + β8Sales Volatilityit-1 + β9Competitionit-1 + τtYeart + 𝜀𝜀𝑖𝑖𝑖𝑖.
The key variable in our models is CMO Presence. Under H1, we would expect to observe a
significant negative estimate for CMO Presence in both the Incidence and Severity models. The
regression adjustment portion of the model includes a comprehensive set of controls. Prior work has
shown that certain firm- and market-specific characteristics affect earnings inflation (Armstrong et al.
2013, Chakravarty and Grewal 2011, Roychowdhury 2006), thus, we include them: firm size (Size),
growth opportunities (Market-to-Book), leverage ratio (Leverage), prior performance (Annual Stock
Return), volatility of sales (Sales Volatility), and the degree of competition (Competition). In addition,
Marketing Science Institute Working Paper Series 24

we also include Year fixed effects, CEO Equity Incentive, and Abnormal Accruals as controls.
The inclusion of these additional variables is motivated by the following considerations. Past
research has shown that equity-based managerial compensation affects accruals manipulation (Jiang
et al., 2010). We conjecture that CEO Equity Incentiveit-1 might also affect real activity manipulation,
because it is just an alternative strategy to achieve the same goal of earnings inflation, and include it
in our myopia models. We also include Abnormal Accrualsit (the amount that current accruals deviate
from their normal level) to control for the extent of accounting-based manipulation because accruals
and real manipulation (myopia) are driven by the same motivation to inflate earnings. Abnormal
Accruals are the difference between accounting accruals and expected accruals levels estimated using
the modified Jones model (Dechow et al. 1995). Year fixed effects capture general economic
conditions common across firms.
Except for Abnormal Accrualsit, all variables are lagged one year. This practice has been
established in compensation and earnings-inflation studies for two main reasons (Armstrong et al.
2013; Bergstresser and Philippon 2006): (1) to control for firm factors at the time managers actually
make strategic decisions, that is, at the beginning rather than the end of year; and (2) because
contemporaneous firm-specific factors can be affected by myopic management (e.g., myopic
management may affect firm size and the market-to-book ratio). The only contemporaneous measure
we include is Abnormal Accrualsit. We do so because current abnormal accruals represent the
contemporaneous accounting-based earnings manipulation and are presumably driven by some of the
same factors that motivate earnings inflation through real activity. Indeed, firms can achieve earnings
inflation through accounting accruals manipulation and/or myopic management. That is, Abnormal
Accrualsit proxy for common factors inducing earnings inflation.
Table 5 reports our estimation results. We find no significant effects for CMO Presence
across all six models. We undertake multiple tests to assess this non-finding.
(3) Alternative Models to Test Hypothesis 1. We follow Imbens and Wooldridge (2009), Busso et al.
Marketing Science Institute Working Paper Series 25
(2014) and Gordon et al. (2017) advice to use multiple methods to test our hypotheses. We find no
support for H1 and no evidence of CMO presence affecting either the incidence or severity of myopia
across all methods, models, and myopia proxies we use (all results available upon request). For
example, we tested H1 using Heckman approach for selection correction and various matching
estimators. We find no significant effects of CMO presence.
Heckman and matching methods are similar to IPWRA in that they require the conditional
independence assumption to hold (assume selection on observables). To assess the validity of this
assumption we test H1 using endogenous treatment effects models (control function approach,
Wooldridge 2015) and undertake direct tests of endogeneity between CMO presence and the
unobservables in our myopia models. We find no significant endogeneity (tests reported in Table 5),
suggesting IPWRA approach is preferred.7
Testing Hypotheses 2 and 3: Executive Compensation Effects
H2 predicts that executive equity compensation incentives induce myopic management. H3 predicts
that the CMO incentives have a greater association with the practice of myopic marketing
management than those of the CEO. We can assess these hypotheses by estimating models linking the
incidence and severity of myopia to the CMO and CEO equity incentives:8
(7) Incidence/ Severity Myopiait = γ0+γ1CMO Equity Incentiveit-1 +γ2CEO Equity Incentiveit-1
+β3Abnormal Accrualsit +β4Sizeit-1+β5Market-to-Bookit-1+ β6Leverageit-1
+β7Annual Stock Returnit-1 + β8Sales Volatilityit-1 + β9Competitionit-1 + τtYeart + 𝜀𝜀𝑖𝑖𝑖𝑖.
Following research on executive compensation (Armstrong et al. 2013), we measure
executives’ equity incentives one year prior to the measurement of our outcome variables (myopic
management). The lagged values for CEO and CMO Equity Incentive effectively represent the
7 In the two cases of MMRD and MMKT Severity proxies, where the endogeneity test p-values dip below .10, the estimated effects of CMO Presence from the endogenous treatment effects model are still insignificant, -.0009, p=0.749 and -.0012, p=0.651, respectively. 8 The models include all controls for myopic management discussed in the preceding section. As we later discuss in the Sensitivity Analyses section, we have also considered other controls and executives in addition to CEO and have found that our results are robust.
Marketing Science Institute Working Paper Series 26

"beginning-of-the-year" incentives to allow for these incentives to influence decisions made for that
year. Under H2, we expect the effects of equity compensation for both, the CEO and the CMO, to be
positive (i.e., to increase myopia). Furthermore, under H3 we would expect the CMO equity
incentives to have a greater impact than those of the CEOs.
Table 6 presents results of estimating model 7. We find CMO equity incentives are significantly
associated with the incidence and severity of myopia. Moreover, we find that CEO equity incentives
are unrelated to the incidence of myopia and become insignificant in the severity models (for MMRD
and for MMKT myopia proxies) when CMO equity incentives are included into the model. We
observe a consistent pattern of CMO equity incentives positively associated with the likelihood and
severity of myopia across all our proxies of myopic management. Wald tests reported in Table 6 show
that CMO equity incentives have a significantly stronger association with myopia than those of CEO
for incidence of MMRD and MMKT myopia and marginally so for incidence of advertising myopia
and all severity measures. As such, we find strong support for H2 and support for H3.
(1) Sensitivity Testing: Control Function Estimation. We undertook multiple tests to assess the
stability and validity of our findings. For example, we re-estimated model 7 with Heckman correction
(modeling the choice to issue equity to CMO in the first stage) and found our results are robust. We
also undertook tests to assess the validity of a causal interpretation for the results reported in Table 6
and tested for potential endogeneity in our models. For example, if there are some unobservable
factors affecting both, the compensation structure in the current year and the myopia in the following
year, our estimates in Table 6 could be biased. To address this concern, we undertook a control
function (CF) estimation of model 7.9
CF is closely related to instrumental variable (IV) estimation methods, but offers some
advantages. CF is a variable, such that adding it to a regression model renders an endogenous policy
9 We have also estimated model 7 using a traditional instrumental variable (IV) estimation. We used the exogenous variables CMO Equity Incentiveit-2, CEO Equity Incentiveit-2, Average CMO Equity Incentive in the Industryit-1 to create an instrument for CMO Equity Incentiveit-1. Consistent with CF results and no endogeneity, our IV estimation of model 7 generates results very similar to those reported in Table 6.
Marketing Science Institute Working Paper Series 27

variable exogenous. As a result, a model including CF “provides consistent estimation of the causal
effect of a policy variable” (Wooldridge 2015, p. 420). Wooldridge (2015) offers a thorough review
of CF methods and their use in applied econometrics. We follow Wooldridge (2015) in implementing
our CF estimation. That is, we first estimate the following reduced form regression of CMO Equity
Incentiveit-1 on a set of exogenous instruments:
(8) CMO Equity Incentiveit-1 = δ0+ δ1CMO Equity Incentiveit-2 + δ2CEO Equity Incentiveit-2
+ δ3Average CMO Equity Incentive in the Industryit-1 + τtYeart +νit-1.
The estimated residuals νit-1 become our CF and are added to model 7. In the CF approach, νit-1
is viewed as an additional explanatory variable. If CMO Equity Incentiveit-1 is endogenous (correlated
with unobservables) in model 7, we can re-write model 7 errors (𝜀𝜀𝑖𝑖𝑖𝑖) as 𝜀𝜀𝑖𝑖𝑖𝑖= ηνit-1+ eit. Then,
including νit-1 in model 7 generates a new error term eit which is uncorrelated with CMO Equity
Incentiveit-1. That is, νit-1 is proxying for the factors in CMO Equity Incentiveit-1 that are correlated
with 𝜀𝜀𝑖𝑖𝑖𝑖 and including it into the model effectively controls for the potential endogeneity in CMO
Equity Incentiveit-1. One benefit of CF over IV is that it produces a direct test of potential endogeneity
between CMO Equity Incentiveit-1 and the unobservables in model 7. Including νit-1 generates a
heteroscedasticity-robust Hausnam test of OLS versus 2SLS and CMO Equity Incentiveit-1 actually
being exogenous (H0: η=0). These heteroscedasticity-robust Hausman specification tests of OLS
versus 2SLS are reported in the last row of Table 6. In our data, we cannot reject the null that CMO
Equity Incentiveit-1 is exogenous and as such, the OLS estimates (reported in Table 6) are preferred.
(2) Alternative Models to Test Hypotheses 2 and 3: Difference-in-Differences. To offer further
evidence and support for a causal interpretation of our findings, we undertake a differences-in-
differences (DID) analyses. We exploit a quasi-natural experiment created by the enactment of
regulation FAS 123R which changed the accounting treatment of stock options: it eliminated firms’
ability to expense options at their intrinsic value and required expensing options-based compensation
at a higher “fair” value. FAS 123R created an exogenous shock to the costs of options-based
Marketing Science Institute Working Paper Series 28
compensation while leaving the underlying economic benefits unaffected (Hayes et al. 2012). The
implementation of FAS 123R in 2005 effectively increased the costs and decreased the usage of
option-based compensation. The decline in the use of stock options owing to FAS 123R for
management compensation has been well documented in the accounting and finance literature (e.g.,
Brown and Lee 2011; Hayes et al. 2012). We follow prior literature leveraging FAS 123R in DID
analysis to structure our tests (e.g., Bakke et al. 2016).
We select a balanced window of 2003 to 2007 around the 2005 enactment of FAS 123R.
Restricting our analysis to the 2003-2007 isolates the effect of FAS 123R from two other major
exogenous shocks—the implementation of the Sarbanes-Oxley Act in 2002 and the beginning of the
financial and economic crisis in 2008. We select all firms offering stock options to their CEOs prior
to 2005 and divide them into two groups based on whether the CMO received (treatment group) or
did not receive (control group) stock options prior to 2005. Our sample consists of 910 firm-year
observations, including 807 treatment and 103 control observations. Firms granting options to their
CMOs prior to 2005 reduce or eliminate option grants after the implementation of FAS 123R and
therefore reduce incentives for myopic marketing management. FAS 123R has no effect on CMO
incentives in the “no-options-for-CMO” (control) group. As such, we expect the FAS 123R to reduce
myopic practices in the treatment relative to the control group in the post-2005 period. We estimate
the following DID regression design (Angrist and Pischke 2008):
(9) Incidence/ Severity Myopiait = ϕ1CMO with Optionsit+ ϕ2Post_FAS123Rit
+ ϕ3CMO with Options*Post_FAS123Rit + κkControlskit + 𝜀𝜀𝑖𝑖𝑖𝑖,
where CMO with Optionsit takes the value of one for the treatment firms and zero for the control
group of firms, Post_FAS123Rit is equal to one for firm-years after FAS 123R implementation in
2005 and is zero otherwise, and the set of k control variables (Controlskit) includes all variables from
equation 7. The key coefficient of interest is on the interaction term (ϕ3). It represents the difference-
in-differences estimate and shows the effect of implementing regulation FAS 123R on myopic
Marketing Science Institute Working Paper Series 29
management (Post_FAS123R) for firms granting stock options compared to firms not granting options
to CMOs prior to 2005. We expect ϕ3 to be negative and significantly different from zero.
Table 7 Panel A reports our findings. In line with our expectations, ϕ3 is negative in all and is
significant in five of our six models. That is, we document a decrease in myopic marketing
management after 2005 for firms compensating their CMOs with options. Table 7 also shows
significant positive main effect of treatment (ϕ1), which is consistent with our finding in Table 6:
firms granting options to their CMOs show greater extent of myopic management.
One core assumption underlying the DID estimation is that in the absence of the treatment,
both treated and control firms would experience similar trends in the outcome variable. In other
words, if FAS 123R did not occur, our estimate of ϕ3 would equal zero. This assumption cannot be
directly tested. But we can perform a placebo test suggested by Roberts and Whited (2013): we
falsely assume that a treatment occurs at a different point in time. We maintain the same treatment
and control groups, but use years 2004 and 2007 as alternative focal points. In both placebo tests the
estimated treatment effect is statistically insignificant for all six measures of myopia. This result
supports the argument that decline in myopic marketing management in treatment firms stems from
changes due to FAS 123R in 2005 and is not due to general time trends. In sum, our DID analysis
supports our key results and causal interpretation of the link between CMO equity incentives and
myopic marketing management.
We have undertaken a similar analysis to assess the role of CEO option grants on myopic
marketing management. Unlike CMOs, almost all of the CEOs in our sample are compensated with
stock options. As such, we structure our test as follows: we identified a set of firms in the 2004-2007
period that did not grant options to CMOs or did not have a CMO in the TMT and divided it into two
groups based on whether the CEO equity incentives were above (treatment group) or below (control
group) the median equity incentives in their respective industry (defined by 2-digit SIC code) in the
pre-FAS123R period. Our sample consists of 423 firm-year observations, including 152 treatment and
Marketing Science Institute Working Paper Series 30

271 control observations. If CEO equity incentives drive marketing myopia, we would expect to see a
significant decline in in myopic practices after 2005 for our treatment firms (i.e., ϕ3 < 0 in the
equation 10 below):
(10) Incidence/ Severity Myopiait = ϕ1CEO with High Equity Incentivesit + ϕ2Post_FAS123Rit
+ ϕ3CEO with High Equity Incentivesit *Post_FAS123Rit + κkControlskit + 𝜀𝜀𝑖𝑖𝑖𝑖,
where CEO with High Equity Incentivesit takes the value of one for the treatment firms and zero for
the control group of firms, Post_FAS123Rit equals one for firm-years after FAS 123R implementation
in 2005 and is zero otherwise, and the set of k control variables (Controlskit) includes all variables
from equation 7. Again, the key coefficient of interest is on the interaction term (ϕ3).
Table 7 Panel B reports our findings. We find no significant effects in CEO DID model.
Interestingly, we also do not find significant main effect of high CEO equity incentives on our
myopic marketing measures. As a sensitivity analysis, we have replicated our DID tests with the top
and bottom 25% of the CEO equity incentive groups and found that our results are stable with
alternative definitions of treatment and control groups.
In sum, we find full support for H2 and evidence to support a causal interpretation: CMO
equity incentives drive myopic marketing managements. Further, we find support for the argument
that CMO equity incentives have a stronger association with myopia than those of CEOs. We find no
support for the arguments of the positive and anti-myopia role of equity compensation advanced in
marketing literature: equity incentives of CMOs do not reduce myopic marketing management but
rather increase its incidence and severity.
Testing Hypothesis 4: CMO personal equity trading
H4 suggests that executives will seek to exploit the opportunity and will sell more of their equity
holdings and/ or exercise more options at the time when firm valuation is artificially inflated through
myopic marketing management. A univariate analysis of our data reveals that a significantly greater
portion of exercisable options is exercised in years when myopic management takes place. Across our
Marketing Science Institute Working Paper Series 31

three incidence proxies, CMOs sell on average 23.6 percent of their exercisable options in myopic
years, versus 17.9 percent in non-myopic years. The differences for all three proxies are highly
significant (p<0.001).
We can formally test H4 by contrasting executive equity trading in myopic versus non-
myopic periods and based on the severity of myopic marketing management by estimating the
following model:
(11) CMO Equity Tradingit= 𝜒𝜒0+ 𝜒𝜒1Incidence/Severity Myopiait + 𝜒𝜒2CEO Equity Tradingit
+ 𝜒𝜒8Abnormal Accrualsit + 𝜒𝜒3Sizeit-1+ 𝜒𝜒4Market-to-Bookit-1 + 𝜒𝜒5Stock Returnit-1
+ 𝜒𝜒6Stock Return Volatilityit-1 + 𝜒𝜒7R&D Intensityit-1 + 𝜒𝜒9CMO Equity Holdingsit-1 + τtYeart + 𝜀𝜀𝑖𝑖𝑖𝑖,
where CMO Equity Tradingit is one of our equity-trading measures (options-based, Share of Options
Exercised, or share-holdings-based, Net Trading) for CMO of firm i in year t. Our estimate of interest
is 𝜒𝜒1. It captures the association between our myopia proxies and CMO trading. Under H4 we expect
CMOs to exercise a larger share of their stock options (𝜒𝜒1 >0, i.e., greater portion of exercisable
options exercised) and to sell more of their equity holding (𝜒𝜒1 <0, i.e., overall declining personal
share holdings, shares sales exceeding purchases) in years when myopia occurs and is more severe.
Our CMO trading model includes factors explaining insider trading identified in prior
research: Sizeit-1, because managers in larger firms tend to sell rather than purchase equity compared
to managers in small firms (Seyhun 1986); Market-to-Bookit-1 and Annual Stock Returnit-1, because
insiders are contrarian investors and buy (sell) stock with high (low) valuation (Jenter 2005) and with
poor (good) past performance (Lakonishok and Lee 2001); Stock Return Volatilityit-1, as greater
volatility is associated with fewer early exercises because it increases the cost of exercising options
early (Burns and Kedia 2008); R&D Intensityit-1, because R&D activities increase information
asymmetry and insiders may trade more in firms with greater R&D expenses (Aboody and Lev 2000);
CMO Equity Holdingsit-1, as executives with large prior shareholdings seek portfolio diversification
and sell more stock (Ofek and Yermack 2000); Abnormal Accrualsit, because Bergstresser and
Marketing Science Institute Working Paper Series 32
Philippon (2006) show that insiders tend to sell more of the equity they own at the time of high
discretionary accruals; and year-specific fixed effects (Yeart) to control for general economic
conditions. Importantly, we also include CEO Equity Tradingit (options-based for options model and
share-holdings-based for share trading model) equity trading by the firm i CEO in year t. CEO Equity
Tradingit is a proxy for all other common factors motivating insider trading. It captures all other
unobservable common factors driving CMO and CEO equity trading in company i in year t. We
expect 𝜒𝜒2 to be positive.
Table 8 Panel A reports results of CMO options exercise and Panel B reports results of CMO
share trading models. Consistent with H4, we find that CMOs exercise a larger portion of their
exercisable options in years when myopic marketing management takes place. We also find the
number of options CMOs exercise increases with the severity of myopic marketing management. The
estimates on our myopia proxies are positive in all six models and are significant in five of them. The
results for the MADV severity of myopic marketing management are in the hypothesized direction,
but are not significant. Our findings on the increased CMO options exercises in years when myopic
marketing management takes place are incremental to and cannot be explained by firm-specific and
environmental factors included in the model. They also cannot be explained by the unobservable
factors driving options exercises that are common to CMO and CEO. The coefficient on the CEO
option exercise is positive and highly significant in all six models reported in Panel A.
Table 8 Panel B presents results for the CMOs’ equity trading based on actual shares buying
and selling transactions data. Again, we find that in the years when myopic marketing management
takes place, CMOs sell more shares, decreasing their shareholdings. We also find that selling
increases with severity of myopic marketing management. Here again, CEO trading serves as a proxy
for common unobservable factors driving equity trading.
In sum, our findings support H4 and the proposition that CMOs seek to capitalize on inflated
equity valuations at the time when myopic marketing management takes place.
Marketing Science Institute Working Paper Series 33

SENSITIVITY ANALYSES
We undertook numerous additional analyses to assess the robustness of our results and found no
evidence to call our findings and conclusions into question. All robustness checks are available from
the authors upon request. For example, as a first step in our sensitivity analyses, we confirmed the
consistency of our sample selection with prior literature by replicating the results of Jiang et al.
(2010). Similarly to Jiang et al. (2010), we found that CFO equity incentives have a stronger
association with accounting accruals manipulations than those of the CEO. Further, we found that
CMO equity incentives are not related to the accounting accruals manipulation, suggesting, as
expected, no link between CMO equity compensation and accounting manipulation.
We examined whether different definitions and selection of CMOs in the ExecuComp database
affect our results and found our results are robust. We examined alternative model specifications. Our
research design eliminates time-invariant firm-specific (fixed) effects in our myopia proxies
(equations 1-4 remove firm-specific fixed effects). However, prior research suggests that CMO-
specific characteristics (e.g., education, age, or tenure) can affect firm outcomes. Thus, we considered
model specifications with CMO-specific fixed-effects. These models generate results fully consistent
with reported findings and a Hausman specification tests suggest no significant CMO effects in our
models.
We examined other executives and the role of their equity incentives in inducing myopic
marketing management. For example, CEOs are typically the top-top paid executive in the firm, thus,
we identified the second top-paid executive in the firm and included his/her equity incentives data
into our models.10 Our results on CMOs are robust to the inclusion of additional TMT members in the
analyses.
We have also tested the validity of our proxies for the incidence and severity of myopic
marketing management. Although prior research has endorsed the incidence measure, the severity
10 In those cases where a CMO is the second top-paid executive, we included the third top-paid executive.
Marketing Science Institute Working Paper Series 34
measure is new. The core idea of myopic management is that the inflation of earnings through myopic
practices is not sustainable and the future earnings will decline. The reason for the future
underperformance is that cuts to marketing spending are suboptimal and the inflated firm profits will
reverse in the future (Cohen and Zahowin 2010; Kothari et al. 2016). We test this proposition in our
data sample by examining the association between our six proxies for myopic management and the
change in future operating performance. We find a highly significant negative association (p < 0.01)
for all six measures of myopic management.
DISCUSSION AND CONCLUSION
Myopic management is a serious problem and a threat to firms because it entails inefficient
decision making, which leads to a decline in future firm performance (Kothari et al. 2016). We
present evidence showing that equity compensation incentives of CMOs, but not those of CEOs drive
myopic marketing management. Further, we also find that CMOs take advantage of inflated valuation
by exercising more stock options and selling more personal equity holdings in the years when myopic
management takes place and is more severe.
In contrast to a popular pessimistic view in the marketing literature questioning the ability of
CMOs to influence firm strategy, our findings suggest CMOs might have a significant influence on
marketing budgets and firm strategy. However, our study also challenges the belief in the CMO as a
central force to mitigate marketing resource misallocation and as the dominant advocate for a long-
run-focused marketing strategy. Our findings suggest that CMOs enable myopic marketing
management and seek to derive personal gain when it occurs. Our findings highlight the pitfalls and
limitations of overreliance on equity in managerial compensation packages. Equity compensation can
create perverse incentives for managers to engage in myopic practices.
What are the solutions to the myopic management problem? One of the most commonly
articulated proposals echoes Bizjak, Brickley, and Coles (1993), who suggested firms with
asymmetric information should pay their executives based on stock price performance but defer the
Marketing Science Institute Working Paper Series 35
payout until after the executive’s retirement in order to reduce the effects of equity compensation and
provide optimal investment incentives during the latter part of the CEO’s tenure. Another proposal
calls for tying executive compensation to long-run-oriented performance metrics (e.g., customer
satisfaction or brand equity). Yet another proposal advocates expanding disclosure of value-relevant
non-financial performance indicators to curtail myopic management (Mizik and Nissim, 2011; Tuli,
Skiera, and Bayer 2013).
In April 2015, the SEC issued a “pay versus performance” proposal (it has just been moved
from the 2017 SEC rulemaking agenda to the long-term action list by the new administration) to
require greater disclosure on compensation and to draw a direct link to performance
(http://www.sec.gov/news/pressrelease/2015-78.html). Under this proposal, companies would be
required to disclose the relationship between executive pay and a company’s financial performance
and report executive compensation relative to their financial performance and relative to their peer
group of firms. Will this help remedy the problem? The answer remains to be seen. At this point, all
these proposals offer interesting avenues for future research.
Marketing Science Institute Working Paper Series 36
REFERENCES Aaker, David A. (2008), “Marketing in a Silo World: The New CMO Challenge,” California Management
Review, 51 (1), 144-56. Aboody, David and Baruch Lev (2000), “Information Asymmetry, R&D, and Insider Gains,” Journal of
Finance, 55 (6), 2747–66 Aboody, David, Ron Kasznik (2000), “CEO Stock Option Awards and the Timing of Corporate Voluntary
Disclosures,” Journal or Accounting and Economics, 29 (1), 73-100. Ahearne, Michael J., Jeffrey P. Boichuk, Craig J. Chapman, and Thomas J. Steenburgh (2016), “Real
Earnings Management in Sales,” Journal of Accounting Research, 54 (5), 1233-66. Angrist, Joshua D., and Jörn-Steffen Pischke (2008), Mostly Harmless Econometrics: An Empiricist's
Companion. Princeton University Press. Armstrong, Christopher, David F. Larcker, Gaizka Ormazabal, and Daniel Taylor (2013), “The Relation
Between Equity Incentives and Misreporting: The Role of Risk-Taking Incentives," Journal of Financial Economics, 109 (2), 327-50.
Bakke, Tor-Erik, Hamed Mahmudi, Chitru S. Fernando, Jesus M. Salas (2016), “The causal effect of option pay on corporate risk management,” Journal of Financial Economics, 120 (3), 623–43
Bansal, Naresh, Kissan Joseph, Minghui Ma, and M. Babajide Wintoki (2017), “Do CMO Incentives Matter? An Empirical Investigation of CMO Compensation and Its Impact on Firm Performance,” Management Science, 63 (6), 1993-2015.
Bar-Gill, Oren and Lucian A. Bebchuk (2002), “Misreporting Corporate Performance,” Harvard Law and Economics Discussion Paper No. 400, available on SSRN: http://ssrn.com/abstract=354141
Bayer, Emmanuel, Kapil Tuli, and Bernd Skiera (2017), “Do Disclosures of Customer Metrics Lower Investors and Analysts’ Uncertainty but Hurt Firm Performance?” Journal of Marketing Research, forthcoming.
Bebchuk, Lucian A., and Jesse M. Fried (2006), “Pay without Performance: The Unfulfilled Promise of Executive Compensation,” Harvard University Press (September 30, 2006).
Benmelech, Efraim, Eugene Kandel, and Pietro Veronesi (2010), “Stock-Based Compensation and CEO (Dis) Incentives,” The Quarterly Journal of Economics, 124 (4), 1769-820.
Bereskin, Frederick L., Po-Hsuan Hsu, and Wendy Rottenberg (2018), “The Real Effects of Real Earnings Management: Evidence from Innovation,” Contemporary Accounting Research, forthcoming.
Bergstresser, Daniel, and Thomas Philippon (2006), “CEO Incentives and Earnings Management,” Journal of Financial Economics, 80 (3), 511-29.
Bizjak, John M., James A. Brickley, and Jeffrey L. Coles (1993), “Stock-Based Incentive Compensation and Investment Behavior,” Journal of Accounting and Economics, 16 (1), 349-72.
Boyd, D. Eric, Rajesh K. Chandy, and Marcus Cunha Jr. (2010), “When Do Chief Marketing Officers Affect Firm Value? A Customer Power Explanation,” Journal of Marketing Research, 47 (6), 1162 –76.
Brickley, James A., Sanjai Bhagat, and Ronald C. Lease (1985), “The Impact of Long-Range Managerial Compensation Plans on Shareholder Wealth,” Journal of Accounting and Economics, 7 (1), 115-29.
Brown, Lawrence D. and Yen-Jung Lee (2011), “Changes in Option-Based Compensation Around the Issuance of SFAS 123R,” Journal of Business Finance and Accounting, 38 (9/10), 1053-95.
Burns, Natasha and Simi Kedia (2008), “Executive Option Exercises and Financial Misreporting,” Journal of Banking and Finance, 32 (5), 845-57.
Busso, Matias, John, DiNardo, and Justin McCrary (2014), “New Evidence on the Finite Sample
Marketing Science Institute Working Paper Series 37

Properties of Propensity Score Reweighting and Matching Estimators,” Review of Economics and Statistics, 96 (5), 885-97.
Chakravarty, Anindita and Rajdeep Grewal (2011), “The Stock Market in the Driver's Seat! Implications for R&D and Marketing,” Management Science, 57 (9), 1594-609.
Chakravarty, Anindita and Rajdeep Grewal (2016), “Analyst Earning Forecasts and Advertising and R&D Budgets: Role of Agency Theoretic Monitoring and Bonding Costs,” Journal of Marketing Research, 53 (4), 580-96.
Chapman, Craig J., and Thomas J. Steenburgh (2010), “An Investigation of Earnings Management through Marketing Actions,” Management Science, 57 (1), 72–92.
Cheng, Qiang and Terry D. Warfield (2005), “Equity Incentives and Earnings Management,” The Accounting Review, 80 (2), 441-76.
Cohen, Daniel A. and Paul Zarowin (2010), “Accrual-Based and Real Earnings Management Activities Around Seasoned Equity Offerings,” Journal of Accounting and Economics, 50 (1), 2-19.
Core, John, Wayne Guay (2002), “Estimating the Value of Employee Stock Option Portfolios and their Sensitivities to Price and Volatility,” Journal of Accounting Research, 40(3), 613-30.
Court, David (2007), “The Evolving Role of the CMO,” The McKinsey Quarterly, 2007 (August), 29-39. Crocker, Keith and Joel Slemrod (2007), “The Economics of Earnings Manipulation and Managerial
Compensation,” RAND Journal of Economics, 38 (3), 698-713. Currim, Imran S., Jooseop Lim, and Joung W. Kim (2012), “You Get What You Pay For: The Effect of
Top Executives’ Compensation on Advertising and R&D Spending Decisions and Stock Market Returns,” Journal of Marketing, 76 (5), 33-48.
Dahlstrom, Peter, Chris Davis, Fabian Hieronimus and Marc Singer (2014), “The Rebirth of the CMO,” Harvard Business Review, August 5, 2014.
Dechow, Patricia M., Richard G. Sloan, and Amy P. Sweeney (1995), “Detecting Earnings Management,” The Accounting Review, 70 (2), 193-225.
DeFusco, Richard A., Robert R. Johnson and Thomas S. Zorn (1990), “The Effect of Executive Stock Option Plans on Stockholders and Bondholders,” Journal of Finance, 45 (2), 617-27.
Erickson, Merle, Michelle Hanlon, and Edward L. Maydew (2006), “Is there a Link between Executive Equity Incentives and Accounting Fraud?” Journal of Accounting Research, 44 (1), 113-43.
Feng, Hui, Neil A. Morgan, and Lopo L. Rego (2015), “Marketing Department Power and Firm Performance,” Journal of Marketing, 79 (5), 1-20.
Ferguson, Charles, Chad Beck, and Adam Bolt (2010), Inside Job. United States: Sony Pictures Classics, May 16, 2010.
Germann, Frank, Peter Ebbes, and Rajdeep Grewal (2015), “The Chief Marketing Officer Matters!” Journal of Marketing, 79 (3), 1-22.
Goldman, Eitan and Steve L. Slezak (2006), “An Equilibrium Model of Incentive Contracts in the Presence of Information Manipulation,” Journal of Financial Economics, 80 (3), 603-26.
Gordon, Brett, Florian Zettelmeyer, Neha Bhargava, Dan Chapsky (2017), “A Comparison of Approaches to Advertising Measurement: Evidence from Big Field Experiments at Facebook,” working paper, Northwestern University, September 1, 2017.
Gormley, Todd A., David A. Matsa, and Todd Milbourn (2013), “CEO Compensation and Corporate Risk: Evidence from a Natural Experiment,” Journal of Accounting and Economics, 56 (2), 79-101.
Hayes, Rachel M., Michael Lemmon, and Mingming Qiu (2012), “Stock Options and Managerial
Marketing Science Institute Working Paper Series 38

Incentives for Risk Taking: Evidence from FAS 123R,” Journal of Financial Economics, 105 (1), 174-90. Hirano, Keisuke, and Guido W. Imbens (2001), “Estimation of Causal Effects Using Propensity Score
Weighting: An Application to Data on Right Heart Catheterization,” Health Services and Outcomes Research Methodology, 2(3–4), 259–78.
Hirshleifer, David and Yoon Suh (1992), “Risk, Managerial Effort, and Project Choice,” Journal of Financial Intermediation, 2 (3), 308-45.
Homburg, Christian, Alexander Hahn, Torsten Bornemann, and Philipp Sandner (2014), “The Role of Chief Marketing Officers for Venture Capital Funding: Endowing New Ventures with Marketing Legitimacy,” Journal of Marketing Research, 51 (5), 625-44.
Imbens, Guido W. and Donald B. Rubin (2015). Causal Inference for Statistics, Social, and Biomedical Sciences: An Introduction. Cambridge University Press; 1st edition (April 6, 2015) Imbens, Guido W. and Jeffrey M. Wooldridge (2009). “Recent Developments in the Econometrics of Program Evaluation,” Journal of Economic Literature, 47(1), 5-86. Jaworski, Bernard J. (2011), “On Managerial Relevance,” Journal of Marketing, 75 (4), 211-24. Jenter, Dirk (2005), “Market Timing and Managerial Portfolio Decisions,” Journal of Finance, 60 (4),
1903-49. Jiang, John Xuefeng, Kathy R. Petroni, and Isabel Yanyan Wang (2010), “CFOs and CEOs: Who have the
Most Influence on Earnings Management?” Journal of Financial Economics, 96 (3), 513-26. Khan, Mozaffar and Hai Lu (2013), “Do Short Sellers Front-Run Insider Sales?,” The Accounting Review,
88 (5), 1743-68. Kim, Jeong-Bon, Yinghua Li, and Liandong Zhang (2011), “CFOs versus CEOs: Equity Incentives and
Crashes,” Journal of Financial Economics, 101 (3), 713-30. Kim, MinChung, D. Eric Boyd, Namwoon Kim, Cheong H. Yi (2016), “CMO equity incentive and
shareholder value: Moderating role of CMO managerial discretion,” International Journal of Research in Marketing, 33 (4), 725-38.
Kothari, S.P., Natalie Mizik and Sugata Roychowdhury (2015), “Managing for the Moment: Role of Real Activity Manipulation versus Accruals in SEO Over-Valuation,” The Accounting Review, 91 (2), 559-86.
Kurt, Didem and John Hulland (2013), “Aggressive Marketing Strategy Following Equity Offerings and Firm Value: The Role of Relative Strategic Flexibility,” Journal of Marketing, 77 (5), 57-74.
Lakonishok, Josef and Inmoo Lee (2001), “Are Insider Trades Informative?” The Review of Financial Studies, 14 (1), 79–111.
Luo, Xueming, Jan Wieseke, and Christian Homburg (2012), “Incentivizing CEOs to Build Customer- and Employee-Firm Relations for Higher Customer Satisfaction and Firm Value,” Journal of the Academy of Marketing Science, 40 (6), 745-58.
Mizik, Natalie (2010), “The Theory and Practice of Myopic Management,” Journal of Marketing Research, 47 (4), 594–611.
Mizik, Natalie and Doron Nissim (2011) “Accounting for Marketing Activities: Implications for Marketing Research and Practice,” Marketing Science Institute, Research Report No. 11-103
Moorman, Christine, Simone Wies, Natalie Mizik, and Fredrika J. Spencer (2012), “Firm Innovation and the Ratchet Effect Among Consumer Packaged Goods Firms,” Marketing Science, 31 (6), 934-51.
Murphy, Kevin J. (1999), “Executive compensation,” Handbook of Labor Economics, 3, 2485-563. Narayanan, M. P. (1985), “Managerial Incentives for Short-Term Results,” Journal of Finance, 40 (5),
1469–84.
Marketing Science Institute Working Paper Series 39
Nath, Pravin and Vijay Mahajan (2008), “Chief Marketing Officers: A Study of Their Presence in Firms’ Top Management Teams,” Journal of Marketing, 72 (1), 65-81.
Nath, Pravin and Vijay Mahajan (2011), “Marketing in the C-Suite: A Study of Chief Marketing Officer Power in Firms’ Top Management Teams,” Journal of Marketing, 75 (1), 60-77.
Neff, Jack (2010), “The CMO rock star,” Advertising Age, July 26. O’Connell, Vincent and Don O’Sullivan (2011), “The Impact of Customer Satisfaction on CEO Bonuses,”
Journal of the Academy of Marketing Science, 39 (6), 828-45. Ofek, Eli, and David Yermack (2000), “Taking Stock: Equity-Based Compensation and the Evolution of
Managerial Ownership,” Journal of Finance, 55 (3), 1367-84. Rajgopal, Shivaram and Terry Shevlin (2002), “Empirical Evidence on the Relation between Stock Option
Compensation and Risk Taking,” Journal of Accounting and Economics, 33 (2) 145-71. Roberts, Michael R., and Toni Whited (2013), “Endogeneity in Empirical Corporate Finance,” Chapter 7,
p. 493-572, in Handbook of the Economics of Finance, vol. 2, eds. Constantinides, Harris, Stulz. Elsevier.
Rossi, Peter E. (2017), “Causal Inference in Marketing Applications,” working paper, UCLA. March 20, 2017. Available at SSRN: https://ssrn.com/abstract=3035502
Roychowdhury, Sugata (2006), “Earnings Management through Real Activities Manipulation,” Journal of Accounting and Economics, 42 (3), 335–70.
Seyhun, H. Nejat (1986), “Insiders' Profits, Costs of Trading, and Market Efficiency,” Journal of Financial Economics, 16 (2), 189–212.
SpencerStuart (2011), “Average Chief Marketing Officer Tenure Hits New High: 42 Months,” Press Release, Tuesday May 24 2011, available at http://www.spencerstuart.com/about/media/65/ as of June 2, 2012.
Stein, Jeremy C. (1989), “Efficient Capital Markets, Inefficient Firms: A Model of Myopic Corporate Behavior,” The Quarterly Journal of Economics, 104 (4), 655-69.
Tavassoli, Nader T., Alina Sorescu, and Rajesh Chandy (2014), “Employee-Based Brand Equity: Why Firms with Strong Brands Pay Their Executives Less,” Journal of Marketing Research, 51 (6), 676-90.
The Economist (2004), “Business: A Better Option; Executive Compensation: How Top Pay is Changing and Might Change More.” April 15, 371 (8371), 71.
Wang, Rui, Alok R. Saboo, and Rajdeep Grewal (2015), “A Managerial Capital Perspective on Chief Marketing Officer Succession,” International Journal of Research in Marketing, 32 (2), 164–78.
Webster, Frederick E., Malter, Alan J., and Shankar Ganesan (2005), “The Decline and Dispersion of Marketing Competence,” MIT Sloan Management Review, 46 (4), 35-43.
Welch, Greg (2004), “CMO Tenure: Slowing Down the Revolving Door,” blue paper, available at http://content.spencerstuart.com/sswebsite/pdf/lib/CMO_brochureU1.pdf accessed June 2, 2012.
Wies, Simone and Christine Moorman (2015), “Going Public: How Stock Market Listing Changes Firm Innovation Behavior,” Journal of Marketing Research, 52 (5), 694-709.
Wooldridge, Jeffrey M. (2015), “Control Function Methods in Applied Econometrics,” Journal of Human Resources, 50 (2), 420-45.
Yermack, David (1997), “Good timing: CEO Stock Option Awards and Company News Announcements,” Journal of Finance, 52 (2), 449-76.
Zhang, Amy Z. (2011), “Evidence on the Trade-Off between Real Activities Manipulation and Accrual-Based Earnings Management,” The Accounting Review, 87 (2), 675-703.
Marketing Science Institute Working Paper Series 40
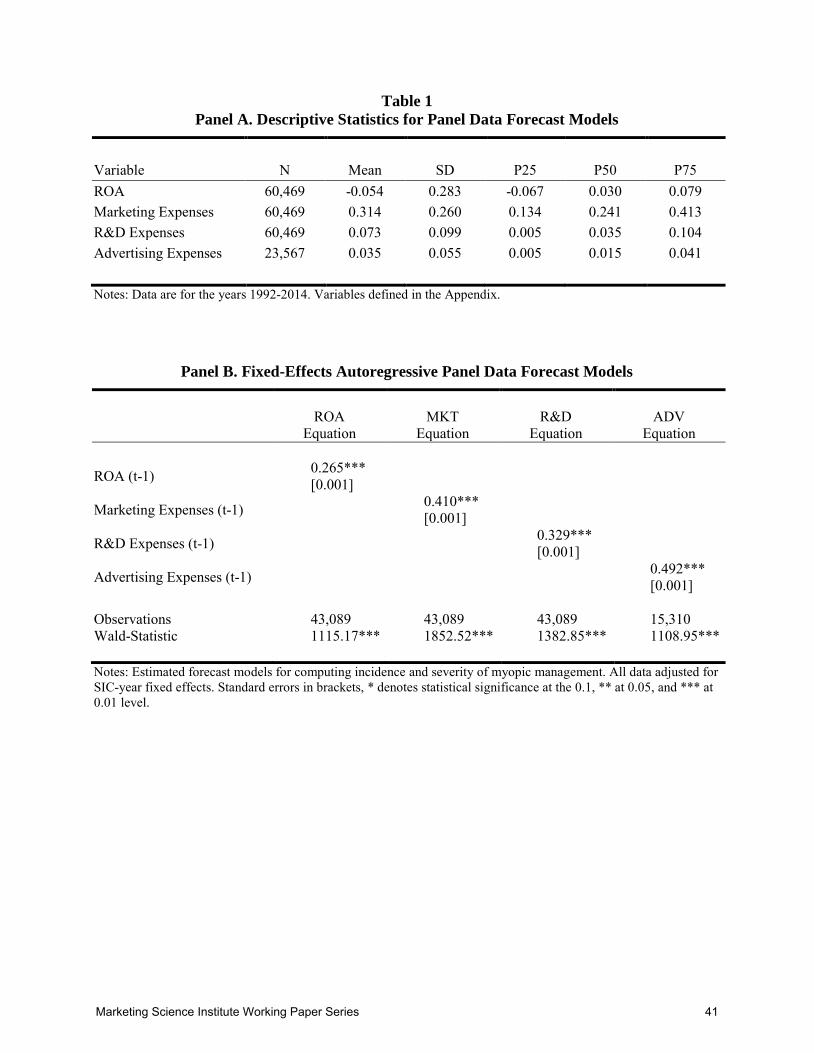
Table 1 Panel A. Descriptive Statistics for Panel Data Forecast Models
Variable N Mean SD P25 P50 P75 ROA 60,469 -0.054 0.283 -0.067 0.030 0.079 Marketing Expenses 60,469 0.314 0.260 0.134 0.241 0.413 R&D Expenses 60,469 0.073 0.099 0.005 0.035 0.104 Advertising Expenses 23,567 0.035 0.055 0.005 0.015 0.041
Notes: Data are for the years 1992-2014. Variables defined in the Appendix.
Panel B. Fixed-Effects Autoregressive Panel Data Forecast Models
ROA Equation
MKT Equation
R&D Equation
ADV Equation
ROA (t-1) 0.265*** [0.001]
Marketing Expenses (t-1) 0.410*** [0.001]
R&D Expenses (t-1) 0.329*** [0.001]
Advertising Expenses (t-1) 0.492*** [0.001]
Observations 43,089 43,089 43,089 15,310 Wald-Statistic 1115.17*** 1852.52*** 1382.85*** 1108.95***
Notes: Estimated forecast models for computing incidence and severity of myopic management. All data adjusted for SIC-year fixed effects. Standard errors in brackets, * denotes statistical significance at the 0.1, ** at 0.05, and *** at 0.01 level.
Marketing Science Institute Working Paper Series 41

Table 2 Executive Compensation and Tenure Descriptive Statistics
# Variable N Mean SD P25 P50 P75 1 CMO Presence (%) 29,418 0.377 0.485 0.000 0.000 1.000 2 CFO Presence (%) 29,418 0.859 0.348 1.000 1.000 1.000 3 COO Presence (%) 29,418 0.515 0.500 0.000 1.000 1.000 4 CEO tenure (years) 27,255 8.257 4.671 5.000 8.000 11.000 5 CMO tenure (years) 11,077 5.445 3.649 3.000 5.000 7.000 6 CFO tenure (years) 25,278 7.736 4.489 4.000 7.000 10.000 7 COO tenure (years) 15,149 6.457 4.131 3.000 6.000 9.000 8 CEO stocks and options delta ($K) 27,255 521.272 1929.858 22.824 87.015 282.709 9 CMO stocks and options delta ($K ) 11,077 24.870 65.117 0.225 5.564 21.096 10 CFO stocks and options delta ($K) 25,277 32.321 73.822 1.613 9.861 31.304 11 COO stocks and options delta ($K) 15,149 73.569 228.078 2.188 14.161 50.694 12 CEO salary ($K) 27,255 675.744 347.549 425.000 615.000 875.000 13 CMO salary ($K) 11,077 316.036 176.071 200.000 275.385 384.513 14 CFO salary ($K) 25,278 340.373 172.617 223.517 309.517 421.385 15 COO salary ($K) 15,148 386.818 220.795 238.606 340.000 498.990 16 CEO bonus ($K) 27,253 843.641 1288.852 103.488 445.000 1050.000 17 CMO bonus ($K) 11,076 237.165 341.489 40.000 128.832 291.141 18 CFO bonus ($K) 25,276 285.397 445.799 50.000 161.261 355.776 19 COO bonus ($K) 15,147 374.286 1230.292 50.000 187.000 440.000 20 CEO equity incentive (%) 27,231 0.153 0.214 0.021 0.066 0.181 21 CMO equity incentive (%) 11,077 0.035 0.063 0.001 0.012 0.040 22 CFO equity incentive (%) 25,265 0.043 0.070 0.004 0.019 0.051 23 COO equity incentive (%) 15,141 0.064 0.115 0.005 0.024 0.069 Notes: Data are for the years 1992-2014. Variables defined in the Appendix. We restrict the sample to observations where a CEO can be identified.
Marketing Science Institute Working Paper Series 42
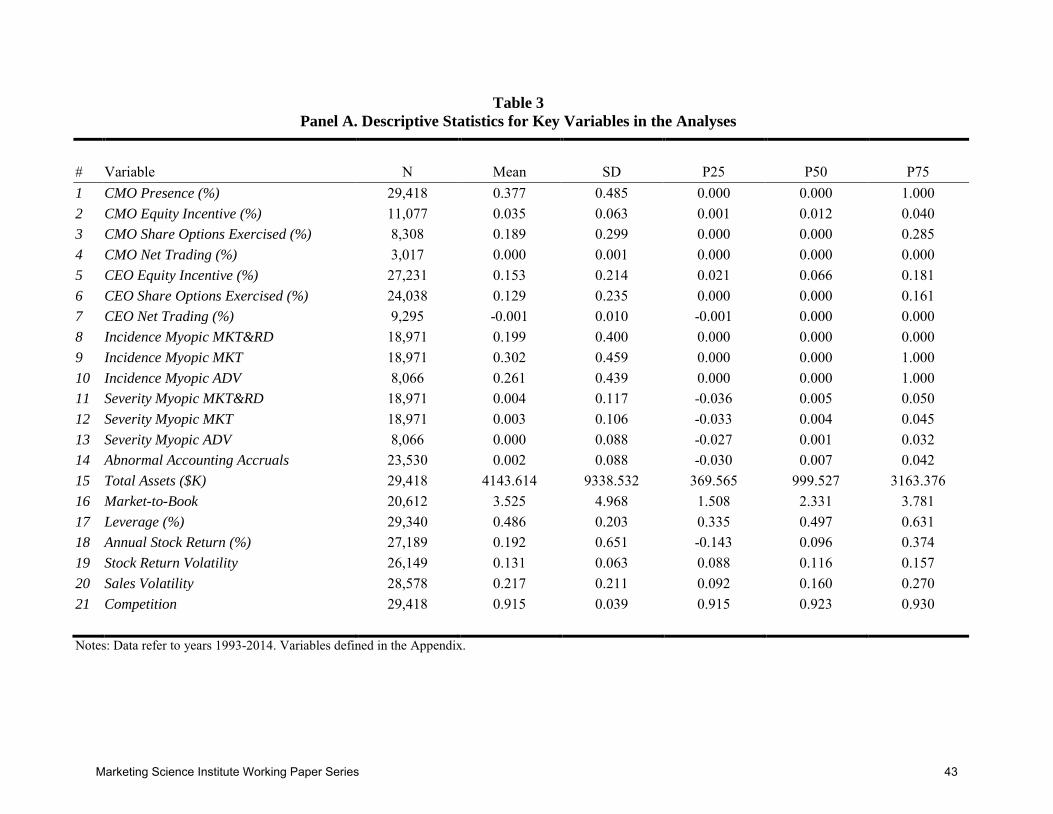
Table 3 Panel A. Descriptive Statistics for Key Variables in the Analyses
# Variable N Mean SD P25 P50 P75 1 CMO Presence (%) 29,418 0.377 0.485 0.000 0.000 1.000 2 CMO Equity Incentive (%) 11,077 0.035 0.063 0.001 0.012 0.040 3 CMO Share Options Exercised (%) 8,308 0.189 0.299 0.000 0.000 0.285 4 CMO Net Trading (%) 3,017 0.000 0.001 0.000 0.000 0.000 5 CEO Equity Incentive (%) 27,231 0.153 0.214 0.021 0.066 0.181 6 CEO Share Options Exercised (%) 24,038 0.129 0.235 0.000 0.000 0.161 7 CEO Net Trading (%) 9,295 -0.001 0.010 -0.001 0.000 0.000 8 Incidence Myopic MKT&RD 18,971 0.199 0.400 0.000 0.000 0.000 9 Incidence Myopic MKT 18,971 0.302 0.459 0.000 0.000 1.000 10 Incidence Myopic ADV 8,066 0.261 0.439 0.000 0.000 1.000 11 Severity Myopic MKT&RD 18,971 0.004 0.117 -0.036 0.005 0.050 12 Severity Myopic MKT 18,971 0.003 0.106 -0.033 0.004 0.045 13 Severity Myopic ADV 8,066 0.000 0.088 -0.027 0.001 0.032 14 Abnormal Accounting Accruals 23,530 0.002 0.088 -0.030 0.007 0.042 15 Total Assets ($K) 29,418 4143.614 9338.532 369.565 999.527 3163.376 16 Market-to-Book 20,612 3.525 4.968 1.508 2.331 3.781 17 Leverage (%) 29,340 0.486 0.203 0.335 0.497 0.631 18 Annual Stock Return (%) 27,189 0.192 0.651 -0.143 0.096 0.374 19 Stock Return Volatility 26,149 0.131 0.063 0.088 0.116 0.157 20 Sales Volatility 28,578 0.217 0.211 0.092 0.160 0.270 21 Competition 29,418 0.915 0.039 0.915 0.923 0.930 Notes: Data refer to years 1993-2014. Variables defined in the Appendix.
Marketing Science Institute Working Paper Series 43
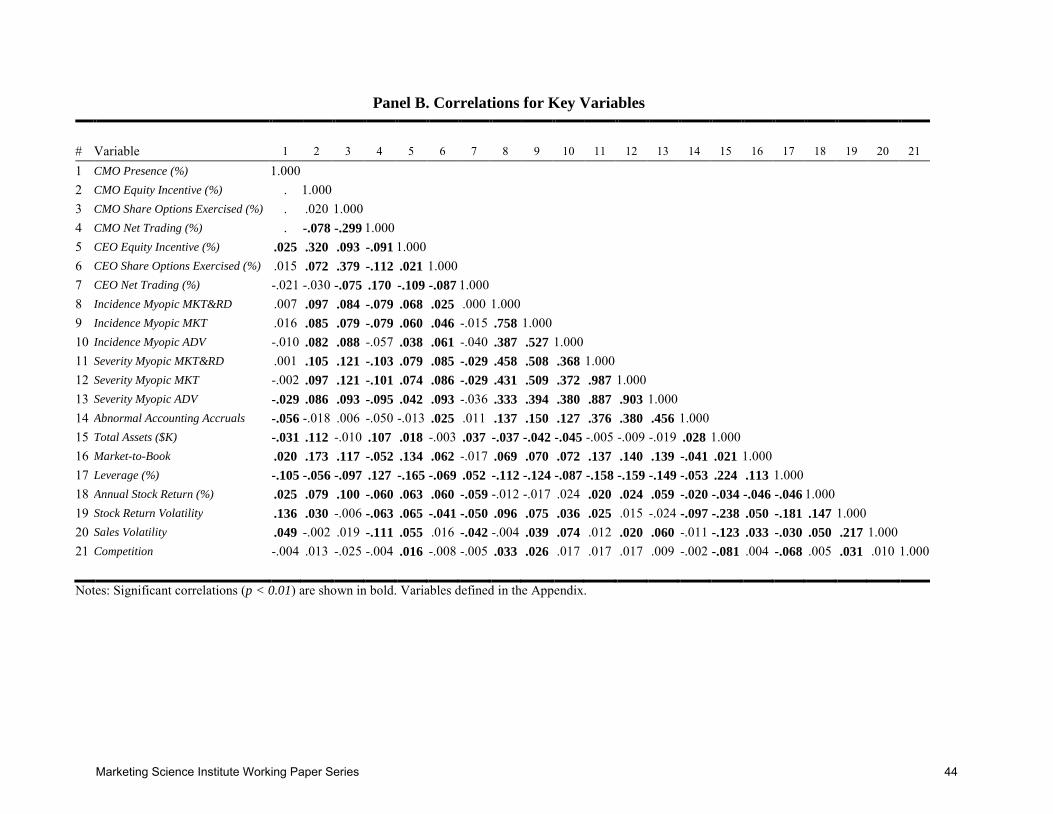
Panel B. Correlations for Key Variables
# Variable 1 2 3 4 5 6 7 8 9 10 11 12 13 14 15 16 17 18 19 20 21
1 CMO Presence (%) 1.000 2 CMO Equity Incentive (%) . 1.000 3 CMO Share Options Exercised (%) . .020 1.000 4 CMO Net Trading (%) . -.078 -.299 1.000 5 CEO Equity Incentive (%) .025 .320 .093 -.091 1.000 6 CEO Share Options Exercised (%) .015 .072 .379 -.112 .021 1.000 7 CEO Net Trading (%) -.021 -.030 -.075 .170 -.109 -.087 1.000 8 Incidence Myopic MKT&RD .007 .097 .084 -.079 .068 .025 .000 1.000 9 Incidence Myopic MKT .016 .085 .079 -.079 .060 .046 -.015 .758 1.000 10 Incidence Myopic ADV -.010 .082 .088 -.057 .038 .061 -.040 .387 .527 1.000 11 Severity Myopic MKT&RD .001 .105 .121 -.103 .079 .085 -.029 .458 .508 .368 1.000 12 Severity Myopic MKT -.002 .097 .121 -.101 .074 .086 -.029 .431 .509 .372 .987 1.000 13 Severity Myopic ADV -.029 .086 .093 -.095 .042 .093 -.036 .333 .394 .380 .887 .903 1.000 14 Abnormal Accounting Accruals -.056 -.018 .006 -.050 -.013 .025 .011 .137 .150 .127 .376 .380 .456 1.000 15 Total Assets ($K) -.031 .112 -.010 .107 .018 -.003 .037 -.037 -.042 -.045 -.005 -.009 -.019 .028 1.000 16 Market-to-Book .020 .173 .117 -.052 .134 .062 -.017 .069 .070 .072 .137 .140 .139 -.041 .021 1.000 17 Leverage (%) -.105 -.056 -.097 .127 -.165 -.069 .052 -.112 -.124 -.087 -.158 -.159 -.149 -.053 .224 .113 1.000 18 Annual Stock Return (%) .025 .079 .100 -.060 .063 .060 -.059 -.012 -.017 .024 .020 .024 .059 -.020 -.034 -.046 -.046 1.000 19 Stock Return Volatility .136 .030 -.006 -.063 .065 -.041 -.050 .096 .075 .036 .025 .015 -.024 -.097 -.238 .050 -.181 .147 1.000 20 Sales Volatility .049 -.002 .019 -.111 .055 .016 -.042 -.004 .039 .074 .012 .020 .060 -.011 -.123 .033 -.030 .050 .217 1.000 21 Competition -.004 .013 -.025 -.004 .016 -.008 -.005 .033 .026 .017 .017 .017 .009 -.002 -.081 .004 -.068 .005 .031 .010 1.000
Notes: Significant correlations (p < 0.01) are shown in bold. Variables defined in the Appendix.
Marketing Science Institute Working Paper Series 44
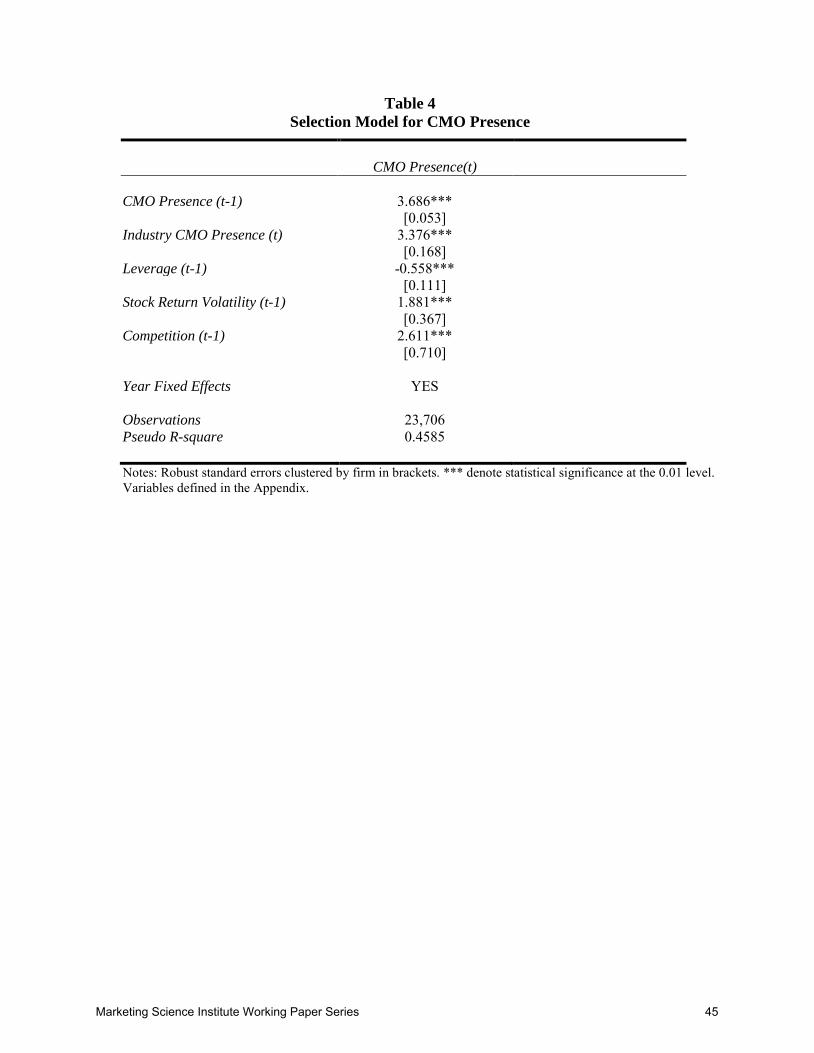
Table 4 Selection Model for CMO Presence
CMO Presence(t) CMO Presence (t-1) 3.686*** [0.053] Industry CMO Presence (t) 3.376*** [0.168] Leverage (t-1) -0.558*** [0.111] Stock Return Volatility (t-1) 1.881*** [0.367] Competition (t-1) 2.611*** [0.710] Year Fixed Effects YES Observations 23,706 Pseudo R-square 0.4585
Notes: Robust standard errors clustered by firm in brackets. *** denote statistical significance at the 0.01 level. Variables defined in the Appendix.
Marketing Science Institute Working Paper Series 45
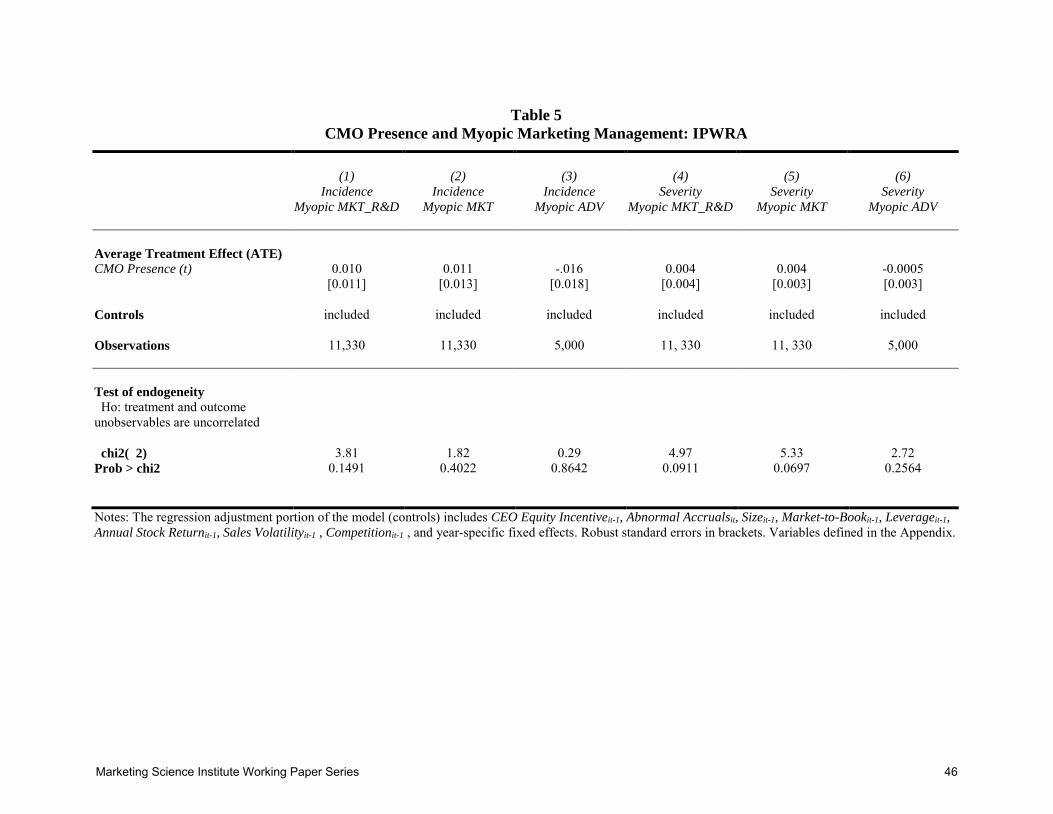
Table 5
CMO Presence and Myopic Marketing Management: IPWRA
(1) (2) (3) (4) (5) (6)
Incidence Myopic MKT_R&D
Incidence Myopic MKT
Incidence Myopic ADV
Severity Myopic MKT_R&D
Severity Myopic MKT
Severity Myopic ADV
Average Treatment Effect (ATE) CMO Presence (t) 0.010 0.011 -.016 0.004 0.004 -0.0005 [0.011] [0.013] [0.018] [0.004] [0.003] [0.003] Controls included included included included included included Observations 11,330 11,330 5,000 11, 330 11, 330 5,000 Test of endogeneity Ho: treatment and outcome unobservables are uncorrelated
chi2( 2) 3.81 1.82 0.29 4.97 5.33 2.72 Prob > chi2 0.1491 0.4022 0.8642 0.0911 0.0697 0.2564 Notes: The regression adjustment portion of the model (controls) includes CEO Equity Incentiveit-1, Abnormal Accrualsit, Sizeit-1, Market-to-Bookit-1, Leverageit-1, Annual Stock Returnit-1, Sales Volatilityit-1 , Competitionit-1 , and year-specific fixed effects. Robust standard errors in brackets. Variables defined in the Appendix.
Marketing Science Institute Working Paper Series 46

Table 6 Executive Equity Incentives and Myopic Management
Incidence Myopic MKT_R&D
Incidence Myopic MKT
Incidence Myopic ADV
Severity Myopic MKT_R&D
Severity Myopic MKT
Severity Myopic ADV
(1a) (1b) (2a) (2b) (3a) (3b) (4a) (4b) (5a) (5b) (6a) (6b) CEO Equity Incentive (t-1) 0.172 0.033 -0.008 -0.148 0.084 -0.029 0.017** 0.011 0.013* 0.008 0.006 0.003 [0.160] [0.164] [0.147] [0.150] [0.200] [0.207] [0.008] [0.008] [0.007] [0.007] [0.007] [0.007] CMO Equity Incentive (t-1) 1.639*** 1.721*** 1.422* 0.070** 0.059** 0.054** [0.561] [0.545] [0.765] [0.029] [0.026] [0.026] Abnormal Accruals (t) 5.141*** 5.158*** 5.462*** 5.470*** 3.900*** 3.883*** 0.657*** 0.658*** 0.600*** 0.600*** 0.571*** 0.570*** [0.458] [0.454] [0.418] [0.415] [0.605] [0.605] [0.042] [0.042] [0.039] [0.039] [0.051] [0.051] Size (t-1) -0.084*** -0.100*** -0.043* -0.059** -0.040 -0.054 0.005*** 0.004*** 0.004*** 0.003** -0.001 -0.001 [0.030] [0.030] [0.025] [0.025] [0.035] [0.035] [0.001] [0.001] [0.001] [0.001] [0.001] [0.001] Market-to-Book (t-1) 0.039*** 0.035*** 0.039*** 0.035*** 0.023** 0.019* 0.002*** 0.002*** 0.002*** 0.002*** 0.001 0.001 [0.008] [0.008] [0.008] [0.008] [0.010] [0.011] [0.001] [0.001] [0.001] [0.001] [0.001] [0.001] Leverage (t-1) -1.203*** -1.165*** -0.947*** -0.912*** -0.802*** -0.772*** -0.055*** -0.054*** -0.044*** -0.043*** 0.006 0.007 [0.227] [0.228] [0.189] [0.190] [0.298] [0.299] [0.009] [0.009] [0.009] [0.009] [0.010] [0.011] Annual Stock Return (t-1) 0.263*** 0.252*** 0.240*** 0.229*** 0.281*** 0.269*** 0.028*** 0.027*** 0.025*** 0.025*** 0.022*** 0.021*** [0.048] [0.049] [0.047] [0.048] [0.070] [0.071] [0.003] [0.003] [0.003] [0.003] [0.003] [0.003] Sales Volatility (t-1) -0.901*** -0.901*** 0.068 0.069 0.503** 0.502** -0.015 -0.015 -0.008 -0.007 0.006 0.005 [0.275] [0.276] [0.162] [0.162] [0.248] [0.247] [0.014] [0.014] [0.013] [0.013] [0.019] [0.019] Competition (t-1) 1.650 1.368 -0.116 -0.364 -1.792 -1.881 0.034 0.025 0.020 0.012 -0.050 -0.054 [1.595] [1.594] [1.532] [1.521] [2.339] [2.339] [0.069] [0.069] [0.067] [0.067] [0.068] [0.067] Year Fixed Effects YES YES YES YES YES YES YES YES YES YES YES YES Observations 5,135 5,135 5,135 5,135 2,625 2,625 5,135 5,135 5,135 5,135 2,625 2,625 Pseudo R2 / R2 0.115 0.116 0.0990 0.101 0.0966 0.0980 0.246 0.247 0.244 0.245 0.297 0.298 Wald test (Ho: γCMO= γCEO,) χ2(1), p-value
6.83 0.009
9.87 0.002
3.01 0.083
3.45 0.063
3.26 0.071
3.37 0.067
Heteroscedasticity-robust Hausman test of exogenety for
0.531
0.497
0.220
0.259
0.208
0.175
CMO Equity Incentive(t-1), p-value
Notes: Robust standard errors in brackets. * denotes statistical significance at the 0.1, ** at 0.05, and *** at 0.01 level. Variables defined in the Appendix.
Marketing Science Institute Working Paper Series 47

Table 7 Panel A: Difference-in-difference Estimation of CMO Equity Incentives and Myopic Management
Incidence Myopic
MKT_R&D
Incidence Myopic MKT
Incidence Myopic
ADV
Severity Myopic
MKT_R&D
Severity Myopic MKT
Severity Myopic
ADV
TREAT 0.870* 0.967** 2.044** 0.049*** 0.048** 0.047** [0.455] [0.395] [1.029] [0.019] [0.019] [0.019] POST 0.374 0.859 1.867 0.045*** 0.042*** 0.042** [0.614] [0.555] [1.150] [0.017] [0.016] [0.016]
TREAT x POST -0.679 -1.125** -2.276** -0.037** -0.034** -0.030** [0.588] [0.538] [1.135] [0.015] [0.014] [0.015]
Controls YES YES YES YES YES YES Pseudo R2 / R2 0.073 0.054 0.076 0.226 0.224 0.340 Observations 910 910 489 910 910 489
Panel B: Difference-in-difference Estimation of CEO Equity Incentives and Myopic Management
Incidence Myopic
MKT_R&D
Incidence Myopic MKT
Incidence Myopic
ADV
Severity Myopic
MKT_R&D
Severity Myopic MKT
Severity Myopic
ADV
TREAT -0.057 0.246 0.135 0.026 0.021 -0.002 [0.419] [0.401] [0.847] [0.019] [0.018] [0.017] POST -0.336 0.616 0.279 0.018 0.019 0.017 [0.487] [0.470] [1.010] [0.023] [0.021] [0.018]
TREAT x POST 0.196 -0.529 0.686 -0.030 -0.026 0.012 [0.553] [0.512] [1.081] [0.022] [0.020] [0.018]
Controls YES YES YES YES YES YES Pseudo R2 / R2 0.055 0.040 0.124 0.142 0.154 0.241 Observations 423 423 209 423 423 209
Notes: Data refer to fiscal years 2003-2007. The list of control variables includes CEO Equity Incentiveit-1, Abnormal Accrualsit, Sizeit-1, Market-to-Bookit-1, Leverageit-1, Annual Stock Returnit-1, Sales Volatilityit-1 , Competitionit-1 , and year-specific fixed effects. Robust standard errors in brackets. Variables defined in the Appendix. * denotes statistical significance at the 0.1, ** at 0.05, and *** at 0.01 level.
Marketing Science Institute Working Paper Series 48

Table 8 Panel A. Myopic Management and CMO Option Exercise
Myopic Management Proxy Incidence Myopic MKT_R&D
Incidence Myopic MKT
Incidence Myopic ADV
Severity Myopic MKT_R&D
Severity Myopic MKT
Severity Myopic ADV
Myopic Management Proxy (t) 0.042*** 0.028*** 0.036** 0.127*** 0.134*** 0.070 [0.012] [0.011] [0.017] [0.041] [0.045] [0.069] CEO Share Options Ex. (t) 0.426*** 0.426*** 0.429*** 0.424*** 0.424*** 0.430*** [0.028] [0.028] [0.036] [0.028] [0.028] [0.037]
Abnormal Accruals (t) -0.007 -0.002 -0.096 -0.059 -0.058 -0.115 [0.053] [0.054] [0.078] [0.060] [0.061] [0.090] Annual Stock Return (t-1) 0.065*** 0.066*** 0.073*** 0.064*** 0.064*** 0.074*** [0.008] [0.008] [0.012] [0.008] [0.008] [0.012] Stock Return Volatility (t-1) -0.186** -0.179** -0.248** -0.168** -0.161** -0.238** [0.078] [0.079] [0.107] [0.078] [0.078] [0.108] Market to Book (t-1) 0.004*** 0.004*** 0.004*** 0.004*** 0.004*** 0.004*** [0.001] [0.001] [0.001] [0.001] [0.001] [0.001] R&D Expenses (t-1) -0.142** -0.127** -0.068 -0.131** -0.139** -0.079 [0.062] [0.063] [0.085] [0.062] [0.063] [0.085] Market Value (t-1) 0.108 0.116 -0.412 0.091 0.101 -0.443 [0.315] [0.315] [0.324] [0.314] [0.314] [0.324] CMO Equity Holdings (t-1) -0.009 -0.015 -0.075 -0.013 -0.013 -0.069 [0.041] [0.042] [0.047] [0.042] [0.042] [0.047] Year Fixed Effects YES YES YES YES YES YES
R-squared 0.191 0.190 0.199 0.191 0.190 0.197 Observations 3,303 3,303 1,773 3,303 3,303 1,773
Notes: Notes: The dependent variable is CMO Share Options Exercised, i.e., the share of CMO’s exercisable options exercised in year t. Market Value and Equity Holdings are scaled by 1,000,000 to ease interpretation of coefficients. Robust standard errors in brackets. Variables defined in the Appendix. * denotes statistical significance at the 0.1, ** at 0.05, and *** at 0.01 level.
Marketing Science Institute Working Paper Series 49
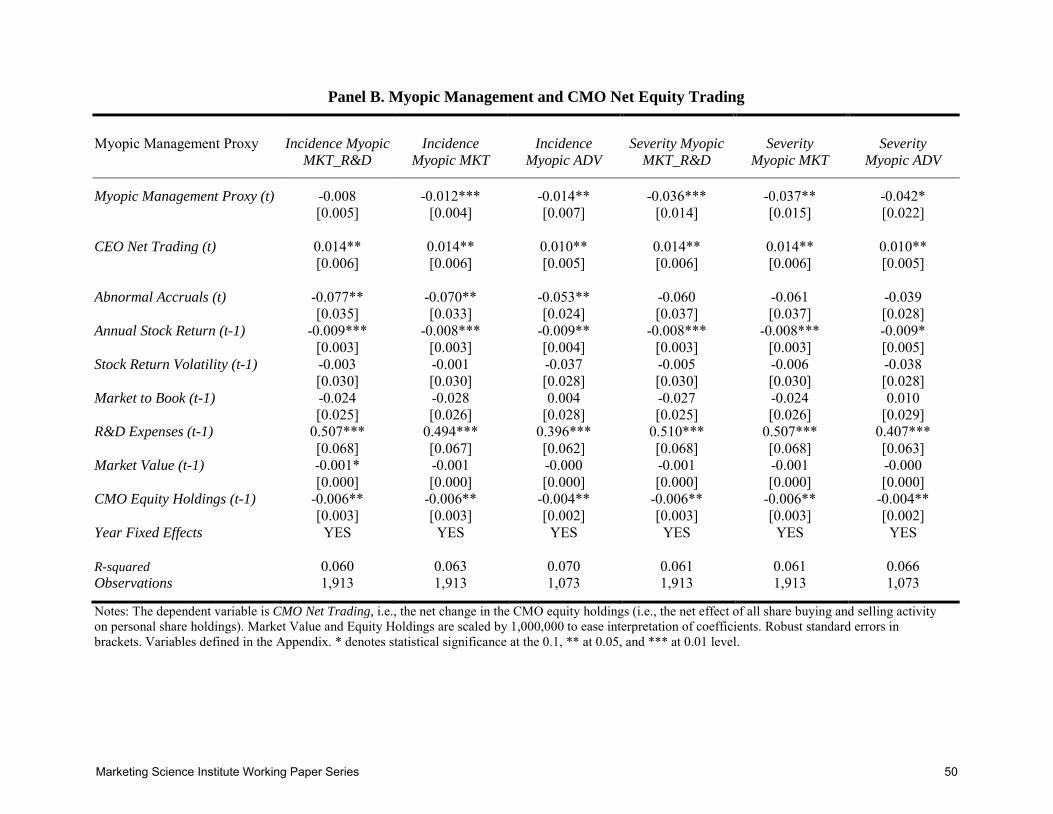
Panel B. Myopic Management and CMO Net Equity Trading
Myopic Management Proxy Incidence Myopic MKT_R&D
Incidence Myopic MKT
Incidence Myopic ADV
Severity Myopic MKT_R&D
Severity Myopic MKT
Severity Myopic ADV
Myopic Management Proxy (t) -0.008 -0.012*** -0.014** -0.036*** -0.037** -0.042* [0.005] [0.004] [0.007] [0.014] [0.015] [0.022] CEO Net Trading (t) 0.014** 0.014** 0.010** 0.014** 0.014** 0.010** [0.006] [0.006] [0.005] [0.006] [0.006] [0.005] Abnormal Accruals (t) -0.077** -0.070** -0.053** -0.060 -0.061 -0.039 [0.035] [0.033] [0.024] [0.037] [0.037] [0.028] Annual Stock Return (t-1) -0.009*** -0.008*** -0.009** -0.008*** -0.008*** -0.009* [0.003] [0.003] [0.004] [0.003] [0.003] [0.005] Stock Return Volatility (t-1) -0.003 -0.001 -0.037 -0.005 -0.006 -0.038 [0.030] [0.030] [0.028] [0.030] [0.030] [0.028] Market to Book (t-1) -0.024 -0.028 0.004 -0.027 -0.024 0.010 [0.025] [0.026] [0.028] [0.025] [0.026] [0.029] R&D Expenses (t-1) 0.507*** 0.494*** 0.396*** 0.510*** 0.507*** 0.407*** [0.068] [0.067] [0.062] [0.068] [0.068] [0.063] Market Value (t-1) -0.001* -0.001 -0.000 -0.001 -0.001 -0.000 [0.000] [0.000] [0.000] [0.000] [0.000] [0.000] CMO Equity Holdings (t-1) -0.006** -0.006** -0.004** -0.006** -0.006** -0.004** [0.003] [0.003] [0.002] [0.003] [0.003] [0.002] Year Fixed Effects YES YES YES YES YES YES R-squared 0.060 0.063 0.070 0.061 0.061 0.066 Observations 1,913 1,913 1,073 1,913 1,913 1,073
Notes: The dependent variable is CMO Net Trading, i.e., the net change in the CMO equity holdings (i.e., the net effect of all share buying and selling activity on personal share holdings). Market Value and Equity Holdings are scaled by 1,000,000 to ease interpretation of coefficients. Robust standard errors in brackets. Variables defined in the Appendix. * denotes statistical significance at the 0.1, ** at 0.05, and *** at 0.01 level.
Marketing Science Institute Working Paper Series 50
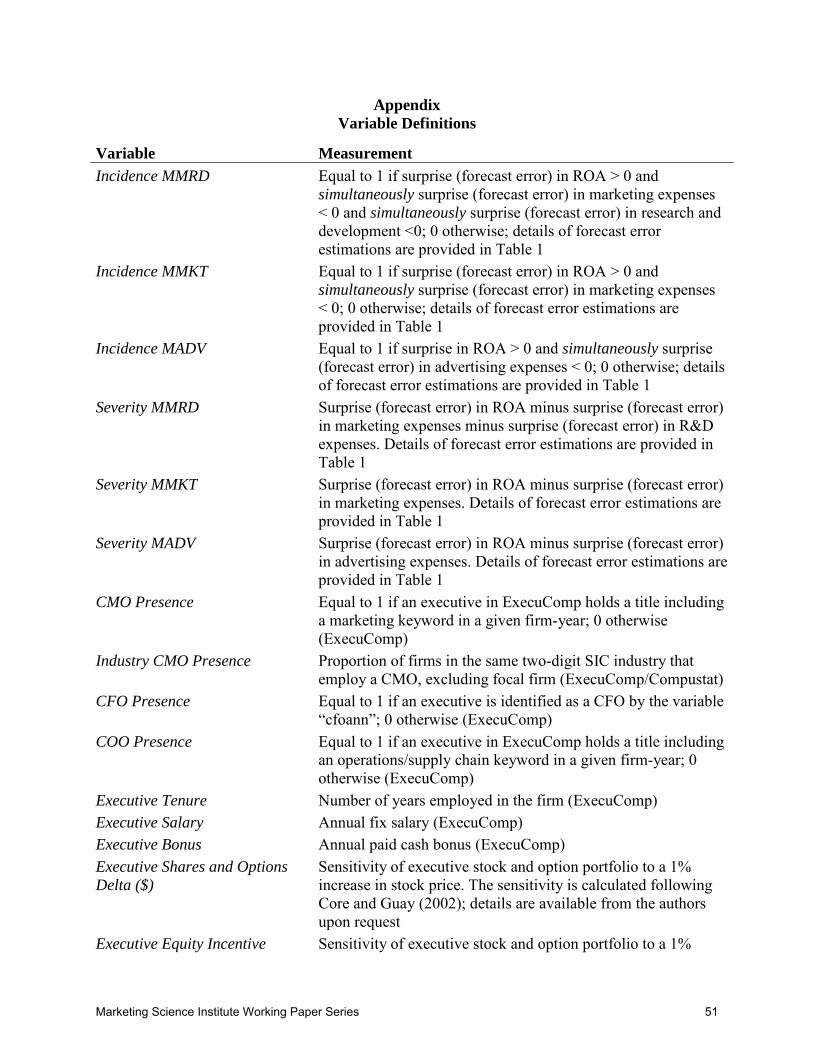
Appendix Variable Definitions
Variable Measurement Incidence MMRD Equal to 1 if surprise (forecast error) in ROA > 0 and
simultaneously surprise (forecast error) in marketing expenses < 0 and simultaneously surprise (forecast error) in research and development <0; 0 otherwise; details of forecast error estimations are provided in Table 1
Incidence MMKT Equal to 1 if surprise (forecast error) in ROA > 0 and simultaneously surprise (forecast error) in marketing expenses < 0; 0 otherwise; details of forecast error estimations are provided in Table 1
Incidence MADV Equal to 1 if surprise in ROA > 0 and simultaneously surprise (forecast error) in advertising expenses < 0; 0 otherwise; details of forecast error estimations are provided in Table 1
Severity MMRD
Surprise (forecast error) in ROA minus surprise (forecast error) in marketing expenses minus surprise (forecast error) in R&D expenses. Details of forecast error estimations are provided in Table 1
Severity MMKT
Surprise (forecast error) in ROA minus surprise (forecast error) in marketing expenses. Details of forecast error estimations are provided in Table 1
Severity MADV Surprise (forecast error) in ROA minus surprise (forecast error) in advertising expenses. Details of forecast error estimations are provided in Table 1
CMO Presence Equal to 1 if an executive in ExecuComp holds a title including a marketing keyword in a given firm-year; 0 otherwise (ExecuComp)
Industry CMO Presence
Proportion of firms in the same two-digit SIC industry that employ a CMO, excluding focal firm (ExecuComp/Compustat)
CFO Presence Equal to 1 if an executive is identified as a CFO by the variable “cfoann”; 0 otherwise (ExecuComp)
COO Presence Equal to 1 if an executive in ExecuComp holds a title including an operations/supply chain keyword in a given firm-year; 0 otherwise (ExecuComp)
Executive Tenure Number of years employed in the firm (ExecuComp) Executive Salary Annual fix salary (ExecuComp) Executive Bonus Annual paid cash bonus (ExecuComp) Executive Shares and Options Delta ($)
Sensitivity of executive stock and option portfolio to a 1% increase in stock price. The sensitivity is calculated following Core and Guay (2002); details are available from the authors upon request
Executive Equity Incentive Sensitivity of executive stock and option portfolio to a 1%
Marketing Science Institute Working Paper Series 51

increase in stock price (delta) scaled by the sum of salary, bonus, and delta
Executive Share Options Exercised (%)
Number of exercised options per year by an executive divided by the sum of exercised options and unexercised exercisable options (ExecuComp)
Executive Net Trading
Difference between the cumulative sales and purchases of equity shares in his/her own company by an executive as provided by Thomson Reuters Insider Filing Data Feed (IFDF) divided by the number of firm shares outstanding provided by CRSP
Executive Equity Holdings Number of shares an executive holds end of year (IFDF) Marketing Expenses Sales, General, and Administrative (SAG) expenses minus
R&D expenses divided by Total Assets (Compustat) R&D Expenses Research and Development expenses divided by Total Assets
(Compustat) Advertising Expenses Advertising expenses divided by Total Assets (Compustat) Annual Stock Return Buy-and-hold returns over the year (CRSP) Stock Return Volatility Standard deviation of monthly returns per firm over the last 5
years (CRSP) ROA Net Income scaled by Total Assets (Compustat) Accounting Accruals Income Before Extraordinary Items minus Net Cash Flow of
operating activities scaled by lagged Total Assets according to Dechow, Sloan, and Sweeny (1995) (Compustat)
Abnormal Accounting Accruals Accounting accruals minus accruals surprise (forecast error); surprises are estimated with the Modified Jones Model (Dechow, Sloan, and Sweeny, 1995) (Compustat)
Size Natural logarithm of Total Assets (Compustat) Market Value Market value of equity (Compustat) Market-to-Book Ratio of Market Value of Equity to Book Value of Equity
(Compustat) Leverage Total Liabilities scaled by Total Assets (Compustat) Sales Volatility Standard deviation of Revenues per firm over the last 5 years
scaled by Total Assets (Compustat) Competition One minus the Herfindahl index of Revenues per year and two-
digit SIC industry (Compustat)
Marketing Science Institute Working Paper Series 52