how informal caregivers’ health affects recipients · how informal caregivers’ health affects...
TRANSCRIPT
i
How Informal Caregivers’ Health Affects Recipients
Michio Yuda*
Associate Professor, School of Economics, Chukyo University
Jinkook Lee
Professor, School of Gerontology, University of Southern California & Senior Economist, RAND Corporation
Abstract
Informal care is increasingly important in countries undergoing population aging. Previous research
has discussed how the long-term care system may affect the behaviors of informal caregivers but
has paid little attention to how changes in caregivers’ circumstances affect those receiving their care.
Using the Japanese Study of Aging and Retirement, we empirically examine how caregivers’ health
condition may affect the elderly parents receiving their care, and find that declining caregiver health
adversely affects recipients of care. This effect is evident outside genetic influences.
Keywords: informal caregiver, elderly care receiver, health condition, long-term care, Japan
JEL Classification Number: I10, I12, J14
* Corresponding author
Address: 101-2, Yahoto-Honmachi, Showa-Ward, Nagoya, Aichi, 4668666, Japan
TEL & FAX: +81-52-835-7146
Email: [email protected]

1
How Informal Caregivers’ Health Affects Recipients
Michio Yuda
Associate Professor, School of Economics, Chukyo University
Jinkook Lee
Professor, School of Gerontology, University of Southern California & Senior Economist, RAND Corporation
1. Introduction
In recent years, informal care provision has become increasingly important in countries that
face population aging. Within a family, informal care, typically by a child for their elderly parent,
can suit the elderly’s needs in their familiar home and environment. While informal care can help
alleviate the financial burden of public-health and long-term care systems, it can burden the care
providers, worsening their physical and psychological health, hampering their labor supply, or
disrupting their leisure activities.
Previous studies on informal care tend to focus on the following four areas. First, several
studies have examined the relationship between informal and formal care provision (Pezzin et al.,

2
1996; Van Houtven and Norton, 2004 and 2008; Hanaoka and Norton, 2008; Bonsang, 2009;
Spillman and Long, 2009; Tamiya et al., 2011; Kikuchi, 2012; Paraponaris et al., 2012). They find
that informal care substitutes for formal care although the effects differ by situation. Second, much
previous research has established that providing informal care negatively affects the caregiver’s
labor supply (Carmichael and Charles, 1998 and 2003; Pezzin and Schone, 1999; Noguchi and
Shimizutani, 2004; Carmichael et al., 2010; Hassink and Van den Berg, 2011; Tamiya et al., 2011;
Otsu and Komamura, 2012; Van Houtven et al., 2013). Third, previous research has explored who
becomes a caregiver within a family (Fontaine et al., 2009; Pezzin et al., 2009), finding that
economic conditions of siblings and the relationship between children and parents significantly
affect this decision. Fourth, previous work has investigated the burden of family caregiving on
caregiver’s health condition, mainly using cross-sectional data. Two of these studies (Kishida and
Takagi, 2007, and Suzuki et al., 2008) find that caregiving adversely affects a caregiver’s health, but
Rubin and White-Means (2009) find no significant effect.
These studies show how long-term care can affect caregiver behaviors but give little
attention to how changes in caregiver’s circumstances ultimately affect those receiving care.
Informal care, can, as noted, provide several benefits to those receiving it, as well as to the finances
of long-term care systems. Yet such advantages may put burdens on caregivers and may ultimately

3
affect those receiving care. Researchers and policymakers should account for such burdens and their
effects in estimating the costs and benefits of informal care giving.
In this article, we use the Japanese Study of Aging and Retirement (JSTAR) to empirically
examine how burdens placed on caregivers may ultimately affect those receiving informal care.
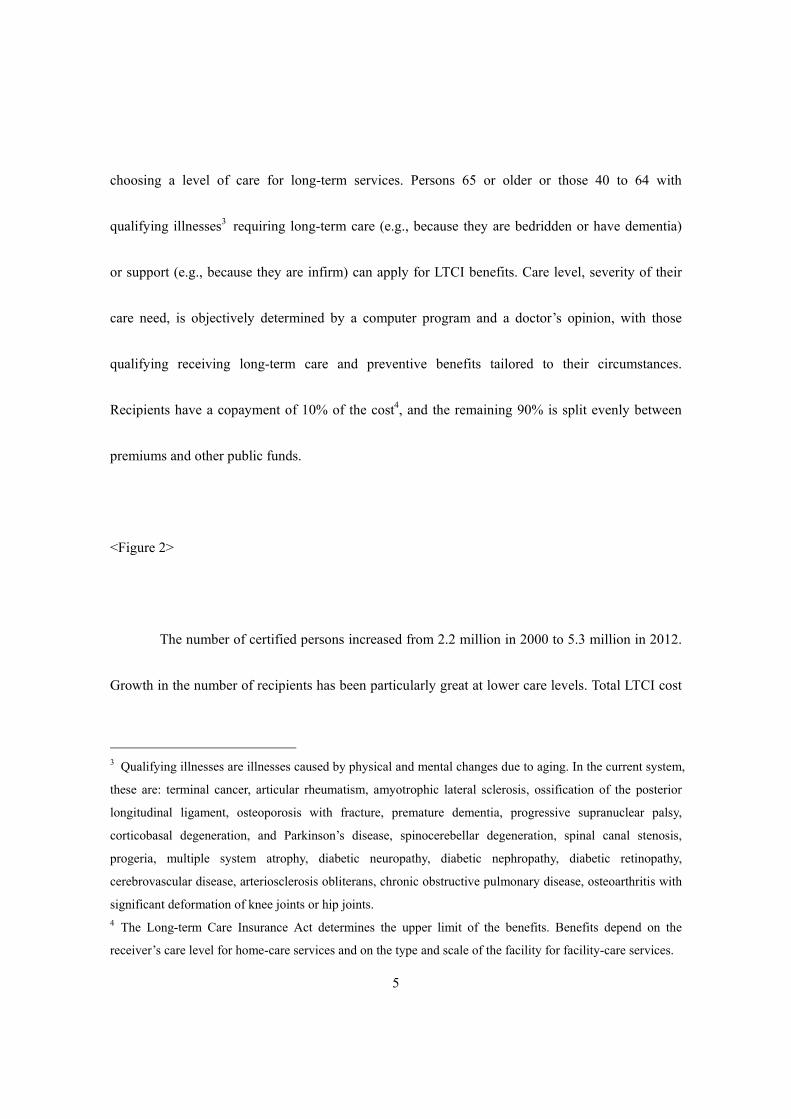
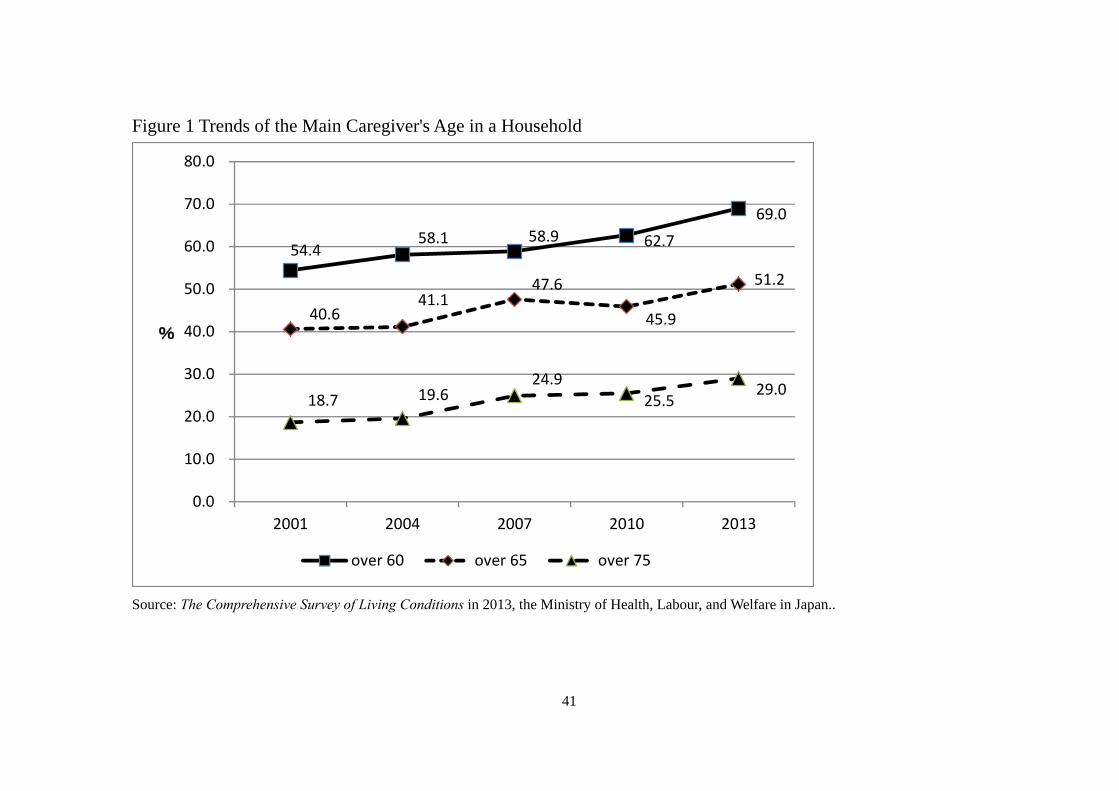
Japan is a critical setting for such research because of its rapid pace of population aging. As Figure
1 shows, the age of informal caregivers has been increasing: the proportion who are at least 60 years
of age has increased from 54.4 percent in 2001 to 69.0 percent in 2013, while the proportion of
those at least 75 years of age increased from 18.7 percent in 2001 to 29.0 percent in 2013. This
elder-to-elder nursing care may worsen caregiver’s health, with recent headlines on tragic cases of
family suicide driven by the heavy burden of caregiving.
<Figure 1>
Investigating the care-giving burden on care-givers’ health and subsequent consequences
for care recipients can illuminate a serious social issue in Japan and provide useful insights to policy
makers in other countries facing population aging. Our results indeed show that worsening health
among informal caregivers adversely affects the health of those receiving their care. We see such
4
links between informal caregivers and their in-laws, demonstrating that these effects go beyond
genetic influences.
In the next section, we provide a brief policy background with the overview of the
Japanese long-term care insurance system. In Section 3, we discuss details of the data we use. In
Sections 4 and 5, we review methods and present empirical results. In Section 6 we conclude.
2. Policy Background
Japan introduced its long-term care insurance (LTCI) system in April 2000 to support
independent living for the elderly and decrease burden on family members who provide caregiving1.
The insurer of the LTCI is each municipality2, and the prefectural and national governments also
support their finance and management. LTCI is compulsory for all persons at least 40 years of age,
who pay earnings-related premiums. The primary insured are those at least 65 years of age, and the
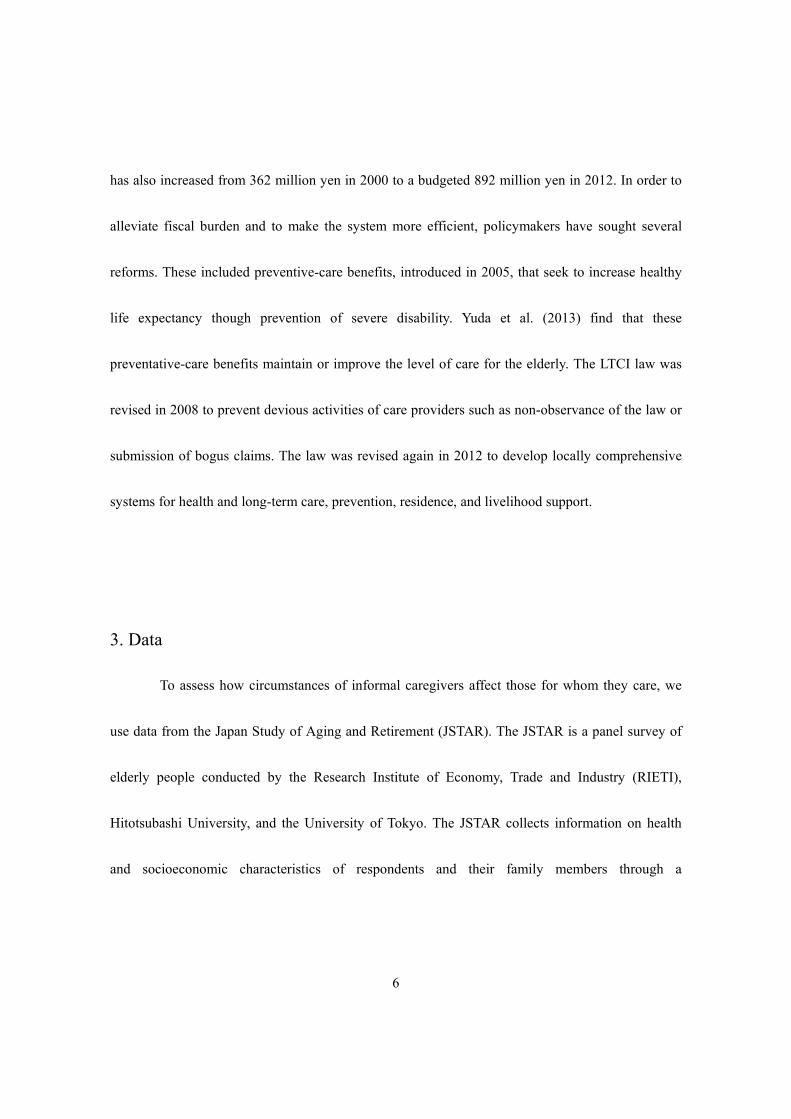
secondary insured are those 40 to 64 years of age. Figure 2 summarizes the decision process for
1 National Institute of Population and Social Security Research (2014, Ch5) reviews the Japanese LTCI
system in more detail. Tamiya et al. (2011) summarize the background of the LTCI, how it compares to
similar systems in other countries, and policy challenges in the current system. 2 Several small municipalities organize an extended association as a regional insurer for their financial
stability and administrative efficiency.
5
choosing a level of care for long-term services. Persons 65 or older or those 40 to 64 with
qualifying illnesses3 requiring long-term care (e.g., because they are bedridden or have dementia)
or support (e.g., because they are infirm) can apply for LTCI benefits. Care level, severity of their
care need, is objectively determined by a computer program and a doctor’s opinion, with those
qualifying receiving long-term care and preventive benefits tailored to their circumstances.
Recipients have a copayment of 10% of the cost4, and the remaining 90% is split evenly between
premiums and other public funds.
<Figure 2>
The number of certified persons increased from 2.2 million in 2000 to 5.3 million in 2012.
Growth in the number of recipients has been particularly great at lower care levels. Total LTCI cost
3 Qualifying illnesses are illnesses caused by physical and mental changes due to aging. In the current system,
these are: terminal cancer, articular rheumatism, amyotrophic lateral sclerosis, ossification of the posterior
longitudinal ligament, osteoporosis with fracture, premature dementia, progressive supranuclear palsy,
corticobasal degeneration, and Parkinson’s disease, spinocerebellar degeneration, spinal canal stenosis,
progeria, multiple system atrophy, diabetic neuropathy, diabetic nephropathy, diabetic retinopathy,
cerebrovascular disease, arteriosclerosis obliterans, chronic obstructive pulmonary disease, osteoarthritis with
significant deformation of knee joints or hip joints. 4 The Long-term Care Insurance Act determines the upper limit of the benefits. Benefits depend on the
receiver’s care level for home-care services and on the type and scale of the facility for facility-care services.
6
has also increased from 362 million yen in 2000 to a budgeted 892 million yen in 2012. In order to
alleviate fiscal burden and to make the system more efficient, policymakers have sought several
reforms. These included preventive-care benefits, introduced in 2005, that seek to increase healthy
life expectancy though prevention of severe disability. Yuda et al. (2013) find that these
preventative-care benefits maintain or improve the level of care for the elderly. The LTCI law was
revised in 2008 to prevent devious activities of care providers such as non-observance of the law or
submission of bogus claims. The law was revised again in 2012 to develop locally comprehensive
systems for health and long-term care, prevention, residence, and livelihood support.
3. Data
To assess how circumstances of informal caregivers affect those for whom they care, we
use data from the Japan Study of Aging and Retirement (JSTAR). The JSTAR is a panel survey of
elderly people conducted by the Research Institute of Economy, Trade and Industry (RIETI),
Hitotsubashi University, and the University of Tokyo. The JSTAR collects information on health
and socioeconomic characteristics of respondents and their family members through a

7
self-completion questionnaire and a computer-assisted personal interview5. It is comparable to other
Health and Retirement Study (HRS) family surveys, including the HRS in the United States, the
Survey of Health, Aging and Retirement in Europe (SHARE), and the English Longitudinal Study
of Aging (ELSA) in the United Kingdom6. The JSTAR sampled five municipalities in 2007, which
have been surveyed every two years since then, an additional two municipalities in 2009, and an
additional three, bringing the total to ten municipalities, in 2011. Its respondents are persons aged
50 to 75 as randomly selected from the Basic Resident Register7. The first five municipalities
include Adachi-Ku, Kanazawa City, Shirakawa City, Sendai City, and Takigawa City (N=4,163 in
2007 with 82 – 87% retention rate in the follow-up waves in 2009 and 2011). The two
municipalities added in 2009 includes Tosu City and Naha City (N=1567 in 2009 with 70%
retention rate), and the three municipalities added in 2011 includes Chofu City, Tonbayashi City,
and Hiroshima City (N=2,184). The baseline response rates for all municipalities range from
5 The RIETI provides three types of JSTAR data for analysis. These differ by security level: High (H), Very
High (VH), and Ultra High (UH). We use the Level VH JSTAR datasets. These contain the full sample
datasets with geographic information. For more detailed information on the analysis data sets and how they
differ by levels of security, see http://www.rieti.go.jp/en/projects/jstar/. 6 See Ichimura, Shimizutani, and Hashimoto (2009) as well as the more recent and detailed information is
available on the website of the GATEWAY TO GLOBAL AGING DATA (http://gateway.usc.edu). 7 This sampling method differs from those of the HRS, the SHARE, and the ELSA. The JSTAR uses its
sampling strategy so as to allow analysts to compare economic activities of individuals under the same
circumstance.
8
48.5% to 52.2%.
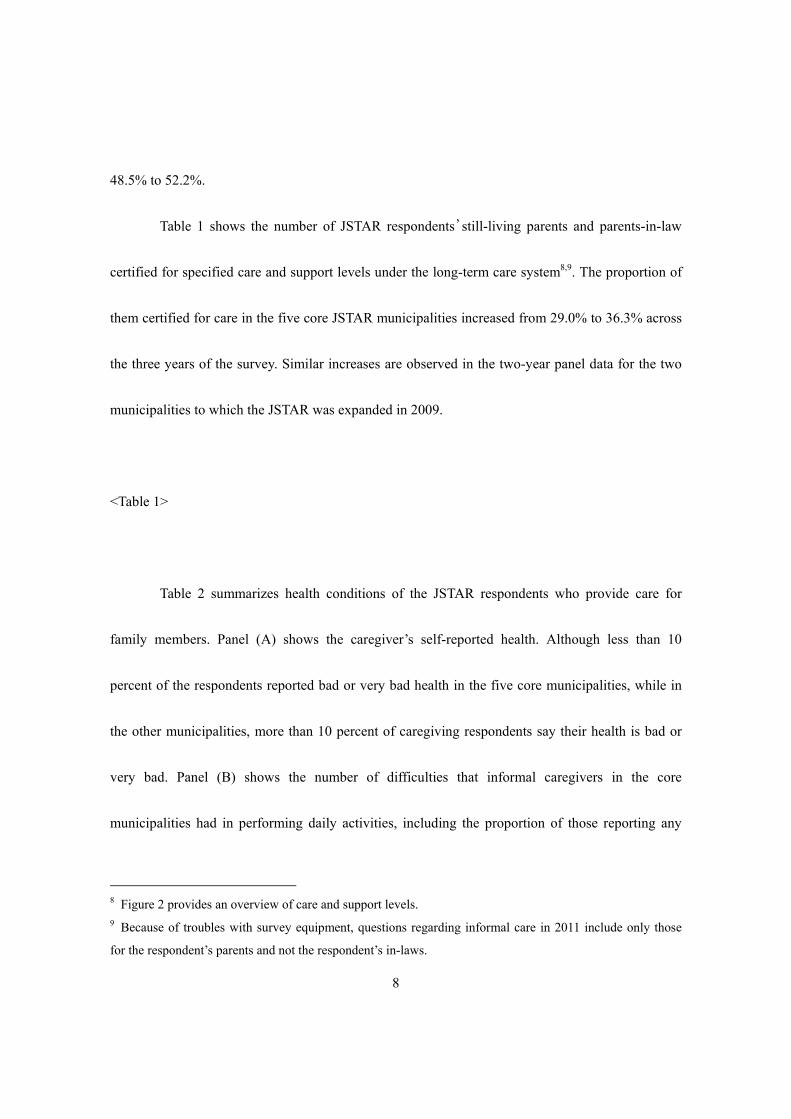
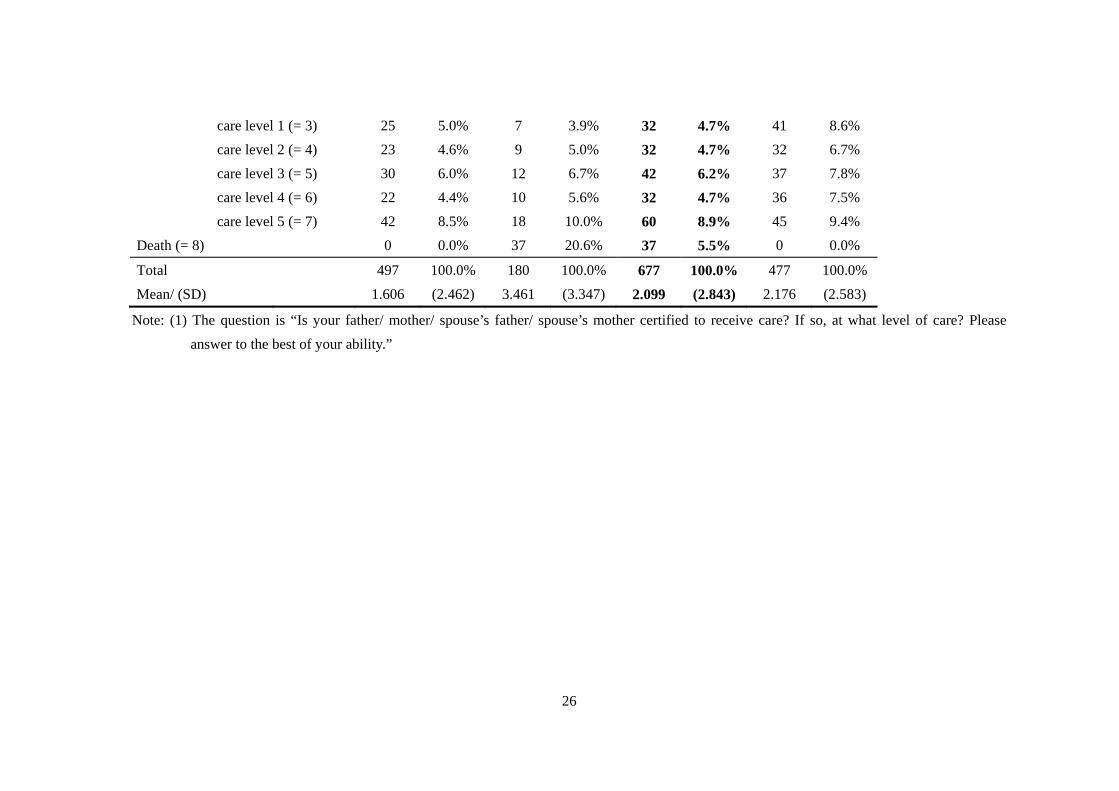
Table 1 shows the number of JSTAR respondents’still-living parents and parents-in-law
certified for specified care and support levels under the long-term care system8,9. The proportion of
them certified for care in the five core JSTAR municipalities increased from 29.0% to 36.3% across
the three years of the survey. Similar increases are observed in the two-year panel data for the two
municipalities to which the JSTAR was expanded in 2009.
<Table 1>
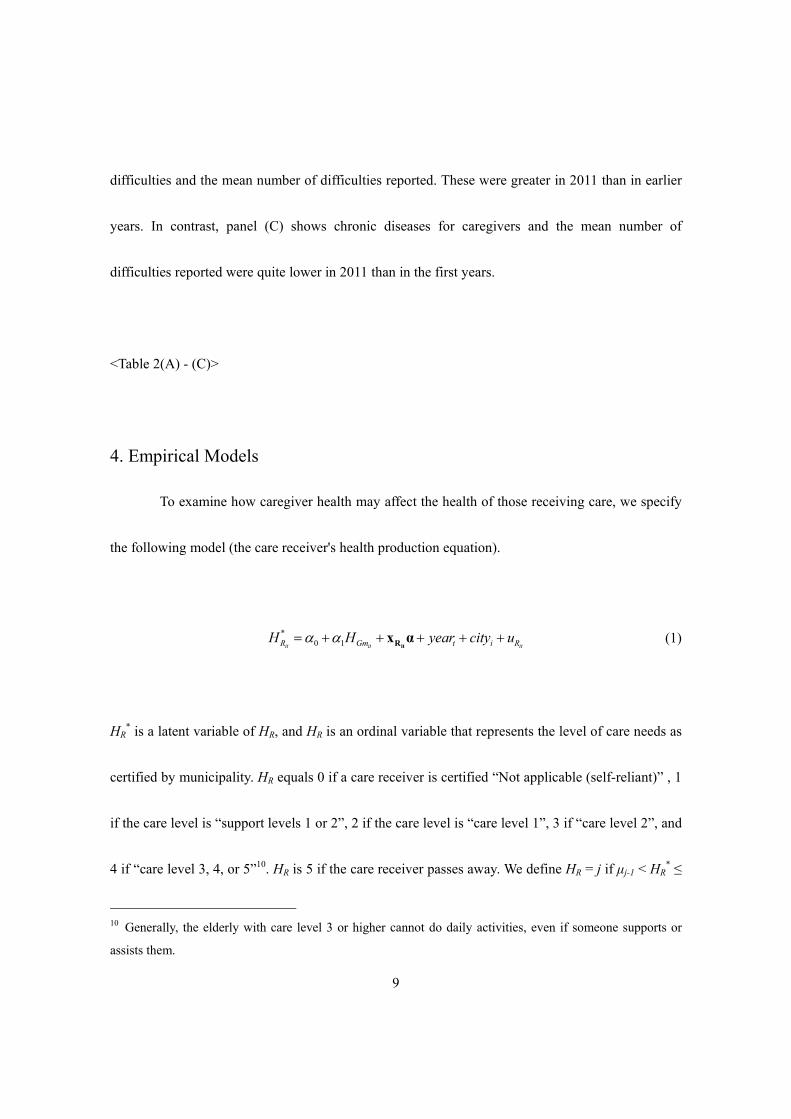
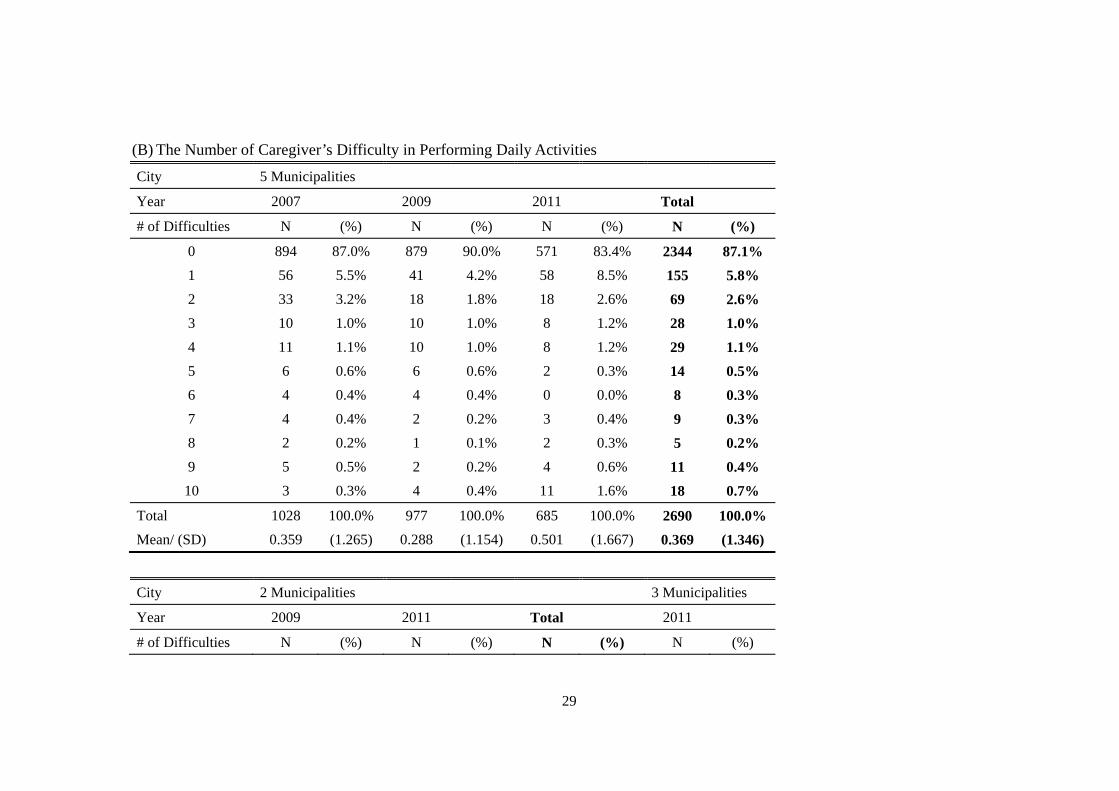
Table 2 summarizes health conditions of the JSTAR respondents who provide care for
family members. Panel (A) shows the caregiver’s self-reported health. Although less than 10
percent of the respondents reported bad or very bad health in the five core municipalities, while in
the other municipalities, more than 10 percent of caregiving respondents say their health is bad or
very bad. Panel (B) shows the number of difficulties that informal caregivers in the core
municipalities had in performing daily activities, including the proportion of those reporting any
8 Figure 2 provides an overview of care and support levels. 9 Because of troubles with survey equipment, questions regarding informal care in 2011 include only those
for the respondent’s parents and not the respondent’s in-laws.
9
difficulties and the mean number of difficulties reported. These were greater in 2011 than in earlier
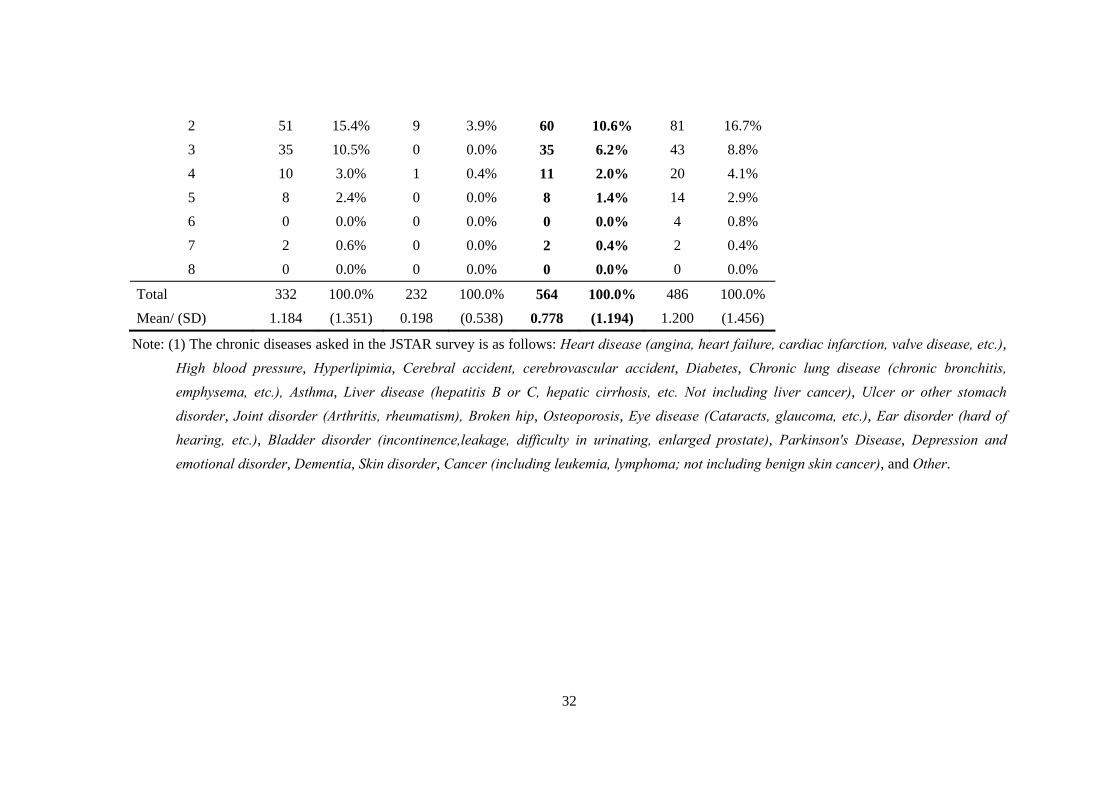
years. In contrast, panel (C) shows chronic diseases for caregivers and the mean number of
difficulties reported were quite lower in 2011 than in the first years.
<Table 2(A) - (C)>
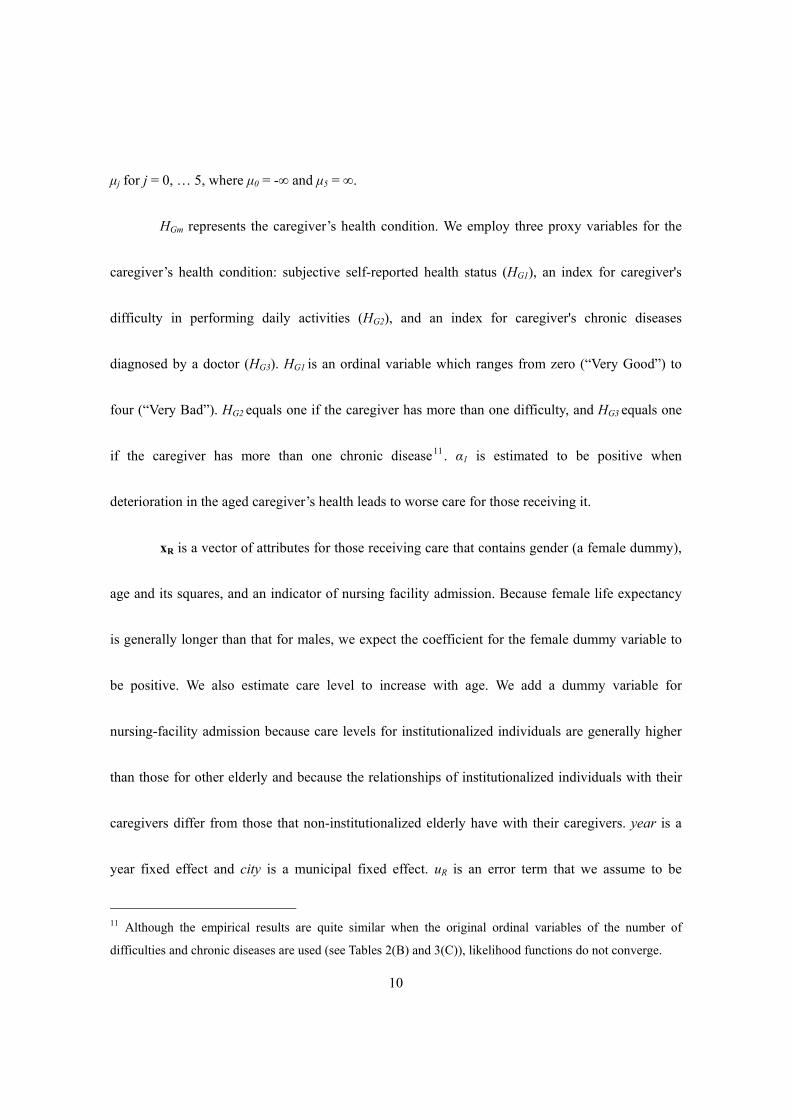
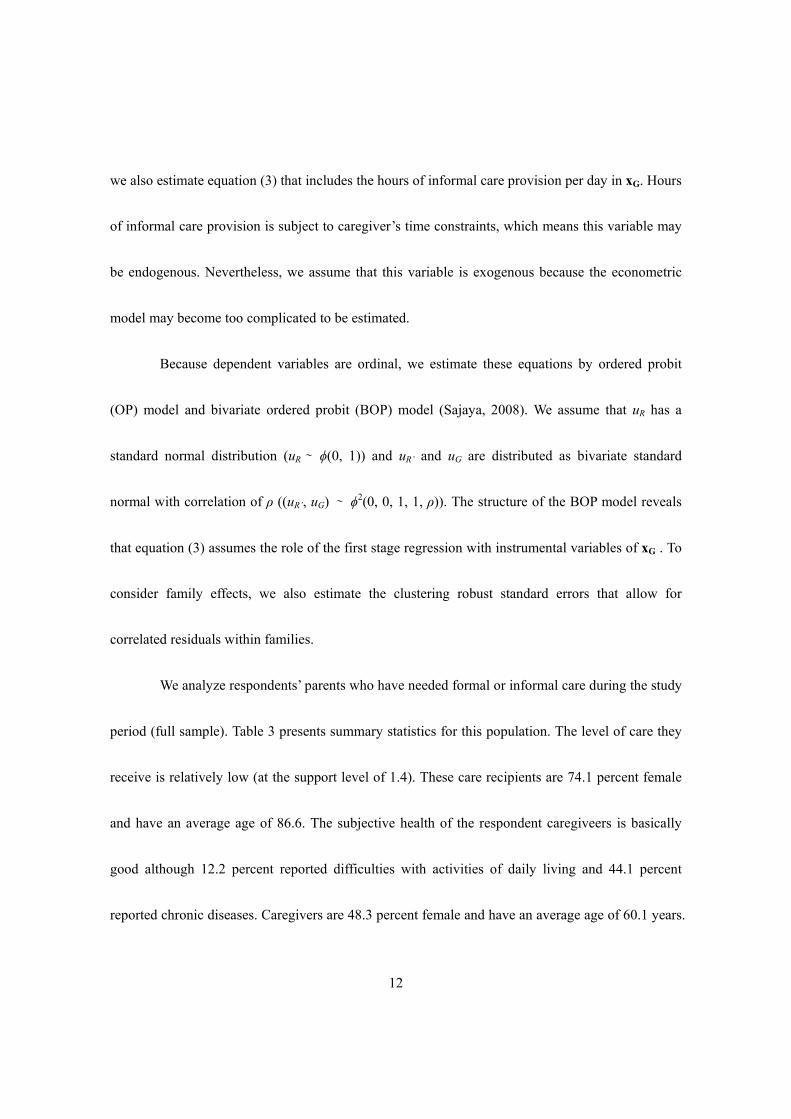
4. Empirical Models
To examine how caregiver health may affect the health of those receiving care, we specify
the following model (the care receiver's health production equation).
*0 1it it itR Gm t i RH H year city u
itRx α (1)
HR* is a latent variable of HR, and HR is an ordinal variable that represents the level of care needs as
certified by municipality. HR equals 0 if a care receiver is certified “Not applicable (self-reliant)” , 1
if the care level is “support levels 1 or 2”, 2 if the care level is “care level 1”, 3 if “care level 2”, and
4 if “care level 3, 4, or 5”10. HR is 5 if the care receiver passes away. We define HR = j if μj-1 < HR* ≤
10 Generally, the elderly with care level 3 or higher cannot do daily activities, even if someone supports or
assists them.
10
μj for j = 0, … 5, where μ0 = -∞ and μ5 = ∞.
HGm represents the caregiver’s health condition. We employ three proxy variables for the
caregiver’s health condition: subjective self-reported health status (HG1), an index for caregiver's
difficulty in performing daily activities (HG2), and an index for caregiver's chronic diseases
diagnosed by a doctor (HG3). HG1 is an ordinal variable which ranges from zero (“Very Good”) to
four (“Very Bad”). HG2 equals one if the caregiver has more than one difficulty, and HG3 equals one
if the caregiver has more than one chronic disease11. α1 is estimated to be positive when
deterioration in the aged caregiver’s health leads to worse care for those receiving it.
xR is a vector of attributes for those receiving care that contains gender (a female dummy),
age and its squares, and an indicator of nursing facility admission. Because female life expectancy
is generally longer than that for males, we expect the coefficient for the female dummy variable to
be positive. We also estimate care level to increase with age. We add a dummy variable for
nursing-facility admission because care levels for institutionalized individuals are generally higher
than those for other elderly and because the relationships of institutionalized individuals with their
caregivers differ from those that non-institutionalized elderly have with their caregivers. year is a
year fixed effect and city is a municipal fixed effect. uR is an error term that we assume to be
11 Although the empirical results are quite similar when the original ordinal variables of the number of
difficulties and chronic diseases are used (see Tables 2(B) and 3(C)), likelihood functions do not converge.

11
exogenous (i.e., E[uR|x] = 0, where x includes all regressors in equation (1)).
Because the caregiver’s health-status variables are also endogenous, estimated parameters
may be biased. To solve this endogeneity problem, we define the caregiver’s health production
equation and jointly estimate the following equations (2) and (3).
'
* *0 1it it it
R Gm t i RH H year city u
itRx α (2)
*0it itGm t i GH year city u
it itG Rx β x γ (3)
where HGm* is a latent variable of HGm, and HG1 = j if λj-1 ≤ HG1
* < λj for j = 0, …, 4 where λ0 = -∞
and λ4 = ∞, HG2 = 0 if HG2* ≤ 0 and HG2 = 1 if HG2
* > 0, and HG3 = 0 if HG3* ≤ 0 and HG3 = 1 if HG3
*
> 0. xG is a vector of caregiver attributes that contains gender (a female dummy), age and its squares,
years of education, marital status, the number of dependent minors (aged 19 and under), gross
yearly (marital) income, the amount of (marital) assets, and an index for having financial support
from another person besides one’s spouse. uR’ and uG are error terms. We assume that each error
term is exogenous (E[uR’|x] = 0 and E[uG|z] = 0, x includes all regressors in equations (2) and and z
includes all regressors in equation (3)).
Because the burden of informal care provision may adversely affect the caregiver’s health,
12
we also estimate equation (3) that includes the hours of informal care provision per day in xG. Hours
of informal care provision is subject to caregiver’s time constraints, which means this variable may
be endogenous. Nevertheless, we assume that this variable is exogenous because the econometric
model may become too complicated to be estimated.
Because dependent variables are ordinal, we estimate these equations by ordered probit
(OP) model and bivariate ordered probit (BOP) model (Sajaya, 2008). We assume that uR has a
standard normal distribution (uR ∼ ϕ(0, 1)) and uR’ and uG are distributed as bivariate standard
normal with correlation of ρ ((uR’, uG) ∼ ϕ2(0, 0, 1, 1, ρ)). The structure of the BOP model reveals
that equation (3) assumes the role of the first stage regression with instrumental variables of xG . To
consider family effects, we also estimate the clustering robust standard errors that allow for
correlated residuals within families.
We analyze respondents’ parents who have needed formal or informal care during the study
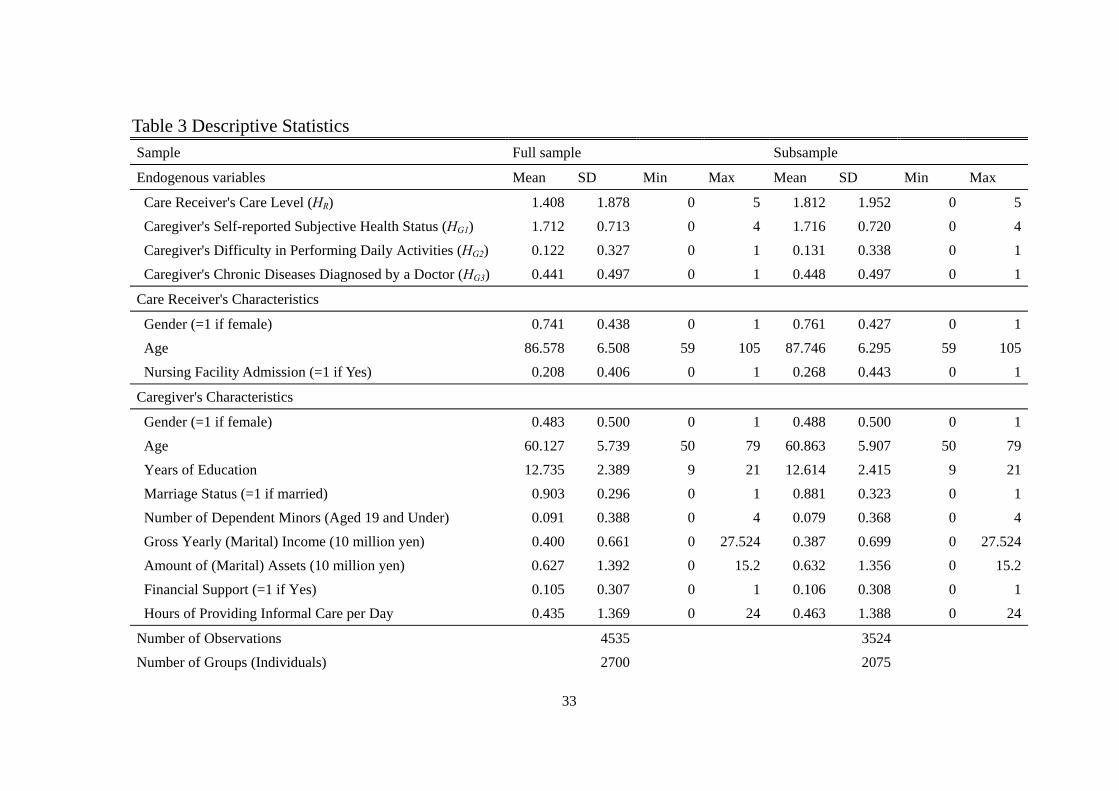
period (full sample). Table 3 presents summary statistics for this population. The level of care they
receive is relatively low (at the support level of 1.4). These care recipients are 74.1 percent female
and have an average age of 86.6. The subjective health of the respondent caregiveers is basically
good although 12.2 percent reported difficulties with activities of daily living and 44.1 percent
reported chronic diseases. Caregivers are 48.3 percent female and have an average age of 60.1 years.
13
90.3 percent of them are married, and 9 percent of them live with dependent minors. Their mean
gross yearly income is 4 million yen and their mean amount of assets is 6.27 million yen, while 10.5
percent of them receive financial support from persons other than their spouse. On average, they
provide 0.435 hours of informal care daily. Because 23.1 percent of the parents do not receive care,
we also estimated the same models above on the 76.9 percent of parents who do receive care
(subsample).
<Table 3>
5. Empirical Results
5.1 Basic Results
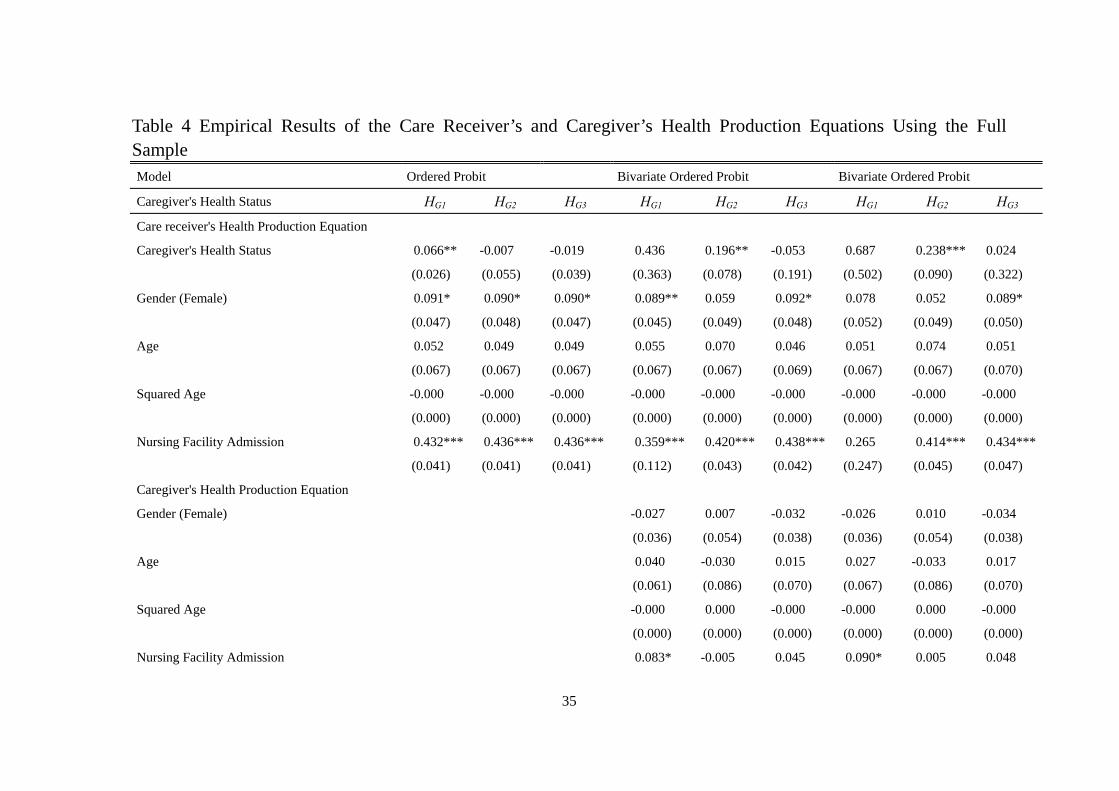
Table 4 shows the empirical results using the full sample. The results of the OP model are
summarized in the left side, those of the BOP model in the middle, and those of the BOP model
with the hours of informal care provision per day in xG in the right side12.
The results of two test statistics for the validity of the instruments suggest that they are
12 Most of results estimated by the liner probability models are closely similar to those of OP and BOP
models.
14
statistically valid (e.g., Wooldridge, 2010). More specifically, the first stage F statistics exceed 10,
while one of them is insignificant. This indicates that they have sufficient power for explaining
caregiver’s health. Regarding the overidentifying restrictions test, we cannot reject the null
hypothesis that instruments are exogenous, which indicates that the instruments are not correlated
with uR’13.
We find the caregiver’s subjective self-reported health significantly and positively affects
the recipient’s level of care in the OP model but is insignificant in the BOP models. In addition, the
recipient’s level of care significantly increases when a caregiver has difficulty in performing daily
activities in the BOP models. Because the LR tests in these models show that two error terms are
correlated, the results of these BOP models are more reliable than those of the OP models. Yet
caregiver’s chronic diseases do not have a significant effect on the recipient’s care level in the OP
and BOP models, while the coefficients of female and nursing facility admission dummy variables
are significantly positive.
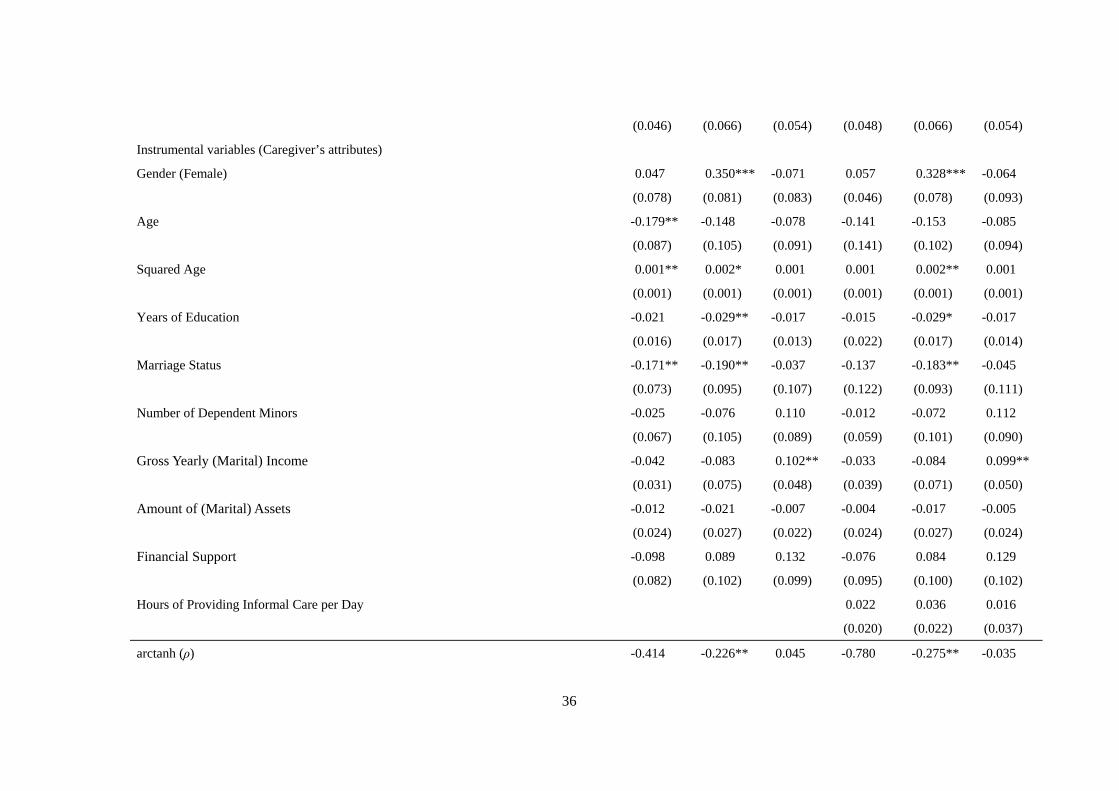
Regarding the results of the first-stage regression, we note that increasing caregiver’s age
and having a spouse have significantly positive effects on the caregiver’s subjective health status.
Although female or aged caregivers tend to have more difficulty in performing daily activities,
13 These statistics are based on the results of panel linear 2SLS estimation.
15
having more education or being married significantly decreases this probability. An increase in
gross income has a significantly positive effect on the probability of a caregiver having chronic
diseases. The coefficient of the number of dependent minors has an insignificant effect, consistent
with the results of Rubin and White-Means (2009) comparing informal care provisions between the
“sandwiched person”, who takes care of both children and parents, and other caregivers. The
coefficients of the hours of informal care provision per day are not significant, contradicting earlier
work.
<Table 4>
Table 5 shows the empirical results using the subsample. Most of the results are consistent
with those of the full sample. In particular, the results of two test statistics for the validity of the
instruments suggest that they are statistically valid.
In this subsample, too, caregiver’s subjective self-reported health significantly and
positively affects level of care for the recipient in the OP model but is insignificant in the BOP
models. In addition, in the BOP models recipient’s level of care significantly increases when a
caregiver has difficulty in performing daily activities. The LR tests in these models also show that
16
two error terms are correlated, which means that the results of these BOP model are more reliable
than those of the OP model. Chronic disease for a caregiver does not significantly affect the level of
care in the OP and BOP models. The coefficients for the dummy variable on nursing-facility
admission are significantly positive.
Regarding the results of the first stage regression, older or married caregivers tend to be in
good health. Increased assets also improve subjective health for caregivers, but greater income
increases the probability of having chronic diseases. Female or aged caregivers are also more likely
to report difficulty in performing daily activities, as does a greater number of hours providing daily
care. The number of dependent minors does not affect caregiver’s health.
<Table 5>
5.2 Exclusion of Genetic Effect
Because genes can affect health and activities (E.g., Conley, 2009; Cawley et al., 2011,
Cawley and Ruhm, 2012), the empirical results in the previous subsection may reflect that health
deterioration of both parents and adult children resulting from shared genetic characteristics. In this
subsection, we remove genetic effects from our analysis by examining the effect of caregiver’s

17
health on the health of in-laws receiving care.
Table 6 (A) shows the results using the full sample and Table 6 (B) shows the results for
the subsample. Most of the results including the tests for the validity of instruments are consistent
with those of the previous subsection. More specifically, worsening health for a caregiver adversely
affects the health of an in-law care recipient. The results using the full sample show that
deterioration of a caregiver’s self-reported health can also adversely affect health of the care
recipient in the OP and the BOP models, but other health statuses do not affect the level of care
given. In addition, the LR tests in the model of self-reported health only show that two error terms
are correlated. The results using the subsample, however, show that level of care does deteriorate
with the caregiver’s subjective self-reported health in both the OP and the BOP models. Caregiver’s
difficulty in performing daily activities does not have a significant effect on level of care in the OP
model but does in the BOP models. Chronic disease of caregivers does not have a significant effect
on the level of care in the OP model but does in the BOP models. In addition, the LR tests show that
two error terms are correlated.
<Table 6 (A) & (B)>
18
6. Concluding Remarks
In this article, we use the JSTAR to examine how informal caregivers’ health affects the
level of care provided. We find that deteriorating health for a caregiver adversely affects the health
of the recipient, and that this effect persists even among individuals who are not genetically related.
These results imply that creating circumstances that maintain middle-aged caregiver’s good
psychosomatic health conditions may also help maintain the health of care recipients. This suggests
policymakers should introduce aggressive health promotion and care prevention policies for
middle-aged people. Although some such policies have already been implemented in Japan as part
of the national health screening and intervention program in 200814, it is important to discuss and
establish more such comprehensive health policies in the future. Such policies, by ultimately
strengthening the informal care system, may also help improve LTCI finances.
Our work has some limitations. The JSTAR does not include detailed information on the
parents’ care utilization nor on expenditures for it. It also does not have information on who is the
primary caregiver nor on how much care each provider gives. Given several previous studies
14 The national health screening and intervention program targets individuals aged 40 to 74 to prevent them at
a risk of lifestyle-related diseases through focusing on metabolic syndrome. See Kohro et al., (2008) for more
detailed explanation.
19
showing that different types of long-term care services have different impacts on the health of those
receiving care, future research should identify these different sources and examine their effects. In
addition, information on use of health care by elderly parents is unavailable in JSTAR. Such
information can help identify opportunities for cooperation in health and long-term care systems.
Finally, results from the JSTAR may not be generalized because the sample is not nationally
representative. Further analyses using other, nationally representative data would help confirm our
findings.
Acknowledgment
We thank the JSTAR team of the RIETI for their support. This study was financially
supported by research fellowships of the Grant-in-Aid for Young Scientists B (No.26780180) and a
grant from the National Institute on Aging/National Institutes of Health (R01 AG030153). The
authors assume responsibility for any errors.
References
Bonsang, E. (2009) “Does informal care from children to their elderly parents substitute for formal
care in Europe?”, Journal of Health Economics, Vol.28, No.1, pp.143-154.
20
Carmichael, F. and S. Charles (1998) “The labour market costs of community care”, Journal of
Health Economics, Vol.17, No.6, pp.747-765.
Carmichael, F. and S. Charles (2003) “The opportunity costs of informal care: does gender matter?”,
Journal of Health Economics, Vol.22, No.5, pp.781-803.
Carmichael, F., S. Charles, and C. Hulme (2010) “Who will care? Employment participation and
willingness to supply informal care”, Journal of Health Economics, Vol.29, No.1, pp.182-190.
Cawley, J. and C. J. Ruhm (2012) “The economics of risky health behaviors”, in M. V. Pauly, T. G.
McGuire, P. P. Barros, ed., Handbook of Health Economics, Vol.2, North Holland: Elsevier,
pp.95-199.
Cawley, J., E. Han, E. C. Norton (2011) “The validity of genes related to neurotransmitters as
instrumental variables”, Health Economics, Vol.20, No.8, pp.884-888.
Conley, D. (2009) “The promise and challenges of incorporating genetic data into longitudinal
social science surveys and research”, Biodemography and Social Biology, Vol.55, No.2,
pp.238-251.
Fontaine, R., A. Gramain, and J. Wittwer (2009) “Providing care for an elderly parent: interactions
among siblings?”, Health Economics, Vol.18, No.9, pp.1011-1029.
Hassink, W. H.J. and B. Van den Berg (2011) “Time-bound opportunity costs of informal care:
21
Consequences for access to professional care, caregiver support, and labour supply estimates”,
Social Science and Medicine, Vol.73, No.10, pp.1508-1516.
Hanaoka, C. and E. C. Norton (2008) “Informal and formal care for elderly persons: How adult
children’s characteristics affect the use of formal care in Japan”, Social Science and Medicine,
Vol.67, No.6, pp.1002-1008.
Ichimura, H., S. Shimizutani, H. Hashimoto (2009) “JSTAR First Results 2009 Report”, RIETI
Discussion Paper Series 09-E-047, pp.1-305.
JSTAR datasets, produced by the Research Institute of Economy, Trade and Industry (RIETI),
Hitotsubashi University, and the University of Tokyo, are distributed by RIETI in Tokyo, Japan.
Kikuchi, J. (2012) “Does formal care substitute informal care?”, in T. Ihori, Y. Kaneko, and H.
Noguchi, ed., New Risks in the Social Security System: Establishment of supportive measures
over a lifetime, Tokyo: The University of Tokyo Press, pp.211-230 (in Japanese).
Kishida, K. and S. Tanigaki (2007) “What’s needed in at-home services? An analysis of family care
burden”, Japanese Journal of Health Economic and Policy, Vol.19, No.1, pp.21-35 (in Japanese
with English Abstract).
Kohro, T., Y. Furii, N. Mitustake, R. Fujii, H. Morita, S. Oku, K. Ohe, and R. Nagai (2008) “The
Japanese National Health Screening and Intervention Program Aimed at Preventing Worsening

22
of the Metabolic Syndrome”, International Heart Journal, Vol.49, No.2, pp.193-203.
National Institute of Population and Social Security Research (2014) “Welfare for the elderly”,
Social Security in Japan 2014, available at :
http://www.ipss.go.jp/s-info/e/ssj2014/PDF/ssj2014.pdf (June 20, 2014).
Noguchi, H. and S. Shimizutani (2004) Economic Analyses on the Market for Long-term Care and
Child Care Services: Solution for Current Situations and Policy Proposals by Using Micro Data,
Tokyo: Toyo Keizai Shinposha (in Japanese).
Otsu, Y. and K. Komamura (2012) “Burden of long-term care and labor supply”, in Y. Highchi, T.
Miyauchi, C. R. McKenzie, and Panel Data Research Center at Keio University, ed., Parent and
Child Relationship and Dynamism of Household Behavior: Education, Health, and Employment
under the Public-finance Crisis, Tokyo: Keio University Press, pp.143-159 (in Japanese).
Paraponaris, A., B. Davin, and P. Verger (2012) “Formal and informal care for disabled elderly
living in the community: an appraisal of French care composition and costs”, European Journal
of Health Economics, Vol.13, No.3, pp.327-336.
Pezzin, L. E., P. Kemper, and J. Reschovsky (1996) “Does publicly provided home care substitute
for family care? experimental evidence with endogenous living arrangements”, Journal of
Human Resources, Vol.31, No.3, pp.650-676.
23
Pezzin, L. E. and B. S. Schone (1999) “Intergenerational Household Formation, Female Labor
Supply and Informal Caregiving: A Bargaining Approach”, Journal of Human Resources, Vol.34,
No.3, pp.475-503.
Pezzin, L. E., R. A. Pollak, B. S. Schone (2009) “Long-term care of the disabled elderly: do
children increase caregiving by spouses?”, Review of Economics of the Household, Vol.7, No.3,
pp.323-339.
Rubin, R. M. and S. I. White-Means (2009) “Informal Caregiving: Dilemmas of Sandwiched
Caregivers”, Journal of Family and Economic Issues, Vol.30, No.3, pp.252-267.
Sajaya, Z. (2008) “Maximum likelihood estimation of a bivariate ordered probit model:
implementation and Monte Carlo simulations”, The Stata Journal, Vol.4, No.2, pp.1-18.
Spillman, B. C. and S. K. Long (2009) “Does high caregiver stress predict nursing home entry?”,
Inquiry, Vol.46, No.2, pp.140-161.
Suzuki, W., S. Ogura, and N. Izumida (2008) “Burden of family care-giving and the rationing in the
long-term care insurance benefits of Japan”, Singapore Economic Review, Vol.53, No.1,
pp.121-144.
Tamiya, N., H. Noguchi, A. Nishi, M. R. Reich, N. Ikegami, H. Hashimoto, K. Shibuya, I. Kawachi,
J. C. Campbell (2011) “Population ageing and wellbeing: lessons from Japan’s long-term care

24
insurance policy”, Lancet, Vol.378, pp.1183-1192.
The Ministry of Health, Labour, and Welfare in Japan (2013) The Current Situations and the Future
Directions of the Long-term Care Insurance System in Japan: With a Focus on the Housing for
the Elderly, available at :
http://www.mhlw.go.jp/english/policy/care-welfare/care-welfare-elderly/dl/ri_130311-01.pdf
Van Houtven, C. H. and E. C. Norton (2004) “Informal care and health care use of older adults”,
Journal of Health Economics, Vol.23, No.6, pp.1159-1180.
Van Houtven, C. H. and E. C. Norton (2008) “Informal care and medicare expenditures: testing for
heterogeneous treatment effects”, Journal of Health Economics, Vol.27, No.1, pp.134-156.
Van Houtven, C. H, N. B. Coe, and M. M. Skira (2013) “The effect of informal care on work and
wages”, Journal of Health Economics, Vol.32, No.1, pp.240-252.
Wooldridge, J. M. (2010) Econometric Analysis of Cross Section and Panel Data, Cambridge,
Massachusetts: The MIT Press.
Yuda, M., W. Suzuki, R. Morozumi, and Y. Iwamoto (2013) “The effect of introducing prevention
benefits on changes in care levels of support-level 1 care receivers”, The Quarterly of Social
Security Research, Vol.49, No.3, pp. 310-325 (in Japanese).

25
Table 1 Trends of Elderly Care Receiver’s Care Level City 5 Municipalities
Year 2007 2009 2011 Total
Care Level N (%) N (%) N (%) N (%)
Not applicable (self-reliant) (= 0) 1167 71.0% 651 52.1% 220 45.1% 2038 60.3% Certified for support level 1 (= 1) 43 2.6% 32 2.6% 11 2.3% 86 2.5%
support level 2 (= 2) 34 2.1% 40 3.2% 14 2.9% 88 2.6% care level 1 (= 3) 56 3.4% 32 2.6% 16 3.3% 104 3.1% care level 2 (= 4) 81 4.9% 59 4.7% 37 7.6% 177 5.2% care level 3 (= 5) 87 5.3% 83 6.6% 38 7.8% 208 6.2% care level 4 (= 6) 82 5.0% 74 5.9% 25 5.1% 181 5.4% care level 5 (= 7) 94 5.7% 71 5.7% 36 7.4% 201 5.9%
Death (= 8) 0 0.0% 207 16.6% 91 18.6% 298 8.8%
Total 1644 100.0% 1249 100.0% 488 100.0% 3381 100.0%Mean/ (SD) 1.331 (2.314) 2.767 (3.268) 3.186 (3.295) 2.129 (2.955)
City 2 Municipalities 3 Municipalities
Year 2009 2011 Total 2011
Care Level N (%) N (%) N (%) N (%)
Not applicable (self-reliant) (= 0) 320 64.4% 73 40.6% 393 58.1% 243 50.9% Certified for support level 1 (= 1) 15 3.0% 4 2.2% 19 2.8% 15 3.1%
support level 2 (= 2) 20 4.0% 10 5.6% 30 4.4% 28 5.9%
26
care level 1 (= 3) 25 5.0% 7 3.9% 32 4.7% 41 8.6% care level 2 (= 4) 23 4.6% 9 5.0% 32 4.7% 32 6.7% care level 3 (= 5) 30 6.0% 12 6.7% 42 6.2% 37 7.8% care level 4 (= 6) 22 4.4% 10 5.6% 32 4.7% 36 7.5% care level 5 (= 7) 42 8.5% 18 10.0% 60 8.9% 45 9.4%
Death (= 8) 0 0.0% 37 20.6% 37 5.5% 0 0.0%
Total 497 100.0% 180 100.0% 677 100.0% 477 100.0%Mean/ (SD) 1.606 (2.462) 3.461 (3.347) 2.099 (2.843) 2.176 (2.583)
Note: (1) The question is “Is your father/ mother/ spouse’s father/ spouse’s mother certified to receive care? If so, at what level of care? Please answer to the best of your ability.”

27
Table 2 The Trends of Health Conditions of the JSTAR Respondents Who Provide Care for Family Members (A) Subjective Self-reported Health Status
City 5 Municipalities
Year 2007 2009 2011 Total
Self-reported Health N (%) N (%) N (%) N (%)
Very Good (= 0) 64 6.5% 43 5.7% 20 3.0% 127 5.3% Good (= 1) 206 21.0% 228 30.2% 210 32.0% 644 26.9% Fair (= 2) 623 63.6% 437 57.8% 370 56.4% 1430 59.8% Bad (= 3) 81 8.3% 44 5.8% 53 8.1% 178 7.4% Very Bad (= 4) 5 0.5% 4 0.5% 3 0.5% 12 0.5%
Total 979 100.0% 756 100.0% 656 100.0% 2391 100.0%Mean/ (SD) 1.752 (0.717) 1.653 (0.699) 1.709 (0.676) 1.709 (0.701)
City 2 Municipalities 3 Municipalities
Year 2009 2011 Total 2011
Self-reported Health N (%) N (%) N (%) N (%)
Very Good (= 0) 25 8.7% 7 3.3% 32 6.5% 34 7.8% Good (= 1) 54 18.9% 73 34.8% 127 25.6% 97 22.2% Fair (= 2) 170 59.4% 106 50.5% 276 55.6% 262 60.0% Bad (= 3) 36 12.6% 21 10.0% 57 11.5% 41 9.4% Very Bad (= 4) 1 0.3% 3 1.4% 4 0.8% 3 0.7%
Total 286 100.0% 210 100.0% 496 100.0% 437 100.0%

28
Mean/ (SD) 1.769 (0.792) 1.714 (0.748) 1.746 (0.773) 1.730 (0.763)
Note: (1) The question is “Please select the item that most accurately describes your overall current health. (Circle only one)”.
29
(B) The Number of Caregiver’s Difficulty in Performing Daily Activities
City 5 Municipalities
Year 2007 2009 2011 Total
# of Difficulties N (%) N (%) N (%) N (%)
0 894 87.0% 879 90.0% 571 83.4% 2344 87.1% 1 56 5.5% 41 4.2% 58 8.5% 155 5.8% 2 33 3.2% 18 1.8% 18 2.6% 69 2.6% 3 10 1.0% 10 1.0% 8 1.2% 28 1.0% 4 11 1.1% 10 1.0% 8 1.2% 29 1.1% 5 6 0.6% 6 0.6% 2 0.3% 14 0.5% 6 4 0.4% 4 0.4% 0 0.0% 8 0.3% 7 4 0.4% 2 0.2% 3 0.4% 9 0.3% 8 2 0.2% 1 0.1% 2 0.3% 5 0.2% 9 5 0.5% 2 0.2% 4 0.6% 11 0.4% 10 3 0.3% 4 0.4% 11 1.6% 18 0.7%
Total 1028 100.0% 977 100.0% 685 100.0% 2690 100.0%Mean/ (SD) 0.359 (1.265) 0.288 (1.154) 0.501 (1.667) 0.369 (1.346)
City 2 Municipalities 3 Municipalities
Year 2009 2011 Total 2011
# of Difficulties N (%) N (%) N (%) N (%)

30
0 279 84.0% 197 84.9% 476 84.4% 425 87.4% 1 29 8.7% 17 7.3% 46 8.2% 22 4.5% 2 7 2.1% 5 2.2% 12 2.1% 12 2.5% 3 6 1.8% 3 1.3% 9 1.6% 11 2.3% 4 5 1.5% 2 0.9% 7 1.2% 7 1.4% 5 3 0.9% 1 0.4% 4 0.7% 1 0.2% 6 1 0.3% 2 0.9% 3 0.5% 2 0.4% 7 0 0.0% 1 0.4% 1 0.2% 0 0.0% 8 0 0.0% 1 0.4% 1 0.2% 3 0.6% 9 1 0.3% 0 0.0% 1 0.2% 2 0.4% 10 1 0.3% 3 1.3% 4 0.7% 1 0.2%
Total 332 100.0% 232 100.0% 564 100.0% 486 100.0%Mean/ (SD) 0.366 (1.152) 0.457 (1.554) 0.402 (1.331) 0.362 (1.259)
Note: (1) The difficulty in performing daily activities asked in the JSTAR survey is as follows: Walk 100 meters, Sit in a chair for two hours
continuously, Get up from a chair after sitting continuously for a long time, Climb up several flights of stairs without using the handrail, Climb up one flight of stairs without using the handrail, Squat or kneel, Raise your hands above your shoulders, Push or pull a large object
such as a living-room chair or sofa, Lift and carry an object weighing 5kg or more, such as a bag of rice, and Pick up a small object such as
a one-yen coin from a desktop with your fingers.

31
(C) The Number of Caregiver’s Chronic Diseases Diagnosed by a Doctor
City 5 Municipalities
Year 2007 2009 2011 Total
# of Diseases N (%) N (%) N (%) N (%)
0 369 35.9% 782 80.0% 545 79.6% 1696 63.0% 1 331 32.2% 151 15.5% 108 15.8% 590 21.9% 2 190 18.5% 35 3.6% 24 3.5% 249 9.3% 3 80 7.8% 7 0.7% 5 0.7% 92 3.4% 4 42 4.1% 1 0.1% 3 0.4% 46 1.7% 5 9 0.9% 0 0.0% 0 0.0% 9 0.3% 6 6 0.6% 1 0.1% 0 0.0% 7 0.3% 7 0 0.0% 0 0.0% 0 0.0% 0 0.0% 8 1 0.1% 0 0.0% 0 0.0% 1 0.0%
Total 1028 100.0% 977 100.0% 685 100.0% 2690 100.0%Mean/ (SD) 1.175 (1.236) 0.258 (0.591) 0.267 (0.602) 0.611 (1.000)
City 2 Municipalities 3 Municipalities
Year 2009 2011 Total 2011
# of diseases N (%) N (%) N (%) N (%)
0 134 40.4% 198 85.3% 332 58.9% 218 44.9% 1 92 27.7% 24 10.3% 116 20.6% 104 21.4%
32
2 51 15.4% 9 3.9% 60 10.6% 81 16.7% 3 35 10.5% 0 0.0% 35 6.2% 43 8.8% 4 10 3.0% 1 0.4% 11 2.0% 20 4.1% 5 8 2.4% 0 0.0% 8 1.4% 14 2.9% 6 0 0.0% 0 0.0% 0 0.0% 4 0.8% 7 2 0.6% 0 0.0% 2 0.4% 2 0.4% 8 0 0.0% 0 0.0% 0 0.0% 0 0.0%
Total 332 100.0% 232 100.0% 564 100.0% 486 100.0%Mean/ (SD) 1.184 (1.351) 0.198 (0.538) 0.778 (1.194) 1.200 (1.456)
Note: (1) The chronic diseases asked in the JSTAR survey is as follows: Heart disease (angina, heart failure, cardiac infarction, valve disease, etc.), High blood pressure, Hyperlipimia, Cerebral accident, cerebrovascular accident, Diabetes, Chronic lung disease (chronic bronchitis,
emphysema, etc.), Asthma, Liver disease (hepatitis B or C, hepatic cirrhosis, etc. Not including liver cancer), Ulcer or other stomach
disorder, Joint disorder (Arthritis, rheumatism), Broken hip, Osteoporosis, Eye disease (Cataracts, glaucoma, etc.), Ear disorder (hard of
hearing, etc.), Bladder disorder (incontinence,leakage, difficulty in urinating, enlarged prostate), Parkinson's Disease, Depression and
emotional disorder, Dementia, Skin disorder, Cancer (including leukemia, lymphoma; not including benign skin cancer), and Other.
33
Table 3 Descriptive Statistics Sample Full sample Subsample
Endogenous variables Mean SD Min Max Mean SD Min Max
Care Receiver's Care Level (HR) 1.408 1.878 0 5 1.812 1.952 0 5 Caregiver's Self-reported Subjective Health Status (HG1) 1.712 0.713 0 4 1.716 0.720 0 4 Caregiver's Difficulty in Performing Daily Activities (HG2) 0.122 0.327 0 1 0.131 0.338 0 1 Caregiver's Chronic Diseases Diagnosed by a Doctor (HG3) 0.441 0.497 0 1 0.448 0.497 0 1
Care Receiver's Characteristics
Gender (=1 if female) 0.741 0.438 0 1 0.761 0.427 0 1 Age 86.578 6.508 59 105 87.746 6.295 59 105 Nursing Facility Admission (=1 if Yes) 0.208 0.406 0 1 0.268 0.443 0 1
Caregiver's Characteristics
Gender (=1 if female) 0.483 0.500 0 1 0.488 0.500 0 1 Age 60.127 5.739 50 79 60.863 5.907 50 79 Years of Education 12.735 2.389 9 21 12.614 2.415 9 21 Marriage Status (=1 if married) 0.903 0.296 0 1 0.881 0.323 0 1 Number of Dependent Minors (Aged 19 and Under) 0.091 0.388 0 4 0.079 0.368 0 4 Gross Yearly (Marital) Income (10 million yen) 0.400 0.661 0 27.524 0.387 0.699 0 27.524 Amount of (Marital) Assets (10 million yen) 0.627 1.392 0 15.2 0.632 1.356 0 15.2 Financial Support (=1 if Yes) 0.105 0.307 0 1 0.106 0.308 0 1 Hours of Providing Informal Care per Day 0.435 1.369 0 24 0.463 1.388 0 24
Number of Observations 4535 3524 Number of Groups (Individuals) 2700 2075
34
Number of Clusters (Families) 1582 1578
35
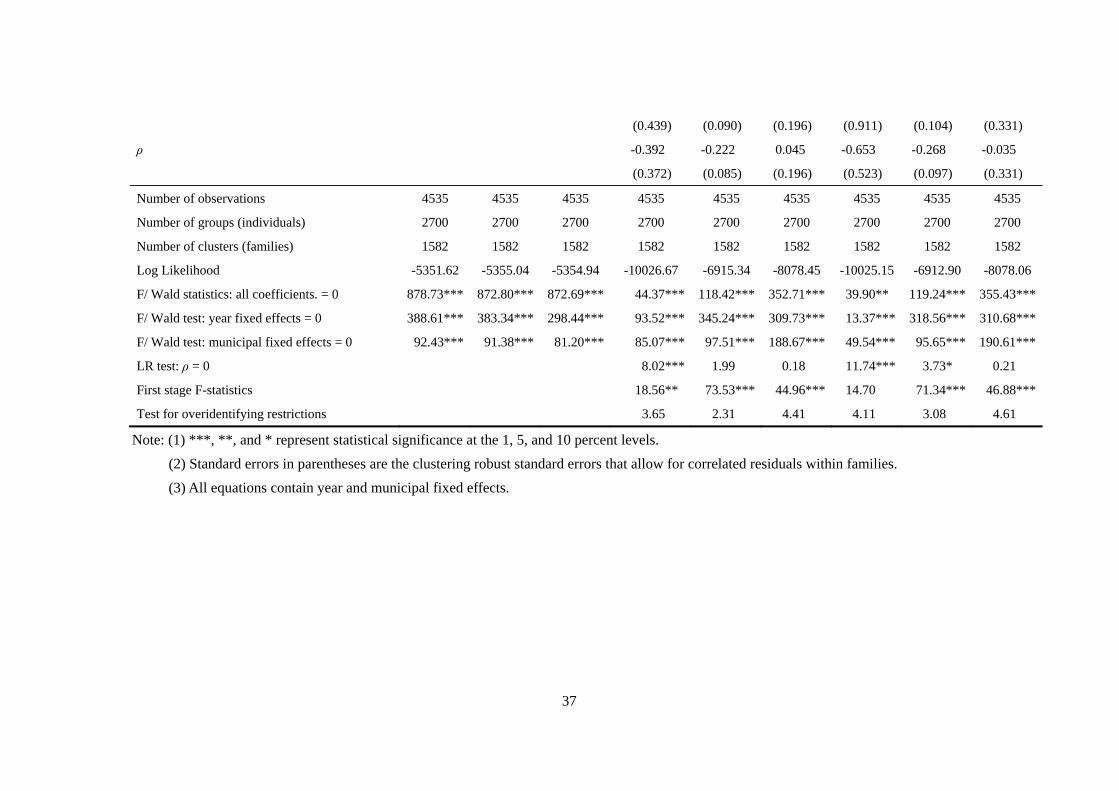
Table 4 Empirical Results of the Care Receiver’s and Caregiver’s Health Production Equations Using the Full Sample Model Ordered Probit Bivariate Ordered Probit Bivariate Ordered Probit
Caregiver's Health Status HG1 HG2 HG3 HG1 HG2 HG3 HG1 HG2 HG3
Care receiver's Health Production Equation
Caregiver's Health Status 0.066** -0.007 -0.019 0.436 0.196** -0.053 0.687 0.238*** 0.024
(0.026) (0.055) (0.039) (0.363) (0.078) (0.191) (0.502) (0.090) (0.322)
Gender (Female) 0.091* 0.090* 0.090* 0.089** 0.059 0.092* 0.078 0.052 0.089*
(0.047) (0.048) (0.047) (0.045) (0.049) (0.048) (0.052) (0.049) (0.050)
Age 0.052 0.049 0.049 0.055 0.070 0.046 0.051 0.074 0.051
(0.067) (0.067) (0.067) (0.067) (0.067) (0.069) (0.067) (0.067) (0.070)
Squared Age -0.000 -0.000 -0.000 -0.000 -0.000 -0.000 -0.000 -0.000 -0.000
(0.000) (0.000) (0.000) (0.000) (0.000) (0.000) (0.000) (0.000) (0.000)
Nursing Facility Admission 0.432*** 0.436*** 0.436*** 0.359*** 0.420*** 0.438*** 0.265 0.414*** 0.434***
(0.041) (0.041) (0.041) (0.112) (0.043) (0.042) (0.247) (0.045) (0.047)
Caregiver's Health Production Equation
Gender (Female) -0.027 0.007 -0.032 -0.026 0.010 -0.034
(0.036) (0.054) (0.038) (0.036) (0.054) (0.038)
Age 0.040 -0.030 0.015 0.027 -0.033 0.017
(0.061) (0.086) (0.070) (0.067) (0.086) (0.070)
Squared Age -0.000 0.000 -0.000 -0.000 0.000 -0.000
(0.000) (0.000) (0.000) (0.000) (0.000) (0.000)
Nursing Facility Admission 0.083* -0.005 0.045 0.090* 0.005 0.048
36
(0.046) (0.066) (0.054) (0.048) (0.066) (0.054)
Instrumental variables (Caregiver’s attributes)
Gender (Female) 0.047 0.350*** -0.071 0.057 0.328*** -0.064
(0.078) (0.081) (0.083) (0.046) (0.078) (0.093)
Age -0.179** -0.148 -0.078 -0.141 -0.153 -0.085
(0.087) (0.105) (0.091) (0.141) (0.102) (0.094)
Squared Age 0.001** 0.002* 0.001 0.001 0.002** 0.001
(0.001) (0.001) (0.001) (0.001) (0.001) (0.001)
Years of Education -0.021 -0.029** -0.017 -0.015 -0.029* -0.017
(0.016) (0.017) (0.013) (0.022) (0.017) (0.014)
Marriage Status -0.171** -0.190** -0.037 -0.137 -0.183** -0.045
(0.073) (0.095) (0.107) (0.122) (0.093) (0.111)
Number of Dependent Minors -0.025 -0.076 0.110 -0.012 -0.072 0.112
(0.067) (0.105) (0.089) (0.059) (0.101) (0.090)
Gross Yearly (Marital) Income -0.042 -0.083 0.102** -0.033 -0.084 0.099**
(0.031) (0.075) (0.048) (0.039) (0.071) (0.050)
Amount of (Marital) Assets -0.012 -0.021 -0.007 -0.004 -0.017 -0.005
(0.024) (0.027) (0.022) (0.024) (0.027) (0.024)
Financial Support -0.098 0.089 0.132 -0.076 0.084 0.129
(0.082) (0.102) (0.099) (0.095) (0.100) (0.102)
Hours of Providing Informal Care per Day 0.022 0.036 0.016
(0.020) (0.022) (0.037)
arctanh (ρ) -0.414 -0.226** 0.045 -0.780 -0.275** -0.035
37
(0.439) (0.090) (0.196) (0.911) (0.104) (0.331)
ρ -0.392 -0.222 0.045 -0.653 -0.268 -0.035
(0.372) (0.085) (0.196) (0.523) (0.097) (0.331)
Number of observations 4535 4535 4535 4535 4535 4535 4535 4535 4535
Number of groups (individuals) 2700 2700 2700 2700 2700 2700 2700 2700 2700
Number of clusters (families) 1582 1582 1582 1582 1582 1582 1582 1582 1582
Log Likelihood -5351.62 -5355.04 -5354.94 -10026.67 -6915.34 -8078.45 -10025.15 -6912.90 -8078.06
F/ Wald statistics: all coefficients. = 0 878.73*** 872.80*** 872.69*** 44.37*** 118.42*** 352.71*** 39.90** 119.24*** 355.43***
F/ Wald test: year fixed effects = 0 388.61*** 383.34*** 298.44*** 93.52*** 345.24*** 309.73*** 13.37*** 318.56*** 310.68***
F/ Wald test: municipal fixed effects = 0 92.43*** 91.38*** 81.20*** 85.07*** 97.51*** 188.67*** 49.54*** 95.65*** 190.61***
LR test: ρ = 0 8.02*** 1.99 0.18 11.74*** 3.73* 0.21
First stage F-statistics 18.56** 73.53*** 44.96*** 14.70 71.34*** 46.88***
Test for overidentifying restrictions 3.65 2.31 4.41 4.11 3.08 4.61
Note: (1) ***, **, and * represent statistical significance at the 1, 5, and 10 percent levels. (2) Standard errors in parentheses are the clustering robust standard errors that allow for correlated residuals within families. (3) All equations contain year and municipal fixed effects.

38
Table 5 The Effect of Informal Caregivers’ Health on Their Elderly Parents’ Health Model Ordered Probit Bivariate Ordered Probit Bivariate Ordered Probit
Caregiver's Health Status HG1 HG2 HG3 HG1 HG2 HG3 HG1 HG2 HG3
0.066** -0.024 -0.036 -0.186 0.162* -0.237 -0.287 0.199*** -0.205
(0.028) (0.059) (0.043) (0.546) (0.086) (0.232) (1.346) (0.089) (0.373)
Number of observations 3524 3524 3524 3524 3524 3524 3524 3524 3524
Number of groups (individuals) 2075 2075 2075 2075 2075 2075 2075 2075 2075
Number of clusters (families) 1578 1578 1578 1578 1578 1578 1578 1578 1578
Log Likelihood -4847.29 -4850.23 -4849.94 -8515.39 -6123.85 -6958.24 -8515.32 -6120.71 -6958.19
LR test: ρ = 0 6.62** 2.13 1.50 6.06** 3.28* 1.32
First stage F-statistics 24.39*** 75.41*** 39.62*** 23.97*** 73.14*** 41.01***
Test for overidentifying restrictions 4.93 2.74 4.92 5.25 3.54 5.71
Note: (1) See Table 5. (2) All equations control the attributes of care receiver and caregiver and year and municipal fixed effects.

39
Table 6 The Effect of Informal Caregivers’ Health on Their Elderly Parents’ Health Excluding Genetic Effect between Parents and Children (A) Full sample
Model Ordered Probit Bivariate Ordered Probit Bivariate Ordered Probit
Caregiver's Health Status HG1 HG2 HG3 HG1 HG2 HG3 HG1 HG2 HG3
0.079* 0.156 0.057 0.671*** 0.263 -0.078 0.696*** 0.276 -0.060
(0.043) (0.098) (0.065) (0.252) (0.298) (0.390) (0.255) (0.331) (0.446)
Number of observations 1738 1738 1738 1738 1738 1738 1738 1738 1738
Number of groups (individuals) 1197 1197 1197 1197 1197 1197 1197 1197 1197
Number of clusters (families) 972 972 972 972 972 972 972 972 972
Log Likelihood -1874.58 -1875.01 -1875.97 -3656.52 -2422.35 -2940.55 -3656.31 -2422.31 -2940.52
LR test: ρ = 0 5.89** 2.84* 0.83 6.75*** 2.98* 0.76
First stage F-statistics 14.86* 27.18*** 29.68*** 14.70* 27.01*** 29.98***
Test for overidentifying restrictions 2.17 2.88 0.30 2.24 2.62 3.34

40
(B) Subsample Model Ordered Probit Bivariate Ordered Probit Bivariate Ordered Probit
Caregiver's Health Status HG1 HG2 HG3 HG1 HG2 HG3 HG1 HG2 HG3
0.082* 0.119 0.098 0.904*** 0.592* -0.632** 0.902*** 0.598* -0.636**
(0.046) (0.109) (0.073) (0.124) (0.321) (0.301) (0.123) (0.314) (0.310)
Number of observations 1215 1215 1215 1215 1215 1215 1215 1215 1215
Number of groups (individuals) 840 840 840 840 840 840 840 840 840
Number of clusters (families) 765 765 765 765 765 765 765 765 765
Log Likelihood -1621.31 -1622.20 -1621.95 -2860.58 -2038.26 -2349.39 -2860.21 -2037.99 -2349.38
LR test: ρ = 0 15.39*** 7.93*** 10.40*** 15.42*** 8.20*** 10.38***
First stage F-statistics 7.62 19.48** 19.76** 7.94 19.26** 20.45**
Test for overidentifying restrictions 3.74 3.72 3.76 4.03 3.85 4.04
Note: (1) See Table 5. (2) All equations control the attributes of care receiver and caregiver and year and municipal fixed effects.
41
Figure 1 Trends of the Main Caregiver's Age in a Household
Source: The Comprehensive Survey of Living Conditions in 2013, the Ministry of Health, Labour, and Welfare in Japan..
54.4 58.1 58.9 62.7
69.0
40.6 41.1
47.6
45.9
51.2
18.7 19.6 24.9
25.5 29.0
0.0
10.0
20.0
30.0
40.0
50.0
60.0
70.0
80.0
2001 2004 2007 2010 2013
%
over 60 over 65 over 75
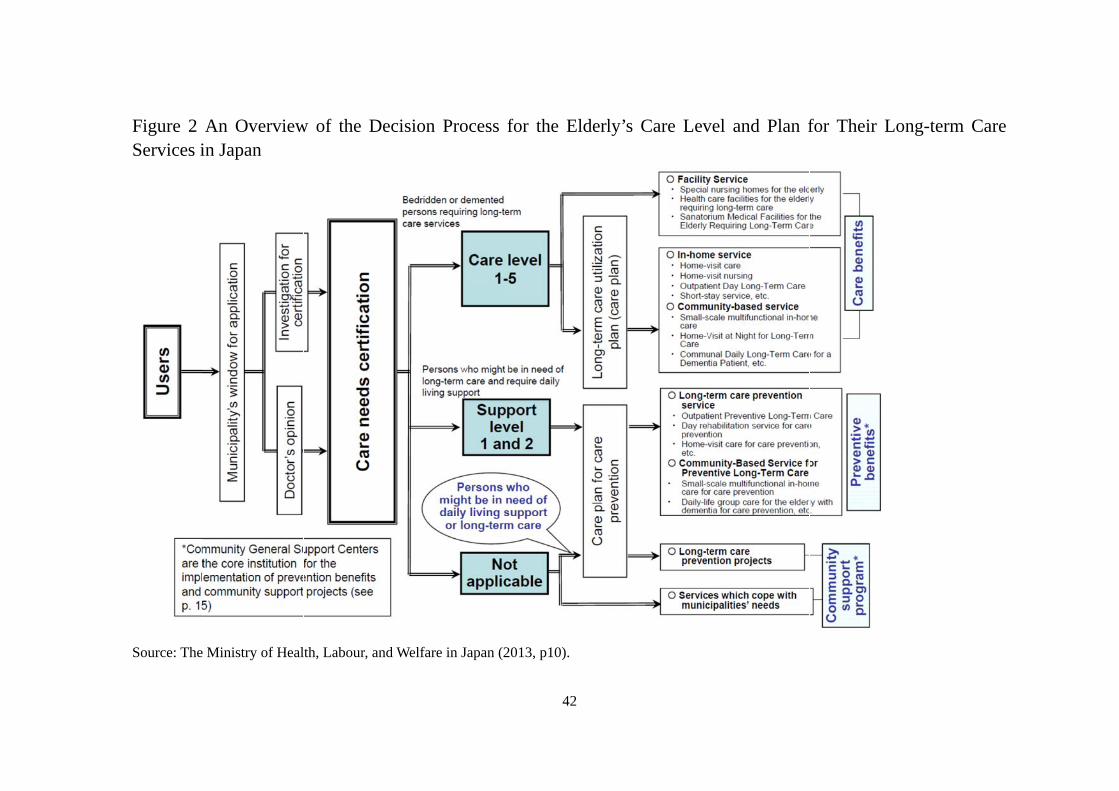
Figure 2Services i
Source: The
An Overviewin Japan
e Ministry of Heal
w of the Deci
lth, Labour, and W
sion Process
Welfare in Japan (2
42
for the Elderl
2013, p10).
ly’s Care Levvel and Plan ffor Their Lon
ng-term Care