how much energy can balancing save?€¦ · henri pitot – invented the pitot tube in 1732 and...
TRANSCRIPT

How Much Energy Can Balancing Save?
Monday, January 14 - 4:00 to 5:30 - Room B 315
Ben Lipscomb, P.E. and Rob Falke
National Comfort InstituteContent and illustrations © NCI Inc. 2019
Let’s begin with a few questions…energy savings
How much energy does testing and balancing save?
a. About 10%b. Nonec. 50% or higherd. It depends
Source of energy savings
Where do the energy savings come from?
a. Testing
b. Balancing
c. Additional Diagnostics
d. Addressing Issues Found

Does a typical balancing report verify the system is operating efficiently?
A typical air balancing report:
a. Verifies the system is operating efficiently
b. Assures equipment heating/cooling capacity is delivered into the occupied space
c. Verifies air and water flow rates match design
d. Assures all rooms are comfortable
F

Test and Balance and Efficiency HistoryHenri Pitot – Invented the Pitot tube in 1732 and laid the foundation for air and fluid measurement
Henry Darcey – Test methods and use of Pitot Tube was further developed in the mid 1850’s
These, and many other pioneers, formed the groundwork of test and balance today
HVAC system test and balance
In 1965 the first Test and Balance Agency is formed
Test and balance is specified as the required method to verify field measured data of an operating HVAC system.
Architects and Engineers became aware design intent was not materializing once systems were installed.

HVAC and Efficiency
• Government and utilities jumped into the HVAC efficiency arena.
• Energy efficiency imposed on equipment manufacturers and utilities, who focused primarily on equipment efficiency.
• HVAC energy savings by utilities savings were “deemed using bulk data.”
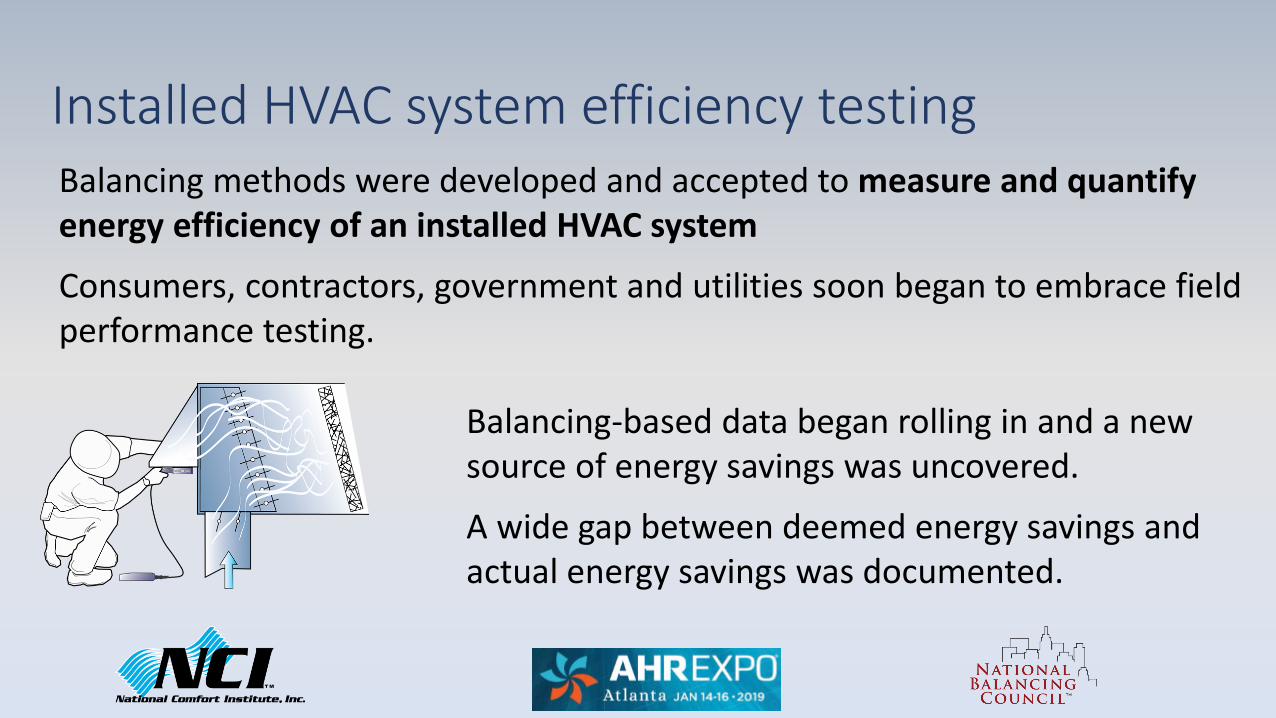
Installed HVAC system efficiency testing Balancing methods were developed and accepted to measure and quantify energy efficiency of an installed HVAC system
Consumers, contractors, government and utilities soon began to embrace field performance testing.
Balancing-based data began rolling in and a new source of energy savings was uncovered.
A wide gap between deemed energy savings and actual energy savings was documented.
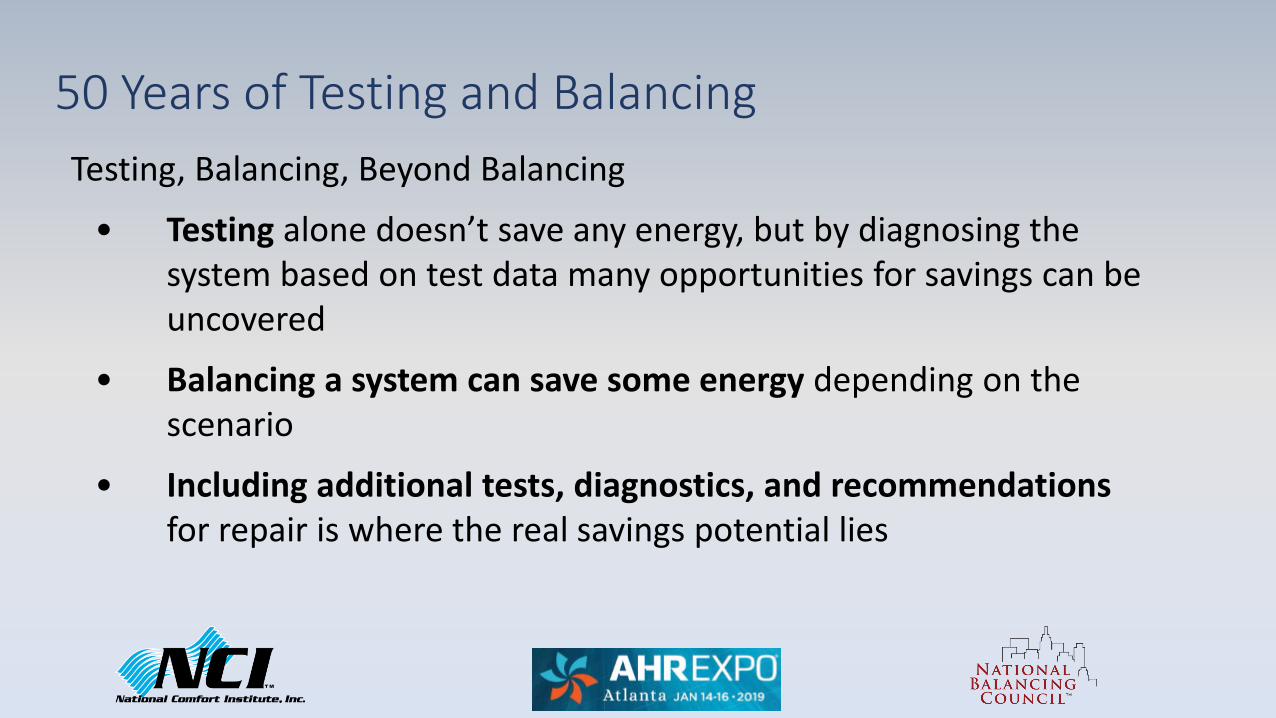
Testing, Balancing, Beyond Balancing
• Testing alone doesn’t save any energy, but by diagnosing the system based on test data many opportunities for savings can be uncovered
• Balancing a system can save some energy depending on the scenario
• Including additional tests, diagnostics, and recommendations for repair is where the real savings potential lies
50 Years of Testing and Balancing

Cover letter and certification statement Exceptions report Job and equipment data compared to specification, equipment specs, etc. Field measurements – Airflow, pressures, voltage, temperatures Floor plan, photos Instrument calibration, certification documentation Missing from the upcoming report are: Non-air moving equipment,
outside air, motor measurements, hydronics, auxiliary reports, etc.
Summary air balance report informationL
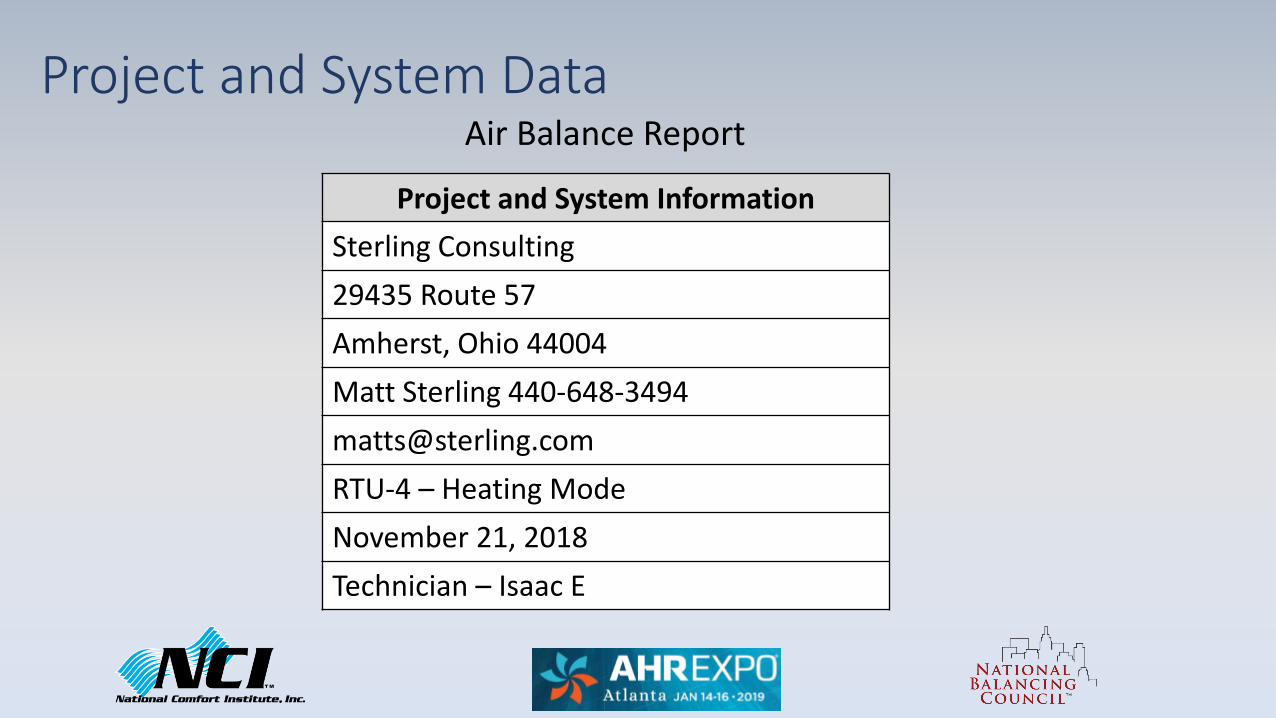
Project and System Data
Project and System InformationSterling Consulting 29435 Route 57Amherst, Ohio 44004Matt Sterling [email protected] – Heating ModeNovember 21, 2018Technician – Isaac E
Air Balance Report
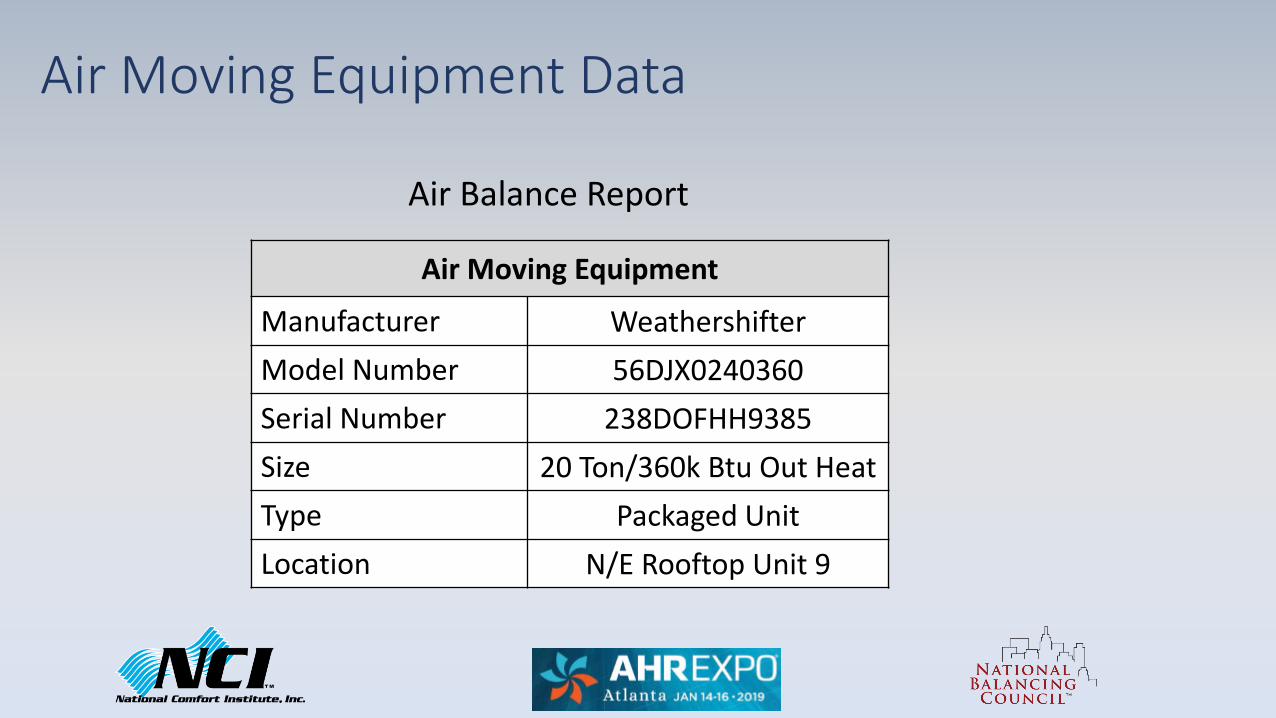
Air Moving Equipment Data
Air Moving Equipment
Manufacturer WeathershifterModel Number 56DJX0240360Serial Number 238DOFHH9385Size 20 Ton/360k Btu Out HeatType Packaged UnitLocation N/E Rooftop Unit 9
Air Balance Report
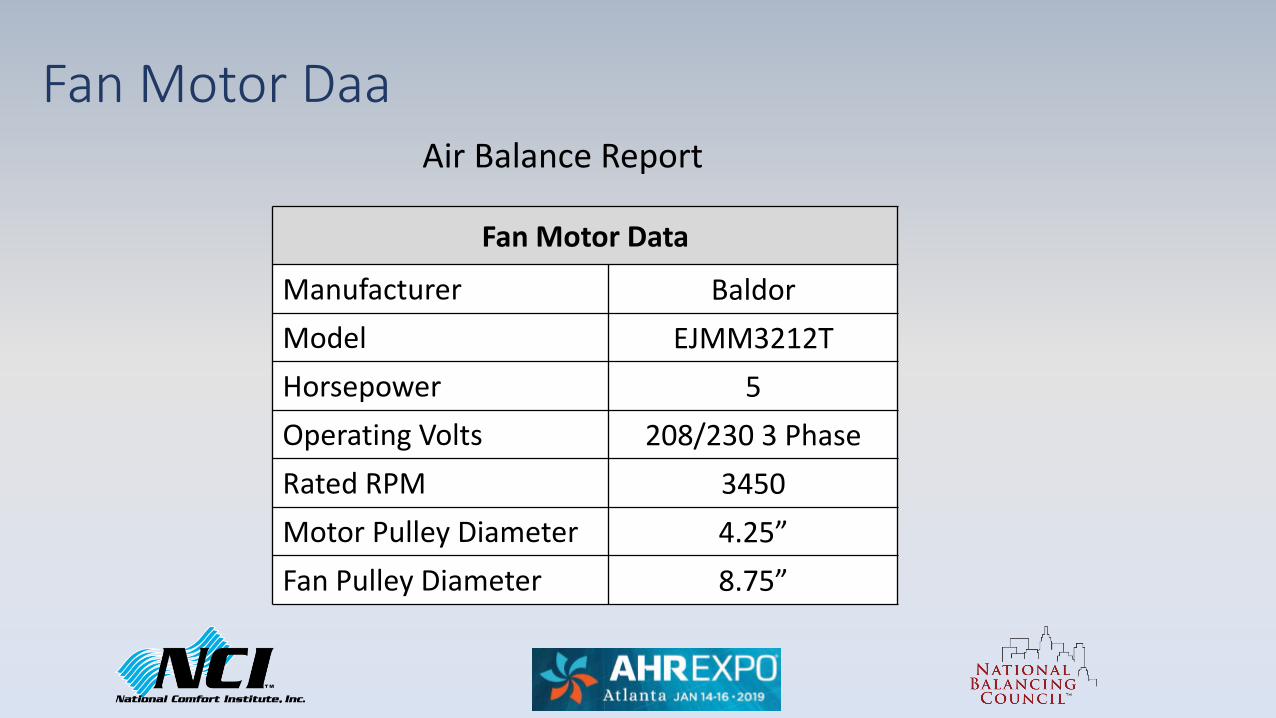
Fan Motor Daa
Fan Motor Data
Manufacturer BaldorModel EJMM3212THorsepower 5 Operating Volts 208/230 3 PhaseRated RPM 3450Motor Pulley Diameter 4.25”Fan Pulley Diameter 8.75”
Air Balance Report
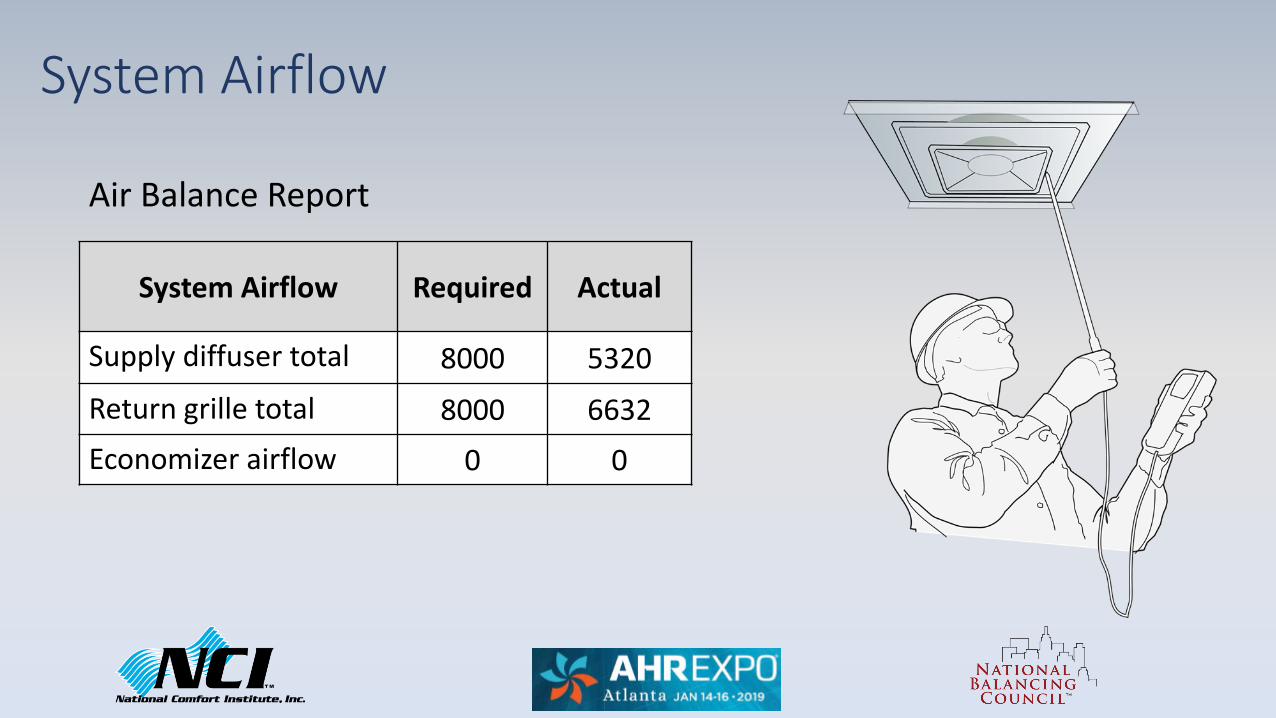
System Airflow
Air Balance Report
System Airflow Required Actual
Supply diffuser total 8000 5320Return grille total 8000 6632Economizer airflow 0 0

Grille and Diffuser AirflowAir Balance Report – Proportionally Balanced
Room Name Grille No.
Design cfm Initial Percent
RequiredFinal cfm
Percent Required
Lobby West 1 2000 1640 82% 1340 67%Lobby East 2 2000 840 42% 1375 69%Administration 3 1500 1150 77% 970 65%Accounting 4 1000 690 69% 730 73%Conference 5 1500 1120 75% 905 60%
Total 8000 5440 68% 5320 66%Equipment Plenum Inlet R-1 8000 6872 86% 6632 83%
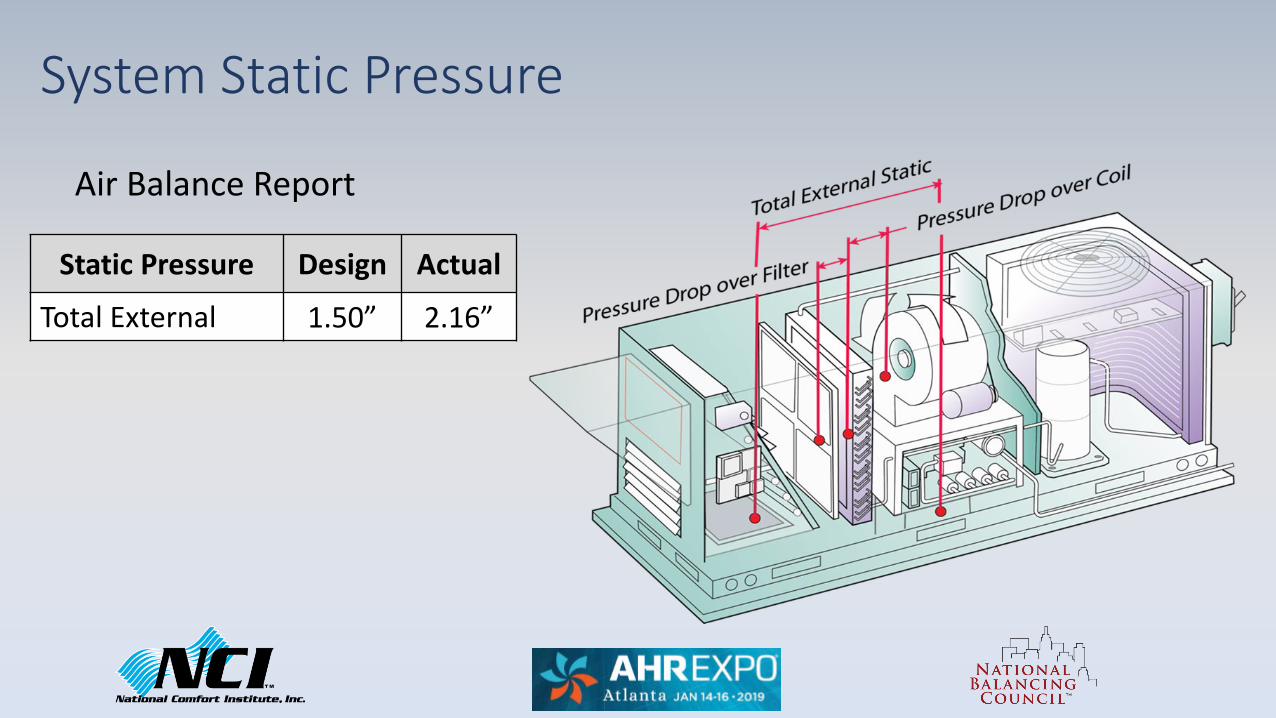
System Static Pressure
Air Balance Report
Static Pressure Design Actual
Total External 1.50” 2.16”
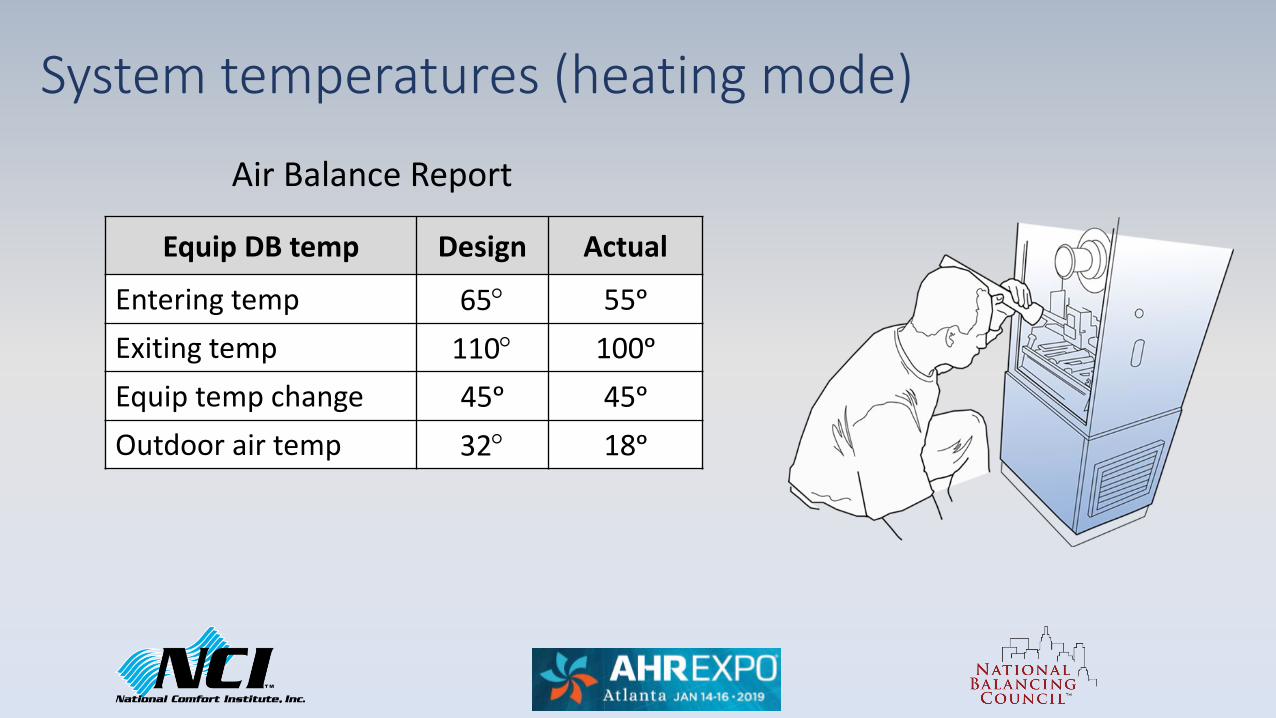
System temperatures (heating mode)
Air Balance Report
Equip DB temp Design Actual
Entering temp 65° 55ᵒExiting temp 110° 100ᵒEquip temp change 45ᵒ 45ᵒOutdoor air temp 32° 18ᵒ
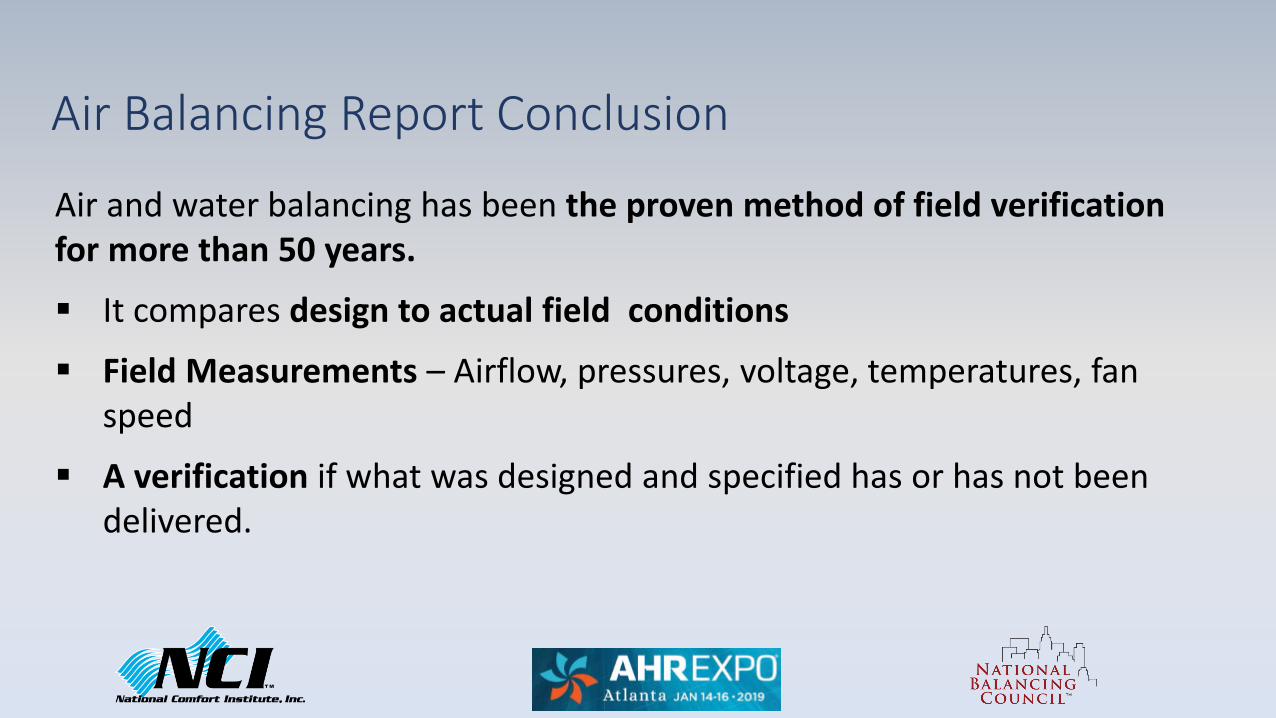
Air and water balancing has been the proven method of field verification for more than 50 years.
It compares design to actual field conditions
Field Measurements – Airflow, pressures, voltage, temperatures, fan speed
A verification if what was designed and specified has or has not been delivered.
Air Balancing Report Conclusion
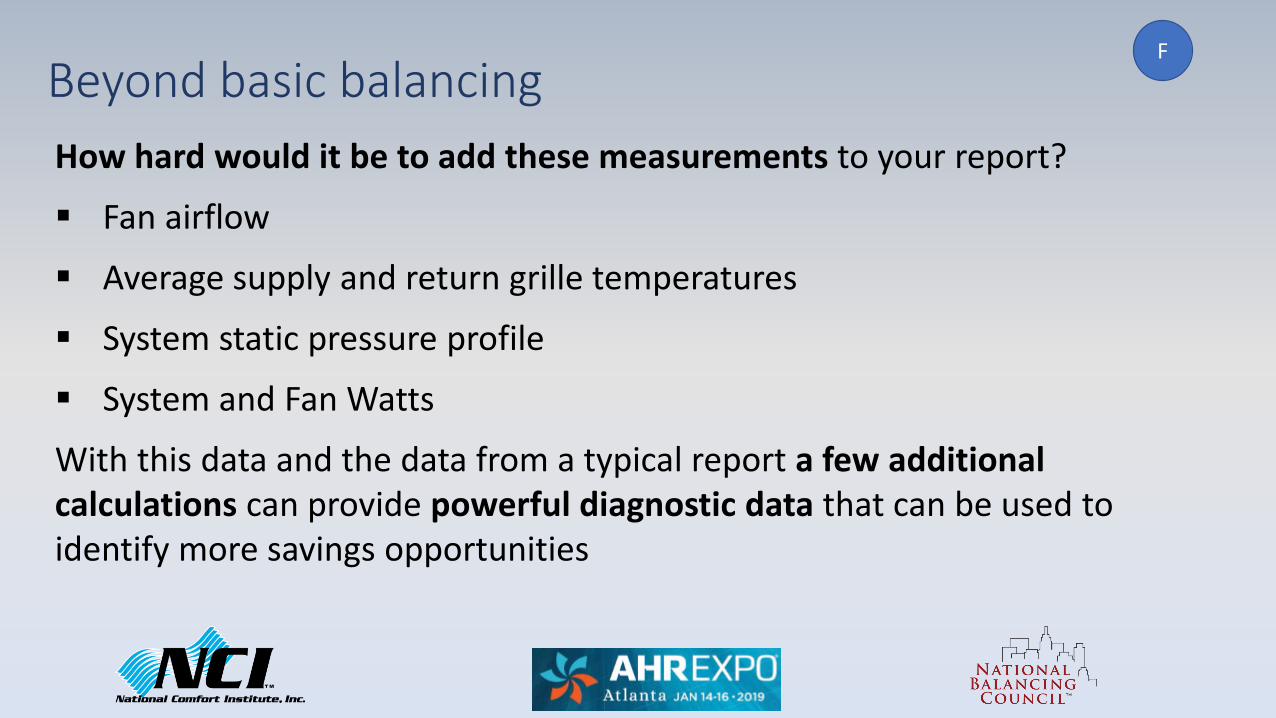
How hard would it be to add these measurements to your report?
Fan airflow
Average supply and return grille temperatures
System static pressure profile
System and Fan Watts
With this data and the data from a typical report a few additional calculations can provide powerful diagnostic data that can be used to identify more savings opportunities
Beyond basic balancing F

Duct Performance
Air Balance Report
System Airflow Required Balance Only
Supply diffuser total 8000 5320Return grille total 8000 6632
Now we’ll contrast a typical air balance repor to a system performance report

Duct Performance
System Airflow Required Balance Only
After Repairs
Fan airflow cfm 8000 6840 7455- Supply diffuser total 8000 5320 7230= Supply duct Leakage 0 1522 225
Fan airflow cfm 8000 6840 7455-Return grille total 8000 6632 7285= Return duct leakage 0 212 170
System Performance Report
New Performance Data Shown In Blue
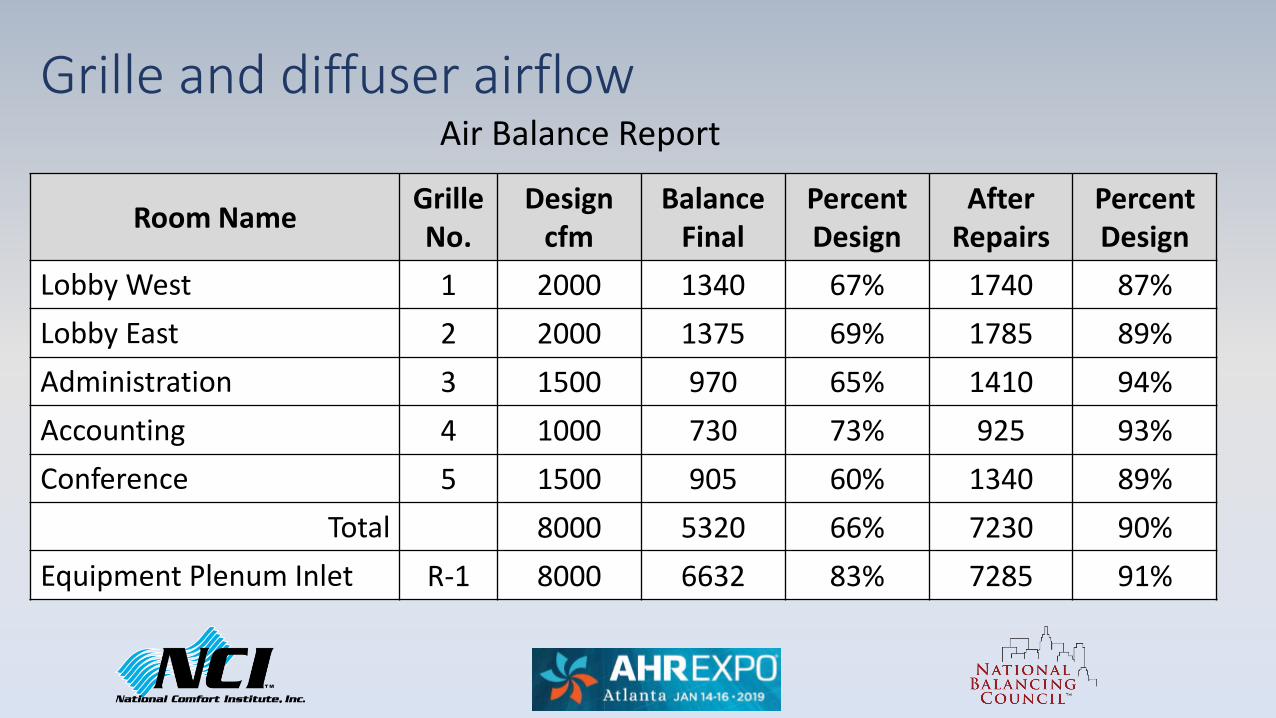
Grille and diffuser airflowAir Balance Report
Room Name Grille No.
Design cfm
Balance Final
Percent Design
After Repairs
Percent Design
Lobby West 1 2000 1340 67% 1740 87%Lobby East 2 2000 1375 69% 1785 89%Administration 3 1500 970 65% 1410 94%Accounting 4 1000 730 73% 925 93%Conference 5 1500 905 60% 1340 89%
Total 8000 5320 66% 7230 90%Equipment Plenum Inlet R-1 8000 6632 83% 7285 91%

Grille and diffuser airflow and temperaturesSystem Performance Report
Room Name Grille No.
Design cfm
Balance Only
Percent Design
After Repairs
Percent Design
DB Temp
Lobby West 1 2000 1340 67% 1740 87% 108ᵒLobby East 2 2000 1375 69% 1785 89% 111ᵒAdministration 3 1500 970 65% 1410 94% 109ᵒAccounting 4 1000 730 73% 925 93% 110ᵒConference 5 1500 905 60% 1340 89% 109ᵒ
Total 8000 5320 66% 7230 90% 109ᵒEquipment inlet R-1 8000 6632 83% 7285 91% 69ᵒ
New Performance Data

Static Pressure – Air Balance Report
Static Pressure Required Balance Only
After Repairs
Total External Static 1.50” 2.16” 1.66”
New Performance Data

System Static Pressure - System Performance Report
Static Pressure Required Balance Only
After Repairs
Suction Pressure .75” .54” .61”Discharge Pressure .75” 1.62” 1.01”
Total External Static 1.50” 2.16” 1.62”Internal Coil Pressure .30” .38” .32”Internal Filter Pressure .30” .46” .27”
New Performance Data
System Performance Report

System temperatures (heating mode)Air Balance Report
Equip DB temp Required Actual
Entering temp 65° 55ᵒExiting temp 110° 100ᵒEquip temp change 45ᵒ 45ᵒOutdoor air temp 32° 18ᵒ

System temperature summary (heating mode)
System Temps Required Balance Only After RepairsEquip exiting temp 110ᵒ 100ᵒ 114ᵒ- Supply diffuser avg temp 110ᵒ 92ᵒ 109ᵒ= Supply duct temp loss 0ᵒ 8ᵒ 5ᵒ
Return grille avg temp 65ᵒ 66ᵒ 69ᵒ- Equip entering temp 65ᵒ 55ᵒ 63ᵒ= Return duct temp loss 0ᵒ 11ᵒ 6ᵒAvg Grille Temp Difference 0 26ᵒ 40ᵒ
System Performance Report
New Performance Data
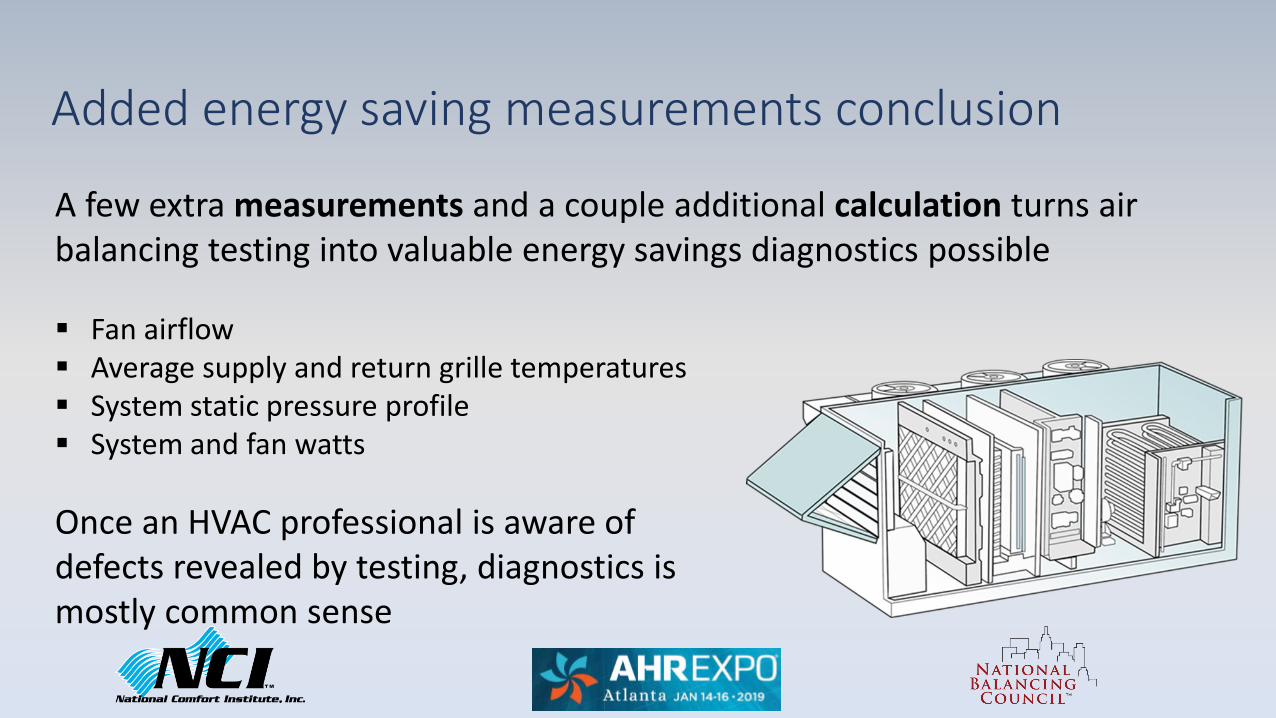
A few extra measurements and a couple additional calculation turns air balancing testing into valuable energy savings diagnostics possible
Fan airflow Average supply and return grille temperatures System static pressure profile System and fan watts
Added energy saving measurements conclusion
Once an HVAC professional is aware of defects revealed by testing, diagnostics is mostly common sense

Using the data you’ve gathered you can make the following calculations
Field measured system delivered BTUs Percent of delivered Btu into the occupied space Field measured system EER for cooling
Putting it All Together – Air Balance Reports and System Performance Reports
L

BTU and EER equations
Heating
𝐵𝐵𝐵𝐵𝐵𝐵𝐵 = 1.08 × 𝐶𝐶𝐶𝐶𝐶𝐶 × ∆𝐵𝐵
Cooling
𝐵𝐵𝐵𝐵𝐵𝐵𝐵 = 4.5 × 𝐶𝐶𝐶𝐶𝐶𝐶 × ∆𝐵
𝐸𝐸𝐸𝐸𝐸𝐸 =𝐵𝐵𝐵𝐵𝐵𝐵𝐵𝑊𝑊𝑊𝑊𝑊𝑊𝑊𝑊𝑊𝑊
Note: Full calculations with normalization for outside and equipment entering air conditions available in ASHRAE 221P – currently a draft in public review

System delivered Btu/hr. (heating or sensible Btu/hr.)
Measured System Value Required Balance Only
After Repairs
Supply Register Airflow 8,000 6632 7285Average Grille and Register temp difference 42° 26ᵒ 40ᵒHeating Btu multiplier 1.08 1.08 1.08Output / Delivered System Btu 360,000 186,200 314,700÷ Equipment rated Btu 360,000 360,000 360,000Percent of rated Btu delivered to cond space 100% 51% 87%
System Performance Report, Heating Mode
New Performance Data
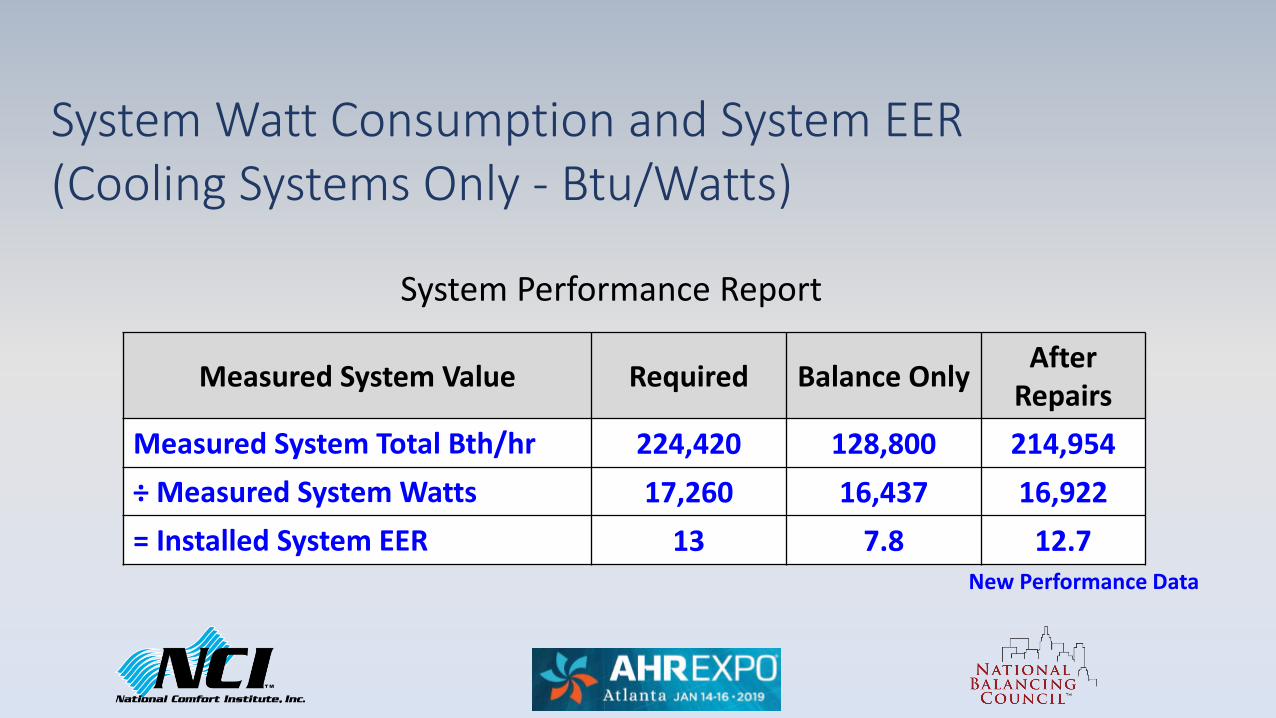
System Watt Consumption and System EER(Cooling Systems Only - Btu/Watts)
Measured System Value Required Balance Only After Repairs
Measured System Total Bth/hr 224,420 128,800 214,954÷ Measured System Watts 17,260 16,437 16,922= Installed System EER 13 7.8 12.7
System Performance Report
New Performance Data
Every system is different, and savings can range widely
Typical savings don’t mean a whole lot
How can we use what we provide as balancers to accurately estimate savings?
Estimating Energy Savings with BTUs and EER
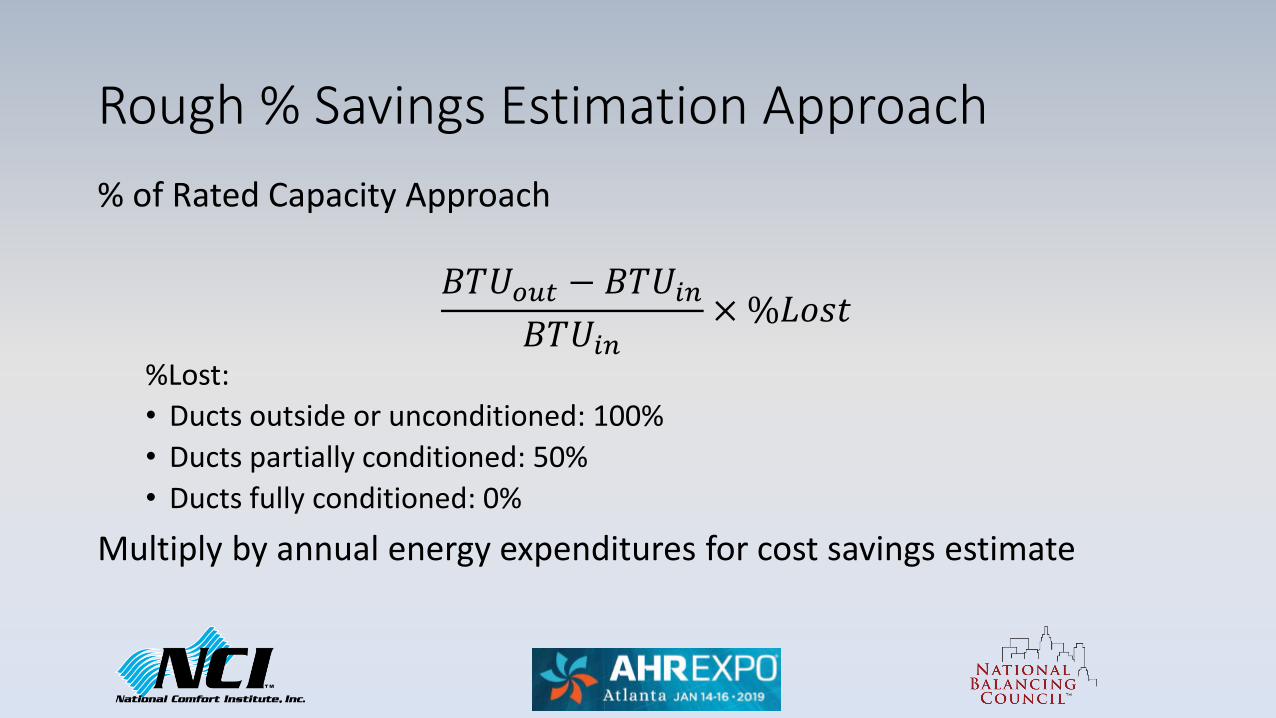
Rough % Savings Estimation Approach% of Rated Capacity Approach
𝐵𝐵𝐵𝐵𝐵𝐵𝑜𝑜𝑜𝑜𝑜𝑜 − 𝐵𝐵𝐵𝐵𝐵𝐵𝑖𝑖𝑖𝑖𝐵𝐵𝐵𝐵𝐵𝐵𝑖𝑖𝑖𝑖
× %𝐿𝐿𝐿𝐿𝑊𝑊𝑊𝑊
%Lost: • Ducts outside or unconditioned: 100%• Ducts partially conditioned: 50%• Ducts fully conditioned: 0%
Multiply by annual energy expenditures for cost savings estimate

Estimating Savings with EER
𝑘𝑘𝑊𝑊𝐵𝑠𝑠𝑠𝑠𝑠𝑠𝑖𝑖𝑖𝑖𝑠𝑠𝑠𝑠 = 𝐵𝐵𝐵𝐵𝐵𝐵𝐵 × 𝐸𝐸𝐶𝐶𝐿𝐿𝐻𝐻𝑐𝑐 × (1
𝐸𝐸𝐸𝐸𝐸𝐸𝑖𝑖𝑖𝑖−
1𝐸𝐸𝐸𝐸𝐸𝐸𝑜𝑜𝑜𝑜𝑜𝑜
)
EFLHc = Equivalent Full Load Hours (Cooling)Search for your state + “Technical Reference Manual”

Start with real simple 50% to 80% improvement percent of savings. Then go deeper.
We’ve provided many alternative views and a wide range of savings potential
Based on experience and data, here are some average percent savings to expect based on the various approaches to Testing and Balancing
So What Energy Does Balancing Actually Save?

Typical Energy savings estimates for balancing related work
Balancing Work Type Typical Percent of Savings
Testing and or diagnostics alone 0%
Balancing 5% to 10%
Minimal Repairs 8% to 13%
Typical Repairs 21% to 26%
Comprehensive Repairs 34% to 39%
Presentation Conclusion
Balancing principles can be easily adapted tot diagnostics and finding solutions
This has the potential to yield significant energy savings
By implementing balancing principles and associated repairs any HVAC professional can improve the performance of a system

Thank You!From National Comfort Institute
Sign up for our FREE magazine:
For additional information call: 800-633-7058For the latest training schedule: NCILink.com/ClassSched