how predictable is the winter extremely cold days over
TRANSCRIPT
1 3
DOI 10.1007/s00382-016-3222-4Clim Dyn
How predictable is the winter extremely cold days over temperate East Asia?
Xiao Luo1,2 · Bin Wang2,3
Received: 18 December 2015 / Accepted: 3 June 2016 © Springer-Verlag Berlin Heidelberg 2016
lead–lag linkages between the three predictors and the pre-dictand is provided for stimulating further studies.
Keywords Climate predictability · Prediction of extremely cold events · East Asia winter monsoon (EAWM) · El Niño/La Niña · Arctic Ocean temperature anomalies
1 Introduction
Extremely cold events have profound influences on peo-ple’s livelihoods and economy in East Asian countries such as China, Japan, and Korea. There has been an increasing societal demand for seasonal forecast of the number of extreme events such as ECD. For instance, the policymakers need the information to decide their budget for heating costs. Transportation industry needs it to plan the amount of fuel to be transported. Planning agricultural activity also needs the forecasted frequency of NECD and mean temperature. Accurate forecast of winter mean temperature and NECD will greatly benefit policymakers and stackholders. Seasonal prediction of the frequency of extremely cold day (ECD) occurrence and estimation of its predictability has been one of frontier challenge in climate science.
Geographically, the present study focuses on temperate East Asia (TEA, 30°–50°N, 110°–140°E), the “heart” of EAWM. The TEA region is located in between the Aleu-tian low and Mongolian-Siberian High and underneath the southern part of the EA trough with the prevailing surface northerlies, a region which is closely associated with three main components of EAWM circulation system (Fig. 1). Furthermore, this densely populated TEA region is home to variety of modern industries and has strong demands for accurate forecast of extremely cold events.
Abstract Skillful seasonal prediction of the number of extremely cold day (NECD) has considerable benefits for climate risk management and economic planning. Yet, predictability of NECD associated with East Asia winter monsoon remains largely unexplored. The present work estimates the NECD predictability in temperate East Asia (TEA, 30°–50°N, 110°–140°E) where the current dynami-cal models exhibit limited prediction skill. We show that about 50 % of the total variance of the NECD in TEA region is likely predictable, which is estimated by using a physics-based empirical (P-E) model with three conse-quential autumn predictors, i.e., developing El Niño/La Niña, Eurasian Arctic Ocean temperature anomalies, and geopotential height anomalies over northern and eastern Asia. We find that the barotropic geopotential height anom-aly over Asia can persist from autumn to winter, thereby serving as a predictor for winter NECD. Further analysis reveals that the sources of the NECD predictability and the physical basis for prediction of NECD are essentially the same as those for prediction of winter mean temperature over the same region. This finding implies that forecasting seasonal mean temperature can provide useful information for prediction of extreme cold events. Interpretation of the
* Bin Wang [email protected]
1 School of Atmospheric Sciences, Nanjing University, Nanjing 210023, China
2 Department of Atmospheric Sciences and Atmosphere-Ocean Research Center, University of Hawaii at Manoa, Honolulu, HI 96822, USA
3 Earth System Modeling Center, Nanjing University of Information Science and Technology, Nanjing 210044, China

X. Luo, B. Wang
1 3
Substantial effort has been made in understanding sea-sonal mean temperature variability over East Asia, which provides clues for seasonal prediction of extreme cold events. Variety of factors controlling EA winter tempera-ture variations have been found, including El Niño/South-ern Oscillation (ENSO) events (Zhang et al. 1996; Wang et al. 2000), Arctic sea ice anomaly (Honda et al. 2009; Kug et al. 2015), Eurasian snow cover anomalies (Clark and Serreze 2000; Watanabe and Nitta 1999; Wang et al. 2010), and sea surface temperature anomalies over Indian Ocean and North Atlantic (Wang et al. 2010; Wang and Chen 2014; Liu et al. 2014) in the preceding autumn.
Despite considerable progress made in understanding the sources of climate variability, prediction of the seasonal mean temperature over EAWM remains an outstanding and challenging task in climate science (Wang et al. 2009a; Lee et al. 2013). How skillful are the current dynamical models’ predictions of the winter mean temperature over the TEA region? To answer this question, we have assessed the per-formance of the 46-year (1960–2005) retrospective fore-cast made by five models that participated in ENSEMBLE
project (Weisheimer et al. 2009), and found that the multi-model ensemble hindcast yielded a domain-averaged tem-poral correlation skill of 0.29 for the TEA region (figure not shown), which is significant but rather limited.
Seasonal prediction of the extreme cold conditions has been a rare practice and presumably more difficult than seasonal mean temperature prediction due to its infrequent occurrence. For prediction of the extreme cold condition, ENSO has been recognized as the most important factor on the global scale (Pepler et al. 2015; Hamilton et al. 2012), but in many regions forecast of extreme temperatures can still be skillful even if ENSO effect is removed (Pep-ler et al. 2015). Therefore, for the TEA region, what role does ENSO play in determining ECDs in the TEA region? Besides ENSO, would any other physically consequential precursors exist?
Capability of dynamical models in seasonal predic-tion of extreme events was assessed only in the past few years. Hamilton et al. (2012) showed that the correlations of predicted and observed numbers of extreme days over a season are significantly greater than zero over much of the globe and dynamical prediction is generally better than per-sistence forecast. Using UK Met Office seasonal forecast-ing models, Eade et al. (2012) found that the multi-model ensemble (MME) prediction of winter extremes obtained an average correlation skill of 0.28 over global land. Pep-ler et al. (2015) have shown that the skill of a multi-model ensemble in forecasting 10th percentile of daily minimum temperature is statistically insignificant over mid- and low- latitude East Asia.
Apart from the dynamical models’ evaluation, the explo-ration of the potential predictability and prediction of ECD has been rare so far. Considering the deficiencies of dynam-ical models in predicting ECD, to what extent we can pre-dict the extreme cold winter days remains unanswered and the physical basis for such a prediction and the sources of predictability remain elusive.
In the present study, we aimed to explore the predict-ability sources and limits for the frequency of ECD over a season in the TEA region. Although dynamical seasonal prediction is an ultimate tool for seasonal forecast, in view of their limited skills at present, we will use physics-based empirical (P-E) model approach to understand the sources and estimate limits of predictability of NECD. This approach has been effectively applied to study Indian and East Asian summer rainfall prediction (Wang et al. 2015; Xing et al. 2014; Li and Wang 2015; Yim et al. 2014). Section 2 describes the datasets and methodology. Section 3 defines the ECD and the predictand. Section 4 presents characteristics of NECD-related simultaneous circulation anomalies. In Sect. 5, we search for physi-cally consequential predictors and followed by establish-ing a P-E model to estimate the predictability of NECD in
(a)
(b)
Fig. 1 Winter (DJF) mean circulations in the domain of Asian winter monsoon. a Sea-level pressure (SLP; shaded; hPa) and 850 hPa winds (vectors; m s−1), b 500 hPa geopotential height (contours; 10 gpm) and 300 hPa zonal wind (shaded; m s−1). The 3000 m topographic contour outlines the location of the Tibetan Plateau. The boxed region (30°–50°N, 110°–140°E) at each panel indicates the location of tem-perate East Asia (TEA)

How predictable is the winter extremely cold days over temperate East Asia?
1 3
Sect. 6. Section 7 presents shared sources of predictability between the winter mean temperature and the extreme cold conditions. The last section summarizes major results.
2 Data and methodology
2.1 Data
This study uses daily and monthly circulation data from the National Centers for Environmental Prediction-National Center for the Atmospheric Research (NCEP-NCAR) rea-nalysis (Kalnay et al. 1996). The time period analyzed in this study is 41 winters from 1973/1974 to 2013/2014. For simplicity, the winter of 1973 refers to the December 1973 to February 1974. The sea surface temperature (SST) data gridded at 2° × 2° resolution is derived from the National Oceanic and Atmospheric Administration (NOAA) extended reconstructed SST (ERSST version 3b) (Smith et al. 2008) for the same period. In addition, monthly mean precipitation are adopted from Global Precipitation Clima-tology Project (GPCP) version 2.2 dataset for the period of 1979–2013 (Huffman and Bolvin 2011).
To assess the performance of the dynamical models, we used retrospective forecasts made by the ENSEMBLES project for the period of 1960–2005 (Weisheimer et al. 2009). This data set consists of five state-of-the-art cou-pled atmosphere ocean circulation models, i.e., the Euro-Mediterranean Center for Climate Change (CMCC-INGV) in Bologna, European Centre for Medium-Range Weather Forecasts (ECMWF), the Leibniz Institute of Marine Sci-ences at Kiel University (IFM-GEOMAR), Météo France (MF), and UK Met Office (UKMO). The hindcasts were initiated form Nov. 1st that yielded a 1-month-lead DJF forecast. The MME prediction was made by simply averag-ing the above five models’ predictions.
2.2 Method
Distinguished from pure statistical model, the P-E model aims to identify the most consequential predictors based on understanding of the physical processes that explain the lead–lag relationships between predictors and the pre-dictand (Wang et al. 2015). Statistical methods are used as an auxiliary tool to maximize the predictors-predictand correlation in training periods.
To search for physically meaningful predictors, we focus on only three fields that reflect ocean and land sur-face anomalous conditions: (a) sea surface temperature (SST) over oceans and 2 m air temperature (T2m) over land, the latter often reflects snow cover anomalies, (b) sea level pressure (SLP) and (c) 500 hPa geopotential height. Meanwhile, we focus on two types of precursors, i.e., the
persistent signals in autumn represented by the mean of September–October–November (SON) and tendency signal across autumn from September to November (November minus September). These persistent and tendency signals can reflect atmosphere–ocean–land interaction processes and indicate the maintenance of the anomalies and direc-tion of its development, respectively. Long-term trend esti-mated by the least squares method can be found in seasonal mean fields, especially Arctic Ocean temperature in autumn (figures not shown). Since the trend could be due to exter-nal forcing or governed by different mechanisms than those governing natural interannual and decadal variation, we removed the linear trends from all the seasonal mean fields, based on 41 samples (1973–2013).
To circumvent over-fitting, the number of predictors is limited to three (i.e., <10 % of the sample size of 40). The prediction model is derived by stepwise multi-linear regression. All the predictor variables are normalized and selected at 95 % statistical significance level according to Fisher’s F-test.
In addition, cross-validation method is employed to make a retrospective forecast (Michaelsen 1987). We train the model with the sample leaving 3 years out each time, and then apply the derived model to forecast the middle year of the three withheld years.
3 Definition of ECD and the predictand‑NECD
A number of indices have been developed to quantify the ECD. The “Day-count” indices use fixed thresholds, which are less suitable for regions that exhibit large spatial varia-tion (Zhang et al. 2011). In particular, a temperature thresh-old that is good for representing extremely cold days in mid-latitudes can only indicate a mild winter day at higher latitudes. Indices based on the count of days crossing per-centile thresholds can provide useful local information for the impact and adaption. For instance, the indices of cold nights (TN10P) defined by experts of the CCI/CLIVAR/JCOMM Team on Climate Change Detection and Indices (ETCCDI), i.e., the number of days with daily minimum temperature below the 10th percentile of daily minimum temperatures (Zhang and Yang 2004), are relevant for com-paring changes in heating demands (Zhang et al. 2011; Frich et al. 2002; Klein Tank et al. 2009). Some other indi-ces such as cooling degree days and heating degree days, defined by the daily difference between mean temperature and a base temperature, are typical indicators of household energy consumption for space heating/cooling (Arguez et al. 2012), which are widely used for monitoring energy consumption.
In the present study, the threshold used to define ECDs is the 10th percentile of daily mean temperature. Instead of
X. Luo, B. Wang
1 3
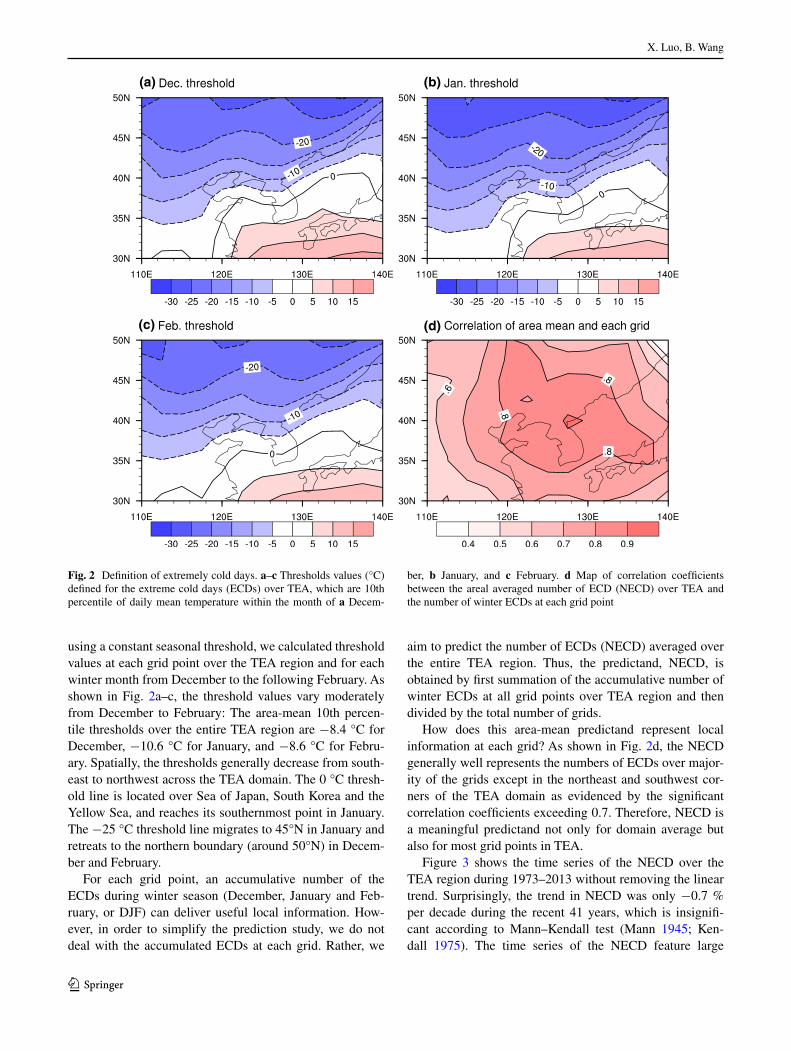
using a constant seasonal threshold, we calculated threshold values at each grid point over the TEA region and for each winter month from December to the following February. As shown in Fig. 2a–c, the threshold values vary moderately from December to February: The area-mean 10th percen-tile thresholds over the entire TEA region are −8.4 °C for December, −10.6 °C for January, and −8.6 °C for Febru-ary. Spatially, the thresholds generally decrease from south-east to northwest across the TEA domain. The 0 °C thresh-old line is located over Sea of Japan, South Korea and the Yellow Sea, and reaches its southernmost point in January. The −25 °C threshold line migrates to 45°N in January and retreats to the northern boundary (around 50°N) in Decem-ber and February.
For each grid point, an accumulative number of the ECDs during winter season (December, January and Feb-ruary, or DJF) can deliver useful local information. How-ever, in order to simplify the prediction study, we do not deal with the accumulated ECDs at each grid. Rather, we
aim to predict the number of ECDs (NECD) averaged over the entire TEA region. Thus, the predictand, NECD, is obtained by first summation of the accumulative number of winter ECDs at all grid points over TEA region and then divided by the total number of grids.
How does this area-mean predictand represent local information at each grid? As shown in Fig. 2d, the NECD generally well represents the numbers of ECDs over major-ity of the grids except in the northeast and southwest cor-ners of the TEA domain as evidenced by the significant correlation coefficients exceeding 0.7. Therefore, NECD is a meaningful predictand not only for domain average but also for most grid points in TEA.
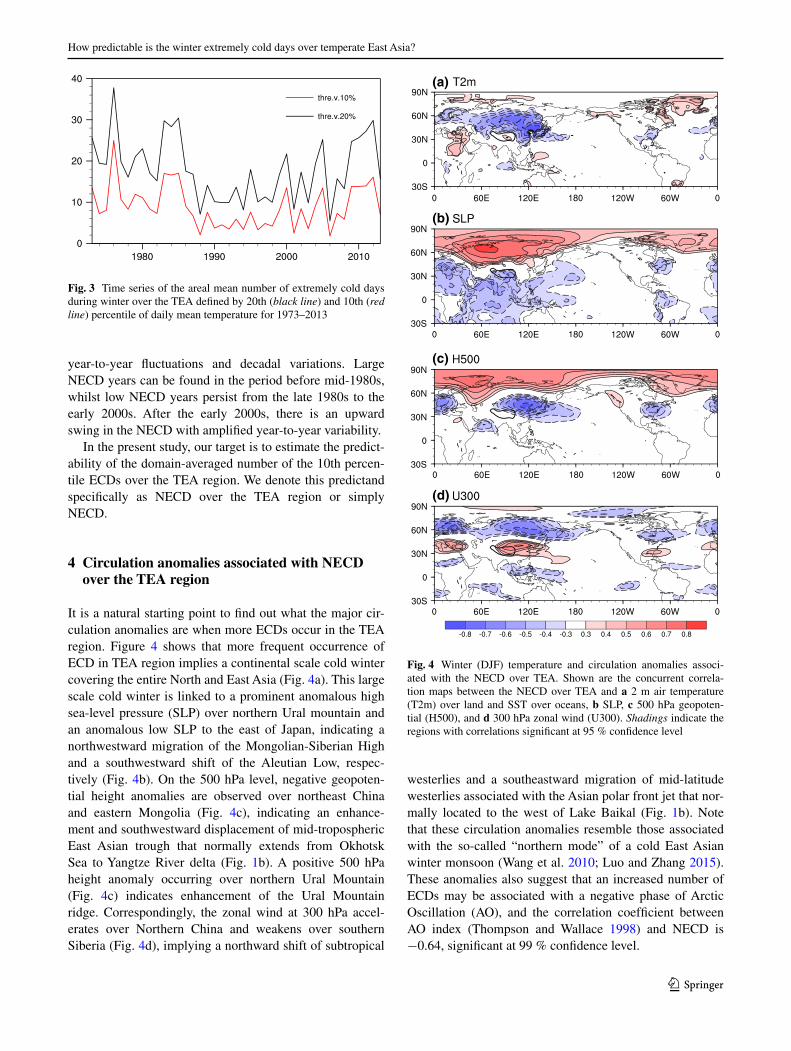
Figure 3 shows the time series of the NECD over the TEA region during 1973–2013 without removing the linear trend. Surprisingly, the trend in NECD was only −0.7 % per decade during the recent 41 years, which is insignifi-cant according to Mann–Kendall test (Mann 1945; Ken-dall 1975). The time series of the NECD feature large
(a) (b)
(c) (d)
Fig. 2 Definition of extremely cold days. a–c Thresholds values (°C) defined for the extreme cold days (ECDs) over TEA, which are 10th percentile of daily mean temperature within the month of a Decem-
ber, b January, and c February. d Map of correlation coefficients between the areal averaged number of ECD (NECD) over TEA and the number of winter ECDs at each grid point
How predictable is the winter extremely cold days over temperate East Asia?
1 3
year-to-year fluctuations and decadal variations. Large NECD years can be found in the period before mid-1980s, whilst low NECD years persist from the late 1980s to the early 2000s. After the early 2000s, there is an upward swing in the NECD with amplified year-to-year variability.
In the present study, our target is to estimate the predict-ability of the domain-averaged number of the 10th percen-tile ECDs over the TEA region. We denote this predictand specifically as NECD over the TEA region or simply NECD.
4 Circulation anomalies associated with NECD over the TEA region
It is a natural starting point to find out what the major cir-culation anomalies are when more ECDs occur in the TEA region. Figure 4 shows that more frequent occurrence of ECD in TEA region implies a continental scale cold winter covering the entire North and East Asia (Fig. 4a). This large scale cold winter is linked to a prominent anomalous high sea-level pressure (SLP) over northern Ural mountain and an anomalous low SLP to the east of Japan, indicating a northwestward migration of the Mongolian-Siberian High and a southwestward shift of the Aleutian Low, respec-tively (Fig. 4b). On the 500 hPa level, negative geopoten-tial height anomalies are observed over northeast China and eastern Mongolia (Fig. 4c), indicating an enhance-ment and southwestward displacement of mid-tropospheric East Asian trough that normally extends from Okhotsk Sea to Yangtze River delta (Fig. 1b). A positive 500 hPa height anomaly occurring over northern Ural Mountain (Fig. 4c) indicates enhancement of the Ural Mountain ridge. Correspondingly, the zonal wind at 300 hPa accel-erates over Northern China and weakens over southern Siberia (Fig. 4d), implying a northward shift of subtropical
westerlies and a southeastward migration of mid-latitude westerlies associated with the Asian polar front jet that nor-mally located to the west of Lake Baikal (Fig. 1b). Note that these circulation anomalies resemble those associated with the so-called “northern mode” of a cold East Asian winter monsoon (Wang et al. 2010; Luo and Zhang 2015). These anomalies also suggest that an increased number of ECDs may be associated with a negative phase of Arctic Oscillation (AO), and the correlation coefficient between AO index (Thompson and Wallace 1998) and NECD is −0.64, significant at 99 % confidence level.
Fig. 3 Time series of the areal mean number of extremely cold days during winter over the TEA defined by 20th (black line) and 10th (red line) percentile of daily mean temperature for 1973–2013
(a)
(b)
(c)
(d)
Fig. 4 Winter (DJF) temperature and circulation anomalies associ-ated with the NECD over TEA. Shown are the concurrent correla-tion maps between the NECD over TEA and a 2 m air temperature (T2m) over land and SST over oceans, b SLP, c 500 hPa geopoten-tial (H500), and d 300 hPa zonal wind (U300). Shadings indicate the regions with correlations significant at 95 % confidence level
X. Luo, B. Wang
1 3
5 Predictors for winter NECD
5.1 Searching for predictors
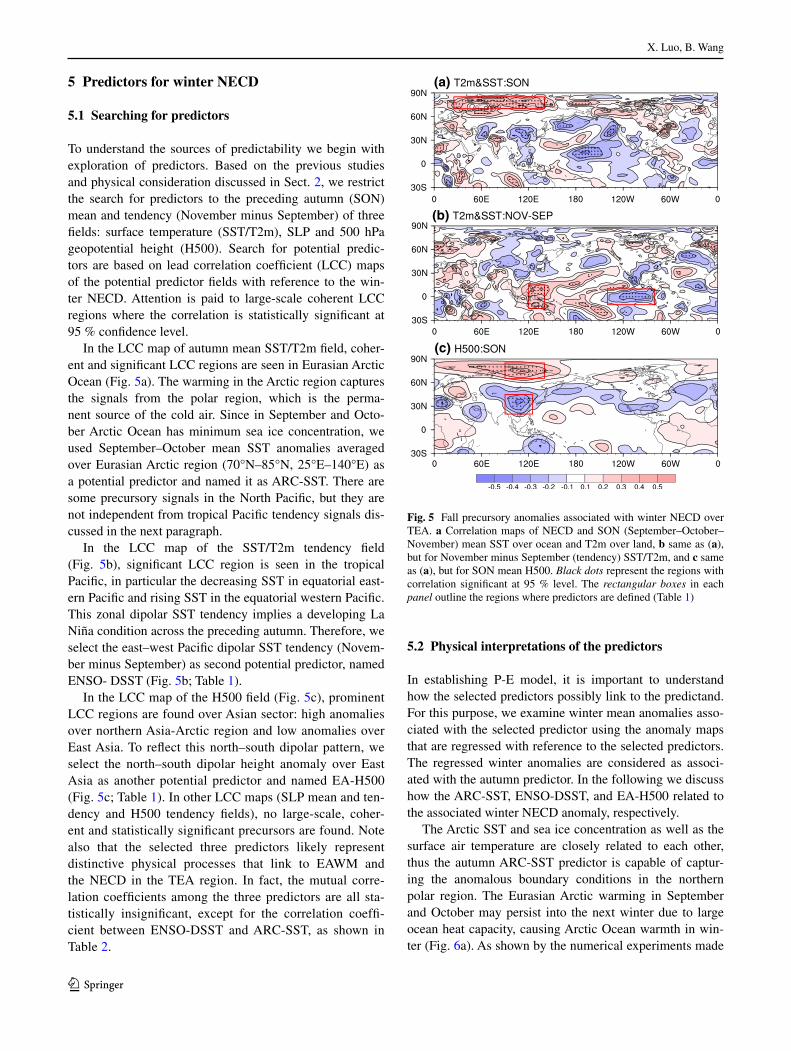
To understand the sources of predictability we begin with exploration of predictors. Based on the previous studies and physical consideration discussed in Sect. 2, we restrict the search for predictors to the preceding autumn (SON) mean and tendency (November minus September) of three fields: surface temperature (SST/T2m), SLP and 500 hPa geopotential height (H500). Search for potential predic-tors are based on lead correlation coefficient (LCC) maps of the potential predictor fields with reference to the win-ter NECD. Attention is paid to large-scale coherent LCC regions where the correlation is statistically significant at 95 % confidence level.
In the LCC map of autumn mean SST/T2m field, coher-ent and significant LCC regions are seen in Eurasian Arctic Ocean (Fig. 5a). The warming in the Arctic region captures the signals from the polar region, which is the perma-nent source of the cold air. Since in September and Octo-ber Arctic Ocean has minimum sea ice concentration, we used September–October mean SST anomalies averaged over Eurasian Arctic region (70°N–85°N, 25°E–140°E) as a potential predictor and named it as ARC-SST. There are some precursory signals in the North Pacific, but they are not independent from tropical Pacific tendency signals dis-cussed in the next paragraph.
In the LCC map of the SST/T2m tendency field (Fig. 5b), significant LCC region is seen in the tropical Pacific, in particular the decreasing SST in equatorial east-ern Pacific and rising SST in the equatorial western Pacific. This zonal dipolar SST tendency implies a developing La Niña condition across the preceding autumn. Therefore, we select the east–west Pacific dipolar SST tendency (Novem-ber minus September) as second potential predictor, named ENSO- DSST (Fig. 5b; Table 1).
In the LCC map of the H500 field (Fig. 5c), prominent LCC regions are found over Asian sector: high anomalies over northern Asia-Arctic region and low anomalies over East Asia. To reflect this north–south dipolar pattern, we select the north–south dipolar height anomaly over East Asia as another potential predictor and named EA-H500 (Fig. 5c; Table 1). In other LCC maps (SLP mean and ten-dency and H500 tendency fields), no large-scale, coher-ent and statistically significant precursors are found. Note also that the selected three predictors likely represent distinctive physical processes that link to EAWM and the NECD in the TEA region. In fact, the mutual corre-lation coefficients among the three predictors are all sta-tistically insignificant, except for the correlation coeffi-cient between ENSO-DSST and ARC-SST, as shown in Table 2.
5.2 Physical interpretations of the predictors
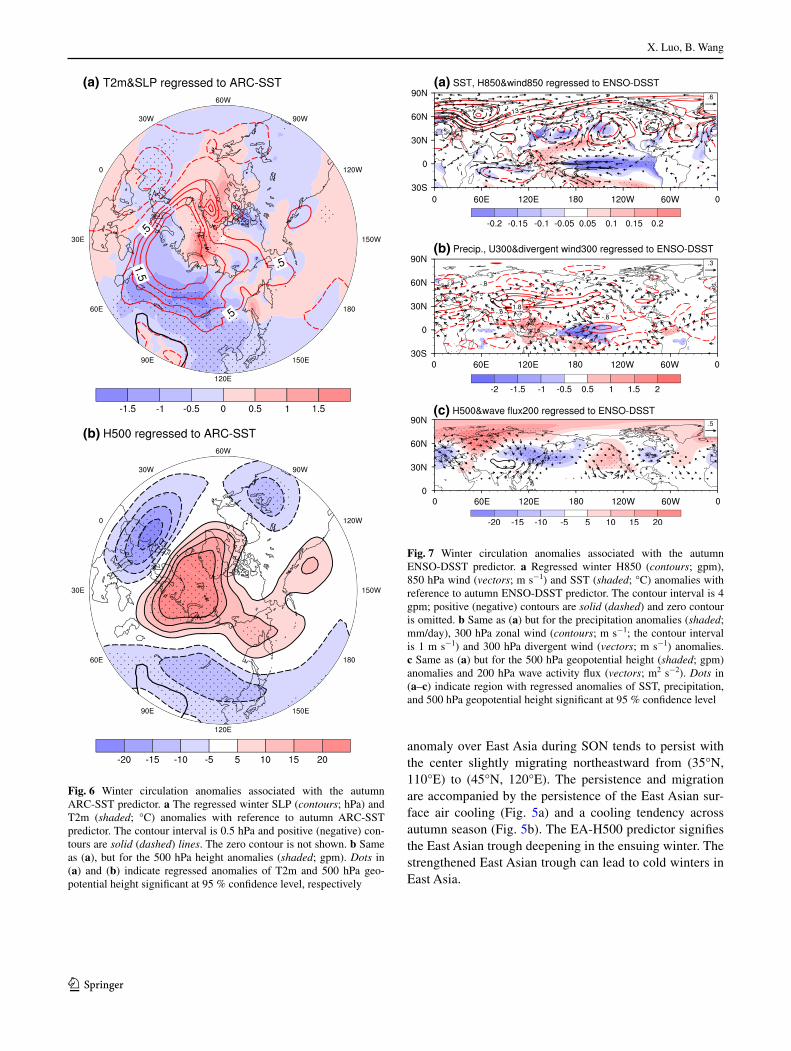
In establishing P-E model, it is important to understand how the selected predictors possibly link to the predictand. For this purpose, we examine winter mean anomalies asso-ciated with the selected predictor using the anomaly maps that are regressed with reference to the selected predictors. The regressed winter anomalies are considered as associ-ated with the autumn predictor. In the following we discuss how the ARC-SST, ENSO-DSST, and EA-H500 related to the associated winter NECD anomaly, respectively.
The Arctic SST and sea ice concentration as well as the surface air temperature are closely related to each other, thus the autumn ARC-SST predictor is capable of captur-ing the anomalous boundary conditions in the northern polar region. The Eurasian Arctic warming in September and October may persist into the next winter due to large ocean heat capacity, causing Arctic Ocean warmth in win-ter (Fig. 6a). As shown by the numerical experiments made
(a)
(b)
(c)
Fig. 5 Fall precursory anomalies associated with winter NECD over TEA. a Correlation maps of NECD and SON (September–October–November) mean SST over ocean and T2m over land, b same as (a), but for November minus September (tendency) SST/T2m, and c same as (a), but for SON mean H500. Black dots represent the regions with correlation significant at 95 % level. The rectangular boxes in each panel outline the regions where predictors are defined (Table 1)

How predictable is the winter extremely cold days over temperate East Asia?
1 3
by Kug et al. (2015), the winter Arctic warming, especially over the Kara Sea, can induce an anticyclonic anomaly extending from polar region to Ural Mountain, which is seen from surface up to 500 hPa (Fig. 6a, b). The ris-ing pressure over Ural Mountain can further lead to down-stream low pressure anomalies that deepen and shift west-ward the East Asian trough at 500 hPa (Fig. 6b) through Rossby wave propagation (Kug et al. 2015). It has been well documented that the rising pressure over Ural moun-tain region and deepening EA trough favor for more fre-quent occurrence of cold surges over TEA (Chang et al. 2006, also Fig. 4c).
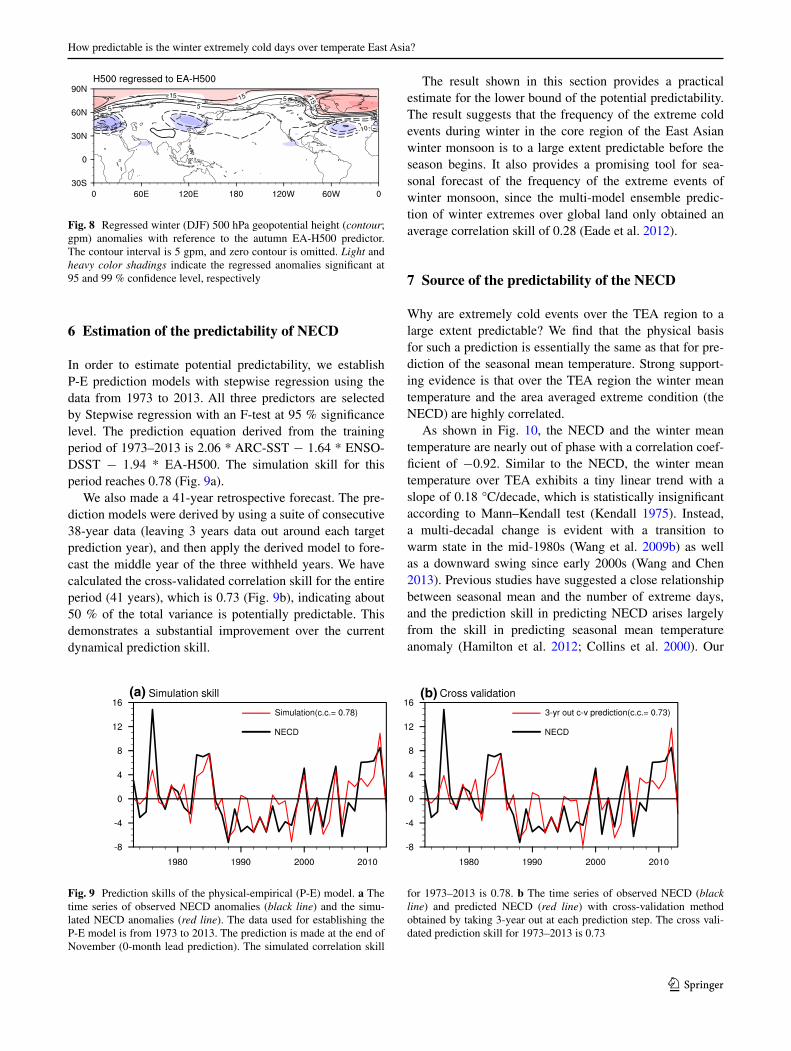
How does the ENSO-SST predictor lead to a more frequent occurrence of ECD during winter? The East-ern Pacific cooling-western Pacific warming tendency in autumn foreshadows a positive Bjerknes feedback between zonal SST gradient, zonal wind stress and upwelling (Wang et al. 2015), leading to a mature phase of La Niña during the following winter (Fig. 7a). A large scale cyclonic wind anomaly (with two centers located at Philippines and east of Japan, respectively) appears over western North Pacific associated with mature phase of La Niña (Fig. 7a), which is the counterpart of the west-ern North Pacific anticyclone during El Niño phase (Wang et al. 2000). The northerly anomaly induced by the anoma-lous cyclone over western North Pacific at midlatitude EA facilitates cold air intrusion into to the TEA region. Dur-ing La Niña events, cold SST in the eastern-central Pacific generates low-level equatorial easterly anomalies and enhances the precipitation heating over the Maritime Con-tinent (Fig. 7b), which further strengthens upward motion over the maritime continent and the associated northward
divergent winds at upper level (Fig. 7b). As a result, the upper tropospheric westerly over the northern (southern) part of the subtropical (polar front) jet is accelerated due to Earth’s rotation as evidenced by zonal wind anomaly at 300 hPa (Fig. 7b), suggesting the impact of ENSO through the meridional overturning mechanism. Moreo-ver, a meridional wave train over East Asia is associated with anomalous northward propagation of wave activity flux (Fig. 7c), thus deepening the EA trough as shown by the 500 hPa height anomaly (Fig. 7c). Circulation anomaly associated with the meridional teleconnection modulate the upper zonal winds that lead to reduced westerly in the mid-high latitude (60˚N), and accelerated zonal wind in mid latitude (35˚N) over East Asia. There is another zonal Eurasian wave train that links to EA trough but origin of the east–west Eurasian wave train remains elusive, which is unlikely related to ENSO directly. These distinct fea-tures associated with ENSO-DSST predictor signify circu-lation anomalies that lead to a more frequent ECD occur-ring over TEA (Fig. 4). An opposite SST tendency across equatorial Pacific leads to a mature El Niño, which tends to have reversed circulation anomalies and opposite effects on East Asian winter monsoon and NECD.
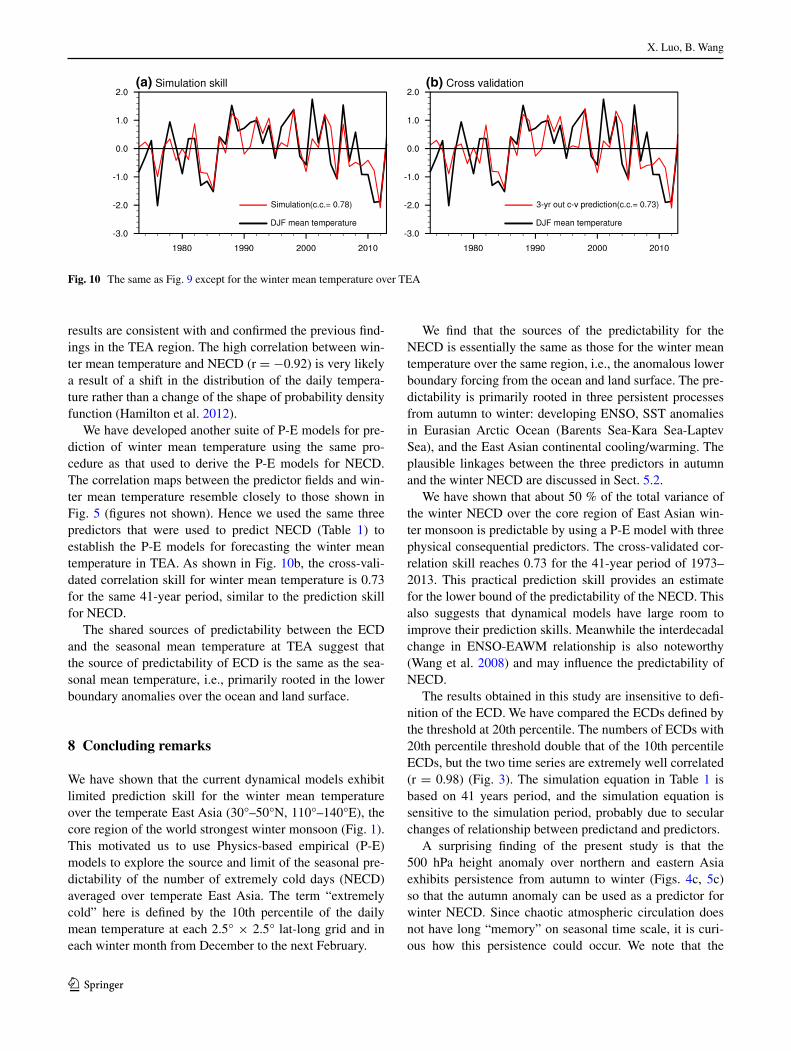
The EA-H500 is not a direct lower boundary anomaly. However, careful inspection of the autumn anomaly shown in Fig. 5 reveals that the 500 hPa height anomalies over the Asian sector, i.e., the Asian Arctic high and East Asian low anomalies (Fig. 5c), are closely linked to the lower boundary temperature anomalies, namely the anomalous warmth over Asian Arctic and the anomalous cooling over East Asia, respectively (Fig. 5a). Therefore, the 500 hPa height anomalies associated with EA-H500, to a large extent, are rooted in the surface anomalous thermal con-ditions and exhibit a deep equivalent barotropic structure. Further analysis shows the correlation coefficient between winter the North Atlantic Oscillation (NAO) index and EA-H500 is −0.40, which is significant 99 % confidence level (Barnston and Livezey 1987). It implies EA-H500 predictor may carry information of NAO signal, which is associated changes of surface temperature and snow cover over the Eurasian continent, and may affect EAWM through thermal advection (Watanabe 2004; Watanabe and Nitta 1999; Gong et al. 2002; Jhun and Lee 2004). Com-parison of Figs. 5c and 8 unravels that the 500 hPa low
Table 1 Definition of selected predictors for prediction of NECD
Name Definition
ARC-SST Sep. and Oct. mean SST (70°N–85°N, 25°E–140°E)
ENSO-DSST Nov. minus Sep. DSST (10°S–10°N, 80°W–130°W)–DSST (15°S–15°N, 120°E–140°E)
EA-H500 SON H500 (20°N–45°N, 90°E–125°E)–H500 (65°N–85°N, 90°E–140°E)
Table 2 The correlation coefficients between NECD and predictors and between any two of the predictors during 1973–2013
The bold (italic) numbers denote statistically significant at 99 % (95 %) confidence level
NECD ENSO-DSST ARC-SST EA-H500
NECD −0.56 0.58 −0.49
ENSO-DSST −0.39 0.19
ARC-SST −0.10
EA-H500
X. Luo, B. Wang
1 3
anomaly over East Asia during SON tends to persist with the center slightly migrating northeastward from (35°N, 110°E) to (45°N, 120°E). The persistence and migration are accompanied by the persistence of the East Asian sur-face air cooling (Fig. 5a) and a cooling tendency across autumn season (Fig. 5b). The EA-H500 predictor signifies the East Asian trough deepening in the ensuing winter. The strengthened East Asian trough can lead to cold winters in East Asia.
(a)
(b)
Fig. 6 Winter circulation anomalies associated with the autumn ARC-SST predictor. a The regressed winter SLP (contours; hPa) and T2m (shaded; °C) anomalies with reference to autumn ARC-SST predictor. The contour interval is 0.5 hPa and positive (negative) con-tours are solid (dashed) lines. The zero contour is not shown. b Same as (a), but for the 500 hPa height anomalies (shaded; gpm). Dots in (a) and (b) indicate regressed anomalies of T2m and 500 hPa geo-potential height significant at 95 % confidence level, respectively
(a)
(b)
(c)
Fig. 7 Winter circulation anomalies associated with the autumn ENSO-DSST predictor. a Regressed winter H850 (contours; gpm), 850 hPa wind (vectors; m s−1) and SST (shaded; °C) anomalies with reference to autumn ENSO-DSST predictor. The contour interval is 4 gpm; positive (negative) contours are solid (dashed) and zero contour is omitted. b Same as (a) but for the precipitation anomalies (shaded; mm/day), 300 hPa zonal wind (contours; m s−1; the contour interval is 1 m s−1) and 300 hPa divergent wind (vectors; m s−1) anomalies. c Same as (a) but for the 500 hPa geopotential height (shaded; gpm) anomalies and 200 hPa wave activity flux (vectors; m2 s−2). Dots in (a–c) indicate region with regressed anomalies of SST, precipitation, and 500 hPa geopotential height significant at 95 % confidence level
How predictable is the winter extremely cold days over temperate East Asia?
1 3
6 Estimation of the predictability of NECD
In order to estimate potential predictability, we establish P-E prediction models with stepwise regression using the data from 1973 to 2013. All three predictors are selected by Stepwise regression with an F-test at 95 % significance level. The prediction equation derived from the training period of 1973–2013 is 2.06 * ARC-SST − 1.64 * ENSO-DSST − 1.94 * EA-H500. The simulation skill for this period reaches 0.78 (Fig. 9a).
We also made a 41-year retrospective forecast. The pre-diction models were derived by using a suite of consecutive 38-year data (leaving 3 years data out around each target prediction year), and then apply the derived model to fore-cast the middle year of the three withheld years. We have calculated the cross-validated correlation skill for the entire period (41 years), which is 0.73 (Fig. 9b), indicating about 50 % of the total variance is potentially predictable. This demonstrates a substantial improvement over the current dynamical prediction skill.
The result shown in this section provides a practical estimate for the lower bound of the potential predictability. The result suggests that the frequency of the extreme cold events during winter in the core region of the East Asian winter monsoon is to a large extent predictable before the season begins. It also provides a promising tool for sea-sonal forecast of the frequency of the extreme events of winter monsoon, since the multi-model ensemble predic-tion of winter extremes over global land only obtained an average correlation skill of 0.28 (Eade et al. 2012).
7 Source of the predictability of the NECD
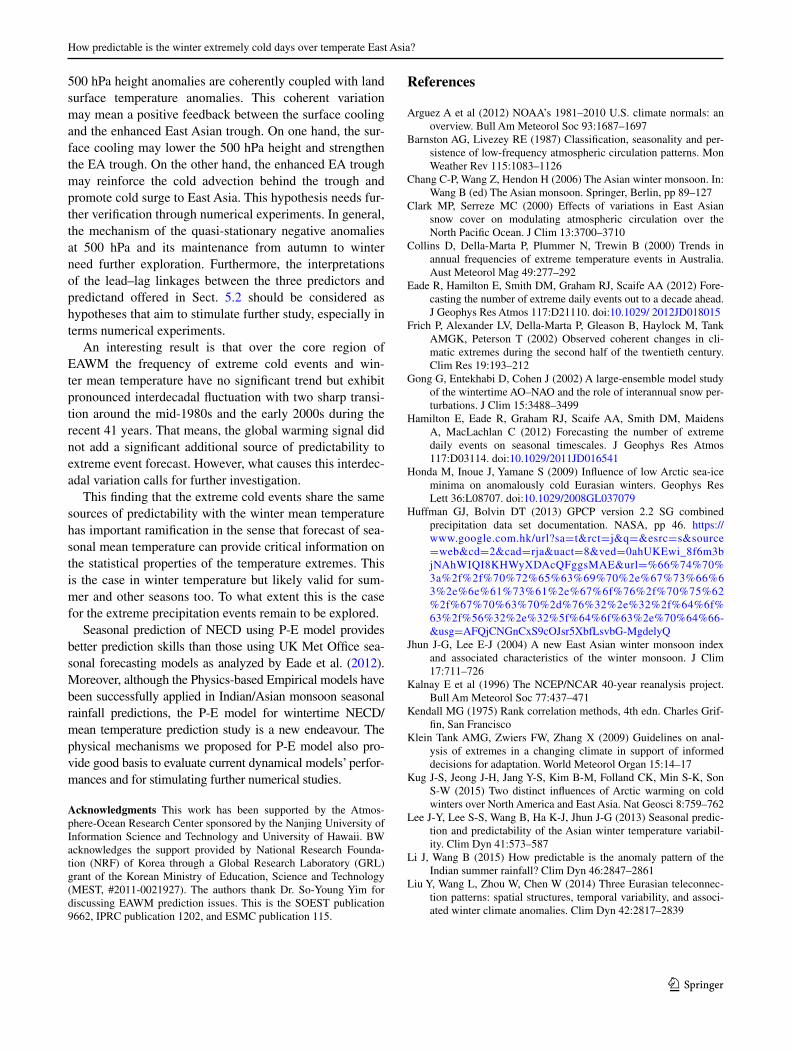
Why are extremely cold events over the TEA region to a large extent predictable? We find that the physical basis for such a prediction is essentially the same as that for pre-diction of the seasonal mean temperature. Strong support-ing evidence is that over the TEA region the winter mean temperature and the area averaged extreme condition (the NECD) are highly correlated.
As shown in Fig. 10, the NECD and the winter mean temperature are nearly out of phase with a correlation coef-ficient of −0.92. Similar to the NECD, the winter mean temperature over TEA exhibits a tiny linear trend with a slope of 0.18 °C/decade, which is statistically insignificant according to Mann–Kendall test (Kendall 1975). Instead, a multi-decadal change is evident with a transition to warm state in the mid-1980s (Wang et al. 2009b) as well as a downward swing since early 2000s (Wang and Chen 2013). Previous studies have suggested a close relationship between seasonal mean and the number of extreme days, and the prediction skill in predicting NECD arises largely from the skill in predicting seasonal mean temperature anomaly (Hamilton et al. 2012; Collins et al. 2000). Our
Fig. 8 Regressed winter (DJF) 500 hPa geopotential height (contour; gpm) anomalies with reference to the autumn EA-H500 predictor. The contour interval is 5 gpm, and zero contour is omitted. Light and heavy color shadings indicate the regressed anomalies significant at 95 and 99 % confidence level, respectively
(a) (b)
Fig. 9 Prediction skills of the physical-empirical (P-E) model. a The time series of observed NECD anomalies (black line) and the simu-lated NECD anomalies (red line). The data used for establishing the P-E model is from 1973 to 2013. The prediction is made at the end of November (0-month lead prediction). The simulated correlation skill
for 1973–2013 is 0.78. b The time series of observed NECD (black line) and predicted NECD (red line) with cross-validation method obtained by taking 3-year out at each prediction step. The cross vali-dated prediction skill for 1973–2013 is 0.73
X. Luo, B. Wang
1 3
results are consistent with and confirmed the previous find-ings in the TEA region. The high correlation between win-ter mean temperature and NECD (r = −0.92) is very likely a result of a shift in the distribution of the daily tempera-ture rather than a change of the shape of probability density function (Hamilton et al. 2012).
We have developed another suite of P-E models for pre-diction of winter mean temperature using the same pro-cedure as that used to derive the P-E models for NECD. The correlation maps between the predictor fields and win-ter mean temperature resemble closely to those shown in Fig. 5 (figures not shown). Hence we used the same three predictors that were used to predict NECD (Table 1) to establish the P-E models for forecasting the winter mean temperature in TEA. As shown in Fig. 10b, the cross-vali-dated correlation skill for winter mean temperature is 0.73 for the same 41-year period, similar to the prediction skill for NECD.
The shared sources of predictability between the ECD and the seasonal mean temperature at TEA suggest that the source of predictability of ECD is the same as the sea-sonal mean temperature, i.e., primarily rooted in the lower boundary anomalies over the ocean and land surface.
8 Concluding remarks
We have shown that the current dynamical models exhibit limited prediction skill for the winter mean temperature over the temperate East Asia (30°–50°N, 110°–140°E), the core region of the world strongest winter monsoon (Fig. 1). This motivated us to use Physics-based empirical (P-E) models to explore the source and limit of the seasonal pre-dictability of the number of extremely cold days (NECD) averaged over temperate East Asia. The term “extremely cold” here is defined by the 10th percentile of the daily mean temperature at each 2.5° × 2.5° lat-long grid and in each winter month from December to the next February.
We find that the sources of the predictability for the NECD is essentially the same as those for the winter mean temperature over the same region, i.e., the anomalous lower boundary forcing from the ocean and land surface. The pre-dictability is primarily rooted in three persistent processes from autumn to winter: developing ENSO, SST anomalies in Eurasian Arctic Ocean (Barents Sea-Kara Sea-Laptev Sea), and the East Asian continental cooling/warming. The plausible linkages between the three predictors in autumn and the winter NECD are discussed in Sect. 5.2.
We have shown that about 50 % of the total variance of the winter NECD over the core region of East Asian win-ter monsoon is predictable by using a P-E model with three physical consequential predictors. The cross-validated cor-relation skill reaches 0.73 for the 41-year period of 1973–2013. This practical prediction skill provides an estimate for the lower bound of the predictability of the NECD. This also suggests that dynamical models have large room to improve their prediction skills. Meanwhile the interdecadal change in ENSO-EAWM relationship is also noteworthy (Wang et al. 2008) and may influence the predictability of NECD.
The results obtained in this study are insensitive to defi-nition of the ECD. We have compared the ECDs defined by the threshold at 20th percentile. The numbers of ECDs with 20th percentile threshold double that of the 10th percentile ECDs, but the two time series are extremely well correlated (r = 0.98) (Fig. 3). The simulation equation in Table 1 is based on 41 years period, and the simulation equation is sensitive to the simulation period, probably due to secular changes of relationship between predictand and predictors.
A surprising finding of the present study is that the 500 hPa height anomaly over northern and eastern Asia exhibits persistence from autumn to winter (Figs. 4c, 5c) so that the autumn anomaly can be used as a predictor for winter NECD. Since chaotic atmospheric circulation does not have long “memory” on seasonal time scale, it is curi-ous how this persistence could occur. We note that the
(a) (b)
Fig. 10 The same as Fig. 9 except for the winter mean temperature over TEA
How predictable is the winter extremely cold days over temperate East Asia?
1 3
500 hPa height anomalies are coherently coupled with land surface temperature anomalies. This coherent variation may mean a positive feedback between the surface cooling and the enhanced East Asian trough. On one hand, the sur-face cooling may lower the 500 hPa height and strengthen the EA trough. On the other hand, the enhanced EA trough may reinforce the cold advection behind the trough and promote cold surge to East Asia. This hypothesis needs fur-ther verification through numerical experiments. In general, the mechanism of the quasi-stationary negative anomalies at 500 hPa and its maintenance from autumn to winter need further exploration. Furthermore, the interpretations of the lead–lag linkages between the three predictors and predictand offered in Sect. 5.2 should be considered as hypotheses that aim to stimulate further study, especially in terms numerical experiments.
An interesting result is that over the core region of EAWM the frequency of extreme cold events and win-ter mean temperature have no significant trend but exhibit pronounced interdecadal fluctuation with two sharp transi-tion around the mid-1980s and the early 2000s during the recent 41 years. That means, the global warming signal did not add a significant additional source of predictability to extreme event forecast. However, what causes this interdec-adal variation calls for further investigation.
This finding that the extreme cold events share the same sources of predictability with the winter mean temperature has important ramification in the sense that forecast of sea-sonal mean temperature can provide critical information on the statistical properties of the temperature extremes. This is the case in winter temperature but likely valid for sum-mer and other seasons too. To what extent this is the case for the extreme precipitation events remain to be explored.
Seasonal prediction of NECD using P-E model provides better prediction skills than those using UK Met Office sea-sonal forecasting models as analyzed by Eade et al. (2012). Moreover, although the Physics-based Empirical models have been successfully applied in Indian/Asian monsoon seasonal rainfall predictions, the P-E model for wintertime NECD/mean temperature prediction study is a new endeavour. The physical mechanisms we proposed for P-E model also pro-vide good basis to evaluate current dynamical models’ perfor-mances and for stimulating further numerical studies.
Acknowledgments This work has been supported by the Atmos-phere-Ocean Research Center sponsored by the Nanjing University of Information Science and Technology and University of Hawaii. BW acknowledges the support provided by National Research Founda-tion (NRF) of Korea through a Global Research Laboratory (GRL) grant of the Korean Ministry of Education, Science and Technology (MEST, #2011-0021927). The authors thank Dr. So-Young Yim for discussing EAWM prediction issues. This is the SOEST publication 9662, IPRC publication 1202, and ESMC publication 115.
References
Arguez A et al (2012) NOAA’s 1981–2010 U.S. climate normals: an overview. Bull Am Meteorol Soc 93:1687–1697
Barnston AG, Livezey RE (1987) Classification, seasonality and per-sistence of low-frequency atmospheric circulation patterns. Mon Weather Rev 115:1083–1126
Chang C-P, Wang Z, Hendon H (2006) The Asian winter monsoon. In: Wang B (ed) The Asian monsoon. Springer, Berlin, pp 89–127
Clark MP, Serreze MC (2000) Effects of variations in East Asian snow cover on modulating atmospheric circulation over the North Pacific Ocean. J Clim 13:3700–3710
Collins D, Della-Marta P, Plummer N, Trewin B (2000) Trends in annual frequencies of extreme temperature events in Australia. Aust Meteorol Mag 49:277–292
Eade R, Hamilton E, Smith DM, Graham RJ, Scaife AA (2012) Fore-casting the number of extreme daily events out to a decade ahead. J Geophys Res Atmos 117:D21110. doi:10.1029/ 2012JD018015
Frich P, Alexander LV, Della-Marta P, Gleason B, Haylock M, Tank AMGK, Peterson T (2002) Observed coherent changes in cli-matic extremes during the second half of the twentieth century. Clim Res 19:193–212
Gong G, Entekhabi D, Cohen J (2002) A large-ensemble model study of the wintertime AO–NAO and the role of interannual snow per-turbations. J Clim 15:3488–3499
Hamilton E, Eade R, Graham RJ, Scaife AA, Smith DM, Maidens A, MacLachlan C (2012) Forecasting the number of extreme daily events on seasonal timescales. J Geophys Res Atmos 117:D03114. doi:10.1029/2011JD016541
Honda M, Inoue J, Yamane S (2009) Influence of low Arctic sea-ice minima on anomalously cold Eurasian winters. Geophys Res Lett 36:L08707. doi:10.1029/2008GL037079
Huffman GJ, Bolvin DT (2013) GPCP version 2.2 SG combined precipitation data set documentation. NASA, pp 46. https://www.google.com.hk/url?sa=t&rct=j&q=&esrc=s&source=web&cd=2&cad=rja&uact=8&ved=0ahUKEwi_8f6m3bjNAhWIQI8KHWyXDAcQFggsMAE&url=%66%74%70%3a%2f%2f%70%72%65%63%69%70%2e%67%73%66%63%2e%6e%61%73%61%2e%67%6f%76%2f%70%75%62%2f%67%70%63%70%2d%76%32%2e%32%2f%64%6f%63%2f%56%32%2e%32%5f%64%6f%63%2e%70%64%66-&usg=AFQjCNGnCxS9cOJsr5XbfLsvbG-MgdelyQ
Jhun J-G, Lee E-J (2004) A new East Asian winter monsoon index and associated characteristics of the winter monsoon. J Clim 17:711–726
Kalnay E et al (1996) The NCEP/NCAR 40-year reanalysis project. Bull Am Meteorol Soc 77:437–471
Kendall MG (1975) Rank correlation methods, 4th edn. Charles Grif-fin, San Francisco
Klein Tank AMG, Zwiers FW, Zhang X (2009) Guidelines on anal-ysis of extremes in a changing climate in support of informed decisions for adaptation. World Meteorol Organ 15:14–17
Kug J-S, Jeong J-H, Jang Y-S, Kim B-M, Folland CK, Min S-K, Son S-W (2015) Two distinct influences of Arctic warming on cold winters over North America and East Asia. Nat Geosci 8:759–762
Lee J-Y, Lee S-S, Wang B, Ha K-J, Jhun J-G (2013) Seasonal predic-tion and predictability of the Asian winter temperature variabil-ity. Clim Dyn 41:573–587
Li J, Wang B (2015) How predictable is the anomaly pattern of the Indian summer rainfall? Clim Dyn 46:2847–2861
Liu Y, Wang L, Zhou W, Chen W (2014) Three Eurasian teleconnec-tion patterns: spatial structures, temporal variability, and associ-ated winter climate anomalies. Clim Dyn 42:2817–2839
X. Luo, B. Wang
1 3
Luo X, Zhang Y (2015) The linkage between upper-level jet streams over East Asia and East Asian winter monsoon variability. J Clim 28:9013–9028
Mann HB (1945) Nonparametric tests against trend. Econom J Econom Soc 13:245–259
Michaelsen J (1987) Cross-validation in statistical climate forecast models. J Climate Appl Meteorol 26:1589–1600
Pepler AS, Díaz LB, Prodhomme C, Doblas-Reyes FJ, Kumar A (2015) The ability of a multi-model seasonal forecasting ensem-ble to forecast the frequency of warm, cold and wet extremes. Weather Clim Extremes 9:68–77
Smith TM, Reynolds RW, Peterson TC, Lawrimore J (2008) Improve-ments to NOAA’s historical merged land–ocean surface tempera-ture analysis (1880–2006). J Clim 21:2283–2296
Thompson DWJ, Wallace JM (1998) The Arctic oscillation signature in the wintertime geopotential height and temperature fields. Geophys Res Lett 25:1297–1300
Wang L, Chen W (2013) The East Asian winter monsoon: re-amplifi-cation in the mid-2000s. Chin Sci Bull 59:430–436
Wang L, Chen W (2014) An intensity index for the East Asian winter monsoon. J Clim 27:2361–2374
Wang B, Wu R, Fu X (2000) Pacific-East Asian teleconnection: how does ENSO affect East Asian climate? J Clim 13:1517–1536
Wang L, Chen W, Huang R (2008) Interdecadal modulation of PDO on the impact of ENSO on the east Asian winter monsoon. Geo-phys Res Lett 35:L20702
Wang B et al (2009a) Advance and prospectus of seasonal prediction: assessment of the APCC/CliPAS 14-model ensemble retrospec-tive seasonal prediction (1980–2004). Clim Dyn 33:93–117
Wang L, Huang R, Gu L, Chen W, Kang L (2009b) Interdecadal variations of the East Asian winter monsoon and their asso-ciation with quasi-stationary planetary wave activity. J Clim 22:4860–4872
Wang B, Wu Z, Chang C-P, Liu J, Li J, Zhou T (2010) Another look at interannual-to-interdecadal variations of the East Asian winter monsoon: the northern and southern temperature modes. J Clim 23:1495–1512
Wang B, Xiang B, Li J, Webster PJ, Rajeevan MN, Liu J, Ha KJ (2015) Rethinking Indian monsoon rainfall prediction in the context of recent global warming. Nat Commun 6:7154. doi:10.1038/ncomms8154
Watanabe M (2004) Asian jet waveguide and a downstream extension of the North Atlantic Oscillation. J Clim 17:4674–4691
Watanabe M, Nitta T (1999) Decadal changes in the atmospheric cir-culation and associated surface climate variations in the North-ern Hemisphere winter. J Clim 12:494–510
Weisheimer A et al (2009) ENSEMBLES: a new multi-model ensem-ble for seasonal-to-annual predictions—skill and progress beyond DEMETER in forecasting tropical Pacific SSTs. Geo-phys Res Lett 36:L21711
Xing W, Wang B, Yim SY (2014) Peak-summer East Asian rainfall predictability and prediction part I: Southeast Asia. Clim Dyn. 47:1–13. doi:10.1007/s00382-014-2385-0
Yim S-Y, Wang B, Xing W (2014) Prediction of early summer rain-fall over South China by a physical–empirical model. Clim Dyn 43:1883–1891
Zhang X, Yang F (2004) RClimDex (1.0) user manual. http://etccdi.pacificclimate.org/RClimDex/RClimDexUserManual.doc
Zhang R, Sumi A, Kimoto M (1996) Impact of El Niño on the East Asian Monsoon: a diagnostic study of the ‘86/87 and ‘91/92 events. J Meteorol Soc Jpn Ser II 74:49–62
Zhang X et al (2011) Indices for monitoring changes in extremes based on daily temperature and precipitation data. Wiley Inter-discip Rev Clim Change 2:851–870