how students think about experimental design: novel
TRANSCRIPT

Education
http://bioscience.oxfordjournals.org February 2014 / Vol. 64 No. 2 • BioScience 125
BioScience 64: 125–137. © The Author(s) 2013. Published by Oxford University Press on behalf of the American Institute of Biological Sciences. All rights reserved. For Permissions, please e-mail: [email protected]. doi:10.1093/biosci/bit016 Advance Access publication 18 December 2013
How Students Think about Experimental Design: Novel Conceptions Revealed by in-Class Activities
SARA E. BROWNELL, MARY PAT WENDEROTH, RODDY THEOBALD, NNADOZIE OKOROAFOR, MIKHAIL KOVAL, SCOTT FREEMAN, CRISTINA L. WALCHER-CHEVILLET, AND ALISON J. CROWE
Experimental design is a fundamental skill for scientists, but it is often not explicitly taught in large introductory biology classes. We have designed two pencil-and-paper in-class activities to increase student understanding of experimental design: an analyze activity, in which students are asked to evaluate data, and a design activity, in which students are asked to propose a novel experiment. We found that students who completed the design activity but not the analyze activity performed significantly better on the Expanded Experimental Design Ability Tool (E-EDAT) than did students who attended a didactic lecture about experimental design. By using grounded theory on student responses on the in-class activities, we have identified a novel set of accurate and inaccurate conceptions focused on two aspects of experimental design: sample size and the repetition of experiments. These findings can be used to help guide science majors through mastering the fundamental skill of designing rigorous experiments.
Keywords: experimental design, education, learning progression, active learning, large lecture
Experimental design is a fundamental skill, essential for achieving success in science (Coil et al. 2010) and
gaining fluency in scientific literacy and critical thinking in general (Brewer and Smith 2011). However, explicit instruction and practice in experimental design is often lacking in introductory biology lecture courses because of perceived time pressures, large class sizes, and the need to emphasize content rather than skills (Dirks and Cunningham 2006).
Efforts have been made to develop activities to test and improve students’ skills and knowledge of experimental design (Hoefnagels 2002, Hiebert 2007, White et al. 2009, Pollack 2010, Sirum and Humburg 2011, D’Costa and Schlueter 2013, Kloser et al. 2013). In addition, students’ understanding of the significance of controls has been addressed in many studies (Shadmi 1981, Chen and Klahr 1999, Lin and Lehman 1999, Boudreaux et al. 2008, Shi et al. 2011). In biology, the development of a validated assess-ment to measure student understanding of experimental design (Sirum and Humburg 2011) illustrated how chal-lenging it is for introductory-level college students to design well-controlled experiments. However, despite this body of
research, there are few studies in which students’ accurate and inaccurate conceptions about experimental design have been identified (Kanari and Millar 2004, White et al. 2009, Colon-Berlingeri and Burrows 2011). Therefore, there is a need for additional studies to investigate how best to teach this topic to introductory biology students and what aspects of experimental design are particularly difficult for students to grasp.
In this Education article, we describe two pencil-and-paper in-class group activities designed to test alternative hypotheses about how best to teach experimental design in a large introductory biology classroom. We describe the relative effectiveness of these activities in the improvement of students’ experimental design ability and discuss specific accurate and inaccurate conceptions that we identified from student responses to the in-class activities. To deter-mine whether inaccurate conceptions persist as students progress through the undergraduate biology curriculum, we have also assessed students enrolled in upper-level biology courses on their understanding of two key ele-ments of experimental design: sample size and repeating an experiment.
Dow
nloaded from https://academ
ic.oup.com/bioscience/article-abstract/64/2/125/231866 by guest on 24 August 2019
Education
126 BioScience • February 2014 / Vol. 64 No. 2 http://bioscience.oxfordjournals.org
Development of in-class paper-and-pencil activities focused on experimental designNumerous studies have demonstrated that active learning approaches more effectively increase student learning than do traditional lectures (Hake 1998, Beichner et al. 2007, Freeman et al. 2007). However, there have been few studies on the relative effectiveness of different types of active learn-ing approaches for helping students learn specific concepts (Eddy et al. 2013). Our first goal was to develop in-class activities to test alternative hypotheses for how best to teach experimental design in a large introductory biology lecture hall. On the basis of previous studies (Boudreaux et al. 2008, Crowe et al. 2008), we reasoned that student understanding of experimental design could be improved by working in a group (a) to develop a hypothesis and design an experiment to test that hypothesis (the design activity; see supplemental appendices A1 and A2) or (b) to analyze and draw appropri-ate conclusions from mock experimental data (the analyze activity; see supplemental appendices B1 and B2). Both tasks require higher-order thinking and are considered high level on Bloom’s taxonomy of cognitive domains (Bloom and Krathwohl 1956); however, the first activity requires synthesis-level skills, whereas the second relies on analysis and evaluation skills.
The in-class activities were based on a nontechnical sce-nario approachable for students taking their first biology course. Both activities prompted the students to consider the basic elements of a well-designed experiment and were structured as a series of guided prompts (Lin and Lehman 1999). We designed both activities with the goal of improv-ing students’ ability to explain the importance of the ele-ments included in an experimental design and to recognize the iterative nature of science and the tentative nature of results (Giere 2004). The activities were pilot tested twice with students in a large introductory biology course and revised before the final versions were administered. The data reported in this article are from the student responses to the final version of the activities.
Implementation of the activitiesStudents enrolled in Biology 180, the first course of a three-quarter introductory biology series at a large public research university, completed the activities on the second day of class in autumn 2011. This introductory biology course is a required gateway course for all students interested in major-ing in biological sciences and is focused on the topics of ecology and evolution. Typical enrollment is approximately 600–800 students, primarily sophomores. All of the students attend the same lecture period and are asked to sit with students from their lab sections. For the in-class activity, the students self-aggregated into groups of two or three on the basis of where they were sitting in the large traditional lecture hall, and the student groups were randomly assigned one of the two activities to complete in the lecture hall. While they were working on the activity, the students could request help from other groups, the instructor, or teaching
assistants (TAs). One instructor and 16 TAs (approximately 40 students per TA) circulated around the room to answer questions while the students were working on the activities. Because these activities were administered on the second day of class, the TAs had only minimal experience facili-tating group discussions, so they primarily responded to student-generated questions. Participation points were given for completing the activity, independent of performance. Approval for this study was obtained from the University of Washington Institutional Review Board (application no. 36743).
Assessment of experimental design abilityTo measure the impact of the in-class activity on students’ ability to design an experiment, we adapted the Experimental Design Ability Tool (EDAT; Sirum and Humburg 2011) to create the Expanded EDAT (E-EDAT). The EDAT is an open-ended response instrument administered as a pre- and posttest in which students are asked to design an investiga-tive strategy to address a company’s claim regarding one of its products (Sirum and Humburg 2011). The instrument is content independent; it works particularly well for intro-ductory biology students and nonmajors, because it does not require any technical expertise. However, in our initial administration of the EDAT, we found that several of the grading criteria did not discriminate among our students. To enhance the discrimination ability of the test, we created the E-EDAT by adding prompts to the EDAT that direct students to (a) design an experiment that would test a com-pany’s claim, (b) provide justification for each element of their research design, and (c) state whether the conclusions drawn from their proposed study could prove the company’s claim (supplemental appendix C1).
To score the students’ responses on the E-EDAT, we developed an expanded scoring rubric (supplemental appendix C2) that awarded the students points for recog-nizing that they needed to include an experimental design element (e.g., a large sample size) and for giving an appro-priate explanation of why that element was needed (e.g., to account for natural variability in the population). We were particularly interested in their reasoning, because it had previously been shown that students often understand what components are important for experimental design but do not necessarily know why they should use them (Boudreaux et al. 2008). We did not introduce any novel elements to the E-EDAT, but through an iterative process based on student responses on the EDAT, we altered the scoring to reflect both an inclusion of essential elements and appropriate reasoning for including those elements. Whether a response warranted partial credit or full credit for a criterion on the E-EDAT was determined through an iterative process with four different raters, who scored the E-EDAT responses independently and then held norm-ing sessions to come to agreement on what score to give a particular response. Content validity of the final rubric was affirmed by asking three experts in biology to confirm that
Dow
nloaded from https://academ
ic.oup.com/bioscience/article-abstract/64/2/125/231866 by guest on 24 August 2019
Education
http://bioscience.oxfordjournals.org February 2014 / Vol. 64 No. 2 • BioScience 127
the scoring rubric was scientifically accurate and relevant to the understanding of experimental design. Unlike the binary system employed in the original EDAT rubric, this expanded scoring system allowed us to identify students with an intermediate understanding of a concept. The stu-dents could receive 17 points using the E-EDAT scoring rubric, as opposed to the 10 points possible on the original EDAT (Sirum and Humburg 2011).
The students completed the E-EDAT online, outside of class; the pretest was completed the evening before the in-class activity, and the posttest was completed the eve-ning after the in-class activity. Only those students who participated in the in-class activity, completed the pre- and posttests, and consented to have their data analyzed were included in the study. From a consenting population of 357 students who completed the design activity and 276 students who completed the analyze activity, we selected a random subset of pre- and posttests to score with the expanded rubric and then included only the responses from the con-senting students in the final analysis (n = 87 in the design activity group; n = 95 in the analyze activity group). All of our future references to the effectiveness of the in-class activities are based on the data from this randomly selected subset of the students’ pre- and posttests. The E-EDATs were scored blindly by two independent graders. To assess the level of agreement between the graders, we calculated the interrater reliability using Cohen’s kappa coefficient for a subset of blinded responses (90 responses each on the pre- and posttests) graded independently by each grader. The interrater reliability on individual questions ranged from .54 to .89, with a reliability of .76 across all of the questions. This indicates moderately strong agreement between the two graders and illustrates that the expanded scoring rubric provides sufficient guidance to achieve reliability between independent graders.
We compared the experimental design ability of students who completed the in-class activities with that of students who learned experimental design through a traditional lecture by measuring learning gains on the E-EDAT. The students in all three comparison groups (i.e., design activity, analyze activity, lecture) were enrolled in Biology 180, but the students who participated in the didactic lecture took the course in a different term and with a different instructor. The students in the traditional lecture course were assigned the same readings and received instruction of equivalent length to the in-class activities on the scientific method and experi-mental design. The lecture included examples of experimen-tal data that illustrated inherent variation in a population and variable outcomes from repeating an experiment with a different population. The lecture also included explicit statements that a hypothesis can never be definitively proven (one of the elements scored on the assessment). One hun-dred student pre- and posttest responses were randomly selected from the lecture group and scored; we compared the lecture students’ learning gains with the gains attained by the students who completed the activities.
Identification of students’ accurate and inaccurate conceptions regarding experimental designMany terms have been used to describe student con-ceptions, including naive conceptions (Strike and Posner 1992), alternative conceptions (Mak et al. 1999, Poehnl and Bogner 2013), preconceptions (Clement et al. 1989, Ryan and Aikenhead 1992), misconceptions (Coley and Tanner 2012, Yates and Marek 2013), and inaccurate conceptions (Zuckerman 1994, Edens and Potter 2003). In this article, we will use a model of describing student conceptions as either accurate or inaccurate, defining accurate as being in accordance with what is known to be scientifically true and confirmed by a group of expert scientists. The students’ handwritten responses to questions posed on the in-class activity worksheets were transcribed and coded as accurate, inaccurate, a mixed model that was a combination of accu-rate and inaccurate, or too vague to determine accuracy. A response was classified as vague if it was incomplete, did not answer the question, or was so general that we could not determine whether the student held an inaccurate or accurate conception. We took a conservative approach in our analysis by removing vague answers from the data set so that we did not incorrectly infer what the students were thinking (Gormally et al. 2012).
We chose to focus on two aspects of experimental design that we determined were challenging for the students on the basis of their low E-EDAT scores: sample size and repeat-ing an experiment (supplemental table S1). The majority of the students’ answers on the E-EDAT did not include any mention of sample size or repetition, which may be because of the open-ended nature of the E-EDAT, which does not contain specific prompts for students to address each of these aspects of experimental design. Alternatively, it could be because the students did not think that sample size and repeating an experiment are important elements of experimental design. The commonality between these two elements is that both sample size and repeating an experi-ment are relevant to one’s confidence in a conclusion based on a given set of data and require an understanding of the inherent variation that exists in biological populations; they both help students understand the iterative, tentative nature of scientific results.
In order to assess the quality of the students’ conceptions, we analyzed their responses on the in-class worksheets, because the students were explicitly asked to consider sample size and repeating an experiment as they completed those worksheets (table 1). Grounded theory was used to identify specific conceptions—both accurate and inac-curate conceptions—that the students held about sample size and repeating an experiment from the in-class activi-ties. Grounded theory is a process by which researchers do not hold previous ideas or hypotheses about the data; rather, the themes emerge from the data itself (Glaser and Strauss 1967). We decided to use this method as a way to examine the students’ responses without prior bias in order to uncover potentially novel conceptions. Two raters then
Dow
nloaded from https://academ
ic.oup.com/bioscience/article-abstract/64/2/125/231866 by guest on 24 August 2019
Education
128 BioScience • February 2014 / Vol. 64 No. 2 http://bioscience.oxfordjournals.org
scored the students’ written answers on the in-class activities for the presence of these conceptions. The raters’ agreement averaged 70%, and disagreement in coding was discussed to achieve consensus. To achieve expert validation, we asked a group of five expert biologists (expert was defined as hold-ing a PhD in a biology-related field) in our research group to review the list of identified accurate and inaccurate con-ceptions (see the tables), and they agreed with the raters’ designations. In addition, we asked a group of three outside expert biologists to confirm the designations.
Comparing introductory students with advanced students to determine whether inaccurate conceptions persist throughout the curriculumWe also surveyed undergraduate biology majors enrolled in 400-level (senior-level) courses (n = 122) to assess their understanding of the importance of sample size and repeat-ing an experiment and to investigate whether they main-tained the inaccurate conceptions held by the introductory students. Using an online survey, the advanced students were asked a subset of the questions from the analyze activ-ity, because the question prompts were more direct and elic-ited fewer vague conceptions than did the question prompts of the design activity. These students received participation points for completing the questions regardless of the accu-racy of their responses. The same two independent raters who coded the introductory student responses coded the advanced student responses, using the same set of categories described for the introductory students. Rater agreement was established to be over 70%, and disagreements in coding were discussed to achieve consensus.
Statistical analysisAs a preliminary analysis, Student’s t-tests were used to compare the students’ gain scores on the E-EDAT among the three groups: the students who completed the design activity, the students who completed the analyze activity, and the stu-dents who were in the lecture course. The gains were calcu-lated as the posttest score minus the pretest score. However, there are some differences in the characteristics of the stu-dents in the three groups (see table 2) that may be correlated with the test score gains. To control for these differences, we used a multiple linear regression model in which each stu-dent’s test score gain was the response variable, and observ-able student characteristics, including gender, ethnicity, socioeconomic status, grade point average, and verbal SAT score, serve as predictor variables. This regression model produces estimates of two treatment effects: the treatment
effect of the design activity relative to the lecture and the treatment effect of the analyze activity relative to the lecture. In each case, the treatment effect is the average difference in test score gains between the two groups, holding observable characteristics of students in the two groups constant.
In order to determine significant differences in the student conceptions derived from grounded theory, a chi-squared analysis was used to compare the inaccurate, mixed model, and accurate conceptions, and t-tests were used for comparing the specific student conceptions (α = .05).
Finding 1: An active approach leads to greater understanding of experimental design than passive lecturing does. The introduc-tory biology students showed gains in their ability to design an experiment after the in-class pencil-and-paper activities, independent of the type of activity, and the students who completed the design activity had significantly higher gains than did the students who attended a didactic lecture.
We found that the students who completed the design and the students who completed the analyze activity had similar learning gains when their pre- and posttests were compared (p = .21). However, only the students who completed the design activity demonstrated significantly higher gains on the E-EDAT than the group of students who learned about experi-mental design through the didactic lecture (t-test, p < .05; figure 1). The average score on the posttest for all of the groups was 7.6 out of 17, with no individual group scoring higher than 8.1, which indicated no ceiling effect (table S1). The learning gains could be seen in multiple criteria (table S1) and could not be attributed to one particular aspect of the E-EDAT.
The results of the linear regression model used to con-trol for differences in the observable characteristics of the students in the three groups (table 2) indicate that, holding individual student characteristics constant, the students who completed the design experiment gained almost half a point more out of 17 possible points, on average, than did the stu-dents in the lecture class, so the differences in the E-EDAT scores are likely due to the differences in activities, not to differences in the student population (p = .022; table 3). The observation that the students in the lecture group did not show gains from the pretest to the posttest indicates that the process of taking the E-EDAT itself did not lead to learning.
To account for the possibility that the variability in test scores may have differed among the three groups, we used Cohen’s d to calculate a standardized effect size for each group, which expresses the difference between groups in units of standard deviations. With pretest–posttest data, it is appropriate to use a modification of Cohen’s d that accounts
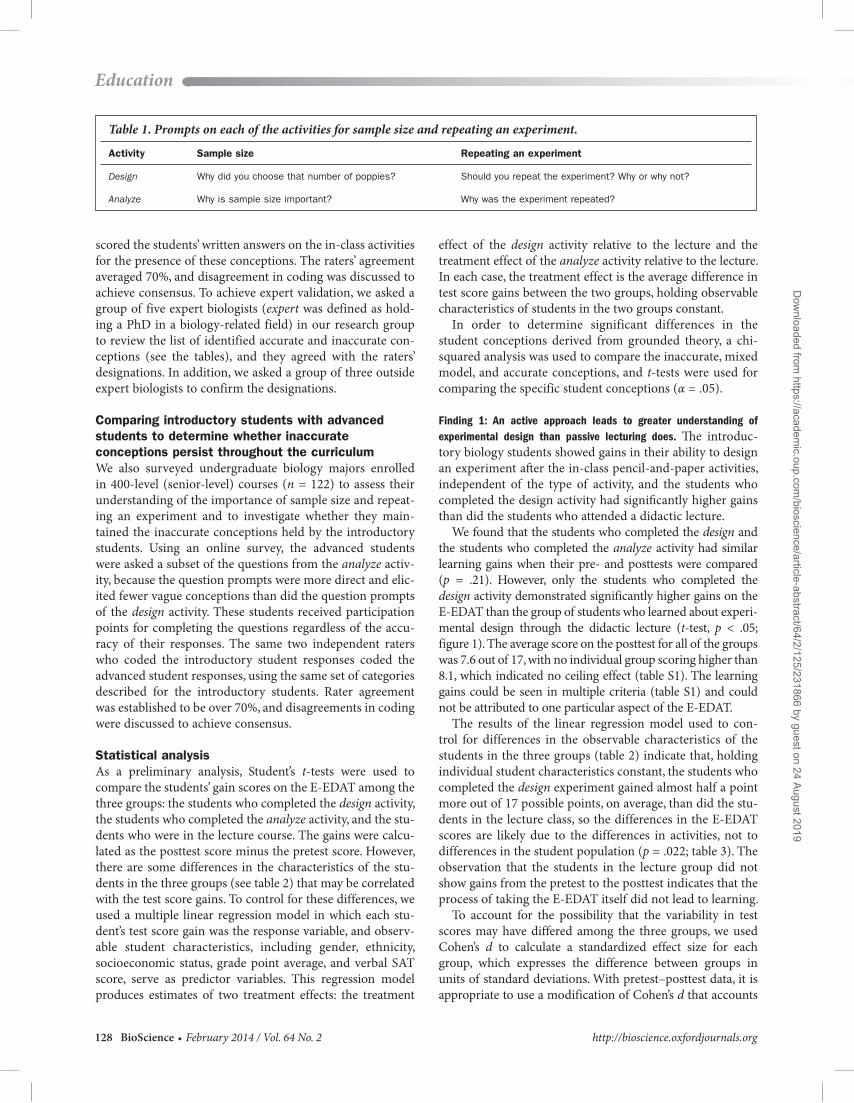
Table 1. Prompts on each of the activities for sample size and repeating an experiment.
Activity Sample size Repeating an experiment
Design Why did you choose that number of poppies? Should you repeat the experiment? Why or why not?
Analyze Why is sample size important? Why was the experiment repeated?
Dow
nloaded from https://academ
ic.oup.com/bioscience/article-abstract/64/2/125/231866 by guest on 24 August 2019

Education
http://bioscience.oxfordjournals.org February 2014 / Vol. 64 No. 2 • BioScience 129
Table 2. Demographic information for the subset of students who completed the activities or experienced a didactic lecture and whose scores were analyzed.
Design (n = 87)
Analyze (n = 95)
Lecture (n = 100)
Grade point average 3.36* 3.28 3.23
SAT verbal score 609 593 585
Low socioeconomic statusa (percentage of the respondents, %) 8.0* 12.6 19.0
Racial or ethnic identity (%)
African American 2.3 4.2 2.0
American Indian 1.1 0.0 3.0
Asian 33.3 34.7 39.0
White 51.7 43.2 37.0
Hawaiian or Pacific Islander 1.1 1.1 2.0
Hispanic 2.3 2.1 5.0
International 5.7 9.5 8.0
No race information 2.3 5.3 4.0
Female (%) 63.2 62.1 66.0
aLow socioeconomic status was measured by admission into the Equal Opportunity Program. *p < .05.
Figure 1. Students who completed the design activity scored higher on the Expanded Experimental Design Ability Tool (E-EDAT) than did students who experienced only a lecture on experimental design (design activity, n = 87; analyze activity, n = 95; lecture, n = 100; design–analyze comparison, p = .210; design–lecture comparison, p = .018; analyze–lecture comparison, p = .275). The gain was calculated as the posttest score minus the pretest score. The error bars represent the standard error.
Dow
nloaded from https://academ
ic.oup.com/bioscience/article-abstract/64/2/125/231866 by guest on 24 August 2019

Education
130 BioScience • February 2014 / Vol. 64 No. 2 http://bioscience.oxfordjournals.org
for the same students’ being tested twice (Andrews et al. 2011). Therefore, we calculate the effect size for each group as
where X–post and X–pre are the average scores on the posttest and pretest, respectively; sg is the standard deviation of the raw gain scores; and r is the correlation between student scores on the pre- and posttests. The effect size was .367 in the design group, .209 in the analyze group, and .055 in the lecture group.
Finding 2: Introductory students do not have a strong understanding of the importance of sample size and repeating an experiment. The analysis of the introductory students’ written responses on the in-class activity worksheets revealed that the students harbored three distinct levels of understanding about sample size and repeating an experiment: accurate, inaccurate, and a combination of accurate and inaccurate conceptions (figure 2a, 2b). If we combine the student responses that were completely inaccurate with those that contained mixed con-ceptions, we see that the majority of the student responses on the design activity and the analyze activity contained some inaccurate conceptions about both sample size (design, 75.2%; analyze, 69.8%) and repeating an experiment (design, 63.4%; analyze, 81.1%). The students’ responses revealed more inaccurate conceptions surrounding the purpose of repeating an experiment than regarding the importance of sample size for both the design (45.5%) and the analyze (52.2%) activities (t-test, p < .01). Interestingly, the design activity responses contained significantly fewer inaccurate conceptions about sample size than did the analyze activity responses (10.2% and 39.6%, respectively; t-test, p < .01).
Notably, there were significantly more vague answers to the question about sample size in the design activity (47.3%) than in the analyze activity (12.7%) (data not shown).
However, when students were prompted to provide reason-ing for repeating an experiment, their responses contained similar percentages of vague responses in both activities (design, 11.8%; analyze, 17.4%). Vague responses may reflect confused thinking, a misinterpretation of the question, or a low level of motivation to answer the question.
Finding 3: Novel accurate conceptions and inaccurate conceptions were identified from introductory student responses for sample size and repeating an experiment on the in-class activities. In order to further explore what conceptions the students held about sample size and repeating an experiment, we used grounded theory to identify three distinct accurate concep-tions (table 4a) and three distinct inaccurate conceptions (table 4b) about sample size. We also identified three distinct accurate conceptions (table 5a) and seven distinct inaccu-rate conceptions (table 5b) about repeating an experiment. Several students who completed the design activity (8.9%) stated that it was not necessary to repeat an experiment, particularly if the sample size was large enough. Because the analyze activity did not allow the students this option, we cannot conclude whether this idea is a general inaccu-rate conception held by introductory students or whether the nature of the design exercise led the students to this conception.
Finding 4: Some inaccurate conceptions are “sticky.” The advanced students held fewer inaccurate and more accurate concep-tions than did the introductory students who completed the analyze activity, but over a third of the advanced students continued to harbor inaccurate conceptions.
We surveyed the advanced biology majors’ understand-ing of experimental design by asking them the same ques-tions about sample size and repeating an experiment that were included in the analyze activity. We found that the advanced students held significantly more accurate concep-tions (advanced, 57.3%; introductory, 30.2%) and fewer inaccurate conceptions about sample size (advanced, 14.5%;
Table 3. Multiple linear regression of gain scores against individual student characteristics.
Variable correlated with gain score Coefficient Standard error t p
Intercept .050 0.831 0.060 .952
Grade point average –.016 0.223 –0.071 .944
SAT verbal score .000 0.001 –0.127 .899
Underrepresented minority .441 0.396 1.112 .267
Low socioeconomic status –.265 0.334 –0.793 .429
Female .284 0.182 1.563 .119
Design group .498 0.217 2.298 .022*
Analyze group .248 0.211 1.175 .241
*p < .05.
Dow
nloaded from https://academ
ic.oup.com/bioscience/article-abstract/64/2/125/231866 by guest on 24 August 2019

Education
http://bioscience.oxfordjournals.org February 2014 / Vol. 64 No. 2 • BioScience 131
introductory 39.6%) than did the introductory students who completed the analyze activity (ps < .05; figure 3). Similarly, in describing their reasoning for repeating an experiment, the advanced students held significantly more accurate conceptions (advanced, 56.1%; introductory, 18.9%) and fewer inaccurate conceptions (advanced, 9.6%; introductory, 52.2%) than did the introductory students (ps < .05).
When we combine the student responses that were completely inaccurate with those containing mixed con-ceptions, we see that the majority of responses from the advanced students contained accurate conceptions about both sample size (57.3%) and repeating an experiment (56.1%). However, we still identified a notable percentage of
inaccurate conceptions in the advanced students’ responses (42.7% for sample size, 43.8% for repeating an experiment), which indicate that these conceptions about experimental design persist even among students who have almost com-pleted the undergraduate biology curriculum.
We found that the advanced students held more accurate conceptions (table 6a) and fewer inaccurate conceptions (table 6b) about sample size than did their introductory-level counterparts. Specifically, significantly more advanced stu-dent responses (77.3%) than introductory student responses (53.1%) exhibited the accurate conception that a larger sample size is good (p < .05; table 6a). However, there was no significant difference in the advanced and introductory
Figure 2. Introductory students’ conceptions of (a) sample size and (b) repeating an experiment. For responses regarding the rationale for sample size, the data are shown as percentages of the total number of student group responses (n = 69 for the design group, n = 96 for the analyze group). The student group responses for the design activity were completely inaccurate (10.2%), completely accurate (24.6%,) or a mix of accurate and inaccurate (65.2%) conceptions; the differences between these groups are statistically significant (chi-squared analysis, p < .001). The student group responses for the analyze activity were completely inaccurate (39.6%), completely accurate (30.2%), or a mix of accurate and inaccurate (30.2%). Chi-squared analysis indicates that these differences are not statistically significant. The student responses that were too vague to code have been removed. There was a statistically significant difference between the design and analyze student responses for inaccurate and mixed conceptions (Student’s t-test, p < .01). For responses regarding the rationale for repeating an experiment, the data are shown as percentages of the total number of student responses (n = 112 for the design group and n = 90 for the analyze group). The student responses for the design activity were completely inaccurate (45.5%), completely accurate (36.6%), or a mix of accurate and inaccurate (17.9%). The student responses for the analyze activity were completely inaccurate (52.2%), completely accurate (18.9%), or a mix of accurate and inaccurate (28.9%). Chi-squared analysis for both the design and the analyze groups indicates that these are statistically significant differences (p < .001).
Table 4a. Introductory students’ accurate conceptions about sample size.
Category of accurate conceptions
Example student response
Design activity
Analyze activity
It is better to have a larger sample size than a smaller one
“Large enough sample size to draw conclusion from” 82.6 53.1*
Too big of a sample size is not cost effective or manageable
“Large enough, but not terribly difficult to organize/take care of”
30.4 2.1*
A large sample size is needed because of inherent variation in a given population
“Sample size should be large in order to average out natural variation in a population”
11.6 10.4
Note: The data are shown as percentages of the number of student responses on each in-class activity (n = 69 for the design group, n = 96 for the analyze group). Student responses that were too vague to code have been removed. *p < .05 (Student’s t-test).
Dow
nloaded from https://academ
ic.oup.com/bioscience/article-abstract/64/2/125/231866 by guest on 24 August 2019

Education
132 BioScience • February 2014 / Vol. 64 No. 2 http://bioscience.oxfordjournals.org
Table 4b. Introductory students’ inaccurate conceptions about sample size.Category of inaccurate conceptions
Why the conception is incorrect
Example student response
Design activity
Analyze activity
Larger sample size ensures randomized or controlled results
A large sample size can still be biased if only certain individuals are chosen (e.g., sampling error)
“Large sample size—randomization” 11.6 16.7
A larger sample size gives more accurate data
A larger sample size may yield a more accurate interpretation of the data but not necessarily more accurate data if the data collected are all outliers (e.g., sampling error)
“Larger sample size, more accurate data”
26.1 15.6
A larger sample size eliminates variables, chance, or outliers
A larger sample size can decrease the impact of variables and outliers but does not decrease their number
“It’s a large sample size to decrease unusual data”
37.7 38.5
Note: The data are shown as percentages of the number of student responses on each in-class activity (n = 69 for the design group, n = 96 for the analyze group). Student responses that were too vague to code have been removed. *p < .05.
Table 5a. Introductory students’ accurate conceptions about repeating an experiment.
Category of accurate conceptions
Example student response
Design activity
Analyze activity
Repeating an experiment increases confidence in the data
“Yes, more trials will show that the experiment is replicable”
35.7 43.3
Repetition reduces the likelihood that uncontrolled variable affected the results
“Yes, to account for uncontrolled variables (such as animals and insects)”
7.1 3.3
Repetition reduces the impact of chance or randomness on the interpretations
“To verify that nothing happened by accident to change the outcome”
10.7 6.7
Repetition is needed because of inherent variation in a given population
“Some poppy seeds might not be from the same gene pool”
0.9 0
Note: The data are shown as percentages of the number of student responses on each in-class activity (n = 112 for the design group, n = 90 for the analyze group). Student responses that were too vague to code have been removed. *p < .05.
Table 5b. Introductory students’ inaccurate conceptions about repeating an experiment.
Category of inaccurate conceptions
Why the conception is incorrect
Example student response
Design activity
Analyze activity
It is not necessary to repeat an experiment Experiments need to be repeated “No, the sample size should account for any differences”
8.9* —
Repeat to increase sample size Repeating an experiment gives a replicate, not a larger sample size
“Repeated to create a larger sample size”
9.8 12.2
Repeat to change a variable When repeating an experiment, all variables should remain constant
“To see how results will vary with diff[erent] variables”
5.4 6.7
Repeat only to avoid making errors This is not the only reason one would repeat an experiment
“Repeated to reduce effects of making mistakes”
8.0 10.0
Repeat to eliminate outliers, chance, or variation
Repeating an experiment can decrease the impact of variables and outliers but does not decrease their number
“To eliminate the possibility of an anomaly”
17.0 22.2
Repeat to make data—not the interpretation—more accurate
Repeating an experiment may give a more accurate interpretation of the data but not necessarily more accurate data if there were an uncontrolled variable affecting the accuracy
“To make the results more accurate”
17.9 28.9
Repeat to make certain or prove that the findings are correct (overstating the claim of what a repeated experiment could tell them)
Too absolute; you cannot prove a hypothesis
“To ensure the validity of the results”
18.8 28.9
Note: The data are shown as percentages of the number of student responses on each in-class activity (n = 112 for the design group, n = 90 for the analyze group). Student responses that were too vague to code have been removed. *p < .05.
Dow
nloaded from https://academ
ic.oup.com/bioscience/article-abstract/64/2/125/231866 by guest on 24 August 2019

Education
http://bioscience.oxfordjournals.org February 2014 / Vol. 64 No. 2 • BioScience 133
students’ recognition that too big of a sample size is not cost effective (advanced, 3.6%; introductory, 2.1%). Importantly, we did not observe a statistically significant difference between the advanced and introductory students’ recognition that sample size is important because of inherent natural
biological diversity (advanced, 20%; introductory, 10.4%), the primary reason that most biologists would give for including a large sample size.
In general, the advanced students held fewer inaccurate conceptions about sample size than did the introductory
Figure 3. Advanced students’ conceptions of (a) sample size and (b) repeating an experiment. For sample size, the data are shown as percentages of the total number of student responses (n = 110). The advanced student responses were completely inaccurate (14.5%), completely accurate (57.3%), or a mix of accurate and inaccurate (28.2%). Compared with the introductory students, who completed the analyze activity, the advanced students had significantly more accurate conceptions and fewer inaccurate conceptions (chi-squared analysis, p < .01). Student responses that were too vague to code have been removed. For repeating an experiment, the data are shown as percentages of the total number of student responses (n = 114). The advanced student responses were completely inaccurate (9.6%), completely accurate (56.1%), or a mix of accurate and inaccurate (34.2%). The advanced students had significantly more accurate conceptions than inaccurate conceptions (chi-squared analysis, p < .01). The introductory student group is the same as the analyze group (see figure 2).
Table 6a. Advanced students’ accurate conceptions about sample size.
Category of accurate conceptions Percentage of responses
A larger sample size is good 77.3*
Too big of a sample size is not cost effective or manageable 3.6
A large sample size is needed because of inherent variation in a given population 20.0
Note: The data are shown as percentages of the total number of advanced student responses (n = 110). Student responses that were too vague to code have been removed. The advanced student responses were compared (using Student’s t-tests) with the introductory student group responses on the analyze activity (see table 3a). *p < .05.
Table 6b. Advanced students’ inaccurate conceptions about sample size.
Category of inaccurate conceptions Percentage of responses
Larger sample size gives randomized or controlled results 2.7*
A larger sample size gives more accurate data 31.8*
A larger sample size eliminates variables, chance, or outliers 4.5*
Note: The data are shown as percentages of the total number of advanced student responses (n = 110; see table 3a). Student responses that were too vague to code have been removed. The advanced student responses were compared (using Student’s t-tests) with the introductory student group responses on the analyze activity (see table 3a). *p < .05.
Dow
nloaded from https://academ
ic.oup.com/bioscience/article-abstract/64/2/125/231866 by guest on 24 August 2019

Education
134 BioScience • February 2014 / Vol. 64 No. 2 http://bioscience.oxfordjournals.org
students (table 6b); however, the inaccurate idea that a larger sample size gives more accurate data was more common in the advanced group (advanced, 31.8%; introductory, 15.6%).
The advanced students held more accurate conceptions and fewer inaccurate conceptions than did the introductory students (table 7a, 7b) regarding the importance of repeat-ing an experiment. A significantly higher percentage of the advanced students correctly stated that it is important to repeat an experiment to reduce the likelihood that an uncon-trolled variable has affected the results (advanced, 21.9%; introductory, 3.3%) or to reduce the impact of chance or randomness on the interpretation of the results (advanced, 36.8%; introductory, 6.7%; ps < .05). However, the advanced students and the introductory students were equally likely to recognize that repeating an experiment and getting a reproducible result would increase confidence in the data (advanced, 52.6%; introductory, 43.3%; table 7a). Significantly fewer of the advanced students held the inaccurate concep-tion that you repeat an experiment to eliminate outliers or to account for chance (advanced, 0.9%; introductory, 22.2%), to make the data more accurate (advanced, 14.9%; introduc-tory, 28.9%), or to make certain that the findings are correct (advanced, 13.2%; introductory, 28.9%; ps < .05; table 7b).
ConclusionsWe originally set out to identify which activity would lead to higher learning gains, but the finding that both in-class
activities were beneficial for improving students’ experi-mental design ability may be even more interesting. It sug-gests that there may not be one “right” way to teach a skill as complex as experimental design. Because the students completed these activities in groups, we cannot disaggregate their responses by demographic characteristics for this study. However, it would be an interesting area for future research to see whether certain students learn better with an analysis or evaluation task than with a synthesis-level task.
Although we found no significant differences in E-EDAT score gains between the two activities, we did observe a dif-ference of 0.5 point between the design activity and the pas-sive lecture. Although this number is small, it is statistically significant, and we believe that it demonstrates a meaning-ful improvement. We were not expecting a large difference between the pre- and posttest scores for an intervention of only 30 minutes, and, given the time spent on the task, this gain is similar to what has previously been reported (Sirum and Humburg 2011).
There are at least two possible explanations for why only the design activity was significantly more effective than the lecture: There may be closer alignment of the design task with the assessment instrument, or the students’ abil-ity to apply concepts to new situations may increase after completing a synthesis-level activity. The development of additional validated tools to assess student understanding of experimental design would allow us to differentiate these
Table 7a. Advanced students’ accurate conceptions about repeating an experiment.
Category of accurate conceptions Advanced students
Reproducibility increases confidence in data 52.6
Reduce likelihood that uncontrolled variable affected results 21.9*
Reduce impact of chance or randomness on interpretations 36.8*
Note: The data are shown as percentages of the total number of advanced student responses (n = 114; see table 4a). Student responses that were too vague to code have been removed. The advanced student responses were compared (using Student’s t-tests) with the introductory student group responses on the analyze activity (table 4a). *p < .05.
Table 7b. Advanced students’ inaccurate conceptions about repeating an experiment.
Category of inaccurate conceptions Advanced students
Repeat an experiment to increase sample size 10.5
Repeat to change a variable 1.8
Repeat to avoid making errors 9.6
Repeat to eliminate outliers, chance, or variation 0.9*
Repeat to make data more accurate 14.9*
Repeat to make certain that findings are correct 13.2*
Note: The data are shown as percentages of the number of advanced student responses (n = 114; see table 4b). Student responses that were too vague to code have been removed. The advanced student responses were compared (using Student’s t-tests) with the introductory student group responses on the analyze activity (table 4a). *p < .05.
Dow
nloaded from https://academ
ic.oup.com/bioscience/article-abstract/64/2/125/231866 by guest on 24 August 2019

Education
http://bioscience.oxfordjournals.org February 2014 / Vol. 64 No. 2 • BioScience 135
possibilities. The students completed either the design activ-ity or the analyze activity in this study, but a possible area for future exploration would be to determine whether there could be a synergistic effect resulting from students com-pleting both activities. In particular, it may be interesting to investigate whether there is an order effect, such that we see higher gains in students who complete the analyze activity before the design activity or vice versa.
We also uncovered several novel accurate and inaccurate student conceptions about experimental design. The struc-ture of the two in-class activities probably affected which accurate and inaccurate conceptions were identified. The increased number of vague responses on the design activity, for example, may be a result of the more open-ended nature of the questions on that activity. Interestingly, the students in the design activity group were much more likely to consider the advantages of a large sample size, as well as the cost and logistical challenges associated with using a large sample size; the design activity was better than the analyze activity at eliciting these accurate conceptions concerning sample size. Furthermore, the design activity responses contained significantly fewer inaccurate conceptions about sample size than did the analyze activity responses. This suggests that the process of interpreting data may reveal more inac-curacies in students’ ways of thinking than does the act of designing an experiment, which indicates that the analyze activity may be more effective at eliciting inaccurate student ideas. Alternatively, designing an experiment may help move students toward more accurate conceptions. Questions that prompted students to consider the purpose of repeating an experiment elicited significantly more inaccurate conceptions than did those focused on sample size. This may be because of the difficulty of the topic, the wording of the prompt, or because students are not often asked to consider why they should repeat an experiment (e.g., in “cookbook” lab courses).
Much of the research focused on gaining insight into student understanding of biological concepts has generally relied heavily on identifying student misconceptions (Nelson 2008), which are defined as scientifically inaccurate ideas. Although the identification of misconceptions has been valuable for the biology education community, recent find-ings indicate that students’ misunderstandings of concepts cannot simply be described as misconceptions; rather, there is a continuum of student understanding known as a learn-ing progression (Alonzo and Gotwals 2012). Learning pro-gressions are research-based models of how core ideas are formed over time, often focused on students’ ways of think-ing (Songer et al. 2009, Duncan and Rivet 2013). Learners develop their understanding of complex biological concepts in stages that build on each other. It has been shown that scientifically inaccurate answers may be useful for students at early stages of learning, allowing them to partially under-stand a topic (Duncan and Rivet 2013). Although there are a few studies in which inaccurate but possibly productive student conceptions related to experimental design have been identified (Kanari and Millar 2004, White et al. 2009,
Colon-Berlingeri and Burrows 2011), we currently lack a learning progression for undergraduate biology majors’ understanding of experimental design, and we hope that findings from our study can help move the field toward this goal.
Specifically, our investigation of the differences between introductory and advanced students could be useful for developing a learning progression. Overall, the advanced students held significantly more accurate conceptions and fewer inaccurate conceptions for sample size and repeating an experiment than did the introductory students. There are a few surprising observations about the differences between the advanced and introductory students’ ideas concerning the significance of sample size and repeating an experiment. First, the advanced students were more likely to hold the inaccurate conception that repeating an experiment leads to more accurate data. A possible reason for this is that the advanced students were actually thinking correctly about how repeating an experiment could lead to a more accurate interpretation of the results but simply used the phrase “more accurate data” to convey the idea that repeating an experiment will lead to increased confidence in one’s inter-pretation of the data. This difference in language, although it is subtle, is important but may not be clear to these students. Intriguingly, this inaccurate idea of “more accurate data” could be viewed as a productive misunderstanding in a stu-dent learning progression of experimental design (Duncan and Rivet 2013). As students move from not thinking about how sample size affects the quality of the data to thinking that a larger sample size often leads to a more accurate inter-pretation of those data, perhaps thinking incorrectly about accurate data is an indication that the students are on the path to building a deeper understanding.
Although the advanced students were more likely to provide accurate justifications for experimental design ele-ments, we think that it may be primarily because of an increased proficiency with statistics and may not be reflec-tive of improved understanding of how biological variation influences experimental design. The vast majority of the introductory and advanced students who mentioned any-thing related to variation discussed “unique individuals” or “mutants,” as opposed to the variation that exists on a natu-ral continuum (data not shown). Although we do not have an explanation for why these biology students’ did not think about inherent variation in a population, our study suggests that this concept may need to be more explicitly taught in the biology classroom.
Although it does not provide a complete picture, this study is an important first step toward revealing the types of conceptions that students hold about experimental design. The underlying reasons for which students hold these inac-curate conceptions remain to be explored. Is it a result of how we teach experimental design in lab courses—with a very small sample size and typically never repeating experi-ments? Do students not understand inherent variability in the population because we often present the data as averages,
Dow
nloaded from https://academ
ic.oup.com/bioscience/article-abstract/64/2/125/231866 by guest on 24 August 2019

Education
136 BioScience • February 2014 / Vol. 64 No. 2 http://bioscience.oxfordjournals.org
and undergraduate students rarely see raw data? Do students understand the underlying biological principles but have linguistic difficulties describing precise aspects of experi-mental design (e.g., the difference between “decreasing the effect of outliers” and “decreasing outliers”) that make their responses inaccurate? Future directions for this research include developing research tools that target these specific inaccurate conceptions and using think-alouds and inter-views to more deeply probe student understanding.
It is possible that the present results underrepresent the extent to which students hold inaccurate conceptions about experimental design. We relied on the students to come up with an inaccurate conception, as opposed to asking a specific question about the inaccurate conception, so it is possible that some of the students may have had inaccurate conceptions that they did not write down. The students also worked in groups, so they had the opportunity to discuss their responses with each other. They were able to ask the TAs and the instructor questions about the activities dur-ing the class session, so, perhaps, some of their inaccurate conceptions were clarified in class. Although our work is an important first exploration into possible conceptions that students may harbor, more work needs to be done to determine how prevalent these conceptions are for undergraduates.
There are a few limitations to this study that necessitate caution in generalizing the results. First, different instruc-tors taught the lecture course and the course in which the activities were administered, so an instructor effect could have affected the difference we saw between the design activity and lecture students on the E-EDAT. Next, we col-lected data from the introductory students through in-class, handwritten worksheets, whereas we collected data from the advanced students though online questions. The questions were identical, but the method of delivery was different, which could have influenced the results. Finally, although we anticipate that we would obtain similar results with a different population of students, especially because we con-trolled for student ability in our regression model, collecting only one set of data is a limitation but is not uncommon for educational research. Determining the impact of these activities in different student populations is an interest of ours, and we encourage others to use our activities and the E-EDAT to see whether they obtain similar gains in differ-ent contexts.
In this article, we have presented two in-class activities that instructors can use to teach experimental design, a modified EDAT (E-EDAT), and a rubric to assess students’ ability to design an experiment and justify their reasoning. This study also provides novel insight into how students think about specific elements of experimental design, which could be the basis for building a learning progression of undergraduate thinking about experimental design. Much work still needs to be done before we can begin to model what the learning progression may be, but we believe that
this study is an important step in our own learning progres-sion of understanding student thinking about experimental design.
AcknowledgmentsThis work was supported in part by National Science Foundation grant no. DUE-0942215, awarded to AJC and MPW, and a Washington Research Foundation-Hall fel-lowship awarded to CLW-C. We would like to thank the University of Washington (UW) students who participated in the study and the UW faculty members who were sup-portive of these efforts. Special thanks go to John Parks for his invaluable support administering the activities, the UW Biology Education Research Group for helpful discussions, and Sarah Eddy for statistical advice.
References citedAlonzo AC, Gotwals AW, eds. 2012. Learning Progressions in Science:
Current Challenges and Future Directions. Springer.Andrews TM, Leonard MJ, Colgrove CA, Kalinowski ST. 2011. Active
learning not associated with student learning in a random sample of college biology courses. CBE Life Sciences Education 10: 394–405.
Beichner RJ, Saul JM, Abbot DS, Morse JJ, Deardorff DL, Allain RJ, Bonham SW, Dancy MH, Risley DS. 2007. The student-centered activities for large enrollment undergraduate programs (SCALE-UP) project. Pages 2–39 in Redish EF, Cooney PJ, eds. Research-Based Reform of University Physics. American Association of Physics Teachers.
Bloom BS, Krathwohl DR. 1956. Taxonomy of Educational Objectives: The Classification of Educational Goals. Longman, Green, and Company.
Boudreaux A, Shaffer PS, Heron PRL, McDermott LC. 2008. Student under-standing of control of variables: Deciding whether or not a variable influences the behavior of a system. American Journal of Physics 76: 163.
Brewer CA, Smith D, eds. 2011. Vision and Change in Undergraduate Biology Education: A Call to Action. American Association for the Advancement of Science.
Chen Z, Klahr D. 1999. All other things being equal: Acquisition and transfer of the control of variables strategy. Child Development 70: 1098–1120.
Clement J, Brown DE, Zietsman A. 1989. Not all preconceptions are miscon-ceptions: Finding “anchoring conceptions” for grounding instruction on students’ intuitions. International Journal of Science Education 11: 554–565.
Coil D, Wenderoth MP, Cunningham M, Dirks C. 2010. Teaching the pro-cess of science: Faculty perceptions and an effective methodology. CBE Life Sciences Education 9: 524–535.
Coley JD, Tanner KD. 2012. Common origins of diverse misconceptions: Cognitive principles and the development of biology thinking. CBE Life Sciences Education 11: 209–215.
Colon-Berlingeri M, Burrowes PA. 2011. Teaching biology through statis-tics: Application of statistical methods in genetics and zoology courses. CBE Life Sciences Education 10: 259–267.
Crowe A, Dirks C, Wenderoth MP. 2008. Biology in bloom: Implementing Bloom’s taxonomy to enhance student learning in biology. CBE Life Sciences Education 7: 368–381.
D’Costa AR, Schlueter MA. 2013. Scaffolded instruction improves student understanding of the scientific method and experimental design. American Biology Teacher 75: 18–28.
Dirks C, Cunningham M. 2006. Enhancing diversity in science: Is teach-ing science process skills the answer? CBE Life Sciences Education 5: 218–226.
Duncan RG, Rivet AE. 2013. Science learning progressions. Science 339: 396–397.
Dow
nloaded from https://academ
ic.oup.com/bioscience/article-abstract/64/2/125/231866 by guest on 24 August 2019

Education
http://bioscience.oxfordjournals.org February 2014 / Vol. 64 No. 2 • BioScience 137
Eddy SE, Crowe AJ, Wenderoth MP, Freeman S. 2013. How should we teach tree-thinking? An experimental test of two hypotheses. Evolution: Education and Outreach 6 (art. 13). doi:10.1186/1936-6434-6-13
Edens KM, Potter E. 2003. Using descriptive drawings as a conceptual change strategy in elementary science. School Science and Mathematics 103: 135–144.
Freeman S, Haak D, Wenderoth MP. 2011. Increased course structure improves performance in introductory biology. CBE Life Sciences Education 10: 175–186.
Giere RN. 2004. How models are used to represent reality. Philosophy of Science 71: 742–752.
Glaser BG, Strauss AL. 1967. The Discovery of Grounded Theory: Strategies for Qualitative Research. Aldine Transaction.
Gormally C, Brickman P, Lutz M. 2012. Developing a test of scientific literacy skills (TOSLS): Measuring undergraduates’ evaluation of scientific information and arguments. CBE Life Sciences Education 11: 364–377.
Hake RR. 1998. Interactive-engagement versus traditional methods: A six-thousand-student survey of mechanics test data for introductory phys-ics courses. American Journal of Physics 66: 64.
Hiebert SM. 2007. Teaching simple experimental design to undergradu-ates: Do your students understand the basics? Advances in Physiology Education 31: 82–92.
Hoefnagels MH. 2002. Using superstitions and sayings to teach experimen-tal design. Tested Studies for Laboratory Teaching 24: 325–327.
Kanari Z, Millar R. 2004. Reasoning from data: How students collect and interpret data in science investigations. Journal of Research in Science Teaching 41: 748–769.
Kloser MJ, Brownell SE, Shavelson RJ, Fukami T. 2013. Effects of a research-based ecology lab course: A study of nonvolunteer achievement, self-confidence, and perception of lab course purpose. Journal of College Science Teaching 42: 90–99.
Lin X, Lehman JD. 1999. Supporting learning of variable control in a computer-based biology environment: Effects of prompting college students to reflect on their own thinking. Journal of Research in Science Teaching 36: 837–858.
Mak SY, Yip DY, Chung CM. 1999. Alternative conceptions in biology-related topics of integrated science teachers and implications for teacher education. Journal of Science Education and Technology 8: 161–170.
Nelson CE. 2008. Teaching evolution (and all of biology) more effectively: Strategies for engagement, critical reasoning, and confronting miscon-ceptions. Integrative and Comparative Biology 48: 213–225.
Poehnl S, Bogner FX. 2013. Cognitive load and alternative conceptions in learning genetics: Effects from provoking confusion. Journal of Educational Research 106: 183–196.
Pollack AE. 2010. Exploring the complexities of experimental design: Using an on-line reaction time program as a teaching tool for diverse student populations. Journal of Undergraduate Neuroscience Education 9: A47–A50.
Ryan AG, Aikenhead GS. 1992. Students’ preconceptions about the epistem-ology of science. Science Education 76: 559–580.
Shadmi Y. 1981. Teaching “control of variables” to primary school teachers. Physics Education 16: 93.
Shi J, Power JM, Klymkowsky MW. 2011. Revealing student thinking about experimental design and the roles of control experiments. International Journal for the Scholarship of Teaching and Learning 5 (art. 93).
Sirum K, Humburg J. 2011. The Experimental Design Ability Test (EDAT). Bioscene: Journal of College Biology Teaching 37: 8–16.
Songer NB, Kelcey B, Gotwals AW. 2009. How and when does complex reasoning occur? Empirically driven development of a learning pro-gression focused on complex reasoning about biodiversity. Journal of Research in Science Teaching 46: 610–631.
Strike KA, Posner GJ. 1992. A revisionist theory of conceptual change. Pages 147–176 in Duschl RA, Hamilton RJ, eds. Philosophy of Science, Cognitive Psychology, and Educational Theory and Practice. State University of New York Press.
White TK, Whitaker P, Gonya T, Hein R, Kroening D, Lee K, Lee L, Lukowiak A, Hayes E. 2009. The use of interrupted case studies to enhance critical thinking skills in biology. Journal of Microbiology and Biology Education 10: 25–31.
Yates TB, Marek EA. 2013. Is Oklahoma really OK? A regional study of the prevalence of biological evolution-related misconceptions held by intro-ductory biology teachers. Evolution: Education and Outreach 6 (art. 6).
Zuckerman JT. 1994. Accurate and inaccurate conceptions about osmosis that accompanied meaningful problem solving. School Science and Mathematics 94: 226–234.
Sara E. Brownell ([email protected]) is a postdoctoral scholar in biology education; Roddy Theobald is a graduate student in statistics; Nnadozie Okoroafor and Mikhail Koval are undergraduates in biology; and Scott Freeman, Mary Pat Wenderoth, and Alison J. Crowe are principal lecturers in biology, all at the University of Washington, in Seattle. Cristina L. Walcher-Chevillet is a lecturer in biology at the University of Puget Sound, in Tacoma, Washington.
Dow
nloaded from https://academ
ic.oup.com/bioscience/article-abstract/64/2/125/231866 by guest on 24 August 2019