how to make a scatter plot in adobe...
TRANSCRIPT
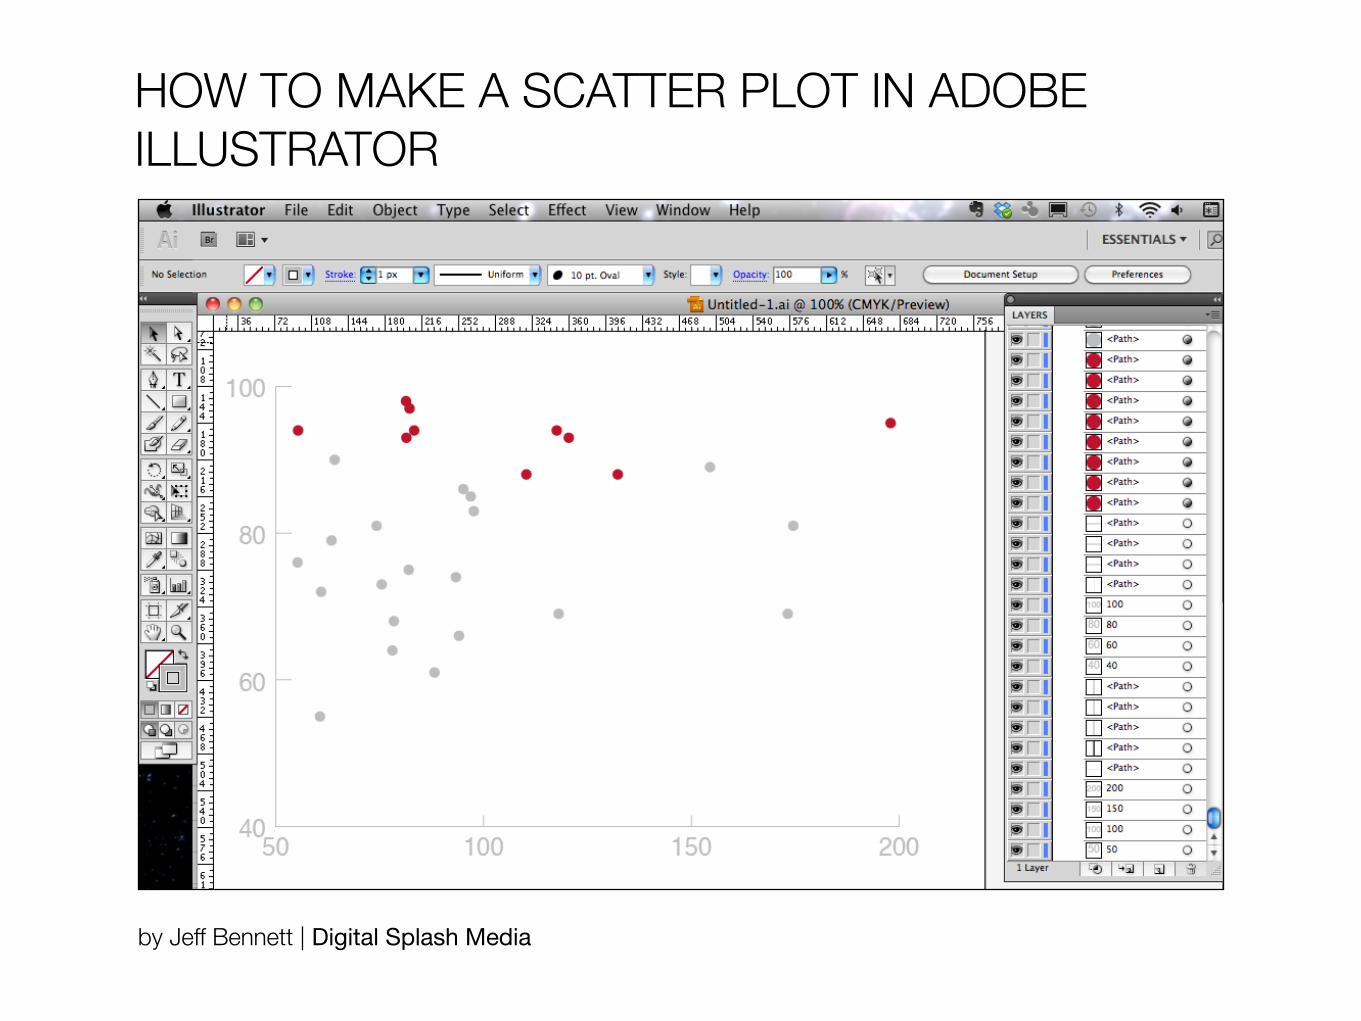
HOW TO MAKE A SCATTER PLOT IN ADOBE ILLUSTRATOR
by Jeff Bennett | Digital Splash Media

Get theData
Get theData intoIllustrator
Styling a Scatter Plotin Illustrator
01 02 03INTRO
TABLE OF CONTENTS
by Jeff Bennett | Digital Splash Media 2
Pages 5–9 Pages 10–21Page 4Page 3

WHY SCATTER PLOTS?
Scatter plots are a great way to show correlation between two variables. They’re extremely easy to create in Google Docs, Microsoft Excel, and Open Office. But if you want to go beyond the limited styling that those applications allow, you might consider creating your scatter plot in Adobe Illustrator. But, making a scatter plot in Illustrator is a little less intuitive than these other applications.
This step-by-step guide will show you how to get your data into Illustrator and style your scatter plot to your liking.
I created an infographic about the 2012 Major League Baseball season that compares data and shows correlations of aspects of the games to wins, for example how well a teams’s home runs, or hits, or ERA, or payroll correlates to wins. So for this example, I’ll show how to create a scatter plot that shows the correlation of team payrolls to wins for the 2012 season.
The Scenario
by Jeff Bennett | Digital Splash Media 3
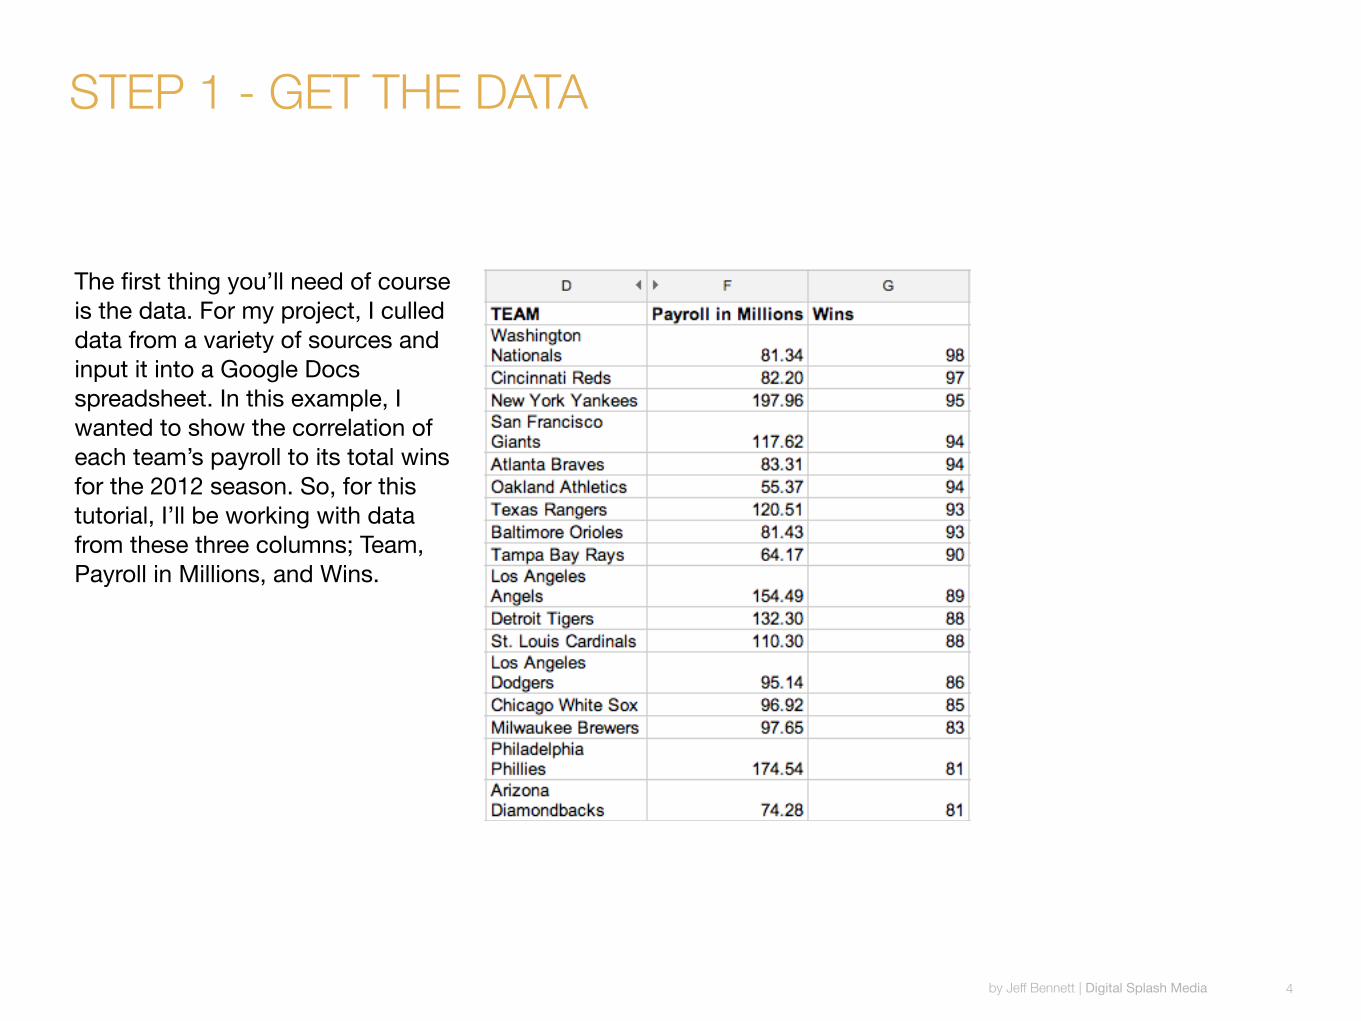
The first thing you’ll need of course is the data. For my project, I culled data from a variety of sources and input it into a Google Docs spreadsheet. In this example, I wanted to show the correlation of each team’s payroll to its total wins for the 2012 season. So, for this tutorial, I’ll be working with data from these three columns; Team, Payroll in Millions, and Wins.
STEP 1 - GET THE DATA
by Jeff Bennett | Digital Splash Media 4

STEP 2 - GET THE DATA INTO ILLUSTRATOR
The next step is to get your data into Illustrator. In an Illustrator document, find the scatter graph tool as shown here. You may need to hold down your mouse button as you hover over the graph tool icon to see the list of available graph tools. Select the scatter graph tool.
by Jeff Bennett | Digital Splash Media 5
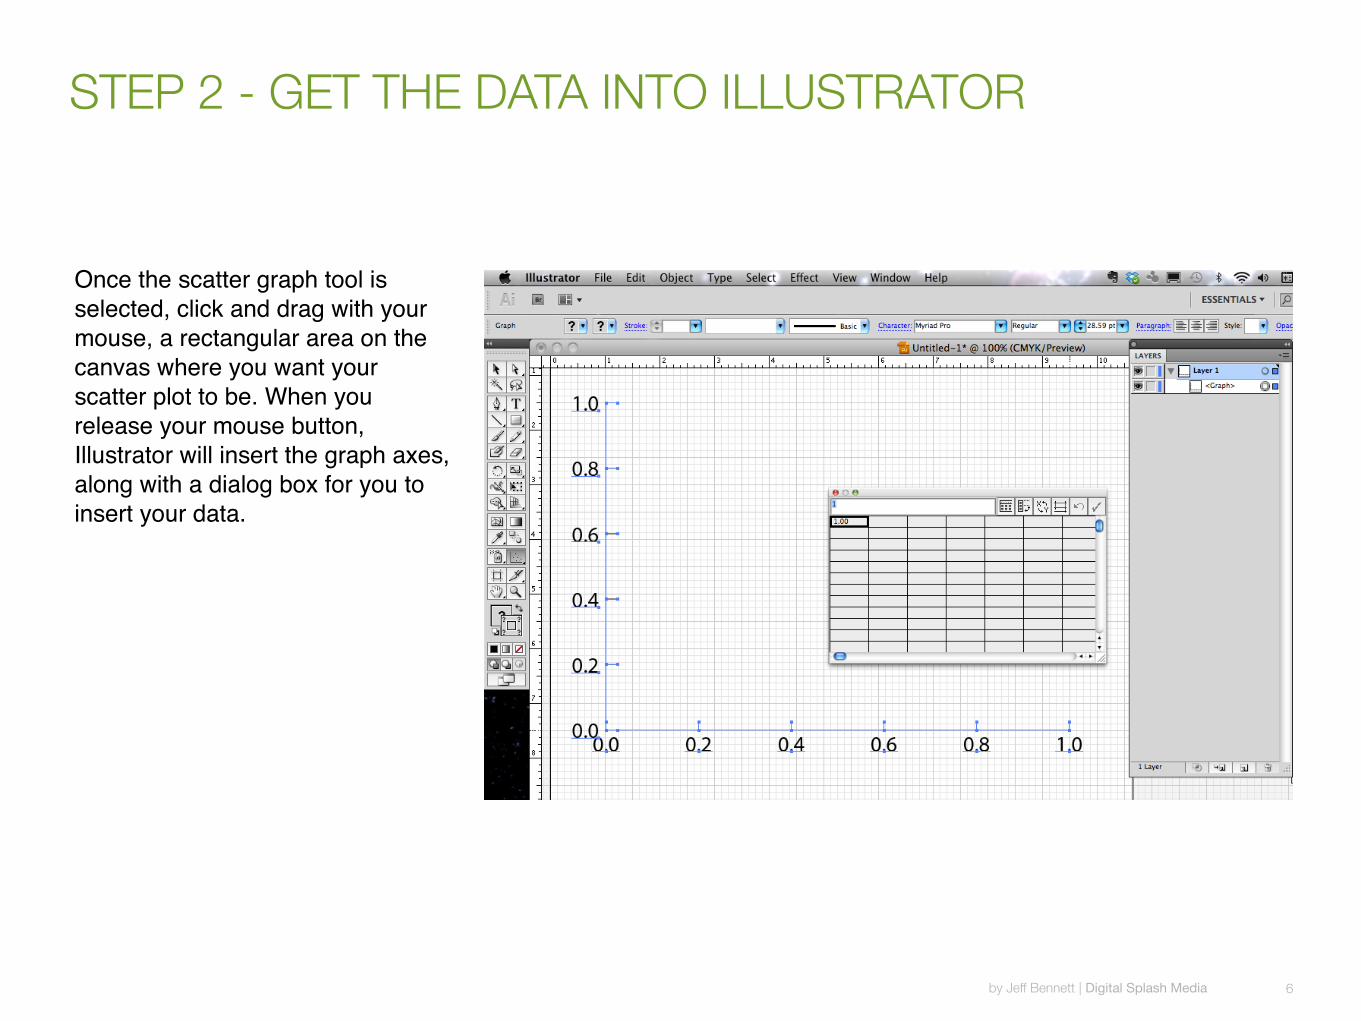
Once the scatter graph tool is selected, click and drag with your mouse, a rectangular area on the canvas where you want your scatter plot to be. When you release your mouse button, Illustrator will insert the graph axes, along with a dialog box for you to insert your data.
STEP 2 - GET THE DATA INTO ILLUSTRATOR
by Jeff Bennett | Digital Splash Media 6

The next step is to insert your data into the Illustrator pop up window that looks like a spreadsheet. This is where Illustrator can be a bit quirky. You only want to insert the numerical data. In other words, don’t insert the column titles (Team, Payroll in Millions, Wins). It’s also important to consider what data you want on which axis. I’m correlating payroll to wins so I want wins on the vertical axis and payroll on the horizontal axis. So, go to your spreadsheet program where you have your data and select the data you want on the vertical axis and copy it. In my scenario, it’s wins. Remember, don’t select the cell that says “Wins.” Now go back to Illustrator select the top left cell in the pop up window and paste the data.
STEP 2 - GET THE DATA INTO ILLUSTRATOR
by Jeff Bennett | Digital Splash Media 7
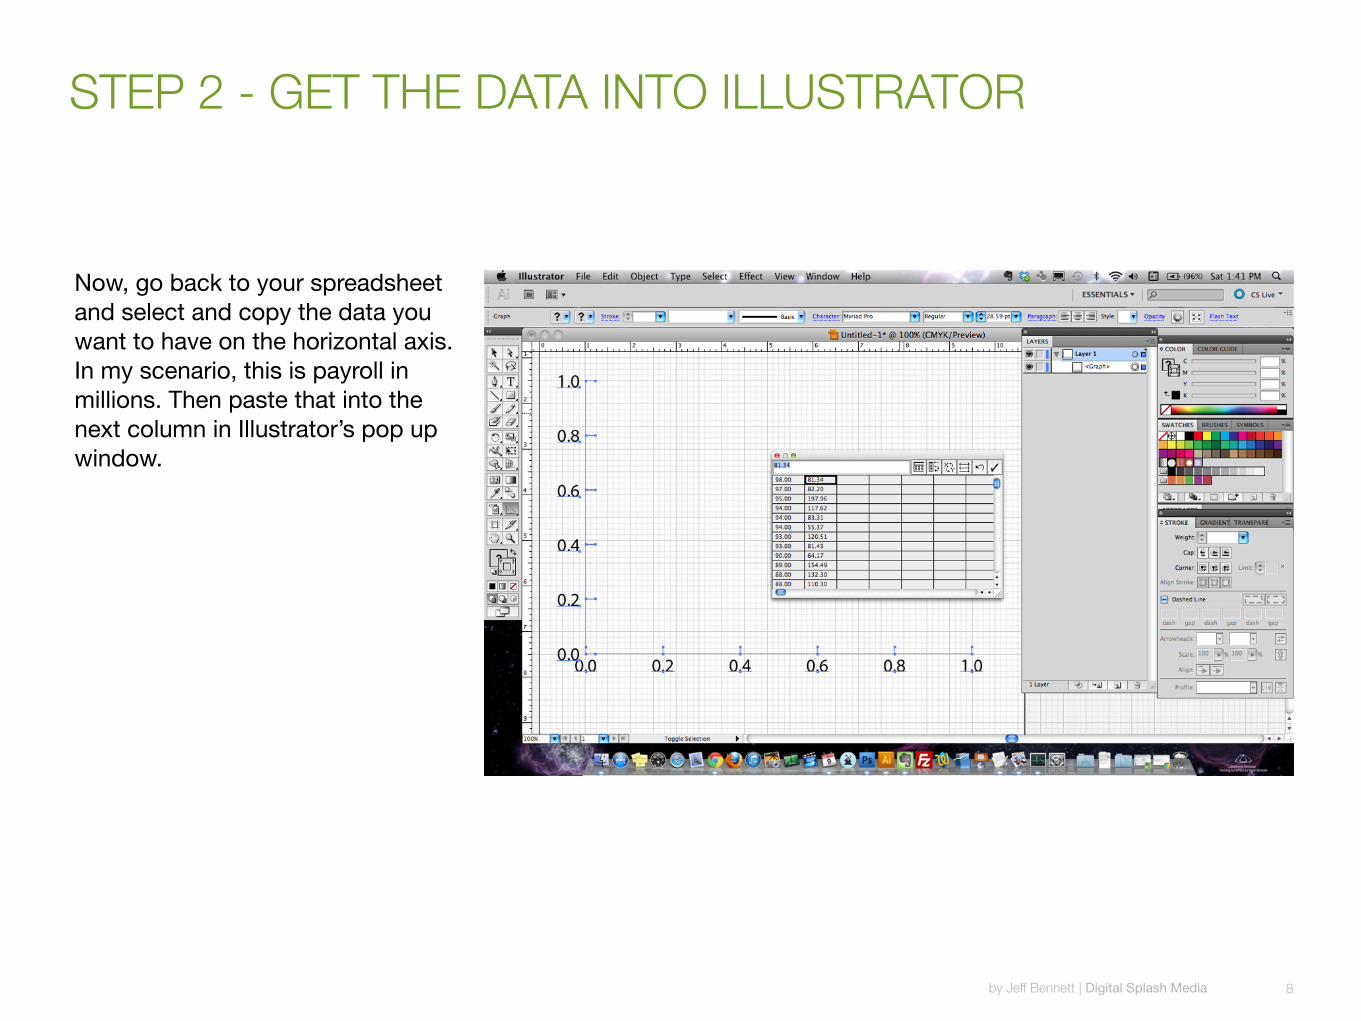
Now, go back to your spreadsheet and select and copy the data you want to have on the horizontal axis. In my scenario, this is payroll in millions. Then paste that into the next column in Illustrator’s pop up window.
STEP 2 - GET THE DATA INTO ILLUSTRATOR
by Jeff Bennett | Digital Splash Media 8
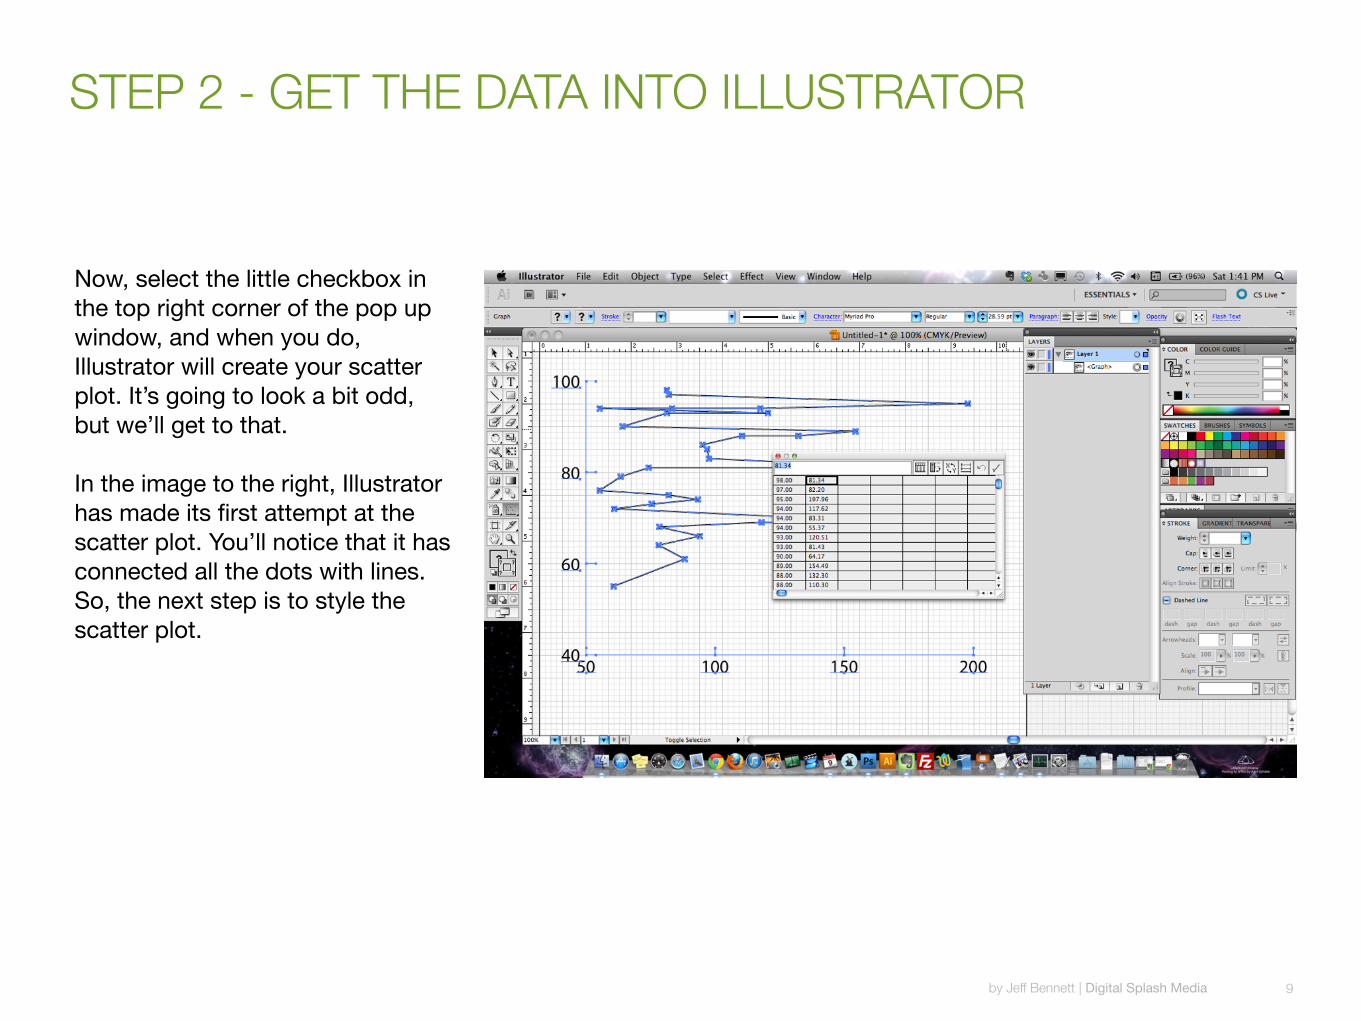
Now, select the little checkbox in the top right corner of the pop up window, and when you do, Illustrator will create your scatter plot. It’s going to look a bit odd, but we’ll get to that.
In the image to the right, Illustrator has made its first attempt at the scatter plot. You’ll notice that it has connected all the dots with lines. So, the next step is to style the scatter plot.
STEP 2 - GET THE DATA INTO ILLUSTRATOR
by Jeff Bennett | Digital Splash Media 9

Close Illustrator’s pop up window by clicking on the little red dot in the top left corner of the pop up window. You may have to have the selection tool selected in order for this to work. Notice in your Layers window that the whole scatter plot is a graph object. In order to do any styling of the graph, you’ll need to ungroup the graph. With the graph selected go to Object > Ungroup (or Cmd + Shift + G on a Mac, Ctrl + Shift + G for PCs). Illustrator will give you a warning. Click Ok.
STEP 3 - STYLING A SCATTER PLOT IN ILLUSTRATOR
by Jeff Bennett | Digital Splash Media 10
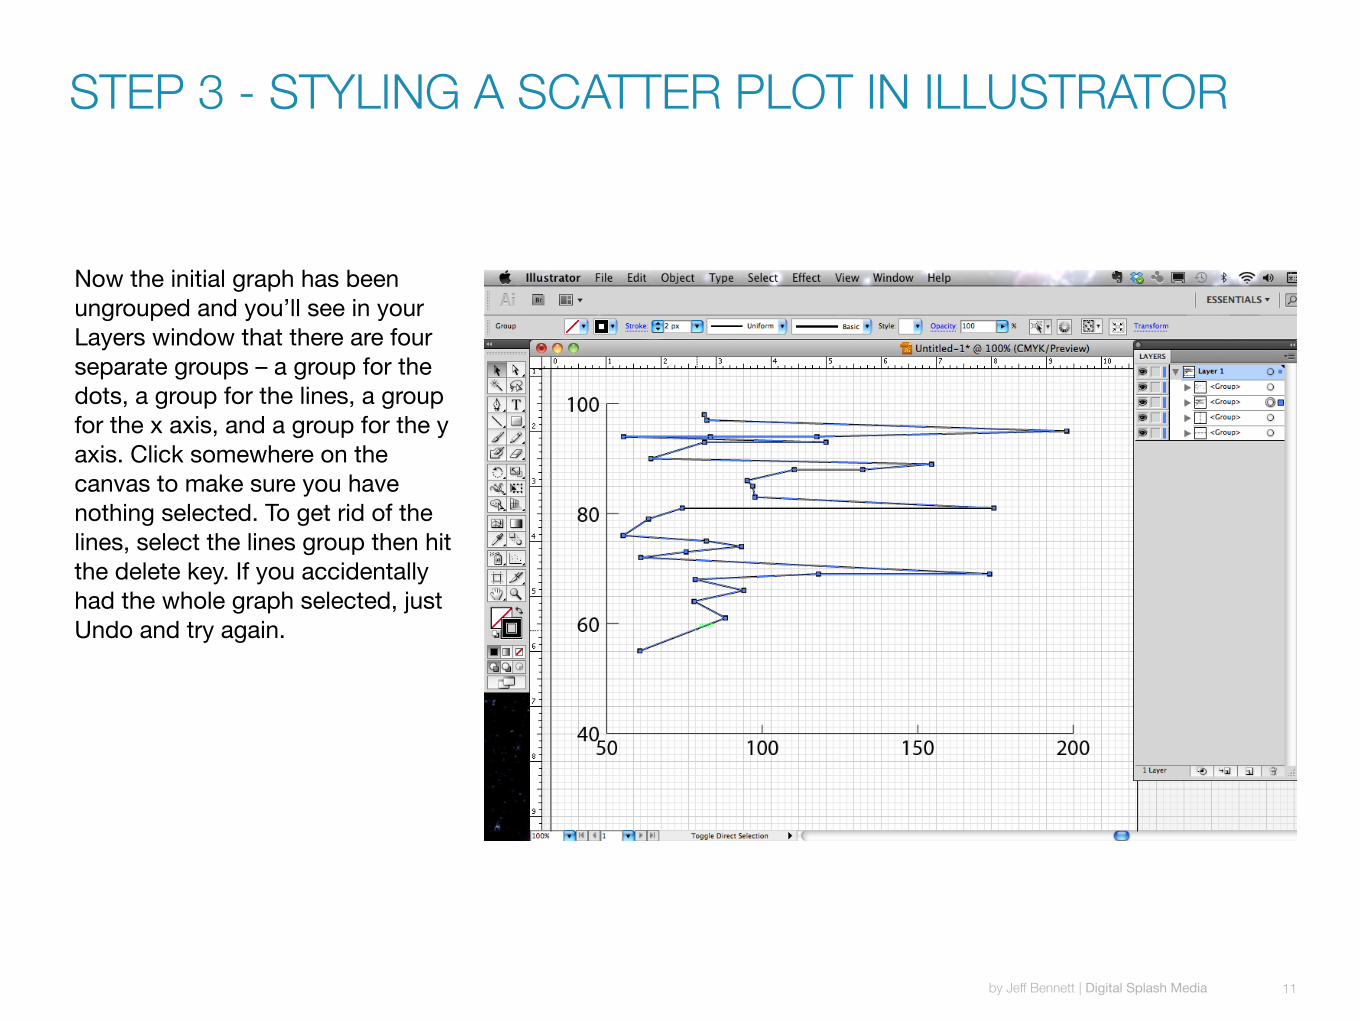
Now the initial graph has been ungrouped and you’ll see in your Layers window that there are four separate groups – a group for the dots, a group for the lines, a group for the x axis, and a group for the y axis. Click somewhere on the canvas to make sure you have nothing selected. To get rid of the lines, select the lines group then hit the delete key. If you accidentally had the whole graph selected, just Undo and try again.
STEP 3 - STYLING A SCATTER PLOT IN ILLUSTRATOR
by Jeff Bennett | Digital Splash Media 11
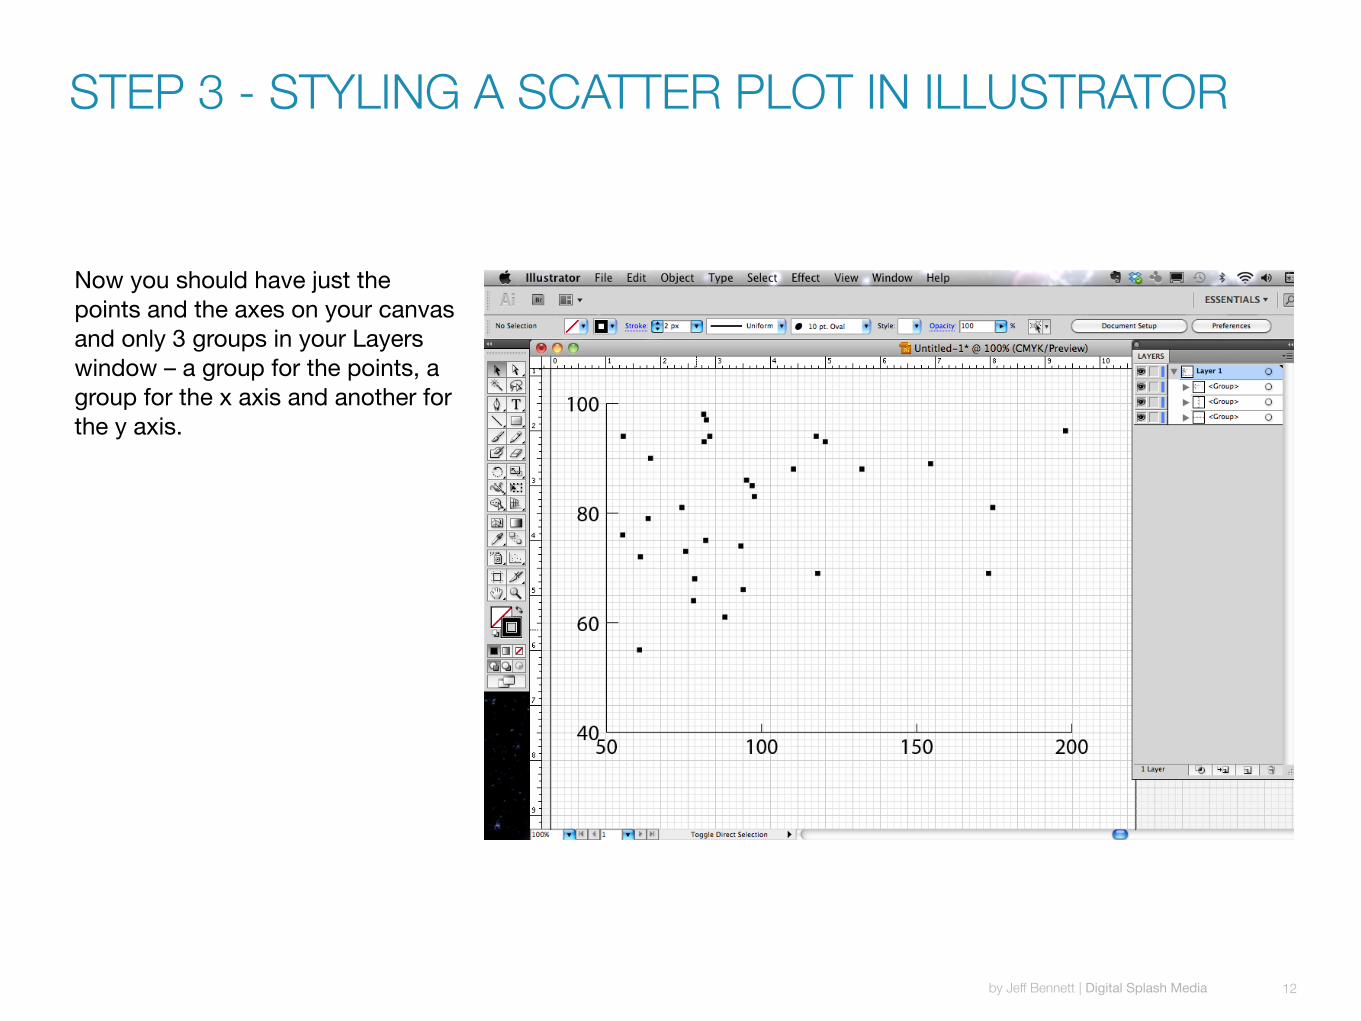
Now you should have just the points and the axes on your canvas and only 3 groups in your Layers window – a group for the points, a group for the x axis and another for the y axis.
STEP 3 - STYLING A SCATTER PLOT IN ILLUSTRATOR
by Jeff Bennett | Digital Splash Media 12
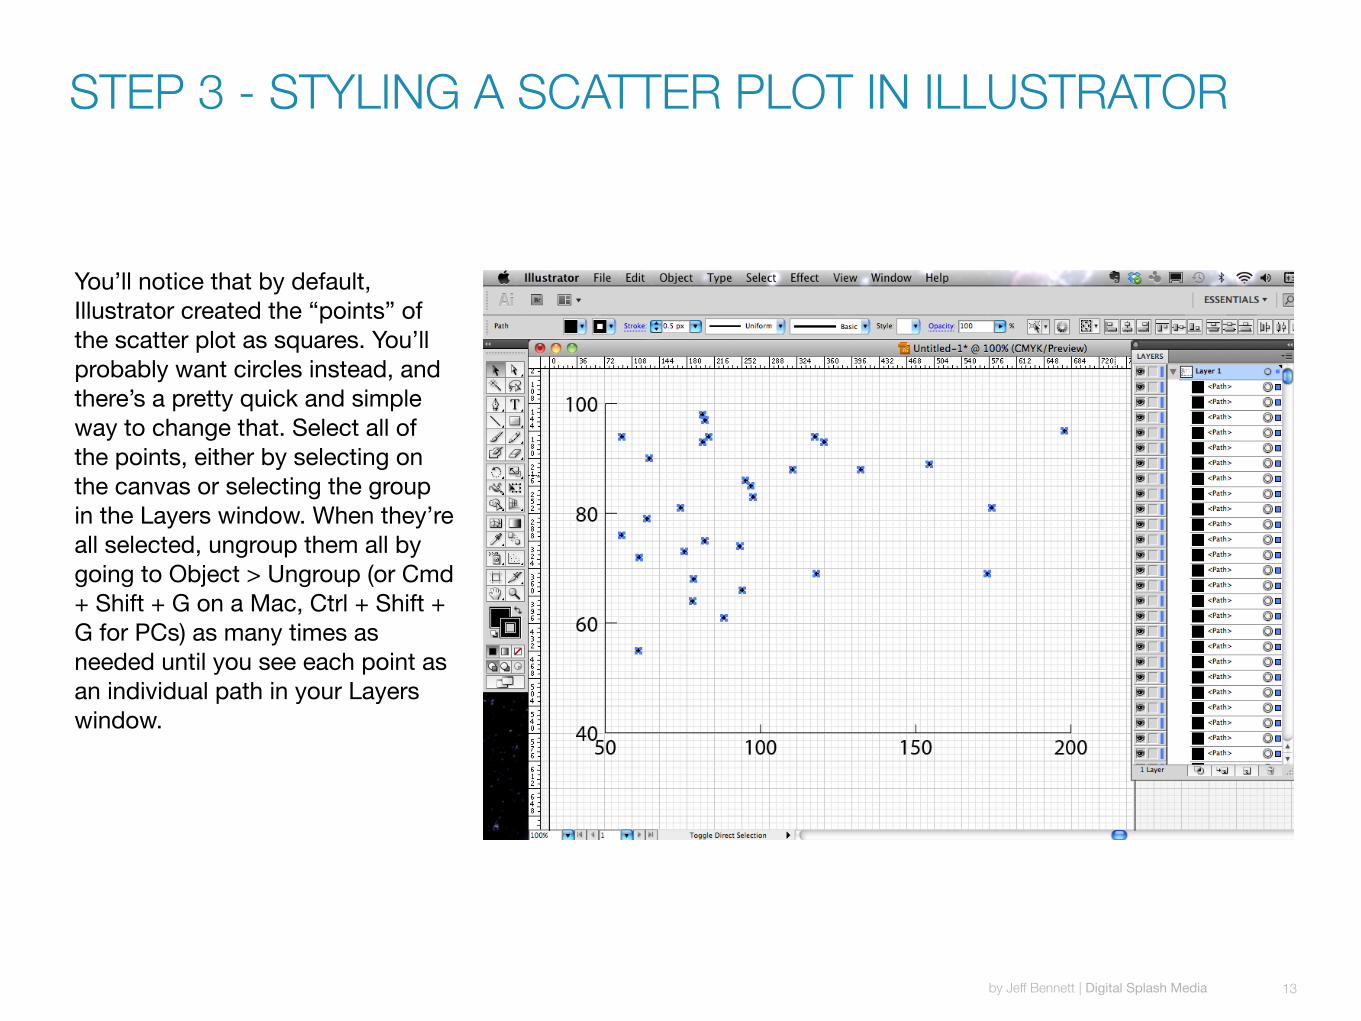
You’ll notice that by default, Illustrator created the “points” of the scatter plot as squares. You’ll probably want circles instead, and there’s a pretty quick and simple way to change that. Select all of the points, either by selecting on the canvas or selecting the group in the Layers window. When they’re all selected, ungroup them all by going to Object > Ungroup (or Cmd + Shift + G on a Mac, Ctrl + Shift + G for PCs) as many times as needed until you see each point as an individual path in your Layers window.
STEP 3 - STYLING A SCATTER PLOT IN ILLUSTRATOR
by Jeff Bennett | Digital Splash Media 13
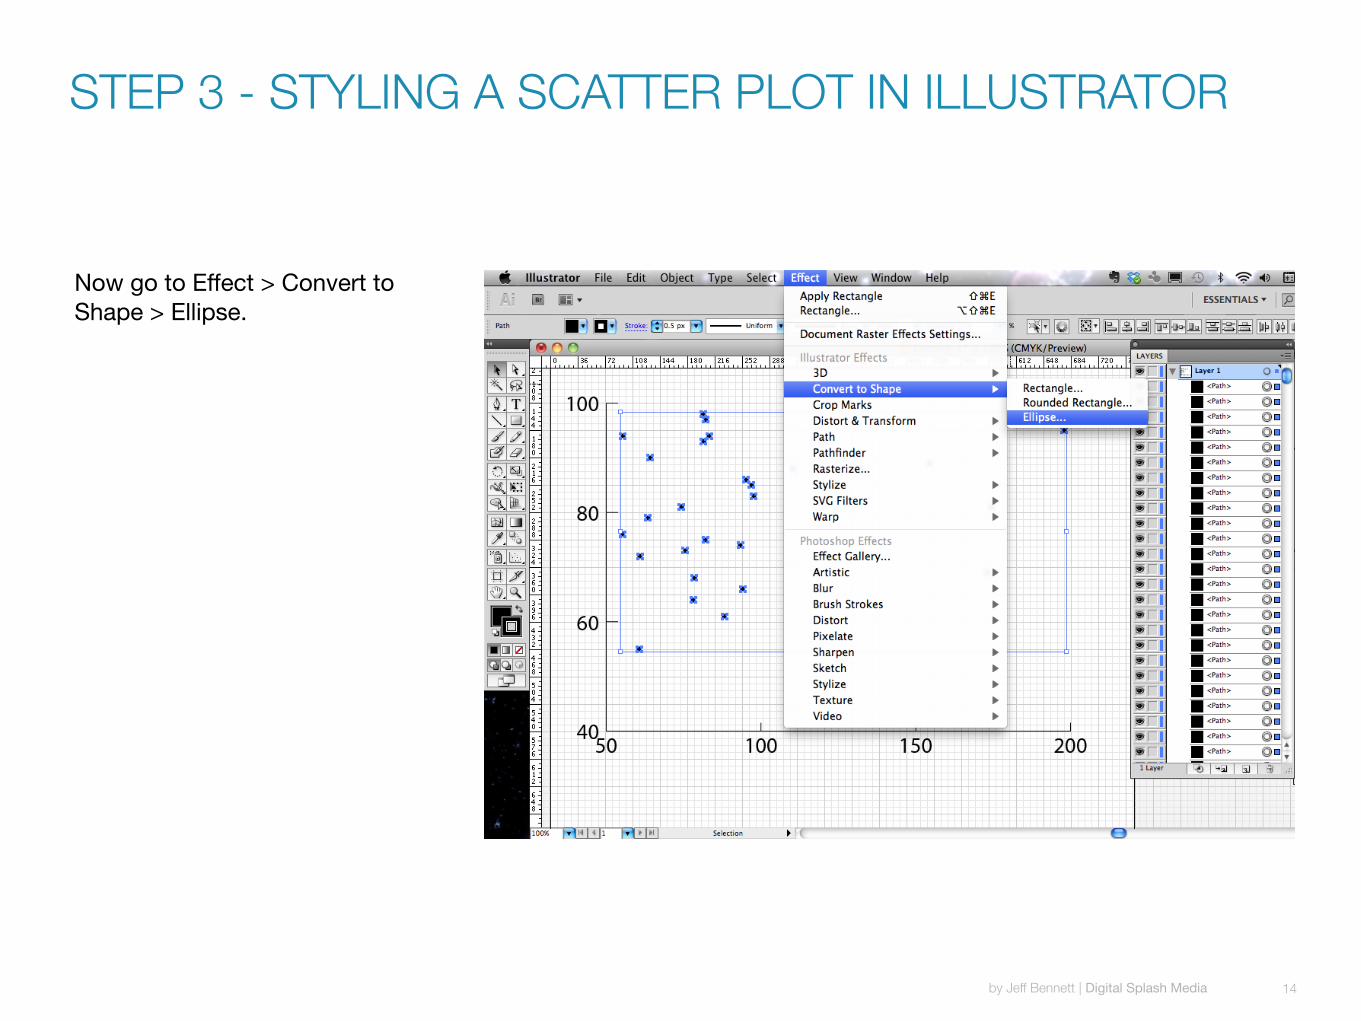
Now go to Effect > Convert to Shape > Ellipse.
STEP 3 - STYLING A SCATTER PLOT IN ILLUSTRATOR
by Jeff Bennett | Digital Splash Media 14
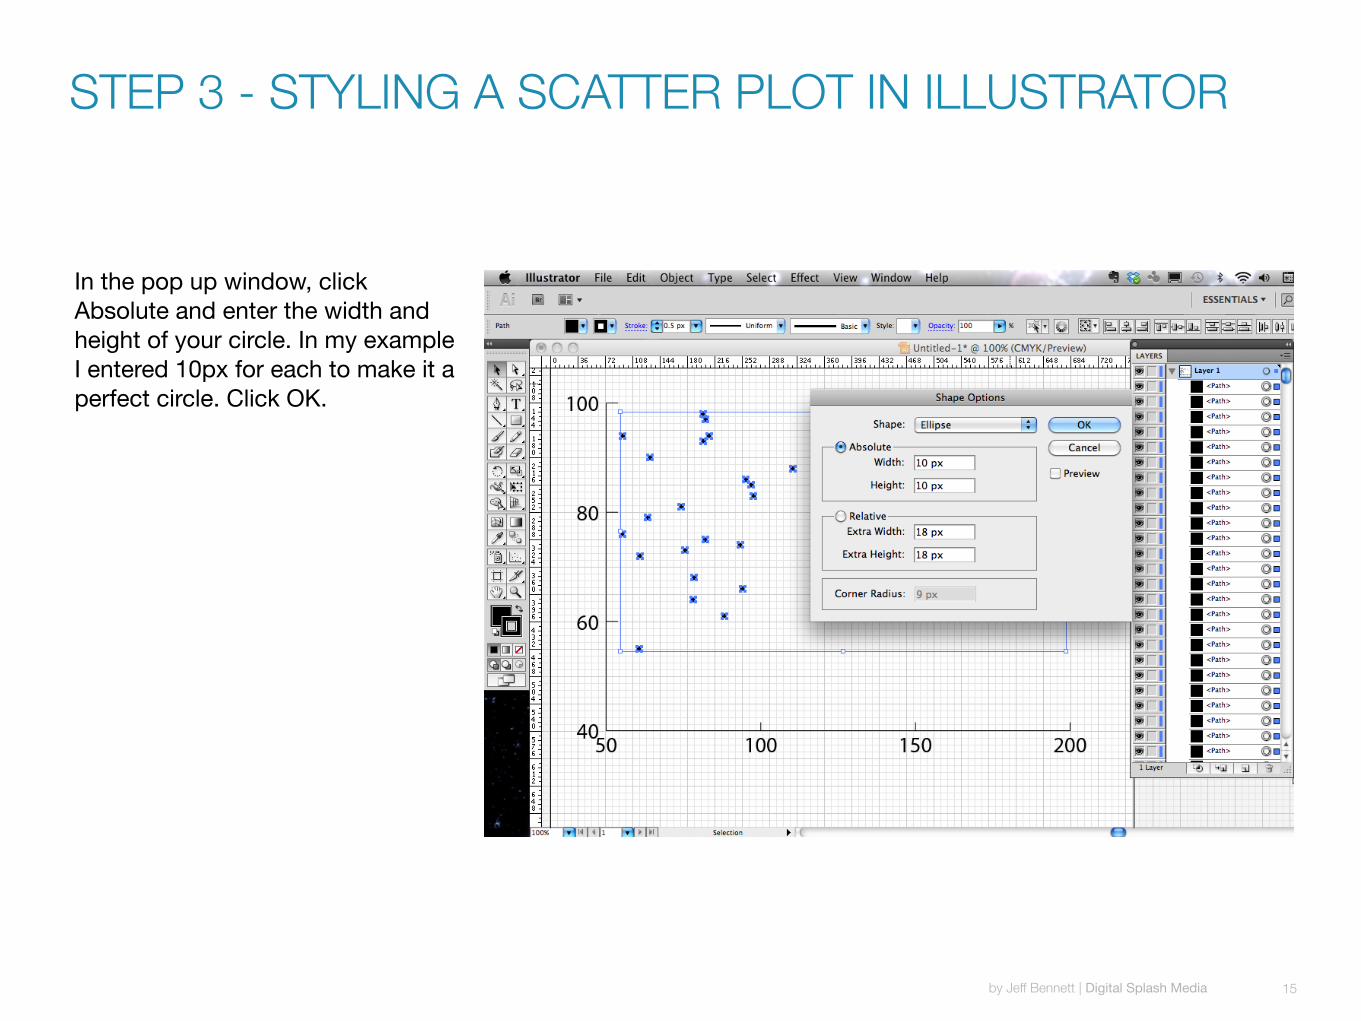
In the pop up window, click Absolute and enter the width and height of your circle. In my example I entered 10px for each to make it a perfect circle. Click OK.
STEP 3 - STYLING A SCATTER PLOT IN ILLUSTRATOR
by Jeff Bennett | Digital Splash Media 15

While you’ve still got all the points selected deselect the stroke color if you don’t want the circles to have a stroke.
STEP 3 - STYLING A SCATTER PLOT IN ILLUSTRATOR
by Jeff Bennett | Digital Splash Media 16
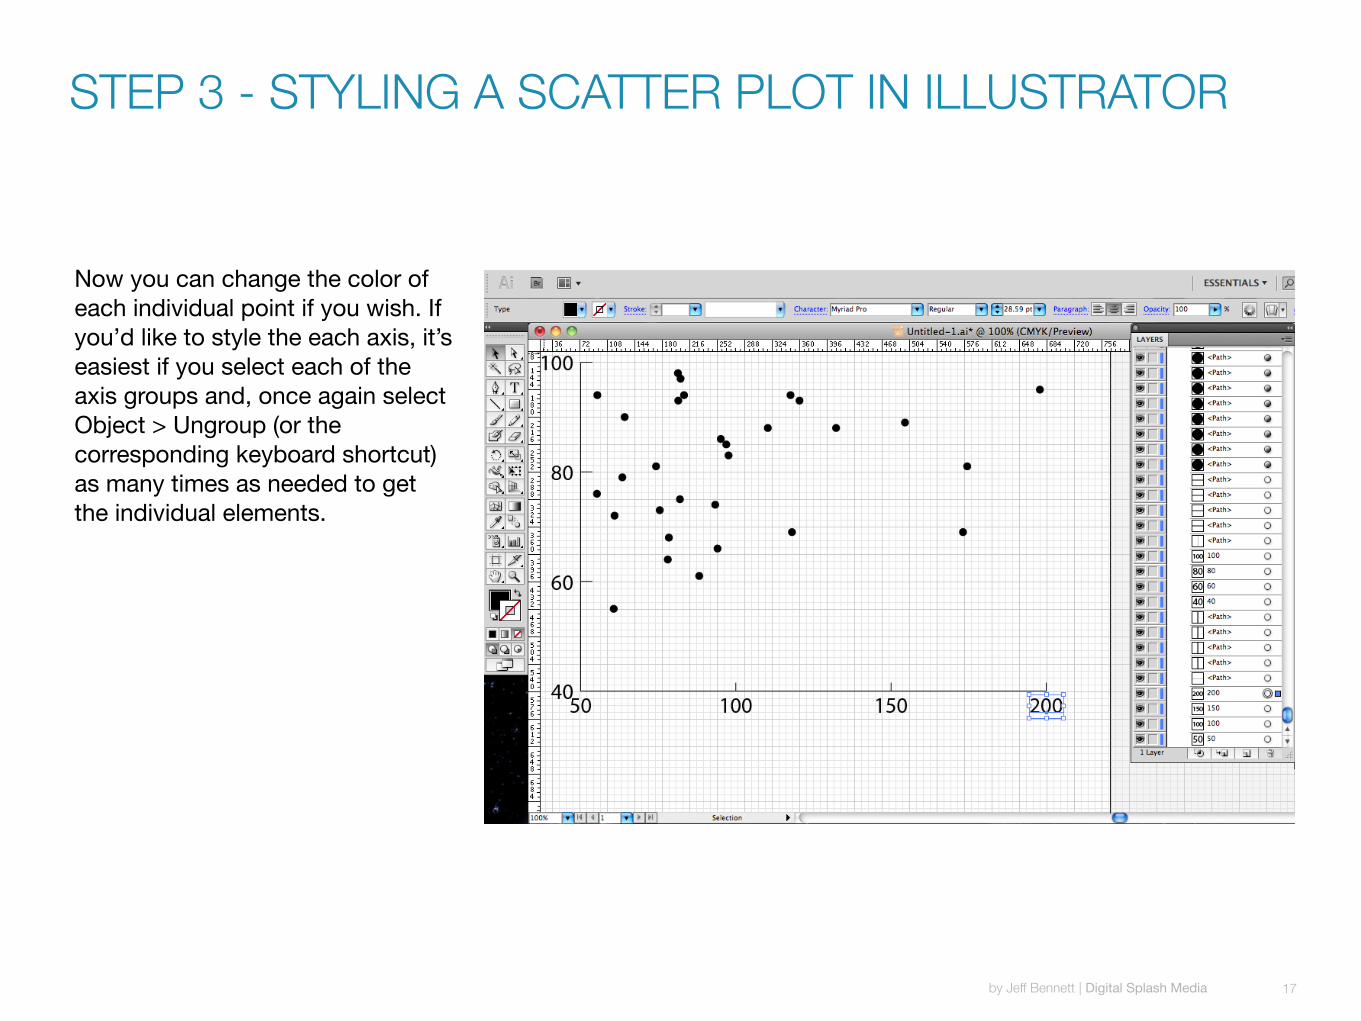
Now you can change the color of each individual point if you wish. If you’d like to style the each axis, it’s easiest if you select each of the axis groups and, once again select Object > Ungroup (or the corresponding keyboard shortcut) as many times as needed to get the individual elements.
STEP 3 - STYLING A SCATTER PLOT IN ILLUSTRATOR
by Jeff Bennett | Digital Splash Media 17

Here’s the same plot after changing the font, size and color of the axis elements and changing the colors of the dots. I wanted to focus on the ten teams that made the playoffs so I colored those teams in red and changed the rest to gray.
Now, the scatter plot is looking pretty good and it’s doing its job of showing the correlation, or lack thereof, of payroll to wins. But what if we want to label each of the dots of the graph so we can know which teams fall where?
STEP 3 - STYLING A SCATTER PLOT IN ILLUSTRATOR
by Jeff Bennett | Digital Splash Media 18

Unfortunately I haven’t found an easy way to label the dots, so I’ve come up with a rather tedious solution of identifying who each dot represents back in my spreadsheet program then finding the corresponding dot in illustrator and labeling it manually. Here’s what I mean.
Over in Google Docs, I can hover over each point and it will display the data for that dot. In the image above, I hovered over the top left dot to find the data for it, $55.37 million and 94 wins, then looked in the columns to find that that corresponds to the Oakland Athletics.
STEP 3 - STYLING A SCATTER PLOT IN ILLUSTRATOR
by Jeff Bennett | Digital Splash Media 19
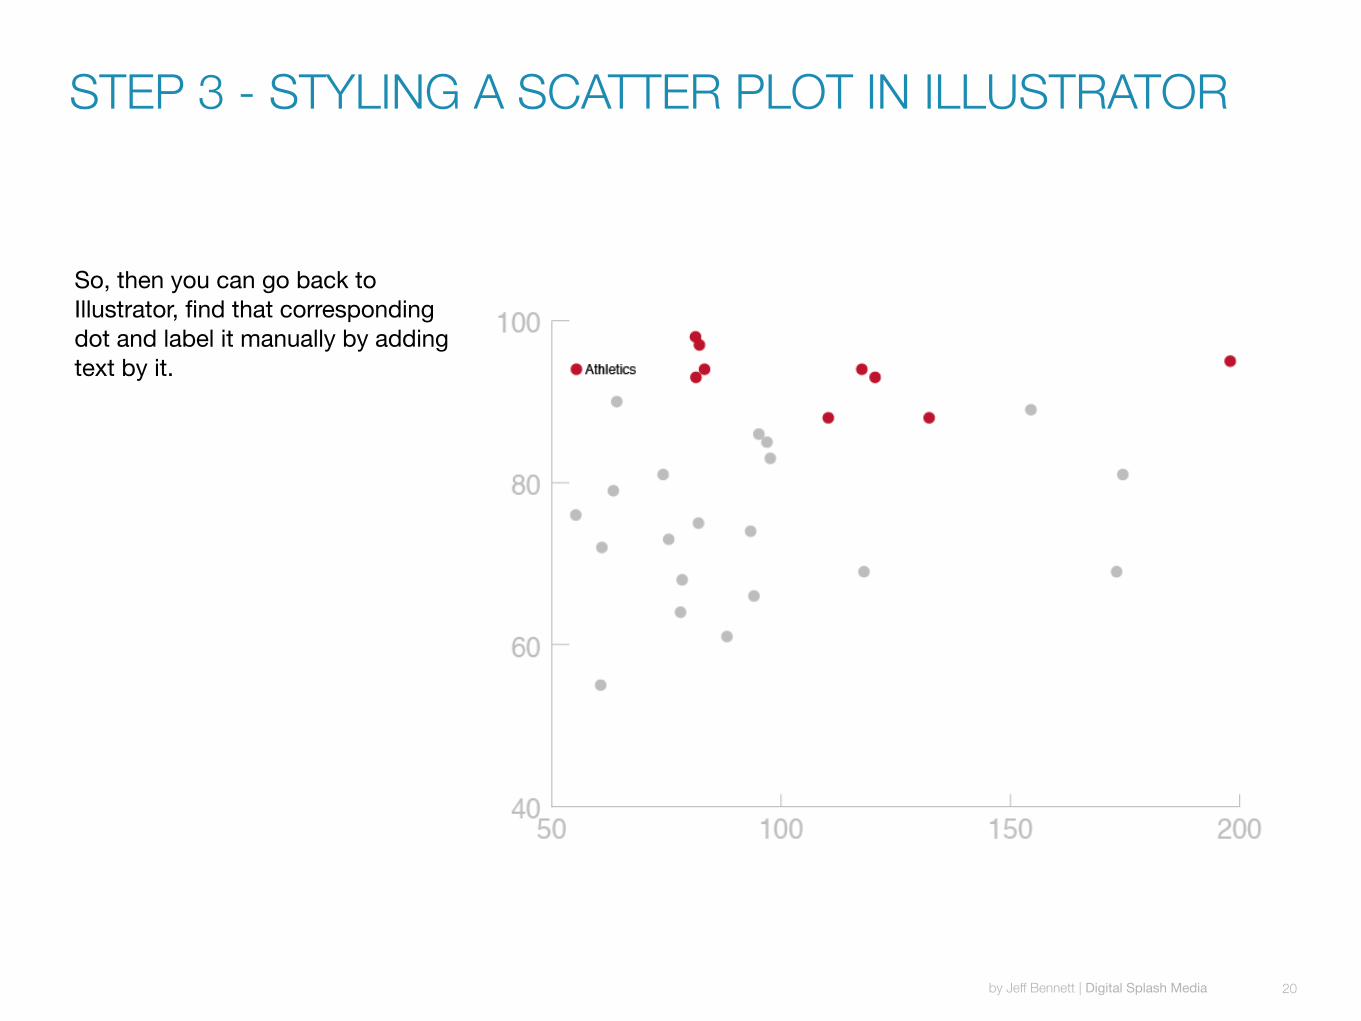
So, then you can go back to Illustrator, find that corresponding dot and label it manually by adding text by it.
STEP 3 - STYLING A SCATTER PLOT IN ILLUSTRATOR
by Jeff Bennett | Digital Splash Media 20

Repeat as needed to label as many of the dots as you’d like, until you’re happy with the result. Here’s my result.
STEP 3 - STYLING A SCATTER PLOT IN ILLUSTRATOR
by Jeff Bennett | Digital Splash Media 21