how to use life cycle assessment to reduce your scope 3
TRANSCRIPT

How to use life cycle assessment to reduce your scope 3 carbon emissions
12 October 2021
Sam Turner | Sam Hinton | Oli Lockhart

2
Who we are

3
• Why Scope 3 matters
• HVMC project to quantify off-shored emissions
• Potential for UK manufacturers to reduce
emissions by greenshoring
• Advice on how to quantify your own emissions and
take advantage of opportunity offered to UK
manufacturers
This webinar

PRESENTERS
Sam Turner
Sam Hinton
Oli Lockhart
Chief Technology Officer, HVM Catapult
Senior LCA Consultant, Ricardo
Senior Consultant, Carbon Management
and Net Zero, Ricardo

6
Any questions?
You can submit your question or comment in writing at any time during the webinar, using the control panel on your screen.
The control panel is
usually located in the
top right or top left
of your screen.

Scope 3 emissions: the challenge and
opportunityTHE ISSUE

8
The Engineering Challenge
10 point plan: Engineers and manufacturers will deliver many of the solutions to the Net
Zero challenge:
• Clean energy
• Decarbonised transport
• Sustainable buildings
+ Sustainable design + make
Chance to win UK engineering and manufacturing content
We must build these solutions with a net zero carbon manufacturing footprint

9
Definitions
• Embodied emissions: GHG emissions that are attributable to the mining, extraction,
transport, manufacture of a product
• Green Shoring*: Relocation of manufacturing supply chains to regions/ facilities with lower
GHG emissions
• UK Consumption emissions: Emissions attributable to goods and services consumed within
the UK
*Coined as part of Cross Catapult Net Zero Programme

10
Ref Prof Barret-
Leeds MRIO
Figure 4. 2017 UK emissions breakdown

11
UK manufacturing emissions headlines
• Emissions from manufacturing
could be as high as 43% of the
total UK consumption
emissions.
• UK consumption emissions
have flatlined while UK
territorial manufacturing
emissions have halved.

12
Intervention & innovation opportunities
Sector supply chain mapping will identify
high emitting steps in the chain and
opportunities for UK innovation and
‘Green-shoring’

13
MRIO – Sector lifecycle view of emissions
Raw Materials
Extraction
Materials
Processing
Engineering
Sub-component
Manufacturing
Operation of
Product through
life
Assembly of
Sub-systems
into a final
Product
Assembly of Sub-
components into
a Sub-system
MRIO
model (1)MRIO model (3)
MRIO
model (2)
UK Aerospace sector manufacturing apportionment of emissions from MRIO model (Top 20 attributable SIC codes- scaled from 52% total sector manufacturing emissions)
24
%60%
16
%

14
MRIO – Sector lifecycle view of emissions
Raw Materials
Extraction
Materials
Processing
Engineering
Sub-component
Manufacturing
Operation of
Product through
life
Assembly of
Sub-systems
into a final
Product
Assembly of Sub-
components into
a Sub-system
MRIO
model (1)MRIO model (3)
MRIO
model (2)
UK Automotive sector manufacturing apportionment of emissions from MRIO model
(Top 20 attributable SIC codes- scaled from 54% total sector manufacturing emissions)
25
%46%
29
%
15
Incentivise and reward OEMs and suppliers
We see four ways in which supply chain decarbonisation can be incentivised:
1. National legislation (carbon regulator or carbon pricing).
2. Voluntary sector standards and norms adopted across supply chains.
3. Consumer demand, enabled though visibility and embodied carbon tracking.
4. Investor choice; investors and funds favouring low carbon technologies.

16
UK Leadership
The UK has 1.1% of global emissions & offshore 89% of manufacturing emissions.
The impact can be much greater as a leader and exporter of technology & standards.
Lead the way in accounting for scope 3 or consumption emissions to amplify impact - Lead
the green industrial revolution just as we led the first…
…& become a global supply chain destination for sustainable manufacturing

17
Sector and business opportunities
Whole lifecycle and embodied carbon
analysis will pinpoint opportunities and
enable businesses to evidence their net
zero credentials
PLCA deep dives in Automotive, Aerospace, Nuclear & Offshore Wind to identify opportunities

POLL
What is your main driver for tackling your embodied emissions?
Client pressure
Investor pressure
Reputation
LCA of embodied carbon emissionsCASE STUDY

20
End of lifeManufacturing Distribution Retail UseComponents
What is Life Cycle Assessment (LCA)?
Raw material Energy Water
Carbon
emissions
CO2
Inp
uts
Su
pp
ly c
ha
inIm
pa
cts
ISO 14040 defines Life Cycle
Assessment to be the…
“compilation and evaluation of
the inputs, outputs and the
potential environmental impacts
of a product system throughout
its life cycle”

21
End of lifeManufacturing Distribution Retail UseComponents
What is Life Cycle Assessment (LCA)?
Raw material Energy Water
Carbon
emissions
CO2
Inp
uts
Su
pp
ly c
ha
inIm
pa
cts
ISO 14040 defines Life Cycle
Assessment to be the…
“compilation and evaluation of
the inputs, outputs and the
potential environmental impacts
of a product system throughout
its life cycle”

22
Product systems
• 1.5GW wind farm
• 100 15MW turbines
• ~84% Metal
• ~8% Concrete
• ~6% Composite
• ABWR fuel assembly
• ~52% Steel
• ~24% UO2
• ~14% Zircaloy
• C-Segment EDU
• ~49% Steel
• ~35% Aluminium
• ~10% Copper
Nuclear fuel assemblyAutomotive electric drive unitWind turbine

23
Wind turbine, breakdown by mass and GWP
Model built within LCA software,
SimaPro, using the ecoinvent
database
Model can be summarised as:
• Blades
• Nacelle
• Tower
• Farm infrastructure

24
What did we find?
• Mass dominated by metal (more specifically
steel)
• GWP, need to focus on steel and composites
Wind turbine, breakdown by mass and GWP
0%
10%
20%
30%
40%
50%
60%
70%
80%
90%
100%
Mass GWP
Other Composite Metal Rare earth Concrete

25
Steel
59%
23%
11%
<1%
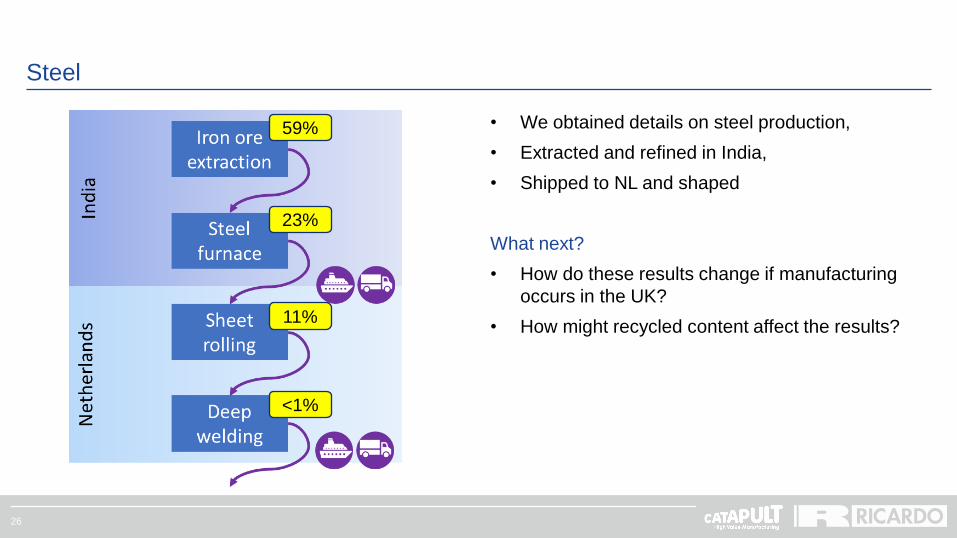
• We obtained details on steel production,
• Extracted and refined in India,
• Shipped to NL and shaped
26
Steel
59%
23%
11%
<1%
• We obtained details on steel production,
• Extracted and refined in India,
• Shipped to NL and shaped
What next?
• How do these results change if manufacturing
occurs in the UK?
• How might recycled content affect the results?

27
Steel
FOOTER INFO
0.0
0.1
0.2
0.3
0.4
0.5
0.6
0.7
0.8
0.9
1.0
1.1
1.2
1.3
1.4
kgC
O2eq/ kW
h
Region

28
Rebuilt model to use:
• UK Steel
• UK based EAF
• Iron scrap, as opposed to virgin iron ore
extraction
• UK based steel rolling
Steel, UK scenario
0%
10%
20%
30%
40%
50%
60%
70%
80%
90%
100%
Mass GWP GWP, UK
Other Composite Metal Rare earth Concrete

29
Onshoring CFRP and Steel
0
50
100
150
200
250
300
350
400B
lad
e m
at
Nace
lle m
at
Arm
ou
rin
g
Mo
no
pile
fo
un
da
tio
n
To
wer
mat
Con
du
cto
r
Bla
de
ma
t w
aste
Insu
latio
n
Tra
nsfo
rmers
(assu
med
2p
er
sub
sta
tion
)
Lea
d s
he
ath
Fo
un
datio
ns, la
nd
pre
pa
ratio
n
MP
tra
nsitio
n p
iece
-p
rim
ary
ste
el
Su
bsta
tio
n ja
cket
foun
datio
n
Bla
de
en
erg
y
Pla
tfo
rm
Oth
er
Su
bsta
tio
n ja
cket
pile
s
Sw
itch
gea
r
Bla
de
co
nsu
m
MP
tra
nsitio
n p
iece
-secon
da
ry s
tee
l
Fib
re O
ptic U
nit
ktC
O2e
Components of Wind Turbine
Composite Concrete Metal Other Rare earth Energy Waste Default scen
38%reduction overall

30
Nuclear Fuel Assembly, onshoring
0 300 600 900 1,200 1,500
Fuel pellets
Outer packaging
Clamshell
Transport
Skeleton
Intermediate spacer grids
End spacer grids
Top nozzle spring system
Intermediate products
Rod springs
Rod end plugs
Fuel rod support tubes
Bottom nozzle
Fuel rod cladding tubes
End nozzles
Debris filter
Guide thimble tube
Co
mp
on
en
t ty
pe
0.0 2.0 4.0 6.0 0 0.1 0.2
Aluminium
Steel
Zircaloy
Metal(other)
Process
Transport
Fuel
Reductions
45%reduction overall

31
EDU, onshoring
0 10 20 30 40 50 60 70 80 90 100 110 120 130
Fixings/Thermal Interface
Fixings/ Extras
Ancillary Components
Bearings
Shaft and Bearings
Gears, Shaft and bearing
Rotor Fastening
Stator Insulation
Gearbox Castings
Differential
Driver Board
HV Connections
Control Board
PE Casing
DC-link
Power Module
Housing
Active Components
kgCO2e
Com
ponent
Aluminium Steel Metal (other) Polymer Chemical Composite Other Carbon saving62%reduction overall

32
• UK offshores 89% of manufacturing emissions.
• Must look ‘upstream’ to reduce global emissions
• LCA can quantify upstream emissions and
opportunity offered by ‘greenshoring’
• Case studies show potential for reduction
• Wind 38%
• Nuclear 45%
• EDU 62%
Summary

POLL
Where do you see your organisation in terms of sustainability?
Leading the pack
Midfield
Needing to catch up

How to understand your emissions and
make the most of the opportunityAPPLICATION
35
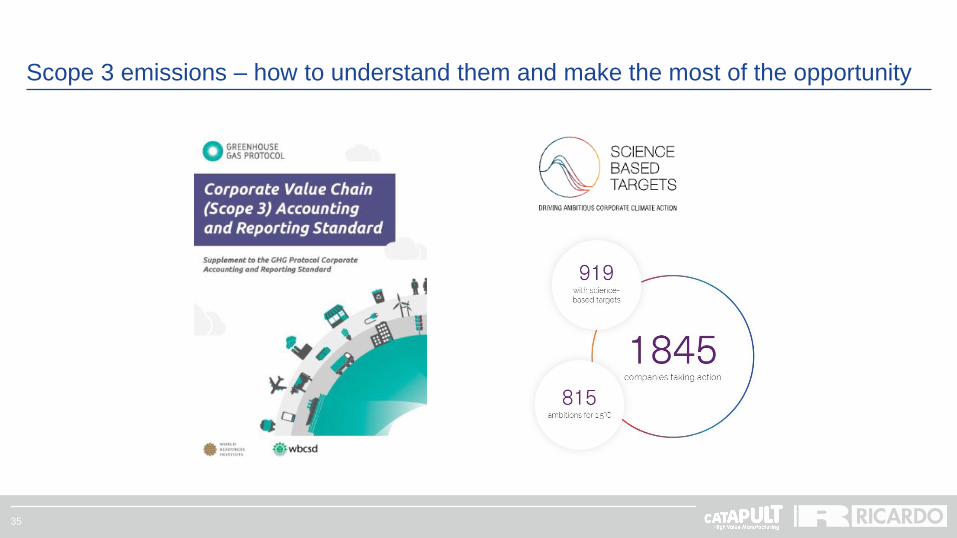
Scope 3 emissions – how to understand them and make the most of the opportunity

36
What are scope 3 emissions?
Scope 3 – How to understand your emissions and make the most of the opportunity
Source: GHG Protocol

37
What are scope 3 emissions?
Scope 3 – How to understand your emissions and make the most of the opportunity
Average emissions breakdown
Source: CDP
Ricardo’s emissions breakdown

38
The impact of scope 3 emissions
Scope 3 – How to understand your emissions and make the most of the opportunity
Source: Climate Action Tracker
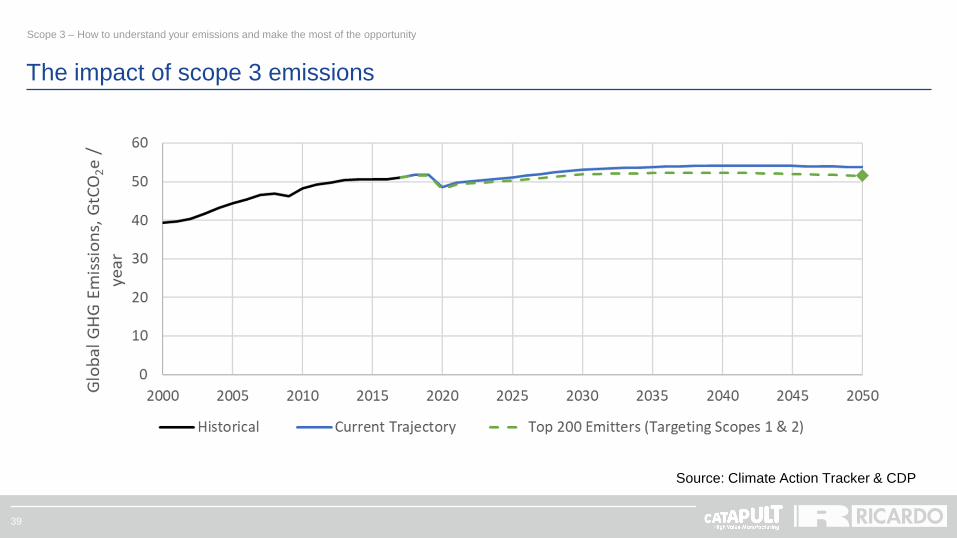
39
The impact of scope 3 emissions
Scope 3 – How to understand your emissions and make the most of the opportunity
Source: Climate Action Tracker & CDP

40
The impact of scope 3 emissions
Scope 3 – How to understand your emissions and make the most of the opportunity
Source: Climate Action Tracker & CDP

41
The business case
Scope 3 – How to understand your emissions and make the most of the opportunity
Demonstrate leadership
Identify resource and supply chain risks
Innovation
Access to capital
Legislation / regulation changes
Supplier engagement
Opportunities: Challenges:
Data availability
Resource and competing priorities
Complex value chains
Supplier engagement

42
Data hierarchy
Scope 3 – How to understand your emissions and make the most of the opportunity
1. Spend based data
e.g. GHG evaluator tool
2. Physical data (LCA)
Weights/volumes & average
emissions factors
3. Hybrid method
Combination of average & value
chain specific data
4. Energy & emissions data
Actual value chain partner energy &
emissions data
Incre
asin
g a
ccu
racy

43
Scope 3 is a process
Scope 3 – How to understand your emissions and make the most of the opportunity
Gap analysis
Inventory development
Action planning
Implement
Screening
Supplier engagement

44
Physical & energy
Estimates & spend
Activity D
ata
Em
issio
ns
Fa
cto
r
Scope 3
Emissions
x
=
Physical & energy
Value chain specific
Average data
Increasing supplier engagement, time & accuracy
Estimates & spend
Physical & energy
Value chain specific
Average data
Estimates & spend
Value chain specific
Average data
Data methodology development
Scope 3 – How to understand your emissions and make the most of the opportunity

45
Action planning and implementation
Scope 3 – How to understand your emissions and make the most of the opportunity
Scope 3
target
Scope 3 reduction projects /
programmes:
• Sustainable procurement
• Product design
• Supplier engagement
• Customer engagement
• Investment strategy
• Travel policies
• Transport and logistics
• Waste and water
management

POLL
What stage are you at with scope 3?
Not considered it yet
Thinking about it but not started a plan
Started to form a plan
Have a plan in place
Started implementing solutions
CONTACT US
Sam Turner
Sam Hinton
Oli Lockhart
Chief Technology Officer, HVM Catapult
https://hvm.catapult.org.uk/talk-to-us
Senior LCA Consultant, Ricardo
[email protected] | +44 (0)1235 753 000
Senior Consultant, Carbon Management
and Net Zero, Ricardo
[email protected] | +44 (0)1235 753 000