reduce cycle time and work in process in a medical device
TRANSCRIPT
Reduce Cycle Time and Work In Process in a Medical Device Factory:Scheduling of Needle Hub Molding Machines
by
Jing Yao
Bachelor of Engineering (Computer Engineering)National University of Singapore, 2006
Submitted to the Department of Mechanical Engineeringin Partial Fulfillment of the Requirements for the Degree of
Master of Engineering in Manufacturing
at the
Massachusetts Institute of Technology
September 2007
C 2007 Massachusetts Institute of TechnologyAll rights reserved
Signature of Author.................... ................ ..... ........................................
Department of Mechanical EngineeringAugust 21, 2007
I L4ABSA~HUBE
C ertified by......................... . .. .. ......... ..Stephen C. Graves
Abraham J. Siegel Professor of Management, Sloan School of ManagementThesis Supervisor
A ccepted by ........................................... ......... 4 .............. .. ...................Lallit Anand
Professor of Mechanical EngineeringChairman, Department Committee on Graduate Students
op TEoMiM.Ys
JAt4 3 2008
LIBRARIES
ARCHNVESI

2

Reduce Cycle Time and Work In Process in a Medical Device Factory:Scheduling of Needle Hub Molding Machines
by
Jing Yao
Submitted to the Department of Mechanical Engineeringon August 21, 2007 in partial fulfillment of the
requirements for the Degree of Master of Engineering inManufacturing
ABSTRACT
Many manufacturing firms have improved their operations by implementing a work-in-process (WIP) limiting control strategy. This project explores the application of thisconcept to limit WIP and reduce cycle time for the Becton, Dickinson and Company'smanufacturing facility in Tuas, Singapore. BD's Eclipse Safety Needle production line isfacing increasing pressure to reduce its high WIP and long cycle times. With the forecastof increasing demand, the current production control practice will sooner or later push theshop floor space to a limit. We divided the overall system into three manageable sub-systems and analyzed different strategies for each. This paper documents the approachesto schedule 30 molding machines. These machines are located at the first stage of theproduction line. Although the total production rate of the 30 machines is higher than thedownstream machines, the production rate of each product type is much slower becauseof machine constraints. This project groups the 30 machines into three groups, andproposes different strategies to reduce the total WIP level and cycle time.
Thesis Supervisor: Stephen C. GravesTitle: Abraham J. Siegel Professor of Management, Sloan School of Management
3

ACKNOWLEDGEMENT
First and foremost, we wish to express our deepest appreciation to our thesis supervisor,Professor Stephen C. Graves from the Sloan School of Management in MIT, for hisconsistent guidance and encouragement throughout the project. We will always feelinspired by his enthusiasm, dedication to excellence, and careful attention to details.
We would also like to thank Associate Professor Sivakumar Appa Iyer from the Schoolof Mechanical and Aerospace Engineering in NTU as an advisor of this project. ProfessorSiva helped us with exploring scheduling policies and simulation tools for this project.
Kind thanks also goes to Becton, Dickinson and Company for sponsoring this work.Specifically we want to thank Mr. Tan Kok Hui, our corporate supervisor, for giving usvaluable feedback and suggestions. Many thanks go to all the staffs in the Eclipse safetyneedle production line in BD Tuas plant, for their strong support in the project.
I would also like to thank the other two team members of this project, Kai Meng and YiQian. This project could not be possible without their teamwork.
Finally, I would like to thank my wife, Suh In, for the support and love she had given methroughout this project.
4

TABLE OF CONTENTS
A BSTRA C T .................................................................................................................................................. 3
A C K N O W L ED G EM EN T ........................................................................................................................... 4
TA BLE O F C O N TEN TS ............................................................................................................................. 5
LIST O F FIG U R ES...................................................................................................................................... 7
LIST O F TA BLES ........................................................................................................................................ 8
LIST O F EQ UA T IO N S ............................................................................................................................... 9
IN TR O D U C TIO N ............................................................................................................................. 11
1.1 BACKGROUND ........................................................................................................................... 111.1.1 BD M edical and BD Tuas Plant.......................................................................................... 111.1.2 The Team Project................................................................................................................. 12
1.2 THESIS O VERVIEW ................................................................................................................... 12
2 ECLIPSE SAFETY NEEDLE PRODUCTION LINE................................................................. 13
2.1 T HE PRODUCT........................................................................................................................... 132 1.1 Eclipse Safety N eedle......................................................................................................... 132.1.2 Four M ajor Product Types ............................................................................................... 142.1.3 28 K Us................................................................................................................................ 14
2.2 D EM AND AND C USTOM ERS.................................................................................................... 152.2.1 D em and D istribution ........................................................................................................ 152.2.2 Custom ers and Orders .................................................................................................... . 16
2.3 THE ECLIPSE V ALUE STREAM .............................................................................................. 172.3.1 Process Flow of the Eclipse Production Line................................................................. 72.3.2 The Eclipse Value Stream Production Planning Team.................................................... 19
2.4 C URRENT PRACTICE................................................................................................................. 192.4.1 Planning............................................................................................................................... 192.4.2 M achine Capacity and Perform ance............................................................................... 20
.4.3 Cycle Tim e and W IP Level............................................................................................... 22
3 PROPOSED SOLUTIONS TO THE OVERALL SYSTEM ..................................................... 25
3.1 ROOT CAUSES TO THE HIGH WIP AND LONG CYCLE TIME PROBLEM ............................... 253.1.1 Unnecessary Early Start in a Push-Pull and Pure Push System .................................... 253.1.2 Unsynchronized Production Flow .................................................................................... 263.1.3 R ationales behind the R oot Causes.................................................................................. 26
3.2 OUR APPROACHES TO REDUCE CYCLE TIME AND WIP ......................................................... 26
4 SCHEDULING THE HUB MOLDING MACHINES................................................................... 29
4.1 H UB M OLDING STAGE .............................................................................................................. 294.1.1 Products ............................................................................................................................... 294.1.2 M achines.............................................................................................................................. 294.1.3 Capacity................................................................................................................................ 294.1.4 M achine Compatibility ...................................................................................................... 30
4.2 A NALYZE THE PROBLEM .......................................................................................................... 304.2.1 D em and and it D istribution of N eedle H ubs.................................................................... 304.2.2 M achine Capacity and H ub Inventory............................................................................. 314.2.3 Variability of Production R ate ........................................................................................ 33
4.3 C URRENT PRACTICE................................................................................................................. 344.4 A PROPOSED SOLUTION ........................................................................................................... 34
4.4.1 Create Three Groups of Molding Machines ................................................................... 354.4.2 Strategy for the LS Group ............................................................................................... 36
5

4.4.34.4.4
4.5
Strategy for the Two LL Groups..........................................................................................Details of the Proposed Solution ...................................................................................
SIM ULATION .............................................................................................................................
363740
4.5.1 A ssumptions ......................................................................................................................... 414.5.2 O bjectives ............................................................................................................................. 424.5.3 Sim ulation and Results...................................................................................................... 434.5.4 D iscussion of the Sim ulation Results............................................................................... 45
4.6 C ONCLUSION............................................................................................................................. 48
4.6.1 Implem entation.................................................................................................................... 494.6.2 Future W ork ........................................................................................................................ 49
R E FER EN C ES ........................................................................................................................................... 51
APPENDIX A PRODUCTION ASSIGNMENT OF THE HUB MOLDING MACHINES TOM IN IM IZ E C H A N G EO V ER S ................................................................................................................. 52
6

LIST OF FIGURES
FIGURE 1 A LUER-SLIP SAFETY NEEDLE WITH SYRINGE............................................................................ 13FIGURE 2 HOW TO USE AN ECLIPSE SAFETY NEEDLE................................................................................. 13FIGURE 3 THE ECLIPSE PRODUCTION LINE PROCESS FLOW (MODIFIED BASED ON BD INTERNAL SOURCE). 17FIGURE 4 C URRENT PLANNING PRACTICE ..................................................................................................... 20FIGURE 5 REPRESENTATION OF WIP INVENTORY ON FLOW PATHS............................................................. 22FIGURE 6 AN EXAMPLE OF THE PROPOSED PLANNING CYCLE ................................................................... 27FIGURE 7 THE PROPOSED PRODUCTION CYCLE FOR HUB MOLDING ............................................................. 37FIGURE 8 A SCREENSHOT OF THE LS HUB MOLDING PLANNING TOOL ..................................................... 39FIGURE 9 A SIMULATION MODEL FOR THE HUB MOLDING, AN, AND PACKAGING MACHINES.................... 41FIGURE 10 COMPARISON OF THE DEMAND COMPLETION DAYS IN THE 3 SIMULATION SCENARIOS .............. 45FIGURE I I COMPARISON OF THE AVERAGE CYCLE TIME IN THE 3 SIMULATION SCENARIOS ..................... 46FIGURE 12 COMPARISON OF THE TOTAL AVERAGE WIP IN THE 3 SIMULATION SCENARIOS ..................... 46FIGURE 13 WIP SIZE COMPARISON BETWEEN THE CURRENT PRACTICE AND THE SIMULATION RESULTS..... 48FIGURE 14 AVERAGE CYCLE TIME: THE CURRENT PRACTICE VS. THE SIMULATION RESULTS (EXCLUDING LS
P R O D U C T S)........................................................................................................................................... 4 8
7

LIST OF TABLES
TABLE I AVAILABLE SKUs OF THE ECLIPSE SAFETY NEEDLE PRODUCTION LINE..................................... 15TABLE 2 D EM AND D ISTRIBUTION ................................................................................................................. 16TABLE 3 ACTUAL W IP INVENTORY QUANTITY AND COST.......................................................................... 23
TABLE 4 CAPACITY AND CONSTRAINTS OF THE HUB MOLDING MACHINES................................................ 30TABLE 5 Two GROUPS OF THE LL MOLDING MACHINES........................................................................... 35
TABLE 6 THE PROPOSED PRODUCTION SEQUENCE FOR THE ASSEMBLY MACHINE .................................... 38
TABLE 7 THE PROPOSED PRODUCTION SEQUENCES FOR THE Two LL HUB MOLDING GROUPS................ 40
TABLE 8 SIMULATION RESULTS FOR LL HUB MOLDING STARTS AT THE SAME TIME AS ASSEMBLY ............ 43
TABLE 9 SIMULATION RESULTS FOR LL HUB MOLDING STARTS 12 SHIFTS EARLIER THAN ASSEMBLY ....... 44
TABLE 10 SIMULATION RESULTS FOR LL HUB MOLDING STARTS 18 SHIFTS EARLIER THAN ASSEMBLY..... 44
8

LIST OF EQUATIONS
EQUATION t CALCULATION OF DEMAND OF EACH MACHINE .................................................................... 21EQUATION 2 EQUATIONS TO CALCULATE ASSEMBLY STARVATION........................................................... 32EQUATION 3 CALCULATION OF UTILIZATION IN THE SPREADSHEET FOR THE LS HUB MOLDING MACHINES 40
9

10

1 INTRODUCTION
To produce the right parts, at the right time, at competitive costs is the key success factorin the modem manufacturing world. To achieve the competitive advantage, to improvethe overall performance of manufacturing operations and to obtain time and cost saving,production cycle time and work in process (WIP) limiting control strategies have becomeessential.
The Eclipse Safety Needle production line in BD Medical's Singapore manufacturingfacility is facing increasing pressure to reduce its high WIP and long cycle times. Withthe forecast of increasing demand, the current WIP management and productionscheduling practice will sooner or later push the shop floor space to a limit. Long cycletime will also delay the company's response to product obsolescence and quality issues.Evidently, effective strategies for reducing cycle time and limiting WIP will be necessaryfor BD to strengthen its competitive position.
The challenge of the task lies in the complex setting of process flow and equipmentcapability. Multiple product types take different routes in a multi-station production line.The only shared resource among all product types is the bottleneck in the company; yet,this piece of equipment operates faster than any other single machine. Depending on theproduct-mix demand distribution, other machines may experience high utilization as well.At the multi-machine molding station, there are long changeover times to switch fromone product type to another. Setting up machines to produce a particular product type atmaximum possible rate can help to reduce cycle time and WIP, but it also results in morechangeovers. Such tradeoffs between cycle time and changeover cost further complicatethe problem.
1.1 Background
1.1.1 BD Medical and BD Tuas Plant
Becton, Dickinson and Company (BD) is a global medical technology company that isfocused on improving drug therapy, enhancing the diagnosis of infectious diseases andadvancing drug discovery. BD manufactures and sells medical supplies, devices,laboratory instruments, antibodies, reagents and diagnostic products. It serves healthcareinstitutions, life science researchers, clinical laboratories, industry and the general public.
BD Tuas plant manufactures cannula, needle, and syringe products; it supplies theseproducts to BD's distribution centers (DC), which then supply the worldwide market. Theplant is organized in value streams. There are 7 values streams (VS) producing 7 differentproduct families in the plant. Each VS operates independently with its own equipmentand work force. This project focuses on the VS that produces safety needles. This VS isinternally referred to as Eclipse Value Stream.
11

1.1.2 The Team Project
Sponsored by Singapore-MIT-Alliance program and the company, this internship projectserves as the basis for the theses for MIT's Master of Engineering degree inManufacturing. A team approach is adopted, in which a group of 3 students identify andanalyze the problem jointly; then each of the three students focuses on solving a sub-problem on an individual basis.
The team identified three sub-problems and provided an analysis and possible solutionsfor each. Details of the project are documented in the three theses. Titles of the threetheses are listed below. Proposed strategies for the Needle Assembly machine (AN) anddownstream packaging machines are discussed in Thesis 1 and Thesis 2. Scheduling ofhub molding machines is extensively studied and documented in Thesis 3. Inventorymanagement and production scheduling for Needle Shield (NS) and Safety Shield (SS)molding machines is presented in Thesis 1.
Thesis 1: Reduce Cycle Time and Work In Process in a Medical Device Factory: TheProblem and a Proposed Solution
Thesis 2: Reduce Cycle Time and Work In Process in a Medical Device Factory:Scheduling Policies for Needle Assembly Machine
Thesis 3: Reduce Cycle Time and Work In Process in a Medical Device Factory:Scheduling of Needle Hub Molding Machines
1.2 Thesis Overview
In Chapter 2 we will provide background information of the company's operations andthe cycle time and WIP problem in the Eclipse safety needle production line. In Chapter3 we analyze the root cause of the problem and present an overall solution. In Chapter 4we analyze issues related to the scheduling of the needle hub molding machines andpresent a solution.
12

2 ECLIPSE SAFETY NEEDLE PRODUCTION LINE
In this chapter, we will provide background information of the company's operations andthe cycle time and WIP problem in the Eclipse safety needle production line.
2.1 The Product
2.1.1 Eclipse Safety Needle
A needle product is a hypodermic needle connected to a syringe for hypodermic injection.It is detachable from the syringes. A conventional needle consists of a plastic needle hub,a metal cannula, and a plastic needle shield for the cannula. The needle hub is used toattach the needle to a syringe. The cannula is fixed on the needle hub by epoxy. Theneedle shield is a safety cover for the cannula for protection both before and afterinjection.
Eclipse safety needle (Figure 1) is a new product introduced by BD Medical in 2005.Different from conventional needles, the safety needle has an extra safety shield installedon its needle hub. The safety shield is designed to shield and lock the needle cannula afterinjection. The major reason to have the safety shield is to protect end users, like nurses,from being injured with the use of the needle (Figure 2).
Cannula
4 -0'
3>Luer-Slip Hub
Luer-Slip Syringe (Slip Lock)
Figure 1 A Luer-Slip Safety Needle with Syringe
Safety Shield
Metal Ring inside Hub
Needle Shield
iw to use an Ecipse Natety Needle
13
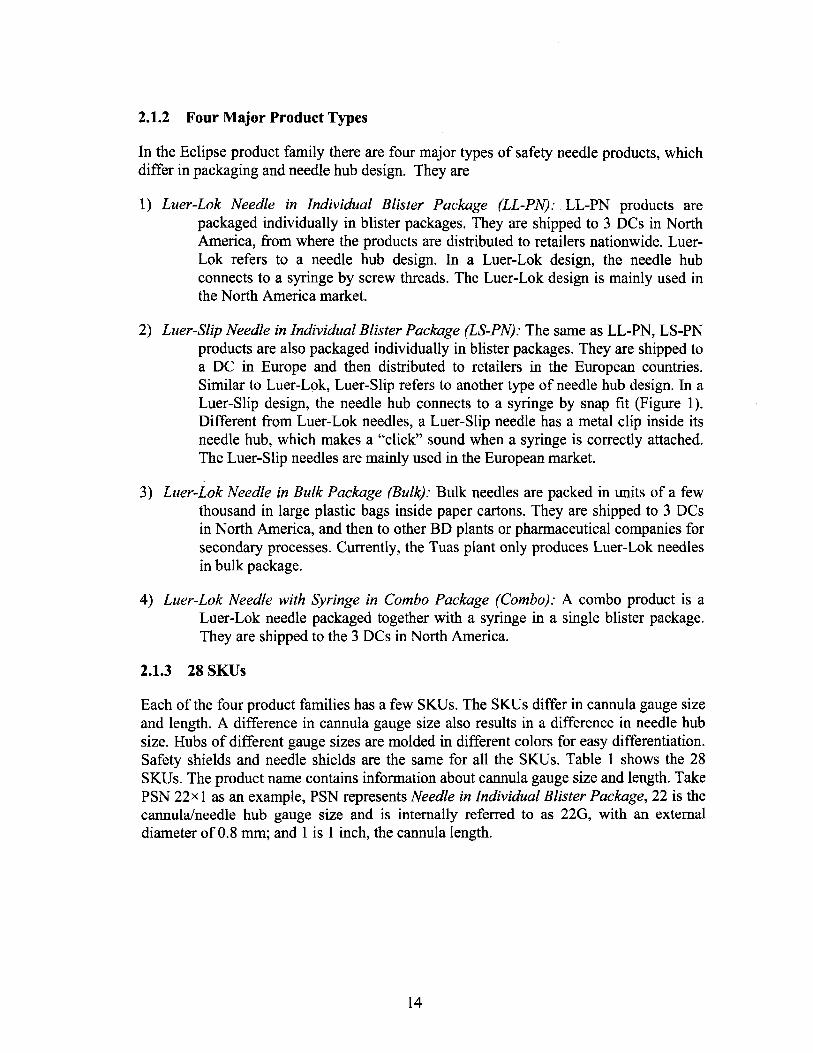
2.1.2 Four Major Product Types
In the Eclipse product family there are four major types of safety needle products, whichdiffer in packaging and needle hub design. They are
1) Luer-Lok Needle in Individual Blister Package (LL-PN):. LL-PN products arepackaged individually in blister packages. They are shipped to 3 DCs in NorthAmerica, from where the products are distributed to retailers nationwide. Luer-Lok refers to a needle hub design. In a Luer-Lok design, the needle hubconnects to a syringe by screw threads. The Luer-Lok design is mainly used inthe North America market.
2) Luer-Slip Needle in Individual Blister Package (LS-PN): The same as LL-PN, LS-PNproducts are also packaged individually in blister packages. They are shipped toa DC in Europe and then distributed to retailers in the European countries.Similar to Luer-Lok, Luer-Slip refers to another type of needle hub design. In aLuer-Slip design, the needle hub connects to a syringe by snap fit (Figure 1).Different from Luer-Lok needles, a Luer-Slip needle has a metal clip inside itsneedle hub, which makes a "click" sound when a syringe is correctly attached.The Luer-Slip needles are mainly used in the European market.
3) Luer-Lok Needle in Bulk Package (Bulk): Bulk needles are packed in units of a fewthousand in large plastic bags inside paper cartons. They are shipped to 3 DCsin North America, and then to other BD plants or pharmaceutical companies forsecondary processes. Currently, the Tuas plant only produces Luer-Lok needlesin bulk package.
4) Luer-Lok Needle with Syringe in Combo Package (Combo): A combo product is aLuer-Lok needle packaged together with a syringe in a single blister package.They are shipped to the 3 DCs in North America.
2.1.3 28 SKUs
Each of the four product families has a few SKUs. The SKUs differ in cannula gauge sizeand length. A difference in cannula gauge size also results in a difference in needle hubsize. Hubs of different gauge sizes are molded in different colors for easy differentiation.Safety shields and needle shields are the same for all the SKUs. Table I shows the 28SKUs. The product name contains information about cannula gauge size and length. TakePSN 22x I as an example, PSN represents Needle in Individual Blister Package, 22 is thecannula/needle hub gauge size and is internally referred to as 22G, with an externaldiameter of 0.8 mm; and 1 is 1 inch, the cannula length.
14

PSN 21 x 1 TWPSN 21 x 1 1/2 TWPSN 22 x 1PSN 22 x 1 1/2PSN 23 x 1_PSN 25 x 1PSN 25 x 1 1/2
De
-ligh Runner
-uigh Runner
PSN 20 x 1 (Luer-Slip)PSN 21 x 1 (Luer-Slip)PSN 21 x 1 1/2 TW (Luer-Slip)
Luer Slip PSN 23 x 1 (Luer-Slip)PSN 25 x 5/8 (Luer-Slip)PSN 27 x 1/2 (Luer-Slip)PSN 30 x 1/2 (Luer-Slip)Bulk Needle 22 x 1 1/2
Bulk Bulk Needle 22 x 1 TW (ABG)Bulk Needle 23 x 1 MTW (ABG)21 x 1 1/2 TW 3 ml Combo21 x 1 TW 3 ml Combo22 x 1 1/2 3 ml Combo22 x 1 3 ml Combo23 x 1 3 ml Combo25 x 1 3 ml Combo25 x 5/8 1 ml Combo25 x 5/8 3 ml Combo
LL Light Blue High Runner
LL Orange High RunnerLS Yellow High Runner
High RunnerLS Li ht BlueLS Orang High RunnerLS GreyLS Yellow
LL Li ht Blue
LLgtBu
LL Orange I27 x 1/2 1 ml Combo LL Grey30 x 1/2 1 ml Combo ILL Yellow I
Eclipse Safety Needle Production Line
2.2 Demand and Customers
2.2.1 Demand Distribution
Because the Eclipse products have been introduced to the North America market for less
than 3 years and to the European market for about 1 year, there is very high demand
fluctuation. BD expects the demand to increase rapidly, especially in the Europeanmarket. Demand of different products types and SKUs are not evenly distributed.
In FY 2006, LL-PN contributes over 50% of the total units sold to the DCs, followed byLS-PN and Combo with about 20% each. Bulk constitutes less than 4% of the total units
sold. For each major product type, demand usually concentrates in a few SKUs. For
instance, SKUs with gauge size 18G, 21 G, 23G, and 25G have higher demand than others
in LL-PN.
A more detailed illustration of the demand distribution is shown in Table 2. We
summarize the distribution based on the total units sold to the DCs in FY 2006. Due to
confidentiality concerns, the real demand quantity is not disclosed. Nevertheless, to
provide information on the demand fluctuation, we calculate the coefficient of variation
(c.v. = Mean ) based on the monthly demand of each SKU. The 4th columnstandard deviation
summarizes the demand percentage of each SKU in its major product type; and the 5 th
15
Package ProductIPSN 18 x 1 1/2
Luer-Lock
Combo
Table 1 Available SKUs of the

column indicates the demandproducts in FY 2006.
percentage of each product type in all the safety needle
Major Types SKUs (Guage x Length) c.v. SKU/Type Type/TotalPSN 25 x 1 0.76 14.2%PSN 23 x 1 0.65 17.5%PSN 22 x 1 1/2 1.01 9.4%PSN 21 x 1 TW 0.77 11.7%
LL-PN PSN 21 x 1 1/2 TW 1.21 7.9% 532%PSN 18 x 1 1/2 0.50 31.9%PSN 25 x 1 1/2 0.76 5.8%PSN 22 x 1 2.38 1.5%PSN 25 x 5/8 (Luer-Slip) 0.74 32.1%PSN 27 x 1/2 (Luer-Slip) 0.72 6.6%PSN 30 x 1/2 (Luer-Slip) 0.62 5.2%
LS-PN PSN 23 x 1 (Luer-Slip) 0.79 5.2% 19.6%PSN 21 x 1 (Luer-Slip) 0.43 12.8%PSN 21 x 1 1/2 TW (Luer-Slip) 0.71 16.1%PSN 20 x 1 TW (Luer-Slip) 0.90 22.1%1 ml 25 x 5/8 Combo 0.49 16.1%1 ml 27 x 1/2 Combo 0.40 11.8%1 ml 30 x 1/2 Combo 0.58 2.8%3 ml 21 x 1 TW Combo 0.00 1.9%
Combo 3 ml 25 x 5/8 Combo 0.54 19.9% 23.6%3 ml 23 x 1 Combo 0.57 13.3%3 ml 22 x 1 1/2 Combo 0.52 26.6%3 ml 21 x 1 1/2 TW Combo 1.00 1.9%3 ml 25 x 1 Combo 0.73 3.8%3 ml 22 x 1 Combo 0.00 1.9%Bulk Needle 22 x 1 1/2 0.33 28.9%
Bulk Bulk Needle 23 x 1 MTW (ABG) 0.09 27.7% 3.6%Bulk Needle 22 x 1 TW (ABG) 0.35 43.4%
Table 2 Demand Distribution
2.2.2 Customers and Orders
Although products from the Eclipse line are consumed by both end users and industrialcustomers, the production line's direct customers are the 3 DCs in North America and the1 DC in Europe, who then provide supply to regional customers.
In the beginning of a fiscal year, the Tuas plant receives an order forecast from the 4 DCs,which contains information about the monthly order quantity for each SKU in the next 12months. The DCs can update their forecast subject to a 45-day frozen window ruleimposed by the company, in which they could only change the forecast at least 45 days inadvance of an order. In other words, the forecast becomes a firm order when its shipmentdate is less than 45 days away. The plant can start to produce an order once it becomesfirm. The forecast is updated mostly via email between the DCs and plant planner.
The time unit for order quantity commitment from the DCs is a month, which meansthere is not a more specific due date on an order. With the 45-day frozen window, ordersfor the next month are usually confirmed on the 15th of the current month. For example, ifthere is an order for a particular SKU in May, it is confirmed on April 15h. Its deadlinewill be the end of May and it could be shipped any time in May. There is no plannedfinished goods inventory in BD as production is to order and orders are shipped once theyare ready to go. This is true for all SKUs.
16

As a conclusion, the order for next month from each of the four DCs is confirmed on the
middle of the current month. The orders for next month must be shipped by the end of the
next month at the latest.
2.3 The Eclipse Value Stream
2.3.1 Process Flow of the Eclipse Production Line
Figure 3 shows the process flow of the Eclipse line, with the clean room boundary
marked in black lines. The scope of this project is limited to the processes inside the
clean room.
Clean Room
Assembly StageMolding Stage
Luer Lock PrcssFo
u lk N Pedle Assebly (250 MM)
Nedk Sheied Packaging Stagen2.1PN ETO Sterilization
Packaged Nodle (705.6Ne l cycle -PN
m c , Safety Shield Assembly (145 MM) il ( m388.8cncycle -Combo)
3cc
A Outgassing -Microlab
cc
( Luer Lock Process Flow i ce Sierentpon Luer Slip Process Flow c I m
--0 Bulk Needle Process Flow Shipment-- Combo Process Flow 1cc
Figure 3 The Eclipse Production Line Process Flow (Modified based on BD Internal Source)
2.3. 1.1 Processes inside Clean Room
The processes inside the clean room can be divided into three stages: molding, assembly
and packaging. There are four groups of 33 injection molding machines in the molding
stage, two machines in the needle assembly stage, and three machines in the packaging
stage.
2.3. 1.1. 1 Molding Stage
This process produces plastic parts by injection molding; these parts are used in the
assembly stage. There are four types of plastic parts being molded: Needle Shield (I
machine), Safety Shield (2 machines), Luer-Lok Hub (20 machines), and Luer-Slip Hub
(10 machines). Luer-Lok and Luer-Slip hub molding machines produce 13 different types
of needle hubs. Each machine can produce a few types of hubs by changing its mold
17
-_ --- :- . . ......... ..... ................... ..... ... .......... ... ....

inserts. The changeover typically takes 2 hours. There is only one type of needle shieldand safety shield, so there is no changeover for the shield molding machines.
The production at the molding stage follows a monthly production plan. For hub molding,production capacity of a specific hub type is constrained by the number of availablemachines and mold inserts. Moreover, a mold insert can only run on a limited number ofmachines on which it has been validated. For example, there are 10 Luer-Slip Hubmolding machines, but there are only 5 mold inserts for 20G hubs. These inserts can onlyrun on 5 validated machines out of the 10. Thus, we are constrained to have at most fivemachines producing 20G hubs at any point of the time.
2.3.1.1.2 Assembly Stage
Needle Assembly (AN) Machine
Needle assembly is performed by a complex assembly machine, which assembles thecannula, needle hub, and needle shield together into an assembled needle. The detailedsteps involved in this stage are:
a) Insert cannula into the needle hub.b) Apply epoxy between the cannula and hub.c) Rotate the cannula position in the hub.d) Heat the epoxy to create bonde) Put on needle shield.
All products produced in the Eclipse line are processed through this station. As aconsequence, BD perceives the AN machine as the bottleneck of the whole process flow.It is highly utilized in order to meet monthly demand. Its utilization can go as high asover 90% when demand is high. A changeover is required between assemblies ofdifferent SKUs. A typical changeover takes 30 minutes on average.
Snap Clip Assembly (AN SC) Machine
Only Luer-Slip products require this process step. It is done by a single machine, whichtakes assembled needles from AN and inserts a metal clip into the needle hub. Achangeover is required between assemblies of different SKUs. A typical changeovertakes 30 minutes on average.
2.3.1.1.3 Packaging Stage
Packaged Needle Assembly (PN) Machine
The PN machine first attaches a safety shield to the needle hub. It then seals the needle ina single blister package, and finally packages the blister packages in cartons. All threesteps are performed by a single machine. Both LL-PN and LS-PN products have to routethrough this machine.
18

Bulk Needle Packaging Machine
Only one type of product, Bulk needles, uses this machine, which packages needles inbulk form. Because the bulk product has very low demand (less than 4% of the totaldemand in FY 2006), this machine runs only a few shifts per month.
Combo Packaging Machine
This machine is very similar to the PN machine. An assembled Luer-Lok needle fromAN is assembled with a safety shield, then packaged together with a syringe into a blisterpackage, and finally packed in cartons. Syringes are manufactured and supplied byanother value stream in the same plant.
2.3.1.2 Processes outside Clean Room
After being packaged in cartons, products are moved out from the clean room. Processesoutside the clean room include sterilization, out gassing, shrink wrap, and shipment tocustomers. The total processing time of these operations takes 15 days on average. As aconsequence, products need to complete all operations in the clean room 15 days beforetheir shipment date.
2.3.2 The Eclipse Value Stream Production Planning Team
Coordinated by a Value Stream leader, the production planning team consists of aproduction planner, shift supervisors, technicians and material handling personnelworking on the shop floor. Major decisions on scheduling and production control aremade by the planner.
2.4 Current Practice
2.4.1 Planning
The production plan is generated monthly for each individual machine by a planner usingExcel spreadsheets. Based on the current WIP level and demand, the planner sets theproduction quantity, start date and finish date for each part for each machine monthly.After these production plans are generated, they are released to the production floor. Theproduction plans of the Eclipse line are also passed to other value streams who supplysyringes and cannula, so that syringes and cannula would be delivered according to theplans.
As AN is perceived as the bottleneck, the current planning strives to minimize thechangeover on AN by producing large batches. Typically the production batch size ofeach SKU is chosen to be the order quantity for an entire month, which can go up to 5million pieces for high demand SKUs. The transfer batch size is always the same as theproduction batch size, which means any downstream production of one SKU would notstart until its upstream process is finished. Moreover, the production plans build in a timebuffer between successive operations; thus, according to the schedule, a production batch
19

from upstream will complete well before the scheduled start for its next downstreamoperation. This scheduled queuing time varies from a few days to a few weeks. Forinstance, the scheduled queuing time for hubs between molding stage and assembly stageis usually around I to 3 weeks. The scheduled queuing time for assembled needlesbetween assembly stage and packaging stage is usually around a few days to 2 weeks.
Because of the long queuing time, there is a long cycle time for producing any of theproduct types. Due to the long cycle time, the current planning practice must rely heavilyon the demand forecast. Figure 4 describes an example of the current planning practice.Planning for production in May is started on 15th Apr, when customer orders for May areconfirmed. Because products require 15 days for processes outside clean room, orders inMay have to be completed from packaging at the latest by 15th May. As a result, productsproduced at the packaging stage after 15th May are for demand in June, which is stillbased on forecast when the production plan for May is generated. For molding andassembly stages, production starts even earlier than packaging. From our analysis, 80%of assembly and 100% of molding are planned based on forecast due to the long cycletimes. It is evident that shortening the cycle time is critical to enable production to bebased entirely on firm orders.
Molding
Assembly Production Based on
Production Based on Forecast. Ship in Future.Firm Order. Ship in May. Packaging
1st May 1st un 1st JulTime I -
Order Frozen Window (Firm Order) Demand Forecast
1st to 31St May: Exercise Plans* for May
~25th Apr: Release Plans for May
~15h Apr: Start Planning for May
*Plans might be revised during this periodFigure 4 Current Planning Practice
2.4.2 Machine Capacity and Performance
2.4.2.1 Capacity
Currently, demand is very close to the originally designed capacity of many machines inthe line, especially for the AN machine and PN machine. Since only the data from theproduced quantity of the final products in FY 2006 is available, we calculated thedemand for each machine based on the produced quantity, the flow paths of those
20
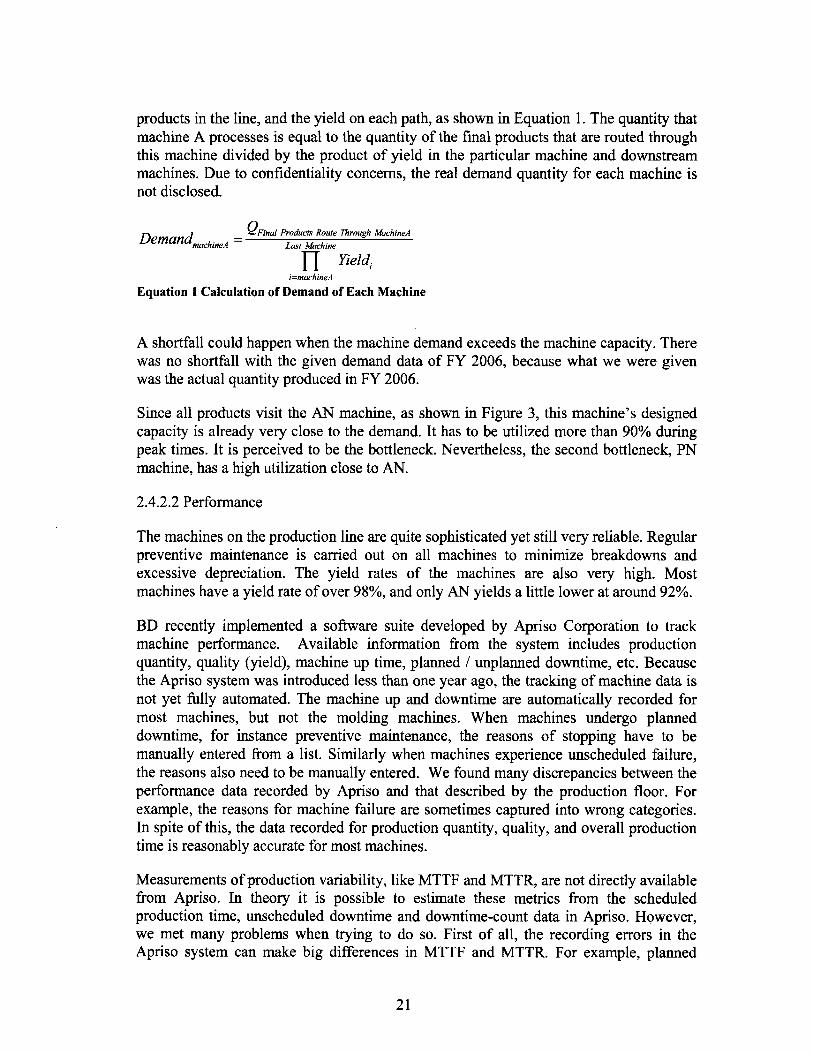
products in the line, and the yield on each path, as shown in Equation 1. The quantity thatmachine A processes is equal to the quantity of the final products that are routed throughthis machine divided by the product of yield in the particular machine and downstreammachines. Due to confidentiality concerns, the real demand quantity for each machine isnot disclosed.
Demand - QFinal Products Route Through MachineALast Machine
fj Yield,i=machineA
Equation I Calculation of Demand of Each Machine
A shortfall could happen when the machine demand exceeds the machine capacity. Therewas no shortfall with the given demand data of FY 2006, because what we were givenwas the actual quantity produced in FY 2006.
Since all products visit the AN machine, as shown in Figure 3, this machine's designedcapacity is already very close to the demand. It has to be utilized more than 90% duringpeak times. It is perceived to be the bottleneck. Nevertheless, the second bottleneck, PNmachine, has a high utilization close to AN.
2.4.2.2 Performance
The machines on the production line are quite sophisticated yet still very reliable. Regularpreventive maintenance is carried out on all machines to minimize breakdowns andexcessive depreciation. The yield rates of the machines are also very high. Mostmachines have a yield rate of over 98%, and only AN yields a little lower at around 92%.
BD recently implemented a software suite developed by Apriso Corporation to trackmachine performance. Available information from the system includes productionquantity, quality (yield), machine up time, planned / unplanned downtime, etc. Becausethe Apriso system was introduced less than one year ago, the tracking of machine data isnot yet fully automated. The machine up and downtime are automatically recorded formost machines, but not the molding machines. When machines undergo planneddowntime, for instance preventive maintenance, the reasons of stopping have to bemanually entered from a list. Similarly when machines experience unscheduled failure,the reasons also need to be manually entered. We found many discrepancies between theperformance data recorded by Apriso and that described by the production floor. Forexample, the reasons for machine failure are sometimes captured into wrong categories.In spite of this, the data recorded for production quantity, quality, and overall productiontime is reasonably accurate for most machines.
Measurements of production variability, like MTTF and MTTR, are not directly availablefrom Apriso. In theory it is possible to estimate these metrics from the scheduledproduction time, unscheduled downtime and downtime-count data in Apriso. However,we met many problems when trying to do so. First of all, the recording errors in theApriso system can make big differences in MTTF and MTTR. For example, planned
21

downtime is sometimes recorded as unplanned downtime in the system. Because theplanned downtime can sometimes be very long, it could increase MTTR dramatically if itgets recorded as unplanned downtime. Moreover, the machine downtime-count data isinaccurate in most cases. For example, the waiting time for material from upstreamoperations is often falsely recorded as machine downtime. Such recording errors increasedowntime drastically. As a conclusion, the exact measurements of production variabilityare not available for our project. Because the company regards the machines as veryreliable, we expect there is little loss from ignoring variability in our analysis.
2.4.3 Cycle Time and WIP Level
The WIP that we discuss in this project includes molded hubs and shields beforeassembly, as well as assembled needles. The locations of WIP on the process flow areindicated in Figure 5. Four major product types are labeled with different color and thelight blue ellipses represent the WIP locations.
Eclipse Flow PathsVersion 2
1. Including blister packaging andcartoning2. Manual process
NeedleShield
Molding
NeedleShields
LL Hub LLMolding Hubs
LS Hub LSMolding Hubs
-I
SafetyShield
Molding SaetyShield
Needle
AN LLNeedle
Assembly
AN SCSnap ClipAssembly
AssembledNeedle LS
(before SC)
Combo Process Flow
Bulk Needle Process Flow
* Needle Needle
Psckaglrg Ctonigj
Luer Lock Process Flow
PackagedNeedle Luer Slip Process Flow
AssembW y
Machine Buffr
AssembledNeedle LS(after SC)
Figure 5 Representation of WIP Inventory on Flow Paths
The Apriso system is able to accurately track the real-time WIP status, but it does notstore historical data. Table 3 summarizes the actual WIP quantity and cost extracted fromthe Apriso system, based on daily observation over the month June 2007.
22

Quantity' (K Unit Inventory inventory CostMolded parts pieces) cost () 1 ($)Luer Lock Hub 4,904 $0.013 $62,962Luer Slip Hub 4,402 $0.018 $79,040Needle Shield 2,003 $0.007 $14,508Safety Shield 1,761 $0.008 $14,633Total Molded 13,070 $171,144
Quantity (K Unit inventory Inventory CostAssembled parts pieces) Cost ($) ($)Safety Needle - LL 8,692 $0.039 $342,765Safety Needle - LS (before Snapclip) 6,316 $0.047 $294,323Safety Needle - LS (after Snapclip) 4,725 $0.106 $499,108Total Assembled 19,733 $1,136,196* figure based on average of daily figure from 1st June to 31st June, 2007
Table 3 Actual WIP Inventory Quantity and Cost
In the month of June, an extraordinary problem with raw material supply forced the SnapClip Assembly (AN SC) machine to stop for a month. Contamination of metal clips fromthe only supplier caused AN SC to starve, affecting all the Luer-Slip products. Thoseassembled Luer-Slip needles with the stained metal clips have to be scrapped sooner orlater. The other three types of products do not route through ANSC. Upstream of theANSC, the bottleneck AN continued to process Luer-Slip products because the companybelieved that ANSC would be able to catch up quickly as soon as it returned toproduction. As a result by early July, the WIP produced by AN kept building up in thebuffer space before ANSC. Because of this rare problem, the figures in Table 3 over-statethe actual inventory level for assembled Luer-Slip needles. However, the table stillprovides good estimate of assembled Luer-Lok needles, as well as molded components.
The average WIP inventory amounts to ~13 million pieces for molded parts, and at least~14 million pieces for assembled needles after discounting the inflated estimate for Luer-Slip. Compared to the demand in FY 2006, the inventory levels for molded parts andassembled needles are both more than their average monthly demand. A large WIPinventory leads to long cycle time in the product line. The recorded current cycle time isabout 60 days for the processes within clean room. Given the 45 days' order frozenwindow and the 15 days required for processes outside the clean room, the cycle timeinside the clean room has to be within 30 days for the production to be fully based onfirmed demand. Since the current cycle time inside the clean room far exceeds 30 days,the production is forced to be based on the demand forecast.
Reducing the cycle time may enable the production plan to be based on the firm orders.By reducing the cycle time, the factory also has the advantage of gaining flexibility [1]:The system will be more capable of very fast turnaround on individual orders, and thefactory may more readily adapt to a changed order because the corresponding job maynot have begun its processing. By reducing the WIP on the shop floor, the factory has thebenefit of reducing inventory holding cost, faster detection of quality problems, henceless scrap or rework.
23

24
3 PROPOSED SOLUTIONS TO THE OVERALL SYSTEM
After understanding the current operation practice and measuring the WIP inventory level,in this chapter we will analyze the root causes to the high WIP and long cycle timeproblem, and discuss our approaches to the problem.
3.1 Root Causes to the high WIP and long Cycle Time Problem
3.1.1 Unnecessary Early Start in a Push-Pull and Pure Push System
From the current planning practice (Section 2.4.1), we observe that the current practice isactually a mixture of push-pull and pure push approaches. In a pure push system,production is planned based on forecast. In a push-pull system, the upstream productionis scheduled based on forecast, which is push, and the downstream production is based ondemand, which is pull.
In the current practice, upstream machines, like the molding machines, producecompletely based on forecast. It is a very typical push approach. The planning of thedownstream machines, which are the assembly and packaging machines, is morecomplicated. For packaging machines, they produce based on demand in the first half of amonth and based on forecast in the second half. As a result, they change from pull topush in the middle of each month. The situation for assembly machines is similar, butthey transform from pull to push earlier (See Section 2.4). When we look at theproduction line as a whole, it is a push-pull system in the first half of a month and a purepush system in the second half. When it is a push-pull system, a push-pull boundaryexists between molding and assembly at first, and then quickly moves to betweenassembly and packaging. As a result, a large amount of WIP is built up at the push-pullboundary, before and after the assembly, especially between assembly and packaging.
The major problem with this mixture of push-pull and pure push is that it does not workwell with a make-to-order system, which the Eclipse line is designed to be. A push-pullapproach could be used in a make-to-order system, but a pure push system is definitelynot. However, how could the current practice survive with a pure push system? Thesecrets are the relatively accurate forecast and the planner's ability to communicate withcustomers frequently to further reduce forecast errors.
Even though the current practice seems to work well with meeting demand, it canincrease cycle time and WIP. There are two reasons.
First of all, push starts production too early in either pure push or push-pull scenarios.The current practice simply starts pushing production of molded parts about one and halfmonths earlier than demand, which directly increases cycle time and WIP.
Secondly, because the production line is supposed to be make-to-order, there is nofinished goods inventory. If there is an error in forecast, like a cancellation of an order,the last stage (packaging stage), would not produce the cancelled order. The already
25

partially produced order from upstream would sit in the buffers as WIP and wait until thenext order of the same SKU arrives.
3.1.2 Unsynchronized Production Flow
Under the current practice, a monthly production plan is generated for all stations beforethe month starts. The plan specifies the production quantity, start and end date for eachbatch of material on all machines in the month. It is equivalent to say that the time thateach batch visits each machine on its route is pre-determined. Because it is difficult topredict the exact time when the batch will be ready from the upstream station, the planusually gives a more conservative schedule by requiring the upstream to complete thebatch earlier. This planning method causes a lack of synchronization of flow for eachproduct type and introduces an extra delay between stations on top of the queuing time.
3.1.3 Rationales behind the Root Causes
In summary, the two root causes which explain the high WIP and cycle time are
1) Unnecessary early start of production in a push-pull and pure push system.2) Unsynchronized production flow caused by the over-detailed production plans.
After we find the root causes of our problem, it is not hard for us to understand therationales behind them. First of all, because the AN machine is the bottleneck of theproduction line as a whole, the best interest of planning would naturally be to preventstarvation at the AN station. To prevent starvation, the plan requires molded parts toalways be available in front of the AN machine. In order to do so, molding starts muchearlier than assembly, the earlier the better AN is protected from starvation. However, aproblem starts to develop when molding starts earlier and earlier. The make-to-ordersystem gradually transforms from a pull system to push-pull system, or even pure pushsystem. Because of the nature of push, products are manufactured based on forecast. Inthe case when the partially finished products do not have actual demand, they have tostay in the shop floor because there is no finished goods inventory. As a result, the laststage of the line has to be scheduled after the orders become firm. This is exactly whathappens in the current practice. The last stage operates on pull according to its productionplan and the other stages push material to the downstream. In the end, overly detailedproduction plans introduce extra delays to the production flow and further increase cycletime and WIP.
3.2 Our Approaches to Reduce Cycle Time and WIP
After understanding the root causes, our basic approaches to the problem became veryclear.
First of all, we need to eliminate the unnecessary early start. Our goal is to graduallytransform the system back to a pure pull system, in this case make-to-ordermanufacturing. However, if the cycle time can not be reduced to the quoted lead time to
26

customers, a push-pull system is still necessary. Our goal would then be to move thepush-pull boundary as far upstream as possible.
Then, we also need to achieve better synchronization of the production flow for eachproduct family. Downstream machines could use FIFO policy instead of detailedproduction plans, if a pure pull system is used. If a push-pull system is required, only themost upstream machines and the machines right after the boundary have to be scheduled.Other machines can still use FIFO. Extra delays would be automatically eliminated withFIFO.
Molding
Production Based onFirm Order. Ship in May. Assembly Possible Idle Time.
Packaging Production Based onPossible Idle Time. -Firm Order. Ship in May.
1st May 1st Jun 1st JulTime -
Order Frozen Window (Firm Order) Demand Forecast
16th Apr to 15th May: Exercise Plans
15thApr: Release Plans for 16th Apr to 15th May
Figure 6 An Example of the Proposed Planning Cycle
These two basic approaches require some changes of the current planning cycle. Thecurrent planning cycle is from the beginning of a month to the end of it. To transform thesystem to a demand-based make-to-order system, we change the cycle to be from 16th of
every month to 15 th of the following month, which is just the first 30 days of the orderfrozen window. It is important to note that, in our new planning cycle, we just want toproduce the orders which are confirmed on the 15th of that month. It means planning foreach cycle is done just one day before the cycle starts based on actual demand.
Figure 6 shows an example of our proposed planning cycle. On 15th April, demand forMay is confirmed. We release the production plans for the period from 16th Apr to 15th
May on that day, based only on actual demand in May. During the production period, 16th
Apr to 15'h May, we run the machines to satisfy demand in May. An optimal outcome isthat all products for May leave the clean room before 15th May, so that they can proceedto processes outside the clean room and be shipped before May 31. A new planning cyclefor June then starts on 15th May.
There are two important questions to be addressed in the above example.
27

First of all, can the demand of May be satisfied, if we only start production on 16 th Apr?If the answer is yes, then what we have described is a make-to-order or pull system whichmeets demand. If the answer is no, we need to further adjust the pull system to be push-pull, which means upstream of the production line has to start before 16h Apr.
Secondly, the current practice requires 10 days to do planning, is it possible to planeverything in just one day now? The answer might be yes. As we have already discussed,we propose to use FIFO when possible. No planning would be required when a machineproduces based on FIFO. If the answer is no, our proposed solution would be hard toimplement.
Now we can see that the two important questions are actually two requirements for ourproposed solution. In the rest of our theses, we divide the problem into three parts andelaborate our solution in detailed steps. Meanwhile, we also show that the tworequirements could actually be met by our solution.
The three parts are
1) Scheduling AN and downstream machines. In this part, we do not consider themolding machines other than to assume that molding will not starve the AN.Based on the proposed planning cycle, we analyze the machines downstream ofmolding in great details. Results are shown in both the first thesis and the secondthesis.
2) Scheduling hub molding machines. With the findings in the first part, we thenconsider the whole line including the molding machines. These results arediscussed in this thesis.
3) Scheduling safety shield and needle shield machines. We use a different approachfor these two machines. This is discussed in the first thesis.
28

4 SCHEDULING THE HUB MOLDING MACHINES
As discussed earlier, we divided the team project into three parts. The hub moldingmachines are the last part studied in the project.
4.1 Hub Molding Stage
Needle hub molding is the first stage of the safety needle production. In this stage, needlehubs are produced from plastic resin and color concentrates by injection moldingmachines. The next stage after hub molding is needle assembly, in which hubs, needleshields, and cannulas are assembled together into assembled needles.
4.1.1 Products
Although there are about 30 SKUs in the safety needle product family, some SKUs usethe same hub type. There are 13 types of hubs in total. They differ in design and gaugesize. Hubs for Luer-Lok and Luer-Slip needles are different in design. For each design,there are a few gauge sizes. More specifically, there are 7 gauge sizes for Luer-Lok hubsand 6 sizes for Luer-Slip hubs. Each of the 13 types of hubs is produced in a differentcolor, so that they can be easily differentiated.
4.1.2 Machines
Different from needle shield and safety shield, hubs are produced by a group of 30 small-capacity injection molding machines. The machines are managed in two groups. The firstgroup of 20 machines is dedicated to Luer-Lok hubs, and the second group of 10machines is dedicated to Luer-Slip hubs. Because of validation and other reasons,machines in one group can only produce the design to which it is dedicated. Within thetwo groups, machines can produce hubs with different gauge sizes by changing inserts.
Because one insert could only produce one gauge size, a changeover is required toproduce a different gauge size. Changeover takes about 2 hours on average. Two mainsteps of changeover are cleaning and changing mold inserts. The steps are documented asstandard operating procedures. Changeover time variation is very small.
4.1.3 Capacity
Because of different mold inserts design, the average production rates of the LL machinesand LS machines are different. Each LL machine has an average capacity of 14,000 hubsper shift. Each LS machine has an average capacity of 10,000 hubs per shift. Highercapacity is achieved by running multiple machines in parallel.
For each gauge size, its maximum capacity is limited by the total number of inserts. Forexample, there are only 12 inserts for 18G LL hubs. Even if there are 20 LL machines,the maximum capacity is only the capacity of running 12 machines simultaneously.Because mold inserts used in hub molding are expensive, the number of inserts for each
29

gauge size is limited, and based on the demand.each hub type and the maximum capacity.
Table 4 shows the number of inserts for
ILL ProductMax mold Max Production
Gauge Schedule inserts Machine Competibility Rate (/shift)18G High runner 12 16821G High runner 12 16822G Medium runner 7 9823G High runner 12 any of the 20 machines 16825G High runner 12 16827G Low runner 5 7030G Low runner 6 84
LS ProductMax momd Nax Production
Gauge Schedule inserts MINchine Cornpatibilfty Rate MW00shlft)20G High runner 5 LS5; LS6; LS7; LS9; LS10 5021G High runner 4 LS1 : LS2; LS3 ;LS4; LS8 4023G Low runner 3 LS7; LS8; LS10 3025G High runner 6 LS2; LS3; LS5; LS6; LS7; LS9 6027G Low runner 2 LS1 ; LS2 2030G Low runner 3 LS3; LS4; LS5 30
Table 4 Capacity and Constraints of the Hub Molding Machines
4.1.4 Machine Compatibility
Machine compatibility refers to the compatibility between the molding machines andmold inserts. Because of natural variation on machines and inserts, an insert and machinepair has to be validated together before they can be paired for production. If an insert andmachine pair passes validation, they are compatible and qualified for production.
Because the current validation process is costly and time consuming, some machines andinserts are still not compatible with each other. The compatibility issue exists in the Luer-Slip machine group. Table 4 shows compatible machines for each gauge size. For theLuer-Lok group, all mold inserts are compatible with any of the molding machines.
The compatibility issue creates an extra constraint in scheduling the LS machines. Thecompany is working on the compatibility issue now, but we have to keep this constraintin our project.
4.2 Analyze the Problem
Demand of the safety needle products is described in 2.2. In the previous section, wedescribed the capacity and constraints of the hub molding stage in detail. By translatingthe demand of safety needle products to the demand of hubs and comparing demand withcapacity, we can understand the problem better.
4.2.1 Demand and it Distribution of Needle Hubs
We can calculate the demand of the needle hubs from the demand of final products.Because one hub type is usually shared by a few SKUs, its demand is the sum of thedemand of a few SKUs. As hub molding is the first stage of the production line, we alsoneed to consider downstream yield loss when calculating demand for the hubs. In our
30
calculation, we use the product monthly demand data of FY 2006 and average yield lossto estimate the demand of hubs in FY 2006.
Distribution of hub demand is also closely related to its direct consumer - the needleassembly machine. The assembly machine is the most highly loaded machine in theproduction line. Each needle has to go through this machine. In FY 2006, the monthlydemand is close to its capacity. In order to fully utilize this machine to meet demand, theplant wants to minimize its idle time, including changeover. In current practice,changeover at this machine is minimized such that production batch size of a SKU isusually the same as its monthly demand. In other words, the assembly machine onlyproduces each SKU once a month. We follow the same practice in our project. As a resultof this practice, the monthly demand for a needle hub type occurs only when it is beingassembled on the needle assembly machine. The period varies from one shift to a fewshifts, depending on demand. In this period, demand of a hub type is just the averageproduction rate of the assembly machine (250,000 per shift).
As a conclusion, monthly demand of the hubs is calculated from the monthly demand offinal products with yield loss. For a particular hub type, its demand is concentrated intothe few shifts when the hub type is being assembled on the needle assembly machine.Demand is zero for the rest of the month.
4.2.2 Machine Capacity and Hub Inventory
The total capacity of the 30 molding machines is 380,000 per shift (280,000 per shift forLL and 100,000 per shift for LS), which is much higher than the capacity of the assemblymachine (250,000 per shift). However, the maximum capacity of each individual hubtype is actually smaller than the capacity of the assembly machine (see Table 4). Thus,the production rate of a hub type is actually slower than its consumption during itsassembly period.
Theoretically, this is not a problem. As long as we can have the total production rate ofhubs be higher than the assembly rate, the assembly machine can always avoid starvationby getting a different hub type when stock of the current type is exhausted. It means that,if the total molding production rate is higher than the assembly rate, even if molding andneedle assembly start at the same time, we can avoid starvation.
However, in the actual case, because the assembly machine only produces each SKUonce a month, it does not produce another SKU until the current one is completed. If ahub type is depleted when its SKU batch is not completed, starvation would happen.
As a result, there must be enough stock of a hub type before its assembly starts.Otherwise, the assembly machine might be starved. The solution is to start hub moldingmuch earlier than needle assembly. For example, hub molding of SKU B can be startedwhile assembly machine is still working on SKU A. When SKU A is finished at theassembly machine, a stock of hubs for SKU B is already built.
When early start of hub molding is required, the question becomes how early it shouldstart, or how many hubs should be stocked before assembly starts. As the average rates of
31

production (production rate of hub molding for each SKU) and demand (production rateof assembly) are known, we can consider the question as a simple Chase Problem.Production runs first in this problem. Demand starts a few shifts later and chasesproduction. If demand catches up with production before the finish line, starvationhappens. The total distance is the production batch size (monthly demand) of a SKU. Theproblem is formulated below, from where we can calculate the minimum early start timeor inventory level for hubs.
For each SKU,ProductionBatchSize
tAN = AssemblyProductionRate
ProductionBatchSizetfHUB HubProductionRate
To prevent starvation of the assembly machine, we must haveTimeAN Start -TimeHUB Start tHUB tAN
Or inventory of hubs before assembly isInventory (tJy - tA ) HubProductionRate
Equation 2 Equations to Calculate Assembly Starvation
The simple equations show that the minimum early start time and inventory level of hubsare functions of production batch size, production rates of hubs, and production rate ofassembly. As discussed earlier, the production batch size is always the same as themonthly demand and the production rate of assembly is always at its maximum. We onlyhave the freedom to control hub production rate in this project.
A high production rate of hubs results in a small minimum inventory and early start time,which also means small cycle time and WIP. However, the highest production rate ofeach hub type is achieved by running the maximum possible machines in parallel. Whenthe total number of machines is limited to 30, this means very frequent changeover ofmold inserts on the machines is necessary. Frequent changeover could be a problem forthe production floor. Currently, there are at most about 30 to 40 changeovers monthly.Any more changeovers would require extra labor force and changeover stations. We needto consider a tradeoff between changeover frequency and the minimum hub inventory(cycle time) in our analysis. We analyzed two extreme cases of the tradeoff.
To minimize changeovers, it is possible to dedicate a portion of the machines (more thanhalf of the 30 machines, based on a detailed analysis with demand in the first 9 months ofFY 2006) to some high demand hub types. For the first 9 months of FY 2006, somededicated machines require no changeovers, and most other machines require only two orthree changeovers. Appendix A shows the detailed hub type assignment of every machinein the 9 months. The average number of changeovers in a month is about 10 times.
32
However, the production rate of each hub type is low when machines are dedicated. Wecan use the simple equations discussed in this section to estimate how early hubproduction should start. For example, 4 LL machines are set up to produce hub type 18Gin Oct. Production rate of 18G hubs is 4* 14k/shift=64k/shift. Using the equations, wefind production of 18G hubs has to start at least 30 shifts (10 days) earlier than assembly.If we do the same calculation for every hub type in the 9 months, we find the requiredearly start time is about I to 2 weeks for LL hubs and 2 to 3 weeks for LS hubs.
To minimize inventory of hubs, we can produce the hubs at their maximum productionrates. We can use the same method in the previous paragraph to estimate early start timeof hub production in this case. A quick estimate shows that for FY 2006, hub molding, atits maximum rate, only needs to be started about 5 shifts earlier than its assembly onaverage (about 9 shifts for LS and 3 shifts for LL). The resulting cycle time and inventorylevel would be much smaller compared to the previous case. However, about 90changeovers are required every month, which would be much more than what theproduction floor can handle.
4.2.3 Variability of Production Rate
A very important issue is the variability of the machines. The simple starvation equationsdo not consider variability. When variation of molding and assembly are considered, theminimum inventory level has to be adjusted to compensate for it. Any disruption to themolding production, like machine breakdown, could increase the minimum inventoryrequirement.
To consider variability, we might use a few models to calculate the minimum inventoryrequirement. An inventory model, like periodic or continuous model, could be considered.The variability of molding could be modeled as variability in supply, like lead timevariability, and variability of assembly could be modeled as variability in demand. Wecan also approximate the molding machines as one single machine and use a TwoMachines with One Finite Buffer model to obtain an approximate solution. Variation ofmachines, like MTTR and MTTF, are considered in the model. The exact relationshipbetween buffer size and overall production rate could be solved, if Markov processes areassumed.
In section 2.4.2, we have discussed the inaccuracy and unavailability of the machinevariability measures in the current system. Based on the description by the machineoperators, both molding machines and assembly machines are generally reliable. A one-shift-long Preventive Maintenance is carried out weekly. Machine problems could almostalways be solved within one shift's time.
As a result, we use the average production rate of machines, which is an average of theactual production rate in the last 9 months, in our calculation. Machine variations, likeMTTF and MTTR, are not considered in our analysis. They could be considered in futurework.
33

4.3 Current Practice
As discussed in 2.4.1, production plans for hub molding machines are generated monthly.Hub molding starts about 1 month to 1 week earlier than assembly on average. Theproduction quantity is entirely based on forecast. Because the forecast is generallyaccurate, this seldom gives problems. The production rate of each hub type is generallyabout 50% or more of its maximum rate. Hubs produced in the first half of a month areusually assembled in the same month, and those produced in the second half of the monthare usually assembled sometime in the following month.
The current inventory level for hubs is quite high. For LL hubs, the average level in Juneis about 50% of its average monthly demand in FY 2006. The peak level is about thesame as its average monthly demand. For LS hubs, the average inventory level is about150% of its average monthly demand. The peak can be as high as twice of its averagemonthly demand. The net amount LL and LS hubs are about the same, as their demand isdifferent.
There might be three reasons for the relative inventory level (inventory/demand) of theLS hubs being higher than that of the LL hubs. Firstly, LL molding is faster than LSmolding. They don't have to be started as early as LS molding. Secondly, LL moldingdoesn't have the compatibility issue (see 4.1). It is much easier to plan the LL machines.Lastly, demand of the LL hubs is more than twice that of the LS hubs. The plannerusually focuses on reducing the relative inventory level of the LL hubs in order to reducethe net inventory.
4.4 A Proposed Solution
We have already discussed that hub'production of each type has to start earlier than itsassembly to prevent starvation. Starvation is usually not acceptable, because productionmight not be able to meet demand if it happens. However, early start of hub productionunavoidably increases cycle time and hub inventory. In our proposed solution, we aretrying to reduce early start of hub production. If it is reduced, both the cycle time andWIP level could be reduced.
One important point to note is that the early start is for each hub type. We must also keepin mind that the overall molding production rate is still higher than that of the assembly.As a result, if the constraint of production batch size at assembly stage (see 4.2.2) couldbe taken care of, the molding process as a whole does not have to start much earlier thanassembly.
Meanwhile, we also need to keep the monthly changeover of molding machines at anacceptable level. It should not be more frequent than that from the current practice.
The current practice takes about 10 days to generate the monthly production plan. Wealso try to propose a simple solution, so that planning could be more efficient.
34

Finally, we must make sure that production could meet demand with our proposedsolution. The monthly demand must be produced within a 30 day lead time inside theclean room.
4.4.1 Create Three Groups of Molding Machines
The first step of our solution is to group the molding machines into three groups. Thereason to create groups is to make scheduling easier. After grouping, we can let the threegroups run simultaneously and feed the assembly machine one at a time. It is a simpleand clear structure to take advantage of the fact that overall molding capacity is biggerthan assembly capacity. Each hub type is only produced from one group, so that a bigscheduling problem becomes three smaller problems with less complexity. Thescheduling is simplified.
The three groups are one LS group and two LL groups, with each group having 10machines.
The LS and LL machines are in different groups, which is the current practice. Becausethe demand and production of LL and LS hubs are not related, we can consider differentstrategies for LL and LS hub production. The motivation to do so is that the scheduling ofLS machines is more complicated than that of LL machines, due to the compatibilityissue (see 4.1). We have more flexibility with scheduling LL machines.
To split the 20 LL machines into two groups is to simplify the problem. Table 5 showsthe details of the two groups. Hub types are allocated to the two groups in such a way thatdemand is split evenly. The total monthly demand of final products is divided almostequally to the two groups. Furthermore, demand of the two major product types, Comboand LL-PN, is also divided almost equally to the two groups.
Ratio of Ratio of Ratio ofGuage Inserts SKU Total Combo LL-PN
. LDemand Products Products18G 10 PSNI18xI1 1/2
PSN 25 x 1PSN 25 x 1 1/2
25G 10 1 ml 25 x 5/8 Combo 47% 45% 53%3 ml 25 x 5/8 Combo3 ml 25 x 1 Combo
27G 5 1 ml 27 x 1/2 Combo30G 6 1 ml 30 x 1/2 Combo
PSN 21 x 1 TW
21G 10 PSN 21 x 1 1/2 TW3 ml 21 x 1 TW Combo3 ml 21 x 1 1/2 TW ComboPSN 22 x 1PSN 22 x 1 1/2
LL2 22G 7 3 ml 22 x 1 Combo 53% 55% 47%3 ml 22 x 1 1/2 ComboBulk Needle 22 x 1 TW (ABG)
_ Bulk Needle 22 x 1 1/2PSN 23 x 1
23G 10 3 ml 23 x 1 Combo_ _ Bulk Needle 23 x 1 MTW (ABG)
Table 5 Two Groups of the LL Molding Machines
35

Because there are only 10 machines in each subgroup, the maximum possible productionrate of each hub type would be the rate of running 10 machines in parallel. As a result,the hub types with 12 inserts could only run at a maximum of 10 inserts in parallel. Thisis a drawback of our grouping scheme.
Next, we discuss the strategy we use for each group.
4.4.2 Strategy for the LS Group
For LS machines, we suggest the machine dedication approach discussed in section 4.2.2.4 out of the 10 machines could be dedicated to 3 hub types in FY 2006. No changeover isrequired for the entire year. For the other machines, they produce different hub typesfrom month to month according to demand. Most of them only need one changeover permonth. Our calculation (based on the simple equations in 4.2.2) shows that with thisapproach, LS hub production needs to start about 2 to 3 weeks earlier than assembly.
There are several reasons to use the machine dedication approach.
Firstly, demand of the LS hubs is much lower than that of the LL hubs. If we start itsproduction about 2 to 3 weeks earlier than assembly, average inventory level of the LShubs would be approximately equals to its average monthly demand, which is acceptableand similar to the current WIP level. The same approach would not be acceptable for theLL hubs, because its monthly demand is much higher.
Secondly, the LS machines are constrained by the compatibility issue, which makes itvery difficult to schedule. Tremendous efforts spent on optimizing the LS machineschedules might not be rewarded by great savings on cycle time and WIP. In thededication approach, because most machines only produce one hub type every month, itis very easy to schedule the machines.
Thirdly, we have an accurate forecast to allow us to produce LS hubs 2 to 3 weeks inadvance. In fact, current practice is also based on this forecast.
The difference between our approach and the current practice is the emphasis on machinededication. The emphasis could reduce the complexity of planning and minimize thenumber of changeovers. The inventory level and cycle time for the LS hubs are expectedto remain the same with our approach.
4.4.3 Strategy for the Two LL Groups
The basic strategy for the LL groups is to shorten their early start time as much aspossible to reduce cycle time and inventory. How short the early start time could bedepends on if it would result in starvation and if the starvation would lead to unmetmonthly demand.
In 4.4.2, we talked about the strategy for the LS group. Following our strategy, the LShubs are always in stock when their assembly starts. We can take advantage of thisproperty when exploring the strategy for LL machines. As the LS hubs are always ready,
36

we use the LS hubs to feed the assembly machine at the start of the month, so that the twoLL groups can afford more time to build up inventory.
In the following sections, we discuss the early start time for the two LL groups in detail.
4.4.4 Details of the Proposed Solution
Although we present this as a solution for the hub molding machines, it incorporatesscheduling policies for the entire production line. There are two reasons to do so.
Firstly, to reduce cycle time and WIP, it is optimal for the assembly machine to be fed bythe three hub molding groups in a cyclic fashion. A scheduling policy for the assemblymachine is then required.
Secondly, we need to simulate the entire line to evaluate our scheduling policy againstperformance measures like the total cycle time, WIP level, and if production meetsdemand. The policies for the whole line are required in our simulation.
The basics of the proposed solution follow the overall solution discussed in 3.2. Theplanning and production cycle follows the overall solution. In detail, the assemblymachine starts production on the beginning of a production cycle (16th of a month). Wehave shown that monthly demand could be met if assembly starts on that day.' The LShub molding group starts about 2-3 weeks earlier than assembly based on the forecast.The LL hub molding groups start only a few, or even zero, shifts earlier than assembly(details will be discussed later). Figure 7 shows the proposed solution graphically. Wewill talk about scheduling policies for assembly and molding machines in detail in thenext section.
Production Based onForecast. Ship in May.
'7
Production Based on Firm/Order. Ship in May.
Possible Idle Time. -
1St Apr
Time
,LS Hub Molding
aI
LL Hub Molding
Assembly
Packaging
1st May
Production Based onForecast. Ship in Jun.
Possible Idle Time.
Production Based on FirmOrder. Ship in May.
1 St J un
Order Frozen Window (Firm Order) I
1St Jul
Demand Forecast
16th Apr to 151 May: Exercise Plans
15th Apr: Release Plans for 16t Apr to 15th May
Figure 7 The Proposed Production Cycle for Hub Molding
Details are presented in the second thesis of the project.
37
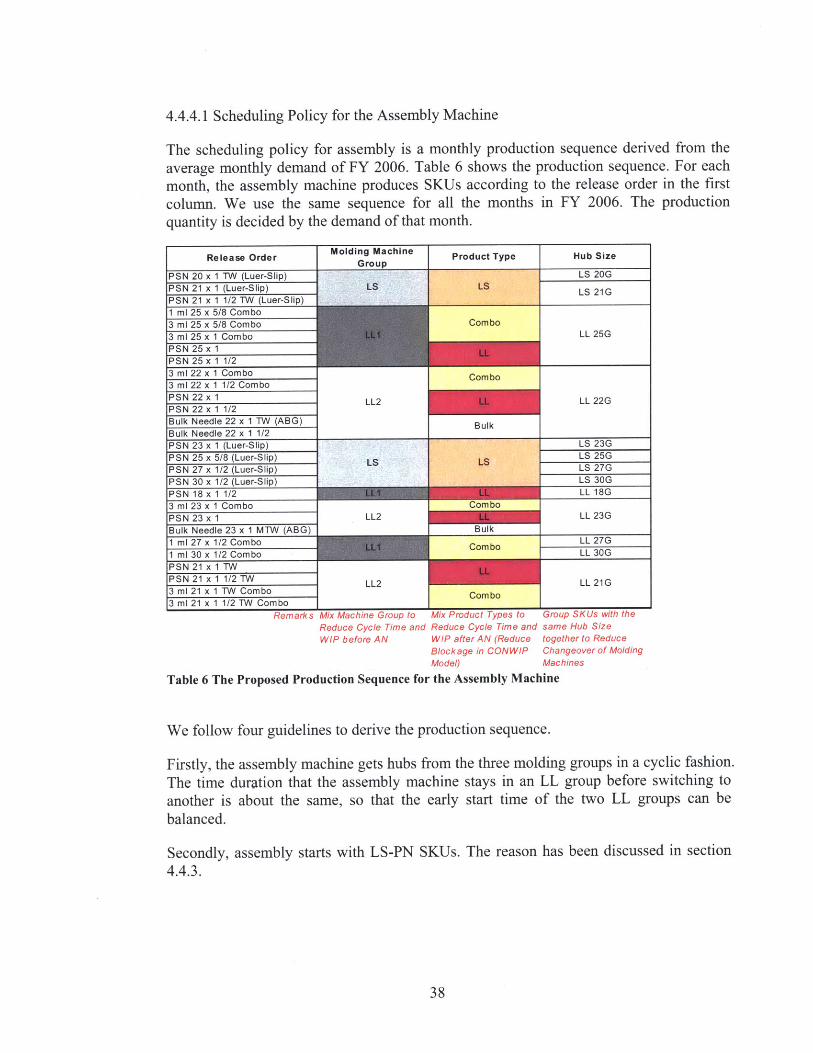
4.4.4.1 Scheduling Policy for the Assembly Machine
The scheduling policy for assembly is a monthly production sequence derived from theaverage monthly demand of FY 2006. Table 6 shows the production sequence. For eachmonth, the assembly machine produces SKUs according to the release order in the firstcolumn. We use the same sequence for all the months in FY 2006. The productionquantity is decided by the demand of that month.
Release Order
PSN 20 x 1 TW (Luer-Slip)PSN 21 x 1 (Luer-Slip)PSN 21 x 1 1/2 TW (Luer-Slip)1 ml 25 x 5/8 Combo3 ml 25 x 5/8 Combo3 ml 25 x 1 ComboPSN 25 x 1PSN 25 x 1 1/23 ml 22 x 1 Combo3 ml 22 x 1 1/2 ComboPSN 22 x 1PSN 22 x 1 1/2Bulk Needle 22 x 1 TW (ABG)Bulk Needle 22 x 1 1/2
Product TMolding Machine
LS 20G
LS 21G
LL 25G
Combo
LL 22GLL2
Bulk
PSN 23 x 1 (Luer-Slip) LS 23GPSN 25 x 5/8 (Luer-Slip) LS LS LS 25GPSN 27 x 1/2 (Luer-Slip) LS 27G
PSN 30 x 1/2 (Luer-Slip) LS 30G-SN 8 x 1/2LL 18G
3 ml 23 x 1Combo Comb
PS N 23 x 1 LL2 LL 23G
Bulk Needle 23 x 1 MTW (ABG) Bulk
1 ml 27 x 1/2 Combo Combo LL 27G
PSN 21 x 1 1/2 TW LL2 LL 21G3 ml 21 x 1 TW Combo Com bo3 ml 21 x 1 1/2 TW Combo
Remark s Mix Machine Group to Mix Product Types to GroReduce Cycle Time and Reduce Cycle Time and samWIP before AN WIP after AN (Reduce toge
Blockage in CONWIP ChaModel) Mac
Table 6 The Proposed Production Sequence for the Assembly Machine
up onKus with thee Hub Sizether to Reducengeover of Moldinghines
We follow four guidelines to derive the production sequence.
Firstly, the assembly machine gets hubs from the three molding groups in a cyclic fashion.The time duration that the assembly machine stays in an LL group before switching toanother is about the same, so that the early start time of the two LL groups can bebalanced.
Secondly, assembly starts with LS-PN SKUs. The reason has been discussed in section4.4.3.
38
. ... . .............. .. . .......................
Hub Size

Thirdly, the four major product types, LS-PN, LL-PN, COMBO, and BULK, are mixed
in the release order. The reason to do so is to improve cycle time and WIP level in
downstream machines.2
Lastly, the release order allows each molding group to produce a hub type only once in a
month. Details will be discussed in the next section.
4.4.4.2 Scheduling Policy for Hub Molding Machines
4.4.4.2.1 The LS Group
As we discussed earlier in 4.4.2, LS hub molding starts about 2 to 3 weeks earlier than
assembly machine. LS Hubs are all in stock when the assembly machine starts production.
All SKUs are produced concurrently from dedicated machines. We created a spreadsheet
to help in making machine allocation decisions. After the input of an allocation plan and
demand data, the spreadsheet displays graphically if a month's demand could be met with
the allocation plan. If not, rearrangement can be made and tested. A screenshot of the
spreadsheet is shown in Figure 8.
LS MoldsLS1 LS2 LS3 LS4 LS5 LS6 LS7 LS8 LS9 LS10
Dedication yes no yes yes no no no no no yes
20 00%N 21 100% 100%
23 100%25 100% 100% 100% . 100%
S27 100%
Allocation
Demand After Yield Utilization Legend
20 486 497.44115 81% Input Cells4 21 705.6 722.21085' 23 235.2 240.73695 Output
25 1882.8 1927.1238 Good
27 117.6 120.36847 High Utilization30 0 0 Rearrange
Figure 8 A Screenshot of the LS Hub Molding Planning Tool
To use the spreadsheet, we first input monthly demand data of LS products into the
demand input cells located on the left bottom corner of the spreadsheet. We then adjust
the capacity allocation of the non-dedicated machines in the yellow input cells below
each machine. (The machines with grey cells are dedicated to a hub type.) For example, if
machine LS2 is planned to produce the hub type 21 G for half a month and 27G for the
other half, we put 50% in the yellow cell for 21G under LS2 and 50% in the yellow cell
for 27G under LS2. After allocating machine capacity to the gauge sizes, the spreadsheet
calculates utilization for the gauge sizes using the following equation.
2 Details of assembly and downstream machines are discussed in the first and second theses of the project.
39

DemandUtilization =
Allocated Machine Capacity
Equation 3 Calculation of Utilization in the Spreadsheet for the LS Hub Molding Machines
For example, if demand of 20G is 486k and one machine is allocated to it, the totalallocated capacity is IOk/shift*60shift=600k (the normal operation time for the hubmolding machines in a month is 60 shifts), the utilization is 486k/600k=81%. Ifutilization is higher than 100%, we need to allocate more capacity to the gauge size. Itcan be done by borrowing capacity from gauge sizes with low utilization. For example, if20G has capacity more than 100% and 25G has extra capacity, we can make LS6, LS7, orLS9 give some capacity to 20G.
4.4.4.2.2 The LL Groups
For the two groups of LL machines, each group will produce a type hub at its maximumrate and will start only a few shifts before assembly. Their production schedules areclosely related to the schedule of the assembly machine. Based on the schedule forassembly discussed in 4.4.4.1, the two groups produce according to the sequence in Table7.
LL1 Production Sequence 25G 18G 27G 30G
LL2 Production Sequence 22G 23G 21GTable 7 The Proposed Production Sequences for the Two LL Hub Molding Groups
The remaining question now is how much earlier the LL groups should start productionwith the production sequences above. As we discussed in 4.4.3, we desire to meetdemand as well as to minimize the early start to keep the cycle time small. A simulationmodel discussed in section 4.5 helps us to determine if monthly demand could be metwith a given early start time.
4.5 Simulation
We simulated the proposed solution using SIMUL8 10.0 package. SIMUL8 is a powerfulanalytic tool for Discrete Event Simulation, which allows visual models to be easilycreated by drawing objects and results to be displayed interactively on the screen. Themodel is shown in Figure 9.
40
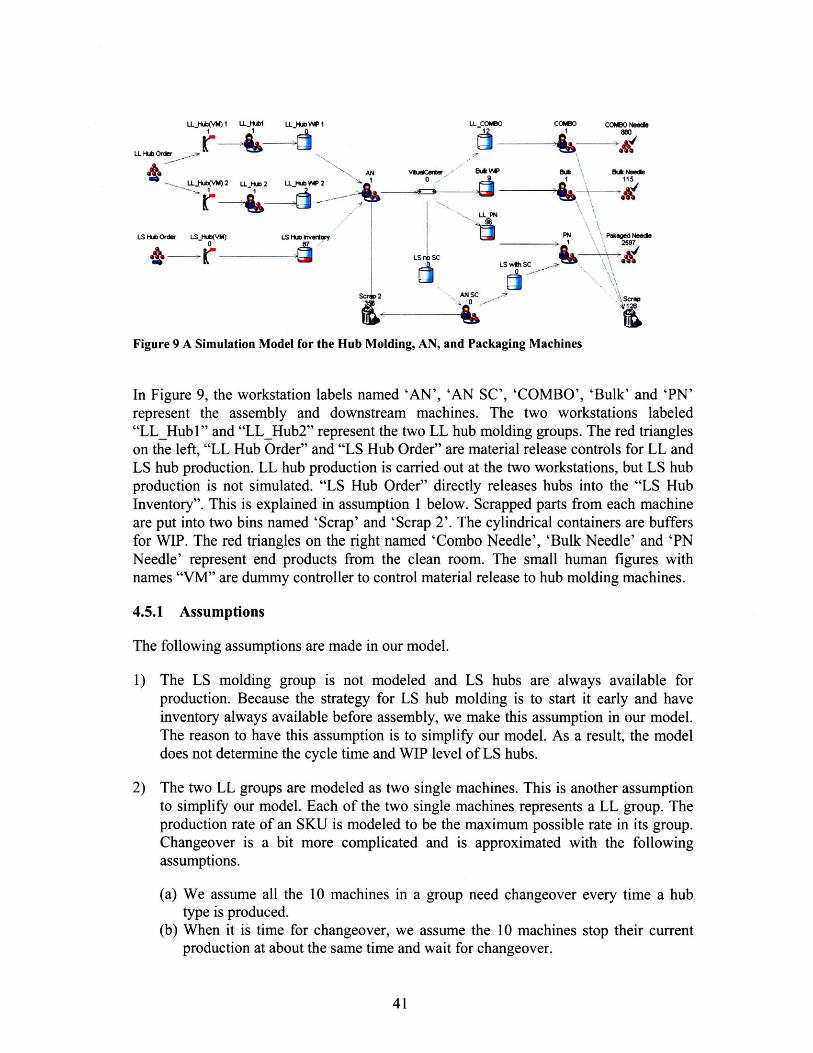
LL Hub 0"
IS Hub0
ILjUHt(M) I ILj"Z1 LIk %W~ I LL-COMBO COMBO COMBO Needl
U -PN
rder LSKj(WM IS Hub Invera" IN jaae Pei0 87 M7
r~lS LS w~hSC
Sc~2 AN SC" IFigure 9 A Simulation Model for the Hub Molding, AN, and Packaging Machines
In Figure 9, the workstation labels named 'AN', 'AN SC', 'COMBO', 'Bulk' and 'PN'represent the assembly and downstream machines. The two workstations labeled"LL Hub " and "LL Hub2" represent the two LL hub molding groups. The red triangleson the left, "LL Hub Order" and "LS Hub Order" are material release controls for LL andLS hub production. LL hub production is carried out at the two workstations, but LS hubproduction is not simulated. "LS Hub Order" directly releases hubs into the "LS HubInventory". This is explained in assumption 1 below. Scrapped parts from each machineare put into two bins named 'Scrap' and 'Scrap 2'. The cylindrical containers are buffersfor WIP. The red triangles on the right named 'Combo Needle', 'Bulk Needle' and 'PNNeedle' represent end products from the clean room. The small human figures withnames "VM" are dummy controller to control material release to hub molding machines.
4.5.1 Assumptions
The following assumptions are made in our model.
1) The LS molding group is not modeled and LS hubs are always available forproduction. Because the strategy for LS hub molding is to start it early and haveinventory always available before assembly, we make this assumption in our model.The reason to have this assumption is to simplify our model. As a result, the modeldoes not determine the cycle time and WIP level of LS hubs.
2) The two LL groups are modeled as two single machines. This is another assumptionto simplify our model. Each of the two single machines represents a LL group. Theproduction rate of an SKU is modeled to be the maximum possible rate in its group.Changeover is a bit more complicated and is approximated with the followingassumptions.
(a) We assume all the 10 machines in a group need changeover every time a hubtype is produced.
(b) When it is time for changeover, we assume the 10 machines stop their currentproduction at about the same time and wait for changeover.
41
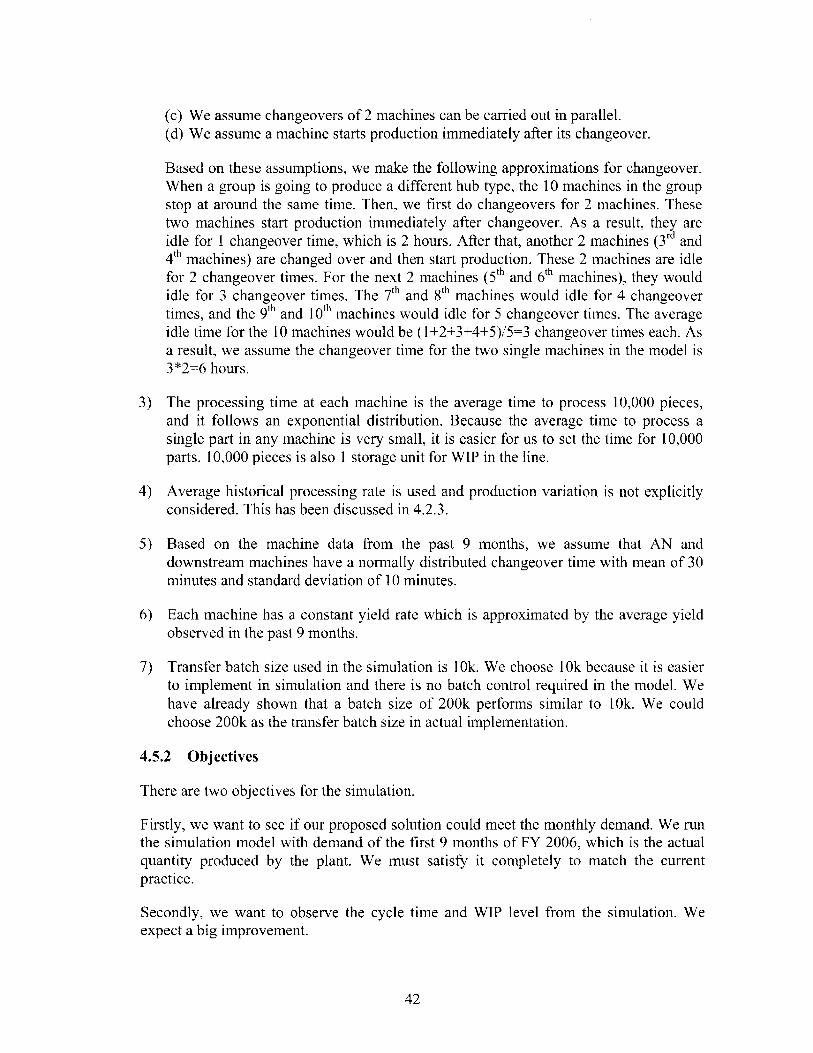
(c) We assume changeovers of 2 machines can be carried out in parallel.(d) We assume a machine starts production immediately after its changeover.
Based on these assumptions, we make the following approximations for changeover.When a group is going to produce a different hub type, the 10 machines in the groupstop at around the same time. Then, we first do changeovers for 2 machines. Thesetwo machines start production immediately after changeover. As a result, they areidle for 1 changeover time, which is 2 hours. After that, another 2 machines (3rd and41h machines) are changed over and then start production. These 2 machines are idlefor 2 changeover times. For the next 2 machines (5 th and 6th machines), they wouldidle for 3 changeover times. The 7th and 8th machines would idle for 4 changeovertimes, and the 9th and 1 0th machines would idle for 5 changeover times. The averageidle time for the 10 machines would be (I+2+3+4+5)/5=3 changeover times each. Asa result, we assume the changeover time for the two single machines in the model is3*2=6 hours.
3) The processing time at each machine is the average time to process 10,000 pieces,and it follows an exponential distribution. Because the average time to process asingle part in any machine is very small, it is easier for us to set the time for 10,000parts. 10,000 pieces is also I storage unit for WIP in the line.
4) Average historical processing rate is used and production variation is not explicitlyconsidered. This has been discussed in 4.2.3.
5) Based on the machine data from the past 9 months, we assume that AN anddownstream machines have a normally distributed changeover time with mean of 30minutes and standard deviation of 10 minutes.
6) Each machine has a constant yield rate which is approximated by the average yieldobserved in the past 9 months.
7) Transfer batch size used in the simulation is 10k. We choose 10k because it is easierto implement in simulation and there is no batch control required in the model. Wehave already shown that a batch size of 200k performs similar to 10k. We couldchoose 200k as the transfer batch size in actual implementation.
4.5.2 Objectives
There are two objectives for the simulation.
Firstly, we want to see if our proposed solution could meet the monthly demand. We runthe simulation model with demand of the first 9 months of FY 2006, which is the actualquantity produced by the plant. We must satisfy it completely to match the currentpractice.
Secondly, we want to observe the cycle time and WIP level from the simulation. Weexpect a big improvement.
42

4.5.3 Simulation and Results
We simulate one month at a time. We start each month with an empty shop floor. Thereason to have an empty floor is related to our proposed solution. In section 3.2, we havediscussed that the proposed solution produces next month's demand starting from a 30-day production cycle on the 16 th of the current month. If demand can be satisfied,production should finish by the end of the 30-day production cycle, and there should beno jobs left inside clean room. As a result, the simulation of our proposed solution startswith an empty floor.
In the simulation, we store the monthly production quantity and sequence for hubs in thematerial release controls, "LL Hub Order" and "LS Hub Order". The material releasecontrols release jobs to the downstream workstation or inventory buffer when thesimulation starts. The LL hub workstations, "LL Hubl" and "LLHub2", produceaccording to the production quantity and sequence released from "LL Hub Order". The"LS Hub Inventory" stores parts released from "LS Hub Order". When the simulationstarts, the "AN" machine starts production immediately according to the proposedschedule. If a hub type is not available for production, the AN machine starves. Themachines after the "AN" machine start production when their upstream buffers are notempty. Their production is based on FIFO.
Three scenarios are simulated.
Scenario 1: LL hub molding starts at the same time as the assembly machine
In this scenario, the two LL groups start on 16t of a month, which is the beginning of aproduction cycle. Results of this scenario are shown in Table 8. We can see that it takesmore than 30 days to satisfy monthly demand in two out of the 9 months. The twomonths are February and May, highlighted in orange in the table. This happens becausedemand of the two months is high and starvation of the assembly machine reduces itsutilization. To reduce starvation, we let the molding machines starts a few shifts earlierthan the assembly machine. The next scenario shows a scenario in which demand couldbe met.
LL Hub Molding Starts at the Same Time as AssemblyOct Nov Dec Jan Feb Mar Apr May Jun
COMBO 3.2 5.9 7.1 8.3 5.7 4.7 6.1 5.5 8.6
Cycle Time (days) BULK 7.0 0.3 3.7 6.1 5.6 4.7 - 1.7 13.6LL-PN 4.2 0.9 4.7 4.2 11.3 5.3 5.8 7.0 5.8LS-PN 3.4 5.7 6.6 5.2 9.51 9.91 11.3 8.11 14.5
Demand Complete Days 1 21[ 23[ 30[ 24 .I 231 301 1 29
LL Hub Inventory Average 1,284 752 2,144 1,826 2,743 1,101 2,182 2,072 2,448(000's) Max 3,840 1,810 3,440 3,740 5,840 3,320 4,540 3,830 4,580
LS Hub Inventory Average 38 164 341 284 785 878 877 667 1,496(000's) Max 140 410 1,400 2,630 4,930 3,400_ 2,210 2,960 3,110
Needle inventory Average 213 289 673, 819 2,249 855 818 1,615 796(000's) Max 840 1,050 1,160 1,470 3,560 2,200 1,4701 2,870 1,760
Table 8 Simulation Results for LL Hub Molding Starts at the Same Time as Assembly
43
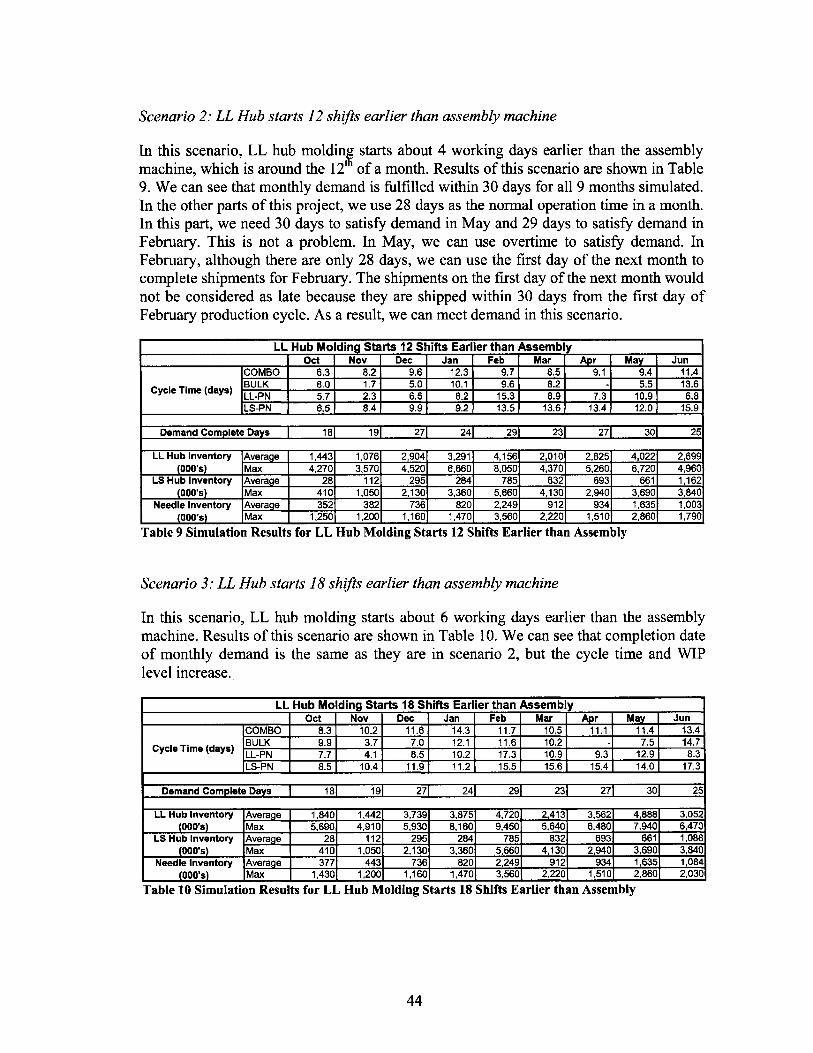
Scenario 2: LL Hub starts 12 shifts earlier than assembly machine
In this scenario, LL hub molding starts about 4 working days earlier than the assemblymachine, which is around the 12" of a month. Results of this scenario are shown in Table9. We can see that monthly demand is fulfilled within 30 days for all 9 months simulated.In the other parts of this project, we use 28 days as the normal operation time in a month.In this part, we need 30 days to satisfy demand in May and 29 days to satisfy demand inFebruary. This is not a problem. In May, we can use overtime to satisfy demand. InFebruary, although there are only 28 days, we can use the first day of the next month tocomplete shipments for February. The shipments on the first day of the next month wouldnot be considered as late because they are shipped within 30 days from the first day ofFebruary production cycle. As a result, we can meet demand in this scenario.
LL Hub Molding Starts 12 Shifts Earlier than AssemblyOct Nov Dec Jan Feb Mar r May Jun
COMBO 6.3 8.2 9.6 12.3 9.7 8.5 9.1 9.4 11.4BULK 8.0 1.7 5.0 10.1 9.6 8.2 - 5.5 13.6
Cycle Time (days) LL-PN 5.7 2.3 6.5 8.2 15.3 8.9 7.3 10.9 6.8tLS-PN 6.5 8.4 9.9 9.2 13.5 13.6 13.4 12.0 15.9
Demand Complete Days 181 19( 271 241 291 231 271 301 25
LL Hub Inventory Average 1,443 1,076 2,904 3,291 4,156 2,010 2,825 4,022 2,699(000's) Max 4,270 3,570 4,520 6,660 8,050 4,370 5,260 6,720 4,960
LS Hub Inventory Average 28 112 295 284 785 832 693 661 1,162(000's) Max 410 1,050 2,130 3,360 5,660 4,130 2,940 3,690 3,840
Needle Inventory Average 352 382 736 820 2,249 912 934 1,635 1,003(000's) Max 1,250 1,200 1,160 1,470 3,560 2,220 1,510 2,860 1,790
Table 9 Simulation Results for LL Hub Molding Starts 12 Shifts Earlier than Assembly
Scenario 3: LL Hub starts 18 shifts earlier than assembly machine
In this scenario, LL hub molding starts about 6 working days earlier than the assemblymachine. Results of this scenario are shown in Table 10. We can see that completion dateof monthly demand is the same as they are in scenario 2, but the cycle time and WIPlevel increase.
LL Hub Molding Starts 18 Shifts Earlier than AssemblyOct Nov Dec Jan Feb Mar r May Jun
COMBO 8.3 10.2 11.6 14.3 11.7 10.5 11.1 11.4 13.4BULK 9.9 3.7 7.0 12.1 11.6 10.2 - 7.5 14.7
CycleTime(days) LL-PN 7.7 4.1 8.5 10.2 17.3 10.9 9.3 12.9 8.3LS-PN 8.5j 10.4 11.9 11.2 15.5 15.6 15.4 14.0 17.3
Demand Complete Days 1 181 191 271 241 291 231 271 301 25
LL Hub Inventory Average 1,840 1,442 3,739 3,875 4,720 2,413 3,562 4,888 3,052(000's) Max 5,690 4,910 5,930 8,160 9,450 5,640 6,480 7,940 6,470
LS Hub Inventory Average 28 112 295 284 785 832 693 661 1,086(000's) Max 410 1,050 2,130 3,360 5,660 4,130 2,940 3,690 3,840
Needle Inventory Average 377 443 736 820 2,249 912 934 1,635 1,084(000's) Max 1,430 1,200 1,160 1,470 3,560 2,220 1,510 2,860 2,030
Table 10 Simulation Results for LL Hub Molding Starts 18 Shifts Earlier than Assembly
44

4.5.4 Discussion of the Simulation Results
4.5.4.1 Meet Demand
From the simulation results, we see that our proposed solution could meet demand. In thesecond scenario, monthly demand could be satisfied within 30 days of production. As aresult, all the produced products would have at least 15 days to go through processes afterthe clean room, which guarantees on time shipment.
By comparing the three scenarios, we find that the early start time of LL hub moldingcould affect production rate by starving the assembly machine. When demand is high,starvation could result in unmet demand or late deliveries (February and May in scenario1). However, when the early start time is big enough, starvation of the assembly machineis avoided; increasing the early start time further need not shorten the productioncompletion date. This happens in scenario 2 and 3. Further increasing the early start timefrom scenario 2 only increases the cycle time and WIP.
Demand Completion Days
35
33
31
29
27 --+-0 Shifts
Z 25 - -.- 12 Shifts
18 Shifts
21
19 FPlease Note:F1 Demand could NOT be met in Feb
17 and May in the case of 0 Shifts.
15 ___
Oct Nov Dec Jan Feb Mar Apr May Jun
Figure 10 Comparison of the Demand Completion Days in the 3 Simulation Scenarios
4.5.4.2 Reduce Cycle Time and WIP
It is obvious that the earlier LL hub molding starts, the longer is the cycle time and WIP.Results of the three simulation scenarios show the difference (see Figure 11 and Figure12). The cycle time shown below is the time between when a product enters the system(enters the LL molding stage) and when it leaves the system (leaves the packaging stage).
45

Average Cycle Time
16.00
14.00
12.00 .
1i.00
-.- 0 Shifts( k 1 Shifts
418 Shifts
Please Note:Demand could NOT be met in Feb
2.00 2.00 and May in the case of 0 Shifts.
0.00Oct Nov Dec Jan Feb Mar Apr May Jun
Figure 11 Comparison of the Average Cycle Time in the 3 Simulation Scenarios
Total Average WIP
9,000
8,000 -
7,000
6,000
5, OW --*-0 Shifts-.- 12 Shifts
4,000 18 Shifs
3,000
2,000 Please Note:Demand could NOT be met in Feb
1,000 and May in the case of 0 Shifts.
0Oct Nov Dec Jan Feb Mar Apr May Jun
Figure 12 Comparison of the Total Average WIP in the 3 Simulation Scenarios
We are also interested in comparing the simulation results with the current practice.There are a few comments required before we make this comparison.
First of all, there is no historical data of WIP level in the current practice. The only datawe have is from a daily monitoring of the WIP level during June 2007(see section 2.4.3).Because monthly demand was increasing in the past 9 months, it is not fair to comparethe actual WIP level in June with a 9 month average from the simulation. As a result, wecompare it with the simulation result for June only.
46

Secondly, we assume LS hubs are always available in our simulation. This is anassumption made based on our proposed solution (see 4.4.2). There is a small differencebetween simulation and the proposed solution. In simulation, we keep a required amountof LS hubs at the beginning and there is no replenishment of LS hubs throughout theproduction cycle. In the actual proposed solution, the same amount of hub inventorywould be stored at the beginning, and the LS hub molding machine would produce hubsfor the next month throughout the production cycle. As a result, the actual proposedsolution would introduce more WIP than the simulation predicts. We have alreadydiscussed the cycle time and WIP level of LS hubs of our proposed solution in section4.4.2. As a result, we would not compare cycle time and WIP of LS hubs in this section.
Thirdly, our simulation is on a monthly basis. When LL hub molding starts 12 or 18shifts earlier than assembly, they actually start from a previous production cycle (or amonth, as a production cycle is 30 days). As a result, it is more accurate to simulate formore than one production cycle continuously. But, because the early start time isrelatively short, 4 or 6 days, we did not use a multiple month simulation model. However,there are two things to note. Firstly, at the beginning of our one month simulation, thereis a warm-up period of 12 shifts (or 18 shifts) for the LL hub molding machines to build-up inventory of LL hubs. Secondly, in the actual case, the LL hub molding machineswould start producing hubs for the next month in the last 12 shifts (or 18 shifts) of thecurrent production cycle. We did not include that in our simulation. As a result, thesimulated WIP level of LL hubs in the last 12 shifts (or 18 shifts) is slightly lower thanthe actual case.
Lastly, although demand of February and May could not be met in the first scenario, wecan still compare the results of June in that scenario with actual data of June. The reasonis that the first scenario can meet demand in June. As a result, in the followingcomparisons, we include the first scenario.
Now, we compare WIP level of LL hubs between the current practice and the threescenarios. We can see a ~50% reduction of LL hubs with our proposed solution (seeFigure 13). The total reduction of WIP (excluding LS hubs) is even bigger, because of thehuge reduction of WIP in downstream stages (discussed in the other two theses of thisproject). A comparison of cycle time is shown in Figure 14, which also shows a greatimprovement. The results are not surprising because we have effectively reduced theearly start of production in our solution. Reduction of LL hub inventory level is achievedby reducing its early start time from about 3 weeks to 0-18 shifts. Reduction of cycle timeis achieved by the reduction of early start time for both LL hub molding and assembly.(Details of reduction cycle time and WIP in the assembly and downstream machines arediscussed in the first and the second theses.)
47

WIP Level: Simulation Results v.s Current Practice
Please Note:Demand could NOT be met inFeb and May in the case of 0Shifts.
AHrage Ma
LL Hub Inventory in Jun
Average Max
Total Inentory in Jun (excluding LS hubs)
Figure 13 WIP Size Comparison between the Current Practice and the Simulation Results
Average Cycle Time: Simulation v.s Current Practice
70
60
50
40-
30
20
10
0
Please Note:Demand could NOT be met in Feb andMay in the case of 0 Shifts.
E Current*0 Shifts
0 12 Shifts0 18 Shifts
Avrage Cycle Time
Figure 14 Average Cycle Time: the Current Practice vs. the Simulation Results (excluding LSProducts)
4.6 Conclusion
In this chapter, we presented a set of scheduling policies for the hub molding machinesand the assembly machine. The policies work based on the overall solution discussed in3.2. We have shown that the proposed solution could meet demand and also reduce cycletime and WIP. It could combine with the policies proposed in the other two theses of theproject to reduce total cycle time and WIP of the production line.
48
25000
20000
15000
.6S
10000
5000
0
E Current* 0 Shifts
0 12 Shifts0318 Shifts

The key in our solution is to start hub molding before assembly but not too far before. Inour solution, LL hub molding starts only 4 days (12 shifts) before assembly and LS hubmolding starts about 3 weeks before assembly. In the current practice, the average earlystart time is about 3 weeks or more, so our solution will reduce the cycle time and WIPlevel of LL hubs.
If we review the discussion of the root causes of the problem in 3.1, we can see that ourproposed solution for hubs actually shifts a push-pull boundary of the current system tothe very beginning of it. We minimize the early start of production at the same time.
The most critical aspect to minimize the early start is the set of production sequences forthe molding and assembly machines, which allow us to feed the assembly machine fromthe three groups of hub molding machines in a cyclic fashion. By simulation we showthat the same sequences work in all 9 months. This makes the planning procedure mucheasier. The only planning decision required each month is to adjust the productionquantity according to the confirmed orders.
4.6.1 Implementation
The production sequences are based on the demand data of the past 9 months. Becausesafety needles are still new products, demand fluctuation could be high and demand isexpected to grow rapidly. For actual implementation, although the overall solution couldremain the same, we need to do the same analysis with future demand forecast to see ifthe production sequences are still suitable. They may need to be adjusted when thecomposition of SKUs in total demand changes largely.
The key factor to prevent starvation and meet demand is to start LL hub productionearlier than assembly. We have already shown in the simulation model that demand couldbe met with LL hub production starts about 4 days earlier than assembly. In actualimplementation stage, we would want to start with a larger early start time, 6 days forexample, and reduce it to 4 days gradually.
4.6.2 Future Work
The current study does not consider production variability, like machine breakdowns, indetail. Machine variation can greatly affect the production rate sometimes. In future, wemight want to consider it in our model. A short discussion in section 4.2.3 might give ussome ideas of how to do it.
For the proposed solution in 4.4, there are still a few things that can be done.
Firstly, the same production sequence is proposed for all 9 months simulated. Thesequence is derived from the average monthly demand of each SKU in that period.However, composition of monthly demand might sometimes be very different from theaverage value. For those months, another sequence might be preferred. We might want todevelop a tool or a few guidelines to generate production sequences monthly.
49

Secondly, from the simulation results, we can see demand could be met with zero earlystart of LL hub molding in some months. In the other months, it could only be met withan early start of 12 shifts. As a result, we might want to adjust the early start timeaccording to monthly demand in future.
Lastly, LS molding starts about 3 weeks in advance. One main reason to do so is thecomplexity of scheduling the LS machines. As the company is working on solving thecompatibility issue with the LS machines, scheduling them would be less complicated infuture. As a result, there would be new opportunities to improve the scheduling of thesemachines in future.
50

REFERENCES
[I] Wein, L. M. 1990. Scheduling Networks of Queues: Heavy Traffic Analysis of aTwo-Station Network with Controllable Inputs. Opns. Res. 38, 1065-1078
[2] Hopp and Spearman, Factory Physics, 2nd edition, Irwin, 2000. (HS)
51

- Il LL2 LL3 LL4 LLS LL6 IL7 LL8 LL9 LL10 LL11 LL12 LL13 LL14 LL15 LL16 LL17 LL18 LL19 LL20 ChangeoversOct 18G 18G - - -17Oct-- 21G 21G 21G___Nov 30G G 23G 23G 27G 22G 22G 23G 5Dec 21/22G 25G 18G 25/27G 5
Jan 25G 21G 23G 7Feb 18G 18G 22G 22G 22G 18G 18G 23G 25G 25G 25G 27G 18G 18G 18G 4
Mar 18G 23G 23G 22/27G 18/30G_ 5Ar 21G 21G 21G 21G 23/27G 21G 21G 25G 5
Ma. 23G 23G 18G 18G _ 23G 23/27G 7Jun 25G 25G 25G 25G 25/30G 6
LS Hub Molding MachinesLS1 LS2 LS3 LS4 LS5 LS6 LS7 LS8 LS9 1510 Changeovers
Oct - - - - 5Nov - 30G 25G 23G 2Dec 27G 1Jan 2OG 21G 20G 2Feb 21G 25G 21G 20/30G 20/25G 121/23G 20G 4Mar 21G 25G 21/23G 7Apr 27G 30G 25G 26G 1Ma 20G 23G 1Jun 25G 1
'D
"t
0A
Remarks:
For the first month (Oct), assume every machine requires 1changeover to start production
Some machines are scheduled idle in some months. It is becausedemand could be met without running those machines in thosemonths. We can run the idle machines to increase productionrate of hubs, but we increases changeovers at the same time.
PEW
P~I4
"We
0
pod
0
-S
0
Un~tN) average: 6.78
average: 2.67