how we make a difference
TRANSCRIPT


How We Make a Difference
ETHICSSERVICESAFETYINNOVATIONTEAMWORK
18415 101st Ave NE, Bothell, WA 98011
425.806.6100www.ci.bothell.wa.us

Chris BothwellFinance Director
Maureen ScholsDeputy Finance Director
Linli MoatSenior Financial Analyst
Ted ReijonenSenior Financial Analyst
Gretchen ZundelSenior Financial Analyst
Ricky LeungSenior Financial Analyst
Luz MangaserGraphic Designer
Prepared by theFinance Team
For the Fiscal Year EndedDecember 31, 2020

Comprehensive Annual Financial ReportFor The Fiscal Year Ended December 31, 2020 City of Bothell
A. INTRODUCTORY SECTION
LETTER OF TRANSMITTAL ....................................................................................................................................................................I-VCERTIFICATE OF ACHIEVEMENT FOR EXCELLENCE IN FINANCIAL REPORTING ...............................................................................VICITY OF BOTHELL ORGANIZATIONAL CHART .....................................................................................................................................VIICITY OF BOTHELL ELECTED OFFICIALS...............................................................................................................................................VIII
B. FINANCIAL SECTION
INDEPENDENT AUDITOR’S REPORT ....................................................................................................................................................I-IVMANAGEMENT’S DISCUSSION AND ANALYSIS ................................................................................................................................ 1-12BASIC FINANCIAL STATEMENTS
GOVERNMENT-WIDE FINANCIAL STATEMENTS Statement of Net Position ...........................................................................................................................................................................1Statement of Activities .................................................................................................................................................................................2
GOVERNMENTAL FUND STATEMENTSBalance Sheet ..............................................................................................................................................................................................3Reconciliation of the Governmental Funds Balance Sheet to the Statement of Net Position.....................................................................4Statement of Revenues, Expenditures, and Changes in Fund Balances Governmental Funds ...................................................................5Reconciliation of the Statement of Revenues, Expenditures, and Changes in Fund Balances of Governmental Funds To the Statement of Activities ........................................................................................................................................................6
PROPRIETARY FUND STATEMENTSStatement of Net Position ...........................................................................................................................................................................7Statement of Revenues, Expenses, and Changes in Fund Net Position .....................................................................................................8Statement of Cash Flows .............................................................................................................................................................................9
FIDUCIARY FUND STATEMENTSStatement of Net Position .........................................................................................................................................................................10Statement of Changes in Fiduciary Net Position .......................................................................................................................................11
NOTES TO FINANCIAL STATEMENTS......................................................................................................................................................12-76

Comprehensive Annual Financial ReportFor The Fiscal Year Ended December 31, 2020 City of Bothell
REQUIRED SUPPLEMENTAL INFORMATION
SCHEDULES OF REVENUES, EXPENDITURES, AND CHANGES IN FUND BALANCES – BUDGET TO ACTUALGeneral Fund ...............................................................................................................................................................................................1Arterial Street Fund .....................................................................................................................................................................................2
SCHEDULE OF PROPORTIONATE SHARE OF THE NET PENSION LIABILITYPERS 1 .........................................................................................................................................................................................................3PERS 2/3 ......................................................................................................................................................................................................4PSERS 2 .......................................................................................................................................................................................................5LEOFF 1 .......................................................................................................................................................................................................6LEOFF 2 .......................................................................................................................................................................................................7
SCHEDULE OF EMPLOYER CONTRIBUTIONSPERS 1 .........................................................................................................................................................................................................8PERS 2/3 ......................................................................................................................................................................................................9PSERS 2 .....................................................................................................................................................................................................10LEOFF 1 .....................................................................................................................................................................................................11LEOFF 2 .....................................................................................................................................................................................................12Firefighters’ Pension Fund .........................................................................................................................................................................13
SCHEDULE OF CHANGES IN NET PENSION LIABILITYFirefighters’ Pension Fund .........................................................................................................................................................................14
SCHEDULE OF CHANGES IN TOTAL OPEB LIABILITY AND RELATED RATIOSSingle Employer OPEB Plan ......................................................................................................................................................................15
COMBINING FINANCIAL STATEMENTSNON-MAJOR FUNDS – OTHER GOVERNMENTAL FUNDS
Combining Balance Sheet ...........................................................................................................................................................................1Combining Statement of Revenues, Expenditures, and Changes in Fund Balances ..................................................................................2

Comprehensive Annual Financial ReportFor The Fiscal Year Ended December 31, 2020 City of Bothell
BUDGET TO ACTUAL COMPARISONS
SCHEDULES OF REVENUES, EXPENDITURES, AND CHANGES IN FUND BALANCES – BUDGET TO ACTUALStreet Fund ..................................................................................................................................................................................................3Park Cumulative Reserve Fund ....................................................................................................................................................................4Drug Forfeitures Fund .................................................................................................................................................................................5Fire Impact Fees Fund .................................................................................................................................................................................6Public Safety Levy Fund ...............................................................................................................................................................................7Cemetery Endowment Fund .......................................................................................................................................................................8General Obligation Public Safety Bond Fund .............................................................................................................................................9Lift GO Bond Redemption Fund ...............................................................................................................................................................102013 GO Bond Fund .................................................................................................................................................................................11Capital Improvements Fund ......................................................................................................................................................................12Public Safety Capital Fund .........................................................................................................................................................................13
INTERNAL SERVICE FUNDSCombining Statement of Net Position ......................................................................................................................................................14Combining Statement of Revenues, Expenses, and Changes in Fund Net Position .................................................................................15Combining Statement of Cash Flows ........................................................................................................................................................16
SUPPLEMENTAL INFORMATIONBUDGET TO ACTUAL COMPARISONS FOR THE OPERATING ACCOUNTS OF THE ENTERPRISE AND INTERNAL SERVICE FUNDS OF THE
PRIMARY GOVERNMENTSchedule of Operations – Water Fund ........................................................................................................................................................1Schedule of Operations – Sewer Fund ........................................................................................................................................................2Schedule of Operations – Storm & Surface Water Fund .............................................................................................................................3Schedule of Operations – Equipment Rental Fund .....................................................................................................................................4Schedule of Operations – Self Insurance Fund ............................................................................................................................................5Schedule of Operations – Asset Replacement Fund ...................................................................................................................................6
Comprehensive Annual Financial ReportFor The Fiscal Year Ended December 31, 2020 City of Bothell
SCHEDULESSchedule of Expenditures of Federal Awards .............................................................................................................................................7Schedule of State and Local Financial Assistance .......................................................................................................................................8General Obligation LIFT Bond 2014 ...........................................................................................................................................................9General Obligation Bonds 2013 B ............................................................................................................................................................10Utility Revenue Bonds 2014 .......................................................................................................................................................................11Public Works Trust Fund Loan PC12-951-022 ...........................................................................................................................................12Public Works Trust Fund Loan Horse Creek PC13-961-060 .......................................................................................................................13City Hall Lease Revenue Bonds .................................................................................................................................................................14Snohomish County Public Work Assistance Loan ......................................................................................................................................15General Obligation Public Safety Bonds ..................................................................................................................................................16
C. STATISTICAL SECTION
STATISTICAL SECTION TABLE OF CONTENTS
FINANCIAL TRENDSNet Position by Component ........................................................................................................................................................................1Change in Net Position ...............................................................................................................................................................................2Fund Balances of Governmental Funds .......................................................................................................................................................3Changes in Fund Balances of Governmental Funds ....................................................................................................................................4
REVENUE CAPACITYAssessed Value of Taxable Property ............................................................................................................................................................5Direct and Overlapping Property Tax Rates ................................................................................................................................................6Principal Property Tax Payers .......................................................................................................................................................................7Property Tax Levies and Collections ............................................................................................................................................................8Sales Tax Revenue by Category ...................................................................................................................................................................9Direct and Overlapping Sales Tax Rates ....................................................................................................................................................10

Comprehensive Annual Financial ReportFor The Fiscal Year Ended December 31, 2020 City of Bothell
DEBT CAPACITYRatios of Outstanding Debt by Type .........................................................................................................................................................11Ratios of General Bonded Debt Outstanding ...........................................................................................................................................12Computation of Direct and Overlapping Debt..........................................................................................................................................13Legal Debt Margin Information .................................................................................................................................................................14Pledged-Revenue Coverage - Water, Sewer, Storm & Surface Water Fund ..............................................................................................15Utility Revenue Bond Statistics - Water, Sewer, Storm & Surface Water Fund...........................................................................................16
DEMOGRAPHIC AND ECONOMIC INFORMATIONDemographic and Economic Statistics ......................................................................................................................................................17Principal Employers ...................................................................................................................................................................................18
OPERATING INFORMATIONFull-time Equivalent City Government Employees by Function/Program .................................................................................................19Operating Indicators by Function/Program ...............................................................................................................................................20Capital Asset Statistics by Function/Program ............................................................................................................................................21

INTRODUCTORY SECTION

Introductory Section City of Bothell
I
July 23, 2021
HONORABLE MAYOR, MEMBERS OF THE CITY COUNCIL, AND CITIZENS OF THE CITY OF BOTHELL:
It is my pleasure to present to you the Comprehensive Annual Financial Report (Annual Report) of the City of Bothell for the fiscal year ended December 31, 2020. This report is published annually as the official annual financial report, and complies with State law (RCW 43.09.230) requiring annual reports for Washington municipal governments to be certified and filed timely with the State Auditor’s Office.
The management of the City is responsible for both the accuracy of the data and the completeness and fairness of the presentation, including all related disclosures. The City operates under a system of accounting internal controls that are concerned with the safeguarding of assets and the reliability of financial records. The definition of accounting control assumes reasonable, but not absolute, assurance that the objectives expressed in it will be accomplished by the system. The concept of reasonable assurance recognizes that the cost of internal control should not exceed the benefits expected to be derived.
Cities and counties of the State of Washington use the Budgeting, Accounting and Reporting System (BARS) developed and prescribed by the Office of the State Auditor. State law provides for an annual independent audit to be conducted by the Office of the State Auditor. This report includes the auditor’s opinion with respect to the City’s financial statements.
The City is a recipient of more than $750,000 in federal assistance, and is therefore required to undergo an annual independent single audit in accordance with generally accepted auditing standards. The standards applicable to financial audits are contained in Government Auditing Standards, issued by the Comptroller General of the United States; and Title 2 U.S. Code of Federal Regulations Part 200, Uniform Administrative Requirements, Cost Principles, and Audit Requirements for Federal Awards (Uniform Guidance). The State Auditor’s Office conducted Bothell’s single audit in conjunction with the City’s annual independent audit. The City’s single audit for the fiscal year ended December 31, 2020 cited zero deficiencies in the design or operation of internal controls over major federal programs.
Generally Accepted Accounting Principles (GAAP) requires that management provide a narrative introduction, overview and analysis to accompany the basic financial statements in the form of Management’s Discussion and Analysis (MD&A). This letter of transmittal is designed to complement the MD&A and should be read in conjunction with it. The City of Bothell’s MD&A can be found immediately following the independent auditor’s report.

Introductory Section City of Bothell
II
Profile of the GovernmentOriginally populated by the Native American Sammamish people, the City of Bothell was incorporated in 1909, and for many years was a center for the logging industry, then a farming community, and then a bedroom suburb for people working in the greater Puget Sound area. Today, the municipality with a population of 48,400 straddles both King and Snohomish Counties, encompasses 14.38 square miles, and is ranked number 26 among the largest cities in the State of Washington.
The City of Bothell is a non-charter optional code city, operating under Section 35A of the Revised Code of Washington. It has a Council-City Manager form of government. The seven members of the City Council are elected by voters and serve four-year terms. The Council elects the Mayor and Deputy Mayor from within its ranks, and contracts with a professional City Manager to carry out their established goals, policies and directives. The City Manager appoints eight department heads and an Assistant City Manager.
At the end of 2020, the City of Bothell had 387.85 authorized full-time equivalent positions. Bothell’s full and part-time employees provide a full range of municipal services, including general government administration, police, fire, emergency medical services, planning and zoning, street maintenance and construction, and parks and recreation.
Bothell’s proprietary operations consist of water, sewer, and storm and surface water utilities. The City also operates three internal service funds – Equipment Rental (Fleet), Self-Insurance, and Asset Replacement. The City has one blended component unit, COB Properties, which accounts for the City Hall lease. Garbage service is provided by an independent contractor, while library services are provided by the King County Library System.
The City prepares a biennial budget based upon established Council goals, and in accordance with the Revised Code of Washington (RCW 35A.34). The budget also includes the first two years of the adopted seven-year Capital Facilities Plan (CFP). The City Council adopts Bothell’s biennial budget appropriation at the fund level prior to the first day of each odd-numbered calendar year. Reviews are conducted at the mid-biennium, and any changes for the second half of the biennium are adopted by City Council. In accordance with state law, budget status reports are provided to the Council and City management for each fiscal quarter. The adopted budget serves as a financial planning and policy document for use by the community, City Council and staff.

Introductory Section City of Bothell
III
Local EconomyBothell is an affluent community with a healthy economy and tax base. Bothell’s full value per capita ($253,200) is above the US median, and increased dramatically from 2015 to 2019. The median family income is a robust 157% of the US level (Moody’s Issuer Comment May 2021). Bothell is home to University of Washington-Bothell and Cascadia College, which share a common campus within Bothell’s historic downtown. In addition, the Northshore School District, the school district that serves Bothell, is consistently recognized among the state’s top school districts.
Bothell is home to three business parks; key industries within Bothell’s the business parks include biotech and biomedical firms, wireless communications, medical device manufacturing, medical research and a state-designated innovation partnership zone facilitated by University of Washington-Bothell, Cascadia College, and private sector businesses. Major firms include: AT&T (the largest communications holding company in the world based on revenue generation), Philips Medical Systems (a global leader in diagnostic imaging systems, patient monitoring and cardiac devices), Seattle Genetics Inc. (a global biotech company dedicated to revolutionizing cancer care), Sonosite Inc. (a world leader and specialist in hand-carried and mounted ultrasound) and T-Mobile (a national provider of wireless voice, messaging, and data services).
Long-term Financial Planning and Major InitiativesIn May 2021, Moody’s Annual Issuer Comment Report reaffirmed Bothell’s Aa1 rating stating that Bothell’s credit position is excellent. The Aa1 rating is significantly stronger than the median rating of Aa3 for cities nationwide. The notable credit factors include a robust financial position, a very strong wealth and income profile and a substantial tax base. It also reflects a light debt burden and a moderate pension liability.
Fiscal sustainability and strong reserves remain a top priority for the City. Since 2006, the City has utilized unreserved fund balance to invest in the revitalization of its historic downtown, which included environmental cleanup of properties acquired by the City as part of the revitalization efforts. Environmental cleanup has proven to be a costly endeavor and is required prior to the sale of the surplus properties. The City Council and staff are dedicated to replenishing reserves with the eventual proceeds of sale of the surplus properties. Two surplus properties are currently under contract for sale and are scheduled to close in the very near future.

Introductory Section City of Bothell
IV
The pandemic in 2020 had significant impacts on revenues and the City’s ability to fund current Capital Facilities Plan (CFP) projects. As a result, the call for new projects was temporarily suspended for the 2021-2027 update. Staff was tasked with updating project timelines, reforecasting revenues, and realigning project schedules. The update did not significantly change the scope of the original CFP, but further refined the current project timelines and funding plans with consideration given to current economic conditions.
The City continues to move forward with the construction to replace two aging fire stations. The project is funded by a voter-approved Public Safety Bond. Construction is scheduled to begin Summer of 2021.
A major plan to achieve a new vision for the Snohomish portion of Bothell (Canyon Park Subarea) is progressing. The plan encourages a more walkable, accessible, livable, amenities, and competitive job center, and proposes policies and strategies to implement this new vision. The plan will also satisfy regional growth goals identified in the Puget Sound Regional Council’s (PSRC) 2018 Regional Centers Framework Update and VISION 2050. Regional Growth Centers are urban areas throughout the Puget Sound designated to play a regional role in job and housing growth. They are supported by infrastructure and transportation investments.
Relevant Financial PoliciesThe City recently completed an update to its comprehensive financial management policies. The following is a summary of the noteworthy financial policies. A review of the policies and consideration of updates is required at least every two years.
Fund Balance. The City strives to maintain sufficient fund balance to ensure funding for continuity of operations and to provide a buffer for revenue fluctuations. Fund balance targets are established for all funds that support operations and are based on fund specific factors. Fund balance targets range from thirty-days of operating expenditures to ninety-days of operating expenditures. If fund balance targets are not met in any given year, then staff must communicate a plan to replenish the fund balance within four years.
Budget Development and Monitoring. Policy dictates that prudent and conservative revenue and expenditures assumptions should be used in the development of a balanced budget. Budget monitoring is noted as a responsibility of department heads.
One-Time Revenues. One-time revenues should be used to fund one-time expenditures and not ongoing operations.
Order of Funding. Policy states that restricted funding should be utilized first to fund qualifying expenditures before unrestricted resources are considered.
Long Range Financial Planning. A six-year financial forecast shall be drafted and periodically updated as the City’s long-range financial planning tool.
User Fees-Full Cost Recovery. Policy describes how and when user fees are established including an acknowledgement that certain fees are set at a rate that recovers the full cost of providing the services.
Introductory Section City of Bothell
V
Capital Facilities Plan. A Capital Facilities Plan (CFP) is required. The CFP shall plan major infrastructure projects for a seven-year period and shall account for the maintenance and operating costs associated with projects. The first two years of the CFP are to be incorporated into the biennial budget.
Awards and AcknowledgmentsThe Government Finance Officers Association of the United States and Canada (GFOA) awarded a Certificate of Achievement for Excellence in Financial Reporting to the City of Bothell for its Annual Report for the fiscal year ended December 31, 2019. This was the 19th consecutive year Bothell has received this prestigious award. To receive a Certificate of Achievement award, a government must publish an easily readable and efficiently organized Annual Report that satisfies all generally accepted accounting principles and adheres to all applicable legal requirements.
A Certificate of Achievement represents the highest standards in government accounting and financial reporting. Bothell is submitting the City’s 2020 CAFR to the GFOA to determine this report’s eligibility for a certificate. Staff believes the City’s 2020 CAFR again meets the requirements of the GFOA Certificate of Achievement for Excellence in Financial Reporting Program.
The City was also pleased to receive the GFOA Distinguished Budget Presentation Award for the City’s 2019-2020 biennial budget document. GFOA presents this award to governments whose budget document is aligned with best practices and satisfies criteria as an effective policy document, a financial plan, an operations guide, and a communication device. The City has submitted its 2021-2022 budget document for consideration of the award.
Successful preparation of Bothell’s 2020 Annual Report could not have been accomplished without the technical expertise and dedication of the City’s Finance staff. Appreciation is also extended to the Mayor, Council, and City management for their steadfast encouragement in conducting Bothell’s fiscal operations in a sound and prudent manner. The support and assistance from the State Auditor’s Office is also appreciated.
We would be happy to respond to any questions or comments about the information contained in this report.
Respectfully submitted,
Chris BothwellFinance Director

Introductory Section City of Bothell
VI
Government Finance Officers Association
Certificate of Achievementfor Excellence
in Financial Reporting
Presented to
City of BothellWashington
For its Comprehensive AnnualFinancial Report
For the Fiscal Year Ended
December 31, 2019
Executive Director/CEO

Introductory Section City of Bothell
VII
Legisla ve
(City Council)
Execu ve
(City Manager)
Judicial (Municipal Court
Public Works Transporta on Engineering Street Facili es Fleet U li es:
Sewer Water Storm Surface Water
Informa on Services (IS) Network Administra on Desktop Support IS Hardware Management Applica on Management
Execu ve City Manager’s Office City Clerk Communica ons Emergency Preparedness Economic Development Public Defender
Community Development City Hall Customer Service Business and Pet License Applica on Processing Building Inspec ons Code Enforcement Land Use Planning and Zoning Plan Review Permi ng Historic Preserva on Imagine Bothell Comprehensive Plan Updates
Legal General Legal Services Prosecu on and Defense Risk Management Domes c Violence Vic ms Advocate
Human Resources Recrui ng and Onboarding Collec ve Bargaining Bene!ts Administra on Well and Safety Programs
Finance Accoun ng and Repor ng Treasury Management Investments and Debt Capital Facili es Planning Admin Budget Administra on Grant Administra on Payroll and Disbursements
Police Patrol Inves ga ons Dispatch Communica ons
Fire Fire Preven on All Hazards Response Including: Fire Figh ng Emergency Medical Services (EMS)
Parks and Recrea on Parks Maintenance Parks Planning Special Events Tourism
ORGANIZATIONAL CHART
Introductory Section City of Bothell
VIII
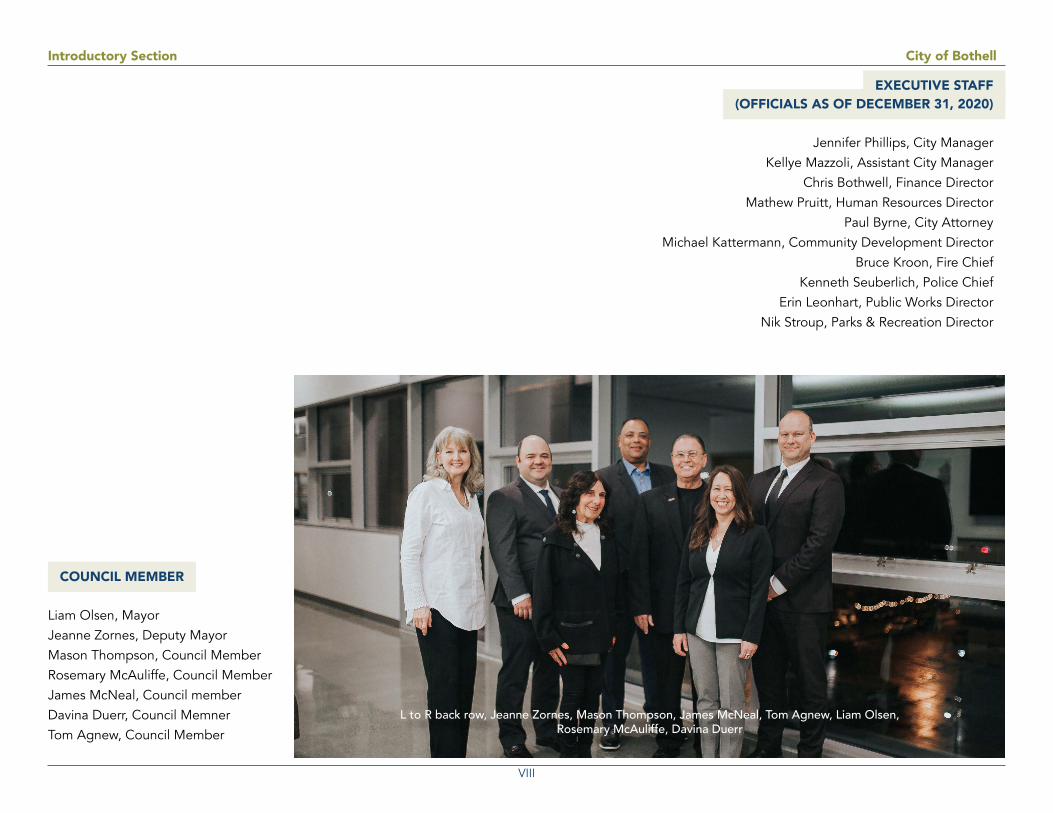
L to R back row, Jeanne Zornes, Mason Thompson, James McNeal, Tom Agnew, Liam Olsen, Rosemary McAuliffe, Davina Duerr
COUNCIL MEMBER
Liam Olsen, MayorJeanne Zornes, Deputy MayorMason Thompson, Council MemberRosemary McAuliffe, Council MemberJames McNeal, Council memberDavina Duerr, Council MemnerTom Agnew, Council Member
EXECUTIVE STAFF (OFFICIALS AS OF DECEMBER 31, 2020)
Jennifer Phillips, City ManagerKellye Mazzoli, Assistant City Manager
Chris Bothwell, Finance DirectorMathew Pruitt, Human Resources Director
Paul Byrne, City AttorneyMichael Kattermann, Community Development Director
Bruce Kroon, Fire ChiefKenneth Seuberlich, Police Chief
Erin Leonhart, Public Works DirectorNik Stroup, Parks & Recreation Director


AUDITOR'S LETTER

Auditor's Letter City of Bothell
i

Auditor's Letter City of Bothell
ii

Auditor's Letter City of Bothell
iii

Auditor's Letter City of Bothell
iv


MANAGEMENT'SDISCUSSION AND ANALYSIS

Management's Discussion and Analysis City of Bothell
1
The discussion and analysis section of the City of Bothell’s Comprehensive Annual Financial Report is prepared by City management to provide users an overview of the City’s financial activity and performance for the fiscal year ended December 31, 2020. Users are encouraged to consider Management’s Discussion and Analysis in conjunction with additional information furnished in the letter of transmittal (Introductory Section) and the City’s financial statements (Financial Section).
2020 Financial Highlights
■ The City’s assets and deferred outflows of resources exceeded its liabilities and deferred inflows of resources at the end of year by $657,765,918 (net position). Of this amount, $21,277,695 represents unrestricted net position, which may be used to meet the government’s ongoing obligations to citizens and creditors. Unrestricted net position increased substantially by $11,384,514 primarily due to the increase in tax revenues and intergovernmental revenues.
■ The City’s total net position decreased $8,709,866 mainly due to a substantial depreciation generated in governmental capital assets. A prior period adjustment of $6,121,043 was added to beginning net position which brought the ending net position to $657,765,918. (See Note 22)
■ At the close of the fiscal year, the City’s governmental funds reported combined fund balances of $58,633,462, an increase of $3,569,909, compared to the prior year. Of this amount $11,226,529 is available for spending at the City’s discretion (unassigned fund balance).
■ At the end of the current fiscal year, unrestricted fund balance (the total of the committed, assigned, and unassigned components of fund balance) for the general fund was $12,954,409, or approximately 24.7% of total general fund expenditures.
■ The City’s total outstanding long-term debt decreased by $4,916,276 due to the redemptions of the bond principals and amortizations of the premiums.
Overview of the Financial Statements
The discussion and analysis provided here are intended to serve as an introduction to the City’s basic financial statements. The City’s basic financial statements consist of three components: 1) government-wide financial statements, 2) fund financial statements, and 3) the notes to the financial statements. This report also includes supplementary information intended to furnish additional detail to support the basic financial statements themselves.
Government-Wide Financial Statements
The government-wide financial statements are designed to provide readers with a broad overview of the City’s finances, in a manner similar to a private-sector business.
The statement of net position presents financial information on all of the City’s assets, liabilities, and deferred inflows/outflows of resources, with the difference reported as net position. Over time, increases or decreases in net position may serve as a useful indicator of whether the financial position of the City is improving or deteriorating.

Management's Discussion and Analysis City of Bothell
2
The statement of activities presents information showing how the City’s net position changed during the most recent fiscal year. All changes in net position are reported as soon as the underlying event giving rise to the change occurs, regardless of the timing of related cash flows. Thus, revenues and expenses are reported for some items that will only result in cash flows in future fiscal periods (e.g., uncollected taxes and earned but unused vacation leave).
For the City of Bothell, both of the government-wide statements distinguish functions that are principally supported by taxes and intergovernmental revenues (governmental activities) from other functions that are intended to recover all or a significant portion of their costs through user fees and charges (business-type activities). Governmental activities include most of the City’s basic services such as general government, public safety, highways and streets, parks and recreation, and development services. Sales, business, and property taxes finance most of these activities. Business-type activities, on the other hand, are services the City provides for a fee. Customers pay based on their actual usage. Business-type activities include water, sewer, and storm & surface water.
The government-wide financial statements include not only the City of Bothell itself, but also its blended component unit COB Properties, a nonprofit corporation, which accounts for the activities of the City Hall lease revenue bond issuance, debt services, and maintenance.
Government-wide financial statements are located in the Financial Section of this report.
Fund Financial Statements
A fund is a grouping of related accounts that is used to maintain control over resources that have been segregated for specific activities or objectives. The City of Bothell, like other state and local governments, uses fund accounting to ensure and demonstrate compliance with finance-related legal requirements. All of the funds of the City can be divided into three categories: governmental funds, proprietary funds, and fiduciary funds.
Governmental Funds. Governmental funds are used to account for essentially the same functions reported as governmental activities in the government-wide financial statements. However, unlike the government-wide financial statements, governmental fund financial statements focus on near-term inflows and outflows of spendable resources, as well as on balances of spendable resources available at the end of the fiscal year. Such information may be useful in assessing a government’s near-term financial requirements.
Because the focus of governmental funds is narrower than that of the government-wide financial statements, it is useful to compare the information presented for governmental funds with similar information presented for governmental activities in the government-wide financial statements. By doing so, readers may better understand the long-term impact of the government’s near-term financing decisions. Both the governmental fund balance sheet and the governmental fund statement of revenues, expenditures, and changes in fund balances provide a reconciliation to facilitate this comparison between governmental funds and governmental activities.
The City maintains twelve individual governmental funds. Information is presented separately in the governmental fund balance sheet and in the governmental fund statement of revenues, expenditures, and changes in fund balances for the General Fund, Capital Improvements Fund, Public Safety Capital Fund, and Arterial

Management's Discussion and Analysis City of Bothell
3
Street Fund, which are considered to be major funds. Data from the other eight governmental funds are combined into a single aggregated presentation. Individual fund data for each of these governmental funds is provided in the form of combining statements in the combining and individual fund statements and schedules section of this report.
The basic governmental fund financial statements can be found in the Financial Section of this report.
Proprietary Funds. The City maintains two different types of proprietary funds. Enterprise funds are used to report the same functions presented as business-type activities in the government-wide financial statements. The City uses enterprise funds to account for its water, sewer, and storm and surface water activities. Internal service funds are an accounting method used to accumulate and allocate costs internally among the City’s various functions. The City uses internal service funds to account for its Equipment Rental, Self Insurance, and Asset Replacement functions. The internal service funds predominately benefit governmental rather than business-type functions, and therefore they have been included within governmental activities in the government-wide financial statements.
Proprietary funds provide the same type of information as the government-wide financial statements, only in more detail. The proprietary fund financial statements provide separate information for each of the enterprise funds. Conversely, internal service funds are combined into a single, aggregated presentation in the proprietary fund financial statements. Individual fund data for the internal service funds are provided in the form of combining statements in the combining and individual fund statements and schedules section of this report.
Fiduciary funds are used to account for resources held for the benefit of parties outside of the government. Fiduciary funds are not reported in the government-wide financial statements because the resources of these funds are not available to support the City’s own programs. The accounting used for fiduciary funds is much like that used for proprietary funds.
The fiduciary fund financial statements were reestablished in 2020 due to the implementation of GASB 84 Fiduciary Activities. (Refer to Basic Financial Statements 10 and 11, and Note 22)
Notes to the Financial Statements. The notes provide additional information that is necessary to acquire a full understanding of the data provided in the government-wide and fund financial statements. The notes to the financial statements are presented in the Financial Section of this report immediately following the basic financial statements.
Other Information. In addition to the basic financial statements and accompanying notes, this report also presents required supplementary information concerning the City’s progress in funding its obligation to provide pension and OPEB benefits to its employees, and a schedule of revenues, expenditures, and changes in fund balance for the City’s general fund.The combining statements referred to earlier in connection with nonmajor governmental funds and internal service funds, and a statistical section containing ten years of economic condition reporting are presented immediately following the required supplementary information.

Management's Discussion and Analysis City of Bothell
4
GOVERNMENT-WIDE OVERALL FINANCIAL ANALYSIS
Statement of Net Position
The statement of net position serves as a useful indicator of the City’s financial position.
As of December 31, 2020, the City’s assets and deferred outflows of resources exceeded liabilities and deferred inflows of resources by $657,765,918. Net investments in capital assets (e.g. land, buildings, machinery, and equipment) are by far the largest portion of the City’s net position (91.6%), less any debt used to acquire those assets that is still outstanding. The City uses capital assets to provide services to citizens, consequently these assets are not available for future spending. Although the City’s investment in its capital assets is reported net of related debt, it should be noted that the resources needed to repay this debt must be provided from other sources, since the capital assets themselves cannot be used to liquidate these liabilities. The following is a condensed version of the government-wide statement of net position for 2020 compared to 2019. The City’s $141,384 in unrestricted governmental net position increased by $10,026,159 or 101%, mainly due to the addition of a new Public Safety Bond levy of $1,590,286 and intergovernmental revenues of $11,291,738 including a COVID19 relief grant of $2,218,409.
City of Bothell's Net Position
2019 2020 2019 2020 2019 2020
Current and other assets $75,456,736 $77,426,169 $22,391,565 $23,900,159 $97,848,301 $101,326,328Capital assets 658,597,128 642,011,338 62,327,861 62,012,060 720,924,989 704,023,398Total assets 734,053,864 719,437,507 84,719,426 85,912,219 818,773,292 805,349,726
Deferred outflows of resources 3,845,701 4,645,630 300,548 325,667 4,146,249 4,971,297
Long-term liabilities 129,921,951 125,351,490 17,102,691 16,140,385 147,024,643 141,491,876Other liabilities 6,247,725 5,857,679 581,188 1,095,402 6,828,912 6,953,081Total liabilities 136,169,676 131,209,169 17,683,880 17,235,787 153,853,555 148,444,957
Deferred inflows of resources 8,141,888 3,776,139 569,356 334,009 8,711,244 4,110,148
Net positionNet investment in capital assets 571,700,385 556,090,023 45,672,414 46,215,411 617,372,799 602,305,433Restricted 31,772,391 32,866,421 1,316,369 1,316,369 33,088,760 34,182,790Unrestricted (9,884,774) 141,384 19,777,955 21,136,310 9,893,181 21,277,695
Total net position $593,588,002 $589,097,828 $66,766,738 $68,668,090 $660,354,740 $657,765,918
TotalPrimary Government
Business-TypeActivities
GovernmentalActivities

Management's Discussion and Analysis City of Bothell
5
Current and other assets increased in governmental activities by $1,969,433 from the prior year, mainly as a result of the new property tax levy for public safety bonds and CARES Act reimbursements.
Long-term liabilities, which consist of bonds, leases, compensated absences and postemployment benefit obligations, decreased by $5,532,767 from the previous year for governmental and business-type activities combined. This was primarily due to long term debt redemption of $4,916,276.
An additional portion of the City’s net position, $34,182,790, represents resources that are subject to external restrictions on how they may be used. As of the end of the current year, the City’s unrestricted net position was $21,277,695, an increase of 115% over the previous year.
The City’s overall net position decreased $8,709,866 from operating activities during 2020. The reasons for this overall decrease are discussed in the following sections for governmental activities and business-type activities.
0 100,000 200,000 300,000 400,000 500,000 600,000 700,000
Net investment in capital assets
Restricted
Unrestricted
Thousands
City of Bothell Net Position
2020 2019

Management's Discussion and Analysis City of Bothell
6
Changes in Net Position
Governmental Activities. During the current fiscal year, net position for governmental activities decreased by $10,611,217. A prior period adjustment of $6,121,043 due to a correction of capital asset depreciation added to an ending net position of $589,097,828. (Refer to Note 22) Governmental activities account for 89.6% of the City’s net position. The decrease in the overall net position of governmental activities is the result of a combination of depreciation costs of $44,300,863 (Refer to Note 6) and reduced long term liabilities of $4,570,461. (Refer to Note 13)
Governmental revenues increased $8,507,433 from the prior year primarily due to $2,218,409 in federal COVID-19 operating relief grants and $7,206,715 increase in capital grants and contributions to fund ongoing transportation projects. Also, an increase of $449,866 from property tax, sales tax, excise tax and business taxes.
Governmental expenses by function for governmental activities remained relatively steady in comparison with prior year. Despite the unpredictability of the pandemic, 2020 expenses were significantly reduced due to the swift actions taken by the organization. These measures included employee furloughs, layoffs, other hiring/vacancy strategies and strict budget discipline.
As shown in the chart below, revenues generated by the City’s programs are not sufficient to cover the costs. The City relies on property taxes, sales taxes, excise tax, business taxes and other general revenues to cover the costs associated with the various programs.
Changes in Net Position
Governmental Activities
Business-Type Activities
Total Primary Government
Governmental Activities
Business-Type Activities
Total Primary Government
RevenuesProgram revenuesCharges for services $22,052,440 $21,577,950 $43,630,390 $19,590,604 $20,042,085 $39,632,689Operating grants and contributions 1,427,294 113,714 1,541,008 5,512,318 61,232 5,573,550Capital grants and contributions 10,305,181 426,278 10,731,460 17,511,896 1,125,953 18,637,849General revenuesProperty taxes 23,179,428 23,179,428 25,777,074 25,777,074Sales taxes 23,107,676 23,107,676 16,419,635 16,419,635Excise taxes 4,688,954 4,688,954Business taxes 7,570,286 7,570,286 7,421,594 7,421,594Interest and investment earnings 1,448,679 7,998 1,456,677 1,051,689 12,110 1,063,799Miscellaneous 785,683 785,683 410,338 410,338Total revenues 89,876,668 22,125,940 112,002,608 98,384,101 21,241,380 119,625,481
Program expenses including indirect expensesGeneral government 18,481,329 18,481,329 18,572,174 18,572,174Security of persons and property 31,280,308 31,280,308 30,675,844 30,675,844Physical environment 2,656,681 2,656,681 2,268,331 2,268,331Transportation 47,442,708 47,442,708 48,788,724 48,788,724Economic environment 3,493,273 3,493,273 3,323,007 3,323,007Culture and recreation 2,238,693 2,238,693 1,807,436 1,807,436Interest and fiscal charges 3,536,401 3,536,401 3,966,414 3,966,414Water 5,445,506 5,445,506 5,399,995 5,399,995Sewer 8,084,249 8,084,249 8,006,728 8,006,728Storm & surface water 5,789,406 5,789,406 5,526,694 5,526,694Total expenses 109,129,394 19,319,161 128,448,556 109,401,930 18,933,417 128,335,347
Increase ( decrease) in net position before transfers (19,252,726) 2,806,779 (16,445,947) (11,017,829) 2,307,963 (8,709,866)
Transfers 412,566 (412,566) 406,612 (406,612)
Increase ( decrease) in net position ($18,840,160) $2,394,213 ($16,445,947) ($10,611,217) $1,901,351 ($8,709,867)
Net position beginning $612,083,749 $64,372,526 $676,456,275 $593,588,002 $66,766,738 $660,354,740Prior period adjustment (see note 22) $6,121,043 $6,121,043Restatement per GASB 73 & 84 implementation (see note 22) 344,413 $344,413Net position ending $593,588,002 $66,766,738 $660,354,740 $589,097,828 $68,668,090 $657,765,917
20202019

Management's Discussion and Analysis City of Bothell
7
Changes in Net Position
Governmental Activities. During the current fiscal year, net position for governmental activities decreased by $10,611,217. A prior period adjustment of $6,121,043 due to a correction of capital asset depreciation added to an ending net position of $589,097,828. (Refer to Note 22) Governmental activities account for 89.6% of the City’s net position. The decrease in the overall net position of governmental activities is the result of a combination of depreciation costs of $44,300,863 (Refer to Note 6) and reduced long term liabilities of $4,570,461. (Refer to Note 13)
Governmental revenues increased $8,507,433 from the prior year primarily due to $2,218,409 in federal COVID-19 operating relief grants and $7,206,715 increase in capital grants and contributions to fund ongoing transportation projects. Also, an increase of $449,866 from property tax, sales tax, excise tax and business taxes.
Governmental expenses by function for governmental activities remained relatively steady in comparison with prior year. Despite the unpredictability of the pandemic, 2020 expenses were significantly reduced due to the swift actions taken by the organization. These measures included employee furloughs, layoffs, other hiring/vacancy strategies and strict budget discipline.
As shown in the chart below, revenues generated by the City’s programs are not sufficient to cover the costs. The City relies on property taxes, sales taxes, excise tax, business taxes and other general revenues to cover the costs associated with the various programs.
Changes in Net Position
Governmental Activities
Business-Type Activities
Total Primary Government
Governmental Activities
Business-Type Activities
Total Primary Government
RevenuesProgram revenuesCharges for services $22,052,440 $21,577,950 $43,630,390 $19,590,604 $20,042,085 $39,632,689Operating grants and contributions 1,427,294 113,714 1,541,008 5,512,318 61,232 5,573,550Capital grants and contributions 10,305,181 426,278 10,731,460 17,511,896 1,125,953 18,637,849General revenuesProperty taxes 23,179,428 23,179,428 25,777,074 25,777,074Sales taxes 23,107,676 23,107,676 16,419,635 16,419,635Excise taxes 4,688,954 4,688,954Business taxes 7,570,286 7,570,286 7,421,594 7,421,594Interest and investment earnings 1,448,679 7,998 1,456,677 1,051,689 12,110 1,063,799Miscellaneous 785,683 785,683 410,338 410,338Total revenues 89,876,668 22,125,940 112,002,608 98,384,101 21,241,380 119,625,481
Program expenses including indirect expensesGeneral government 18,481,329 18,481,329 18,572,174 18,572,174Security of persons and property 31,280,308 31,280,308 30,675,844 30,675,844Physical environment 2,656,681 2,656,681 2,268,331 2,268,331Transportation 47,442,708 47,442,708 48,788,724 48,788,724Economic environment 3,493,273 3,493,273 3,323,007 3,323,007Culture and recreation 2,238,693 2,238,693 1,807,436 1,807,436Interest and fiscal charges 3,536,401 3,536,401 3,966,414 3,966,414Water 5,445,506 5,445,506 5,399,995 5,399,995Sewer 8,084,249 8,084,249 8,006,728 8,006,728Storm & surface water 5,789,406 5,789,406 5,526,694 5,526,694Total expenses 109,129,394 19,319,161 128,448,556 109,401,930 18,933,417 128,335,347
Increase ( decrease) in net position before transfers (19,252,726) 2,806,779 (16,445,947) (11,017,829) 2,307,963 (8,709,866)
Transfers 412,566 (412,566) 406,612 (406,612)
Increase ( decrease) in net position ($18,840,160) $2,394,213 ($16,445,947) ($10,611,217) $1,901,351 ($8,709,867)
Net position beginning $612,083,749 $64,372,526 $676,456,275 $593,588,002 $66,766,738 $660,354,740Prior period adjustment (see note 22) $6,121,043 $6,121,043Restatement per GASB 73 & 84 implementation (see note 22) 344,413 $344,413Net position ending $593,588,002 $66,766,738 $660,354,740 $589,097,828 $68,668,090 $657,765,917
20202019

Management's Discussion and Analysis City of Bothell
8
Business-Type Activities. For the City’s business-type activities, the results for the current fiscal year were positive in that overall net position increased to reach an ending balance of $68,668,090. The total increase in net position for business-type activities was $1,901,351 or 2.85% higher than the prior fiscal year. The growth, in large part, is attributable to the capital contribution increase of $699,675 and reduction of $356,831 in the operating expenses throughout all three utility funds - Water, Sewer, and Storm and Surface Water.
Financial Analysis of the Governmental Funds
As noted earlier, the City uses fund accounting to ensure and demonstrate compliance with finance-related legal requirements.
Governmental Funds. The focus of the City’s governmental funds is to provide information on near-term inflows, outflows, and balances of spendable resources. Such information is useful in assessing the City’s financing requirements. In particular, unassigned fund balance may serve as a useful measure of a government’s net resources available for discretionary use, as they represent the portion of fund balance which has not yet been limited for use for particular purposes by the City Council.
$500,000
$5,500,000
$10,500,000
$15,500,000
$20,500,000
$25,500,000
$30,500,000
$35,500,000
$40,500,000
$45,500,000
General Government Security of Persons &Property
Physical Environment Transportation Economic Environment Culture and Recreation Interest on Long Term Debt
Expenses and Program Revenues - Governmental Activities
RevenuesExpenses

Management's Discussion and Analysis City of Bothell
9
At the end of 2020, the City’s governmental funds reported combined fund balances of $58,633,462, an increase of $3,569,909 compared to the prior year. This increase is due mainly to COVID-19 federal grant relief efforts and a combination of property tax, sale tax, excise tax and business tax revenue, which was up 3.1% ($1,642,042) over 2019.
Approximately 19.2% of fund balance ($11,226,529) constitutes unassigned fund balance, which is available for spending at the government’s discretion. The remainder of the fund balance is either restricted, committed, or assigned to indicate that it is 1) restricted for particular purposes ($45,611,361), 2) committed for particular purposes ($84,442), or 3) assigned for particular purposes ($1,711,130).
0 2,000,000 4,000,000 6,000,000 8,000,000 10,000,000 12,000,000
Restricted
Committed
Assigned
Unassigned:
General Fund Components of Fund Balance
2020 2019
The General Fund is the chief operating fund of the City. At the end of the current fiscal year, unassigned fund balance of the General Fund was $11,226,529. Total fund balance increased by $3,866,847 mainly due to $2,218,409 in CARES Act reimbursements and $1,503,019 in expenditure reductions. As a measure of the General Fund’s liquidity, it may be useful to compare both unassigned fund balance and total fund balance to total General Fund expenditures. Unassigned fund balance represents 80.2% of total General Fund balance and 21.4% of total General Fund expenditures, an increase of 8% from prior fiscal year.
The Capital Improvements Fund, a major fund, increased $84,230 in fund balance mainly due to capital grants funding for major transportation projects. However, the major revenue source of real estate excise tax decreased by 18.3%.
The Public Safety Capital Fund is a major fund to account for the construction of two new fire stations. In 2020, the City expended $2,466,823 (10%) of the original $25 million in voter-approved GO bonds. The fire stations are scheduled to be completed in 2023.

Management's Discussion and Analysis City of Bothell
10
The Arterial Street Fund, the remaining major governmental fund, decreased fund balance by $2,120,589 during the current year, bringing the year-end fund balance to $3,236,572. This decrease was a result of reduced impact and mitigation fee revenues, and impact fee refunds.
All other governmental funds experienced an increase in fund balance of $4,047,854. The increase was due mainly to the new voter-approved Public Safety levy starting in 2020. Approximately $1.6 million is to repay principal and interest of the Public Safety Capital GO Bonds.
0 2,000,000 4,000,000 6,000,000 8,000,000 10,000,000 12,000,000 14,000,000
Restricted
Committed
Assigned
Unassigned:
Other Governmental Funds Components of Fund Balance
2020 2019
Proprietary Funds. The City’s proprietary funds provide the same type of information found in the government-wide financial statements, but in more detail. Unrestricted net position of the Water Fund at the end of the year was $4,454,448, the Sewer Fund was $7,968,018, and the Storm & Surface Water Fund was $8,713,845. The total growth in net position for all three funds was $102,168, $146,262 and $1,652,921 respectively. As noted earlier in the discussion of business-type activities, the increase for water, sewer, and storm & surface water rates and capital grants and capital contributions resulted in the growth of the unrestricted net position.
General Fund Budgetary Highlights
The City of Bothell adopts a biennial budget for its General Fund and budget amendments are presented to Council throughout the year as needed.
The General Fund has three major revenue sources – sales tax, property tax and utility tax. In 2020, sales tax collections increased by more than two percent compared to 2019 as a result of strong third and fourth quarter collections. Despite the rebound, sales tax lagged the adopted biennial budget by approximately $2.5 million for the biennium. Utility tax collections decreased by a modest $180,000, but also underperformed relative to the budget by approximately $2 million for the biennium. In addition, the City received $2.2 million in CARES Act reimbursements and $2 million in Ground Emergency Medical Transport (GEMT) revenues, both of which were unbudgeted revenue sources.

Management's Discussion and Analysis City of Bothell
11
General Fund expenditures were significantly below budget as a direct result of early actions in response to the pandemic. Employee furloughs, layoffs, and other hiring/vacancy strategies, along with exercising budget discipline, resulted in approximately $1.6 million in expenditure savings in 2020, thereby ending the biennium 3.5% less than projected.
Capital Assets and Debt Administration
Capital Assets. The City’s investment in capital assets for its governmental and business-type activities as of December 31, 2020, amounts to $704,023,398 (net of accumulated depreciation). This investment in capital assets includes land, buildings, machinery, equipment, vehicles, park facilities, roads, highways, bridges, utility structures and construction in progress. The total decrease in capital assets for 2020 was 2.4%.
In 2020, the coronavirus pandemic attributed in delaying the completion of two major capital projects: ■ NE 188th Street Non-Motorized Improvements
■ Park at Bothell Landing Pedestrian Bridge Replacement
Project costs of over $4.6 million remain as construction in progress and are expected to be completed in 2021.
Another major capital project is the replacement of two outdated fire stations. The project is funded from $35.5 million voter-approved bonds and $2.5 million of fire impact fees and other contributions. In December 2019, the City issued $25 million in bonds to start the construction process. In 2020, the City expended $2.4 million on building design. Construction of both fire stations is expected to begin July 2021 with completion by 2023.
Following is a condensed version of the City’s capital assets, net of depreciation, related to governmental and business-type activities for fiscal years 2019 and 2020:
City of Bothell's Capital Assets (net of depreciation)
2019 2020 2019 2020 2019 2020Land and land improvements $71,978,308 $72,545,127 $285,302 $285,302 $72,263,609 $72,830,428Infrastructure right-of-way 81,888,608 82,211,379 1,935,868 1,935,868 83,824,476 84,147,247Buildings 12,087,383 11,777,366 6,895,825 6,724,825 18,983,207 18,502,191Capital lease - City Hall 46,842,644 45,813,135 46,842,644 45,813,135Improvements 48,818,682 45,323,226 49,926,835 49,609,772 98,745,517 94,932,998Infrastructure 364,486,722 335,699,943 364,486,722 335,699,943Vehicles 4,132,761 3,569,578 88,466 79,985 4,221,227 3,649,563Machinery & equipment 1,698,296 1,298,494 1,061,620 945,855 2,759,917 2,244,349Construction in progress 23,252,205 40,680,751 2,133,946 2,430,453 25,386,151 43,111,204Work of art 121,519 115,672 121,519 115,672Intangible asset 3,290,000 2,976,667 3,290,000 2,976,667Total $658,597,128 $642,011,338 $62,327,861 $62,012,060 $720,924,989 $704,023,398
TotalGovernmentalActivities
Business-TypeActivities

Management's Discussion and Analysis City of Bothell
12
Major capitalization and additional information on the City’s capital assets can be found in the Financial Section, Note 6 of the Basic Financial Statements.
Long-term Debt. In 2020, the City’s total debt decreased by $4,916,276 (3.8%). The City paid debt principal of $4,540,609 in accordance with debt schedules and amortized bond premiums of $375,667 using the straight-line method. The City had no new debt issuance in 2020.
Washington State statute limits the amount of general obligation debt issued by a unit of government to 7.5% of the total assessed value of taxable property located within that government’s boundaries. As of January 1, 2020, the City’s outstanding net debt was $108,342,413.
At the end of 2020, the City’s total long-term debt was $124,139,062, including bonded debt outstanding of $73,403,126 (general obligation bonds and utility revenue bonds). Of this amount, $58,153,006 of the debt is backed by the full faith and credit of the government. The remainder of the City’s long-term obligations is comprised of public trust fund loans, capital leases, and utility revenue bonds. Additional information regarding the City’s long-term debt is located in the Financial Section, Note 13.
City of Bothell's Outstanding Debt
2019 2020 2019 2020 2019 2020
General obligation debt $60,307,219 $58,153,006 $60,307,219 $58,153,006
Capital lease 46,623,437 45,180,265 46,623,437 45,180,265
Loans 5,469,235 5,009,142 592,046 546,530 6,061,281 5,555,672
Utility revenue bonds 16,063,401 15,250,120 16,063,401 15,250,120
Total $112,399,891 $108,342,413 $16,655,447 $15,796,649 $129,055,338 $124,139,062
TotalGovernmentalActivities
Business-TypeActivities

Management's Discussion and Analysis City of Bothell
13
ECONOMIC FACTORS AND NEXT YEAR’S BUDGETS AND RATES
As of April 2021, Washington State Economic and Revenue Council reports the Washington economy continues to recover from the recession but growth has slowed. Washington’s unemployment rate declined to 5.4% in March from 5.6% in February. The unemployment rate is down significantly from the 16.3% rate reached in April 2020. Total nonfarm payroll employment increased 24,800 in March which was 19,400 more than the increase of 5,500 expected in the forecast. Despite strong March growth, Washington employment is 5.9% lower than its February 2020 peak. Washington’s housing construction remains strong. The decline in Washington real GDP in 2020 was mild due to a favorable mix of industries.
The 2021-2022 Adopted Budget includes a 1% property tax increase. Washington State law limits the increase of property tax from the actual amount collected in the previous year to 1%. Also included in Bothell’s property tax are Safe Street and Sidewalks levy, Public Safety levy and Public Safety Bond levy. Total levy rate for 2021 is $1.99/$1,000 assessed value.
Bothell’s fees for 2021 increased by 1.0%. City fees increase annually on January 1 of each year. Fees are increased based upon the June-to-June Consumer Price Index (CPI-W), or by the amount required to continue to ensure full cost recovery. 2021 utility rates increased as follows: 6% water, 3.5% sewer and 5% storm and surface water. These rates pay for utility expenses and capital projects identified in the City’s 2021-2027 Capital Facilities Plan. The City’s utility funds remain financially stable due to sound operational and project management, coupled with continued adoption of annual rate increases that keep pace with inflation and capital demands.
The City continues to monitor the economic forecast along with any post-pandemic behavior that might affect the City’s financial condition moving forward into 2021.
Requests for Information
This financial report is designed to provide a general overview of the City of Bothell’s finances for all those with an interest in the government’s finances. Questions concerning any of the information provided in this report or requests for additional financial information should be addressed to: City of Bothell Finance Director, 18415 101st Avenue NE, Bothell, WA 98011.


BASIC FINANCIALSTATEMENTS

Basic Financial Statement City of Bothell
The accompany notes are an integral part of this statement 1
Statement of Net Position December 31, 2020
Governmental Activities Business-Type Activities TotalASSETSCash and cash equivalents 4,018,297$ 820,747$ 4,839,044$ Investments 50,766,436 18,962,038 69,728,474Receivables (net) 12,442,655 2,801,005 15,243,661Taxes receivable 352,082 352,082Reserved assets:
Deposit held in trust 276,939 276,939Investment 1,316,369 1,316,369
Capital assets:Non-depreciable 195,437,257 4,651,623 200,088,879Depreciable, net 446,574,081 57,360,437 503,934,518
Net pension asset 9,569,760 9,569,760Total assets 719,437,507 85,912,219 805,349,726
DEFERRED OUTFLOWS OF RESOURCES
Deferred outflows - pension 4,581,135 325,667 4,906,802Deferred outflows - other postemployment benefits (OPEB) 64,495 64,495
Total deferred outflows of resources 4,645,630 325,667 4,971,297
LIABILITIESAccounts payable 5,580,740 1,095,402 6,676,142Unearned revenue 276,939 276,939Long-term liabilities (see Note 13):
Due within one year 7,661,074 888,798 8,549,872Due in more than one year 104,253,934 14,907,852 119,161,786
Other postemployment benefits (OPEB):Due within one year 188,147 188,147Due in more than one year 6,866,547 6,866,547
Net pension liability - due in more than one year 6,381,788 343,736 6,725,524Total liabilities 131,209,169 17,235,787 148,444,957
DEFERRED INFLOWS OF RESOURCES
Deferred inflows - pension 3,775,864 321,100 4,096,964Deferred inflows - advanced grant 275 12,909 13,184
Total deferred inflows of resources 3,776,139 334,009 4,110,148
NET POSITIONNet investment in capital assets 556,090,023 46,215,411 602,305,433Restricted for:
Net pension asset 9,676,158 9,676,158Transportation 3,236,572 3,236,572Parks & Recreation 4,263,094 4,263,094
Capital projects 7,233,536 7,233,536Street maintenance 3,223,639 3,223,639Drug forfeitures 120,919 120,919Fire impact fees 318,661 318,661Public safety levy 3,748,109 3,748,109Debt service 3,626 1,316,369 1,319,995Firefighter's Pension 358,749 358,749Cemetery (permanently restricted) 16,321 16,321Other purpose 667,037 667,037
Unrestricted (deficit) 141,384 21,136,310 21,277,695 Total net position 589,097,828$ 68,668,090$ 657,765,918$
Primary Government

Basic Financial Statement City of Bothell
The accompany notes are an integral part of this statement 2

Basic Financial Statement City of Bothell
The accompany notes are an integral part of this statement 3
Special Revenue Fund
General Arterial Street Capital Improvements Public Safety Capital
Other Governmental
Funds
Total Governmental Funds
ASSETSCurrent cash & cash equivalents 1,954,382$ 256,105$ 287,394$ 997,399$ 3,495,281$ Investments 9,425,879 3,000,000 1,900,000 23,316,377 10,824,179 48,466,436 Receivables (net of allowances)Taxes 187,952 164,130 352,082 Accounts receivable 1,870,735 41,794 15,323 1,927,852 Due from other governmental units 4,121,346 6,192,373 133,267 10,446,986 Total assets 17,560,294$ 3,256,105$ 8,421,562$ 23,316,377$ 12,134,299$ 64,688,637$
LIABILITIES, DEFERRED INFLOWS OF RESOURCES AND FUND BALANCESLiabilities:
Accounts payable 575,180 1,734,514 343,793 62,691 2,716,178 Deposits payable 410,651 410,651 Due to other governmental units 101,043 4,722 4,388 110,153 Payroll payable 1,849,163 180,282 2,029,444 Total liabilities 2,936,036 1,739,236 343,793 247,360 5,266,426
Deferred Inflows of Resources Unavailable revenue-property tax, service fees & impact fees 633,027 19,533 135,913 788,473 Unavailable revenue-advanced grant 275 275 Total deferred inflows of resources 633,027 19,533 275 135,913 788,748
Fund balances:Restricted 1,036,822 3,236,572 6,682,050 22,972,584 11,683,333 45,611,361 Committed 16,750 67,692 84,442 Assigned 1,711,130 1,711,130 Unassigned 11,226,529 11,226,529 Total fund balances 13,991,231 3,236,572 6,682,050 22,972,584 11,751,025 58,633,462
TOTAL LIABILITIES, DEFERRED INFLOWS OF RESOURCES AND FUND BALANCES 17,560,294$ 3,256,105$ 8,421,562$ 23,316,377$ 12,134,299$ 64,688,637$
Capital Projects Fund

Basic Financial Statement City of Bothell
The accompany notes are an integral part of this statement 4

Basic Financial Statement City of Bothell
The accompany notes are an integral part of this statement 5

Basic Financial Statement City of Bothell
The accompany notes are an integral part of this statement 6

Basic Financial Statement City of Bothell
The accompany notes are an integral part of this statement 7
Statement of Net Position Proprietary Funds December 31, 2020
Governmental Activities
Water Sewer Storm & Surface Water Total Internal Service Funds
ASSETSCurrent assetsCash and cash equivalents 201,452$ 201,171$ 418,124$ 820,747$ 523,016$ Investments 4,190,215 6,307,503 8,464,320 18,962,038 2,300,000 Accounts receivable 759,783 1,680,263 254 2,440,299 52,235 Due from other governments 1,130 872 358,704 360,706 15,582 Reserved assets: Deposit held in trust 276,939 Investment-revenue bond reserve 109,785 292,497 914,086 1,316,369 Total current assets 5,262,365 8,482,306 10,155,488 23,900,159 3,167,773
Non-current assetsCapital assets not being depreciated:
Land 122,175 163,126 285,302 Right of way 1,935,868 1,935,868 Construction in progress 605,488 154,684 1,670,282 2,430,453
Capital assets being depreciated:Intangible assets 141,538 122,978 146,663 411,179 Buildings 2,729,301 3,513,086 2,304,125 8,546,512 35,285 Improvements other than buildings 28,083,047 17,564,753 35,781,739 81,429,538 1,501,071 Equipment 59,048 1,812,988 275,951 2,147,988 1,910,805 Vehicles 30,457 30,457 250,920 311,834 9,623,833 Less accumulated depreciation (12,450,779) (10,085,136) (12,950,697) (35,486,613) (8,438,683)
Total non-current assets 19,320,274 13,276,935 29,414,850 62,012,060 4,632,310 Total assets 24,582,640 21,759,241 39,570,338 85,912,219 7,800,083
DEFERRED OUTFLOWS OF RESOURCESDeferred outflows - pension 84,656 76,164 164,847 325,667 53,602 Total deferred outflows of resources 84,656 76,164 164,847 325,667 53,602
LIABILITIESCurrent liabilitiesAccounts payable 424,935 28,358 137,837 591,129 70,140 Payroll payable 51,180 48,273 98,429 197,882 35,936 Compensated absences 63,833 64,767 111,191 239,790 37,766 Due to other governments 66,601 66,601 57,116 Interest payable 151,122 Current portion of loans payable 45,516 45,516 Current portion of revenue bonds payable, net 178,345 81,047 583,890 843,281 Total current liabilities 784,894 222,443 976,863 1,984,200 352,079
Non-current liabilitiesLoans payable 501,013 501,013 Revenue Bonds Payable, net 3,035,147 1,362,094 10,009,597 14,406,838Unearned revenue 276,939 Pension Liabilities 91,331 80,537 171,868 343,736 61,118 Total non-current liabilities 3,126,478 1,442,631 10,682,479 15,251,588 338,057 Total liabilities 3,911,372 1,665,074 11,659,341 17,235,787 690,136
DEFERRED INFLOWS OF RESOURCESDeferred inflows - advance grant 12,909 12,909 Deferred inflows - pension 84,908 76,021 160,171 321,100 54,478 Total deferred inflows of resources 84,908 76,021 173,080 334,009 54,478
NET POSITIONNet investment in capital assets 16,106,782 11,833,795 18,274,834 46,215,411 4,632,310 Restricted for debt service 109,785 292,497 914,086 1,316,369 Unrestricted 4,454,448 7,968,018 8,713,845 21,136,310 2,476,761 Total net position 20,671,015$ 20,094,310$ 27,902,765$ 68,668,090$ 7,109,071$
Business-Type Activities Enterprise Funds

Basic Financial Statement City of Bothell
The accompany notes are an integral part of this statement 8
Governmental Activities
Water Sewer Storm & Surface Water Total Internal Service Funds
OPERATING REVENUESCharges for services 5,287,886$ 8,016,169$ 6,640,442$ 19,944,496$ 3,538,089$ Other operating revenue 2,568 23,682 25,912 52,162 Total operating revenue 5,290,454 8,039,850 6,666,354 19,996,658 3,538,089
OPERATING EXPENSESAdministrative and general 909,514 1,294,105 2,221,625 4,425,245 2,451,673 Purchased water 1,529,448 1,529,448 Metro service 4,481,525 4,481,525 Maintenance and operations 1,017,072 744,183 1,287,076 3,048,332 361,632 Customer accounts 212,220 241,531 453,751 Taxes 775,454 585,891 359,861 1,721,206 Depreciation 851,200 612,384 1,310,411 2,773,994 1,104,273 Total operating expenses 5,294,909 7,959,619 5,178,973 18,433,500 3,917,578 OPERATING INCOME (LOSS) (4,455) 80,232 1,487,381 1,563,158 (379,489)
NON-OPERATING REVENUES (EXPENSES)Investment income 12,110 12,110 1,739,712 Intergovernmental revenue 1,130 872 59,230 61,232 Miscellaneous revenue 45,427 45,427 Proceeds from sale of capital assets including insurance recoveries 38,003 Gain (loss) on disposition of capital assets (248,249) Revenue bonds interest (105,086) (47,110) (347,721) (499,917) (1,724,960) Total non-operating revenue (expense) (58,529) (46,238) (276,381) (381,148) (195,494) INCOME (LOSS) BEFORE CONTRIBUTIONSAND TRANSFERS (62,983) 33,994 1,211,000 1,182,010 (574,983) Transfers in 1,647,656 Transfers out (81,121) (77,117) (248,374) (406,612) (1,082,774) Capital contributions 246,273 189,385 690,295 1,125,953 CHANGE IN NET POSITION 102,169 146,262 1,652,921 1,901,351 (10,100)
NET POSITION - BEGINNING 20,568,847 19,948,048 26,249,844 66,766,738 7,119,171
NET POSITION - ENDING 20,671,015$ 20,094,310$ 27,902,765$ 68,668,090$ 7,109,071$
Business-Type Activities Enterprise Funds

Basic Financial Statement City of Bothell
The accompany notes are an integral part of this statement 9

Basic Financial Statement City of Bothell
The accompany notes are an integral part of this statement 10
Private-Purpose Trust Funds Custodial Fund Total
ASSETS
Cash and cash equivalents 41,015$ 25,014$ 66,029$ Total assets 41,015 25,014 66,029
DEFERRED OUTFLOWS OF RESOURCES
Total deferred outflows of resources
LIABILITIES
Accounts payable 24,255 24,255Total liabilities 24,255 24,255
DEFERRED INFLOWS OF RESOURCES
Total deferred inflows of resources
NET POSITION
Restricted for: Individuals, organizations and other governments 41,015 759 41,774
UnrestrictedTotal net position 41,015$ 759$ 41,774$

Basic Financial Statement City of Bothell
The accompany notes are an integral part of this statement 11
Private-Purpose Trust Funds Custodial Fund Total
ADDITIONS
Court bail bond/restitution trust 92,335$ 92,335$ Fees collections for other governments 176,750 176,750
Total additions 92,335 176,750 269,085
DEDUCTIONS
Payments of Court bail bond/restitutions 87,370 87,370Payments of fee to other governments 175,991 175,991
Total deductions 87,370 175,991 263,361
Net increase (decrease) in fiduciary net position 4,965 759 5,724
Net position - beginningRestatement per GASB 84 implementation (see Note 22) 36,051 36,051
Net position - ending 41,015$ 759$ 41,774$

Basic Financial Statement City of Bothell
Notes to the Financial Statement 12
NO
TES
TABLE OF CONTENTS - NOTES TO THE FINANCIAL STATEMENTS
1 - Summary of Significant Accounting Policies .................................................................................................................13-22
2 - Compliance and Accountability ....................................................................................................................................23-24
3 - Deposits and Investments ............................................................................................................................................24-29
4 - Property Taxes ..................................................................................................................................................................30
5 - Deferred Inflows and Outflows of Resources ...................................................................................................................31
6 - Capital Assets and Depreciation ..................................................................................................................................32-35
7 - Pensions Plans ..............................................................................................................................................................36-48
8 - Other Employee Benefits ..................................................................................................................................................49
9 - Post-Employment Benefits Other than Pensions..........................................................................................................50-53
10 - Contingencies ..................................................................................................................................................................54
11 - Risk Management .......................................................................................................................................................54-55
12 - Interfund Activities .....................................................................................................................................................55-56
13 - Long-Term Debt ..........................................................................................................................................................56-60
14 - Impacts Fees ...............................................................................................................................................................60-61
15 - Pollution Remediation Obligations .............................................................................................................................61-62
16 - Leases ..............................................................................................................................................................................63
17 - Blended Component Unit ................................................................................................................................................64
18 - Health & Welfare ........................................................................................................................................................64-65
19 - Joint Ventures & Operations ......................................................................................................................................65-69
20 - Governmental Fund Balance and Reconciliation to the Net Position .........................................................................69-71
21 - Tax Abatement ................................................................................................................................................................72
22 - Accounting and Reporting Changes ...........................................................................................................................72-75
23 - Subsequest Event .......................................................................................................................................................75-76
24 - Covid-19 Pandemic ..........................................................................................................................................................76

Basic Financial Statement City of Bothell
Notes to the Financial Statement 13<< back to table of content (Notes)
January 1, 2020 through December 31, 2020The accompanying notes are an integral part of the enclosed financial statements.
NOTE 1SUMMARY OF SIGNIFICANT ACCOUNTING POLICIES
A. DESCRIPTION OF GOVERNMENT-WIDE FINANCIAL STATEMENTS
The government-wide financial statements (the statement of net position and the statement of activities) report information on all of the nonfiduciary activities of the primary government and its component unit. All fiduciary activities are reported only in the fund financial statements. Governmental activities, which normally are supported by taxes, intergovernmental revenues, and other nonexchange transactions, are reported separately from business-type activities, which rely to a significant extent on fees and charges to external customers for support. Likewise, the primary government is reported separately from certain legally separate component units for which the primary government is financially accountable.
B. REPORTING ENTITY
The City is a municipal corporation operating under a Council-Manager form of government. The City’s major operations, as authorized under the laws of the State of Washington applicable to a non-charter code city, include planning & zoning, public safety, public works, recreation & culture, and utilities. The accounting and reporting policies of the City conform to Generally Accepted Accounting Principles (GAAP) and are regulated by the Washington State Auditor's Office. The City’s Comprehensive Annual Financial Report (CAFR) is prepared in accordance with Governmental Accounting Standards Board (GASB) and the following notes detail the City’s significant accounting policies. The City has implemented all GASB statements applicable for implementation in 2020. (Refer to Note 22 Accounting and Reporting Changes). The accompanying financial statements present the government and its component units, entities for which the government is considered to be financially accountable.
Blended Component Unit
The City has one blended component unit, COB Properties. Blended component units are, in substance, part of the primary government’s operations, even though they are legally separate entities. Thus, blended component units are appropriately presented as funds of the primary government. Each discretely presented component unit is reported in a separate column in the government-wide financial statements to emphasize that it is legally separate from the government (Refer to Note 17).
C. BASIS OF PRESENTATION – GOVERNMENT-WIDE FINANCIAL STATEMENTS
While separate government-wide and fund financial statements are presented, they are interrelated. The governmental activities column incorporates data from governmental funds and internal service funds, while business-type activities incorporate data from the government’s enterprise funds. Separate financial

Basic Financial Statement City of Bothell
Notes to the Financial Statement 14<< back to table of content (Notes)
statements are provided for governmental funds, proprietary funds, and fiduciary funds, even though the latter are excluded from the government-wide financial statements.
The City’s basic financial statements include both government- wide (reporting the City as a whole) and fund financial statements (reporting the City’s major funds). The government-wide financial statements categorize primary activities as either governmental or business- type.
In the government-wide Statement of Net Position, both the governmental and business-type activities columns (a) are presented on a consolidated basis by column; and (b) are reported on a full accrual, economic resource basis, which recognizes all long-term assets and receivables as well as long- term debt and obligations.
The components of the City’s net position are: net investment in capital assets, restricted net position, and unrestricted net position. The City first utilizes restricted resources to finance qualifying activities. Fiduciary funds are excluded from government-wide statements.
The government-wide Statement of Activities reports both the gross and net cost of each of the City’s functions and business-type activities - general government, security of persons and property, physical environment, transportation, economic environment, mental and physical health, culture and recreation, water, sewer (wastewater), and storm drain (surface water).
General government revenues (property taxes, retail sales & use taxes, business taxes, excise taxes, and other taxes) also support these functions. The Statement of Activities reduces gross expenses (including depreciation) by related program revenues, operating, and capital grants. Program revenues must be directly associated with the functions or a business-type activity.
D. BASIS OF PRESENTATION – FUND FINANCIAL STATEMENTS
The fund financial statements provide information about the government’s funds, including its fiduciary funds and blended component unit. Separate statements for each fund category – governmental, proprietary, and fiduciary – are presented. The emphasis of fund financial statements is on major governmental and enterprise funds, each displayed in a separate column. All remaining governmental and enterprise funds are aggregated and reported as nonmajor funds. Major individual governmental and enterprise funds are reported as separate columns in the fund financial statements. The following is a description of the governmental funds of the City:
Governmental Funds
■ General fund is the government’s primary operating fund. It accounts for all financial resources of the general government, except those accounted for in another fund.
■ Special revenue funds are used to account for the proceeds of specific revenue sources that are legally restricted or committed to expenditures for specified purposes other than debt service or capital projects.

Basic Financial Statement City of Bothell
Notes to the Financial Statement 15<< back to table of content (Notes)
■ Capital project fund accounts for financial resources that are restricted, committed, or assigned for capital outlays (other than those financed by business-type/ proprietary funds).
■ Debt service funds are used to account for financial resources that are restricted, committed, or assigned to expenditures for principle and interest for debt.
Proprietary Funds
Proprietary fund measurement focuses on determining operating income, changes in net position, financial position, and cash flows. Proprietary funds distinguish operating revenues and expenses from non-operating items. Operating revenues and expenses generally result from providing services, and from producing and delivering goods in connection with a proprietary fund’s principle ongoing operation. The principal operating revenues of the City’s Water, Sewer, and Storm & Surface Water Funds are derived from charges to customers for sales and services.
The Water, Sewer, and Storm & Surface Water Funds also recognize fees (operating revenue) intended to recover the cost of connecting new customers to the City’s utility systems. Operating expenses for enterprise funds include the cost of sales and services, administrative expenses and overhead, and depreciation of capital assets. All revenues and expenses not meeting this definition are reported as non-operating revenues and expenses.
The applicable, generally accepted accounting principles are similar to those used by businesses in the private sector. The following is a description of the proprietary funds of the City:
■ Enterprise funds are required to be used (to account for operations) where a fee is charged to external users for goods or services and where the activity (a) is financed with debt that is solely secured by a pledge of the revenues; (b) has third party requirements that the cost of providing services, including capital costs, be recovered with fees and/ or charges; or (c) establishes fees and/ or charges based on a pricing policy designed to recover similar costs.
■ Internal service funds are used to account for the financing of goods or services provided to other City funds on a cost-reimbursement basis.
Fiduciary Funds
The Fiduciary Fund accounts for activities that carry out for the benefit of individuals and other agencies outside of the government such as employee groups, members of the public, and other governments. Fiduciary activities are reported under GASB Statement 84. The Statement establishes criteria for identifying fiduciary activities: (1) whether a government is controlling the assets of the fiduciary activity and (2) the beneficiaries with whom a fiduciary relationship exists. Separate criteria are included to identify fiduciary component units and postemployment benefit arrangements that are fiduciary activities. MAJOR FUNDS
Governmental ActivitiesGeneral FundThe General Fund accounts for all receipt and disbursement transactions of operations that are not accounted for in another fund. The General Fund includes

Basic Financial Statement City of Bothell
Notes to the Financial Statement 16<< back to table of content (Notes)
police, fire, health and social services, parks and recreation, finance and administration, planning, building inspection, community development, parks maintenance, public works and engineering management, and services contracted to other agencies. Beginning in 2019, the Firefighters Pension Fund is now reported in the General Fund in accordance with GASB Statement 73, Accounting and Financial Reporting for Pensions and Related Assets that are not within the scope of GASB Statement No. 68.
Arterial Street FundThe Arterial Street Fund is a special revenue fund used to account for proceeds of restricted revenues dedicated to street construction and transportation improvement projects. The main source of revenue is impact fees. Impact fees are transferred to the Capital Improvement Fund in a reimbursement manner for right-of-way acquisition, design and construction of roadways, sidewalks, street lighting, traffic signals, and landscaping.
Capital Improvement FundThe Capital Improvement Fund accounts for special revenue dedicated to capital projects. The main sources of revenue are real estate excise taxes, mitigation fees, and grants.
Public Safety Capital FundThe Public Safety Capital Fund accounts for voter-approved bond proceeds dedicated towards public safety capital projects, including the construction of two fire stations.
Business-Type Activities
Water FundThis fund is used to account for the provision of water service to a portion of the City. The City does not have its own water supply, but purchases water from the City of Seattle. All activities necessary to provide such service are accounted for in this fund, including administration, maintenance and operations, financing and debt service, and billing and collection. Funding for these activities is provided for by charges to residential and commercial water customers, permit fees, interest earnings, and rental fees. Water system construction was originally financed by revenue bonds and contributed capital.
Sewer FundThis fund is used to account for the provision of sanitary sewer service to a portion of the City. The City of Bothell does not operate a sewage treatment plant, but is connected to the King County Wastewater Treatment System for service on a contract basis.
All activities necessary to provide service are accounted for in this fund, including administration, maintenance, financing and related debt service, and billing and collection. Funding for these activities is provided for by charges to residential and commercial customers, permit fees, interest earnings, and rentals. Sewer system construction was financed originally by a local improvement district, contributed capital, and revenue bonds.

Basic Financial Statement City of Bothell
Notes to the Financial Statement 17<< back to table of content (Notes)
Storm & Surface Water FundThis fund is used to account for the provision of storm drain and surface water services throughout the City. This utility was established to promote public health, safety, and welfare with a comprehensive approach to surface and storm water problems.
This comprehensive approach includes basin planning, land use regulation, facility construction, maintenance, and public education. Because the most cost-effective and beneficial approach to surface and storm water management is through preventative actions and protection of the natural drainage system, the utility gives priority to methods which provide protection or enhancement of the natural surface water drainage system over means primarily involving construction of new drainage facilities or systems.
Funding for these activities comes from charges to real property within the service area. The amount of each charge is based on the degree to which the property contributes to an increase in surface and storm water runoff.
Other Governmental Funds
Street FundThe Public Works Street Division is responsible for evaluating, maintaining, and repairing all roadways, traffic control devices, drainage systems, sidewalks, and roadsides. This division is also responsible for street cleaning, snow and ice removal, and the removal of road debris from traffic lanes.
Park Cumulative Reserve FundThe Park Cumulative Reserve Fund is used for the acquisition and development of parks. Funding is derived from park fees paid by developers.
Drug Forfeiture FundThis fund accounts for monies seized from drug policing activities.
Fire Impact Fees FundFunds collected from developers used solely for the purpose of making capital improvements to accommodate new growth.
Public Safety Levy FundIn 2019, the City created Public Safety Levy Fund to account exclusively for the public safety levy lid lift passed in November 2018 to improve and enhance various public safety resources.
Cemetery Endowment FundThis permanent trust fund was established in 1993 to account for Bothell Pioneer Cemetery plot sales, donations, and investment earnings.

Basic Financial Statement City of Bothell
Notes to the Financial Statement 18<< back to table of content (Notes)
General Obligation (GO) Bond FundsGO Bond Funds are created to provide for the retirement of general purpose bonds issued for City facilities and various capital projects. When capital expenditures are funded by debt authorized by voter approval, the revenues generated to retire these debts come from property taxes. Debt issued that is not guaranteed by property tax revenue depends on other sources of general City revenue in order to retire debt. In 2020, the City began collecting revenue from the Public Safety Levy providing funding to pay the Public Safety GO Bond debt.
Internal Service Funds
Equipment Rental Fund The Equipment Rental Fund is an internal service fund created to provide for maintenance and replacement of City-owned vehicles and equipment. The Finance Department provides administrative and accounting services, while the Public Works Department performs maintenance and repairs.
Self Insurance FundThe Self Insurance Fund accounts for the costs of administering the City’s self-insurance liability, property insurance risks, and employee benefits.
Asset Replacement FundThe Asset Replacement Fund accounts for monies set aside over the useful life of a major asset, to be used for future replacement of the asset.
COB Properties FundThe COB Properties Fund accounts for the activities of the City Hall lease revenue bond issuance, debt services, and maintenance. COB Properties is a blended component unit of the City.
E. MEASUREMENT FOCUS AND BASIS OF ACCOUNTING
The accounting and financial reporting treatment is determined by the applicable measurement focus and basis of accounting. Measurement focus indicates the type of resources being measured such as current financial resources or economic resources. The basis of accounting indicates the timing of transactions or vents for recognition in the financial statements.
The government-wide financial statements are reported using the economic resources measurement focus and the accrual basis of accounting, as are the proprietary funds financial statements. Revenues are recorded when earned and expenses are recorded when a liability is incurred, regardless of the timing of related cash flows. Property taxes are recognized as revenues in the year for which they are levied. Grants and similar items are recognized as revenue as soon as all eligibility requirements imposed by the provider have been met.
The governmental fund financial statements are reported using the current financial resources measurement focus and the modified accrual basis of accounting. Revenues are recognized as soon as they are both measurable and available. Revenues are considered to be available when they are collectible
Basic Financial Statement City of Bothell
Notes to the Financial Statement 19<< back to table of content (Notes)
within the current period or soon enough thereafter to pay liabilities of the current period. For this purpose, the City considers revenues to be available if they are collected within 60 days of the end of the current fiscal period. Expenditures generally are recorded when a liability is incurred, as under accrual accounting. However, debt service expenditures, as well as expenditures related to compensated absences, and claims and judgments, are recorded only when payment is due. General capital asset acquisitions are reported as expenditures in governmental funds. Issuance of long-term debt and acquisitions under capital leases are reported as other financing sources.
Property taxes, sales taxes, and interest associated with the current fiscal period are all considered to be susceptible to accrual and so have been recognized as revenues of the current fiscal period. Entitlements are recorded as revenues when all eligibility requirements are met, including any time requirements, and the amount is received during the period or within the availability period for this revenue source (within 60 days of year-end). Expenditure-driven grants are recognized as revenue when the qualifying expenditures have been incurred and all other eligibility requirements have been met, and the amount is received during the period or within the availability period for this revenue source (within 60 days of year-end). All other revenue items are considered to be measurable and available only when cash is received by the government.
The proprietary funds and fiduciary fund financial statements are all prepared using economic resources measurement focus and the accrual basis accounting as are the government-wide financial statements as stated above.
F. BUDGETARY INFORMATION
Budgetary basis of accountingWashington State law requires governments to adopt a balanced budget. Biennial appropriations are limited to total estimated revenues for the upcoming biennium, plus any unencumbered fund balance estimated to be available at the close of the current fiscal biennium. The City Council’s adopted biennial budget constitutes legal authority for expenditure at the fund level. Three of these are internal service funds, whose costs are allocated (based on usage) to the funds that utilize their services.
Budget transfers or revisions within funds are allowed, however, other budget modifications must be by ordinance, and approved in the same manner as other ordinances of the city - including making the proposed amendments available to the public and providing time for public input.
G. ASSETS, LIABILITIES, DEFERRED OUTFLOWS/INFLOWS OF RESOURCES, AND NET POSITION/FUND BALANCE
Cash and Cash EquivalentsThe City’s cash and cash equivalents are considered to be cash on hand, demand deposits, and all highly liquid investments (including restricted assets) with a maturity of three months or less from date of acquisition.

Basic Financial Statement City of Bothell
Notes to the Financial Statement 20<< back to table of content (Notes)
InvestmentsInvestments for the City are reported at fair value (generally based on quoted market prices) except for the position in the State Treasurer’s Local Government Investment Pool (LGIP). The LGIP manages a portfolio of securities that meet the maturity, quality, diversification and liquidity and market value calculation requirements set forth by the Governmental Accounting Standard Board (GASB) for external investment pools that elect to measure, for financial reporting purposes, investments at amortized cost. Investments are reported on trade date basis in accordance with generally accepted accounting principles (GAAP). (Refer to Note 3)
ReceivablesTaxes receivable consist of property taxes and related interest and penalties (Refer to Note 4). Accrued interest receivable consists of amounts earned on investments, notes, and contracts at the end of the year. Customer accounts receivable consist of amounts owed from private individuals or organizations for goods and services including amounts owed for billings that have not yet been prepared.
Special assessments are recorded when levied. Special assessments receivables consist of current and delinquent assessments and related interest and penalties. Deferred assessments consist of unbilled special assessments that are liens against the property benefited.
Receivables have been reported net of estimated uncollectible accounts. Because property taxes, special assessments, and utility billings are considered liens on property, no estimated uncollectible amounts are established.
Court receivables consist of transactions handled by the Court in a fiduciary capacity such as a restitution, bail and state portion of certain fines and penalties and is reported as an asset, net of estimated uncollectible amounts with an offsetting liability.
InventoriesAll City inventories are maintained on a consumption basis of accounting, where items are purchased for inventory and charged to the budgetary accounts as the items are consumed. Any material inventories at year-end are included in the balance sheet of the appropriate fund. Inventories are carried at cost on the first in, first out (FIFO) basis.
Capital Assets and DepreciationCapital assets include land and land improvements, easements, building and building improvements, vehicles, and equipment. The straight-line method is used for depreciating assets (Refer to Note 6).
Compensated AbsencesThe City accrues accumulated unpaid vacation and associated employee-related costs when earned (or estimated to be earned) by the employees. The non-current portion (the amount estimated to be used in subsequent fiscal years) for governmental funds is maintained as long term liabilities and represents a reconciling item between the balance sheet of the governmental funds and the governmental activities in the statement of net position.

Basic Financial Statement City of Bothell
Notes to the Financial Statement 21<< back to table of content (Notes)
Other Post-Employment BenefitsThe City provides post-retirement health care benefits for members of the Law Enforcement Officers and Fire Fighters (LEOFF) retirement system hired prior to October 1, 1977 under a defined benefit healthcare plan administered by the City. As a single employer defined benefit plan, the City is required to recognize a liability equal to the net OPEB liability measured as of a date no earlier than the employer’s prior fiscal year and no later than the end of the current fiscal year (the measurement date). (Refer to Note 9).
Interfund ActivityInterfund activities include reciprocal activities or interfund services provided and used; and, nonreciprocal activities or interfund transfers (Refer to Note 12).
Deferred Outflows/Inflows of ResourcesIn addition to assets, the Statement of Net Position and Balance Sheet will sometimes report a separate section for deferred outflows of resources. This separate financial statement element represents a consumption of net position that applies to a future period(s) and so will not be recognized as an outflow of resources (expense/expenditure) until then. The City has only one item that qualifies for reporting in this category in the Statement of Net Position. It is the amount related to pensions.
In addition to liabilities, the Statement of Net Position/Balance Sheet will sometimes report a separate section for deferred inflows of resources. This separate financial statement element represents an acquisition of net position that applies to a future period(s) and so will not be recognized as an inflow of resources (revenue) until that time. The City has only one item that qualifies for reporting in this category in the Statement of Net Position. It is the amount related to pensions. Unavailable revenues in the Balance Sheet, such as property taxes, are deferred and recognized as an inflow of resources in the period that the amounts become available.
Long-Term ObligationIn government-wide financial statements and proprietary funds types in the fund financial statements, long-term debt and other long-term obligations are reported as liabilities in the applicable governmental activities, business-type activities, or proprietary fund type Statement of Net Position. Bond premiums and discounts are deferred and amortized over the life of the bonds using the straight-line method. Bonds payable are reported net of the applicable bond premium or discount.
In the fund financial statements, governmental fund types recognize bond premiums and discounts, as well as bond issuance costs, during the current period. The face amount of debt issued is reported as other financing sources. Premiums received on debt issuances are reported as other financing sources while discounts on debt issuances are reported as other financing uses. Issuance costs, whether or not withheld from the actual debt proceeds received, are reported as debt service expenditures.
Net Position Flow AssumptionSometimes the government will fund outlays for a particular purpose for a particular purpose from both restricted (e.g., restricted bond or grant proceeds)

Basic Financial Statement City of Bothell
Notes to the Financial Statement 22<< back to table of content (Notes)
and unrestricted resources. In order to calculate the amounts to report as restricted - net position and unrestricted - net position in the government-wide and proprietary fund financial statements, a flow assumption must be made about the order in which the resources are considered to be applied.
Flow AssumptionsWhen the option is available to use restricted or unrestricted resources for any purpose, the City expends restricted resources first. When the option is available to use committed, assigned, or unassigned resources for any purpose, the City expends committed resources before assigned resources, and assigned resources before unassigned resources. However, prior to the commencement of any project, the flow assumption is reviewed to ensure that the proper resources are being used.
Fund BalanceFund balance of governmental funds is reported in various categories based on the nature of any limitations requiring the use of resources for specific purposes. The government itself can establish limitations on the use of resources through either a commitment (committed fund balance) or an assignment (assigned fund balance). Fund balance classifications from the most restrictive to no restrictions are as follows:
■ Nonspendable – Fund resources that are not in a spendable form (such as inventory), or that are required to be maintained intact (such as the corpus of an endowment fund).
■ Restricted – Fund resources that are subject to restrictions legally enforceable by outside parties (such as grantors, bondholders, or higher levels of government) through constitutional provisions, or by enabling legislation.
■ Committed – Fund resources that are legally limited by the government’s highest level of decision-making authority (City Council). These resources cannot be used for any other purpose unless the government takes the same highest-level action (Resolution by City Council) to modify or eliminate those limitations.
■ Assigned – Fund resources that are limited by a government for its intended use. Intent can be expressed by the governing body (Council, City Manager, or Directors) to which the governing body delegates the authority. Little or no formal action is required to modify or eliminate those limitations.
■ Unassigned – Unrestricted fund resources that are not committed or assigned in the General Fund. Only positive unassigned fund balances are reported in the General Fund. Negative fund balances in any other governmental fund are considered unassigned.
H. PROPRIETARY FUNDS OPERATING AND NONOPERATING REVENUES AND EXPENSES
Proprietary funds distinguish operating revenues and expenses from nonoperating items. Operating revenues and expenses generally result from providing services and producing and delivering goods in connection with a proprietary fund’s principal ongoing operations. The principal operating revenues are charges to customers for sales and services to recover the cost of providing goods and services. Operating expenses for enterprise funds and internal service funds include the cost of sales and services, administrative expenses, and depreciation on capital assets. All revenues and expenses not meeting this definition are reported as nonoperating revenues and expenses.

Basic Financial Statement City of Bothell
Notes to the Financial Statement 23<< back to table of content (Notes)
NOTE 2COMPLIANCE AND ACCOUNTABILITY
The City of Bothell budgets its funds in accordance with the Revised Code of Washington (RCW) 35A.34. There have been no material violations of finance-related legal or contractual provisions, and no expenditures have exceeded legal appropriations in any City funds. GAAP serves as the budgetary basis of accounting.
AMENDING THE BUDGET
The budget, as adopted, constitutes the legal authority for expenditures. The City’s budget is adopted at the fund level, so that expenditures may not legally exceed appropriations at that level of detail. Transfers or revisions within funds are allowed, but the City Council must approve supplemental or additional appropriations. The City's budget was amended on three occasions during the fiscal year.
The accompanying supplementary information presents both the original and amended budgetary information as approved. All appropriations, except for capital projects and restricted revenues, lapsed 20 days following the end of the biennium. Unexpended resources must be re-appropriated in a subsequent period.
PROCEDURES FOR ADOPTING THE ORIGINAL BUDGETThe City’s biennial budget procedures are mandated by the Revised Code of Washington, Chapter 35A.34. Steps in the budget process are as follows:
1) Prior to October 1, the City Manager submits a proposed operating budget to the Council or the fiscal year commencing the following January 1. The operating budget includes proposed expenditures/expenses and the means of financing them.
2) A public hearing is conducted to obtain taxpayer comments.
3) During the month of December, the budget is legally enacted through the passage of an ordinance.
4) Revisions that alter any fund’s appropriation must be approved by the City Council.
MARCHDepartment
Request Presentations
APRILBalancing &
Number Crunching
MAYCity Manager
Proposal Unveiled
JUNEDepartment
Request Presentations
JULY - AUGUSTBalancing &
Number Crunching
SEPTEMBERFinalizing and Publishing the
Budget Document
OCTOBERCity Manager’s Budget
Proposal Unveiled
OCTOBER - NOVEMBERCity Council
Budget Deliberation
NOVEMBER - DECEMBERFinalizing and Adopting
the Budget

Basic Financial Statement City of Bothell
Notes to the Financial Statement 24<< back to table of content (Notes)
NOTE 3 DEPOSITS AND INVESTMENTS
DEPOSITS
The City’s deposits and certificates of deposit are entirely covered by the Federal Depository Insurance Corporation (FDIC), or by collateral held in a multiple financial institution collateral pool administered by the Washington Public Deposit Protection Commission (PDPC). The PDPC is a statutory authority established under Chapter 39.58 of the Revised Code of Washington. Deposits and investments are governed by the City’s financial policies and are aligned with best practices focusing on strong internal controls to minimize risk of loss. In accordance with Washington State law, the deposit of all cash and cash-like items are to be deposited within 24 hours of receipt. Interest income and investment gains and losses from all idle funds are to be credited to the General Fund to the greatest extent allowable under State law.
INVESTMENTS
The City’s policy is to invest in a manner that provides maximum security, while meeting daily cash flow demands, conforming to all state and local statues governing the investment of public funds, while providing a market rate of return through budgetary and economic cycles. The primary objectives in priority order of the City’s investment activities are Safety, Liquidity, Return on Investment.
All municipal corporations in Washington State are empowered to invest in securities authorized by the Revised Code of Washington Chapter 39.59 and 35.39. As required by state law, authorized investments of the City’s funds are:
■ obligations of the United States or its agency, or any corporation wholly owned by the government of the United States;
■ obligations of the State of Washington, general obligations of Washington State municipalities;
2019-2020 Final Budget Inflows and OutflowsFund Original Inflows Original Outflows Final Inflows Final Outflows
General Fund 110,830,580 111,262,007 111,375,580 111,795,007Street Fund 12,061,100 12,264,880 12,061,100 12,264,880Arterial Street Fund 7,404,438 5,105,192 7,404,438 5,105,192Park Cumulative Reserve Fund 2,184,000 153,000 2,184,000 153,000Drug Seizure Fund 115,000 28,800 115,000 57,600Fire Impact Fee Fund 360,000 360,000Public Safety Levy Fund 10,847,000 8,811,314LIFT General Obligation Bond 3,995,100 3,995,100 3,995,100 3,995,1002013 GO Bond 1,393,926 1,393,926 1,393,926 1,393,926Public Safety GO Bond 1,650,000 1,650,000Capital Improvements Fund 65,486,124 70,695,623 70,415,124 76,710,623Public Safety Capital Fund 26,500,000 25,500,000Water Fund 11,934,398 14,937,192 11,934,398 15,937,192Sewer Fund 16,605,575 20,603,686 16,605,575 21,603,686Storm & Surface Water Fund 14,140,451 19,199,295 14,140,451 20,314,295Equipment Rental Fund 4,697,604 4,697,598 4,697,604 4,697,598Self Insurance Fund 3,640,054 3,640,055 3,640,054 3,640,055Asset Replacement Fund 3,606,165 6,356,941 3,606,165 6,356,941Firemen's Pension Reserve Fund 128,950 128,950 128,950 128,950Total 258,583,465 274,462,245 303,054,465 320,115,359
Basic Financial Statement City of Bothell
Notes to the Financial Statement 25<< back to table of content (Notes)
■ the State Treasurer’s Local Government Investment Pool (LGIP);
■ certificates of deposit with Washington State banks and savings and loan institutions;
■ banker’s acceptances, commercial paper and corporate notes purchased on the secondary market. Investing in corporate notes, the City must adhere to the investment policies and procedures adopted by Washington State Investment Board.
The LGIP manages a portfolio of securities that meet the maturity, quality, diversification and liquidity and market value calculation requirements set forth by the Governmental Accounting Standard Board (GASB) for external investment pools that elect to measure, for financial reporting purposes, investments at amortized cost. The funds are limited to high quality obligations with regulated maximum and average maturities to minimize both market and credit risk. Investments are reported on trade date basis in accordance with generally accepted accounting principles (GAAP).
The City measures and records its investments except for LGIP within the fair value hierarchy established by generally accepted accounting principles. The hierarchy is based on the valuation inputs used to measure the fair value of the asset. The guidelines in GASB 72 recognize a three-tiered fair value hierarchy as follows:
■ Level 1: Quoted prices in active markets for identical assets or liabilities that the government can access at the measurement date. Observable markets include exchange markets, dealer markets, brokered markets and principal-to-principal markets.
■ Level 2: These are inputs other than quoted prices included within Level 1 that are observable for the asset or liability (such as interest rates, yield curves, volatilities, credit spreads). Inputs are derived from or corroborated by observable market data through correlation including quoted prices for similar assets or liabilities in active markets or inactive markets.
■ Level 3: Unobservable inputs for an asset or liability. Only should be used when relevant Level 1 and 2 inputs are unavailable.

Basic Financial Statement City of Bothell
Notes to the Financial Statement 26<< back to table of content (Notes)
As of December 31, 2020, the City-wide’s cash and investments are as follows:
Governmental Funds Internal Service Funds Enterprise Funds Fiduciary Funds Total
Cash on hand $1,750 $1,750
Deposits with financial institutions 3,493,531 523,016 820,747 66,029 $4,903,323
Deposits in trust 276,939 $276,939
Local Government Investment Pool 42,748,985 1,200,000 3,250,000 $47,198,985
All other investments 5,717,451 1,100,000 17,028,407 $23,845,857
Total cash and investments $51,961,717 $3,099,955 $21,099,154 66,029 $76,226,855
Investment Fair Value Measurement As of December 31, 2020
Not Measured at Fair Value
Quoted Prices in Active Markets for Identical
Assets
Significant Other Observable Inputs
Significant Unobservable Inputs
Total Level 1 Level 2 Level 3 Amortized Cost
U.S. Agencies $12,207,073 $12,207,073Supranational Agency 6,047,945 6,047,945 Municipal Bonds 3,056,690 3,056,690 Corporate Bonds 2,534,149 2,534,149 Local Government Investment Pool 47,198,985 47,198,985 Total investments $71,044,842 $23,845,857 $47,198,985
Fair Value Measurements Using
As of December 31, 2020, the City’s investments, excluding the Local Government Investment Pool (LGIP) are classified as Level 2 as the chart below.

Basic Financial Statement City of Bothell
Notes to the Financial Statement 27<< back to table of content (Notes)
Cash and investments listed by fund type:
Special Revenue Fund Capital Project Fund Capital Project Fund Other Capital Public Safety Governmental
Governmental Funds General Fund Arterial Street Improvement Capital Funds TotalCash on hand $1,750 $1,750Deposits with financial institutions 1,952,632 256,105 287,394 997,399 3,493,531 Investments 9,425,879 3,000,000 1,900,000 23,316,377 10,824,179 48,466,436 Total cash and investments $11,380,262 $3,256,105 $2,187,394 $23,316,377 $11,821,579 $51,961,717
Internal Storm & Surface Service
Proprietary Funds Water Sewer Water Total FundsDeposits with financial institutions 201,452 $201,171 $418,124 $820,747 $523,016Deposits held in trust 276,939 Investments 4,190,215 6,307,503 8,464,320 18,962,038 2,300,000 Investments-reserved 109,785 292,497 914,086 1,316,369 Total cash and investments $4,501,452 $6,801,171 $9,796,530 $21,099,154 $3,099,955
Internal Service Funds Equipment Rental Self Insurance Asset Replacement COB Properties TotalDeposits with financial institutions $185,570 $129,113 $208,334 $523,016Investments 2,300,000 $2,300,000Deposits held in trust 276,939 $276,939Total cash and investments $185,570 $129,113 $2,508,334 $276,939 $3,099,955
Business-Type Activities Primary Government
Primary GovernmentGovernmental Funds Internal Service Funds Total Enterprise Funds
Total
Cash on hand $1,750 $1,750 $1,750Deposits with financial institutions 3,493,531 523,016 $4,016,547 820,747 4,837,294 Deposits held in trust 276,939 276,939 276,939 Investments 48,466,436 2,300,000 50,766,436 18,962,038 69,728,474 Investments-reserved 1,316,369 1,316,369
Total Cash, Deposit and Investments $51,961,717 $3,099,955 $55,061,672 $21,099,154 $76,160,826
Fiduciary FundsPrivate-Purpose Trust
Funds Custodial Fund Total
Deposits with financial institutions $41,015 $25,014 $66,029Total cash and investments $41,015 $25,014 $66,029
Enterprise Funds
Governmental Activities

Basic Financial Statement City of Bothell
Notes to the Financial Statement 28<< back to table of content (Notes)
Investment Portfolio and Maturity As of December 31, 2020
Book Fair Market Weighted Avg. Portfolio Value Value Year 1 Year 2 Year 3 Year 4 Year 5 Maturity in Years Allocation
Supranational Agency 5,730,386 6,047,945 2,859,600 3,188,346 2.05 8.51%
Municipal Bonds 2,959,220 3,056,690 1,009,250 2,047,440 1.67 4.30%
Corporate Bonds 2,478,248 2,534,149 1,000,649 1,533,500 2.13 3.57%
U.S. Agencies 11,873,916 12,207,073 4,990,135 3,058,885 4,158,054 2.27 17.18%
Local Government Investment Pool 47,198,985 47,198,985 47,198,985 1.00 66.44%
Total investments 70,240,756 71,044,842 57,058,618 6,639,825 3,188,346 4,158,054 1.36 100%
Fair Value Investment Maturity (Year)
Credit Risk: Credit risk is the risk that an issuer or other counterparty to an investment may not fulfill its obligations. State law limits investments in commercial paper, corporate bonds, and mutual bond funds to the top two ratings issued by nationally recognized statistical rating organizations. The City has no investment policy that would further limit its investment choices.
Concentration of Credit Risk: Concentration of risk is the risk of loss attributed to the magnitude of an investment in a single issuer. The City diversifies its investments by security type and issuer. With the exception of US Treasury securities and authorized state pools, no more than 50% of the City’s total investment portfolio will be invested in any one security issue. As of December 31, 2020, the City’s concentration of investment portfolio is as follows:
Interest Rate Risk: Interest rate risk is the risk that changes in the interest rates of debt instruments that adversely affect the fair value of an investment. The City does not have a formal investment policy that limits investment maturities as a means of managing its exposure to fair value losses arising from increasing interest rates. It does have a policy whereby the City cannot invest in securities maturing more than five (5) years from date of purchase. The chart below exemplified the City’s investment portfolio and maturity data.

Basic Financial Statement City of Bothell
Notes to the Financial Statement 29<< back to table of content (Notes)
Investment List by Issuer:
Investment Type Fair Market Value % of Investment Portfolio Credit Rating
Corporate Bonds:Wells Fargo Bank Notes 1,000,649 1.41% Aa2/A+Microsoft 1,533,500 2.16% Aaa/AAA
Total Corporate Bonds 2,534,149 3.57%Municipal Bonds:
Washing St GO Bonds 1,009,250 1.42% Aa1/AA+Connecticut St Txbl - Ser A 2,047,440 2.88% A+
Total Municipal Bonds 3,056,690 4.30%
US Agency Securities
FNMA GEN STRI 948,299 1.33% AAAFEDERAL HOME LOAN BANK 3,034,582 4.27% NRFFCB 4,111,380 5.79% AAAFANNIE MAE 2,042,558 2.88%FARMER MAC 2,070,254 2.91%
Total Agency Securities 12,207,073 17.18%
Supranational Agency: European Bk Recon & Dev 2,859,600 4.03% Aaa/AAA/AAAIntl-American Dev Bk 1,046,646 1.47% Aaa/AAA/AAAIntl Fin. Corp. 1,067,180 1.50% Aaa/AAA/AAAIntl Bk Recon & Dev. (IBRD/World Bk) 1,074,520 1.51% Aaa/AAA/AAA
Total Supranational Agency Securities 6,047,945 8.51%
Local Government Inbestment Pool 47,198,985 66.44%GRAND TOTAL 71,044,842 100.00%

Basic Financial Statement City of Bothell
Notes to the Financial Statement 30<< back to table of content (Notes)
NOTE 4PROPERTY TAXES
The county treasurer acts as an agent to collect property taxes levied in the county for all taxing authorities. Taxes are levied annually on January 1 on property values listed as of the prior May 31. Assessed values are established by the county assessor at 100% of fair market value. A revaluation of all property is required every four years.
Taxes are due in two equal installments on April 30 and October 31. Tax liens are automatic at the point the taxes are levied. No allowance for uncollectible taxes is established, since delinquent taxes are considered fully collectible. The county treasurer remits collections monthly to the appropriate district.
The City is permitted by law to levy up to $3.60 per $1,000 of assessed valuation for general governmental services, minus a library rate of $0.50. This amount may be reduced for any of the following three reasons:
1) Washington State law (RCW 84.55.010) limits the growth of regular property taxes to 1% per year, after adjustments for new construction. If the assessed valuation increases by more than 1% due to revaluation, the levy rate will be decreased.
2) The Washington State Constitution limits total regular property taxes to 1% of assessed valuation, or $10 per $1,000 of value. If the taxes of all districts exceed this amount, each is proportionately reduced until the total is at or below the 1% limit.
3) The City may voluntarily levy taxes below the legal limit.
Special levies approved by the voters are not subject to the above limitations.
In 2020, the City’s levy rate was $1.96 per $1,000, which included a $0.40 per $1,000 for Safe Streets and Sidewalks levy, $0.41 per $1.00 for Public Safety levy and $0.13 for Public Safety bond. Bothell’s total assessed valuation was $12,385,900,325.
Snohomish County $5,228,696,561King County 7,157,203,764
Total $12,385,900,325
2020 Assessed Valuation
January 01 Taxes are levied and become an enforceable lien against properties.
February 14 Tax bills are mailed.
April 30 First of two equal installment payments is due.
May 31 Assessed value of property established for next year's levy at 100% of market value.
October 31 Second installment is due.
Property Tax Calendar

Basic Financial Statement City of Bothell
Notes to the Financial Statement 31<< back to table of content (Notes)
NOTE 5DEFERRED INFLOWS AND OUTFLOWS OF RESOURCES
Deferred Outflows of Resources at December 31, 2020 are as follows:
Deferred inflows of resources in the governmental funds balance sheet were recognized as revenue sources except for advanced grants, as consolidating into government-wide statements based upon accrual basis of accounting.
Deferred Inflows and Outflows of Resources Description Governmental Funds
Court services $240,558Deferred EMS services 238,684Deferred property tax 289,698Deferred revenue-impact fees 19,533Advanced grant 275
Total $788,748
Deferred Inflows of Resources - Governmental Funds Balance Sheet
Deferred Inflows and Outflows of Resources Governmental Business-Type
Description Activities Activities
Pension $4,581,135 $325,667Other Postemployment Benefits (OPEB) 64,495
Total $4,645,630 $325,667
Pension $3,775,864 $321,100Advanced Grant 275 12,909
Total $3,776,139 $334,009
Deferred Outflows of Resources - Government-Wide Statement of Net Position
Deferred Inflows of Resources - Government-wide Statement of Net Position

Basic Financial Statement City of Bothell
Notes to the Financial Statement 32<< back to table of content (Notes)
NOTE 6CAPITAL ASSETS AND DEPRECIATION
GENERAL POLICIES
Major expenditures for property including land, buildings, or equipment having an initial value of more than $5,000 are capitalized. Assets may be acquired through donation, annexation, gift, purchase, capital lease, or self-construction work in progress with a life expectancy of more than one year.
All capital assets are valued at historical cost, or estimated cost where historical cost is not known, or acquisition value for donated assets, or the lower of cost or fair market value when transferred between proprietary and governmental funds.
The City has acquired certain assets with funding provided by federal financial assistance programs. Depending on the terms of the agreements involved, the federal government could retain an equity interest in these assets. However, the City has sufficient legal interest to accomplish the purposes for which the assets were acquired, and has included such assets within the applicable statements.
GOVERNMENTAL CAPITAL ASSETS
Governmental long-lived assets of the City (purchased, leased, or constructed) are recorded as expenditures in the governmental funds and are capitalized, net of depreciation, in the government-wide statements. This includes current year purchases of governmental infrastructure assets.
During the 2019 audit, the City identified a miscalculation in the depreciation expense for a bridge between fiscal years 2007 and 2010. This resulted in an overstatement of accumulated depreciation, and an understatement of book value by $6,121,043. The City corrected the error in 2020, which is shown as a prior period adjustment in the Statement of Activities and described in Note 22.
PROPRIETARY FUND CAPITAL ASSETS
Capital assets of proprietary funds are capitalized in their respective statement of net position.
DEPRECIATION
Depreciation on all assets is provided on the straight-line basis over the following estimated useful lives:
■ Building and structures 30-50 years
■ Other improvements 20-60 years
■ Machinery and equipment 5-20 years
■ Vehicles 5-20 years
■ Infrastructure 20-50 years

Basic Financial Statement City of Bothell
Notes to the Financial Statement 33<< back to table of content (Notes)
■ Vehicles 5-20 years
■ Infrastructure 20-50 years
Depreciation expense was charged to government and business-type activities as follows:
In 2020, the City completed major projects and capital acquisitions which increased capital assets over $5 million. The capitalization is as follows:
Depreciation expense was charged to government and business-type activities as follows:Government Activities Amount
General government 2,104,921 Security of persons & property 845,636 Transportation 38,514,357 Physical environment 2,248,325 Culture & recreation 587,624
Total Governmental Activities Depreciation Expense 44,300,863
Business-Type Activities AmountWater 851,200 Sewer 612,384 Storm & Surface Water 1,310,411
Total Business-Type Activities Depreciation Expense 2,773,994
Major Projects:19th Ave NE & 232nd St SE Pedestrian & Bicycle Improvements
Governmental Fund $3,099,890
Total 19th Ave NE & 232nd St SE Pedestrian & Bicycle Improvements $3,099,890
7th Ave SE & 88th Ave NE Non-Motorized Sidewalk Improvements
Governmental Fund $822,102
Total 7th Ave SE & 88th Ave NE Non-Motorized Sidewalk Improvements $822,102
Downtown Revitalization Utility Improvements
Water Fund $200,381
Total Downtown Revitalization Utility Improvements $200,381
Sewer Main Project
Sewer Fund $997,945
Total Sewer Main Project $997,945
Total Governmental and Enterprise Capital Costs $5,120,318

Basic Financial Statement City of Bothell
Notes to the Financial Statement 34<< back to table of content (Notes)
Construction Commitments as of December 31, 2020Construction in Remaining Construction in Remaining
Government Activities Progress Commitment Business-Type Activities Progress Commitment1st Lt Nicholas Memorial Park $193,936 $8,320 Bloomberg Reservoir Painting $13,1317th Ave SE/88th Ave NE Non-Motorized Imp 38,000 Downtown Revitalization Utility - Water19th Ave NE & 232nd St SE Ped & Bike Imp (1,646) 65,144 Morningside Booster Station Retrofit 111,459102nd Ave NE Downtown Access Imp 16,765 Water Main Replacement 480,897130th Pl NE & 132nd Ave NE Sidewalk 199 Sewer Main Replacement Program 50,775 64,224228th St SE Pavement Preservation Lift Station #1 7,223 6,377228th St SE Widening (from 35th to 39th) 71,713 53,630 Lift Station #4 96,686 11,947Adaptive Signal Control Phase 1 26,780 236th St & 35th Ave Culvert Replace 43,848Adaptive Signal Control Phase 2 6,447 Annual Stormwater Capital Projects 300,145Annual Arterial Overlay Program 115,349 488,214 Blyth Creek Erosion Control 206,012 108,588 Beardslee Widening Campus to I405 12,379 Downtown Revitalization Utility - Storm 15,001 Bicycle Program 39,612 9,248 Monte Villa Drainage Improvements 304,985 119,694 Blyth Park Improvements 66,825 Parr Creek Flood Mitigation 474,817 16,941 Bothell Way Widening 97,797 Perry Creek & 228th St SE Culverts 310,296 7,597Bridge Rehab & Seismic retrofit 79,111 Sammamish River & Waynita Creek Restoration 30,178Canyon Park Subarea Update 96,573 11,247 Total Business-Type Activities $2,430,453 $350,371Citywide Child Ped School & Park Zone Safety 10,992 Collector Corridor Traffic Program 638 Crosswalk ProgramDowntown Soil/Ground Cleanup 9,399,505 1,660,555 East Norway Hill Improvements 44,274 394 Fire Station 42 - Downtown 1,505,984 16,899,588 Fire Station 45 - Canyon Park 1,156,954 16,899,588 Horse Creek Plaza 196,817 85,349 Joint Fire ServicesJuanita-Woodinville Way/NE 160th Overlay 45,160 Main Street Extension 270,035 Meridian Ave S & 240th St SE Roundabout 1,003 NE 185th Improvements 233,606 NE 188th St Non-Motorized Imp 2,192,025 627,322 North Creek Field 3 74,950 North Creek Trail Section 4 731,503 86,795 Park at Bothell Landing 143,117 Park at Bothell Landing Bridge Replacement 2,395,768 281,642 Park Master Planning 32,687 Pop Keeney Road 225,449 Safety Upgrade & Replacement Program 9,750 Sammamish River Bridge Retrofit 758,757 149,268 Sidewalk/Walkway Program 17,532 SR 522 Stage 2B Improvements 102,672 SR 522 Stage 3 Improvements Phase 1 20,388,845 7,352,009 Stream Rockery Repair 12,305
Total Governmental Activities $40,680,751 $44,807,729
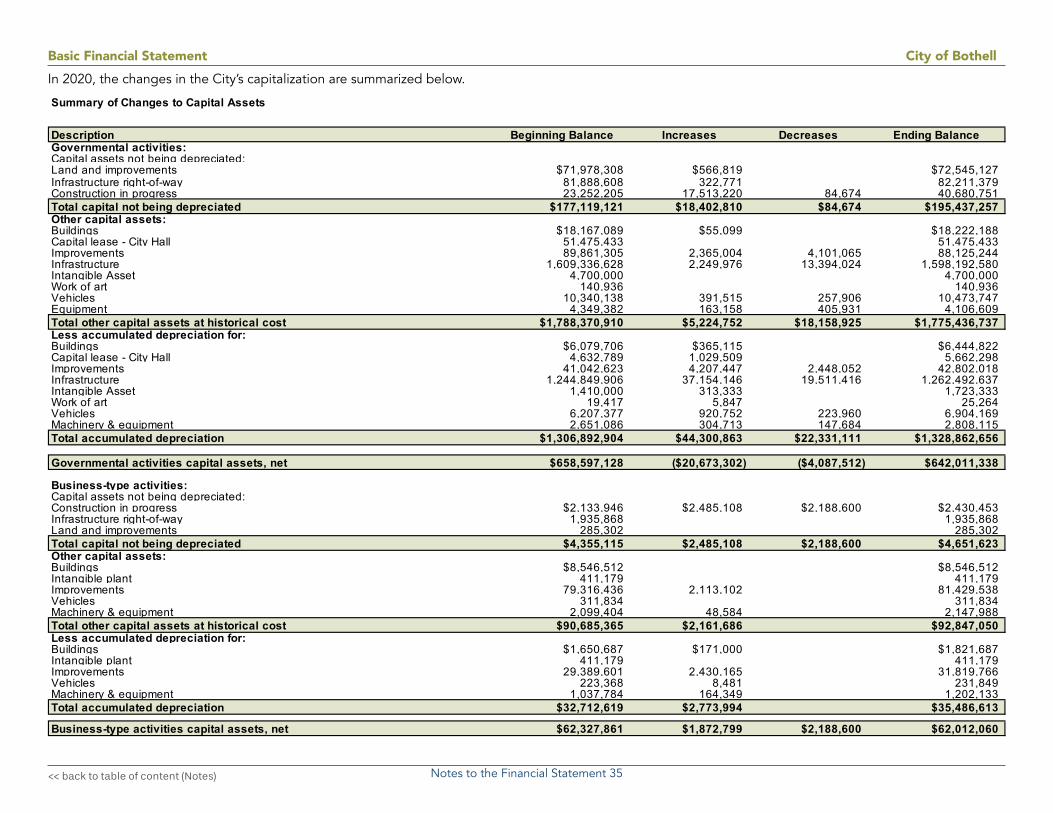
Basic Financial Statement City of Bothell
Notes to the Financial Statement 35<< back to table of content (Notes)
In 2020, the changes in the City’s capitalization are summarized below.
Description Beginning Balance Increases Decreases Ending BalanceGovernmental activities:Capital assets not being depreciated:Land and improvements $71,978,308 $566,819 $72,545,127Infrastructure right-of-way 81,888,608 322,771 82,211,379 Construction in progress 23,252,205 17,513,220 84,674 40,680,751 Total capital not being depreciated $177,119,121 $18,402,810 $84,674 $195,437,257Other capital assets:Buildings $18,167,089 $55,099 $18,222,188Capital lease - City Hall 51,475,433 51,475,433 Improvements 89,861,305 2,365,004 4,101,065 88,125,244 Infrastructure 1,609,336,628 2,249,976 13,394,024 1,598,192,580 Intangible Asset 4,700,000 4,700,000 Work of art 140,936 140,936 Vehicles 10,340,138 391,515 257,906 10,473,747 Equipment 4,349,382 163,158 405,931 4,106,609 Total other capital assets at historical cost $1,788,370,910 $5,224,752 $18,158,925 $1,775,436,737Less accumulated depreciation for:Buildings $6,079,706 $365,115 $6,444,822Capital lease - City Hall 4,632,789 1,029,509 5,662,298 Improvements 41,042,623 4,207,447 2,448,052 42,802,018 Infrastructure 1,244,849,906 37,154,146 19,511,416 1,262,492,637 Intangible Asset 1,410,000 313,333 1,723,333 Work of art 19,417 5,847 25,264 Vehicles 6,207,377 920,752 223,960 6,904,169 Machinery & equipment 2,651,086 304,713 147,684 2,808,115 Total accumulated depreciation $1,306,892,904 $44,300,863 $22,331,111 $1,328,862,656
Governmental activities capital assets, net $658,597,128 ($20,673,302) ($4,087,512) $642,011,338
Business-type activities:Capital assets not being depreciated:Construction in progress $2,133,946 $2,485,108 $2,188,600 $2,430,453Infrastructure right-of-way 1,935,868 1,935,868 Land and improvements 285,302 285,302 Total capital not being depreciated $4,355,115 $2,485,108 $2,188,600 $4,651,623Other capital assets:Buildings $8,546,512 $8,546,512Intangible plant 411,179 411,179 Improvements 79,316,436 2,113,102 81,429,538 Vehicles 311,834 311,834 Machinery & equipment 2,099,404 48,584 2,147,988 Total other capital assets at historical cost $90,685,365 $2,161,686 $92,847,050Less accumulated depreciation for:Buildings $1,650,687 $171,000 $1,821,687Intangible plant 411,179 411,179 Improvements 29,389,601 2,430,165 31,819,766 Vehicles 223,368 8,481 231,849 Machinery & equipment 1,037,784 164,349 1,202,133 Total accumulated depreciation $32,712,619 $2,773,994 $35,486,613
Business-type activities capital assets, net $62,327,861 $1,872,799 $2,188,600 $62,012,060
Summary of Changes to Capital Assets

Basic Financial Statement City of Bothell
Notes to the Financial Statement 36<< back to table of content (Notes)
NOTE 7PENSION PLANS
The following table represents the aggregate pension amounts for all State sponsored plans for the year 2020:
State Sponsored Pension Plans
Substantially, the City’s full-time and qualifying part-time employees participate in one of the following statewide retirement systems administered by the Washington State Department of Retirement Systems, under cost-sharing, multiple-employer public employee defined benefit and defined contribution retirement plans. The state Legislature establishes, and amends, laws pertaining to the creation and administration of all public retirement systems.
The Department of Retirement Systems (DRS), a department within the primary government of the State of Washington, issues a publicly available comprehensive annual financial report (CAFR) that includes financial statements and required supplementary information for each plan. The DRS CAFR may be obtained by writing to:
Department of Retirement Systems Communications UnitP.O. Box 48380Olympia, WA 98540-8380
The DRS CAFR may be downloaded from the DRS website at www.drs.wa.gov/.
Public Employees’ Retirement System (PERS)
PERS members include elected officials; state employees; employees of the Supreme, Appeals and Superior Courts; employees of the legislature; employees of district and municipal courts; employees of local governments; and higher education employees not participating in higher education retirement programs. PERS is comprised of three separate pension plans for membership purposes. PERS plans 1 and 2 are defined benefit plans, and PERS plan 3 is a defined benefit plan with a defined contribution component.
Pension liabilities ($6,682,463)Pension assets $9,569,760Deferred outflows of resources $4,906,802Deferred inflows of resources ($4,096,964)Pension expense/expenditures $846,477
Aggregate Pension Amounts – All Plans

Basic Financial Statement City of Bothell
Notes to the Financial Statement 37<< back to table of content (Notes)
PERS Plan 1 provides retirement, disability and death benefits. Retirement benefits are determined as two percent of the member’s average final compensation (AFC) times the member’s years of service. The AFC is the average of the member’s 24 highest consecutive service months. Members are eligible for retirement from active status at any age with at least 30 years of service, at age 55 with at least 25 years of service, or at age 60 with at least five years of service. Members retiring from active status prior to the age of 65 may receive actuarially reduced benefits. Retirement benefits are actuarially reduced to reflect the choice of a survivor benefit. Other benefits include duty and non-duty disability payments, an optional cost-of-living adjustment (COLA), and a one-time duty-related death benefit, if found eligible by the Department of Labor and Industries. PERS 1 members were vested after the completion of five years of eligible service. The plan was closed to new entrants on September 30, 1977.
ContributionsThe PERS Plan 1 member contribution rate is established by State statute at 6 percent. The employer contribution rate is developed by the Office of the State Actuary and includes an administrative expense component that is currently set at 0.18 percent. Each biennium, the state Pension Funding Council adopts Plan 1 employer contribution rates. The PERS Plan1 required contribution rates (expressed as a percentage of covered payroll) for 2020 were as follows:
*For employees participating in JBM, the contribution rate was 12.26%
PERS Plan 1Actual Contribution Rates Employer Employee*
January - August 2020:PERS Plan 1 7.92% 6.00%PERS Plan 1 UAAL 4.76%Administrative Fee 0.18%Total 12.86% 6.00%September - December 2020:PERS Plan 1 7.92% 6.00%PERS Plan 1 UAAL 4.87%Administrative Fee 0.18%Total 12.97% 6.00%
PERS Plan 2/3 provides retirement, disability and death benefits. Retirement benefits are determined as two percent of the member’s average final compensation (AFC) times the member’s years of service for Plan 2 and 1 percent of AFC for Plan 3. The AFC is the average of the member’s 60 highest- paid consecutive service months. There is no cap on years of service credit. Members are eligible for retirement with a full benefit at 65 with at least five years of service credit. Retirement before age 65 is considered an early retirement. PERS Plan 2/3 members who have at least 20 years of service credit and are 55 years of age or older, are eligible for early retirement with a benefit that is reduced by a factor that varies according to age for each year before age 65. PERS Plan 2/3 members who have 30 or more years of service credit and are at least 55 years old can retire under one of two provisions:
■ With a benefit that is reduced by three percent for each year before age 65; or
■ With a benefit that has a smaller (or no) reduction (depending on age) that imposes stricter return-to-work rules.

Basic Financial Statement City of Bothell
Notes to the Financial Statement 38<< back to table of content (Notes)
PERS Plan 2/3 members hired on or after May 1, 2013 have the option to retire early by accepting a reduction of five percent for each year of retirement before age 65. This option is available only to those who are age 55 or older and have at least 30 years of service credit. PERS Plan 2/3 retirement benefits are also actuarially reduced to reflect the choice of a survivor benefit. Other PERS Plan 2/3 benefits include duty and non- duty disability payments, a cost-of-living allowance (based on the CPI), capped at three percent annually and a one-time duty related death benefit, if found eligible by the Department of Labor and Industries. PERS 2 members are vested after completing five years of eligible service. Plan 3 members are vested in the defined benefit portion of their plan after ten years of service; or after five years of service if 12 months of that service are earned after age 44.
PERS Plan 3 defined contribution benefits are totally dependent on employee contributions and investment earnings on those contributions. PERS Plan 3 members choose their contribution rate upon joining membership and have a chance to change rates upon changing employers. As established by statute, Plan 3 required defined contribution rates are set at a minimum of 5 percent and escalate to 15 percent with a choice of six options. Employers do not contribute to the defined contribution benefits. PERS Plan 3 members are immediately vested in the defined contribution portion of their plan.
ContributionsThe PERS Plan 2/3 employer and employee contribution rates are developed by the Office of the State Actuary to fully fund Plan 2 and the defined benefit portion of Plan 3. The Plan 2/3 employer rates include a component to address the PERS Plan 1 UAAL and an administrative expense that is currently set at 0.18 percent. Each biennium, the state Pension Funding Council adopts Plan 2 employer and employee contribution rates and Plan 3 contribution rates.
The PERS Plan 2/3 required contribution rates (expressed as a percentage of covered payroll) for 2020 were as follows:
PERS Plan 2/3Actual Contribution Rates Employer 2/3 Employee 2*
January - August 2020:PERS Plan 2/3 7.92% 7.90%PERS Plan 1 UAAL 4.76%Administrative Fee 0.18%Employee PERS Plan 3 variesTotal 12.86% 7.90%September - December 2020:PERS Plan 2/3 7.92% 7.90%PERS Plan 1 UAAL 4.87%Administrative Fee 0.18%Employee PERS Plan 3 variesTotal 12.97% 7.90%
*For employees participating in JBM, the contribution rate was 18.53% to 19.75%.
The City’s actual contributions were $903,269 to PERS Plan 1 and $1,458,690 to PERS Plan 2/3 for the year ended December 31, 2020.

Basic Financial Statement City of Bothell
Notes to the Financial Statement 39<< back to table of content (Notes)
Public Safety Employees’ Retirement System (PSERS)
PSERS Plan 2 was created by the 2004 Legislature and became effective July 1, 2006. To be eligible for membership, an employee must work on a full-time basis and:
■ Have completed a certified criminal justice training course with authority to arrest, conduct criminal investigations, enforce the criminal laws of Washington, and carry a firearm as part of the job; or
■ Have primary responsibility to ensure the custody and security of incarcerated or probationary individuals; or
■ Function as a limited authority Washington peace officer, as defined in RCW 10.93.020; or
■ Have primary responsibility to supervise eligible members who meet the above criteria.
PSERS membership includes: ■ PERS 2 or 3 employees hired by a covered employer before July 1, 2006, who met at least one of the PSERS eligibility criteria and elected membership
during the period of July 1, 2006 to September 30 2006; and
■ Employees hired on or after July 1, 2006 by a covered employer, that meet at least one of the PSERS eligibility criteria.
PSERS covered employers include: ■ Certain State of Washington agencies (Department of Corrections, Department of Natural Resources, Gambling commission, Liquor Control Board, Parks and
Recreation Commission, and Washington State Patrol),
■ Washington State Counties,
■ Washington State Cities (except for Seattle, Spokane, and Tacoma),
■ Correctional entities formed by PSERS employers under the Interlocal Cooperation Act.
PSERS Plan 2 provides retirement, disability and death benefits. Retirement benefits are determined as two percent of the average final compensation (AFC) for each year of service. The AFC is based on the member’s 60 consecutive highest creditable months of service. Benefits are actuarially reduced for each year that the member’s age is less than 60 (with ten or more service credit years in PSERS), or less than 65 (with fewer than ten service credit years). There is no cap on year of service credit. Members are eligible for retirement at the age of 65 with five years of service; or at the age of 60 with at least ten years of PSERS service credit; or at age 53 with 20 years of service. Retirement before age 60 is considered an early retirement. PSERS members who retire prior to the age of 60 receive reduced benefits. If retirement is at age 53 or older with at least 20 years of service, a three percent per year reduction for each year between the age at retirement and age 60 applies. PSERS Plan 2 retirement benefits are actuarially reduced to reflect the choice of a survivor benefit. Other benefits include duty and non-duty disability payments, an optional cost-of living adjustment (COLA), and a one-time duty-related death benefit, if found eligible by the Department of Labor and Industries. PSERS Plan 2 members are vested after completing five years of eligible service.

Basic Financial Statement City of Bothell
Notes to the Financial Statement 40<< back to table of content (Notes)
ContributionsThe PSERS Plan 2 employer and employee contribution rates are developed by the Office of the State Actuary to fully fund Plan 2. The Plan 2 employer rates include components to address the PERS Plan 1 unfunded actuarial accrued liability and administrative expense currently set at 0.18 percent. Each biennium, the state Pension Funding Council adopts Plan 2 employer and employee contribution rates.
The PSERS Plan 2 required contribution rates (expressed as a percentage of current-year covered payroll) for 2020 were as follows:
The City’s actual contributions were $16,760 to PSERS Plan 2 and $11,158 to PERS Plan 1 for the year ended December 31, 2020.
Law Enforcement Officers’ and Fire Fighters’ Retirement System (LEOFF)
LEOFF membership includes all full-time, fully compensated, local law enforcement commissioned officers, firefighters, and as of July 24, 2005, emergency medical technicians. LEOFF is comprised of two separate defined benefit plans.
LEOFF Plan 1 provides retirement, disability and death benefits. Retirement benefits are determined per year of service calculated as a percent of final average salary (FAS) as follows:
■ 20+ years of service – 2.0% of FAS
■ 10-19 years of service – 1.5% of FAS
■ 5-9 years of service – 1% of FAS
The FAS is the basic monthly salary received at the time of retirement, provided a member has held the same position or rank for 12 months preceding the date of retirement. Otherwise, it is the average of the highest consecutive 24 months’ salary within the last ten years of service. Members are eligible for retirement
PSERS Plan 2Actual Contribution Rates Employer 2/3 Employee 2*
January - August 2020:PSERS Plan 2 7.20% 7.20%PERS Plan 1 UAAL 4.76%Administrative Fee 0.18%Total 12.14% 7.20%September - December 2020:PSERS Plan 2 7.20% 7.20%PERS Plan 1 UAAL 4.87%Administrative Fee 0.18%Total 12.25% 7.20%

Basic Financial Statement City of Bothell
Notes to the Financial Statement 41<< back to table of content (Notes)
with five years of service at the age of 50. Other benefits include duty and non-duty disability payments, a cost-of living adjustment (COLA), and a one-time duty-related death benefit, if found eligible by the Department of Labor and Industries. LEOFF 1 members were vested after the completion of five years of eligible service. The plan was closed to new entrants on September 30, 1977.
ContributionsStarting on July 1, 2000, LEOFF Plan 1 employers and employees contribute zero percent, as long as the plan remains fully funded. The LEOFF Plan I had no required employer or employee contributions for fiscal year 2020. Employers paid only the administrative expense of 0.18 percent of covered payroll.
LEOFF Plan 2 provides retirement, disability and death benefits. Retirement benefits are determined as two percent of the final average salary (FAS) per year of service (the FAS is based on the highest consecutive 60 months). Members are eligible for retirement with a full benefit at 53 with at least five years of service credit. Members who retire prior to the age of 53 receive reduced benefits. If the member has at least 20 years of service and is age 50, the reduction is three percent for each year prior to age 53. Otherwise, the benefits are actuarially reduced for each year prior to age 53. LEOFF 2 retirement benefits are also actuarially reduced to reflect the choice of a survivor benefit. Other benefits include duty and non-duty disability payments, a cost-of-living allowance (based on the CPI), capped at three percent annually and a one-time duty-related death benefit, if found eligible by the Department of Labor and Industries. LEOFF 2 members are vested after the completion of five years of eligible service.
ContributionsThe LEOFF Plan 2 employer and employee contribution rates are developed by the Office of the State Actuary to fully fund Plan 2. The employer rate included an administrative expense component set at 0.18 percent. Plan 2 employers and employees are required to pay at the level adopted by the LEOFF Plan 2 Retirement Board.
The LEOFF Plan 2 required contribution rates (expressed as a percentage of covered payroll) for 2020 were as follows:
LEOFF Plan 2Actual Contribution Rates Employer Employee
January - December 2020:State and Local Governments 5.15% 8.59%Administrative Fee 0.18%Total 5.33% 8.59%
The City’s actual contributions to the plan were $868,940 for the year ended December 31, 2020.
The Legislature, by means of a special funding arrangement, appropriates money from the state General Fund to supplement the current service liability and fund the prior service costs of Plan 2 in accordance with the recommendations of the Pension Funding Council and the LEOFF Plan 2 Retirement Board. This special funding situation is not mandated by the state constitution and could be changed by statute. For the state fiscal year ending June 30, 2020, the state contributed

Basic Financial Statement City of Bothell
Notes to the Financial Statement 42<< back to table of content (Notes)
$76,297,643 to LEOFF Plan 2. The amount recognized by the City as its proportionated share of this amount is $546,693.
Actuarial AssumptionsThe total pension liability (TPL) for each of the DRS plans was determined using the most recent actuarial valuation completed in 2020 with a valuation date of June 30, 2019. The actuarial assumptions used in the valuation were based on the results of the Office of the State Actuary’s (OSA) 2013-2018 Experience Study and 2019 Economic Experience Study.
Additional assumptions for subsequent events and law changes are current as of the 2019 actuarial valuation report. The TPL was calculated as of the valuation date and rolled forward to the measurement date of June 30, 2019 to June 30, 2020, reflecting each plan’s normal cost (using the entry-age cost method), assumed interest and actual benefit payments.
■ Inflation: 2.75% total economic inflation; 3.50% salary inflation
■ Salary increases: In addition to the base 3.50% salary inflation assumption, salaries are also expected to grow by promotions and longevity.
■ Investment rate of return: 7.4%
Mortality rates were developed using the Society of Actuaries’ Pub. H-2020 mortality rates, which vary by member status, as the base table. The OSA applied age offsets for each system, as appropriate, to better tailor the mortality rates to the demographics of each plan. OSA applied the long-term MP-2017 generational improvement scale, also developed by the Society Actuaries, to project mortality rates for every year after the 2010 base table. Mortality rates are applied on a generational basis; meaning, each member is assumed to receive additional mortality improvements in each future year throughout his or her lifetime.
There were changes in methods and assumptions since the last valuation:
■ OSA updated its demographic assumptions based on the results of its latest demographic experience study. See OSA’s 2013-2018 Demographic Experience Study at leg.wa.gov/osa.
■ OSA updated the Early Retirement Factors and Joint-and-Survivor factors used in its model to match the ones implemented by DRS on October 1, 2020. These factors are used to value benefits for members who elect to retire early and for survivors of members that die prior to retirement.
■ The valuation includes liabilities and assets for Plan 3 members purchasing Total Allocation Portfolio annuities when determining contribution rates and funded status.
■ OSA simplified its modeling of medical premium reimbursements for survivors of duty-related deaths in LEOFF 2.
■ OSA changed its method of updating certain data items that change annually, including the public safety duty-related death lump sum and Washington state average wage. OSA set these values at 2018 and will project them into the future using assumptions until the next Demographic Experience Study in 2025. See leg.wa.gov/osa for more information on this method change

Basic Financial Statement City of Bothell
Notes to the Financial Statement 43<< back to table of content (Notes)
Discount RateThe discount rate used to measure the total pension liability for all DRS plans was 7.4 percent.
To determine that rate, an asset sufficiency test was completed to test whether each pension plan’s fiduciary net position was sufficient to make all projected future benefit payments for current plan members. Based on OSA’s assumptions, the pension plans’ fiduciary net position was projected to be available to make all projected future benefit payments of current plan members. Therefore, the long-term expected rate of return of 7.4 percent was used to determine the total liability.
Long-Term Expected Rate of ReturnThe long-term expected rate of return on the DRS pension plan investments of 7.4 percent was determined using a building-block-method. In selecting this assumption, the Office of the State Actuary (OSA) reviewed the historical experience data, considered the historical conditions that produced past annual investment returns, and considered Capital Market Assumptions (CMA’s) and simulated expected investment returns provided by the Washington State Investment Board (WSIB). The WSIB uses the CMA’s and their target asset allocation to simulate future investment returns at various future times.
Estimated Rates of Return by Asset ClassBest estimates of arithmetic real rates of return for each major asset class included in the pension plan’s target asset allocation as of June 30, 2020, are summarized in the table below. The inflation component used to create the table is 2.2 percent and represents the WSIB’s most recent long-term estimate of broad economic inflation.
% Long-TermExpected Real
Asset Class Target Allocation Rate of ReturnFixed Income 20% 2.20%Tangible Assets 7% 5.10%Real Estate 18% 5.80%Global Equity 32% 6.30%Private Equity 23% 9.30%
Total 100%

Basic Financial Statement City of Bothell
Notes to the Financial Statement 44<< back to table of content (Notes)
Sensitivity of the Net Pension Liability / (Asset)The table below presents the City proportionate share of the net pension liability calculated using the discount rate of 7.4 percent, as well as what the City proportionate share of the net pension liability would be if it were calculated using a discount rate that is 1-percentage point lower (6.4 percent) or 1-percentage point higher (8.4 percent) than the current rate.
Pension Plan Fiduciary Net PositionDetailed information about the State’s pension plans’ fiduciary net position is available in the separately issued DRS financial report.
Pension Liabilities (Assets), Pension Expense, and Deferred Outflows of Resources and Deferred Inflows of Resources Related to Pensions
At June 30, 2020, the City reported a total pension liability of $6,682,463 for its proportionate share of the net pension liabilities and a total pension asset of $9,569,760 for its proportionate share of the net pension assets as follows:
1% Decrease Discount Rate 1% IncreasePension Plan (6.4%) (7.4%) (8.4%)
PERS 1 $5,730,378 $4,574,944 $3,567,287 PERS 2/3 13,113,548 2,107,519 (6,955,952)PSERS 2 66,670 (6,124) (63,737)LEOFF 1 (527,642) (648,250) (752,595)LEOFF 2 (176,498) (8,915,386) (16,070,792)
Pension Plan Liability (or Asset)PERS 1 $4,574,944 PERS 2/3 2,107,519 PSERS 2 (6,124)LEOFF 1 (648,250)LEOFF 2 (8,915,386)
The amount of the liability / (asset) reported above for LEOFF Plan 1 and 2 reflects a reduction for State pension support provided to the City. The amount recognized by the City as its proportionate share of the net pension liability/(asset), the related State support, and the total portion of the net pension liability/(asset) that was associated with the City were as follows:
Pension Plan LEOFF 1 Asset LEOFF 2 AssetEmployer's proportionate share (648,250) (8,915,386) State's proportionate share of the net pension asset associated with the employer (4,384,744) (5,700,714)
Total ($5,032,994) ($14,616,100)

Basic Financial Statement City of Bothell
Notes to the Financial Statement 45<< back to table of content (Notes)
At June 30, 2020, the City’s proportionate share of the collective net pension liabilities was as follows:
Employer contribution transmittals received and processed by the DRS for the fiscal year ended June 30 are used as the basis for determining each employer’s proportionate share of the collective pension amounts reported by the DRS in the Schedules of Employer and Non-employer Allocations for all plans except LEOFF 1.
LEOFF Plan 1 allocation percentages are based on the total historical employer contributions to LEOFF 1 from 1971 through 2000 and the retirement benefit payments in fiscal year 2020. Historical data was obtained from a 2011 study by the Office of the State Actuary (OSA). In fiscal year 2020, the State of Washington contributed 87.12 percent of LEOFF 1 employer contributions and all other employers contributed the remaining 12.88 percent of employer contributions. LEOFF 1 is fully funded and no further employer contributions have been required since June 2000. If the plan becomes underfunded, funding of the remaining liability will require new legislation. The allocation method the plan chose reflects the projected long-term contribution effort based on historical data.
In fiscal year 2020, the state of Washington contributed 39 percent of LEOFF 2 employer contributions pursuant to RCW 41.26.725 and all other employers contributed the remaining 61 percent of employer contributions.
The collective net pension liability (asset) was measured as of June 30, 2020, and the actuarial valuation date on which the total pension liability (asset) is based was as of June 30, 2019, with update procedures used to roll forward the total pension liability to the measurement date.
Pension ExpenseFor the year ended December 31, 2020, the City recognized pension expense as follows:
Proportionate Proportionate Change inPension Plan Share 6/30/2019 Share 6/30/2020 Proportion
PERS 1 0.129911% 0.129582% 0.000329%PERS 2/3 0.164374% 0.164786% -0.000412%PSERS 2 0.043737% 0.044507% -0.000770%LEOFF 1 0.035125% 0.034326% 0.000799%LEOFF 2 0.457065% 0.437060% 0.020005%
Pension Plan Pension ExpensePERS 1 $203,519 PERS 2/3 267,936 PSERS 2 13,781 LEOFF 1 (19,161)LEOFF 2 380,401
Total $846,477

Basic Financial Statement City of Bothell
Notes to the Financial Statement 46<< back to table of content (Notes)
Deferred Outflows of Resources and Deferred Inflows of Resources
At December 31, 2020, the City reported deferred outflows of resources and deferred inflows of resources related to pensions from the following sources:
Deferred Outflows Deferred Inflows PERS 1 of Resources of Resources
Differences between expected and actual experienceNet difference between projected and actual investment earnings on pension plan investments ($25,472)Changes of assumptionsChanges in proportion and differences between contributions and proportionate share of contributionsContributions subsequent to the measurement date 437,737
Total $437,737 ($25,472)
Deferred Outflows Deferred Inflows PERS 2/3 of Resources of Resources
Differences between expected and actual experience $754,461 ($264,122)Net difference between projected and actual investment earnings on pension plan investments (107,032)Changes of assumptions 30,017 (1,439,618)Changes in proportion and differences between contributions and proportionate share of contributions 457,623 (120,767)Contributions subsequent to the measurement date 701,838
Total $1,943,939 ($1,931,539)
Deferred Outflows Deferred Inflows PSERS 2 of Resources of Resources
Differences between expected and actual experience $8,414 (458) Net difference between projected and actual investment earnings on pension plan investments 327 Changes of assumptions 31 (11,577)Changes in proportion share 743 (1,684)Contributions subsequent to the measurement date 7,392
Total $16,907 ($13,719)
LEOFF 1 Deferred Outflows of Resources
Deferred Inflows of Resources
Differences between expected and actual experienceNet difference between projected and actual investment earnings on pension plan investments (6,781) Changes of assumptionsChanges in proportion and differences between contributions and proportionate share of contributionsContributions subsequent to the measurement date
Total $0 ($6,781)

Basic Financial Statement City of Bothell
Notes to the Financial Statement 47<< back to table of content (Notes)
Deferred outflows of resources related to pensions resulting from the City’s contributions subsequent to the measurement date will be recognized as a reduction of the net pension liability in the subsequent fiscal period. Other amounts reported as deferred outflows and deferred inflows of resources related to pensions will be recognized in pension expense as follows:
LEOFF 2 Deferred Outflows of Resources
Deferred Inflows of Resources
Differences between expected and actual experience $1,233,591 (158,122) Net difference between projected and actual investment earnings on pension plan investments (99,369)Changes of assumptions 12,916 (1,380,497)Changes in proportion and differences between contributions and proportionate share of contributions 812,368 (481,465)Contributions subsequent to the measurement date 449,344
Total $2,508,219 ($2,119,453)
Total of All Plans Deferred Outflows of Resources
Deferred Inflows of Resources
Differences between expected and actual experience $1,996,467 ($422,702)Net difference between projected and actual investment earnings on pension plan investments 327 (238,654)Changes of assumptions 42,965 (2,831,692)Changes in proportion and differences between contributions and proportionate share of contributions 1,270,734 (603,916)Contributions subsequent to the measurement date 1,596,311
Total $4,906,802 ($4,096,964)
Year Ended December 31 PERS 1 PERS 2/3 PSERS 2 LEOFF 1 LEOFF 2 Total
2021 ($115,590) ($808,669) ($1,706) ($24,205) ($623,672) ($1,573,842)
2020 (3,636) (143,209) (485) (1,262) (57,268) ($205,860)
2023 35,270 103,283 356 6,881 162,894 $308,684
2024 58,484 281,001 1,285 11,805 329,237 $681,813
2025 (32,055) (604) (28,980) ($61,639)
Thereafter (89,789) (3,050) 157,210 $64,372
Total ($25,472) ($689,438) ($4,203) ($6,781) ($60,579) ($786,472)
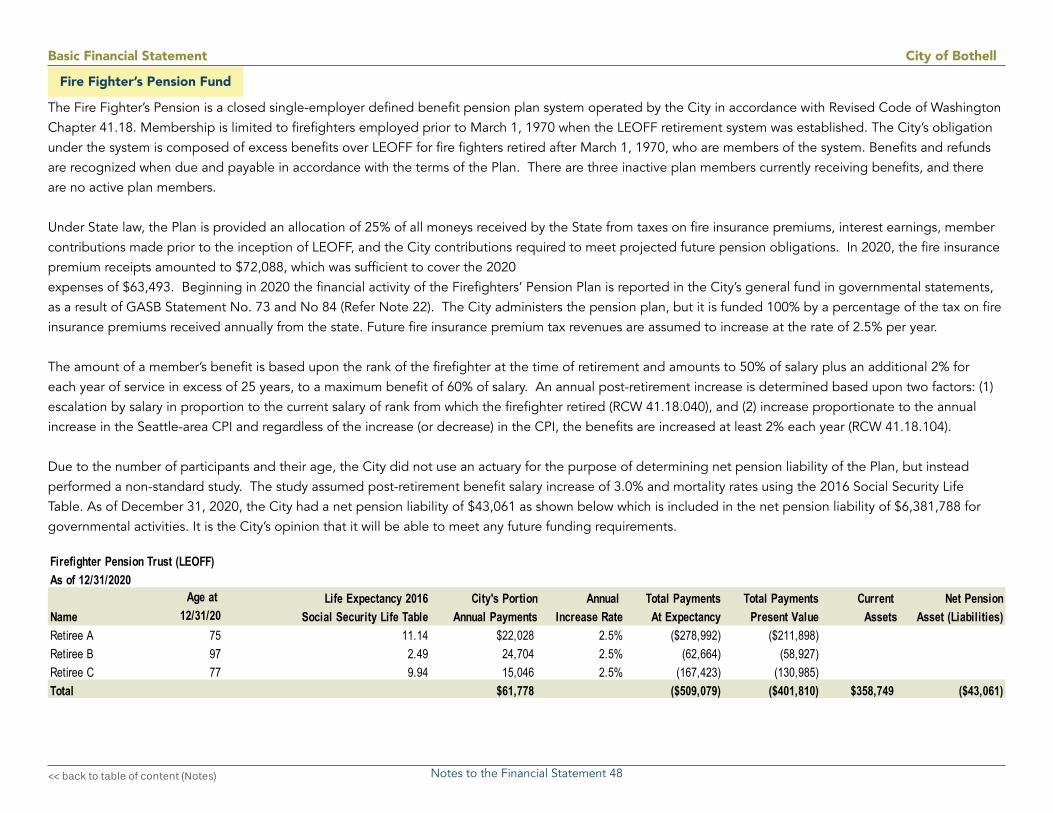
Basic Financial Statement City of Bothell
Notes to the Financial Statement 48<< back to table of content (Notes)
Firefighter Pension Trust (LEOFF)As of 12/31/2020
Age at Life Expectancy 2016 City's Portion Annual Total Payments Total Payments Current Net PensionName 12/31/20 Social Security Life Table Annual Payments Increase Rate At Expectancy Present Value Assets Asset (Liabilities)Retiree A 75 11.14 $22,028 2.5% ($278,992) ($211,898)Retiree B 97 2.49 24,704 2.5% (62,664) (58,927)Retiree C 77 9.94 15,046 2.5% (167,423) (130,985)Total $61,778 ($509,079) ($401,810) $358,749 ($43,061)
Fire Fighter’s Pension Fund
The Fire Fighter’s Pension is a closed single-employer defined benefit pension plan system operated by the City in accordance with Revised Code of Washington Chapter 41.18. Membership is limited to firefighters employed prior to March 1, 1970 when the LEOFF retirement system was established. The City’s obligation under the system is composed of excess benefits over LEOFF for fire fighters retired after March 1, 1970, who are members of the system. Benefits and refunds are recognized when due and payable in accordance with the terms of the Plan. There are three inactive plan members currently receiving benefits, and there are no active plan members.
Under State law, the Plan is provided an allocation of 25% of all moneys received by the State from taxes on fire insurance premiums, interest earnings, member contributions made prior to the inception of LEOFF, and the City contributions required to meet projected future pension obligations. In 2020, the fire insurance premium receipts amounted to $72,088, which was sufficient to cover the 2020expenses of $63,493. Beginning in 2020 the financial activity of the Firefighters’ Pension Plan is reported in the City’s general fund in governmental statements, as a result of GASB Statement No. 73 and No 84 (Refer Note 22). The City administers the pension plan, but it is funded 100% by a percentage of the tax on fire insurance premiums received annually from the state. Future fire insurance premium tax revenues are assumed to increase at the rate of 2.5% per year.
The amount of a member’s benefit is based upon the rank of the firefighter at the time of retirement and amounts to 50% of salary plus an additional 2% for each year of service in excess of 25 years, to a maximum benefit of 60% of salary. An annual post-retirement increase is determined based upon two factors: (1) escalation by salary in proportion to the current salary of rank from which the firefighter retired (RCW 41.18.040), and (2) increase proportionate to the annual increase in the Seattle-area CPI and regardless of the increase (or decrease) in the CPI, the benefits are increased at least 2% each year (RCW 41.18.104). Due to the number of participants and their age, the City did not use an actuary for the purpose of determining net pension liability of the Plan, but instead performed a non-standard study. The study assumed post-retirement benefit salary increase of 3.0% and mortality rates using the 2016 Social Security Life Table. As of December 31, 2020, the City had a net pension liability of $43,061 as shown below which is included in the net pension liability of $6,381,788 for governmental activities. It is the City’s opinion that it will be able to meet any future funding requirements.

Basic Financial Statement City of Bothell
Notes to the Financial Statement 49<< back to table of content (Notes)
NOTE 8 OTHER EMPLOYEE BENEFITS
COMPENSATED ABSENCES
The City has vacation and sick leave policies. Vacation pay may accumulate up to 240 hours at December 31. It is payable upon resignation, retirement, or death. Sick leave may accumulate up to 960 hours, or as provided by contract. Sick leave does not vest until retirement. Liquidation of the liability for compensated absences in prior years has been used by the General Fund and enterprise funds.
DEFERRED COMPENSATIONThe City offers its employees two deferred compensation plans, created in accordance with the Internal Revenue Code Section 457.
The International City Manager’s Association (ICMA) plan is available to all eligible employees. The Nationwide Retirement Solutions plan is available to all eligible International Association of Firefighters (IAFF).
These plans allow participants to defer a portion of their salary until future years. The deferred compensation is not available to employees until termination, retirement, death, or in the event of an unforeseeable emergency.
The City contributes a 3% match to the Police Officer’s Guild and Police Captain’s Union, a 2% match to the Washington State Council of County and City Employees AFSCME Union, and a matched contribution to Non-Represented employees based on a schedule of completed years of service. In 2020, the City’s contributions totaled $459,132, and employee contributions totaled $1,886,543.
Government Activities 1/1/20 Increases Decreases 12/31/20Governmental funds 2,942,892 2,233,448 1,894,744 3,281,596
Total Compensated Absences $2,942,892 $2,233,448 $1,894,744 $3,281,596
Business-Type Activities 1/1/20 Increases Decreases 12/31/20Enterprise funds 190,028 218,710 168,947 239,790
Total Compensated Absences $190,028 $218,710 $168,947 $239,790

Basic Financial Statement City of Bothell
Notes to the Financial Statement 50<< back to table of content (Notes)
NOTE 9 POST-EMPLOYMENT BENEFITS OTHER THAN PENSIONS (OPEB)
In 2020, the City continued to comply GASB Statement No. 75, Accounting and Financial Reporting for Postemployment Benefits Other Than Pensions for the second year. This statement replaces the requirements of Statement No. 45, Accounting and Financial Reporting by Employers for Postemployment Benefits Other Than Pensions.
Plan DescriptionThe City provides post-retirement health care benefits for members of the Law Enforcement Officers and Firefighters (LEOFF) retirement system hired before October 1, 1977, under a single-employer defined benefit healthcare plan administered by the City, as required by the Revised Code of Washington (RCW Chapter 41.26).
Most medical coverage for eligible retirees is provided by one of the City’s medical insurance programs (AWC Benefits Trust and Northwest Firefighters Benefits Trust). Life insurance is provided by Unum Life Insurance. Under the authorization of the LEOFF Disability Board, reimbursements are made for other retiree medical expenses not covered by standard medical plan benefit provisions.
MembershipAs of December 31, 2020, there were 15 LEOFF I retirees receiving these benefits. This is considered a closed group with no new eligible members.
Inactive employees or beneficiaries currently receiving benefits 15
Inactive employees entitled to but not yet receiving benefits -
Active employees -
Total 15
Funding PolicyFunding for LEOFF I retiree healthcare costs is provided entirely by the City as required by RCW. The City’s funding policy is based upon pay-as-you-go financing requirements. It is not administered through a qualifying trust, and therefore, no assets are accumulated. An internal service fund (Self-Insurance) accounts for the contributions and payments related to OPEB.
In 2020, the amount of benefit payment related to the participating retirees totaled $128,370.
In implementing GASB Statement No. 75, the following changes since the prior valuation were implemented:

Basic Financial Statement City of Bothell
Notes to the Financial Statement 51<< back to table of content (Notes)
The City employed the Alternative Measurement Method (AMM) developed by the Office of the State Actuary (OSA) to measure the total OPEB liability. The AMM Tool was designed for local government entities in Washington State and covered members must be active in or retired from LEOFF 1. Employers must have less than 100 total LEOFF 1 members. The federal Patient Protection and Affordable Care Act levies a 40% excise tax on employers for the value of health plan costs that exceed certain thresholds. The excise tax impacts the medical inflation trend for these plans. The AWC actuarial study projects reaching the excise tax threshold in 2028. Under AMM, only the OPEB liability is calculated. There are no deferred outflows and inflows other than the deferred outflow for payments subsequent to the measurement date. The following table represents the OPEB amounts subject to the requirements of GASB Statement 75 for the year 2020:
The total OPEB liabilities are allocated between current and non-current liabilities in the Statement of Net Position of the basic financial statements. The amount of $188,147, expected to be due within one year, is a current liability.
Total OPEB liabilities $7,054,694Deferred outflows of resources 64,495OPEB expense/expenditures 1,090,083
OPEB Amounts – Single Plan
Actuarial Methods and Assumptions
Specific assumptions using the AMM Tool: ■ Assumed any remaining active members will retire immediately following
the measurement date. This assumption considered that over 99 percent of LEOFF 1 members are already retired and the remaining members are eligible to retire. This approach assumes that all liabilities are fully earned and the Service Cost equals zero. In other words, the Entry Age Normal Total OPEB Liability is by definition equal to the Present Value of Future Benefits, and therefore, there is no need to make an assumption with respect to Projected Salary Changes.
■ Each cohort is assumed to be 100 percent male. As of the measurement date, over 98 percent of the eligible LEOFF 1 population is male. This assumption will be monitored in future versions of the AMM Tool.
■ Selected four age-based cohorts for the AMM Tool based upon the overall distribution of the LEOFF 1 eligible population.
■ Medical and long-term care costs were projected from June 30, 2018 to the measurement date of June 30, 2020 using the healthcare trend rates detailed in the 2018 LEOFF 1 Medical Benefits Actuarial Valuation Report.
MethodologyActuarial Valuation Date 6/30/20Actuarial Measurement Date 6/30/20Acturaial Cost Method Entry AgeAmortization Method Recognized ImmediatelyAsset Valuation Method N/A
AssumptionsDiscount Rate
Beginning of Measurement Year 3.50%End of Measurement Year 2.21%
Inflation (Based on the CPI: Urban Wage Earners & Clerical Workers, Seattle-Tacoma-Bremerton, WA - All Items.) 2.75%Healthcare Trend Rates:
Medical Cost Initial rate is about 6% trends down to about 5% in 2020's
Long-Term Care 4.50%Medicare Part B Premimus Approximately 5%, varies by year.
Mortality Rates (assume 100% male population)Bsdr Mottslity Table PP-2000 Mortality Table
+1 year Healthy/-2 years DisabledAge Setback Blended 50%/50% Healthy/DisabledMortality Improvements 100% Scale BBProjection Period Generational
Medicare Participation Rate 100%

Basic Financial Statement City of Bothell
Notes to the Financial Statement 52<< back to table of content (Notes)
Changes of assumptionsFor OPEB plans without trust, GASB 75 requires the discount rate to be based on a yield for 20-year tax-exempt, high–quality municipal bond rate with an average rating of AA/Aa or higher. This resulted in a 3.5 percent discount rate as of June 30, 2019 and 2.21 percent measured June 30, 2020.
Sensitivity of the total OPEB liability to changes in the discount rate and healthcare trend The following table represents the total OPEB liability of the City, as well as what the City’s total OPEB liability would be if it were calculated using a discount rate that is 1-percentage-point lower or 1- percentage-point higher than the current discount rate.
The following table represents the total OPEB liability of the City for healthcare is based upon assumptions in the 2018 LEOFF 1 Medical Benefits Actuarial Valuation Report.
Total OPEB Liability 1% Decrease (1.21%) Current Rate (2.21%) 1% Increase (3.21%)
Discount Rate $7,847,778 $7,054,694 $6,379,100
Sensitivity Analysis
Total OPEB Liability 1% Decrease Current Rate 1% Increase
Healthcare Trend $6,414,808 $7,054,694 $7,787,129
Sensitivity Analysis

Basic Financial Statement City of Bothell
Notes to the Financial Statement 53<< back to table of content (Notes)
At December 31, 2020, the City reported deferred outflows of resources related to OPEB from the following source:
Change in the Total OPEB Liability
Plan Name
Total OPEB liability - beginning 6,092,981.00
Interest 207,533.00
Differences between expected and actual experience 1,083,944.00
Benefit payments (329,764.00)
Total OPEB liability - ending 7,054,694.00
Net adjustment to OPEB Expense at 12/31/2020Beginning OPEB liability (GASB 75) (6,092,981)
Deferred outflows - reverse 2019 subsequent to the measurement date 7/1/19-12/31/19 76,335 Total OPEB liability at 6/30/2020 7,054,694
Deferred outflows - 2020 subsequent to the measurement date 7/1/20-12/31/20 (64,495)
Net adjustment to OPEB expense at 12/31/2020 973,553
OPEB Expense for Fiscal Year Ending Net adjustment to OPEB expense at 12/31/2020 973,553
Deferred outflows - reverse 2019 subsequent to the measurement date 7/1/19-12/31/19 (76,335)
Deferred outflows - 2020 subsequent to the measurement date 7/1/20-12/31/20 64,495
Benefit payments for year 2020 128,370
OPEB expense 1,090,083
A Single-Employer Defined Benefit - No Qualifying Trust
The deferred outflows of resources amount of $64,495 will be recognized as an expense in the period ending December 31, 2021.
Deferred Outflows of ResourcesPayments subsequent to the measurement date $64,495
Total $64,495
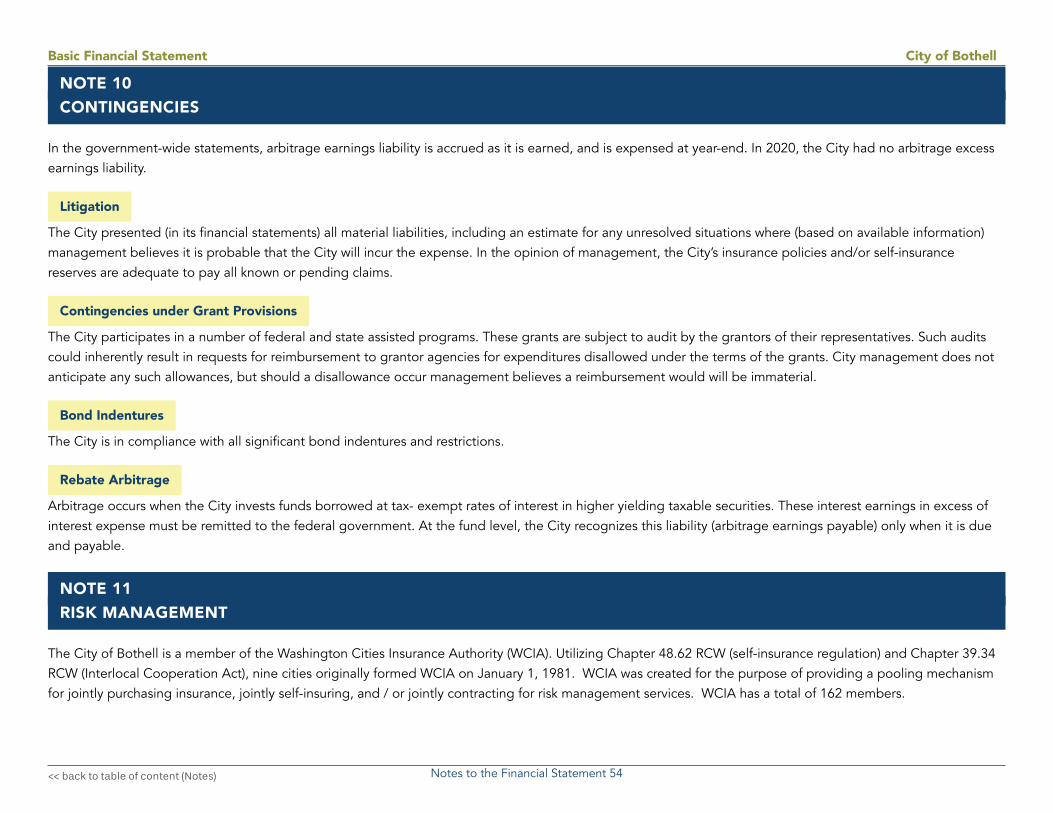
Basic Financial Statement City of Bothell
Notes to the Financial Statement 54<< back to table of content (Notes)
NOTE 10CONTINGENCIES
In the government-wide statements, arbitrage earnings liability is accrued as it is earned, and is expensed at year-end. In 2020, the City had no arbitrage excess earnings liability.
Litigation
The City presented (in its financial statements) all material liabilities, including an estimate for any unresolved situations where (based on available information) management believes it is probable that the City will incur the expense. In the opinion of management, the City’s insurance policies and/or self-insurance reserves are adequate to pay all known or pending claims.
Contingencies under Grant Provisions
The City participates in a number of federal and state assisted programs. These grants are subject to audit by the grantors of their representatives. Such audits could inherently result in requests for reimbursement to grantor agencies for expenditures disallowed under the terms of the grants. City management does not anticipate any such allowances, but should a disallowance occur management believes a reimbursement would will be immaterial.
Bond Indentures
The City is in compliance with all significant bond indentures and restrictions.
Rebate Arbitrage
Arbitrage occurs when the City invests funds borrowed at tax- exempt rates of interest in higher yielding taxable securities. These interest earnings in excess of interest expense must be remitted to the federal government. At the fund level, the City recognizes this liability (arbitrage earnings payable) only when it is due and payable.
NOTE 11RISK MANAGEMENT
The City of Bothell is a member of the Washington Cities Insurance Authority (WCIA). Utilizing Chapter 48.62 RCW (self-insurance regulation) and Chapter 39.34 RCW (Interlocal Cooperation Act), nine cities originally formed WCIA on January 1, 1981. WCIA was created for the purpose of providing a pooling mechanism for jointly purchasing insurance, jointly self-insuring, and / or jointly contracting for risk management services. WCIA has a total of 162 members.

Basic Financial Statement City of Bothell
Notes to the Financial Statement 55<< back to table of content (Notes)
New members initially contract for a three-year term, and thereafter automatically renew on an annual basis. A one-year withdrawal notice is required before membership can be terminated. Termination does not relieve a former member from its unresolved loss history incurred during membership.
Liability coverage is written on an occurrence basis, without deductibles. Coverage includes general, automobile, police, errors or omissions, stop gap, employment practices and employee benefits liability. Limits are $4 million per occurrence in the self-insured layer, and $21 million in limits above the self-insured layer is provided by reinsurance. Total limits are $25 million per occurrence subject to aggregates and sublimits. The Board of Directors determines the limits and terms of coverage annually. Insurance for property, automobile physical damage, fidelity, inland marine, and boiler and machinery coverage are purchased on a group basis. Various deductibles apply by type of coverage. Property coverage is self-funded from the members’ deductible to $750,000, for all perils other than flood and earthquake, and insured above that to $400 million per occurrence subject to aggregates and sublimits. Automobile physical damage coverage is self-funded from the members’ deductible to $250,000 and insured above that to $100 million per occurrence subject to aggregates and sublimits. In-house services include risk management consultation, loss control field services, and claims and litigation administration. WCIA contracts for certain claims investigations, consultants for personnel and land use issues, insurance brokerage, actuarial, and lobbyist services.
WCIA is fully funded by its members, who make annual assessments on a prospectively rated basis, as determined by an outside, independent actuary. The assessment covers loss, loss adjustment, reinsurance and other administrative expenses. As outlined in the interlocal, WCIA retains the right to additionally assess the membership for any funding shortfall.
An investment committee, using investment brokers, produces additional revenue by investment of WCIA’s assets in financial instruments which comply with all State guidelines.
A Board of Directors governs WCIA, which is comprised of one designated representative from each member. The Board elects an Executive Committee and appoints a Treasurer to provide general policy direction for the organization. The WCIA Executive Director reports to the Executive Committee and is responsible for conducting the day to day operations of WCIA.
In the past 14 years insurance settlements have not exceeded insurance coverage.
NOTE 12INTERFUND ACTIVITIES
Interfund Transfers are recorded transactions that support the operations of other funds and are classified as “other financing sources or uses” in the fund statements. Transfers between governmental or proprietary funds are netted as part of the reconciliation to the government-wide financial statements.
Transfers are used to:1) Move revenues from the fund with collection authorization to the Debt Service Fund as debt service principal and interest payments become due.

Basic Financial Statement City of Bothell
Notes to the Financial Statement 56<< back to table of content (Notes)
1) Move restricted debt proceeds to the Debt Service Fund to establish mandatory reserve accounts.
2) Move unrestricted General Fund revenues to finance various programs that the government must account for in other funds in accordance with budgetary authorizations, including amounts provided as subsidies or matching funds for various grant programs.
Interfund Services are services provided by one fund to other and are considered as reciprocal interfund activities because payment is made for services received. The City records and reports these transactions as “charges for service revenues and expenditures” in the appropriate funds.
Interfund Loans provide a mechanism for one fund to borrow from another and must be approved by the legislative body. Reciprocal in activity, interfund loans are reported as interfund receivables by the lender fund and interfund payables by the borrower fund. Interfund loans are not treated as capital-related for purposes of classifying net position.
In 2020, the City did not authorize budgetary transfer between governmental activities and business activities.
Interfund TransfersArterial LIFT 2013 Capital Self Asset Total
General Street Street GO Bond GO Bond Improvements Insurance Replacement TransferredDescription Fund Fund Fund Fund Fund Fund Fund Fund Out
General Fund 128,370 436,512 564,882 Street Fund 1,526,672 1,526,672 Arterial Street Fund 2,666,504 2,666,504 Park Cumulative Reserve Fund 150,999 150,999 Public Safety Levy Fund 26,708 26,708 Capital Improvement Fund 50,000 996,250 697,864 1,744,114 Water Fund 81,121 81,121 Sewer Fund 77,117 77,117 Storm & Surface Water Fund 248,374 248,374 Equipment Rental Fund 1,082,774 1,082,774
Total Transferred In $50,000 $0 $0 $996,250 $697,864 $4,777,495 $128,370 $1,519,286 8,169,265
NOTE 13LONG-TERM DEBT
General Long-Term Debt
The City typically issues general obligation to finance land acquisitions and construction of major capital infrastructure projects.
General obligation bonds pledge the full faith and credit of the City. The City issues two types of general obligation bonds:limited tax general obligation (LTGO) bonds and unlimited tax general obligation (UTGO) bonds.

Basic Financial Statement City of Bothell
Notes to the Financial Statement 57<< back to table of content (Notes)
2013 A (Taxable) & B Limited Tax GO Bonds
In 2012 the Bothell City Council authorized a $7,000,000 short- term Limited Tax General Obligation Bond Anticipation Note (2012 BAN) to pay the final balance owed to the Northshore School District for property purchased and to carry out public improvements related to the downtown revitalization. In 2013, Council authorized extension of the BAN maturity date through May 31, 2013. The BAN extension provided time for staff identify longer-term financing to accommodate the timetable necessary to sell surplus City properties. Staff determined that 20-year, bank qualified (BQ), General Obligation (GO) Bonds would provide the most advantageous financing option, given the current unprecedentedly low interest rates and the City’s capital strategy. In June 2013, the City issued Limited Tax GO Bond without a vote 2013A (taxable) $1,520,000, and GO Bond 2013B $8,145,000 to retire the 2012 BAN. Bond 2013A was paid off in 2017. The 2013B’s outstanding balance at the end of 2020 is $6,940,000.
2014 Limited Tax GO Bonds (LIFT) Bonds
In 2006, the City was awarded LIFT funding for downtown revitalization. The program funding consists of future rebates of state property and sales taxes up to $1,000,000 per year for a maximum of 25 years and is allocated by the Department of Revenue (DOR) based on the State’s portion of tax collected from within the City’s designated Revenue Development Area (RDA). These rebated tax monies are restricted for debt service associated with the LIFT Bond.
2020 Unlimited Tax GO Bonds (Public Safety Bonds)
In December 2019, the City issued 20-year voter-approved Unlimited Tax General Obligation Bonds of $25 million including premium of $2.5 million. The Bonds are for funding the costs of replacing two deteriorating fire stations by modern structures to meet increasing community needs. The construction of both fire stations is expected to begin in July 2021 and completed by 2023. In 2020, the City paid principal of $740,000.
2014 Lease Revenue Bonds
In 2014, COB Properties (COB), a Washington nonprofit corporation, issued $49,625,000 COB Properties Lease Revenue Bonds for the City of Bothell City Hall Project. The bonds were issued by COB on behalf of City of Bothell pursuant to IRS Revenue Ruling 63-20 and 82-26. The City leased land to COB for construction of the new City Hall and the COB leases the premises to the City. Proceeds of the bonds were used for construction of the City Hall and parking garage. Bond principal and interest payments are the responsibility of COB. Lease payments made by the City will pay debt service of the Bonds. COB is a single purpose entity and not a governmental unit. It has no taxing power and no source of funds to pay debt service on the bonds other than the lease payments from the City of Bothell.
Public Works Trust Fund (PWTF) Construction Loan
In 2011, the City was awarded an $8,000,000 PC12-951-022 construction loan and is allocated to the Bothell Crossroads SR- 522 realignment construction project. This loan is considered the general government obligation and is being paid from Capital Improvement Fund with an annual principal payment of $447,123.

Basic Financial Statement City of Bothell
Notes to the Financial Statement 58<< back to table of content (Notes)
Public Works Trust Fund (PWTF) Construction Loan
In 2012, the City was awarded an $800,000 construction loan (PC13-961-060) with 20-year maturity for Horse Creek enhancement project. The City finalized the project in 2016. This loan is a revenue obligation of the Storm & Surface Water Fund. The City began spending down the monies in 2014 and annual principal payment is $45,516.
Public Works Assistance (PWA) Loan
In 2017, the City was received a loan of $125,000 from Snohomish County to fund installation of crosswalks with rectangular rapid flashing beacons within the City’s various locations. The City will reimburse this loan by year 2027 with an annual principal payment $12,970.
Revenue Bonds
In 2014, the City issued $18,355,000 in revenue bonds to finance Water, Sewer and Storm & Surface Water utility projects. The bonds are payable from revenues generated by user fees. A cash reserve is maintained in an amount equal to the lesser of (i) maximum annual debt service, (ii) 125% of average annual debt service, or (iii) 10% of the original proceeds of the bonds. The outstanding balance at the end of 2020 was $14,380,000.
Debt Service requirements to maturity
Principal Interest Principal Interest Principal Interest Principal Interest Principal Interest Principal Interest Totals
Governmental Activities2021 425,000 271,013 795,000 1,200,650 447,123 12,296 780,000 847,050 12,970 1,362 1,510,000 1,813,844 8,116,3082022 440,000 258,263 835,000 1,163,875 447,123 11,178 820,000 808,050 12,970 1,167 1,590,000 1,737,594 8,125,2192023 450,000 245,063 875,000 1,121,125 447,123 10,060 860,000 767,050 12,970 973 1,665,000 1,658,468 8,112,8312024 470,000 227,063 920,000 1,076,250 447,123 8,942 905,000 724,050 12,970 778 1,750,000 1,575,427 8,117,6032025 490,000 208,263 965,000 1,029,125 447,123 7,825 950,000 678,800 12,970 584 1,840,000 1,487,552 8,117,241
2026-2030 1,590,000 754,113 5,630,000 4,349,250 2,235,615 22,356 5,505,000 2,633,000 25,940 584 10,560,000 6,068,143 39,374,0002031-2035 3,075,000 242,063 7,230,000 2,750,000 447,123 1,118 6,625,000 1,515,750 12,705,000 3,923,878 38,514,9312036-2039 7,240,000 1,267,000 6,050,000 460,500 12,075,000 953,866 28,046,366
Subtotal $6,940,000 $2,205,839 $24,490,000 $13,957,275 $4,918,354 $73,777 $22,495,000 $8,434,250 $90,788 $5,448 $43,695,000 $19,218,771 $146,524,500
Principal Interest Principal Interest Totals
Business-Type Activities2021 780,000 531,719 45,516 1,365 1,358,6002022 815,000 492,719 45,516 1,252 1,354,4872023 855,000 451,969 45,516 1,138 1,353,6232024 900,000 409,219 45,516 1,024 1,355,7592025 945,000 364,219 45,516 910 1,355,645
2026-2030 5,260,000 1,293,169 227,581 2,845 6,783,5942031-2034 4,825,000 415,531 91,032 341 5,331,905
Subtotal $14,380,000 $3,958,546 $546,193 $8,874 $18,893,613
Total $165,418,113
Year2014 Revenue Bond PWTF Loan
CH Lease Revenue BondsYear
GO Bond 2013 B GO 2014 LIFT Bond PWTF Loan Snohomish County PWAFPublic Safety Bonds
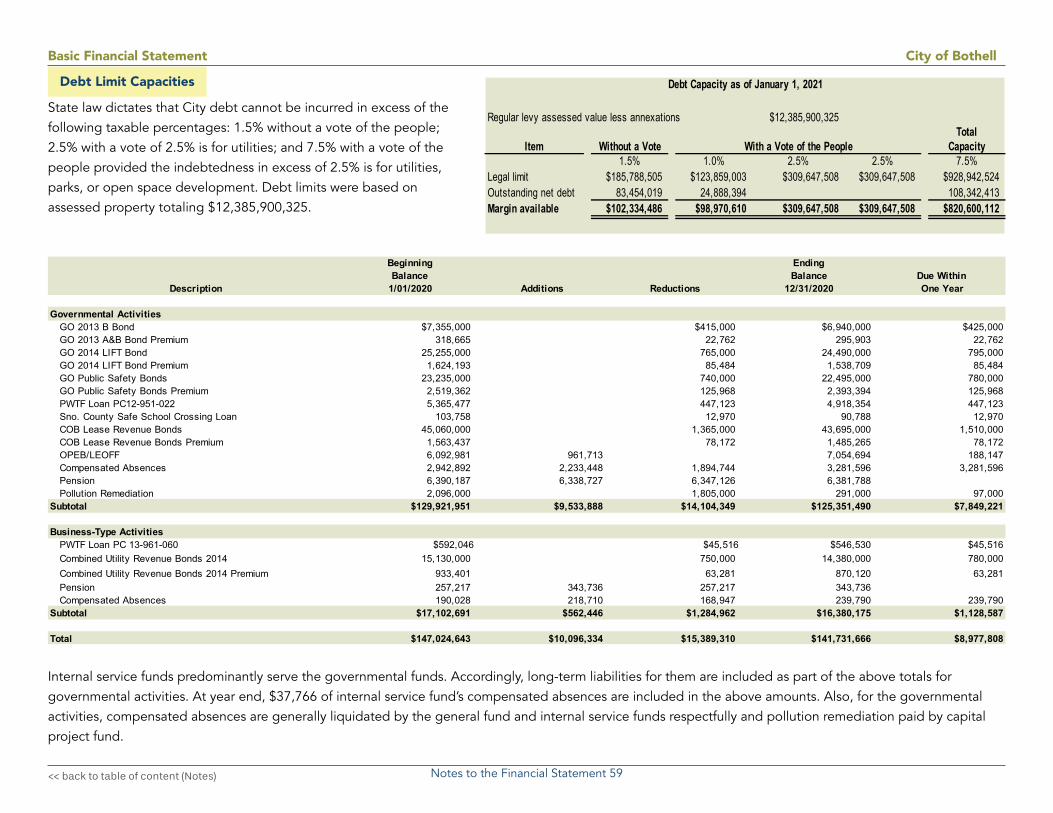
Basic Financial Statement City of Bothell
Notes to the Financial Statement 59<< back to table of content (Notes)
Debt Limit Capacities
State law dictates that City debt cannot be incurred in excess of the following taxable percentages: 1.5% without a vote of the people; 2.5% with a vote of 2.5% is for utilities; and 7.5% with a vote of the people provided the indebtedness in excess of 2.5% is for utilities, parks, or open space development. Debt limits were based on assessed property totaling $12,385,900,325.
Internal service funds predominantly serve the governmental funds. Accordingly, long-term liabilities for them are included as part of the above totals for governmental activities. At year end, $37,766 of internal service fund’s compensated absences are included in the above amounts. Also, for the governmental activities, compensated absences are generally liquidated by the general fund and internal service funds respectfully and pollution remediation paid by capital project fund.
Regular levy assessed value less annexations $12,385,900,325Total
Item Without a Vote With a Vote of the People Capacity1.5% 1.0% 2.5% 2.5% 7.5%
Legal limit $185,788,505 $123,859,003 $309,647,508 $309,647,508 $928,942,524Outstanding net debt 83,454,019 24,888,394 108,342,413Margin available $102,334,486 $98,970,610 $309,647,508 $309,647,508 $820,600,112
Debt Capacity as of January 1, 2021
Beginning Ending Balance Balance Due Within
Description 1/01/2020 Additions Reductions 12/31/2020 One Year
Governmental ActivitiesGO 2013 B Bond $7,355,000 $415,000 $6,940,000 $425,000GO 2013 A&B Bond Premium 318,665 22,762 295,903 22,762GO 2014 LIFT Bond 25,255,000 765,000 24,490,000 795,000GO 2014 LIFT Bond Premium 1,624,193 85,484 1,538,709 85,484GO Public Safety Bonds 23,235,000 740,000 22,495,000 780,000GO Public Safety Bonds Premium 2,519,362 125,968 2,393,394 125,968PWTF Loan PC12-951-022 5,365,477 447,123 4,918,354 447,123Sno. County Safe School Crossing Loan 103,758 12,970 90,788 12,970COB Lease Revenue Bonds 45,060,000 1,365,000 43,695,000 1,510,000COB Lease Revenue Bonds Premium 1,563,437 78,172 1,485,265 78,172OPEB/LEOFF 6,092,981 961,713 7,054,694 188,147Compensated Absences 2,942,892 2,233,448 1,894,744 3,281,596 3,281,596Pension 6,390,187 6,338,727 6,347,126 6,381,788Pollution Remediation 2,096,000 1,805,000 291,000 97,000
Subtotal $129,921,951 $9,533,888 $14,104,349 $125,351,490 $7,849,221
Business-Type ActivitiesPWTF Loan PC 13-961-060 $592,046 $45,516 $546,530 $45,516Combined Utility Revenue Bonds 2014 15,130,000 750,000 14,380,000 780,000Combined Utility Revenue Bonds 2014 Premium 933,401 63,281 870,120 63,281Pension 257,217 343,736 257,217 343,736Compensated Absences 190,028 218,710 168,947 239,790 239,790
Subtotal $17,102,691 $562,446 $1,284,962 $16,380,175 $1,128,587
Total $147,024,643 $10,096,334 $15,389,310 $141,731,666 $8,977,808
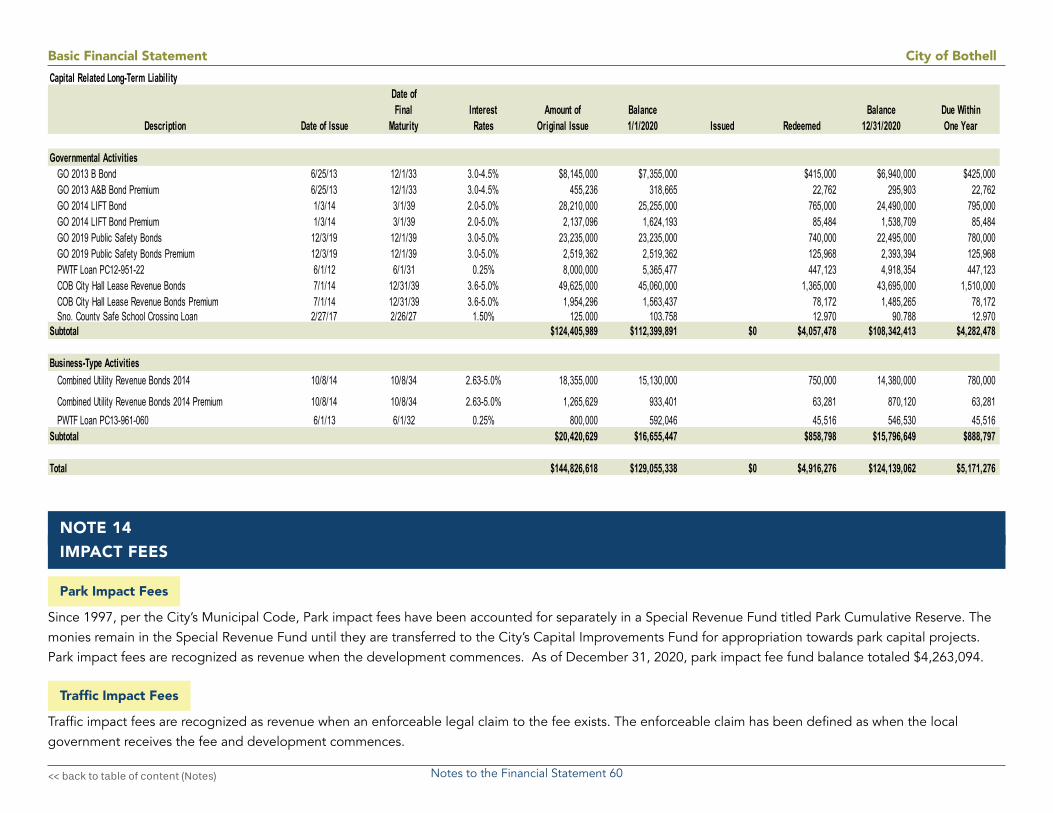
Basic Financial Statement City of Bothell
Notes to the Financial Statement 60<< back to table of content (Notes)
Capital Related Long-Term LiabilityDate ofFinal Interest Amount of Balance Balance Due Within
Description Date of Issue Maturity Rates Original Issue 1/1/2020 Issued Redeemed 12/31/2020 One Year
Governmental ActivitiesGO 2013 B Bond 6/25/13 12/1/33 3.0-4.5% $8,145,000 $7,355,000 $415,000 $6,940,000 $425,000GO 2013 A&B Bond Premium 6/25/13 12/1/33 3.0-4.5% 455,236 318,665 22,762 295,903 22,762GO 2014 LIFT Bond 1/3/14 3/1/39 2.0-5.0% 28,210,000 25,255,000 765,000 24,490,000 795,000GO 2014 LIFT Bond Premium 1/3/14 3/1/39 2.0-5.0% 2,137,096 1,624,193 85,484 1,538,709 85,484GO 2019 Public Safety Bonds 12/3/19 12/1/39 3.0-5.0% 23,235,000 23,235,000 740,000 22,495,000 780,000GO 2019 Public Safety Bonds Premium 12/3/19 12/1/39 3.0-5.0% 2,519,362 2,519,362 125,968 2,393,394 125,968PWTF Loan PC12-951-22 6/1/12 6/1/31 0.25% 8,000,000 5,365,477 447,123 4,918,354 447,123COB City Hall Lease Revenue Bonds 7/1/14 12/31/39 3.6-5.0% 49,625,000 45,060,000 1,365,000 43,695,000 1,510,000COB City Hall Lease Revenue Bonds Premium 7/1/14 12/31/39 3.6-5.0% 1,954,296 1,563,437 78,172 1,485,265 78,172Sno. County Safe School Crossing Loan 2/27/17 2/26/27 1.50% 125,000 103,758 12,970 90,788 12,970
Subtotal $124,405,989 $112,399,891 $0 $4,057,478 $108,342,413 $4,282,478
Business-Type ActivitiesCombined Utility Revenue Bonds 2014 10/8/14 10/8/34 2.63-5.0% 18,355,000 15,130,000 750,000 14,380,000 780,000
Combined Utility Revenue Bonds 2014 Premium 10/8/14 10/8/34 2.63-5.0% 1,265,629 933,401 63,281 870,120 63,281PWTF Loan PC13-961-060 6/1/13 6/1/32 0.25% 800,000 592,046 45,516 546,530 45,516
Subtotal $20,420,629 $16,655,447 $858,798 $15,796,649 $888,797
Total $144,826,618 $129,055,338 $0 $4,916,276 $124,139,062 $5,171,276
NOTE 14IMPACT FEES
Park Impact Fees
Since 1997, per the City’s Municipal Code, Park impact fees have been accounted for separately in a Special Revenue Fund titled Park Cumulative Reserve. The monies remain in the Special Revenue Fund until they are transferred to the City’s Capital Improvements Fund for appropriation towards park capital projects. Park impact fees are recognized as revenue when the development commences. As of December 31, 2020, park impact fee fund balance totaled $4,263,094.
Traffic Impact Fees
Traffic impact fees are recognized as revenue when an enforceable legal claim to the fee exists. The enforceable claim has been defined as when the local government receives the fee and development commences.

Basic Financial Statement City of Bothell
Notes to the Financial Statement 61<< back to table of content (Notes)
Traffic impact fees are held in the Arterial Street Fund until the City Council appropriates the monies toward approved capital improvement projects. As of December 31, 2020, traffic impact fund balance totaled $3,236,572.
Fire Impact Fees
In 2017, fire impact fees were enacted to ensure new development bears a share of the cost of capital facilities to accommodate new growth. Funds are used solely for capital improvements within the fire impact fee service areas. Funds are expended on a “first in/first out” accounting basis. At end of 2020, the City has cumulated fire impact fees $318,661 to support capital project needs.
NOTE 15POLLUTION REMEDIATION OBLIGATIONS
In 2010, the City implemented GASB Statement No. 49, Accounting and Financial Reporting for Pollution Remediation Obligations. This statement requires disclosure of “obligations to address current or potential detrimental effects of existing pollution by participating in pollution remediation activities”, and identifies five distinct “obligating events” that require the City to disclose the potential future outlays associated with remediation of contaminated sites.
Once any of the five events occurs, the City documents the components of expected pollution remediation outlays that are reasonably estimable. The City then determines if some or all of the future outlays are subject to capitalization under GASB Statement No. 49 and records those expenditures accordingly.
Pollution remediation outlays are capitalized when goods and services are acquired to prepare property in anticipation of a sale, or to prepare property for use when the property was acquired with known or suspected pollution that was expected to be remediated.Beginning in 2010, the City purchased properties for a downtown revitalization plan. As of December 31, 2020, the City has seven sites that constitute pollution remediation obligations. All sites are subject to capitalization, and all expenditures have been recorded according to GASB Statement No. 49.
The sites that constitute pollution remediation obligations are:
1) Bothell Landing* – Contaminated with petroleum in soil and groundwater.
2) Bothell Riverside* – Contaminated with petroleum in soil and groundwater, as well as chlorinated solvents in groundwater.
3) Bothell Paint & Decorating* – Contaminated with petroleum in soil and groundwater, as well as heavy metals in soil.
4) Former Hertz* – Contaminated with petroleum in soil and groundwater.
5) Bothell Ultra Custom Cleaners (aka Case) – Contaminated with chlorinated solvents in soil and groundwater.
6) Northshore School District – Contaminated with petroleum in soil and groundwater. The City is enrolled in Department of Ecology’s Voluntary Cleanup Program. The City performed petroleum remediation in 2010 and partnered with the Northshore School District in 2014 to clean up the off-site

Basic Financial Statement City of Bothell
Notes to the Financial Statement 62<< back to table of content (Notes)
1) contamination that was found on adjacent private property. Additional cleanup is currently being pursued under The Pollution Liability Insurance Agency (PLIA), as directed by the City manager.
2) Bothell Service Center (aka BSC) ** – Contaminated with chlorinated solvents in soil and groundwater.
3) Schuck’s/O’Reilly (aka Wexler) – Contaminated with petroleum in soil+ groundwater and chlorinated solvents groundwater (comingled BSC plume).
*Four of these sites lie in the pathway of the Crossroads realignment project and were acquired with known or suspected pollution that was expected to be remediated. These four parcels are enrolled in Agreed Orders (AO) under the Department of Ecology’s remedial oversight program.
**One of the sites lies in the pathway of the Main Street extension and was acquired with known or suspected pollution that was expected to be remediated. This parcel was initially enrolled in the Voluntary Clean-Up Program and was consequently enrolled in a consent decree for clean-up. The Wexler site is commingled with BSC site, and was thus incorporated into the BSD CD via an amendment.
In accordance with GASB Statement 49, future petroleum costs are presented as long-term liabilities. Future solvents, which require longer cleanup time, do not meet the criteria of pollution and remediation obligation under GASB 49, and therefore, are not considered long-term liabilities. (See Note 13)
2020 Pollution Remediation Liability
Site
*Bothell Landing
*Bothell Paint & Decorating
*Former Hertz
Northshore School District
Other Sites (McGee)
Total 429,756 291,000
56,156 111,000
249,030 30,000
22,290
2020Capitalized Costs
2020Future Costs (Liabilities)
47,989 45,000
54,291 105,000

Basic Financial Statement City of Bothell
Notes to the Financial Statement 63<< back to table of content (Notes)
NOTE 16LEASES
Operating Leases
The City has one operating lease, the Northshore School District Operational Facility Lease. The City leases bay area from the Northshore School District’s Operational Facility for the purpose of maintenance and repair of city-owned vehicles and equipment. As of December 2020, the monthly lease payment was $6,799.
Capital Lease
The City leases Bothell City Hall from COB Properties (COB) under a capital lease arrangement. In 2015, in compliance with GAAP, the City recorded capital lease asset at the present value of future minimum lease payments as of the inception date.
The asset (City Hall) acquired through capital lease is as follows:Governmental
Asset ActivitiesCity Hall Building $51,475,433Less: Accumulated depreciation (5,662,298)
Total $45,813,135
The present value of the future minimum lease obligations:Years Ending December 31 Capital Lease
2021 3,323,8442022 3,327,5942023 3,323,6152024 3,325,4272025 3,327,552Thereafter 46,285,888
Total $62,913,920

Basic Financial Statement City of Bothell
Notes to the Financial Statement 64<< back to table of content (Notes)
NOTE 17BLENDED COMPONENT UNIT
COB is a non-profit corporation created in 2014 pursuant to Internal Revenue Service Ruling 63-20, and issued $49,625.000 lease revenue bonds for the City Hall Project. Its sole purpose was to finance, construct and lease the city hall and parking garage to the City under a capital lease arrangement. Capital lease payments from the City are the single source to pay debt service on the bonds. As part of the capital lease agreement, the City pays monthly maintenance and asset management fees to COB.
In accordance with GAAP, the audited financial statements of this blended component unit are reported as an internal service fund in the City’s combining financial statements.
NOTE 18HEALTH & WELFARE
The City of Bothell is a member of the Association of Washington Cities Employee Benefit Trust Health Care Program (AWC Trust HCP). Chapter 48.62 RCW provides that two or more local government entities may, by Interlocal agreement under Chapter 39.34 RCW, form together or join a pool or organization for the joint purchasing of insurance, and/or joint self-insurance, to the same extent that they may individually purchase insurance or self-insure.
An agreement to form a pooling arrangement was made pursuant to the provisions of Chapter 39.34 RCW, the Interlocal Cooperation Act. The AWC Trust HCP was formed on January 1, 2014 when participating cities, towns, and non-city entities of the AWC Employee Benefit Trust in the State of Washington joined together by signing an Interlocal Governmental Agreement to jointly self-insure certain health benefit plans and programs for participating employees, their covered dependents and other beneficiaries through a designated account within the Trust.
As of December 31, 2020, 257 cities/towns/non-city entities participate in the AWC Trust HCP.
The AWC Trust HCP allows members to establish a program of joint insurance and provides health and welfare services to all participating members. The AWC Trust HCP pools claims without regard to individual member experience. The pool is actuarially rated each year with the assumption of projected claims run-out for all current members. The AWC Trust HCP includes medical, dental and vision insurance through the following carriers: Kaiser Foundation Health Plan of Washington, Kaiser Foundation Health Plan of Washington Options, Inc., Regence BlueShield, Asuris Northwest Health, Delta Dental of Washington, and Vision Service Plan. Eligible members are cities and towns within the state of Washington. Non-City Entities (public agency, public corporation, intergovernmental agency, or political subdivision within the state of Washington) are eligible to apply for coverage into the AWC Trust HCP, submitting application to the Board of Trustees for review as required in the Trust Agreement.

Basic Financial Statement City of Bothell
Notes to the Financial Statement 65<< back to table of content (Notes)
Participating employers pay monthly premiums to the AWC Trust HCP. The AWC Trust HCP is responsible for payment of all covered claims. In 2020, the AWC Trust HCP purchased stop loss insurance for Regence/Asuris plans at an Individual Stop Loss (ISL) of $1.5 million through Life Map, and Kaiser ISL at $1 million with Companion Life through ASG Risk Management. The aggregate policy is for 200% of expected medical claims.
Participating employers’ contract to remain in the AWC HCP for a minimum of three years. Participating employers with over 250 employees must provide written notice of termination of all coverage a minimum of 12 months in advance of the termination date, and participating employers with under 250 employees must provide written notice of termination of all coverage a minimum of 6 months in advance of termination date. When all coverage is being terminated, termination will only occur on December 31. Participating employers terminating a group or line of coverage must notify the HCP a minimum of 60 days prior to termination. A participating employer’s termination will not obligate that member to past debts, or further contributions to the HCP. Similarly, the terminating member forfeits all rights and interest to the HCP Account.
The operations of the Health Care Program are managed by the Board of Trustees or its delegates. The Board of Trustees is comprised of four regionally elected officials from Trust member cities or towns, the Employee Benefit Advisory Committee Chair and Vice Chair, and two appointed individuals from the AWC Board of Directors, who are from Trust member cities or towns.
The Trustees or its appointed delegates review and analyze Health Care Program related matters and make operational decisions regarding premium contributions, reserves, plan options and benefits in compliance with Chapter 48.62 RCW. The Board of Trustees has decision authority consistent with the Trust Agreement, Health Care Program policies, Chapter 48.62 RCW and Chapter 200-110-WAC.
The accounting records of the Trust HCP are maintained in accordance with methods prescribed by the State Auditor’s office under the authority of Chapter 43.09 RCW. The Trust HCP also follows applicable accounting standards established by the Governmental Accounting Standards Board (“GASB”). In 2020, the retiree medical plan subsidy was eliminated, and is noted as such in this report. Year-end financial reporting is done on an accrual basis and submitted to the Office of the State Auditor as required by Chapter 200-110 WAC. The audit report for the AWC Trust HCP is available from the Washington State Auditor’s office.
NOTE 19JOINT VENTURES AND OPERATIONS
A Regional Coalition for Housing (ARCH)
In November 1992, the City of Bothell joined the Cities of Kirkland, Bellevue, Redmond, and King County to establish A Regional Coalition for Housing (ARCH). The agreement was recently amended in 2010. Since its inception, King County, the Cities of Redmond, Bellevue, Kirkland, Bothell, Clyde Hill, Hunts Point, Issaquah, Kenmore, Mercer Island, Newcastle, Sammamish, Woodinville, Yarrow Point, and Beaux Arts Village joined ARCH.
ARCH’s purpose is to cooperatively formulate affordable housing goals and policies and to foster efforts to provide affordable housing for low and moderate-income households by combining public funding with private sector resources. ARCH assists member governments in developing housing policies, strategies,

Basic Financial Statement City of Bothell
Notes to the Financial Statement 66<< back to table of content (Notes)
programs, and development regulations; identifies and prioritizes projects which the member cities fund directly through their own grants, Community Development Block Grants and US Department of Housing and Urban Development’s (HUD) grants.
ARCH is governed by an Executive Board composed of a Chief Executive Officer from each member. The Executive Board is responsible for review and approval of all budgetary, financial, policy and contractual matters. The Board is assisted by an administrative staff and a Citizen Advisory Board.
Each member city provides operating funding and contributes operating revenues as specified in the annual budget for ARCH. Contributions from the member cities are based on each member’s population. Contributions by member agencies are held in the ARCH Housing Trust Fund Account and dispersed by the Administering Agency for approved projects. Members may withdraw from the ARCH agreement by giving one year’s written notice to the Executive Board, by December 31st of any year, of its intention to terminate, effective December 31st of the following year. Members remain legally and financially responsible for any obligation incurred while a member of ARCH. Upon dissolution, the agreement provides for distribution of all property and assets among the members based on the percentage of the total annual contributions during the period of the agreement paid by each member. The City’s share of assets is deemed immaterial and thus is not reflected in the financial statements.
In 2020, the City’s contributions totaled $167,384.
Budget monitoring information can be obtained from ARCH, c/o Art Sullivan, 16225 NE 87th Street, A-3, Redmond, WA 98052. 0911, Bellevue. WA 98015-0911.
eCityGov AllianceOn March 25, 2002, the City of Bellevue City Council unanimously adopted a resolution establishing the eCityGov Alliance between the City of Bellevue and the Cities of Bothell, Issaquah, Kenmore, Kirkland, Mercer Island, Sammamish and Snoqualmie. Since then, additional cities and agencies have joined. The Alliance establishes on-line services through a jointly operated internet portal. In 2014 eCityGov Alliance became a non-profit corporation. Expenditures consist of capital and operations costs as specified in the budget adopted by the eCityGov Alliance Executive Board, and Bellevue’s administrative costs associated with performing duties as the Alliance’s fiscal agent. Revenues consist of annual membership fees from the members of the eCityGov Alliance. In 2020, the City of Bothell paid dues totaling $51,938. The interlocal agreement may be terminated if Principals holding at least 66% of the weighted vote of all of the Principals are in concurrence. Upon termination, all property acquired shall be disposed of as follows: (1) property contributed without charge by any member shall revert to the contributor; (2) all property purchased after the effective date of the interlocal agreement shall be distributed to the Principals based upon each Principal’s proportional ownership interest at the time of the sale of the property. The City’s share of assets is deemed immaterial and thus not reflected in the financial statements.
Budget monitoring information may be obtained from City of Bellevue, Information Technology Department, c/o Tarik Rahmani, P.O. Box 90012, Bellevue, WA 98009.

Basic Financial Statement City of Bothell
Notes to the Financial Statement 67<< back to table of content (Notes)
North East King County Regional Public Safety Communications Agency (NORCOM)In November 2007, the City of Bothell, with the Cities of Bellevue, Kirkland, Clyde Hill, Medina, Mercer Island, and Snoqualmie, along with Eastside Fire and Rescue, King County Fire Protection Districts 27 and 45, King and Kittitas County Fire Protection District 51, Northshore Fire Department, Shoreline Fire Department, and Woodinville Fire and Life Safety District entered into an interlocal agreement to establish and maintain a consolidated emergency service communications center to the public for emergency medical services, fire and law enforcement. Prior to the interlocal agreement, the formation efforts were carried out under a Joint Powers Agreement originally approved in 2005 and amended in 2006 and 2007. On July 1st, 2009, the separate dispatch operations of the Cities of Bellevue and Kirkland were combined and began operating as the North East King County Regional Public Safety Communications Agency (or NORCOM).
The Bothell Police Department provides emergency service communications and dispatching services for its law enforcement personnel. Bothell and NORCOM are each Public Safety Answering Points (PSAP) for the purposes of the E9-1-1 system, which requires that each PSAP have a backup agency to provide emergency communications and dispatch services in the event of a disruption in the PSAP’s abilities to provide those services at its own primary facility. NORCOM serves as backup facilities for the Bothell Police Department.
NORCOM includes 911 telephone answering, computer aided dispatch of fire, police and EMS resources, public safety field technology and a records management system. Operating revenues are provided by user fees charged to each member based on average call volume. In 2020, the City of Bothell paid $380,163 for NORCOM services.
Additional financial information can be obtained from NORCOM, c/o Gwen Pilo, Finance Manager, P.O. Box 50911, Bellevue. WA 98015-0911. Hazardous Materials Unit and Response Team (HazMat)In January 1984, the City of Bothell joined the cities of Bellevue, Kirkland, Redmond, and King County Fire Protection Districts 16 and 36 to form a Hazardous Materials Unit and Response Team (HazMat). In December 1991, the agreement was modified to designate the City of Bellevue as the lead agency. Current members are the cities of Bellevue, Kirkland, Redmond, Bothell, Snoqualmie, and Duvall along with Eastside Fire & Rescue, Woodinville Fire & Life Safety, and King County Fire District 27.
The HazMat unit provides equipment and personnel for the management of hazardous material incidents as a normal function of fire protection services. The HazMat team is governed by a Joint Board comprised of the Fire Chiefs of the member agencies plus one member from the HazMat team. The Joint Board is responsible for formulating policy, establishing annual budgets, and acquiring, holding, and disposing of real and personal property. With the exception of the member from the HazMat team, each representative on the Joint Board has a vote on all matters.
The City of Bellevue has the administrative authority for operations conducted pursuant to the agreement and provides administrative and secretarial support to the Joint Board. Members withdrawing from the agreement relinquish all rights to any reserve funds, equipment, or material purchased. Upon dissolution, the agreement provides for distribution of assets among the members based on the percentage of the total annual charges paid by each member over the life of the

Basic Financial Statement City of Bothell
Notes to the Financial Statement 68<< back to table of content (Notes)
agreement. The City’s share of assets is deemed immaterial and thus is not reflected in the financial statements. Operating revenues are provided by an annual change assessed each member’s property values and number of emergency incidents. The City of Bothell’s assessment was $9,707 in 2020.
Budget monitoring information can be obtained from Eastside Hazardous Materials Joint Board, c/o Babette Bechtold, Bellevue Fire Department, 450 110th Ave NE, Bellevue, WA 98004.
Sound Cities Association (SCA) In 1970, Sound Cities Association (SCA) was formed to help cities act locally and partner regionally to create vital, livable communities through advocacy, education, leadership, mutual support and networking. The City of Bothell is among 38 cities represented by SCA having a population less than 150,000. The SCA Board of Directors oversees the general activities of the Association, and governs the organization by establishing broad policies and objectives for SCA. Operating revenues are provided by membership dues based on population. Upon dissolution of SCA, any funds or assets shall be distributed to member cities and towns pursuant to the same formula used to determine membership dues. The City’s share of assets is deemed immaterial and thus is not reflected in the financial statements. The City of Bothell’s dues were $19,038 in 2020.
For additional information contact Deanna Dawson, Executive Director, [email protected].
North Sound Metro SWAT In 2013, City of Bothell joined the North Sound Metro Special Weapons and Tactics (SWAT) Crisis Negotiating Team, which is a regional team made up of the following cities: Edmonds, Kirkland, Lake Forest Park, Lynnwood, Mill Creek, Monroe, Mountlake Terrace, Redmond, and Mukilteo. The Executive Board is comprised of the Police Chiefs of all participating cities. The Board reviews and approves changes and updates to the SWAT Policy and Procedures Manual and gives approval and direction on operational matters. Operating revenues are provided by contributions from the participating cities based on population. Upon termination of the SWAT team, any funds or jointly purchased assets will be distributed to the participating cities. The City’s share of assets is deemed immaterial and thus is not reflected in the financial statements. The City of Bothell’s dues were $4,929 for 2020. The City also contributed $28,786 as Bothell’s share of the consortium’s purchase of a Bearcat vehicle.
Budget monitoring information can be obtained from Assistant Chief Jim Lawless, City of Edmonds, 250 5th Ave North, Edmonds, WA 98020. Northshore Parks and Recreation Service Area (NPRSA) In 1988, pursuant to RCW 36.68.400, King and Snohomish Counties, along with the City of Bothell, entered into an interlocal agreement to implement and govern NPRSA, a quasi-municipal corporation. In 2001, King and Snohomish Counties, along with the Cities of Bothell, Woodinville, and Kenmore, entered into an amended interlocal agreement providing for representatives of each entity to participate in governance of NPRSA. Each entity makes financial contributions to defray costs associated with governing NPRSA. In 2019, voters within NPRSA’s taxing district approved a measure on the ballot raising the levy lid to $0.04/$1,000 of assessed value to cover costs for capital improvements to the two buildings owned by NPRSA. NPRSA is solely responsible for the maintenance of its real property and facilities, including but not limited to the buildings leased to the Northshore Senior Center.

Basic Financial Statement City of Bothell
Notes to the Financial Statement 69<< back to table of content (Notes)
NPRSA requires professional and administrative services to manage the capital projects, and implement the voter-approved levy. In 2020, NPRSA entered into an interlocal agreement with the City of Bothell to serve as its Administering Agency to provide professional and administrative services, on behalf of NPRSA, for the purpose of both managing their current facilities and effectuating repairs to said facilities as generally outlined in the Facility Condition Assessment prepared by EMG Corp, dated August 7, 2019. NPRSA pays the City actual value of services in order for the City to fully recover its costs. The King County treasurer remains NPRSA’s treasurer pursuant to RCW 36.68.500. NPRSA retains all other rights and responsibilities, including but not limited to levying and collecting taxes from the NPRSA’s taxing district, proposing legislation to its member agencies, approving budgets and adopting policies for budget expenditures, holding meetings following the requirements of the Open Public Meetings Act, entering into and authorizing execution of contracts for goods and services, adopting public procurement policies that do not conflict with those of the Administering Agency, retaining sole ownership of the property and buildings already under its ownership, overseeing the activities the Administering Agency provides to NPRSA, and any other obligations pursuant to any contract or local, state, or federal law.
In 2020, NPRSA reimbursed the City $195,000 for professional and administrative services.
North Sound Response Awareness, De-escalation, and Referral (RADAR) ProgramThe RADAR program is a partnership between King County Department of Community and Human Services and the five neighboring cities: Bothell, Lake Forest Park, Kenmore, Kirkland and Shoreline. The program is designed to give police access to mental health professionals who can connect individuals with behavioral health needs to community resources, thereby reducing the need for police and other emergency services. Through an interlocal agreement, the City of Bothell manages the RADAR Program civilian staff, including a full-time program manager and a community resource/social services worker, and also manages contracted services for several mental health professionals called Navigators. Costs associated with the RADAR program may be billed up to the maximum amount of available funding per year ($394,986 in 2020). The City of Bothell invoices DCHS on a monthly basis using a cost reimbursement model.
NOTE 20GOVERNMENTAL FUND BALANCES AND RECONCILIATION TO THE NET POSITION
Governmental fund balances are classified as either spendable or non-spendable. Spendable fund balances are further categorized as restricted, committed, assigned, and unassigned. Restricted amounts are constrained to specific purposes by higher levels of government (such as Federal or State), grantors, bondholders, constitutional provisions or enabling legislation. Committed amounts are amounts specified by the government itself (City Council), and cannot be used for any other purpose than specified by the City Council through resolution. Assigned amounts reflect an intent by the local government (City Council), to use for a specific purpose and delegates the authority to an official or body of the government. Unassigned amounts are available for any purpose of the government with only positive amounts that should be reported in the General Fund.

Basic Financial Statement City of Bothell
Notes to the Financial Statement 70<< back to table of content (Notes)
An itemization of designated fund balance categories from the Governmental Funds Balance Sheet is shown below:
Special RevenueFund Nonmajor Total
Arterial Capital Public Safety Governmental Governmental General Street Improvements Capital Funds Funds
Fund Balances:Restricted for:
Parks donations $91,780 $91,780Police donations 57,731 57,731Fire donations 35,451 35,451Tourism 193,015 193,015Tourism capital 289,060 289,060Fire Pension (from Fund 604) 358,749 358,749Transportation 3,236,572 3,236,572Parks and recreation 4,263,094 4,263,094Capital projects 6,682,050 22,972,584 29,654,634Street maintenance 3,223,639 3,223,639Drug forfeitures 11,035 109,884 120,919Fire impact fees 318,661 318,661Public safety levy 3,748,109 3,748,109Public safety GO bonds 3,626.19 3,626.19 Cemetery services 16,321 16,321
Committed to:
Advance travel 15,000 15,000 Imprest funds 1,750 1,750 Cemetery services 67,692 67,692Assigned to: Capital projects 1,711,130 1,711,130
Unassigned: 11,226,529 11,226,529Total $13,991,231 $3,236,572 $6,682,050 $22,972,584 $11,751,025 $58,633,462
Fund Balance for Governmental Funds December 31, 2020
Major Capital Projects Fund

Basic Financial Statement City of Bothell
Notes to the Financial Statement 71<< back to table of content (Notes)
The governmental fund balance sheet includes a reconciliation between fund balance – total governmental funds and net position – governmental activities as reported in the government-wide statement of net position. The elements of the reconciliation consist of all the noncurrent financial resources and therefore are not reported in the governmental funds as below:
■ Capital assets
■ Long-term outstanding debts
■ Pension/OPEB assets/liabilities/deferred outflows/inflows
■ Pollution remediation liabilities
■ Compensated absences liabilities
■ The assets and liabilities of internal service funds include in governmental activities in the statement of net position
Gov fund bal convert to Arterial Capital Public Safety Capital Comp Pollution Pension Deferred Outflows/ Deferred Inflow Net PositionGov wide net position General Street Improvements Capital Assets absences Liability Assets/Liabilities Inflows - Pension Revenue
Invest in capital net of debt 642,011,338 (80,912,173) (5,009,142) 556,090,023
Restricted
Net pension assets 9,569,760 106,398 9,676,158
General 667,037 667,037 667,037
Pension 358,749 358,749 358,749
Transportation 3,236,572 3,236,572 3,236,572
Parks and recreation 4,263,094 4,263,094 4,263,094
Capital projects 6,682,050 22,972,584 29,654,634 (22,421,098) 7,233,536
Street maintainance 3,223,639 3,223,639 3,223,639
Drug Forfeitures 11,035 109,884 120,919 120,919
Fire impact fees 318,661 318,661 318,661
Public safety levy 3,748,109 3,748,109 3,748,109
Public safety GO bonds 3,626 3,626 3,626
Cemetery services 16,321 16,321 16,321
Unrestricted 12,954,409 67,692 13,022,101 (3,281,596) (7,054,694) (291,000) (6,381,788) 763,368 788,473 2,576,520 141,384
Total 13,991,231 3,236,572 6,682,050 22,972,584 11,751,025 58,633,462 642,011,338 (103,333,271) (5,009,142) (3,281,596) (7,054,694) (291,000) 3,187,972 869,766 788,473 2,576,520 589,097,828
Reconciliation of the Governmental Funds Balance Sheet to the Statement of Net Position
Fund Balance for Governmental funds Net Position of Governmental ActivitiesOther
Governmental
Total Governmental
FundsGO bond PWTF Loan OPEB Internal Service
Funds

Basic Financial Statement City of Bothell
Notes to the Financial Statement 72<< back to table of content (Notes)
NOTE 21TAX ABATEMENT
Tax abatement is a reduction in tax revenues that result from an agreement between one or more governments and an individual or entity in which: a) one or more governments promise to forgo tax revenues to which they are otherwise entitled, and b) the individual or entity promises to take a specific action after the agreement has been entered into that contributes to economic development or otherwise benefits the governments or the citizens of those governments. The City of Bothell, itself, does not have any tax abatement agreements with other entities or individuals. However, the State of Washington provides various tax abatement programs that reduce the amount of tax revenues that flow through to the local jurisdictions. In 2020, the Department of Revenue provided tax abatement programs to biotechnology and high-technology entities within the city limits which reduced the City’s sales tax revenues by $140,420 and $274,607 respectively. The Department of Revenue’s reported figures are estimates for fiscal year 2020.
Additional information regarding the state tax abatement programs can be found on the Department of Revenue’s website: https://dor.wa.gov/doing-business/information-local-governments/governmental-accounting-standards-board-gasb-statement-no-77
NOTE 22 ACCOUNTING AND REPORTING CHANGES
GASB Implementation
The Governmental Accounting Standards Board (GASB) establishes generally accepted accounting principles (GAAP) for U.S. state and local governments. In 2020, the City reviewed the GASB pronouncements effective for reporting year 2020. The summary of current accounting and financial reporting standards showing below.
2020 GASB IMPLEMENTATION
GASB DESCREPTION IMPLEMENTATION NOTES
83 Certain Asset Retirement Obligations (ARO) No ARO reported
84 Fiduciary Activities Implemented
88 Certain Disclosures Related to Debt No change
90 Majority Equity Interests - an amendment of GASB No. 14 and No. 61 No change
95 Postponement of the Effective Dates of Certain Authoritative Guidance Implemented

Basic Financial Statement City of Bothell
Notes to the Financial Statement 73<< back to table of content (Notes)
GASB 83 Asset Retirement Obligation (ARO) is a legally enforceable liability associated with the retirement of a tangible capital asset. A government is required to incur costs for the retirement of a tangible capital asset and recognized an ARO. ARO’s can occur with the retirement of tangible capital assets, disposal of a tangible capital asset or environmental remediation required as part of an asset retirement. All three possibilities are the result of the normal operation of the tangible capital asset. In reviewing the retirement of the City’s capital assets in 2020, the City had no obligatory event occur to meet ARO criteria. Therefore, the City determined that ARO reporting was not applicable.
GASB 88 Certain Disclosures Related to Debt defines debt disclosure in notes to financial statements as a liability that arises from a contractual obligation to pay cash (or other assets that may be used in lieu of cash) in one or more payments to settle an amount that is fixed at the date the contractual obligation is established. This Statement also requires the disclosure including unused lines of credit; assets pledged as collateral for the debt; and terms specified in debt agreements related to significant events of default with finance-related consequences, significant termination events with finance-related consequences, and significant subjective acceleration clauses. The City did not have any debt subject to GASB 88 disclosures, and thus, the debt disclosure remained the same as prior year.
GASB 90 Majority Equity Interests (MEI) applies the situation that a government holds a financial interest with partial or complete ownership of a legally separate entity. MEI is an amendment of GASB 14 and GASB 61, which the City implemented in 2014 as COB Properties was created for the sole purpose to finance the City Hall building. In accordance with these GASB’s, COB Properties, a legally separate entity, is a blended component unit of the City. The City’s accounting and reporting remained the same under GASB 90.
GASB 95 Postponement of the Effective Dates of Certain Authoritative Guidance is to provide temporary relief to governments and other stakeholders in light of the COVID-19 pandemic. That objective is accomplished by postponing the effective dates of certain provisions which the City complied in 2020.
GASB 84 Fiduciary Activities was implemented in the City’s 2019 reporting, but no fiduciary activities were reported. In 2020, the City reevaluated certain financial transactions and determined the fiduciary criteria had been met. Therefore, the City reported fiduciary activities, and created the financial statement of fiduciary net position and change in fiduciary net position.
Activities that should be reported in fiduciary funds consist of the following (GASB 84 paragraph 15-18):
■ Pension/OPEB
■ Investment trust funds
■ Private-purpose trust funds
■ Custodial funds
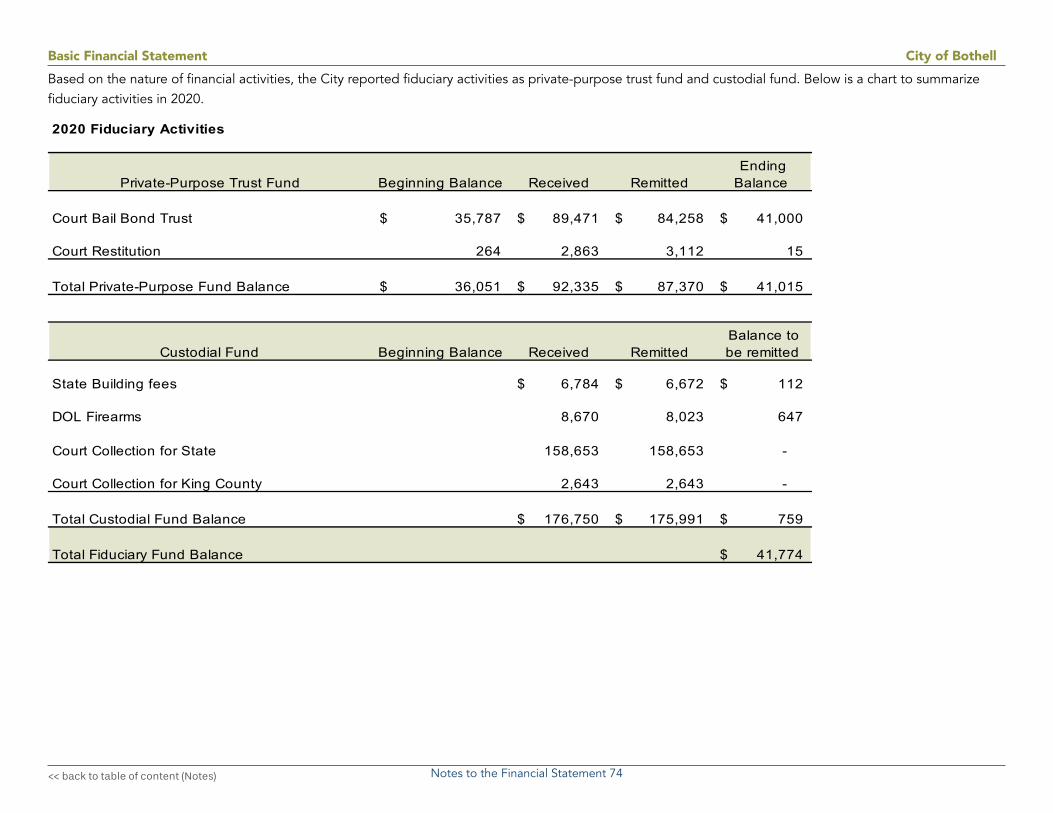
Basic Financial Statement City of Bothell
Notes to the Financial Statement 74<< back to table of content (Notes)
Based on the nature of financial activities, the City reported fiduciary activities as private-purpose trust fund and custodial fund. Below is a chart to summarize fiduciary activities in 2020.
2020 Fiduciary Activities
Private-Purpose Trust Fund Beginning Balance Received Remitted Ending Balance
Court Bail Bond Trust 35,787$ 89,471$ 84,258$ 41,000$
Court Restitution 264 2,863 3,112 15
Total Private-Purpose Fund Balance 36,051$ 92,335$ 87,370$ 41,015$
Custodial Fund Beginning Balance Received Remitted Balance to be remitted
State Building fees 6,784$ 6,672$ 112$
DOL Firearms 8,670 8,023 647
Court Collection for State 158,653 158,653 -
Court Collection for King County 2,643 2,643 -
Total Custodial Fund Balance 176,750$ 175,991$ 759$
Total Fiduciary Fund Balance 41,774$

Basic Financial Statement City of Bothell
Notes to the Financial Statement 75<< back to table of content (Notes)
Prior Period AdjustmentsDue to the reestablishment of fiduciary funds in implementing GASB 84, the City restated the beginning fund balance of $36,051 which was reported in General Fund as municipal court trust in previous years.
During the 2019 financial audit, the City identified a miscalculation in the depreciation calculation of the Monte Villa Bridge between 2007 and 2010. The error resulted in an understated book value and overstated accumulated depreciation of $6,121,043. The amount was adjusted to the beginning net position of governmental activities on the Statement of Activities.
Period Original Correct Variation1994 (2,144,746) (2,144,746) - 1995 (4,289,492) (4,289,492) - 1996 (4,289,492) (4,289,492) - 1997 (4,289,492) (4,289,492) - 1998 (4,289,492) (4,289,492) - 1999 (4,289,492) (4,289,492) - 2000 (4,289,492) (4,289,492) - 2001 (4,289,492) (4,289,492) - 2002 (4,289,492) (4,289,492) - 2003 (4,289,492) (4,289,492) - 2004 (4,289,491) (4,289,491) - 2005 (4,289,492) (4,289,492) - 2006 (4,289,492) (4,289,492) - 2007 (6,354,802) (4,289,492) (2,065,311) 2008 (6,599,218) (4,289,491) (2,309,726) 2009 (6,863,186) (4,289,492) (2,573,695) 2010 (7,149,153) (4,289,492) (2,859,661) 2011 (3,956,289) (4,289,492) 333,202 2012 (3,956,289) (4,289,491) 333,202 2013 (3,854,159) (4,289,492) 435,333 2014 (3,854,159) (4,289,492) 435,333 2015 (3,854,159) (4,289,492) 435,333 2016 (3,854,159) (4,289,491) 435,333 2017 (3,854,159) (4,289,492) 435,333 2018 (3,867,351) (4,289,492) 422,141 2019 (3,867,351) (4,289,492) 422,141
Total (115,503,077) (109,382,034) (6,121,043)
Asset # 201043 MONTE VILLA PRKWY BRIDGEDepreciation
NOTE 23SUBSEQUENT EVENT
Fire Station Bond Program
The design-builder for the Bothell Fire Station 42 and 45 Replacement Project provided a Guaranteed Maximum Price (GMP) to the City, a culmination of a cooperative effort and in accordance with the design-build contract. When combined with other project-specific scope requirements and current market conditions, the GMP total estimated project cost exceeds the approved $35.5 million bond amount by approximately $2.5million.

Basic Financial Statement City of Bothell
Notes to the Financial Statement 76<< back to table of content (Notes)
In February 2021, City Council approved the following to fund project costs in excess of the bond proceeds:
Fire Impact Fees, Accumulated balance 325,000 Fire Impact Fees, Long term line of credit 1,800,000 General Fund Contribution 375,000 Total Funding Excess of Bond Proceeds $2,500,000
Construction is expected to begin on both fire stations in summer of 2021.
NOTE 24COVID-19 PANDEMIC
2020 was a year significantly impacted by the COVID-19 pandemic. Early in the year the City took swift action to mitigate the effects which included employee furloughs, layoffs, and other hiring/vacancy strategies, along with exercising strict budget discipline. Disruptions to revenue from the pandemic were sizable, but short lived. Revenues trended towards a recovery in the second half of 2020 and expenditure savings continued on trend until the end of the year.
The financial health of the organization was maintained largely due to measures taken early in the pandemic to reduce expenditures, and unbudgeted CARES Act funding. Unassigned fund balance in the General Fund increased by 10% in 2020.
Moving forward into 2021, the City continues to monitor any remaining effects from the pandemic.
In early 2021, the American Rescue Plan Act (ARP) went into law. Under the plan U.S. cities and towns will receive $65.1 billion in direct and flexible federal funds. Washington cities are projected to receive more than $1.1 billion in federal funding. While it is unknown at this time what portion of funds will be distributed to Bothell, the funds may be used for the following:
■ Responding to the COVID-19 pandemic
■ Covering costs incurred from the public health emergency
■ Replacing lost, delayed, or decreased revenues due to COVID-19
■ Addressing the negative economic impacts on local businesses and nonprofits
■ Making necessary investments in water, sewer, and broadband infrastructure
Fire Impact Fees, Accumulated balance 325,000
Fire Impact Fees, Long term line of credit 1,800,000
General Fund Contribution 375,000
Total Funding Excess of Bond Proceeds $2,500,000


REQUIREDSUPPLEMENTALINFORMATION

Required Supplemental Information City of Bothell
Required Supplemental Informationt 1

Required Supplemental Information City of Bothell
Required Supplemental Informationt 2

Required Supplemental Information City of Bothell
Required Supplemental Informationt 3

Required Supplemental Information City of Bothell
Required Supplemental Informationt 4
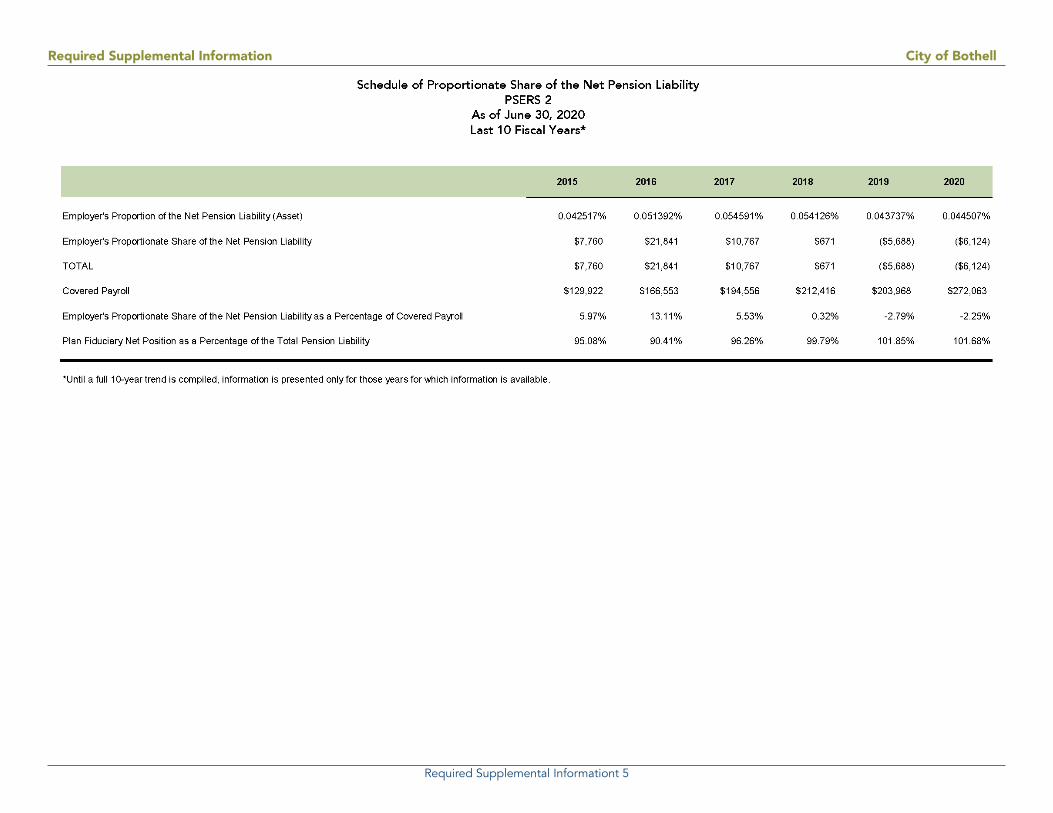
Required Supplemental Information City of Bothell
Required Supplemental Informationt 5
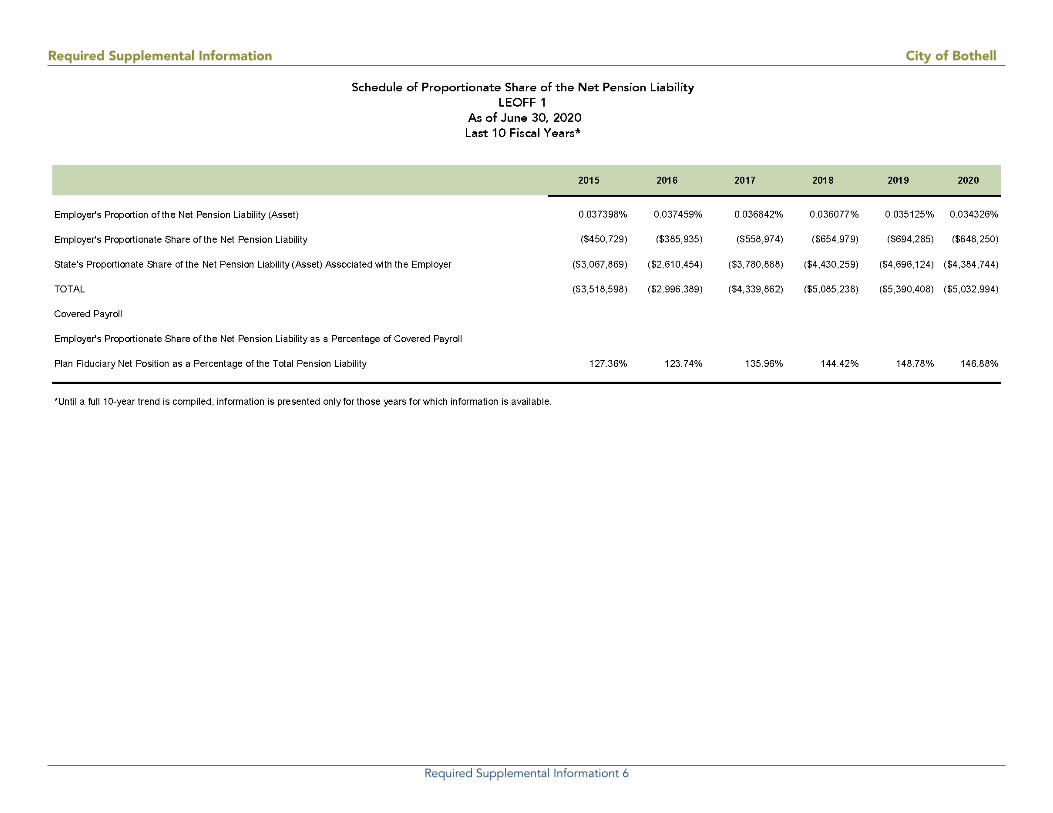
Required Supplemental Information City of Bothell
Required Supplemental Informationt 6

Required Supplemental Information City of Bothell
Required Supplemental Informationt 7

Required Supplemental Information City of Bothell
Required Supplemental Informationt 8
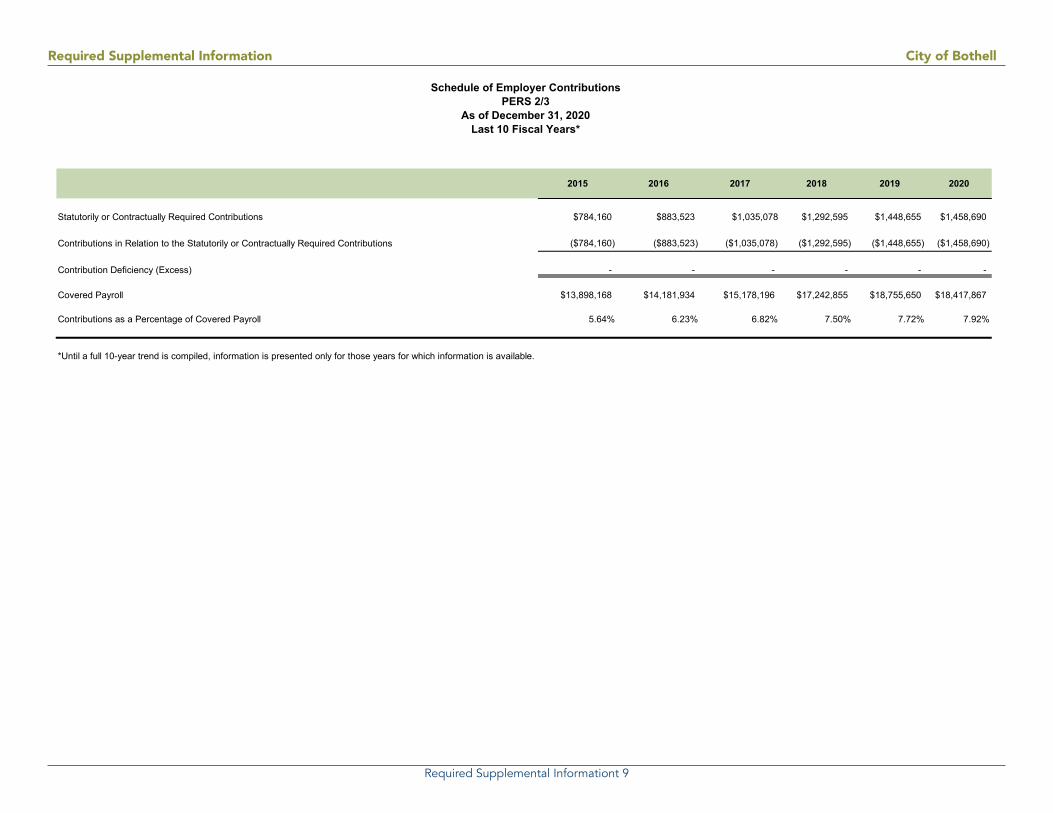
Required Supplemental Information City of Bothell
Required Supplemental Informationt 9
Schedule of Employer Contributions PERS 2/3
As of December 31, 2020Last 10 Fiscal Years*
2015 2016 2017 2018 2019 2020
Statutorily or Contractually Required Contributions $784,160 $883,523 $1,035,078 $1,292,595 $1,448,655 $1,458,690
Contributions in Relation to the Statutorily or Contractually Required Contributions ($784,160) ($883,523) ($1,035,078) ($1,292,595) ($1,448,655) ($1,458,690)
Contribution Deficiency (Excess) - - - - - -
Covered Payroll $13,898,168 $14,181,934 $15,178,196 $17,242,855 $18,755,650 $18,417,867
Contributions as a Percentage of Covered Payroll 5.64% 6.23% 6.82% 7.50% 7.72% 7.92%
*Until a full 10-year trend is compiled, information is presented only for those years for which information is available.

Required Supplemental Information City of Bothell
Required Supplemental Informationt 10

Required Supplemental Information City of Bothell
Required Supplemental Informationt 11

Required Supplemental Information City of Bothell
Required Supplemental Informationt 12

Required Supplemental Information City of Bothell
Required Supplemental Informationt 13

Required Supplemental Information City of Bothell
Required Supplemental Informationt 14

Required Supplemental Information City of Bothell
Required Supplemental Informationt 15


COMBININGFINANCIALSTATEMENTS

Combining Financial Statements City of Bothell
NON-MAJOR OTHER GOVERNMENTAL FUNDS
Special Revenue Funds
Special Revenue Funds are used to account for specific revenues that are legally restricted to expenditure for particular purposes. ■ Street Funds - This fund is used to account for all maintenance & operation functions for the City’s transportation system.
■ Park Cumulative Reserve Fund - This fund is used for the acquisition & development of parks.
■ Drug Forfeiture Fund - This fund is used to account for monies sezed during drug policing activities.
■ Fire Impact Fees Fund - This fund is used for capital improvements to accomodate new growth.
■ Public Safety Levy Fund – This fund is used to account for public safety operational functions for the public safety levy lid lift.
Permanent Funds
Permanent Funds are used to report resources that are legally restricted to the extent that only earnings, not principal, may be used for purposes that support the reporting government’s programs.
■ Cemetery Endowment Fund - This fund account for cemetery plot sales, donations, and investment earnings.
Debt Service Funds
Debt Service Funds funds are used to account for specific revenues that are legally restricted to expenditure for particular purposes. ■ 2013 General Obligation Bond Fund - This fund accounts for the retirement of general purpose bonds issued for public improvements related to the
Downtown Revitalization.
■ 2014 Local Infrastructure Financing Tool (LIFT) Bond Fund – This fund accounts for the retirement of general purpose bonds issued for public improvements related to LIFT funding for the City’s designated Revenue Development Area (RDA).

Combining Financial Statements City of Bothell
Combining Financial Statements 1

Combining Financial Statements City of Bothell
Combining Financial Statements 2
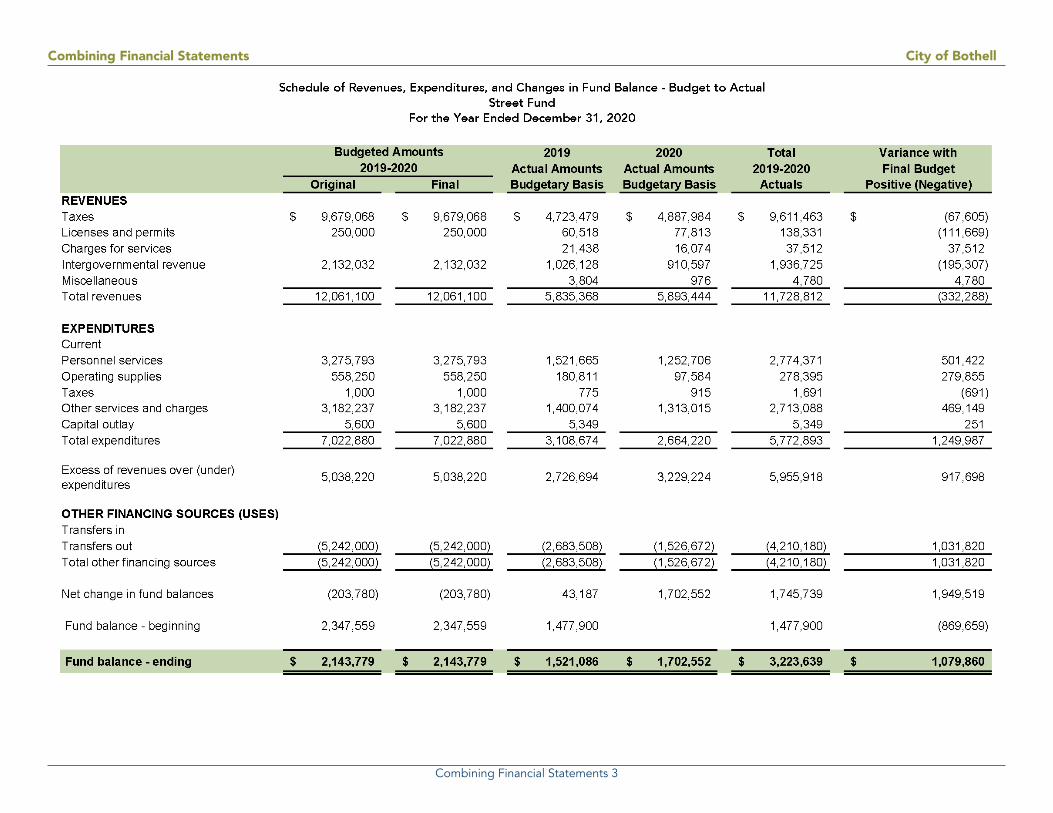
Combining Financial Statements City of Bothell
Combining Financial Statements 3

Combining Financial Statements City of Bothell
Combining Financial Statements 4

Combining Financial Statements City of Bothell
Combining Financial Statements 5

Combining Financial Statements City of Bothell
Combining Financial Statements 6

Combining Financial Statements City of Bothell
Combining Financial Statements 7

Combining Financial Statements City of Bothell
Combining Financial Statements 8

Combining Financial Statements City of Bothell
Combining Financial Statements 9

Combining Financial Statements City of Bothell
Combining Financial Statements 10

Combining Financial Statements City of Bothell
Combining Financial Statements 11

Combining Financial Statements City of Bothell
Combining Financial Statements 12

Combining Financial Statements City of Bothell
Combining Financial Statements 13

Combining Financial Statements City of Bothell
Combining Financial Statements 14

Combining Financial Statements City of Bothell
Combining Financial Statements 15
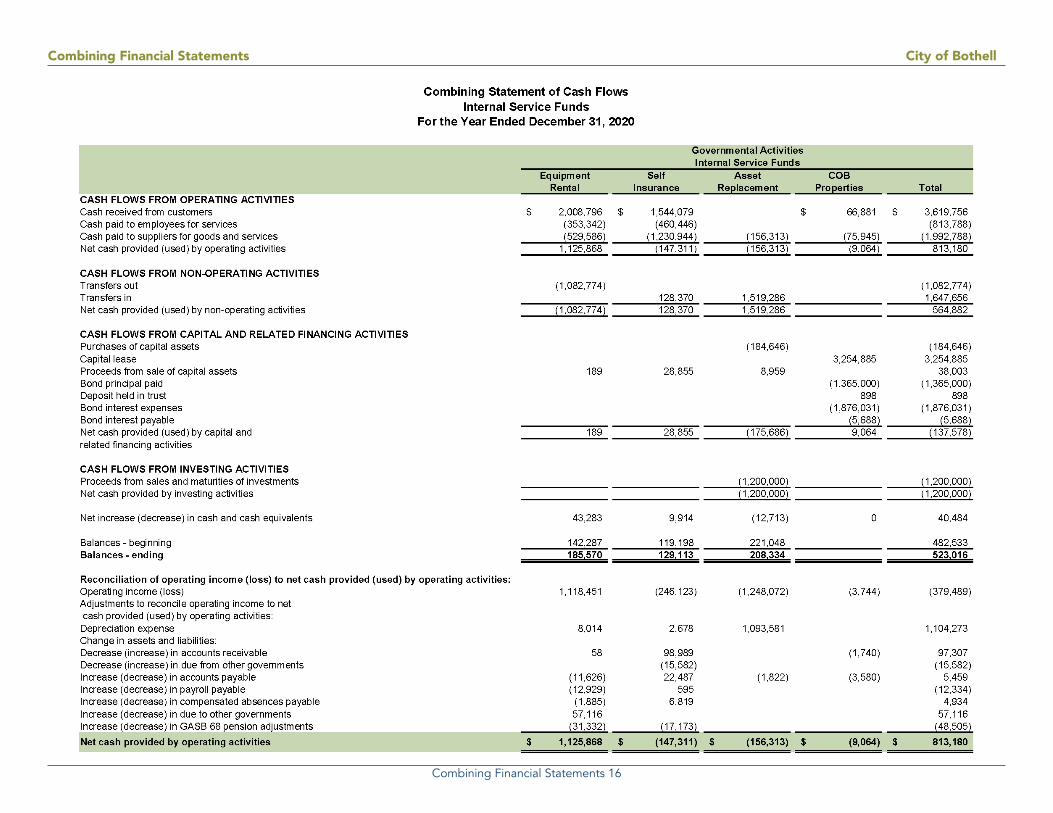
Combining Financial Statements City of Bothell
Combining Financial Statements 16


SUPPLEMENTALINFORMATION

Supplemental Information City of Bothell
This schedule is presented as supplemental information 1
2019 2020 Total Variance withActual Amounts Actual Amounts 2019-2020 Final Budget
Original Final Budgetary Basis Budgetary Basis Actuals Positive (Negative)OPERATING REVENUESCharges for services 11,864,398$ 11,864,398$ 5,800,406$ 5,287,886$ 11,088,292$ (776,106)$ Other operating revenue 70,000 70,000 72,672 2,568 75,240 5,240
Total operating revenues 11,934,398 11,934,398 5,873,078 5,290,454 11,163,532 (770,866)
OPERATING EXPENSESAdministrative and general 1,885,682 1,885,682 892,691 909,514 1,802,206 83,476 Purchase water 3,544,971 3,544,971 1,727,957 1,529,448 3,257,406 287,565 Maintenance and operation 2,086,775 2,086,775 872,235 1,017,072 1,889,308 197,467 Customer accounts 479,287 479,287 254,762 212,220 466,981 12,306 Taxes 1,444,867 1,444,867 774,039 775,454 1,549,493 (104,626) Capital outlay 3,376,200 3,376,200 3,376,200 Debt 310,000 310,000 310,000 Depreciation and amortization 1,566,548 1,566,548 812,736 851,200 1,663,935 (97,387) Total operating expenses 14,694,330 14,694,330 5,334,420 5,294,909 10,629,329 4,065,001
OPERATING INCOME (LOSS) (2,759,932) (2,759,932) 538,658 (4,455) 534,204 3,294,136
NON-OPERATING REVENUES (EXPENSES)Investment earnings 556 556 556 Intergovernmental revenues 257 1,130 1,387 1,387 Miscellaneous revenue 45,427 45,427 45,427 Interfund loan (1,000,000) 1,000,000 Interest expense (242,862) (242,862) (111,086) (105,086) (216,173) 26,689 Total non-operating revenue (expense) (242,862) (1,242,862) (110,273) (58,529) (168,802) 1,074,060
Income (loss) before contributions and transfers (3,002,794) (4,002,794) 428,385 (62,983) 365,402 4,368,196 Transfers inTransfers out (81,334) (81,121) (162,455) (162,455) Contributions 118,028 246,273 364,301 364,301
Net position - beginning January 1, 2019 18,533,498 18,533,498 20,103,768 20,103,768 1,570,270
Net position - ending December 31, 2020 15,530,704$ 14,530,704$ 20,568,847$ 102,169$ 20,671,015$ 6,140,311$
2019-2020Budgeted Amounts

Supplemental Information City of Bothell
This schedule is presented as supplemental information 2
2019 2020 Total Variance withActual Amounts Actual Amounts 2019-2020 Final Budget
Original Final Budgetary Basis Budgetary Basis Actuals Positive (Negative)OPERATING REVENUESCharges for services 16,605,575$ 16,605,575$ 8,302,201$ 8,016,169$ 16,318,370$ (287,205)$ Other 36,654 23,682 60,335 60,335 Total operating revenues 16,605,575 16,605,575 8,338,855 8,039,850 16,378,705 (226,870)
OPERATING EXPENSESAdministrative and general 2,665,921 2,665,921 1,316,497 1,294,105 2,610,602 55,319 Metro service 9,015,494 9,015,494 4,552,004 4,481,525 9,033,529 (18,035) Maintenance and operation 1,424,698 1,424,698 735,281 771,098 1,506,380 (81,682) Customer accounts 462,287 462,287 254,755 214,616 469,372 (7,085) Taxes 1,116,011 1,116,011 577,580 585,891 1,163,471 (47,460) Capital outlay 4,429,200 4,429,200 4,429,200 Debt 140,000 140,000 140,000 Depreciation and amortization 1,240,963 1,240,963 598,221 612,384 1,210,605 30,358 Total operating expenses 20,494,574 20,494,574 8,034,340 7,959,619 15,993,958 4,500,616
OPERATING INCOME (LOSS) (3,888,999) (3,888,999) 304,515 80,232 384,747 4,273,746
NON-OPERATING REVENUE (EXPENSE)Investment earnings 1,445 1,445 1,445 Intergovernmental revenues 278 872 1,150 1,150 Interfund loan (1,000,000) 1,000,000 Interest expense (109,112) (109,112) (49,910) (47,110) (97,019) 12,093 Total non-operating revenue (expense) (109,112) (1,109,112) (48,187) (46,238) (94,425) 1,014,687
Income (loss) before contributions and transfers (3,998,111) (4,998,111) 256,329 33,994 290,322 5,288,433 Transfers inTransfers out (77,338) (77,117) (154,455) (154,455) Contributions 44,314 189,385 233,699 233,699
Net position - beginning January 1, 2019 7,416,987 7,416,987 19,724,744 19,724,744 12,307,757
Net position - ending December 31, 2020 3,418,876$ 2,418,876$ 19,948,048$ 146,262$ 20,094,310$ 17,675,434$
Budgeted Amounts2019-2020
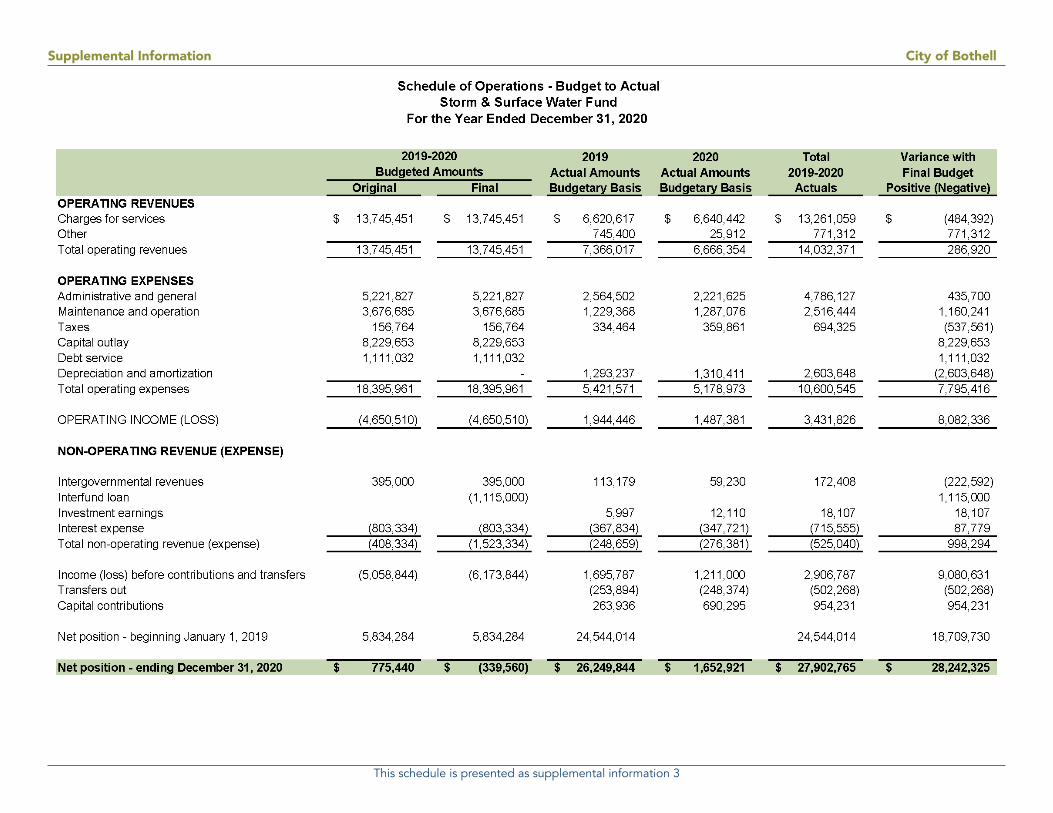
Supplemental Information City of Bothell
This schedule is presented as supplemental information 3

Supplemental Information City of Bothell
This schedule is presented as supplemental information 4

Supplemental Information City of Bothell
This schedule is presented as supplemental information 5
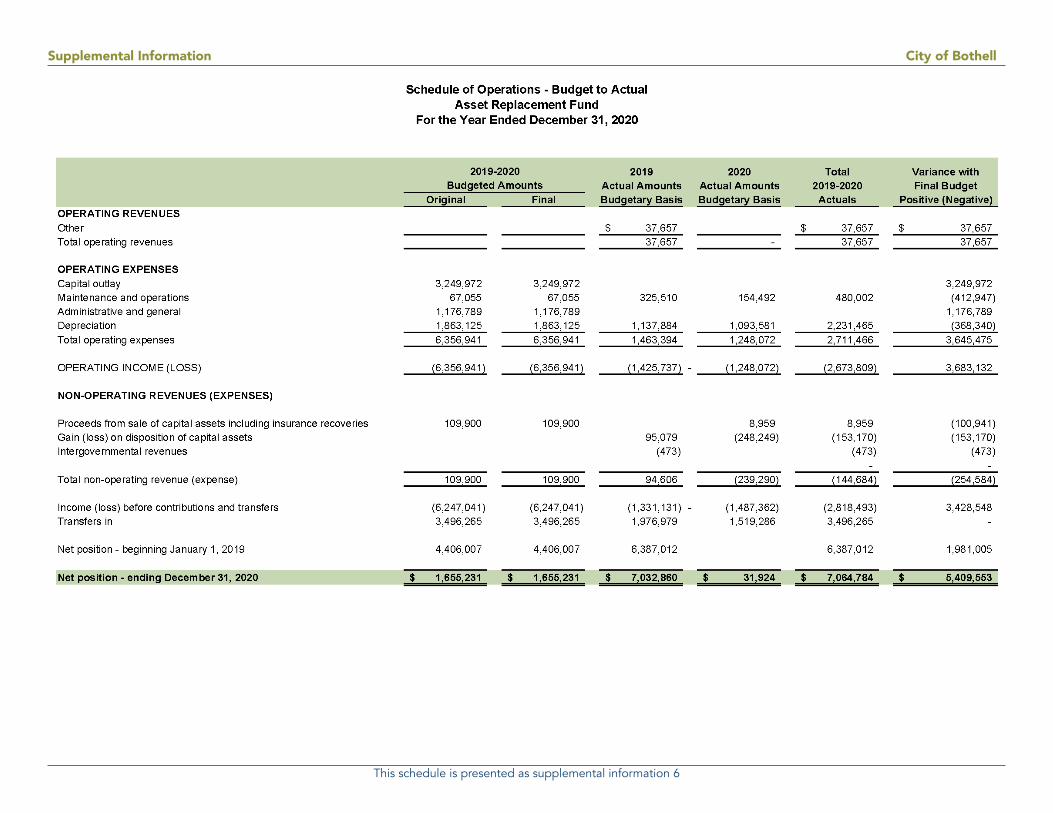
Supplemental Information City of Bothell
This schedule is presented as supplemental information 6

Supplemental Information City of Bothell
This schedule is presented as supplemental information 7

Supplemental Information City of Bothell
This schedule is presented as supplemental information 8

Supplemental Information City of Bothell
This schedule is presented as supplemental information 9

Supplemental Information City of Bothell
This schedule is presented as supplemental information 10

Supplemental Information City of Bothell
This schedule is presented as supplemental information 11
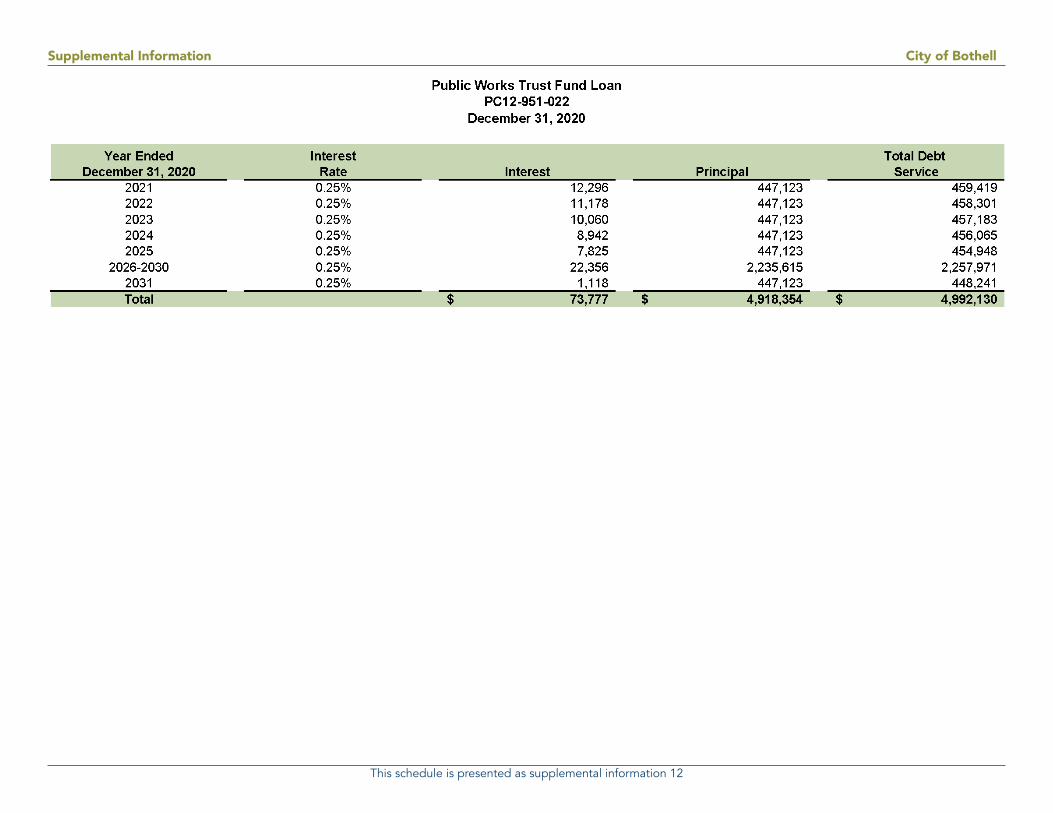
Supplemental Information City of Bothell
This schedule is presented as supplemental information 12

Supplemental Information City of Bothell
This schedule is presented as supplemental information 13

Supplemental Information City of Bothell
This schedule is presented as supplemental information 14

Supplemental Information City of Bothell
This schedule is presented as supplemental information 15

Supplemental Information City of Bothell
This schedule is presented as supplemental information 16


STATISTICALINFORMATION

Statistical Information City of Bothell
1-4Financial TrendsThese schedules contain trend information to help the reader understand how the City’s financial performance and well-being have changed over time.
5-10Revenue CapacityThese schedules contain information to help the reader assess the factors affecting the City’s ability to generate its property and sales taxes.
11-16Debt CapacityThese schedules present information to help the reader assess the affordability of the City’s current levels of outstanding debt and the City’s ability to issue additional debt in the future.
17-18Demographic & Economic InformationThese schedules offer demographic and economic indicators to help the reader understand the environment within which the City’s financial activities take place and to help make comparisons over time and with other governments.
19-21Operation InformationThese schedules contain information about the City’s operations and resources to help the reader understand how the City’s financial information relates to the services the City provides and the activities it performs.
TABLE OF CONTENTSThis part of the City of Bothell’s comprehensive annual financial report presents detailed data as a context for understanding what the information in the financial statements, note disclosures, and required supplementary information says about the City’s overall financial health.
Sources: Unless otherwise noted, the information in these schedules is derived from the comprehensive annual financial reports for the relevant year. The City implemented GASB Statement No. 34 in 2002; schedules presenting government-wide information include information beginning in that year.

Statistical Information City of Bothell
Statistical Information 1
Net Position by ComponentLast Ten Fiscal Years (accrual basis of accounting)
2011 2012 2013 2014 2015 2016 2017 2018 2019 2020
Governmental activities
Net investment in capital assets $772,845,492 $746,225,080 $720,584,679 $709,089,935 $677,138,001 $645,750,647 $623,606,770 $598,724,468 $571,700,385 $556,090,023
Restricted 9,780,831 7,578,092 12,554,203 15,409,677 17,584,435 25,939,390 22,700,029 28,308,719 31,772,391 32,866,421
Unrestricted 4,879,019 3,614,460 3,262,857 1,729,590 (5,769,209) (9,553,063) (6,089,735) (14,949,438) (9,884,774) 141,384
Total governmental activities net position 787,505,342 757,417,631 736,401,739 726,229,202 688,953,226 662,136,973 640,217,064 612,083,749 593,588,002 589,097,828
Business-type activities
Net investment in capital assets 32,660,784 33,185,063 34,892,575 37,917,645 39,266,084 43,249,528 42,785,330 43,768,023 45,672,414 46,215,411
Restricted 1,316,369 1,316,369 1,316,369 1,316,369 1,316,369 1,316,369 1,316,369
Unrestricted 1,771,470 3,074,506 4,531,648 4,435,715 7,451,903 10,476,648 15,245,386 19,288,134 19,777,955 21,136,310
Total business-type activities net position 34,432,254 36,259,569 39,424,223 43,669,729 48,034,356 55,042,545 59,347,085 64,372,526 66,766,738 68,668,090
Primary government
Net investment in capital assets 805,506,276 779,410,143 755,477,254 747,007,580 716,404,085 689,000,175 666,392,100 642,492,491 617,372,799 602,305,433
Restricted 9,780,831 7,578,092 12,554,203 16,726,046 18,900,804 27,255,759 24,016,398 29,625,088 33,088,760 34,182,790
Unrestricted 6,650,489 6,688,966 7,794,505 6,165,305 1,682,694 923,584 9,155,651 4,338,696 9,893,181 21,277,695
Total primary government net position $821,937,596 $793,677,200 $775,825,961 $769,898,931 $736,987,582 $717,179,518 $699,564,149 $676,456,275 $660,354,740 $657,765,918
Fiscal Year

Statistical Information City of Bothell
Statistical Information 2
Change in Net PositionLast Ten Fiscal Years (accrual basis of accounting)
2011 2012 2013 2014 2015 2016 2017 2018 2019 2020Expenses - Governmental activitiesGeneral government $9,877,418 $10,969,744 $10,073,570 $22,655,176 $12,868,567 $16,501,329 $16,389,961 $15,736,695 $18,481,329 $18,572,174Security of persons and property 21,575,204 22,078,983 23,098,903 22,723,613 23,376,244 23,953,206 25,973,285 27,382,168 31,280,308 30,675,844Physical environment 6,398,497 4,914,790 5,972,811 2,196,908 2,548,539 2,757,415 2,763,405 2,750,098 2,656,681 2,268,331Transportation 34,044,668 36,833,751 35,896,052 41,362,523 42,686,251 43,696,700 43,851,764 46,463,697 47,442,708 48,788,724Economic environment 3,298,490 2,860,182 2,882,941 4,770,995 4,067,230 4,318,103 4,028,902 8,577,058 3,493,273 3,323,007Culture and recreation 1,613,519 2,005,064 1,852,966 2,205,709 2,243,434 2,459,788 2,616,511 2,238,693 1,807,436Interest on long-term debt 581,295 517,471 686,700 2,064,923 2,756,555 3,063,168 3,502,614 2,948,818 3,536,401 3,966,414Total governmental activities 75,775,571 79,788,440 80,616,039 97,627,104 90,509,095 96,533,353 98,969,719 106,475,044 109,129,394 109,401,930
Business-type activitiesWater 3,708,205 3,369,337 3,947,670 4,045,439 4,471,061 4,312,430 4,855,578 4,862,936 5,445,506 5,399,995Sewer 5,454,241 4,976,045 5,136,854 5,865,582 6,045,555 6,331,025 6,986,948 7,088,546 8,084,249 8,006,728Storm & Surface Water 2,864,914 2,938,653 2,985,040 3,793,237 4,099,932 4,462,068 5,418,301 5,696,172 5,789,406 5,526,694Total business-type activities 12,027,360 11,284,035 12,069,565 13,704,258 14,616,548 15,105,523 17,260,827 17,647,653 19,319,161 18,933,417Total primary government expenses $87,802,932 $91,072,475 $92,685,604 $111,331,362 $105,125,643 $111,638,876 $116,230,546 $124,122,697 $128,448,556 $128,335,347
Program Revenues - Governmental activitiesCharges for servicesGeneral government $4,810,917 $4,841,692 $5,795,890 $4,949,225 $7,083,683 $9,956,908 $6,978,338 $8,099,979 $7,453,082 $5,456,331Security of persons and property 2,273,740 2,663,755 3,243,837 3,368,962 4,456,563 4,392,999 5,317,863 5,720,408 6,584,362 6,257,028Physical environment 1,376,855 2,078,244 1,352,480 937,303 933,754 986,097 1,393,217 1,345,692 1,866,979 1,579,171Transportation 607,870 1,818,764 349,447 268,215 1,375,389 1,896,846 1,747,125 1,299,326 439,050 356,242Economic environment 1,338,169 1,961,284 4,218,724 4,176,516 3,924,331 5,406,921 6,355,160 9,395,950 5,421,780 5,495,605Culture and recreation 457,981 268,711 266,648 288,713 354,039 280,506 294,786 310,346 287,188 446,226Operating grants and contributions 360,152 969,659 1,566,336 541,291 364,737 334,328 337,028 466,712 1,427,294 5,512,318Capital grants and contributions 10,650,614 4,324,101 11,102,307 8,153,286 4,451,573 8,684,810 9,679,544 7,261,623 10,305,181 17,511,896Total governmental activities program revenues 21,876,297 18,926,210 27,895,669 22,683,511 22,944,069 31,939,415 32,103,061 33,900,036 33,784,916 42,614,817
Business-type activitiesCharges for servicesWater 3,210,573 3,656,582 4,371,380 4,247,227 6,053,287 5,722,568 5,686,533 5,723,140 5,873,078 5,335,881Sewer 5,012,251 5,639,707 6,088,614 6,601,973 7,556,241 7,998,203 7,879,956 8,284,176 8,338,855 8,039,850Storm & Surface Water 2,927,059 3,645,575 4,255,802 5,147,336 5,462,436 6,284,605 6,269,635 7,732,189 7,366,017 6,666,354Operating grants and contributions 149,637 568,848 114,516 113,714 61,232Capital grants and contributions 241,500 164,800 501,000 1,951,300 1,105,654 1,923,454 1,093,277 738,591 426,278 1,125,953Total business-type activities program revenue 11,391,383 13,106,664 15,216,797 17,947,836 20,177,618 22,078,467 21,498,249 22,592,612 22,117,943 21,229,270Total primary government program revenues $33,267,680 $32,032,874 $43,112,466 $40,631,347 $43,121,687 $54,017,882 $53,601,310 $56,492,648 $55,902,858 $63,844,088
Net (Expense)/RevenueGovernment activities ($53,899,274) ($60,862,229) ($52,720,370) ($74,943,593) ($67,565,026) ($64,593,938) ($66,866,658) ($72,575,008) ($75,344,479) ($66,787,113)Business-type activities (635,977) 1,822,629 3,147,232 4,243,578 5,561,070 6,972,944 4,237,421 4,944,958 2,798,781 2,295,853Total primary government net expense (54,535,251) (59,039,600) (49,573,138) (70,700,015) (62,003,956) (57,620,994) (62,629,237) (67,630,049) (72,545,697) (64,491,259)
General Revenue and Other Changes in Net PositionGovernmental activitiesTaxesProperty tax 10,963,812 11,128,474 12,506,112 15,501,155 12,402,051 12,644,299 17,417,803 17,500,847 23,179,428 25,777,074Sales taxes 16,419,635Excise tax 9,960,281 10,341,621 11,071,149 12,889,402 17,053,937 16,804,847 18,610,037 21,868,524 23,107,676 4,688,954Business tax 6,795,259 6,972,159 6,759,484 7,945,069 7,686,370 7,659,567 7,315,916 7,560,793 7,570,286 7,421,594Unrestricted grants and contributions 0Investment earnings 310,195 512,991 164,714 116,931 441,188 229,685 504,584 740,880 1,448,679 1,051,689Special item 23,858,356 0Miscellaneous 516,090 540,813 1,033,726 4,682,318 438,912 439,287 1,098,410 793,665 785,683 410,338Transfers (17,422) 37,103 412,566 406,612Total governmental activities 28,545,636 29,496,058 31,517,764 64,993,231 38,059,561 37,777,685 44,946,749 48,464,709 56,504,319 56,175,896
Business-type activitiesInvestment earnings 1,350 4,685 1,928 20,233 35,244 67,119 80,482 7,998 12,110MiscellaneousTransfers 17,422 (37,103) 0 (412,566) (406,612)Total business-type activities 1,350 4,685 17,422 1,928 (16,870) 35,244 67,119 80,482 (404,568) (394,502)Total primary government $28,546,986 $29,500,743 $31,535,186 $64,995,159 $38,042,691 $37,812,929 $45,013,868 $48,545,191 $56,099,750 $55,781,394
Change in Net PositionGovernment activities ($25,353,638) ($31,366,171) ($21,202,606) ($9,950,362) ($29,505,465) ($26,816,253) ($21,919,909) ($24,110,298) ($18,840,160) ($10,611,217)Business-type activities (634,627) 1,827,315 3,164,654 4,245,507 5,544,200 7,008,188 4,304,540 5,025,441 2,394,213 1,901,351Total primary government ($25,988,265) ($29,538,856) ($18,037,952) ($5,704,855) ($23,961,265) ($19,808,065) ($17,615,369) ($19,084,858) ($16,445,947) ($8,709,866)
Fiscal Year

Statistical Information City of Bothell
Statistical Information 3
Fund Balances of Government FundsLast Ten Fiscal Years (modified accrual basis of accounting)
2011 2012 2013 2014 2015 2016 2017 2018 2019 2020
General Fund
Reserved
Unreserved
Committed 16,750 16,750 16,750 22,250 22,250 22,250 16,750 16,750 16,750 16,750
Restricted 391,930 526,522 602,871 738,694 867,549 1,307,401 967,611 888,584 1,115,298 1,036,822
Assigned 1,711,130 1,711,130 1,711,130 1,711,130 1,711,130 1,711,130 1,711,130 1,711,130 1,711,130 1,711,130
Unassigned 1,587,189 870,296 1,446,023 1,316,482 1,381,675 258,069 6,336,136 7,403,645 7,281,206 11,226,529
Prior Period Adjustment 11,035
Total general fund $3,706,999 $3,124,698 $3,787,810 $3,788,556 $3,982,604 $3,298,850 $9,031,627 $10,020,108 $10,124,384 $13,991,231
All Other Governmental Funds
Unreserved
Special revenue funds $2,268,368 $3,916,223 $4,709,781 $7,290,304 $7,392,924 $8,118,902 $12,060,158 $8,268,961 $12,976,320 $14,899,958
Debt service funds 55,295 142,231 120,129 29,739 396 (928) 88,030 3,626
Capital projects funds 7,065,239 2,976,365 6,917,958 7,594,931 9,307,244 13,883,596 2,990,654 6,607,931 31,878,836 29,654,634
Permanent funds 16,321 16,321 16,321 16,321 16,321 16,321 16,321
Restricted 9,388,902 7,034,819 11,747,868 14,914,974 16,700,564 22,001,569 15,138,842 1,808,681
Committed 68,153 67,692 67,692 67,692 67,692 67,692 67,692 67,692 67,692 67,692
Prior Period Adjustment 175,679 (222,175)
Total all other governmental funds $9,457,055 $7,102,511 $11,991,239 $14,776,812 $16,784,577 $22,085,583 $15,222,856 $16,769,586 $44,939,169 $44,642,231
Note: Prior year amounts have not been restated for the implementation of Statement 54.
Fiscal Year

Statistical Information City of Bothell
Statistical Information 4
Changes in Fund Balances of Governmental FundsLast Ten Fiscal Years (modified accrual basis of accounting)
2011 2012 2013 2014 2015 2016 2017 2018 2019 2020
Revenues
Taxes $27,719,352 $28,442,253 $30,413,113 $34,443,409 $36,521,449 $36,673,875 $43,325,131 $47,036,991 $52,443,307 54,085,349
Licenses and permits 1,081,549 1,761,220 2,953,512 2,837,610 3,404,797 4,055,011 4,008,628 5,060,444 4,322,553 4,184,515
Intergovernmental 13,700,129 8,015,234 11,647,160 8,816,626 6,226,412 9,996,150 11,516,083 8,706,558 11,555,943 22,361,704
Charges for services 4,703,004 6,467,279 9,037,134 9,137,788 9,121,997 10,872,110 11,826,883 15,231,494 13,467,041 11,634,391
Fines and forfeitures 387,550 421,304 381,258 371,011 377,964 406,083 356,979 323,931 217,375 227,126
Interest earnings 306,511 509,634 162,427 115,776 113,568 245,754 477,436 712,123 1,448,679 1,051,689
Proceeds from the sale of capital assets
Contributions 50,930 45,605 890,862 397,021 49,271 604,887 540,930 103,840 162,978 98,566 Other revenue 445,398 435,486 330,305 2,560,223 443,354 393,242 943,349 705,094 575,223 374,168
Total revenues 48,394,423 46,098,016 55,815,771 58,679,464 56,258,812 63,247,111 72,995,419 77,880,476 84,193,100 94,017,510
Expenditures
General government 8,702,807 8,248,283 8,651,252 8,134,152 9,024,948 10,318,936 11,528,616 12,204,936 13,111,650 14,118,876
Security of persons and property 19,958,652 20,292,352 20,829,840 22,072,891 23,695,773 23,474,573 26,548,790 28,132,684 32,111,619 29,993,936
Transportation 1,732,338 1,725,232 1,688,875 5,449,765 5,960,100 6,936,056 7,044,039 7,789,025 8,696,864 7,554,802
Physical environment 4,183,070 4,185,398 3,450,807 20,409 20,455 48,026 18,330 22,471 18,746 20,006
Cultural environment 1,334,713 1,535,044 1,720,662 1,609,254 1,886,405 6,197,131 2,379,754 4,803,581
Economic environment 2,864,765 2,860,182 2,882,941 4,391,995 3,696,718 3,997,153 4,257,381 2,081,195 4,668,988 1,949,038
Bond issue costs 41,603 170,753 125,039 311,422 1,577 248,666
Debt service
Interest 539,692 517,471 686,700 1,753,501 1,767,419 3,222,695 2,222,123 2,057,011 2,912,461 3,757,176
Principal 23,301,611 11,272,161 5,258,421 31,479,922 1,460,527 2,172,123 3,688,178 3,135,235 3,474,153 4,279,507
Other expenditures 28,645 2,436 10,474 21,136 1,959 1,200 853 (707) Capital outlay 16,982,124 12,124,363 21,441,381 13,477,686 58,858,361 15,878,284 18,113,770 13,731,986 13,823,912 23,843,114
Total expenditures 78,335,307 61,398,630 66,360,442 88,647,923 106,208,500 67,658,300 75,308,485 75,351,672 81,446,811 90,319,330
Excess of revenue over (under) expenditures (29,940,884) (15,300,615) (10,544,671) (29,968,459) (49,949,688) (4,411,189) (2,313,066) 2,528,804 2,746,289 3,698,179
Other Financing Sources (Uses)
Refunding bonds issued
Premium on refunding bonds
Bond anticipation note 30,000,000 6,550,000
2013 GO bonds 9,665,000
2013 GO bond premium 455,236
LIFT GO bonds 28,210,000
LIFT GO bond premium 2,137,096
Capital lease 51,475,433
Proceeds from sales of capital assets 4,607,525 15,088 1,800,000 761,483 9,337,640 1,431,042 30,000.00
Public safety bonds 23,235,000
Public safety bond premium 2,519,362
Loan proceeds 5,953,936 1,819,279 226,786 39,450 16,092 54,388
Transfers in 2,348,144 2,406,488 1,889,311 2,052,217 2,609,009 5,840,299 13,632,421 8,742,180 7,299,099 6,521,608
Transfers out (1,931,044) (2,478,701) (2,068,775) (3,041,638) (2,921,209) (6,149,499) (13,919,797) (8,751,865) (7,924,691) (6,679,879)
Total other financing sources uses 30,417,100 11,085,311 15,909,796 32,976,954 52,151,501 9,028,440 1,183,115 6,408 25,183,157 (128,270)
Net change in fund balances $476,216 ($4,215,304) $5,365,125 $3,008,495 $2,201,813 $4,617,251 ($1,129,950) $2,535,212 $27,929,446 3,569,909
Debt service as a percentage of noncapital expenditures 38.9% 23.9% 13.2% 44.2% 6.8% 10.4% 10.3% 8.4% 9.4% 12.1%
Fiscal Year

Statistical Information City of Bothell
Statistical Information 5
Assessed Value of Taxable PropertyLast Ten Fiscal Years
Year Real Property Personal Property Total Taxable Assessed Value Total Direct Tax Rate*
2011 5,170,948,110 1,166,946,298 6,337,894,408 1.49
2012 4,765,234,231 1,142,409,091 5,907,643,322 1.62
2013 4,788,399,900 1,016,236,063 5,804,635,963 1.67
2014 5,226,252,184 902,744,249 6,128,996,433 1.60
2015 6,756,976,860 894,227,150 7,651,204,010 1.50
2016 7,223,612,278 1,072,446,159 8,296,058,437 1.43
2017 8,097,355,849 686,091,405 8,783,447,254 1.90
2018 9,214,882,284 686,001,760 9,900,884,044 1.64
2019 10,697,535,110 717,738,564 11,415,273,674 1.91
2020 11,745,358,170 640,542,155 12,385,900,325 1.96
Source: King and Snohomish County Assessors OfficeNote: *Tax rate is per $1,000 of assessed value Real and personal property have been assessed at 100% of the estimated value.

Statistical Information City of Bothell
Statistical Information 6
Direct and Overlapping Property Tax RatesLast Ten Fiscal Years
City Direct Rates
Year Regular Levy
Street Levy GO Bond
Public Safety Levy
Total Direct Rate
WA State King County School District
County Port
Hospital District Library
Emergency Medical
Services
Park/Rec District
Flood District
Ferry District RTA
Total Direct & Overlapping
Rate
2011 1.37 0.12 1.49 2.28 1.34 4.60 .22 .48 .57 .30 .15 .11 .004 11.55
2012 1.48 0.13 1.62 2.42 1.42 4.75 .23 .49 .57 .30 .02 .12 .004 11.94
2013 1.54 0.13 1.67 2.57 1.54 5.30 .23 .52 .57 .30 .02 .13 .004 12.85
2014 1.49 0.11 1.60 2.38 1.52 4.93 .22 .47 .56 .29 .02 .15 .003 12.13
2015 1.41 0.09 1.50 2.29 1.35 4.44 .19 .40 .50 .30 .01 .14 11.12
2016 1.33 0.10 1.43 2.17 1.48 4.22 .17 .38 .48 .28 .01 .13 10.75
2017 1.29 0.50 0.11 1.90 2.03 1.39 4.01 .15 .36 .45 .26 .01 .12 .25 10.93
2018 1.18 0.46 1.64 2.92 1.33 3.66 .14 .33 .41 .24 .01 .11 .23 11.02
2019 1.02 0.46 0.43 1.91 2.63 1.22 3.49 .12 .29 .37 .22 .01 .10 .21 10.57
2020 1.02 0.40 0.13 0.41 1.96 3.03 1.24 3.55 .12 .28 .36 .27 .05 .09 .20 11.14
City Direct Rates
Year Regular Levy
Street Levy GO Bond
Public Safety Levy
Total Direct Rate
WA State Snohomish County
School District
County Port
Hospital District Library
Emergency Medical
Services
Park/Rec District
Flood District
Ferry District RTA
Total Direct & Overlapping
Rate2011 1.37 0.12 1.49 2.21 0.87 4.60 .15 .57 .21 .02 10.11
2012 1.48 0.13 1.62 2.38 0.98 4.75 .11 .50 .30 .02 10.65
2013 1.54 0.13 1.67 2.43 1.08 5.30 .11 .57 .30 .02 11.47
2014 1.49 0.11 1.60 2.38 1.08 4.93 .56 .29 .02 10.85
2015 1.41 0.09 1.50 2.28 1.00 4.44 .50 .27 .01 10.00
2016 1.33 0.10 1.43 2.12 0.93 4.22 .09 .48 .26 .01 9.55
2017 1.29 0.50 0.11 1.90 2.03 0.88 4.01 .45 .25 .01 .25 9.78
2018 1.18 0.46 1.64 2.85 0.79 3.66 .42 .33 .01 .23 9.93
2019 1.02 0.46 0.43 1.91 2.57 0.72 3.49 .37 .30 .01 .21 9.58
2020 1.02 0.40 0.13 0.41 1.96 2.87 0.67 3.55 .06 .36 .28 .05 .20 10.00
The rates presented above include excess levies
Source: King and Snohomish County Assessors OfficeNote: The City of Bothell is split equally between King and Snohomish Counties
Overlapping Tax Rates - Snohomish County
The combined property tax rate excluding excess levies cannot exceed $10 per $1,000 of assessed value
Overlapping Tax Rates - King County

Statistical Information City of Bothell
Statistical Information 7
Principal Property TaxpayersCurrent and Ten Years Ago
Snohomish County Taxpayers
Taxpayer Taxable Assessed Value Rank
Percentage of Total Assessed
Valuation
Taxable Assessed Value Rank
Precentage of Total Assessed
ValuationCanyon Park Owner 117,916,500 1 2.26%Seattle Genetics Inc 95,422,144 2 1.82%Philips Ultrasound Inc 90,405,004 3 1.73% 82,843,939 3 2.70%BRE Properties Inc 85,760,000 4 1.64% 54,571,000 6 1.78%LIPT 27th Ave SE LLC 77,000,000 5 1.47%Essex Portfolio LP 63,750,000 6 1.22%CIO Canyon Park LP 52,756,600 7 1.01%ALCO Canyon Park East LLC 49,782,400 8 0.95%EQR-Fanwell 49,440,000 9 0.95%DS Canyon Park LP 48,910,000 10 0.94%Monte Villa Farms LLC 37,455,035 8 1.22%Arden Realty Inc/Thompson Prop Tax Svc 130,932,000 1 4.26%Teachers Insurance & Annuity Assn 125,993,200 2 4.10%AT&T Mobility LLC 61,017,848 4 1.99%Diamond Canyon Park LLC 31,937,000 10 1.04%Immunex Mfg Corp 33,685,800 9 1.10%LBA Realty/Thompson Prop Tax Service 0.00%T-Mobile USA Inc 58,802,126 5 1.91%Microsoft 48,881,808 7 1.59%Stonemeadow Farm Apartments IncTotal Assessed Valuation - Largest Taxpayers 731,142,648 13.98% 666,119,756 21.67%Total Assessed Valuation - All Other 4,497,553,913 86.02% 2,407,355,268 78.33%Total Assessed Value $5,228,696,561 100.00% $3,073,475,024 100.00%
King County Taxpayers
Taxpayer Taxable Assessed Value Rank
Precentage of Total Assessed
Valuation
Taxable Assessed Value Rank
Precentage of Total Assessed
ValuationVillage at Beardslee (formerly Gateway Apartments LLC) 168,124,400 1 2.35%Grosvenor International Ltd (formerly Schnitzer West) 167,829,381 2 2.34%DP Bothell TIC 1 LLC 156,102,000 3 2.18%AT&T Mobility LLC $201,749,158 4 2.82%Boulevard Place Senior Living 77,589,000 5 1.08%Belkorp Holdings Inc. 77,495,000 6 1.08%Essex Property Trust 55,609,000 7 0.78% 26,000,000 7 0.61%Willina LLC 54,936,000 8 0.77%MSPT X LLC 53,486,000 9 0.75%North Creek Facility LLC 51,419,100 10 0.72%Puget Sound Energy 20,803,468 9 0.64%T-Mobile 245,707,481 1 7.53%Schnitzer Northwest 147,997,500 2 4.53%Seattle Times 75,126,271 3 2.30%Arden Realty Inc. (formerly Allstate Ins.) 40,000,000 5 1.23%Tishman Speyer Archstone-SM 31,826,000 4 0.97%KPS Realty 31,453,300 6 0.96%Archstone Communities Trust 26,638,400 8 0.80%S/I North Creek VIII LLC 20,064,038 10 0.61%Total Assessed Valuation - Largest Taxpayers 1,064,339,039 14.87% 665,616,458 20.39%Total Assessed Valuation - All Other 6,092,864,725 85.13% 2,598,802,926 79.61%Total Assessed Value $7,157,203,764 100.00% $3,264,419,384 100.00%
King County Levy AdministrationNote: City of Bothell is split between Snohomish and King Counties
2020 2011
2020 2011
Sources: Snohomish County Assessor
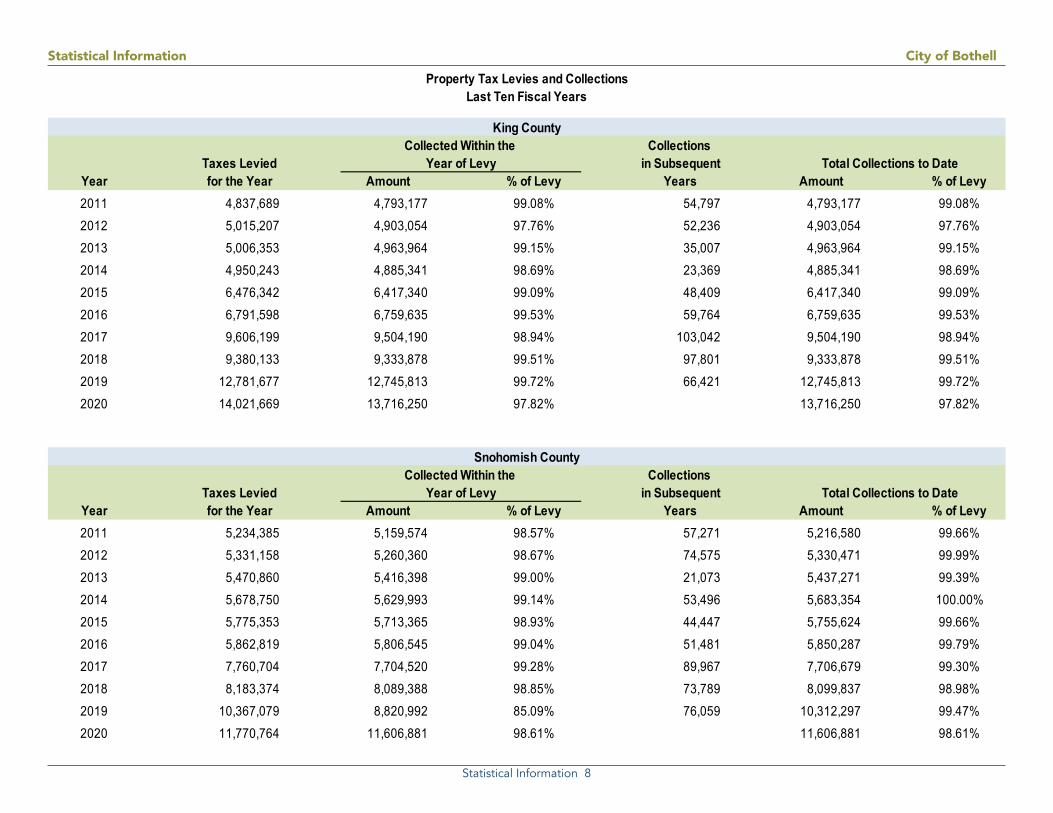
Statistical Information City of Bothell
Statistical Information 8
Property Tax Levies and CollectionsLast Ten Fiscal Years
Collections Taxes Levied in Subsequent
Year for the Year Amount % of Levy Years Amount % of Levy2011 4,837,689 4,793,177 99.08% 54,797 4,793,177 99.08%2012 5,015,207 4,903,054 97.76% 52,236 4,903,054 97.76%2013 5,006,353 4,963,964 99.15% 35,007 4,963,964 99.15%2014 4,950,243 4,885,341 98.69% 23,369 4,885,341 98.69%2015 6,476,342 6,417,340 99.09% 48,409 6,417,340 99.09%2016 6,791,598 6,759,635 99.53% 59,764 6,759,635 99.53%2017 9,606,199 9,504,190 98.94% 103,042 9,504,190 98.94%2018 9,380,133 9,333,878 99.51% 97,801 9,333,878 99.51%2019 12,781,677 12,745,813 99.72% 66,421 12,745,813 99.72%2020 14,021,669 13,716,250 97.82% 13,716,250 97.82%
Collections Taxes Levied in Subsequent
Year for the Year Amount % of Levy Years Amount % of Levy2011 5,234,385 5,159,574 98.57% 57,271 5,216,580 99.66%2012 5,331,158 5,260,360 98.67% 74,575 5,330,471 99.99%2013 5,470,860 5,416,398 99.00% 21,073 5,437,271 99.39%2014 5,678,750 5,629,993 99.14% 53,496 5,683,354 100.00%2015 5,775,353 5,713,365 98.93% 44,447 5,755,624 99.66%2016 5,862,819 5,806,545 99.04% 51,481 5,850,287 99.79%2017 7,760,704 7,704,520 99.28% 89,967 7,706,679 99.30%2018 8,183,374 8,089,388 98.85% 73,789 8,099,837 98.98%2019 10,367,079 8,820,992 85.09% 76,059 10,312,297 99.47%2020 11,770,764 11,606,881 98.61% 11,606,881 98.61%
Year of Levy Total Collections to Date
King CountyCollected Within the
Year of Levy Total Collections to Date
Snohomish CountyCollected Within the
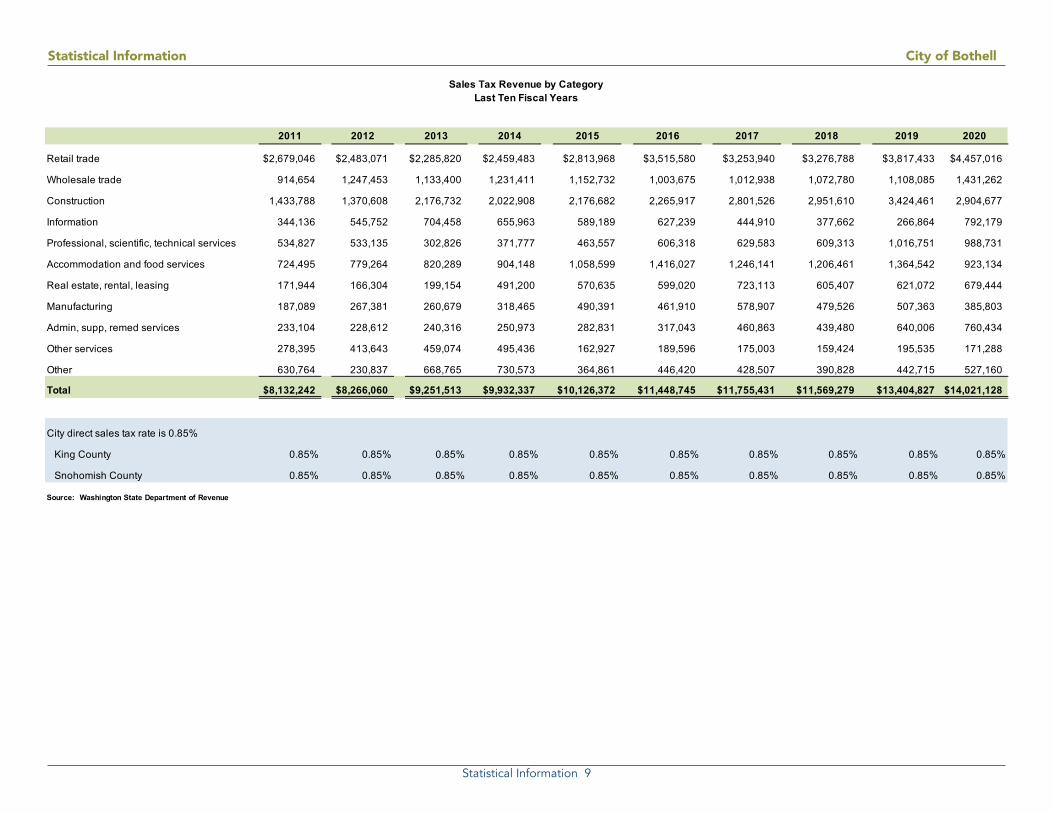
Statistical Information City of Bothell
Statistical Information 9
Sales Tax Revenue by CategoryLast Ten Fiscal Years
2011 2012 2013 2014 2015 2016 2017 2018 2019 2020
Retail trade $2,679,046 $2,483,071 $2,285,820 $2,459,483 $2,813,968 $3,515,580 $3,253,940 $3,276,788 $3,817,433 $4,457,016
Wholesale trade 914,654 1,247,453 1,133,400 1,231,411 1,152,732 1,003,675 1,012,938 1,072,780 1,108,085 1,431,262
Construction 1,433,788 1,370,608 2,176,732 2,022,908 2,176,682 2,265,917 2,801,526 2,951,610 3,424,461 2,904,677
Information 344,136 545,752 704,458 655,963 589,189 627,239 444,910 377,662 266,864 792,179
Professional, scientific, technical services 534,827 533,135 302,826 371,777 463,557 606,318 629,583 609,313 1,016,751 988,731
Accommodation and food services 724,495 779,264 820,289 904,148 1,058,599 1,416,027 1,246,141 1,206,461 1,364,542 923,134
Real estate, rental, leasing 171,944 166,304 199,154 491,200 570,635 599,020 723,113 605,407 621,072 679,444
Manufacturing 187,089 267,381 260,679 318,465 490,391 461,910 578,907 479,526 507,363 385,803
Admin, supp, remed services 233,104 228,612 240,316 250,973 282,831 317,043 460,863 439,480 640,006 760,434
Other services 278,395 413,643 459,074 495,436 162,927 189,596 175,003 159,424 195,535 171,288
Other 630,764 230,837 668,765 730,573 364,861 446,420 428,507 390,828 442,715 527,160
Total $8,132,242 $8,266,060 $9,251,513 $9,932,337 $10,126,372 $11,448,745 $11,755,431 $11,569,279 $13,404,827 $14,021,128
City direct sales tax rate is 0.85%
King County 0.85% 0.85% 0.85% 0.85% 0.85% 0.85% 0.85% 0.85% 0.85% 0.85%
Snohomish County 0.85% 0.85% 0.85% 0.85% 0.85% 0.85% 0.85% 0.85% 0.85% 0.85%
Source: Washington State Department of Revenue

Statistical Information City of Bothell
Statistical Information 10
Direct and Overlapping Sales Tax RatesLast Ten Fiscal Years
Rapid Total Transit Sales Tax
2011 2.5% 6.5% .5% 9.5%2012 2.5% 6.5% .5% 9.5%2013 2.5% 6.5% .5% 9.5%2014 2.5% 6.5% .5% 9.5%2015 2.5% 6.5% .5% 9.5%2016 2.5% 6.5% .5% 9.5%2017 2.5% 6.5% 1.0% 10.0%2018 2.5% 6.5% 1.0% 10.0%2019 2.5% 6.5% 1.0% 10.0%2020 2.5% 6.5% 1.0% 10.0%
Rapid Total Transit Sales Tax
2011 2.5% 6.5% .5% 9.5%2012 2.5% 6.5% .5% 9.5%2013 2.5% 6.5% .5% 9.5%2014 2.5% 6.5% .5% 9.5%2015 2.5% 6.5% .5% 9.5%2016 2.8% 6.5% .5% 9.8%2017 2.8% 6.5% 1.0% 10.3%2018 2.8% 6.5% 1.0% 10.3%2019 2.9% 6.5% 1.0% 10.4%2020 2.9% 6.5% 1.0% 10.4%
Source: Washington State Department of Revenue
Year Local State
King County
Year Local State
Snohomish County

Statistical Information City of Bothell
Statistical Information 11
Ratios of Outstanding Debt by TypeLast Ten Fiscal Years
Total Percentage DebtGeneral Capital Term Loan Water Sewer Combined Term Loan Primary Per Capita of Personal Per
Year Obligation Lease Payable Bonds Bonds Utility Bonds Payable Government Income* Income Population Capita
2011 33,749,705 8,750,000 788,188 43,287,893 49,115 2.61 33,720 1,284
2012 37,832,839 675,589 38,508,428 50,559 2.24 34,000 1,133
2013 48,193,354 562,992 48,756,346 52,943 2.67 34,460 1,415
2014 39,375,000 7,367,710 18,355,000 1,014,416 66,112,126 58,402 2.72 41,630 1,588
2015 40,730,841 51,475,433 7,153,969 19,021,527 1,024,715 119,406,485 61,021 4.59 42,640 2,800
2016 38,897,595 50,422,952 6,706,846 18,323,246 953,791 115,304,430 64,553 4.06 43,980 2,622
2017 37,014,349 49,344,780 6,299,173 17,594,964 795,676 111,048,942 69,214 3.62 44,370 2,503
2018 35,801,103 48,016,609 5,868,142 16,846,683 637,562 107,170,099 74,620 3.17 45,260 2,368
2019 60,307,219 46,623,437 5,469,235 16,063,401 592,046 129,055,338 78,073 3.54 46,750 2,761
2020 58,153,006 45,180,265 5,009,142 15,250,120 546,530 124,139,062 NA NA 48,400 2,565
*Bureau of Economic Analysis
Government Activities Business-Type Activities

Statistical Information City of Bothell
Statistical Information 12
Ratios of General Bonded Debt OutstandingLast Ten Fiscal Years
Percentage ofGeneral Total Taxable Actual Taxable
Year Obligation Bonds Assessed Value Value of Property Population Per Capita
2011 33,749,705 6,337,894,408 0.53 33,720 1,001
2012 37,732,759 5,907,643,322 0.64 34,000 1,110
2013 48,193,354 5,804,635,963 0.83 34,460 1,399
2014 39,375,000 6,128,996,433 0.64 41,630 946
2015 92,206,274 7,651,204,010 1.21 42,640 2,162
2016 89,320,547 8,296,058,437 1.08 43,980 2,031
2017 86,359,129 8,783,447,254 0.98 44,370 1,946
2018 83,817,712 9,900,884,044 0.85 45,260 1,852
2019 106,930,656 11,415,273,674 0.94 46,750 2,287
2020 103,333,271 12,385,900,325 0.83 48,400 2,135

Statistical Information City of Bothell
Statistical Information 13
Computation of Direct and Overlapping DebtDecember 2020
Worksheet Only - Do not print this section in CAFR!
Governmental UnitNet Debt
Outstanding
Estimated Percentage Applicable
Estimated Share of Overlapping Debt
King County $654,637,854 1.93% $12,620,221Snohomish County 321,890,539 8.53% 27,462,796Northshore School District 511,376,466 53.48% 273,481,351King County Hospital #2 220,988,743 14.83% 32,769,941Port of Seattle 311,175,000 1.93% 5,998,816Northshore Parks & Rec 118,652 26.76% 31,755King County Library System 55,215,699 3.25% 1,792,028Total overlapping debt $2,075,402,953 $354,156,907
City of Bothell $108,342,413 100.00% $108,342,413
Total direct and overlapping debt $2,183,745,366 $462,499,320
Direct Debt
Note: Overlapping governments are those that coincide, at least in part, with the geographic boundaries of the City. This schedule estimates the portion of the outstanding debt of those overlapping governments that is borne by the residents and businesses of the City of Bothell. This process recognizes that, when considering the government's ability to issue and repay long-term debt, the entire debt burden borne by the residents and businesses should be taken into account. However, this does not imply that every taxpayer is a resident, and therefore responsible for repaying the debt, of each overlapping government. The information shown above regarding outstanding debt of various governmental units and estimated percentage overlap has been provided by King County and Snohomish County and has not been independently verified by the City.
Overlapping Debt

Statistical Information City of Bothell
Statistical Information 14
Legal Debt Margin InformationLast Ten Fiscal Years
2011 2012 2013 2014 2015 2016 2017 2018 2019 2020
Assessed value $6,337,894,408 $5,907,643,322 $5,804,635,963 $6,128,996,433 $7,651,204,010 $8,296,058,437 $8,783,447,254 $9,900,884,044 $11,415,273,674 $12,385,900,325
Debt limit (7.5% of assessed value) 475,342,081 443,073,249 435,347,697 459,674,732 573,840,301 622,204,383 658,758,544 742,566,303 856,145,526 928,942,524
Debt applicable to limit
General obligation bonds 33,805,000 37,832,839 48,193,354 46,742,710 99,360,243 96,027,393 92,658,302 89,685,854 112,399,891 108,342,413
Less: amount set aside for repayment 55,295 100,080 103,808 29,738 396 (928) 88,030 0 0 0
Total net debt applicable to limit 33,749,705 37,732,759 48,089,546 46,712,972 99,359,847 96,028,321 92,570,272 89,685,854 112,399,891 108,342,413
Legal debt margin 441,592,376 405,340,490 387,258,151 412,961,760 474,480,454 526,176,061 566,188,272 652,880,449 743,745,634 820,600,112
Total net debt applicable to the limit 7.10% 8.52% 11.05% 10.16% 17.31% 15.43% 14.05% 12.08% 13.13% 11.66%as a percentage of debt limit

Statistical Information City of Bothell
Statistical Information 15
Pledged-Revenue CoverageLast Ten Fiscal Years
Utility Less NetService Operating Available
Year Charges Expenses Revenue Principal Interest Coverage2014 $15,996,535 $13,332,786 $2,663,749 $520,000 $794,301 2.032015 $19,071,965 $13,913,731 $5,158,234 $635,000 $676,769 3.932016 $20,005,376 $14,487,888 $5,517,488 $665,000 $651,369 4.192017 $19,836,124 $16,671,040 $3,165,084 $665,000 $651,369 2.402018 $21,739,505 $17,136,580 $4,602,924 $685,000 $624,769 3.512019 $21,577,950 $18,790,331 $2,787,619 $720,000 $590,519 2.132020 $19,996,658 $18,433,501 $1,563,158 $750,000 $561,719 1.19
Operating Operating Operating Debt CoverageYear Revenue Expense Income Service Ratio2014 $4,247,227 $3,963,237 $283,9902015 $6,053,287 $4,320,189 $1,733,098 $277,473 6.252016 $5,722,568 $4,180,760 $1,541,808 $277,681 5.552017 $5,686,533 $4,730,981 $955,552 $277,281 3.452018 $5,723,140 $4,754,634 $968,506 $276,681 3.502019 $5,873,078 $5,334,420 $538,658 $274,431 1.962020 $5,290,454 $5,294,909 ($4,455) $278,431 (0.02)
Operating Operating Operating Debt CoverageYear Revenue Expense Income Service Ratio2014 $6,601,973 $5,830,950 $771,0232015 $7,556,241 $5,979,353 $1,576,888 $125,380 12.582016 $7,998,203 $6,273,035 $1,725,168 $124,206 13.892017 $7,879,956 $6,931,407 $948,549 $126,806 7.482018 $8,284,176 $7,040,320 $1,243,856 $124,206 10.012019 $8,338,855 $8,034,340 $304,515 $125,956 2.422020 $8,039,850 $7,959,619 $80,232 $123,156 0.65
Operating Operating Operating Debt CoverageYear Revenue Expense Income Service Ratio2014 $5,147,336 $3,538,598 $1,608,738 1.772015 $5,462,436 $3,614,189 $1,848,247 $911,448 2.032016 $6,284,605 $4,034,093 $2,250,512 $909,881 2.472017 $6,269,634 $5,008,652 $1,260,982 $912,281 1.382018 $7,732,189 $5,341,626 $2,390,563 $908,881 2.632019 $7,366,017 $5,421,571 $1,944,446 $910,131 2.142020 $6,666,354 $5,178,973 $1,487,381 $1,311,719 1.13
Notes:- Details regarding the City's outstanding debt can be found in the notes to the financial statements- Operating expenses do not include interest and depreciation expenses-2014 Combined Utiity Bonds debt service requirement is maximum annual debt service of $1,316,369
Combined Utility System Bonds
Debt Service
Utility Revenue Bond (Water) Debt Service Coverage Ratios
Utility Revenue Bond (Sewer) Debt Service Coverage Ratios
Utility Revenue Bond (Storm & Surface Water) Debt Service Coverage Ratios

Statistical Information City of Bothell
Statistical Information 16
Utility Revenue Bond Statistics
Water Total VolumeResidential Commercial Irrigation
Volume Volume Volume Residential Commercial IrrigationYear (CCF)1 (CCF)2 (CCF) Revenue Revenue Revenue2014 449,900 153,098 101,396 $2,068,377 $766,624 $767,2922015 431,743 159,648 136,363 $2,842,981 $891,066 $1,027,2962016 443,516 175,473 121,815 $2,407,187 $956,181 $920,9742017 456,067 153,945 121,580 $2,657,446 $909,992 $1,036,9582018 448,612 144,179 118,492 $2,834,251 $894,790 $1,023,4232019 462,326 146,177 106,199 $2,971,814 $977,465 $893,6132020 469,010 95,303 94,827 $3,144,118 $747,018 $801,570
1 Residential includes apartments and mobile home parks2 Commercial volume includes government/education
Commercial/Year Residential Nonresidential Total2014 3,494 502 3,9962015 3,580 505 4,0852016 3,656 519 4,1752017 4,079 580 4,6592018 3,776 512 4,2882019 3,786 506 4,2922020 3,794 516 4,310
Water Utility CustomersConsumption Number of Average
Year (CCF) Accounts GPD/Account2014 715,943 4,031 363.982015 754,601 4,085 378.562016 753,195 4,175 371.042017 745,366 4,230 367.002018 711,283 4,288 339.942019 714,905 4,292 341.352020 659,140 4,310 312.60
Water Total Consumption
Residential Commercial Residential CommercialVolume Volume Revenue Revenue
Year (CCF) (CCF)2014 449,900 153,098 $5,140,586 $1,028,9712015 431,743 159,648 $5,526,670 $1,183,0672016 443,516 175,473 $5,732,613 $1,363,5372017 456,067 153,945 $6,021,440 $1,240,5312018 249,216 144,179 $6,259,635 $1,194,2262019 240,893 295,857 $6,810,922 $1,214,6672020 290,318 274,035 $7,133,743 $713,867
Commercial/Year Residential Nonresidential Total2014 4,764 333 5,0972015 4,795 333 5,1282016 4,867 333 5,2002017 5,373 343 5,7162018 4,977 309 5,2862019 4,747 637 5,3842020 4,801 639 5,440
Sewer Total Consumption
Sewer Utility Customers
Approximately 88% of Sewer Utility customers are residential and the remainder are commercial or non-residential
Commercial/Year Residential Condominiums Seniors Nonresidential Total
2014 9,528 1,613 491 805 12,437
2015 N/A N/A N/A N/A N/A
2016 N/A N/A N/A N/A N/A
2017 N/A N/A N/A N/A N/A
2018 10,040 2,556 395 773 13,764
2019 11,008 2,845 295 916 15,064
2020 10,652 2,919 229 893 14,693
Note:-See the BMC Title 18 for utility rates on the City's website
Storm & Surface Water Utility Customers
Approximately 73% of Storm & Surface Water Utility customers are residential and the remainder are commercial or non-residential.

Statistical Information City of Bothell
Statistical Information 17
Demographic and Economic StatisticsLast Ten Fiscal Years
Personal Per Capita EducationIncome Personal Median Level in Years School Unemployment
Year Population (in thousands) Income Age of Schooling Enrollment Rate2011 33,720 1,704,849 50,559 38 13.7 27,598 7.90%2012 34,000 1,800,062 52,943 38 13.7 28,390 6.50%2013 34,460 1,890,053 65,131 38 13.7 25,548 5.30%2014 41,630 2,460,526 59,105 40 13.7 29,140 4.60%2015 42,640 2,683,704 61,021 40 13.7 30,995 5.00%2016 43,980 2,839,041 64,553 40 13.7 31,984 3.70%2017 44,370 3,089,084 69,621 38 13.7 31,528 4.10%2018 45,260 3,377,301 74,620 38 13.7 32,286 3.30%2019 46,750 3,649,913 78,073 38 13.7 33,608 4.30%2020 48,400 NA NA 38 13.7 34,099 7.20%
Sources:-Washington State - Office of Financial Management (OFM)-US Department of Labor - Bureau of Labor Statistics (BLS)-US Department of Commerce - Bureau of Economic Analysis (BEA)-Northshore School District (NSSD), University of Washington-Bothell (UW-B), Cascadia Community College-US Census Bureau 2010 Demographic Profile Data-Northshore School District (NSSD), University of Washington-Bothell (UW-B), Cascadia CollegeNA = Not Available

Statistical Information City of Bothell
Statistical Information 18
Principal EmployersCurrent Year and Ten Years Ago
2020Percentage Percentageof Total City of Total City
Employer Product or Service Rank Employees Employment Rank Employees Employment
Northshore School District Education 1 2,369 8.38% 2 1,800 7.71%
Seagen Inc Manufacturer 2 1,457 5.15%
AT&T Mobile Telecommunications 3 1,212 4.29% 1 1,968 8.43%
Phillips Ultrasound Diagnostic imaging manufacturer 4 955 3.38% 3 1,116 4.78%
University of Washington-Bothell Education 5 712 2.52% 5 499 2.14%
T-Mobile West LLC Telecommunications 6 692 2.45% 4 655 2.80%
Puget Sound Energy Utility services - electric/gas 7 554 1.96% 9 433 1.85%
Fuji Manufacturer 8 493 1.74%
Panasonic (Matsushita) Avionics Aviation manufacturer 9 361 1.28% 8 434 1.86%
City of Bothell Municipal government 10 380 1.34%
Seattle Genetics Manufacturer 7 441 1.89%
Vertafore Inc Insurance technology 6 450 1.93%
Allstate Insurance Insurance 10 300 1.28%
Total 9,185 32.49% 8,096 34.67%
Sources:-City of Bothell Business License System-City of Bothell Human Resources Department-Northshore School District (NSSD) -University of Washington-Bothell (UW-B)
2011

Statistical Information City of Bothell
Statistical Information 19
Full-Time Equivalent City Government Employees by Function/ProgramLast Ten Fiscal Years
Function/Program 2011 2012 2013 2014 2015 2016 2017 2018 2019 2020Executive Legislative 7.00 7.00 7.00 7.00 7.00 7.00 7.00 7.00 7.00 7.00 City Manager 7.00 7.00 7.00 6.00 6.00 6.00 6.00 6.00 6.00 6.50 City Clerk 2.75 2.75 2.75 2.75 2.75 3.00 3.00 3.00 3.00 3.00
Information Technology 10.00 10.00 10.00 10.00 10.00 10.00 14.00 15.00 17.50 17.50
Municipal Court 4.50 4.50 4.50 4.50 4.50 4.50 6.35 6.85 7.85 7.85
Non-Dept/Tourism 1.00 1.00 1.00 1.00 1.00 1.00 1.20 1.20 3.05 2.925
Finance 8.25 8.25 8.65 8.65 8.85 9.20 12.20 12.75 9.75 10.00
Legal 3.56 3.56 4.15 4.15 4.15 4.15 5.75 5.75 5.75 5.75
Human Resources 6.00 6.00 6.00 6.00 6.00 6.00 5.00 6.00 5.00 5.00
Police Officers 58.00 58.00 58.00 58.00 57.00 57.00 57.00 55.00 77.00 77.00 Civilians 25.75 25.75 26.75 32.00 32.00 32.00 32.00 39.00 35.00 35.00
Fire Firefighters and officers 57.00 57.00 57.00 57.00 57.00 57.00 57.00 62.00 68.00 68.00 Civilians 7.75 7.75 7.75 9.75 9.75 9.75 9.25 7.25 7.25 6.75
Community Development 21.00 21.00 21.00 22.00 23.50 23.50 24.00 24.00 25.00 25.00
Parks & Recreation 10.42 10.42 9.45 11.45 11.50 11.50 15.80 15.80 16.50 16.50
Public Works Facilities 4.71 4.71 4.55 5.30 5.30 5.30 7.60 7.60 8.65 7.65 Engineering 26.27 26.27 25.20 25.20 25.71 25.71 24.80 25.80 25.85 26.35 Street 7.80 7.80 7.30 8.60 10.71 10.71 13.30 13.30 13.75 13.75 Water 8.83 8.83 8.81 8.83 8.94 8.94 9.86 9.58 9.48 9.4375 Sewer 8.41 8.41 8.43 9.43 9.54 9.54 9.46 9.18 8.98 8.9375 Storm & Surface Water 13.31 13.31 15.06 17.24 18.35 18.35 20.49 20.49 20.15 19.85 Fleet 2.72 2.72 2.55 2.80 2.80 2.80 2.80 2.80 4.85 5.85
Self-Insurance/Risk Mgmt .70 .70 1.35 1.35 1.35 1.35 1.25 1.25 2.25 2.25Totals 302.73 302.73 304.25 319.00 323.70 324.30 345.10 356.60 387.60 387.85
Source: Finance Department

Statistical Information City of Bothell
Statistical Information 20
Operating Indicators by Function/ProgramLast Ten Fiscal Years
Function/Program 2011 2012 2013 2014 2015 2016 2017 2018 2019 2020
Police Calls for service 25,071 26,417 25,188 26,891 25,865 29,758 27,923 27,491 26,524 26,051 Physical arrests 1,568 1,565 NA NA NA 682 1,133 1,221 1,631 2,282 Traffic violations 3,828 3,625 2,472 2,388 2,512 2,791 2,914 2,237 2,369 1,916
Fire Incident Responses 4,975 4,946 5,300 5,870 6,196 6,253 6,341 6,350 6,641 6,448 Inspections 1,193 1,422 1,324 2,210 1,174 1,799 569 885 1,342 248
Community Development Building permits issued 464 529 633 519 607 709 1,590 1,739 1,609 1,359 Building inspections 3,132 3,177 4,223 5,428 5,241 6,089 5,445 9,819 7,024 5,255
Parks and Recreation Field & shelter bookings 2,332 2,444 2,703 2,394 2,808 2,764 1181* 2,434 2,518 543**
Water Units served 3,950 3,944 3,950 3,996 4,083 4,175 4,659 4,337 4,292 4,232 Water main breaks 2 2 3 3 1 5 Average daily consumption 1,287 1,324 1,360 1,470 1,499 1,496 1,552 1,478 1,575 1,429 (thousands of gallons)
Sources: City Departments
NA = Not Available*Incomplete data due to software converion. Data from July-December 2017.**January-August field rentals cancelled due to Covid pandemic.

Statistical Information City of Bothell
Statistical Information 21
Capital Asset Statistics by Function/ProgramLast Ten Fiscal Years
Function/Program 2011 2012 2013 2014 2015 2016 2017 2018 2019 2020
Public Safety Police stations 1 1 1 1 1 1 1 1 1 1 Fire stations 3 3 3 3 3 3 3 3 3 3
Public Works - Streets Streets (miles) 326 326 262.7* 302 303.4 303.9 306.4 304.7 308.3 308.7 Street lights 1,957 1,957 2,100 2,100 2,100 2,100 NA NA NA NA
Parks and Recreation Acreage 237.23 237.23 247.62 262.7 262.7 297.07 400.54 405.54 403.09 387.9 Parks 23 23 23 24 24 27 28 28 26 26
Water Water mains (miles) 72.5 79.5 94.9 96.9 97.8 115.3 116.5 117.5 120 120.3
Sewer/Storm & Surface Water Sanitary sewers (miles) 58.6 62.4 62.8 63.9 65.00 69.20 69.60 70.1 70.5 70.8 Storm sewers (miles) 110 119.9 119.9 139.7 143.0 145.7 143.4 145.4 145.9 149.1
Sources: City Departments
NA = Not Available
