how wealthy is your tide pool?
TRANSCRIPT

Yaquina Head Outstanding Natural Area
How Wealthy is Your Tide Pool?
6th– 8th grade
Intertidal Species Richness and Ecology Program
750 Lighthouse Drive, Newport, OR 97365 Telephone: (541) 574–3122 or 574-3100
Email: [email protected]


How Wealthy is Your Tide Pool? Objectives:
Recall and discuss tide pool rules and explain their importance
Identify 10 to 20 tide pool organisms (invertebrates and algae)
Define and discuss “zonation” and “species richness.”
Utilize math application with real-life activities through collecting, compiling and
graphing monitoring data
Conduct scientific monitoring to determine species richness in three different tide
pool zones.
Create and test a hypothesis: Which tide pool zone will be the most species rich?
After quietly observing a natural system, recall personal observations and/or
appreciation.
Identify three strategies to “steward” the tide pool ecosystem.
On-Site Activities: Review “Rules of the Pools”
Define and discuss “Species Richness” (Observe and define zonation)
Tide Pool Scavenger Hunt
Monitoring Instructions and Hypothesis: Which Zone is more “Species Rich?”
Monitor for “Species Richness”
Compare, Contrast and Graph Monitoring Data
Individual Quiet-Reflection Time
Proposed Pre-Visit Activities: Define and discuss species richness. Create an intro Activity?
Review tide pool rules by playing “Shout Out.” A write-up exists
Compare and contrast different ways to monitor for species richness. Students
create an Experimental Design Monitoring strategy.
Review procedures and set up a transect to monitor for species richness. Utilize
existing monitoring instructions.
Identify and/or review tide pool organisms Intertidal Animal Scramble
KWL Chart
Proposed Pre-Visit Activities: Manipulate data collected on the field trip by, comparing and contrasting results
from the entire class. Data and graph sheet exists as part of the WTP packet
Critter-cal Thinking activity or variation.
Summarize a field trip experience, through writing, artwork or poetry.
Propose three ways to help preserve and protect our tide pool ecosystems.

How Wealthy is Your Tide Pool? Oregon Educational Standards
Grade 6:
6.2 Interaction and Change: The related parts within a system interact and change.
6.2L.2 Explain how individual organisms and populations in an ecosystem interact and how
changes in populations are related to resources.
6.3 Scientific Inquiry: Scientific inquiry is the investigation of the natural world based on observations
and science principles that includes proposing questions or hypotheses, and developing procedures for questioning, collecting, analyzing, and interpreting accurate and relevant data to produce justifiable evidence-based explanations.
6.3S.1 Based on observations and science principles, propose questions or hypotheses that
can be examined through scientific investigation. Design and conduct an investigation that uses appropriate tools and techniques to collect relevant data.
6.3S.2 Organize and display relevant data, construct an evidence-based explanation of the results of an investigation, and communicate the conclusions.
6.3S.3 Explain why if more than one variable changes at the same time in an investigation, the outcome of the investigation may not be clearly attributable to any one variable.
Grade 7:
7.3 Scientific Inquiry: Scientific inquiry is the investigation of the natural world based on observations
and science principles that includes proposing questions or hypotheses, designing procedures for questioning, collecting, analyzing, and interpreting multiple forms of accurate and relevant data to produce justifiable evidence-based explanations.
7.3S.1 Based on observations and science principles, propose questions or hypotheses that
can be examined through scientific investigation. Design and conduct a scientific investigation that uses appropriate tools and techniques to collect relevant data.
Grade 8:
8.2 Interaction and Change: Systems interact with other systems.
8.1L.1 Explain how genetics and anatomical characteristics are used to classify organisms and infer evolutionary relationships.
8.2L.1 Explain how species change through the process of natural selection. Describe evidence for evolution.
8.3 Scientific Inquiry: Scientific inquiry is the investigation of the natural world based on observations and science principles that includes proposing questions or hypotheses and designing procedures for
questioning, collecting, analyzing, and interpreting multiple forms of accurate and relevant data to produce justifiable evidence-based explanations and new explorations.
8.3S.1 Based on observations and science principles, propose questions or hypotheses that can be examined through scientific investigation. Design and conduct a scientific
investigation that uses appropriate tools, techniques, independent and dependent variables,
and controls to collect relevant data.

Field Trip Outline
How Wealthy is Your Tide Pool? Field Trip Outline
The “How Wealthy is Your Tide Pool” program at Yaquina Head ONA is designed to give 6th
-
8th
grade students the opportunity to interact with the Cobble Beach tide pool area as ecologists
monitoring relative species richness. This program provides the students with the chance to learn
about the scientific method, ecology, and biology in a safe and engaging physical environment.
This program aims to engage the students’ hands, minds, and hearts, as well as to encourage
lifelong stewardship of this unique ecological resource.
Introductions and Rules of the Pools
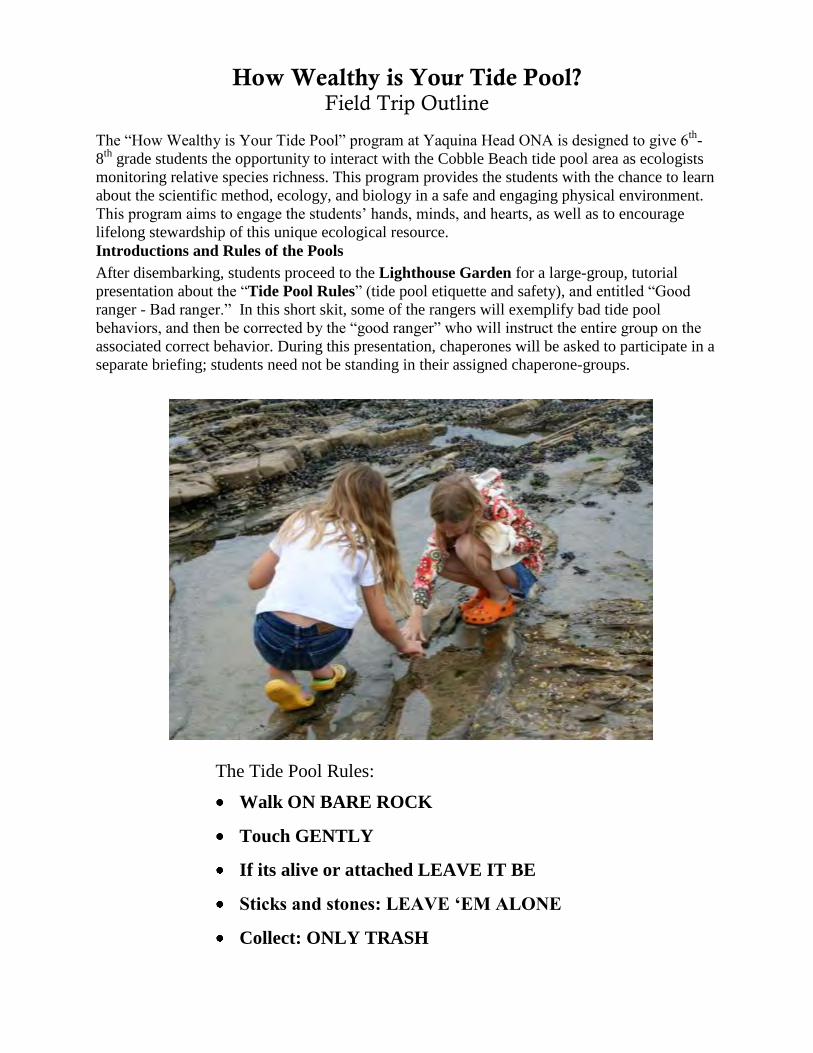
After disembarking, students proceed to the Lighthouse Garden for a large-group, tutorial
presentation about the “Tide Pool Rules” (tide pool etiquette and safety), and entitled “Good
ranger - Bad ranger.” In this short skit, some of the rangers will exemplify bad tide pool
behaviors, and then be corrected by the “good ranger” who will instruct the entire group on the
associated correct behavior. During this presentation, chaperones will be asked to participate in a
separate briefing; students need not be standing in their assigned chaperone-groups.
The Tide Pool Rules:
Walk ON BARE ROCK
Touch GENTLY
If its alive or attached LEAVE IT BE
Sticks and stones: LEAVE ‘EM ALONE
Collect: ONLY TRASH

How Wealthy is Your Tide Pool? Field Trip Outline
Once the tide pool rules are clearly defined, the students will engage in a hands-on demonstration
of species richness by making two different kinds of imaginary “salads.” “Species richness
salad” contains a myriad of appealing ingredients; by contrast, “species impoverishment salad”
contains only one or two ingredients and is much less exciting to the palette.
By comparing and contrasting these imaginary salads, the students begin to grasp the importance
of the presence of many types of species in a healthy environment, rather than just one or two.
Students will then read the definition of species richness aloud.
At this point in the program, the students will be split into their chaperone-groups (pre-arranged
by the teacher), and assigned to work with a ranger for the remainder of the program. Ranger-led
groups will depart from the Lighthouse Garden area and head down the stairs to cobble beach.
Tide Pool Scavenger Hunt
On the stairway platforms, rangers will stop their groups and divide into smaller, chaperone-led
teams. These teams will be responsible for completing a tide pool scavenger hunt. This activity is
explained to the students in the context of a “cursory sample of species richness.” Students will
be trying to determine whether each species is present or absent in the tide pool area. This
scavenger hunt will last approximately 20-30 minutes before the students are called together to
discuss their findings and what they found during the scavenger hunt. Any questions about
specific creatures can be answered at this point. Students will discuss the following themes:
Did you see everything on your scavenger hunt card? Why or why not?
Did you see a species you have never seen before? If so what did it look like?
How many species do you think exist in the entire tide pool area?
Were some areas more diverse than others? Why or why not?

How Wealthy is Your Tide Pool? Field Trip Outline
Monitoring the Tide Pools
Rangers will next introduce concepts, and give instructions for how to complete the monitoring
activity. Instructions will be given verbally in addition to step by step procedures. In their small
groups, the students will then clarify the instructions and create a testable hypothesis that
answers the following question “Which intertidal zone has the most species richness?” Students
then record their hypotheses (as well as their names) on their team’s “Tide Pool Richness Data
Collection Sheet”
At this point in the program the ranger may stop to clarify the directions for the next activity, and
then lead the group in a discussion of why each team chose their hypothesis. This allows the
students to hear the reasoning behind other teams’ hypotheses, and gives them an opportunity to
share their thinking.
The Tide Pool Richness Monitoring activity is approximately a half-hour in duration. During this
time each of the 3 student groups will have 10 minutes to spend monitoring each of three sample
areas, ten square meters in size. Each sample will be located in the three major intertidal areas:
high tide, mid tide, tide pool. Once each group has had a chance to monitor the species richness
of each sample area, the ranger will bring the group together to compare and analyze their data.
Students will be asked to verbally report their data from each zone, and the data from all three
teams will be averaged to come up with a mean species richness figure for each sample area. As
a group, the students will then graph the data, and discuss which hypotheses were correct, which
were incorrect, and why.
Conclusion
The program concludes with a reflective activity, to be decided upon by the ranger. Because so
many different groups respond to different types of activities uniquely, your group’s ranger may
chose to play a game, do a quiet solo activity, or use a talking-stick to discuss the days events
from a thoughtful and meaningful point of view, allowing the students to connect with rocky
shore ecology on a deeper level.

Master Pages

Species Richness is a measure of the number of
different species living within a given area


Monitoring for Tide Pool Richness
Instruction Sheet 1. Create a transect in each zone*: Your transect should be a relatively straight
line, and should be nearly parallel to the shore. Ensure that each transect is properly placed by checking with your Ranger. (*The transect may already be set up by the ranger.)
2. Survey your transects: Slowly and carefully walk along each side of the transect. Record the presence of any and all species located within one meter of your transect (within the reach of your measuring stick).
3. Rotate to the next zone: After approximately 10 minutes, the ranger will signal for you and your group to move to the next transect (in the next intertidal zone). Do this swiftly, so as to make sure you and your team have adequate time to sample each zone.
4. Repeat: Repeat step 2 and 3 until you and your team have sampled and recorded data from each zone.
5. Record and compile your data: As you survey each sample plot, your team should be recording data on the presence or absence of species in that area. When you have finished surveying the transects, you can compile data on the number of zones in which each species lives, as well as the total number of different species in each zone. This data will be used in your ranger groups to graph the relative species richness of each intertidal zone.
When you have finished compiling your data, your chart should look something like this
Tide Pool Organism Common Name, Scientific Name
Tide Pool Mid Tide
High Tide Zones where Species Exists
Turban Snail Tegula funebralis + + + 3 Limpit Acmaea mitra - + - 1
Total number of species present in this zone X 1 2 1 X
6. Return to your ranger led groups: Here you will analyze and discuss the data you have collected. You will be asked to verbally report your team’s data, and to compare it to the data from other teams in your Ranger group. Together, you and your Ranger group will be making a graph.
7. In the Classroom: Once you and your classmates return to school, you will have another opportunity to analyze and discuss your data. This data can be graphed using the same methods you and your Ranger used while at YHONA.
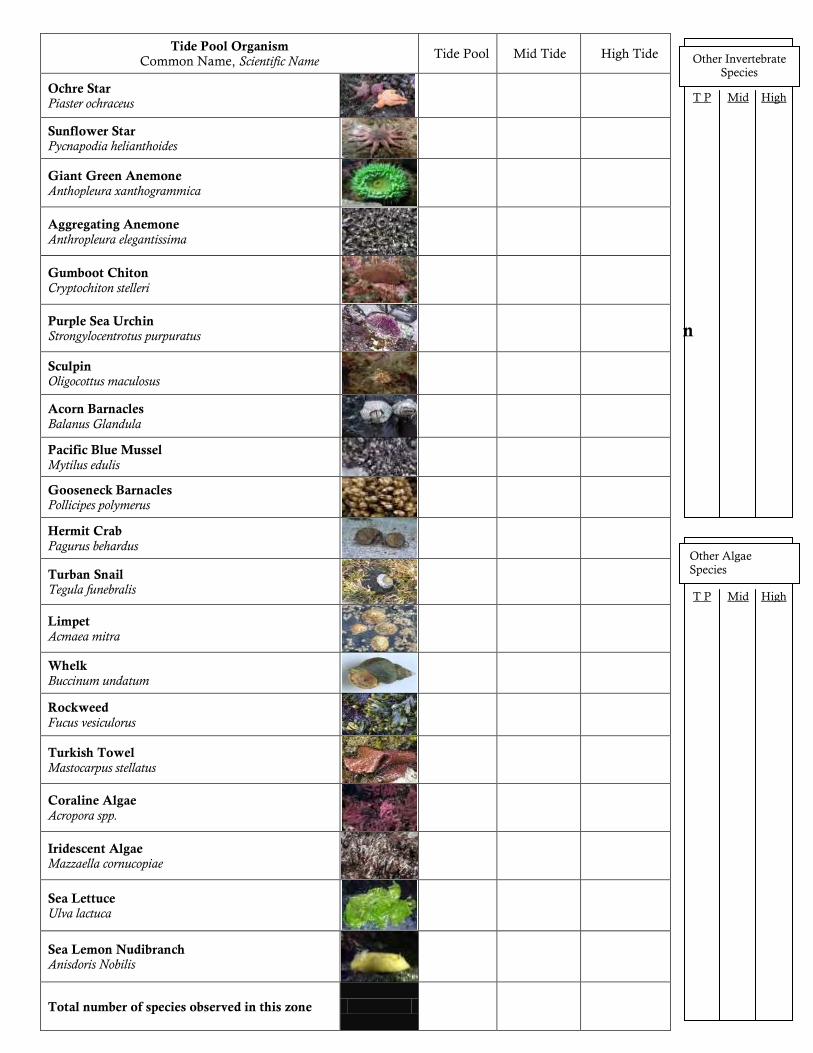
Tide Pool Organism Tide Pool Mid Tide High Tide
Common Name, Scientific Name Other Invertebrate Species
Ochre Star
T P Mid High Piaster ochraceus
Sunflower Star
Pycnapodia helianthoides
Giant Green Anemone
Anthopleura xanthogrammica
Aggregating Anemone
Anthropleura elegantissima Tide Pool
Richness Gumboot Chiton
Cryptochiton stelleri Data
Collectio Purple Sea Urchin
n Sheet Strongylocentrotus purpuratus
Sculpin Oligocottus maculosus
Acorn Barnacles
Balanus Glandula
Pacific Blue Mussel Mytilus edulis
Gooseneck Barnacles
Pollicipes polymerus
Hermit Crab Pagurus behardus
Other Algae Species Turban Snail
Tegula funebralis T P Mid High
Limpet
Acmaea mitra
Whelk Buccinum undatum
Rockweed
Fucus vesiculorus
Turkish Towel
Mastocarpus stellatus
Coraline Algae
Acropora spp.
Iridescent Algae Mazzaella cornucopiae
Sea Lettuce Ulva lactuca
Sea Lemon Nudibranch Anisdoris Nobilis
Total number of species observed in this zone


