hsbc global asset management (usa) inc. hsbc funds · hsbc u.s. government money market fund ftrxx...
TRANSCRIPT

HSBC FundsAnnual ReportOctober 31, 2019
MONEY MARKET FUNDS Class A Class C Class D Class E Class IIntermediary
Class
Intermediary Service Class Class Y
HSBC U.S. Government Money Market Fund
FTRXX HUMXX HGDXX HGEXX HGIXX HGGXX HGFXX RGYXX
HSBC U.S. Treasury Money Market Fund
HWAXX HUCXX HTDXX HTEXX HBIXX HTGXX HTFXX HTYXX
JOB TITLE HSBC Money Market AR REVISION 11 SERIAL <12345678> DATE Monday, December 23, 2019 JOB NUMBER 367682(1) TYPE PAGE NO. i OPERATOR JOSHUAM

JOB TITLE HSBC Money Market AR REVISION 11 SERIAL <12345678> DATE Monday, December 23, 2019 JOB NUMBER 367682(1) TYPE PAGE NO. ii OPERATOR JOSHUAM
Table of Contents
HSBC Family of FundsAnnual Report - October 31, 2019
Glossary of Terms ................................................................................................................................................................................................... 2Commentary From the Investment Manager......................................................................................................................................................... 3Portfolio Reviews .................................................................................................................................................................................................... 4Portfolio Composition ............................................................................................................................................................................................. 6
Schedules of Portfolio Investments
HSBC U.S. Government Money Market Fund .................................................................................................................................................... 7 HSBC U.S. Treasury Money Market Fund ........................................................................................................................................................... 10Statements of Assets and Liabilities ...................................................................................................................................................................... 11Statements of Operations ...................................................................................................................................................................................... 12Statements of Changes in Net Assets ................................................................................................................................................................... 13Financial Highlights ................................................................................................................................................................................................. 15Notes to Financial Statements ............................................................................................................................................................................... 19Report of Independent Registered Public Accounting Firm ................................................................................................................................... 29Other Federal Income Tax Information ................................................................................................................................................................... 31Table of Shareholder Expenses .............................................................................................................................................................................. 32Board of Trustees and Officers ............................................................................................................................................................................... 34Other Information ................................................................................................................................................................................................... 36
JOB TITLE HSBC Money Market AR REVISION 11 SERIAL <12345678> DATE Monday, December 23, 2019 JOB NUMBER 367682(1) TYPE PAGE NO. 1 OPERATOR JOSHUAM

Glossary of Terms
Bloomberg Barclays Global Aggregate Index is an index that is the measure of the global investment-grade debt from 24 local currency markets, which include treasury, government-related, corporate, and securitized fixed-rate bonds from both developed and emerging markets issuers.
Bloomberg Barclays U.S. Aggregate Bond Index is a broad-based benchmark that measures the investment-grade, U.S. dollar-denominated, fixed-rate taxable bond market. This includes Treasuries, government-related and corporate securities, mortgage-backed securities, asset-backed securities and collateralized mortgage-backed securities.
Gross Domestic Product (“GDP”) is the value of goods and services produced in a given country in a given year.
MSCI Europe Australasia and Far East (“MSCI EAFE”) Index is an equity index which captures the large- and mid-cap representation across 21 developed markets countries, excluding the U.S. and Canada.
MSCI Emerging Markets Index is a float-adjusted market capitalization index that is designed to measure equity market performance in global emerging markets.
Purchasing Managers’ Index (“PMI”) is an indicator of the economic health of the manufacturing sector. The PMI is based on five major indicators: new orders, inventory levels, production, supplier deliveries, and the employment environment.
Russell 1000® Index measures the performance of the large-cap segment of the U.S. equity universe. It is a subset of the Russell 3000® Index and includes approximately 1000 of the largest securities based on a combination of their market cap and current index membership. The Russell 1000 represents approximately 92% of the U.S. market.
Russell 2000® Index measures the performance of the small-cap segment of the U.S. equity universe. The Russell 2000® Index is a subset of the Russell 3000® Index representing approximately 8% of the total market capitalization of that index. It includes approximately 2000 of the smallest securities based on a combination of their market cap and current index membership.
Securities indices are unmanaged and assume reinvestment of all distributions and interest payments and do not take in account brokerage fees or expenses. Securities in the Funds do not match those in the indices and performance of the Funds will differ. Investors cannot invest directly in an index.
2 HSBC FAMILY OF FUNDS
JOB TITLE HSBC Money Market AR REVISION 11 SERIAL <12345678> DATE Monday, December 23, 2019 JOB NUMBER 367682(1) TYPE PAGE NO. 2 OPERATOR JOSHUAM

Commentary From the Investment Manager (Unaudited)
Global Economic Review
The global economy softened during the 12-month period from November 1, 2018 through October 31, 2019. The U.S. Federal Reserve Board (the Fed) moved to protect the U.S. economy from global economic weakness by shifting monetary policy from tightening to easing. Uncertainty stemming from U.S.-China trade conflicts, weakness in the eurozone and a downturn in the manufacturing sector, especially in China, exerted downward pressure on economic growth around the world.
Late in 2018, fears of recession drove steep declines in equity markets. Optimism returned in early 2019 as central banks in China, the U.S. and Europe signaled looser monetary policies. Yet worries about the trade conflict between the U.S. and China and signs of further global economic weakness began to weigh on global equities and investor confidence as the year progressed. In the end, some resilience in the U.S. economy and cautious optimism about the potential for improved international trade relations helped buoy equity markets.
The U.S. economy grew throughout the period, though generally at a slowing rate. Annual GDP1 growth peaked at 3.1% in the first quarter of 2019, rebounding from 2.2% in the fourth quarter of 2018. GDP growth dropped to 1.9% in the second quarter of 2019, and early estimates suggest a similar growth rate in the third quarter. The U.S. unemployment rate fell from an already-low level, ending the period at 3.6%. The solid labor market, low interest rates and strong consumer confidence helped support the U.S. economy. Meanwhile, underlying inflation remained subdued. These positive factors generally outweighed a weak picture for U.S. investments and exports amid slower global growth, trade concerns and elevated political uncertainty.
The U.S. yield curve inverted in August as yields on certain short-term Treasury securities fell below yields on longer-term bonds. An inverted yield curve is widely considered a leading indicator of an economic recession. In reaction to signs that global economic weakness was weighing on U.S. growth, the Fed reduced interest rates three times between July and October, for a total reduction of 75 basis points (0.75%).
Weakening manufacturing data weighed on the eurozone throughout the period. Germany narrowly avoided a technical recession in 2019 due to the manufacturing sector’s extended slump, according to data from the PMI1. A robust labor market continued to support the region’s service sector, however, helping to sustain overall eurozone economic activity throughout the period.
Britain’s attenuated negotiations over Brexit continue to constrain economic performance in the United Kingdom. Businesses have had to contend with a challenging operating environment amid shifting deadlines for an agreement governing the United Kingdom’s exit from the European Union. For example, companies have tended to stockpile goods prior to each proposed deadline, and then subsequently sell down their stockpiles each time the government receives a new
extension. The possibility for a wide variety of outcomes, including “no-deal,” “deal” or “no Brexit” scenarios, created (and continues to create) intense uncertainty for businesses and investors. A strong labor market provided a bright spot amid the country’s economic uncertainty.
In Japan, cyclical indicators early in the period fell to their lowest levels since early 2016. Growth remained sluggish through 2019 amid a slowdown in business investment. Meanwhile, softness in global trade—particularly trade with China, a large consumer of many Japanese exports— weighed on the country’s economy.
Emerging market economies remained relatively strong despite heightened geopolitical risks, including lingering trade tensions. Rate cuts from the Fed and looser monetary policy from emerging markets central banks supported these economies. While recent geopolitical instability in Latin America reduced economic growth in that region, the structural characteristics of many other emerging market economies remain strong.
China’s manufacturing exports, domestic orders and industrial profits declined early in the period, as the trade dispute with the U.S. exacerbated the country’s economic downturn. Manufacturing activity picked up briefly in June, but the country’s economic data generally continued to weaken from July through October.
Market review
Global equity markets suffered steep declines late in 2018. Stocks rebounded in early 2019 due in part to easing monetary policy in the U.S. and China, but fell again in May as U.S.-China trade relations deteriorated. Markets continued to rise and fall through the remainder of the period in response to fluctuating trade tensions, mixed economic data and Fed rate cuts. Despite this month-to-month volatility, global equity markets generally delivered positive results for the period.
U.S. stocks ended the period with uneven gains. The Russell 1000® Index1 of large-capitalization U.S. stocks returned 14.15%, while the Russell 2000® Index1 of small-cap stocks produced a 4.91% return.
International equities generally trailed the U.S. stock market. The MSCI EAFE Index1 of developed-market international stocks gained 11.63% (gross of withholding taxes), and the MSCI Emerging Markets Index1 returned 12.29% (gross of withholding taxes).
Global fixed-income markets rallied as looser central bank policies pushed interest rates down and bond prices up. Late in the period, sentiment on U.S.-China trade relations turned cautiously optimistic, easing investor concerns about the global economic outlook and curtailing bond returns. The Bloomberg Barclays Global Aggregate Bond Index1, which tracks the broader global investment-grade fixed income market, posted a 9.54% return for the 12-month period. Meanwhile the Bloomberg Barclays U.S. Aggregate Bond Index1, which tracks similar bonds in the U.S. market, posted an 11.51% return for the 12-month period. 1 For additional information, please refer to the Glossary of Terms.
HSBC Global Asset Management (USA) Inc.
HSBC FAMILY OF FUNDS 3
JOB TITLE HSBC Money Market AR REVISION 11 SERIAL <12345678> DATE Monday, December 23, 2019 JOB NUMBER 367682(1) TYPE PAGE NO. 3 OPERATOR JOSHUAM

Portfolio Reviews (Unaudited)
HSBC U.S. Government Money Market Fund(Class A Shares, Class C Shares, Class D Shares, Class E Shares, Class I Shares, Intermediary Class, Intermediary Service Class and Class Y Shares)by John ChiodiSenior Portfolio Manager
Investment Concerns
You could lose money by investing in the Fund. Although the Fund seeks to preserve the value of your investment at $1.00 per share, it cannot guarantee it will do so. An investment in the Fund is not a deposit of HSBC Bank USA, N.A. and is not insured or guaranteed by the Federal Deposit Insurance Corporation or any other government agency. The Fund’s sponsor has no legal obligation to provide financial support to the Fund, and you should not expect that the sponsor will provide financial support to the Fund at any time.For a complete description of these and other risks associated with investment in a mutual fund, please refer to the Fund’s prospectus.Portfolio Performance
Yields on U.S. government money market securities fell significantly during the 12-month period ended October 31, 2019. The Federal Reserve Board (the Fed) raised short-term interest rates once, in December 2018, before reversing course and cutting rates in July, September, and October for a net decline of 50 basis points (0.50%) for the period. This decline in interest rates drove yields down. The Fed’s shift in interest rate strategy was largely a response to economic developments. Uncertainty over the impact of U.S. trade policy on the manufacturing sector led to a more cautious approach to interest rates,
as did concern over persistently below-target inflation rates. These developments fueled rate cuts totaling 75 basis points (0.75%) between July 31 and October 30. At its October 30, 2019, meeting, the Fed signaled its intention to wait and see the cumulative effect of its rate cuts before taking further action. In general, rate actions take six months to demonstrate their full impact on the economy.As the Fed’s bias shifted during the period, the Fund repositioned itself in preparation for lower rates by extending its duration and maintaining a longer weighted average maturity. As a result, the Fund’s composition became more barbell-shaped, taking on more repurchase agreements (repos) and floating-rate debt. That positioning supported the Fund’s absolute performance.†
The Fund benefited from its higher repo levels through mid-September, when a combination of an increase in repo supply from the Treasury and money being drained out of the system to cover corporate tax payments led to unusually high repo prices. The Fed used its daily open market operations to raise liquidity in the repo markets, bringing rates back to normal levels. This intervention is expected to continue into 2020. This news led the Fund to begin reducing its repo positions and adding to fixed-rate and floating-rate securities that would perform well under lower-than-expected repo levels.†
† Portfolio composition is subject to change.
Moody’s and Standard & Poor’s have assigned an “Aaa-mf” and
“AAAm” rating to the HSBC U.S. Government Money Market Fund.1
Fund PerformanceAverage Annual Total Return (%) Yield (%)2
Expense Ratio (%)3
As of October 31, 2019 Inception
Date1
Year5
Year10
YearSince
Inception7-Day
Average Gross NetClass A 5/3/90 1.71 0.60 0.31 2.44 1.25 0.66 0.66Class C4 11/20/06 — — — 1.39 — 1.26 1.26Class D 4/1/99 1.87 0.69 0.35 1.56 1.40 0.51 0.51Class E5 7/12/16 — — — 0.34 — 0.26 0.25Class I6 12/24/03 2.23 0.94 0.49 1.11 1.76 0.16 0.14Intermediary Class 7/12/16 2.20 — — 1.35 1.73 0.31 0.18Intermediary Service Class 7/12/16 2.17 — — 1.32 1.70 0.36 0.20Class Y 7/1/96 2.12 0.86 0.43 2.12 1.65 0.26 0.26
Past performance does not guarantee future results. The performance data quoted represents past performance and current returns may be lower or higher. Total return figures include change in share price, reinvestment of dividends and capital gains and do not reflect taxes that a shareholder would pay on Fund distributions or on the redemption of Fund shares. Investment return and principal value will fluctuate so that an investor’s shares, when redeemed may be worth more or less than the original cost. To obtain performance information current to the most recent month end, please call 1-800-782-8183.The performance above reflects any fee waivers that have been in effect during the applicable periods, as well as any expense reimbursements that have periodically been made. Absent such waivers and reimbursements, returns would have been lower. Currently, contractual fee waivers and/or expense reimbursements are in effect for the Fund through March 1, 2020 for the Class E Shares, Class I Shares, Intermediary Class Shares and Intermediary Service Class Shares.1 The “Aaa-mf ” and “AAAm” money market fund rating is historical and reflects Moody’s and Standard & Poor’s opinion as to the quality of the Fund’s investments, liquidity
management, and operations and trading support. Periodic reviews are conducted to ensure a secure operations environment. Moody’s and Standard & Poor’s ratings represent an opinion only, not a recommendation to buy or sell. Obligations rated A-1+, A-1 or P-1 are rated in the highest short-term rating category by Standard & Poor’s (A-1+ or A-1) or Moody’s Investor Service (P-1). The obligor’s capacity to meet its financial commitments on these obligations is regarded to be “extremely strong” (A-1+), “strong” (A-1) or “superior” (P-1).
2 The seven-day yield quotation more closely reflects the current earnings of the money market fund than the total return quotation. The seven-day yield reflects voluntary fee waivers/expense reimbursements. Without the voluntary fee waivers/expense reimbursements, the yields would have been 1.75%, 1.60%, and 1.55% for Class I Shares, Intermediary Class, and Intermediary Service Class, respectively.
3 Reflects the expense ratio as reported in the prospectus dated February 28, 2019, as restated May 29, 2019 and supplemented to date. HSBC Global Asset Management (USA) Inc., the Adviser, has entered into a contractual expense limitation agreement with the Fund under which it will limit total expenses of the Fund (excluding interest, taxes, brokerage commissions, extraordinary expenses and estimated indirect expenses attributable to the Fund’s investments in investment companies) to an annual rate of 0.25%, 0.14%, 0.18%, and 0.20% for Class E Shares, Class I Shares, Intermediary Class Shares, and Intermediary Service Class Shares, respectively. The expense limitation shall be in effect until March 1, 2020. Additional information pertaining to the October 31, 2019 expense ratios can be found in the financial highlights.
4 Reflects the applicable contingent deferred sales charge, maximum of 1.00%, for returns presented. Class C Shares were operational during a portion of the periods presented. Amounts reflect performance for the period of time the Class had operations, which was 346, 362 and 351 days during the years ended October 31, 2006, 2009 and 2010, respectively. The Class was not operational during the entire fiscal years ended October 31, 2007, 2008, 2011, 2012, 2013, 2014, 2015, 2016, 2017, 2018 and 2019. No returns are presented for the one-year, five-year and 10-year periods with non-continuous operations.
5 Class E Shares were operational during a portion of the periods presented. Amounts reflect performance for the period of time the Class had operations, which was 112 and 283 days during the years ended October 31, 2016 and 2017, respectively. The Class was not operational during the entire fiscal years ended October 31, 2018 and 2019. No return is presented for the one-year period with non-continuous operations.
6 Class I Shares were operational during a portion of the periods presented. Amounts reflect performance for the period of time the Class had operations, which was 10, 89, 136 and 357 days during the years ended October 31, 2004, 2005, 2006 and 2007, respectively. The Class was operational during the entire fiscal years ended October 31, 2008 through 2019.
4 HSBC FAMILY OF FUNDS
JOB TITLE HSBC Money Market AR REVISION 11 SERIAL <12345678> DATE Monday, December 23, 2019 JOB NUMBER 367682(1) TYPE PAGE NO. 4 OPERATOR JOSHUAM

Portfolio Reviews (Unaudited)
HSBC U.S. Treasury Money Market Fund(Class A Shares, Class C Shares, Class D Shares, Class E Shares, Class I Shares, Intermediary Class, Intermediary Service Class and Class Y Shares) by John ChiodiSenior Portfolio Manager
Investment Concerns
You could lose money by investing in the Fund. Although the Fund seeks to preserve the value of your investment at $1.00 per share, it cannot guarantee it will do so. An investment in the Fund is not a deposit of HSBC Bank USA, N.A. and is not insured or guaranteed by the Federal Deposit Insurance Corporation or any other government agency. The Fund’s sponsor has no legal obligation to provide financial support to the Fund, and you should not expect that the sponsor will provide financial support to the Fund at any time.For a complete description of these and other risks associated with investment in a mutual fund, please refer to the Fund’s prospectus.
Portfolio Performance
The Federal Reserve Board (the Fed) raised the federal funds rate, a short-term interest rate that influences Treasury bill yields, once during the period in December 2018, before reversing course and cutting rates in July, September, and October, for a net decline of 50 basis points (0.50%) for the 12-month period ended October 31, 2019. As a result, yields on Treasury bills declined significantly during the reporting period.
The Fed’s shift in interest rate strategy was largely a response to economic developments. Uncertainty over the impact of U.S. trade policy on the manufacturing sector led to a more cautious approach to interest rates, as did concern over persistently below-target inflation rates. These developments fueled rate cuts totaling 75 basis points (0.75%) between July 31 and October 30. At its October 30, 2019, meeting, the Fed signaled its intention to wait and see the cumulative effect of its rate cuts before taking further action. In general, rate actions take six months to demonstrate their full impact on the economy.During the period, the Fed also committed to purchasing $60 billion worth of Treasury bills on a monthly basis through at least the second quarter of 2020. In response to this news and in anticipation of expected rate cuts, the Fund increased its duration to between 40 and 50 days. Because the Fund can only invest in Treasury securities, floating rate debt continued to offer the most attractive yields available to it in the falling rate environment that dominated the second half of the period under review. As a result, the Fund maintained a weighted average maturity of 100 days or more through the end of the period.†
† Portfolio composition is subject to change.
Fund PerformanceAverage Annual Total Return (%) Yield (%)2
Expense Ratio (%)3
As of October 31, 2019 Inception
Date1
Year5
Year10
YearSince
Inception7-Day
Average Gross NetClass A4 5/24/01 — — — 1.08 — 0.68 0.68Class C5 12/24/03 — — — 0.04 — 1.28 1.28Class D 5/14/01 1.79 0.65 0.33 1.00 1.33 0.53 0.53Class E6 7/12/16 — — — 0.37 — 0.28 0.25Class I7 12/30/03 2.16 0.89 0.45 1.18 1.69 0.18 0.14Intermediary Class 7/12/16 2.14 — — 1.26 1.67 0.33 0.18Intermediary Service Class 7/12/16 2.12 — — 1.29 1.65 0.38 0.20Class Y 5/11/01 2.05 0.80 0.40 1.15 1.58 0.28 0.28
Past performance does not guarantee future results. The performance data quoted represents past performance and current returns may be lower or higher. Total return figures include change in share price, reinvestment of dividends and capital gains and do not reflect taxes that a shareholder would pay on Fund distributions or on the redemption of Fund shares. Investment return and principal value will fluctuate so that an investor’s shares, when redeemed may be worth more or less than the original cost. To obtain performance information current to the most recent month end, please call 1-800-782-8183. The performance above reflects any fee waivers that have been in effect during the applicable periods, as well as any expense reimbursements that have periodically been made. Absent such waivers and reimbursements, returns would have been lower. Currently, contractual fee waivers and/or expense reimbursements are in effect for the Fund through March 1, 2020 for the Class E Shares, Class I Shares, Intermediary Class Shares and Intermediary Service Class Shares.1 The “Aaa-mf ” and “AAAm” money market fund rating is historical and reflects Moody’s and Standard & Poor’s opinion as to the quality of the Fund’s investments, liquidity management,
and operations and trading support. Periodic reviews are conducted to ensure a secure operations environment. Moody’s and Standard & Poor’s ratings represent an opinion only, not a recommendation to buy or sell. Obligations rated A-1+, A-1 or P-1 are rated in the highest short-term rating category by Standard & Poor’s (A-1+ or A-1) or Moody’s Investor Service (P-1). The obligor’s capacity to meet its financial commitments on these obligations is regarded to be “extremely strong” (A-1+), “strong” (A-1) or “superior” (P-1).
2 The seven-day yield quotation more closely reflects the current earnings of the money market fund than the total return quotation. Without the voluntary fee waivers/ expense reimbursements, the yields would have been 1.68, 1.53%, and 1.48% for Class I Shares, Intermediary Class, and Intermediary Service Class, respectively.
3 Reflects the expense ratio as reported in the prospectus dated February 28, 2019, as restated May 29, 2019 and supplemented to date. HSBC Global Asset Management (USA) Inc., the Adviser, has entered into a contractual expense limitation agreement with the Fund under which it will limit total expenses of the Fund (excluding interest, taxes, brokerage commissions, extraordinary expenses and estimated indirect expenses attributable to the Fund’s investments in investment companies) to an annual rate of 0.25%, 0.14%, 0.18%, and 0.20% for Class E Shares, Class I Shares, Intermediary Class Shares, and Intermediary Service Class Shares, respectively. The expense limitation shall be in effect until March 1, 2020. Additional information pertaining to the October 31, 2019 expense ratios can be found in the financial highlights.
4 Class A Shares were operational during a portion of the periods presented. Amounts reflect performance for the period of time the Class had operations, which was 201 days during the year ended October 31, 2014 and the entire fiscal years ended October 31, 2001 through 2013. The Class was not operational during the entire fiscal years ended October 31, 2015 through 2019. No returns are presented for the one-year, five-year and 10-year periods with non-continuous operations.
5 Reflects the applicable contingent deferred sales charge, maximum of 1.00%, for returns presented. Class C Shares were operational during a portion of the periods presented. Amounts reflect performance for the period of time the Class had operations, which was 26 and 351 days during the years ended October 31, 2008 and 2010, respectively. The Class was operational during the entire fiscal years ended October 31, 2005, 2006, 2007 and 2009. The Class was not operational during the entire fiscal year ended October 31, 2011 through 2019. No returns are presented for the one-year, five-year and 10-year periods with non-continuous operations.
6 Class E Shares were operational during a portion of the periods presented. Amounts reflect performance for the period of time the Class had operations, which was 112 and 283 days during the fiscal years ended October 31, 2016 and 2017, respectively. The Class was not operational during the entire fiscal years ended October 31, 2018 and 2019. No return is presented for the one-year period with non-continuous operations.
7 Class I Shares were operational during a portion of the periods presented. Amounts reflect performance for the period of time the Class had operations, which was 13 and 280 days during the fiscal years ended October 31, 2004 and 2005, respectively. The Class was operational during the entire fiscal years ended October 31, 2006 through 2019.
Moody’s and Standard & Poor’s have assigned an “Aaa-mf” and
“AAAm” rating to the HSBC U.S. Treasury
Money Market Fund.1
HSBC FAMILY OF FUNDS 5
JOB TITLE HSBC Money Market AR REVISION 11 SERIAL <12345678> DATE Monday, December 23, 2019 JOB NUMBER 367682(1) TYPE PAGE NO. 5 OPERATOR JOSHUAM

Po r t f o l i o R e v i e w s
Portfolio Composition*October 31, 2019 (Unaudited)
6 HSBC FAMILY OF FUNDS
HSBC U.S. Government Money Market FundInvestment Allocation Percentage of Investments at Value (%)U.S. Government and Government Agency Obligations 54.5Repurchase Agreements 36.0U.S. Treasury Obligations 6.3Investment Companies 3.2Total 100.0
HSBC U.S. Treasury Money Market FundInvestment Allocation Percentage of Investments at Value (%)U.S. Treasury Obligations 100.0Total 100.0
* Portfolio composition is subject to change.
JOB TITLE HSBC Money Market AR REVISION 11 SERIAL <12345678> DATE Saturday, December 21, 2019 JOB NUMBER 367682(1) TYPE PAGE NO. 6 OPERATOR JOELF

H S B C U . S . G OV E R N M E N T M O N E Y M A R K E T F U N D
Schedule of Portfolio Investments—as of October 31, 2019
See notes to financial statements. HSBC FAMILY OF FUNDS 7
U.S. Government and Government Agency Obligations — 54.6%
Principal Amount ($) Value ($)
Federal Farm Credit Bank — 12.3%1.79% (US0001M - 2 bps),
05/28/2020(a) . . . . . . . . . . . . 100,000,000 100,000,0001.84% (US0001M - 1 bps),
07/20/2020(a) . . . . . . . . . . . . 75,000,000 75,000,0001.84% (FEDL01 + 2 bps),
06/17/2020(a) . . . . . . . . . . . . 80,000,000 79,991,8961.85% (FEDL01 + 3 bps),
02/05/2020(a) . . . . . . . . . . . . 15,000,000 14,998,4031.88% (US0001M + 4 bps),
01/19/2021(a) . . . . . . . . . . . . 40,000,000 40,000,0001.88% (US0001M + 8 bps),
07/26/2021(a) . . . . . . . . . . . . 100,000,000 100,000,0001.89% (US0001M - 4 bps),
03/11/2020(a) . . . . . . . . . . . . 150,000,000 149,994,5501.94% (FEDL01 + 12 bps),
02/09/2021(a) . . . . . . . . . . . . 115,000,000 115,000,0001.94% (FEDL01 + 12 bps),
02/22/2021(a) . . . . . . . . . . . . 110,000,000 110,000,0001.95% (FCPR DLY - 305 bps),
08/13/2021(a) . . . . . . . . . . . . 250,000,000 249,651,6231.95% (US0001M - 8 bps),
06/01/2020(a) . . . . . . . . . . . . 73,000,000 72,995,6831.97% (FCPR DLY - 303 bps),
09/03/2021(a) . . . . . . . . . . . . 180,000,000 179,882,8991.99% (FCPR DLY - 301 bps),
06/25/2020(a) . . . . . . . . . . . . 50,000,000 50,000,0001.99% (FEDL01 + 17 bps),
01/25/2021(a) . . . . . . . . . . . . 75,000,000 74,990,7681.99% (FCPR DLY - 301 bps),
06/07/2021(a) . . . . . . . . . . . . 25,000,000 25,000,0002.00% (US0001M + 12 bps),
10/18/2021(a) . . . . . . . . . . . . 50,000,000 50,000,0002.00% (FCPR DLY - 300 bps),
03/18/2021(a) . . . . . . . . . . . . 175,000,000 174,975,1452.00% (FCPR DLY - 300 bps),
03/22/2021(a) . . . . . . . . . . . . 150,000,000 149,978,9322.02% (FEDL01 + 20 bps),
04/22/2021(a) . . . . . . . . . . . . 50,000,000 50,000,0002.03% (FCPR DLY - 298 bps),
05/10/2021(a) . . . . . . . . . . . . 225,000,000 224,947,7392.04% (FEDL01 + 22 bps),
10/12/2021(a) . . . . . . . . . . . . 5,000,000 4,999,4942.05% (US0001M + 4 bps),
06/03/2021(a) . . . . . . . . . . . . 50,000,000 50,000,0002.07% (US0001M + 13 bps),
10/08/2021(a) . . . . . . . . . . . . 18,000,000 18,000,0002.09% (FCPR DLY - 292 bps),
12/17/2020(a) . . . . . . . . . . . . 50,000,000 49,997,1822.17% (US0001M + 16 bps),
10/04/2021(a) . . . . . . . . . . . . 65,000,000 65,000,000
2,275,404,314
Federal Home Loan Bank — 36.0%1.62%, 04/22/2020(b) . . . . . . . 47,720,000 47,348,9581.62%, 04/24/2020(b) . . . . . . . 93,000,000 92,268,5291.64%, 11/26/2019(b). . . . . . . . 30,880,000 30,843,544
U.S. Government and Government Agency Obligations, continued
Principal Amount ($) Value ($)
1.64%, 12/26/2019(b) . . . . . . . 567,673,000 566,227,4311.66%, 11/06/2019(b) . . . . . . . 100,000,000 99,972,2921.66%, 04/03/2020(b) . . . . . . . 9,800,000 9,730,4091.68%, 01/08/2020(b) . . . . . . . 250,000,000 249,195,8061.72%, 04/15/2020 . . . . . . . . . 100,000,000 99,996,1821.72% (US0003M - 22 bps),
01/24/2020(a) . . . . . . . . . . . . 150,000,000 150,000,0001.74%, 11/27/2019(b) . . . . . . . . 414,500,000 413,961,1241.75% (US0003M - 19 bps),
04/28/2020(a) . . . . . . . . . . . . 150,000,000 150,000,0001.76% (US0001M - 9 bps),
11/21/2019(a). . . . . . . . . . . . . 65,000,000 65,000,0001.79% (US0001M - 6 bps),
02/20/2020(a) . . . . . . . . . . . . 150,000,000 150,000,0001.82%, 11/20/2019(b). . . . . . . . 240,807,000 240,564,1231.82% (US0001M - 3 bps),
04/20/2020(a) . . . . . . . . . . . . 100,000,000 100,000,0001.83% (SOFR + 1 bps),
11/13/2019(a). . . . . . . . . . . . . 95,000,000 95,000,0001.83%, 02/13/2020(b) . . . . . . . 125,000,000 124,335,5561.83% (US0003M - 14 bps),
01/21/2020(a) . . . . . . . . . . . . 400,000,000 400,000,0001.84% (US0001M - 5 bps),
01/17/2020(a) . . . . . . . . . . . . 100,000,000 100,000,0001.84%, 12/06/2019(b) . . . . . . . 575,000,000 573,943,6811.86% (US0003M - 13 bps),
01/14/2020(a) . . . . . . . . . . . . 300,000,000 300,000,0001.87% (US0001M - 6 bps),
03/12/2020(a) . . . . . . . . . . . . 50,000,000 50,000,0001.87% (SOFR + 5 bps),
01/17/2020(a) . . . . . . . . . . . . 20,000,000 20,000,0001.87%, 11/22/2019(b). . . . . . . . 384,000,000 383,560,9601.88% (SOFR + 6.50 bps),
11/15/2019(a). . . . . . . . . . . . . 45,000,000 45,000,0001.88% (US0003M - 20 bps),
01/02/2020(a) . . . . . . . . . . . . 100,000,000 100,000,0001.90%, 11/29/2019(b). . . . . . . . 225,000,000 224,655,4251.90% (US0001M - 9 bps),
02/07/2020(a) . . . . . . . . . . . . 50,000,000 50,000,0001.90% (US0003M - 23 bps),
12/03/2019(a) . . . . . . . . . . . . 155,000,000 154,989,2181.91%, 12/04/2019(b) . . . . . . . 198,000,000 197,643,7101.91% (US0001M - 1 bps),
02/12/2020(a) . . . . . . . . . . . . 200,000,000 200,000,0001.92% (US0001M - 7 bps),
02/07/2020(a) . . . . . . . . . . . . 125,000,000 125,000,0001.92% (US0003M - 20 bps),
02/18/2020(a) . . . . . . . . . . . . 150,000,000 150,000,0001.94% (US0003M - 22 bps),
12/23/2019(a) . . . . . . . . . . . . 200,000,000 200,000,0001.94% (US0003M - 22 bps),
12/19/2019(a) . . . . . . . . . . . . 200,000,000 200,000,0001.97% (US0001M - 3 bps),
08/04/2020(a) . . . . . . . . . . . . 150,000,000 150,000,0001.97%, 12/20/2019(b) . . . . . . . 200,000,000 199,455,5561.97% (US0001M - 6 bps),
11/01/2019(a). . . . . . . . . . . . . 100,000,000 100,000,000
6,608,692,504
JOB TITLE HSBC Money Market AR REVISION 11 SERIAL <12345678> DATE Saturday, December 21, 2019 JOB NUMBER 367682(1) TYPE PAGE NO. 7 OPERATOR JOELF
H S B C U . S . G OV E R N M E N T M O N E Y M A R K E T F U N D
Schedule of Portfolio Investments—as of October 31, 2019 (continued)
8 HSBC FAMILY OF FUNDS See notes to financial statements.
U.S. Government and Government Agency Obligations, continued
Principal Amount ($) Value ($)
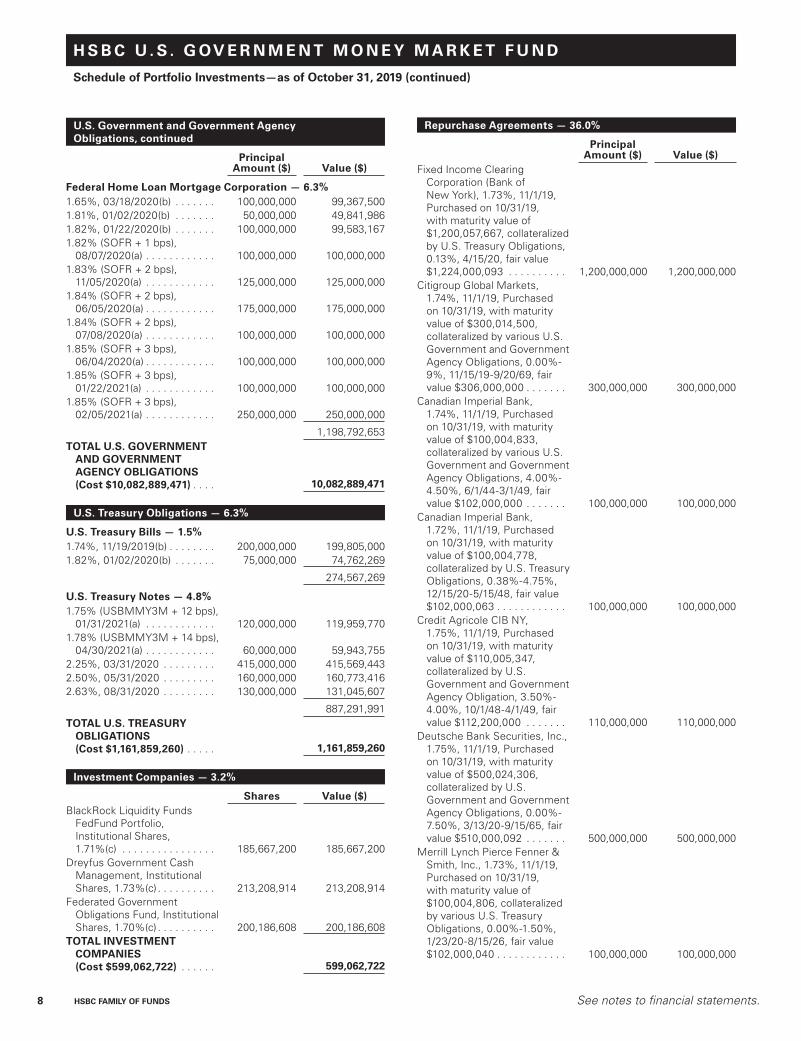
Federal Home Loan Mortgage Corporation — 6.3%1.65%, 03/18/2020(b) . . . . . . . 100,000,000 99,367,5001.81%, 01/02/2020(b) . . . . . . . 50,000,000 49,841,9861.82%, 01/22/2020(b) . . . . . . . 100,000,000 99,583,1671.82% (SOFR + 1 bps),
08/07/2020(a) . . . . . . . . . . . . 100,000,000 100,000,0001.83% (SOFR + 2 bps),
11/05/2020(a) . . . . . . . . . . . . 125,000,000 125,000,0001.84% (SOFR + 2 bps),
06/05/2020(a) . . . . . . . . . . . . 175,000,000 175,000,0001.84% (SOFR + 2 bps),
07/08/2020(a) . . . . . . . . . . . . 100,000,000 100,000,0001.85% (SOFR + 3 bps),
06/04/2020(a) . . . . . . . . . . . . 100,000,000 100,000,0001.85% (SOFR + 3 bps),
01/22/2021(a) . . . . . . . . . . . . 100,000,000 100,000,0001.85% (SOFR + 3 bps),
02/05/2021(a) . . . . . . . . . . . . 250,000,000 250,000,000
1,198,792,653TOTAL U.S. GOVERNMENT
AND GOVERNMENT AGENCY OBLIGATIONS (Cost $10,082,889,471) . . . . 10,082,889,471
U.S. Treasury Obligations — 6.3%
U.S. Treasury Bills — 1.5%1.74%, 11/19/2019(b) . . . . . . . . 200,000,000 199,805,0001.82%, 01/02/2020(b) . . . . . . . 75,000,000 74,762,269
274,567,269
U.S. Treasury Notes — 4.8%1.75% (USBMMY3M + 12 bps),
01/31/2021(a) . . . . . . . . . . . . 120,000,000 119,959,7701.78% (USBMMY3M + 14 bps),
04/30/2021(a) . . . . . . . . . . . . 60,000,000 59,943,7552.25%, 03/31/2020 . . . . . . . . . 415,000,000 415,569,4432.50%, 05/31/2020 . . . . . . . . . 160,000,000 160,773,4162.63%, 08/31/2020 . . . . . . . . . 130,000,000 131,045,607
887,291,991TOTAL U.S. TREASURY
OBLIGATIONS (Cost $1,161,859,260) . . . . . 1,161,859,260
Investment Companies — 3.2%
Shares Value ($)BlackRock Liquidity Funds
FedFund Portfolio, Institutional Shares, 1.71%(c) . . . . . . . . . . . . . . . . 185,667,200 185,667,200
Dreyfus Government Cash Management, Institutional Shares, 1.73%(c) . . . . . . . . . . 213,208,914 213,208,914
Federated Government Obligations Fund, Institutional Shares, 1.70%(c) . . . . . . . . . . 200,186,608 200,186,608
TOTAL INVESTMENT COMPANIES (Cost $599,062,722) . . . . . . 599,062,722
Repurchase Agreements — 36.0%
Principal Amount ($) Value ($)
Fixed Income Clearing Corporation (Bank of New York), 1.73%, 11/1/19, Purchased on 10/31/19, with maturity value of $1,200,057,667, collateralized by U.S. Treasury Obligations, 0.13%, 4/15/20, fair value $1,224,000,093 . . . . . . . . . . 1,200,000,000 1,200,000,000
Citigroup Global Markets, 1.74%, 11/1/19, Purchased on 10/31/19, with maturity value of $300,014,500, collateralized by various U.S. Government and Government Agency Obligations, 0.00%-9%, 11/15/19-9/20/69, fair value $306,000,000 . . . . . . . 300,000,000 300,000,000
Canadian Imperial Bank, 1.74%, 11/1/19, Purchased on 10/31/19, with maturity value of $100,004,833, collateralized by various U.S. Government and Government Agency Obligations, 4.00%-4.50%, 6/1/44-3/1/49, fair value $102,000,000 . . . . . . . 100,000,000 100,000,000
Canadian Imperial Bank, 1.72%, 11/1/19, Purchased on 10/31/19, with maturity value of $100,004,778, collateralized by U.S. Treasury Obligations, 0.38%-4.75%, 12/15/20-5/15/48, fair value $102,000,063 . . . . . . . . . . . . 100,000,000 100,000,000
Credit Agricole CIB NY, 1.75%, 11/1/19, Purchased on 10/31/19, with maturity value of $110,005,347, collateralized by U.S. Government and Government Agency Obligation, 3.50%-4.00%, 10/1/48-4/1/49, fair value $112,200,000 . . . . . . . 110,000,000 110,000,000
Deutsche Bank Securities, Inc., 1.75%, 11/1/19, Purchased on 10/31/19, with maturity value of $500,024,306, collateralized by U.S. Government and Government Agency Obligations, 0.00%-7.50%, 3/13/20-9/15/65, fair value $510,000,092 . . . . . . . 500,000,000 500,000,000
Merrill Lynch Pierce Fenner & Smith, Inc., 1.73%, 11/1/19, Purchased on 10/31/19, with maturity value of $100,004,806, collateralized by various U.S. Treasury Obligations, 0.00%-1.50%, 1/23/20-8/15/26, fair value $102,000,040 . . . . . . . . . . . . 100,000,000 100,000,000
JOB TITLE HSBC Money Market AR REVISION 11 SERIAL <12345678> DATE Saturday, December 21, 2019 JOB NUMBER 367682(1) TYPE PAGE NO. 8 OPERATOR JOELF

H S B C U . S . G OV E R N M E N T M O N E Y M A R K E T F U N D
Schedule of Portfolio Investments—as of October 31, 2019 (continued)
See notes to financial statements. HSBC FAMILY OF FUNDS 9
Repurchase Agreements, continued
Principal Amount ($) Value ($)
Natwest Markets PLC, 1.73%, 11/1/19, Purchased on 10/31/19, with maturity value of $500,024,028, collateralized by U.S. Treasury Obligations, 0.50%-6.63%, 4/15/24-2/15/27, fair value $510,000,005 . . . . . . . 500,000,000 500,000,000
Royal Bank of Canada, 1.73%, 11/1/19, Purchased on 10/31/19, with maturity value of $300,014,417, collateralized by U.S. Government and Government Agency Obligations, 0.00%-6.00%, 8/1/33-10/1/49, fair value $306,000,000 . . . . . . . 300,000,000 300,000,000
Societe' Generale, 1.75%, 11/1/19, Purchased on 10/31/19, with maturity value of $900,043,750, collateralized by various U.S. Government and Government Agency Obligations, 2.50%-3.50%, 6/1/49-10/1/49, fair value $918,000,001 . . . . . . . 900,000,000 900,000,000
Societe' Generale, 1.85%, 11/12/19, Purchased on 10/08/19, with maturity value of $400,719,444, collateralized by U.S. Government and Government Agency Obligations, 4.00%, 2/1/48, fair value $408,000,001 . . . . . . . . . . . . 400,000,000 400,000,000
Societe' Generale, 1.85%, 11/25/19, Purchased on 10/17/19, with maturity value of $200,400,833, collateralized by various U.S. Treasury Obligations, 0.00%-8.13%, 11/30/19-5/15/46, fair value $204,000,001 . . . . . . . 200,000,000 200,000,000
Societe' Generale, 1.76%, 11/22/19, Purchased on 10/23/19, with maturity value of $100,146,667, collateralized by various U.S. Treasury Obligations, 0.00%-2.75%, 12/5/19-8/15/42, fair value $102,000,038 . . . . . . . 100,000,000 100,000,000
Fixed Income Clearing Corporation (State Street Bank), 1.73%, 11/1/19, Purchased on 10/31/19, with maturity value of $1,100,052,861, collateralized by U.S. Treasury Obligations, 0.00%, 8/15/25-5/15/43, fair value $1,122,003,274 . . . . . . 1,100,000,000 1,100,000,000
Repurchase Agreements, continued
Principal Amount ($) Value ($)
Standard Chartered Bank, 1.73%, 11/1/19, Purchased on 10/31/19, with maturity value of $300,014,417, collateralized by various U.S. Government and Government Agency Obligations, 0.00%-6.00%, 12/5/19-3/20/67, fair value $306,000,000 . . . . . . . 300,000,000 300,000,000
Toronto Dominion Bank NY, 1.75%, 11/1/19, Purchased on 10/31/19, with maturity value of $250,012,153, collateralized by U.S. Treasury Obligations, 2.63%-2.88%, 1/31/26-8/15/28, fair value $255,000,079 . . . . . . . . . . . . 250,000,000 250,000,000
Toronto Dominion Bank NY, 1.72%, 11/6/19, Purchased on 10/30/19, with maturity value of $200,066,889, collateralized by U.S. Treasury Obligations, 2.38%-3.63%, 2/15/21-8/15/24, fair value $204,000,040 . . . . . . . . . . . . 200,000,000 200,000,000
TOTAL REPURCHASE AGREEMENTS (Cost $6,660,000,000) . . . . . 6,660,000,000
TOTAL INVESTMENTS IN SECURITIES (Cost $18,503,811,453) — 100.1% . . . . . . . . . . . . . . . . . 18,503,811,453
Other Assets (Liabilities) - (0.1)% . . . . . . . (12,407,757)
NET ASSETS - 100% . . . . . . . $18,491,403,696
(a) Floating or variable rate security linked to the referenced benchmark. The rate presented represents the rate in effect on October 31, 2019. These securities are deemed to have a maturity remaining until the next adjustment of the interest rate or the longer of the demand period of time to the next readjustment.
(b) Discount note. Rate presented represents the effective yield at time of purchase.
(c) The rate represents the annualized one day yield that was in effect on October 31, 2019.
bps - Basis PointsFCPR DLY - Federal Reserve Bank Prime Rate Loan USFEDL01 - Effective Federal Funds RateSOFR - Secured Overnight Financing RateUSBMMY3M - 3 Month Treasury Bill RateUS0001M - 1 Month US Dollar LIBORUS0003M - 3 Month US Dollar LIBOR
JOB TITLE HSBC Money Market AR REVISION 11 SERIAL <12345678> DATE Saturday, December 21, 2019 JOB NUMBER 367682(1) TYPE PAGE NO. 9 OPERATOR JOELF

H S B C U . S . T R E A S U RY M O N E Y M A R K E T F U N D
Schedule of Portfolio Investments—as of October 31, 2019
10 HSBC FAMILY OF FUNDS See notes to financial statements.
U.S. Treasury Obligations — 104.2%
Principal Amount ($) Value ($)
U.S. Treasury Bills — 84.0%1.33%, 11/05/2019(a) . . . . . . . . . . . . . . . . . . . . . . . . . . . . . . . . . . . . . . . . . . . . . . . . . . . . . . . . . . . . . . . . 202,000,000 201,962,7771.47%, 12/31/2019(a) . . . . . . . . . . . . . . . . . . . . . . . . . . . . . . . . . . . . . . . . . . . . . . . . . . . . . . . . . . . . . . . . 85,000,000 84,788,2111.63%, 12/17/2019(a) . . . . . . . . . . . . . . . . . . . . . . . . . . . . . . . . . . . . . . . . . . . . . . . . . . . . . . . . . . . . . . . . 90,000,000 89,808,7811.64%, 12/24/2019(a) . . . . . . . . . . . . . . . . . . . . . . . . . . . . . . . . . . . . . . . . . . . . . . . . . . . . . . . . . . . . . . . . 220,000,000 219,460,8461.66%, 12/03/2019(a) . . . . . . . . . . . . . . . . . . . . . . . . . . . . . . . . . . . . . . . . . . . . . . . . . . . . . . . . . . . . . . . . 100,000,000 99,848,0231.66%, 12/10/2019(a) . . . . . . . . . . . . . . . . . . . . . . . . . . . . . . . . . . . . . . . . . . . . . . . . . . . . . . . . . . . . . . . . 90,000,000 89,834,6841.67%, 01/09/2020(a) . . . . . . . . . . . . . . . . . . . . . . . . . . . . . . . . . . . . . . . . . . . . . . . . . . . . . . . . . . . . . . . . 125,000,000 124,594,2421.68%, 04/09/2020(a). . . . . . . . . . . . . . . . . . . . . . . . . . . . . . . . . . . . . . . . . . . . . . . . . . . . . . . . . . . . . . . . 50,000,000 49,626,6671.74%, 11/19/2019(a) . . . . . . . . . . . . . . . . . . . . . . . . . . . . . . . . . . . . . . . . . . . . . . . . . . . . . . . . . . . . . . . . 101,100,000 101,007,4611.80%, 11/26/2019(a) . . . . . . . . . . . . . . . . . . . . . . . . . . . . . . . . . . . . . . . . . . . . . . . . . . . . . . . . . . . . . . . . 150,000,000 149,805,2081.82%, 11/14/2019(a) . . . . . . . . . . . . . . . . . . . . . . . . . . . . . . . . . . . . . . . . . . . . . . . . . . . . . . . . . . . . . . . . 85,000,000 84,939,9931.82%, 01/02/2020(a) . . . . . . . . . . . . . . . . . . . . . . . . . . . . . . . . . . . . . . . . . . . . . . . . . . . . . . . . . . . . . . . . 50,000,000 49,841,5131.84%, 11/12/2019(a) . . . . . . . . . . . . . . . . . . . . . . . . . . . . . . . . . . . . . . . . . . . . . . . . . . . . . . . . . . . . . . . . 66,000,000 65,959,4651.85%, 01/16/2020(a) . . . . . . . . . . . . . . . . . . . . . . . . . . . . . . . . . . . . . . . . . . . . . . . . . . . . . . . . . . . . . . . . 55,000,000 54,782,7311.87%, 12/05/2019(a) . . . . . . . . . . . . . . . . . . . . . . . . . . . . . . . . . . . . . . . . . . . . . . . . . . . . . . . . . . . . . . . . 35,000,000 34,936,5001.87%, 12/12/2019(a) . . . . . . . . . . . . . . . . . . . . . . . . . . . . . . . . . . . . . . . . . . . . . . . . . . . . . . . . . . . . . . . . 100,000,000 99,781,8461.87%, 12/26/2019(a) . . . . . . . . . . . . . . . . . . . . . . . . . . . . . . . . . . . . . . . . . . . . . . . . . . . . . . . . . . . . . . . . 50,000,000 49,854,6321.89%, 11/29/2019(a) . . . . . . . . . . . . . . . . . . . . . . . . . . . . . . . . . . . . . . . . . . . . . . . . . . . . . . . . . . . . . . . . 50,000,000 49,924,144
1,700,757,724
U.S. Treasury Notes — 20.2%1.38%, 03/31/2020. . . . . . . . . . . . . . . . . . . . . . . . . . . . . . . . . . . . . . . . . . . . . . . . . . . . . . . . . . . . . . . . . . 25,000,000 24,944,9291.67% (USBMMY3M + 3 bps), 04/30/2020(b) . . . . . . . . . . . . . . . . . . . . . . . . . . . . . . . . . . . . . . . . . . . . 10,000,000 10,001,3311.68% (USBMMY3M + 4 bps), 07/31/2020(b). . . . . . . . . . . . . . . . . . . . . . . . . . . . . . . . . . . . . . . . . . . . . 50,000,000 50,000,0001.68% (USBMMY3M + 5 bps), 10/31/2020(b). . . . . . . . . . . . . . . . . . . . . . . . . . . . . . . . . . . . . . . . . . . . . 25,000,000 24,973,7391.75% (USBMMY3M + 12 bps), 01/31/2021(b) . . . . . . . . . . . . . . . . . . . . . . . . . . . . . . . . . . . . . . . . . . . . 150,000,000 149,934,9291.78% (USBMMY3M + 14 bps), 04/30/2021(b). . . . . . . . . . . . . . . . . . . . . . . . . . . . . . . . . . . . . . . . . . . . 25,000,000 24,999,4502.13%, 08/31/2020 . . . . . . . . . . . . . . . . . . . . . . . . . . . . . . . . . . . . . . . . . . . . . . . . . . . . . . . . . . . . . . . . . . 20,000,000 20,079,6652.25%, 03/31/2020. . . . . . . . . . . . . . . . . . . . . . . . . . . . . . . . . . . . . . . . . . . . . . . . . . . . . . . . . . . . . . . . . . 50,000,000 50,068,6282.50%, 05/31/2020. . . . . . . . . . . . . . . . . . . . . . . . . . . . . . . . . . . . . . . . . . . . . . . . . . . . . . . . . . . . . . . . . . 20,000,000 20,096,7332.50%, 06/30/2020 . . . . . . . . . . . . . . . . . . . . . . . . . . . . . . . . . . . . . . . . . . . . . . . . . . . . . . . . . . . . . . . . . 25,000,000 25,095,0832.63%, 08/31/2020. . . . . . . . . . . . . . . . . . . . . . . . . . . . . . . . . . . . . . . . . . . . . . . . . . . . . . . . . . . . . . . . . . 10,000,000 10,080,432
410,274,919
TOTAL U.S. TREASURY OBLIGATIONS (Cost $2,111,032,643) . . . . . . . . . . . . . . . . . . . . . . . . . . . . . . . 2,111,032,643
TOTAL INVESTMENTS IN SECURITIES (Cost $2,111,032,643) — 104.2% . . . . . . . . . . . . . . . . . . . . . . 2,111,032,643
Other Assets (Liabilities) - (4.2)% . . . . . . . . . . . . . . . . . . . . . . . . . . . . . . . . . . . . . . . . . . . . . . . . . . . . . . (84,632,019)
NET ASSETS - 100% . . . . . . . . . . . . . . . . . . . . . . . . . . . . . . . . . . . . . . . . . . . . . . . . . . . . . . . . . . . . . . . . . $2,026,400,624
(a) Discount note. Rate presented represents the effective yield at time of purchase.(b) Floating or variable rate security linked to the referenced benchmark. The rate presented represents the rate in effect on October 31, 2019.
These securities are deemed to have a maturity remaining until the next adjustment of the interest rate or the longer of the demand period of time to the next readjustment.
bps - Basis PointsUSBMMY3M - 3 Month Treasury Bill Rate
JOB TITLE HSBC Money Market AR REVISION 11 SERIAL <12345678> DATE Saturday, December 21, 2019 JOB NUMBER 367682(1) TYPE PAGE NO. 10 OPERATOR JOELF

See notes to financial statements. HSBC FAMILY OF FUNDS 11
H S B C FA M I LY O F F U N D SStatements of Assets and Liabilities—as of October 31, 2019
HSBC U.S. Government
Money Market Fund
HSBC U.S. Treasury Money Market
Fund
Assets:Investments in securities, at value $11,843,811,453 $2,111,032,643Repurchase agreements, at value 6,660,000,000 —Cash 949,317 778,864Interest receivable 19,441,474 679,210Prepaid expenses and other assets 257,813 63,483Total Assets 18,524,460,057 2,112,554,200
Liabilities:Distributions payable 9,877,591 887,907Payable for investments purchased 19,997,897 84,788,211Accrued expenses and other liabilities:
Investment Management 1,669,000 247,823Administration 469,858 62,201Shareholder Servicing 416,311 29,965Accounting 5,500 5,791Custodian fees 89,224 1,669Transfer Agent 37,900 14,655Trustee 1,501 1,498Other 491,579 113,856
Total Liabilities 33,056,361 86,153,576Net Assets $18,491,403,696 $2,026,400,624
Composition of Net Assets:Paid in capital 18,491,403,209 2,026,372,767Total distributable earnings/loss 487 27,857
Net Assets $18,491,403,696 $2,026,400,624
Net Assets:Class A Shares $ 2,923,163 $ —Class D Shares 1,910,114,807 143,505,703Class I Shares 13,988,739,047 879,395,842Intermediary Class Shares 504,329,041 165,841,814Intermediary Service Class Shares 146,441,364 86,073,380Class Y Shares 1,938,856,274 751,583,885
$18,491,403,696 $2,026,400,624
Shares Outstanding:($0.001 par value, unlimited number of shares authorized):Class A Shares 2,923,125 —Class D Shares 1,909,922,759 143,535,558Class I Shares 13,988,889,898 879,389,393Intermediary Class Shares 504,330,086 165,837,895Intermediary Service Class Shares 146,444,879 86,072,339Class Y Shares 1,938,908,809 751,542,549
Net Asset Value, Offering Price and Redemption Price per share:Class A Shares $ 1.00 $ —Class D Shares $ 1.00 $ 1.00Class I Shares $ 1.00 $ 1.00Intermediary Class Shares $ 1.00 $ 1.00Intermediary Service Class Shares $ 1.00 $ 1.00Class Y Shares $ 1.00 $ 1.00Investment in securities, at cost $11,843,811,453 $2,111,032,643Repurchase agreements, at cost $ 6,660,000,000 $ —
Amounts designated as “—” are $0.00 or have been rounded to $0.00.
JOB TITLE HSBC Money Market AR REVISION 11 SERIAL <12345678> DATE Saturday, December 21, 2019 JOB NUMBER 367682(1) TYPE PAGE NO. 11 OPERATOR JOELF

12 HSBC FAMILY OF FUNDS See notes to financial statements.
H S B C FA M I LY O F F U N D SStatements of Operations—For the year ended October 31, 2019
HSBC U.S. Government
Money Market Fund
HSBC U.S. Treasury
Money Market Fund
Investment Income:Interest $308,875,861 $41,476,700Dividends 12,651,116 —
Total Investment Income 321,526,977 41,476,700
Expenses:Investment Management 13,884,140 1,821,502Operational Support:
Class A Shares 2,997 —Class D Shares 1,703,912 189,216Intermediary Class Shares 250,790 178,450Intermediary Service Class Shares 154,080 68,851Class Y Shares 1,915,742 756,533
Administration:Class A Shares 1,149 —Class D Shares 653,001 72,739Class I Shares 3,773,063 241,039Intermediary Class Shares 95,687 68,372Intermediary Service Class Shares 59,082 26,366Class Y Shares 734,623 290,035
Shareholder Servicing:Class A Shares 11,229 —Class D Shares 4,259,811 473,044Intermediary Class Shares 125,399 89,228Intermediary Service Class Shares 154,080 68,851
Accounting 67,107 57,887Compliance Services 31,392 31,392Custodian 853,693 104,175Printing 274,821 22,734Professional 161,342 150,625Transfer Agent 371,309 147,335Trustee 81,000 80,997Registration fees 145,348 85,551Other 535,816 119,853
Total expenses before fee and expense reductions 30,300,613 5,144,775Fees voluntarily reduced/reimbursed by Investment Adviser (2,005,548) (282,702)Fees contractually reduced/reimbursed by Investment Adviser (1,734,355) (482,618)Fees voluntarily reduced by Administrator (985,671) (56,780)Fees voluntarily reduced by Shareholder Servicing Agent (279,479) (158,079)Custody earnings credit (197,630) (37,859)Net Expenses 25,097,930 4,126,737
Net Investment Income 296,429,047 37,349,963
Realized/Unrealized Gains/(Losses) from Investments:Net realized gains/(losses) from investments in securities 83,830 58,815
Net realized/unrealized gains/(losses) on investments 83,830 58,815Change in Net Assets Resulting from Operations $296,512,877 $37,408,778
Amounts designated as “—” are $0.00 or have been rounded to $0.00.
JOB TITLE HSBC Money Market AR REVISION 11 SERIAL <12345678> DATE Saturday, December 21, 2019 JOB NUMBER 367682(1) TYPE PAGE NO. 12 OPERATOR JOELF
See notes to financial statements. HSBC FAMILY OF FUNDS 13
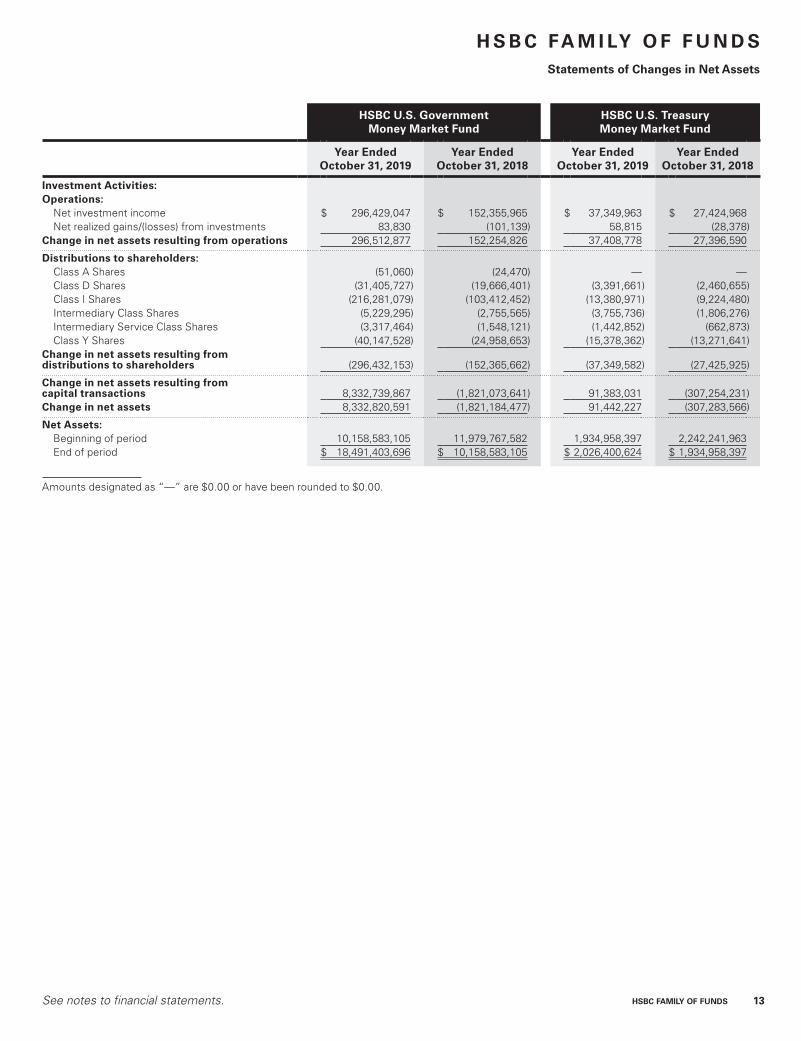
H S B C FA M I LY O F F U N D SStatements of Changes in Net Assets
HSBC U.S. Government Money Market Fund
HSBC U.S. Treasury Money Market Fund
Year Ended October 31, 2019
Year Ended October 31, 2018
Year Ended October 31, 2019
Year Ended October 31, 2018
Investment Activities:Operations:
Net investment income $ 296,429,047 $ 152,355,965 $ 37,349,963 $ 27,424,968Net realized gains/(losses) from investments 83,830 (101,139) 58,815 (28,378)
Change in net assets resulting from operations 296,512,877 152,254,826 37,408,778 27,396,590
Distributions to shareholders:Class A Shares (51,060) (24,470) — —Class D Shares (31,405,727) (19,666,401) (3,391,661) (2,460,655)Class I Shares (216,281,079) (103,412,452) (13,380,971) (9,224,480)Intermediary Class Shares (5,229,295) (2,755,565) (3,755,736) (1,806,276)Intermediary Service Class Shares (3,317,464) (1,548,121) (1,442,852) (662,873)Class Y Shares (40,147,528) (24,958,653) (15,378,362) (13,271,641)
Change in net assets resulting from distributions to shareholders (296,432,153) (152,365,662) (37,349,582) (27,425,925)
Change in net assets resulting from capital transactions 8,332,739,867 (1,821,073,641) 91,383,031 (307,254,231)Change in net assets 8,332,820,591 (1,821,184,477) 91,442,227 (307,283,566)
Net Assets:Beginning of period 10,158,583,105 11,979,767,582 1,934,958,397 2,242,241,963End of period $ 18,491,403,696 $ 10,158,583,105 $ 2,026,400,624 $ 1,934,958,397
Amounts designated as “—” are $0.00 or have been rounded to $0.00.
JOB TITLE HSBC Money Market AR REVISION 11 SERIAL <12345678> DATE Saturday, December 21, 2019 JOB NUMBER 367682(1) TYPE PAGE NO. 13 OPERATOR JOELF

14 HSBC FAMILY OF FUNDS See notes to financial statements.
H S B C FA M I LY O F F U N D SStatements of Changes in Net Assets
H S B C FA M I LY O F F U N D SStatements of Changes in Net Assets (continued)
HSBC U.S. Government Money Market Fund
HSBC U.S. Treasury Money Market Fund
Year Ended October 31, 2019
Year Ended October 31, 2018
Year Ended October 31, 2019
Year Ended October 31, 2018
CAPITAL TRANSACTIONS*:Class A Shares
Proceeds from shares issued $ 1,176,657 $ 1,420,071 $ — $ —Dividends reinvested 50,977 24,437 — —Value of shares redeemed (1,032,739) (714,565) — —
Class A Shares capital transactions 194,895 729,943 — —
Class D SharesProceeds from shares issued 3,440,581,846 3,738,220,266 1,825,704,785 1,080,459,039Dividends reinvested 23,409,695 13,844,262 2,995,672 1,712,324Value of shares redeemed (3,202,111,905) (3,749,041,777) (1,993,338,012) (1,031,094,573)
Class D Shares capital transactions 261,879,636 3,022,751 (164,637,555) 51,076,790
Class I SharesProceeds from shares issued 181,917,798,082 108,881,275,893 7,209,747,161 7,277,473,790Dividends reinvested 99,117,524 45,087,744 6,168,168 4,029,375Value of shares redeemed (174,428,939,474) (110,379,050,672) (7,044,341,005) (7,435,633,995)
Class I Shares capital transactions 7,587,976,132 (1,452,687,035) 171,574,324 (154,130,830)
Intermediary Class SharesProceeds from shares issued 2,825,542,009 1,294,482,655 508,577,385 312,385,011Dividends reinvested 1,288,731 274,502 567 15Value of shares redeemed (2,486,584,081) (1,150,368,774) (512,568,687) (142,557,401)
Intermediary Class Shares capital transactions 340,246,659 144,388,383 (3,990,735) 169,827,625
Intermediary Service Class SharesProceeds from shares issued 1,651,640,014 1,719,925,638 76,944,812 65,384,844Dividends reinvested 2,093,834 522,793 833,884 326,427Value of shares redeemed (1,692,214,442) (1,592,568,189) (42,927,715) (36,505,552)
Intermediary Service Class Shares capital transactions (38,480,594) 127,880,242 34,850,981 29,205,719
Class Y SharesProceeds from shares issued 11,450,392,586 9,462,774,658 1,858,420,901 1,764,679,669Dividends reinvested 38,694,301 23,299,512 14,980,595 12,937,171Value of shares redeemed (11,308,163,748) (10,130,482,095) (1,819,815,480) (2,180,850,375)
Class Y Shares capital transactions 180,923,139 (644,407,925) 53,586,016 (403,233,535)Change in net assets resulting from capital
transactions $ 8,332,739,867 $ (1,821,073,641) $ 91,383,031 $ (307,254,231)
Amounts designated as “—“ are $0.00 or have been rounded to $0.00.* Share transactions are at net asset value of $1.00 per share.
JOB TITLE HSBC Money Market AR REVISION 11 SERIAL <12345678> DATE Saturday, December 21, 2019 JOB NUMBER 367682(1) TYPE PAGE NO. 14 OPERATOR JOELF

See notes to financial statements. HSBC FAMILY OF FUNDS 15
HS
BC
U.S
. G
Ov
er
NM
eN
t M
ON
eY
MA
rk
et
FU
ND
Fin
anci
al H
igh
ligh
ts
Sel
ecte
d d
ata
for
a sh
are
ou
tsta
nd
ing
th
rou
gh
ou
t th
e p
erio
ds
ind
icat
ed.
Inve
stm
ent
Act
ivit
ies
Dis
trib
uti
on
sr
atio
s/S
up
ple
men
tary
Dat
a
Net
Ass
et
val
ue,
B
egin
nin
g
of
Per
iod
Net
In
vest
men
t In
com
e
Net
r
eali
zed
an
d
Un
real
ized
G
ain
s (L
oss
es)
fro
m
Inve
stm
ents
tota
l fro
m
Inve
stm
ent
Act
ivit
ies
Net
In
vest
men
t In
com
e
Net
rea
lize
d
Gai
ns
fro
m
Inve
stm
ent
tran
sact
ion
sto
tal
Dis
trib
uti
on
s
Net
A
sset
v
alu
e,
en
d o
f P
erio
dto
tal
ret
urn
(a)
Net
Ass
ets
at e
nd
of
Per
iod
(0
00’s
)
rat
io o
f N
et
exp
ense
s to
A
vera
ge
Net
A
sset
s(b
)
rat
io o
f N
et
Inve
stm
ent
Inco
me
to
Ave
rag
e N
et
Ass
ets(
b)
rat
io o
f e
xpen
ses
to A
vera
ge
Net
Ass
ets
(exc
lud
ing
Fee
r
edu
ctio
ns)
(b)
CL
AS
S A
SH
Ar
eS
Year
End
ed O
ctob
er 3
1, 2
019
$1.0
0$0
.02
$—
$0.0
2$
(0.0
2)$
—$
(0.0
2)$1
.00
1.71
%$
2,92
30.
63%
1.70
%0.
63%
Year
End
ed O
ctob
er 3
1, 2
018
1.00
0.01
—0.
01(0
.01)
—(0
.01)
1.00
1.05
%2,
728
0.63
%1.
08%
0.65
%Ye
ar E
nded
Oct
ober
31,
201
71.
00—
——
——
—1.
000.
22%
1,99
80.
59%
0.23
%0.
68%
Year
End
ed O
ctob
er 3
1, 2
016
1.00
——
——
——
1.00
0.02
%1,
720
0.34
%0.
02%
0.69
%Ye
ar E
nded
Oct
ober
31,
201
51.
00—
——
——
—1.
000.
03%
929
0.08
%0.
03%
0.69
%
CL
AS
S D
SH
Ar
eS
Year
End
ed O
ctob
er 3
1, 2
019
$1.0
0$0
.02
—$0
.02
$(0
.02)
—$
(0.0
2)$1
.00
1.87
%$
1,91
0,11
50.
48%
1.84
%0.
51%
Year
End
ed O
ctob
er 3
1, 2
018
1.00
0.01
—0.
01(0
.01)
—(0
.01)
1.00
1.20
%1,
648,
226
0.48
%1.
19%
0.51
%Ye
ar E
nded
Oct
ober
31,
201
71.
00—
——
——
—1.
000.
34%
1,64
5,22
20.
47%
0.32
%0.
54%
Year
End
ed O
ctob
er 3
1, 2
016
1.00
——
——
——
1.00
0.02
%1,
949,
225
0.34
%0.
02%
0.54
%Ye
ar E
nded
Oct
ober
31,
201
51.
00—
——
——
—1.
000.
03%
888,
084
0.07
%0.
03%
0.53
%
CL
AS
S e
SH
Ar
eS
Oct
ober
31,
201
6 th
roug
h A
ugus
t 10
, 201
7(c)
$1.0
0—
——
——
—$1
.00
0.26
%$
—0.
23%
0.33
%0.
29%
July
12,
201
6(d)
thr
ough
O
ctob
er 3
1, 2
016
1.00
——
——
——
1.00
0.11
%2
0.06
%0.
32%
0.31
%
CL
AS
S I
SH
Ar
eS
Year
End
ed O
ctob
er 3
1, 2
019
$1.0
0$0
.02
—$0
.02
$(0
.02)
—$
(0.0
2)$1
.00
2.23
%$1
3,98
8,73
90.
12%
2.19
%0.
16%
Year
End
ed O
ctob
er 3
1, 2
018
1.00
0.02
—0.
02(0
.02)
—(0
.02)
1.00
1.57
%6,
400,
700
0.12
%1.
52%
0.16
%Ye
ar E
nded
Oct
ober
31,
201
71.
000.
01—
0.01
(0.0
1)—
(0.0
1)1.
000.
69%
7,85
3,45
70.
12%
0.71
%0.
18%
Year
End
ed O
ctob
er 3
1, 2
016
1.00
——
——
——
1.00
0.21
%4,
687,
197
0.14
%0.
23%
0.19
%Ye
ar E
nded
Oct
ober
31,
201
51.
00—
——
——
—1.
000.
03%
1,58
9,26
40.
07%
0.03
%0.
18%
INt
er
Me
DIA
rY
CL
AS
S S
HA
re
SYe
ar E
nded
Oct
ober
31,
201
9$1
.00
$0.0
2—
$0.0
2$
(0.0
2)—
$(0
.02)
$1.0
02.
20%
$50
4,32
90.
15%
2.09
%0.
30%
Year
End
ed O
ctob
er 3
1, 2
018
1.00
0.02
—0.
02(0
.02)
—(0
.02)
1.00
1.52
%16
4,08
20.
16%
1.57
%0.
31%
Year
End
ed O
ctob
er 3
1, 2
017
1.00
0.01
—0.
01(0
.01)
—(0
.01)
1.00
0.63
%19
,694
0.18
%0.
65%
0.33
%Ju
ly 1
2, 2
016(
d) t
hrou
gh
Oct
ober
31,
201
61.
00—
——
——
—1.
000.
11%
10,1
210.
18%
0.26
%0.
37%
JOB TITLE HSBC Money Market AR REVISION 11 SERIAL <12345678> DATE Tuesday, December 24, 2019 JOB NUMBER 367682(1) TYPE PAGE NO. 15 OPERATOR JOSHUAM

16 HSBC FAMILY OF FUNDS See notes to financial statements.
HS
BC
U.S
. G
Ov
er
NM
eN
t M
ON
eY
MA
rk
et
FU
ND
Inve
stm
ent
Act
ivit
ies
Dis
trib
uti
on
sr
atio
s/S
up
ple
men
tary
Dat
a
Net
Ass
et
val
ue,
B
egin
nin
g
of
Per
iod
Net
In
vest
men
t In
com
e
Net
r
eali
zed
an
d
Un
real
ized
G
ain
s (L
oss
es)
fro
m
Inve
stm
ents
tota
l fro
m
Inve
stm
ent
Act
ivit
ies
Net
In
vest
men
t In
com
e
Net
rea
lize
d
Gai
ns
fro
m
Inve
stm
ent
tran
sact
ion
sto
tal
Dis
trib
uti
on
s
Net
A
sset
v
alu
e,
en
d o
f P
erio
dto
tal
ret
urn
(a)
Net
Ass
ets
at e
nd
of
Per
iod
(0
00’s
)
rat
io o
f N
et
exp
ense
s to
A
vera
ge
Net
A
sset
s(b
)
rat
io o
f N
et
Inve
stm
ent
Inco
me
to
Ave
rag
e N
et
Ass
ets(
b)
rat
io o
f e
xpen
ses
to A
vera
ge
Net
Ass
ets
(exc
lud
ing
Fee
r
edu
ctio
ns)
(b)
INt
er
Me
DIA
rY
Se
rv
ICe
C
LA
SS
SH
Ar
eS
Year
End
ed O
ctob
er 3
1, 2
019
$1.0
0$0
.02
$—
$0.0
2$
(0.0
2)$
—$
(0.0
2)$1
.00
2.17
%$
146,
441
0.18
%2.
15%
0.36
%Ye
ar E
nded
Oct
ober
31,
201
81.
000.
01—
0.01
(0.0
1)—
(0.0
1)1.
001.
50%
184,
921
0.18
%1.
70%
0.36
%Ye
ar E
nded
Oct
ober
31,
201
71.
000.
01—
0.01
(0.0
1)—
(0.0
1)1.
000.
61%
57,0
420.
20%
0.63
%0.
39%
July
12,
201
6(d)
thr
ough
O
ctob
er 3
1, 2
016
1.00
——
——
——
1.00
0.10
%5,
003
0.18
%0.
22%
0.42
%
CL
AS
S Y
SH
Ar
eS
Year
End
ed O
ctob
er 3
1, 2
019
$1.0
0$0
.02
—$0
.02
$(0
.02)
—$
(0.0
2)$1
.00
2.12
%$
1,93
8,85
60.
23%
2.10
%0.
26%
Year
End
ed O
ctob
er 3
1, 2
018
1.00
0.01
—0.
01(0
.01)
—(0
.01)
1.00
1.45
%1,
757,
925
0.23
%1.
43%
0.26
%Ye
ar E
nded
Oct
ober
31,
201
71.
000.
01—
0.01
(0.0
1)—
(0.0
1)1.
000.
58%
2,40
2,35
40.
23%
0.53
%0.
29%
Year
End
ed O
ctob
er 3
1, 2
016
1.00
——
——
——
1.00
0.12
%3,
891,
299
0.23
%0.
11%
0.28
%Ye
ar E
nded
Oct
ober
31,
201
51.
00—
——
——
—1.
000.
03%
3,77
9,59
50.
07%
0.03
%0.
28%
(a) N
ot a
nnua
lized
for
per
iods
less
tha
n on
e ye
ar. T
otal
ret
urn
calc
ulat
ions
do
not
incl
ude
any
sale
s or
red
empt
ion
char
ges.
(b) A
nnua
lized
for
per
iods
less
tha
n on
e ye
ar.
(c) C
lose
d op
erat
ions
on
Aug
ust
10, 2
017.
(d) C
omm
ence
men
t of
ope
ratio
ns o
n Ju
ly 1
2, 2
016.
Am
ount
s de
sign
ated
as
“—”
are
$0.0
0 or
hav
e be
en r
ound
ed t
o $0
.00.
Fin
anci
al H
igh
ligh
ts (
con
tin
ued
)
JOB TITLE HSBC Money Market AR REVISION 11 SERIAL <12345678> DATE Tuesday, December 24, 2019 JOB NUMBER 367682(1) TYPE PAGE NO. 16 OPERATOR JOSHUAM
See notes to financial statements. HSBC FAMILY OF FUNDS 17
HS
BC
U.S
. t
re
AS
Ur
Y M
ON
eY
MA
rk
et
FU
ND
Fin
anci
al H
igh
ligh
ts
Sel
ecte
d d
ata
for
a sh
are
ou
tsta
nd
ing
th
rou
gh
ou
t th
e p
erio
ds
ind
icat
ed.
Inve
stm
ent
Act
ivit
ies
Dis
trib
uti
on
sr
atio
s/S
up
ple
men
tary
Dat
a
Net
Ass
et
val
ue,
B
egin
nin
g
of
Per
iod
Net
In
vest
men
t In
com
e
Net
r
eali
zed
an
d
Un
real
ized
G
ain
s (L
oss
es)
fro
m
Inve
stm
ents
tota
l fro
m
Inve
stm
ent
Act
ivit
ies
Net
In
vest
men
t In
com
e
Net
rea
lize
d
Gai
ns
fro
m
Inve
stm
ent
tran
sact
ion
sto
tal
Dis
trib
uti
on
s
Net
A
sset
v
alu
e,
en
d o
f P
erio
dto
tal
ret
urn
(a)
Net
Ass
ets
at e
nd
of
Per
iod
(0
00’s
)
rat
io o
f N
et
exp
ense
s to
A
vera
ge
Net
A
sset
s(b
)
rat
io o
f N
et
Inve
stm
ent
Inco
me
to
Ave
rag
e N
et
Ass
ets(
b)
rat
io o
f e
xpen
ses
to A
vera
ge
Net
Ass
ets
(exc
lud
ing
Fee
r
edu
ctio
ns)
(b)
CL
AS
S D
SH
Ar
eS
Year
End
ed O
ctob
er 3
1, 2
019
$1.0
0$
0.02
$—
$0.0
2$
(0.0
2)$
—$
(0.0
2)$1
.00
1.79
%$
143,
506
0.50
%1.
79%
0.53
%Ye
ar E
nded
Oct
ober
31,
201
81.
000.
01—
0.01
(0.0
1)—
(0.0
1)1.
001.
17%
308,
136
0.50
%1.
12%
0.53
%Ye
ar E
nded
Oct
ober
31,
201
71.
00—
——
——
—1.
000.
29%
257,
062
0.49
%0.
28%
0.55
%Ye
ar E
nded
Oct
ober
31,
201
61.
00—
——
——
—1.
00—
%21
4,04
10.
28%
—%
0.55
%Ye
ar E
nded
Oct
ober
31,
201
51.
00—
——
——
—1.
00—
%28
0,03
20.
06%
—%
0.54
%
CL
AS
S e
SH
Ar
eS
Oct
ober
31,
201
6 th
roug
h A
ugus
t 10
, 201
7(c)
$1.0
0—
——
——
—$1
.00
0.29
%$
—0.
25%
0.37
%0.
29%
July
12,
201
6(d)
thr
ough
O
ctob
er 3
1, 2
016
1.00
——
——
——
1.00
0.11
%1
—%
0.37
%0.
33%
CL
AS
S I
SH
Ar
eS
Year
End
ed O
ctob
er 3
1, 2
019
$1.0
0$
0.02
—$0
.02
$(0
.02)
—$
(0.0
2)$1
.00
2.16
%$
879,
396
0.14
%2.
13%
0.18
%Ye
ar E
nded
Oct
ober
31,
201
81.
000.
02—
0.02
(0.0
2)—
(0.0
2)1.
001.
54%
707
,804
0.14
%1.
53%
0.18
%Ye
ar E
nded
Oct
ober
31,
201
71.
000.
01—
0.01
(0.0
1)—
(0.0
1)1.
000.
64%
861,
944
0.14
%0.
65%
0.19
%Ye
ar E
nded
Oct
ober
31,
201
61.
00—
——
——
—1.
000.
13%
346,
399
0.16
%0.
13%
0.20
%Ye
ar E
nded
Oct
ober
31,
201
51.
00—
——
——
—1.
00—
%38
4,36
30.
05%
—%
0.19
%
INt
er
Me
DIA
rY
CL
AS
S S
HA
re
SYe
ar E
nded
Oct
ober
31,
201
9$1
.00
$0.
02—
$0.0
2$
(0.0
2)—
$(0
.02)
$1.0
02.
14%
$16
5,84
20.
16%
2.10
%0.
33%
Year
End
ed O
ctob
er 3
1, 2
018
1.00
0.01
—0.
01(0
.01)
—(0
.01)
1.00
1.49
% 1
69,8
270.
16%
1.54
%0.
33%
Year
End
ed O
ctob
er 3
1, 2
017
1.00
——
——
——
1.00
0.44
%1
0.18
%0.
44%
0.34
%Ju
ly 1
2, 2
016(
d) t
hrou
gh
Oct
ober
31,
201
61.
00—
——
——
—1.
000.
11%
1—
%0.
37%
0.38
%
INt
er
Me
DIA
rY
Se
rv
ICe
C
LA
SS
SH
Ar
eS
Year
End
ed O
ctob
er 3
1, 2
019
$1.0
0$
0.02
—$0
.02
$(0
.02)
—$
(0.0
2)$1
.00
2.12
%$
86,0
730.
18%
2.10
%0.
38%
Year
End
ed O
ctob
er 3
1, 2
018
1.00
0.01
—0.
01(0
.01)
—(0
.01)
1.00
1.49
% 5
1,22
00.
18%
1.54
%0.
38%
Year
End
ed O
ctob
er 3
1, 2
017
1.00
0.01
—0.
01(0
.01)
—(0
.01)
1.00
0.58
%22
,016
0.20
%0.
58%
0.40
%Ju
ly 1
2, 2
016(
d) t
hrou
gh
Oct
ober
31,
201
61.
00—
——
——
—1.
000.
10%
18,1
080.
20%
0.14
%0.
48%
JOB TITLE HSBC Money Market AR REVISION 11 SERIAL <12345678> DATE Tuesday, December 24, 2019 JOB NUMBER 367682(1) TYPE PAGE NO. 17 OPERATOR JOSHUAM

18 HSBC FAMILY OF FUNDS See notes to financial statements.
HS
BC
U.S
. t
re
AS
Ur
Y M
ON
eY
MA
rk
et
FU
ND
Fin
anci
al H
igh
ligh
ts (
con
tin
ued
)
Inve
stm
ent
Act
ivit
ies
Dis
trib
uti
on
sr
atio
s/S
up
ple
men
tary
Dat
a
Net
Ass
et
val
ue,
B
egin
nin
g
of
Per
iod
Net
In
vest
men
t In
com
e
Net
r
eali
zed
an
d
Un
real
ized
G
ain
s (L
oss
es)
fro
m
Inve
stm
ents
tota
l fro
m
Inve
stm
ent
Act
ivit
ies
Net
In
vest
men
t In
com
e
Net
rea
lize
d
Gai
ns
fro
m
Inve
stm
ent
tran
sact
ion
sto
tal
Dis
trib
uti
on
s
Net
A
sset
v
alu
e,
en
d o
f P
erio
dto
tal
ret
urn
(a)
Net
Ass
ets
at e
nd
of
Per
iod
(0
00’s
)
rat
io o
f N
et
exp
ense
s to
A
vera
ge
Net
A
sset
s(b
)
rat
io o
f N
et
Inve
stm
ent
Inco
me
to
Ave
rag
e N
et
Ass
ets(
b)
rat
io o
f e
xpen
ses
to A
vera
ge
Net
Ass
ets
(exc
lud
ing
Fee
r
edu
ctio
ns)
(b)
CL
AS
S Y
SH
Ar
eS
Year
End
ed O
ctob
er 3
1, 2
019
$1.0
0$
0.02
$—
$0.0
2$
(0.0
2)$
—$
(0.0
2)$1
.00
2.05
%$
751,
584
0.25
%2.
03%
0.28
%Ye
ar E
nded
Oct
ober
31,
201
81.
000.
01—
0.01
(0.0
1)—
(0.0
1)1.
001.
43%
697
,972
0.25
%1.
37%
0.28
%Ye
ar E
nded
Oct
ober
31,
201
71.
000.
01—
0.01
(0.0
1)—
(0.0
1)1.
000.
53%
1,10
1,21
90.
25%
0.56
%0.
29%
Year
End
ed O
ctob
er 3
1, 2
016
1.00
——
——
——
1.00
0.04
%69
7,86
60.
25%
0.04
%0.
30%
Year
End
ed O
ctob
er 3
1, 2
015
1.00
——
——
——
1.00
—%
763,
473
0.06
%—
%0.
29%
(a) N
ot a
nnua
lized
for
per
iods
less
tha
n on
e ye
ar. T
otal
ret
urn
calc
ulat
ions
do
not
incl
ude
any
sale
s or
red
empt
ion
char
ges.
(b) A
nnua
lized
for
per
iods
less
tha
n on
e ye
ar.
(c) C
lose
d op
erat
ions
on
Aug
ust
10, 2
017.
(d) C
omm
ence
men
t of
ope
ratio
ns o
n Ju
ly 1
2, 2
016.
Am
ount
s de
sign
ated
as
“—”
are
$0.0
0 or
hav
e be
en r
ound
ed t
o $0
.00.
JOB TITLE HSBC Money Market AR REVISION 11 SERIAL <12345678> DATE Tuesday, December 24, 2019 JOB NUMBER 367682(1) TYPE PAGE NO. 18 OPERATOR JOSHUAM

HSBC FAMILY OF FUNDS 19
HSBC FAM ILY OF FUNDS
Notes to Financial Statements—as of October 31, 2019
1. Organization:
The HSBC Funds (the “Trust”), a Delaware statutory trust organized on March 2, 2016, is registered under the Investment Company Act of 1940, as amended (the “Act”), as an open-end management investment company. As of October 31, 2019, the Trust is composed of 8 separate operational funds, each a series of the HSBC Family of Funds. The accompanying financial statements are presented for the following two diversified funds (individually a “Fund”, collectively the “Funds”) of the Trust:
Fund Short Name
HSBC U.S. Government Money Market Fund U.S. Government Money Market Fund
HSBC U.S. Treasury Money Market Fund U.S. Treasury Money Market Fund
Financial statements for all other funds of the Trust are published separately.
Both of the Funds are government money market funds (as defined in Rule 2a-7) and seek to maintain a stable net asset value (“NAV”) of $1.00 per share, although it is possible to lose money by investing in the Funds. The Funds are authorized to issue an unlimited number of shares of beneficial interest with a par value of $0.001 per share. Each of the Funds has eight classes of shares: Class A Shares, Class C Shares, Class D Shares, Class E Shares, Class I Shares, Intermediary Class Shares, Intermediary Service Class Shares and Class Y Shares. Class C Shares of the Funds are offered without any front-end sales charge but will be subject to a maximum CDSC of 1.00% if redeemed less than one year after purchase. Class C Shares are not offered for sale, but are offered as an exchange option for Class C shareholders of the Trust’s other funds. No sales charges are assessed with respect to Class A, Class D, Class E, Class I, Intermediary Class, Intermediary Service Class or Class Y Shares of the Funds. Each class of shares in each Fund has identical rights and privileges, except with respect to arrangements pertaining to shareholder servicing and/or distribution, class-related expenses, voting rights on matters affecting a single class of shares, and exchange privileges.
Under the Trust’s organizational documents, the Trust’s officers and Trustees are indemnified against certain liabilities arising out of the performance of their duties to the Funds. In addition, in the normal course of business, the Trust may enter into contracts with its service providers, which also provide for indemnifications by the Funds. The Funds’ maximum exposure under these arrangements is unknown as this would involve future claims that may be made against the Funds. However, based on experience, the Trust believes the risk of loss to be remote.
The Funds are investment companies and follow accounting and reporting guidance under Financial Accounting Standards Board Accounting Standards Codification Topic 946, “Financial Services-Investment Companies.”
2. Significant Accounting Policies:
The following is a summary of the significant accounting policies followed by the Funds in the preparation of their financial statements. The policies are in conformity with generally accepted accounting principles in the United States of America (“GAAP”). The preparation of financial statements requires management to make certain estimates and assumptions that affect the reported amounts of assets and liabilities and disclosure of contingent assets and liabilities at the date of the financial statements and the reported amounts of increases and decreases in net assets from operations during the reporting period. Actual results could differ from those estimates.
Securities Valuation:
Investments of the Funds, other than investments in other money market funds, are valued using the amortized cost method pursuant to Rule 2a-7 under the Act, provided that certain conditions are met. Generally, amortized cost approximates fair value. Investments in other money market funds are priced at NAV as reported by such investment companies. Repurchase agreements are valued at original cost. Fair value is defined as the price that would be received to sell an asset or paid to transfer a liability in an orderly transaction between market participants at the measurement date. The valuation techniques used to determine fair value are further described in Note 3 below.
JOB TITLE HSBC Money Market AR REVISION 11 SERIAL <12345678> DATE Saturday, December 21, 2019 JOB NUMBER 367682(1) TYPE PAGE NO. 19 OPERATOR JOELF

20 HSBC FAMILY OF FUNDS
HSBC FAM ILY OF FUNDS
Notes to Financial Statements—as of October 31, 2019 (continued)
Investment Transactions and Related Income:
Investment transactions are accounted for no later than one business day after trade date. However, for financial reporting purposes, investment transactions are accounted for on trade date. Investment gains and losses are calculated on the identified cost basis. Interest income is determined on the basis of coupon interest accrued using the effective interest method which adjusts for amortization of premiums and accretion of discounts. Dividend income is recorded on the ex-dividend date.
Restricted Securities:
The Funds may invest in restricted securities. A restricted security is a security which has been purchased through a private offering and cannot be resold to the general public without prior registration under the Securities Act of 1933 (the “1933 Act”) or pursuant to the resale limitations provided by Rule 144 under the 1933 Act, or another exemption from the registration requirements of the 1933 Act. Certain restricted securities may be resold in transactions exempt from registration, normally to qualified institutional buyers, and may be deemed liquid by the Investment Adviser (as defined in Note 4) based on procedures established by the Board of Trustees (the “Board”). Therefore, not all restricted securities are considered illiquid. To the extent that a Fund purchases securities that are restricted as to resale or for which current market quotations are not available, such securities will be valued based upon all relevant factors as outlined in Securities and Exchange Commission Financial Reporting Release No. 1. Disposal of restricted securities may involve time consuming negotiations and expense. Prompt sale at the current valuation may be difficult and could adversely affect the net assets of the Funds. At October 31, 2019, there were no restricted securities held by the Funds.
Repurchase Agreements:
The U.S. Government Money Market Fund may enter into repurchase agreements with an entity which is a member of the Federal Reserve System or which is a “primary dealer” (as designated by the Federal Reserve Bank of New York) in U.S. government obligations. The U.S. Government Money Market Fund may also enter into a repurchase agreement with the Federal Reserve Bank of New York, the Fixed Income Clearing Corporation, or certain counterparties approved by the Investment Adviser (as defined in Note 4). The U.S. Treasury Money Market Fund may temporarily invest in repurchase agreements collateralized by U.S. Treasury Obligations under adverse market conditions. The repurchase price generally equals the price paid by a Fund plus interest negotiated on the basis of current short-term rates, which may be more or less than the rate on the underlying portfolio securities. The seller, under a repurchase agreement, is required to maintain the collateral held pursuant to the agreement, with a fair value equal to or greater than the repurchase price (including accrued interest). Securities subject to repurchase agreements are held by the Funds’ custodian or another qualified custodian or in the Federal Reserve/ Treasury book-entry system. Master Repurchase Agreements (“MRA”) permit the Fund, under certain circumstances, including an event of default (such as bankruptcy or insolvency), to offset receivables under the MRA with collateral posted by the counterparty and create one net payment due to or from the Fund. However, bankruptcy or insolvency laws of a particular jurisdiction may impose restrictions on or prohibitions against such a right of offset in the event of the MRA counterparty’s bankruptcy or insolvency. Pursuant to terms of the MRA, the Fund receives securities as collateral with a market value in excess of the repurchase price to be received by the Fund upon the maturity of the transaction. Upon bankruptcy or insolvency of the MRA counterparty, the Fund would recognize a liability with respect to such excess collateral to reflect the Fund’s obligation under bankruptcy law to return the excess to the counterparty. There is potential for loss to a Fund in the event the Fund is delayed or prevented from exercising its rights to dispose of the collateral securities, including the risk of a possible decline in the fair value of the underlying securities during the period while the Fund seeks to assert its rights.
Cash:
Cash is held in deposit accounts at the Funds’ custodian bank, The Northern Trust Company (“Custodian”), and is a significant portion of the net assets, which may exceed the amount insured by the Federal Deposit Insurance Corporation (“FDIC”). To the extent that such balances exceed FDIC insurance limits, the Funds are subject to the creditworthiness of the Custodian.
JOB TITLE HSBC Money Market AR REVISION 11 SERIAL <12345678> DATE Saturday, December 21, 2019 JOB NUMBER 367682(1) TYPE PAGE NO. 20 OPERATOR JOELF

HSBC FAMILY OF FUNDS 21
HSBC FAM ILY OF FUNDS
Notes to Financial Statements—as of October 31, 2019 (continued)
Allocations:
Expenses directly attributable to a Fund are charged to that Fund. Expenses not directly attributable to a Fund are allocated among the applicable series within the Trust equally to each fund, in relation to its net assets, or another appropriate basis. Class specific expenses are charged directly to the class incurring the expense. In addition, income, expenses (other than class specific expenses), and unrealized and realized gains and losses are allocated to each class based on relative net assets on a daily basis.
Distributions to Shareholders:
Dividends distributed to shareholders of the Funds from net investment income, if any, are declared daily and distributed monthly from each Fund. Distributions from net realized gains, if any, are declared and paid at least annually by the Funds. Additional distributions are also made to the Funds’ shareholders to the extent necessary to avoid the federal excise tax on certain undistributed income and net realized gains of regulated investment companies.
Federal Income Taxes:
Each Fund is a separate taxable entity for federal income tax purposes. Each Fund has qualified and intends to continue to qualify each year as a “regulated investment company’’ under Subchapter M of the Internal Revenue Code, as amended, and to distribute substantially all of its taxable net investment income and net realized gains, if any, to its shareholders. Accordingly, no provision for federal income or excise tax is required for the Funds, although shareholders may be taxed on distributions they receive.
Management of the Funds has reviewed tax positions taken in tax years that remain subject to examination by all major tax jurisdictions, including federal (i.e., the last four tax year ends and the interim tax period since then, as applicable). Management believes that there is no tax liability resulting from unrecognized tax benefits related to uncertain tax positions taken. Management’s conclusions may be subject to future review based on changes in, or interpretation of, accounting standards or tax laws and regulations.
3. Investment Valuation Summary
The valuation techniques employed by the Funds, as described below, maximize the use of observable inputs and minimize the use of unobservable inputs in determining fair value. The Funds’ investments are classified within the fair value hierarchy based on the lowest level of input that is significant to the fair value measurement. The inputs used for valuing the Funds’ investments are summarized in the three broad levels listed below:
• Level 1—quoted prices in active markets for identical assets
• Level 2—other significant observable inputs (including quoted prices for similar securities, interest rates, prepayments speeds, credit risk, etc.)
• Level 3—significant unobservable inputs (including the Fund’s own assumptions in determining the fair value of investments)
Changes in valuation techniques may result in transfers in or out of an assigned level within the fair value hierarchy. The inputs or methodology used for valuing investments are not necessarily an indication of the risk associated with investing in those investments.
Investments of the Funds, other than investments in other money market funds, are valued using the amortized cost method pursuant to Rule 2a-7 under the Act, and are typically categorized as Level 2 in the fair value hierarchy. The amortized cost method involves valuing an instrument at its cost initially and thereafter assuming a constant amortization to maturity of any discounts or premium, regardless of the impact of fluctuating interest rates on the market value of the instrument. The amortized cost method may result in periods during which value, as determined by amortized cost, is higher or lower than the price a Fund holding the instrument would receive if it sold the instrument. The fair value of securities in the Funds can be expected to vary with changes in prevailing interest rates.
JOB TITLE HSBC Money Market AR REVISION 11 SERIAL <12345678> DATE Saturday, December 21, 2019 JOB NUMBER 367682(1) TYPE PAGE NO. 21 OPERATOR JOELF
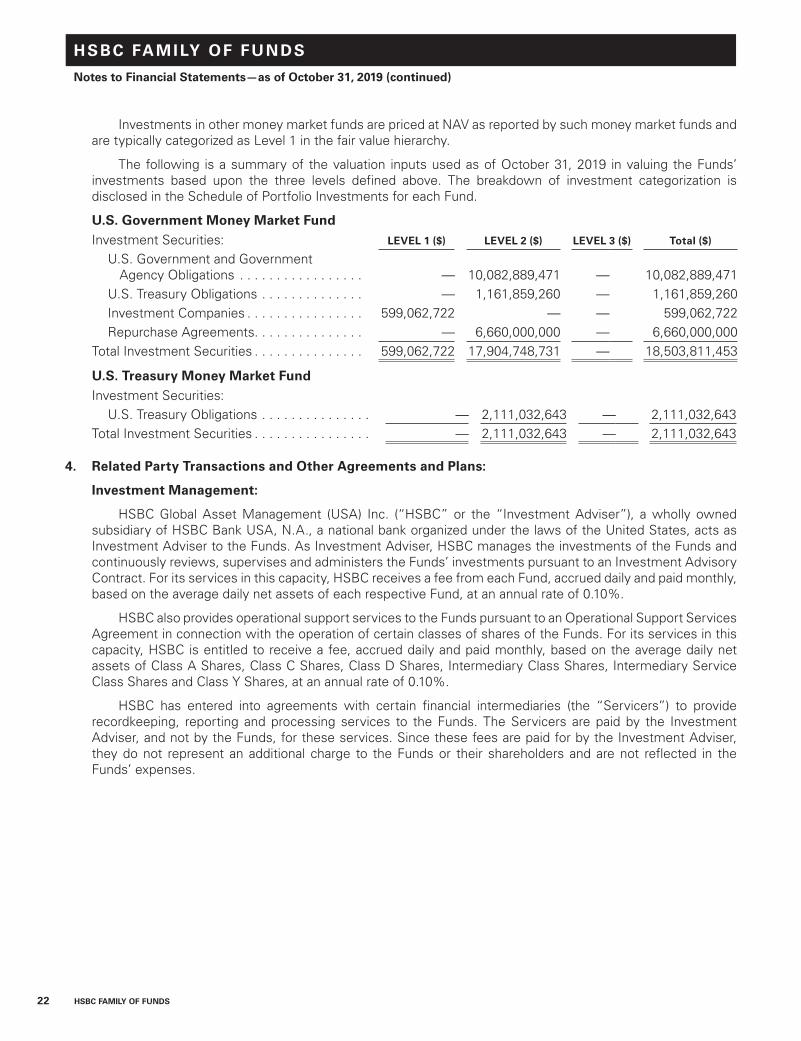
22 HSBC FAMILY OF FUNDS
HSBC FAM ILY OF FUNDS
Notes to Financial Statements—as of October 31, 2019 (continued)
Investments in other money market funds are priced at NAV as reported by such money market funds and are typically categorized as Level 1 in the fair value hierarchy.
The following is a summary of the valuation inputs used as of October 31, 2019 in valuing the Funds’ investments based upon the three levels defined above. The breakdown of investment categorization is disclosed in the Schedule of Portfolio Investments for each Fund.
U.S. Government Money Market FundInvestment Securities: LEVEL 1 ($) LEVEL 2 ($) LEVEL 3 ($) Total ($)
U.S. Government and Government Agency Obligations . . . . . . . . . . . . . . . . . — 10,082,889,471 — 10,082,889,471
U.S. Treasury Obligations . . . . . . . . . . . . . . — 1,161,859,260 — 1,161,859,260Investment Companies . . . . . . . . . . . . . . . . 599,062,722 — — 599,062,722Repurchase Agreements. . . . . . . . . . . . . . . — 6,660,000,000 — 6,660,000,000
Total Investment Securities . . . . . . . . . . . . . . . 599,062,722 17,904,748,731 — 18,503,811,453
U.S. Treasury Money Market FundInvestment Securities:
U.S. Treasury Obligations . . . . . . . . . . . . . . . — 2,111,032,643 — 2,111,032,643Total Investment Securities . . . . . . . . . . . . . . . . — 2,111,032,643 — 2,111,032,643
4. Related Party Transactions and Other Agreements and Plans:
Investment Management:
HSBC Global Asset Management (USA) Inc. (“HSBC” or the “Investment Adviser”), a wholly owned subsidiary of HSBC Bank USA, N.A., a national bank organized under the laws of the United States, acts as Investment Adviser to the Funds. As Investment Adviser, HSBC manages the investments of the Funds and continuously reviews, supervises and administers the Funds’ investments pursuant to an Investment Advisory Contract. For its services in this capacity, HSBC receives a fee from each Fund, accrued daily and paid monthly, based on the average daily net assets of each respective Fund, at an annual rate of 0.10%.
HSBC also provides operational support services to the Funds pursuant to an Operational Support Services Agreement in connection with the operation of certain classes of shares of the Funds. For its services in this capacity, HSBC is entitled to receive a fee, accrued daily and paid monthly, based on the average daily net assets of Class A Shares, Class C Shares, Class D Shares, Intermediary Class Shares, Intermediary Service Class Shares and Class Y Shares, at an annual rate of 0.10%.
HSBC has entered into agreements with certain financial intermediaries (the “Servicers”) to provide recordkeeping, reporting and processing services to the Funds. The Servicers are paid by the Investment Adviser, and not by the Funds, for these services. Since these fees are paid for by the Investment Adviser, they do not represent an additional charge to the Funds or their shareholders and are not reflected in the Funds’ expenses.
JOB TITLE HSBC Money Market AR REVISION 11 SERIAL <12345678> DATE Saturday, December 21, 2019 JOB NUMBER 367682(1) TYPE PAGE NO. 22 OPERATOR JOELF

HSBC FAMILY OF FUNDS 23
HSBC FAM ILY OF FUNDS
Notes to Financial Statements—as of October 31, 2019 (continued)
Administration, Fund Accounting and Other Services:
HSBC also serves the Funds as Administrator. Under the terms of the Administration Services Agreement, HSBC receives from the Funds (as well as other funds in the Trust combined) a fee, accrued daily and paid monthly, at an annual rate of:
Based on Average Daily Net Assets of Fee Rate(%)
Up to $10 billion . . . . . . . . . . . . . . . . . . . . . . . . . . . . . . . . . . . . . . . . . . . . . . . . . . . . . . . . . . . 0.0400In excess of $10 billion but not exceeding $20 billion . . . . . . . . . . . . . . . . . . . . . . . . . . . . . . 0.0350In excess of $20 billion but not exceeding $50 billion . . . . . . . . . . . . . . . . . . . . . . . . . . . . . . 0.0265In excess of $50 billion . . . . . . . . . . . . . . . . . . . . . . . . . . . . . . . . . . . . . . . . . . . . . . . . . . . . . . 0.0245
The fee rates and breakpoints are determined on the basis of the aggregate average daily net assets of the Trust. For the year ended October 31, 2019, the effective annualized rate was 0.038%, prior to any fee waivers or expense reimbursements, based on the average daily net assets of the Trust. The total administration fee paid to HSBC is allocated to each series based upon its proportionate share of the aggregate net assets of the Trust, subject to certain allocations in cases where one fund invests some or all of its assets in another fund.
Pursuant to a Sub-Administration Services Agreement with HSBC, Citi Fund Services Ohio, Inc. (“Citi”), a wholly-owned subsidiary of Citigroup, Inc., serves as the Trust’s Sub-Administrator. For these services, Citi is entitled to a fee, payable by HSBC, at an annual rate equivalent to the fee rates set forth below:
Based on Average Daily Net Assets of Fee Rate(%)
Up to $10 billion . . . . . . . . . . . . . . . . . . . . . . . . . . . . . . . . . . . . . . . . . . . . . . . . . . . . . . . . . . . 0.0200In excess of $10 billion but not exceeding $20 billion . . . . . . . . . . . . . . . . . . . . . . . . . . . . . . 0.0150In excess of $20 billion but not exceeding $50 billion . . . . . . . . . . . . . . . . . . . . . . . . . . . . . . 0.0065In excess of $50 billion . . . . . . . . . . . . . . . . . . . . . . . . . . . . . . . . . . . . . . . . . . . . . . . . . . . . . . 0.0045
Under a Services Agreement between the Trust and Citi (the “Services Agreement”), Citi makes an individual available to serve as the Trust’s Chief Compliance Officer (the “CCO”). Citi also provides infrastructure and support in implementing the written policies and procedures comprising the Trust’s compliance program, including support services to the CCO. For the services provided under the Services Agreement, the Trust paid Citi $313,915 for the year ended October 31, 2019, plus reimbursement of certain out-of-pocket expenses. Expenses incurred by each Fund are reflected on the Statements of Operations as “Compliance Services.” Citi pays the salary and other compensation earned by individuals performing these services, as employees of Citi.
In addition, Citi provides fund accounting services for each Fund under the Services Agreement. As fund accountant, Citi receives an annual fee per Fund and share class, subject to certain minimums and reimbursements of certain expenses. Citi receives additional fees paid by the Trust for regulatory administration services and money market fund reporting services.
Distribution Arrangements:
Foreside Distribution Services, L.P. (“Foreside”) serves the Trust as Distributor (the “Distributor”). The Trust has adopted a non-compensatory Distribution Plan and Agreement (the “Distribution Plan”) pursuant to Rule 12b-1 of the Act. The Distribution Plan provides for reimbursement of expenses incurred by the Distributor related to distribution and marketing, at a rate not to exceed 0.25%, 1.00% and 0.25% of the average daily net assets of Class A Shares (currently not being charged), Class C Shares (currently charging 0.75%) and Class D Shares (currently not being charged) of the Funds, respectively. For the year ended October 31, 2019, Foreside, as Distributor, received $859 in commissions from sales of the Trust.
Expenses reduced during the year ended October 31, 2019 are reflected on the Statements of Operations as “Fees voluntarily reduced by Distributor”, as applicable.
JOB TITLE HSBC Money Market AR REVISION 11 SERIAL <12345678> DATE Saturday, December 21, 2019 JOB NUMBER 367682(1) TYPE PAGE NO. 23 OPERATOR JOELF
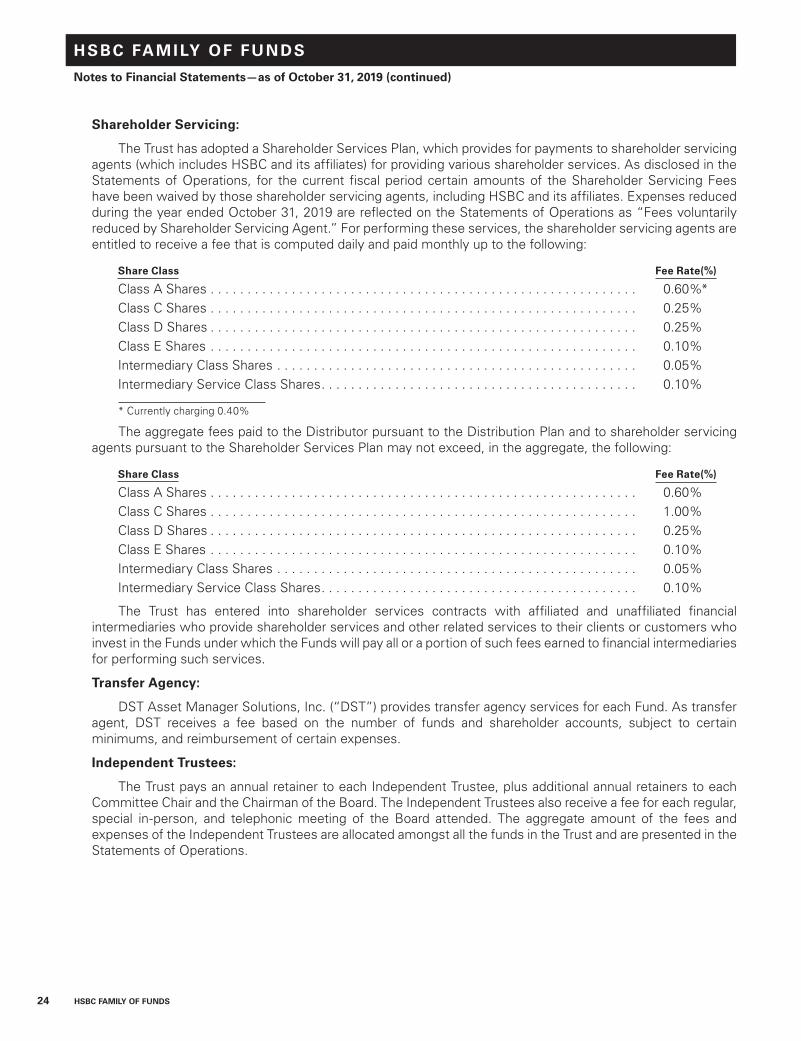
24 HSBC FAMILY OF FUNDS
HSBC FAM ILY OF FUNDS
Notes to Financial Statements—as of October 31, 2019 (continued)
Shareholder Servicing:
The Trust has adopted a Shareholder Services Plan, which provides for payments to shareholder servicing agents (which includes HSBC and its affiliates) for providing various shareholder services. As disclosed in the Statements of Operations, for the current fiscal period certain amounts of the Shareholder Servicing Fees have been waived by those shareholder servicing agents, including HSBC and its affiliates. Expenses reduced during the year ended October 31, 2019 are reflected on the Statements of Operations as “Fees voluntarily reduced by Shareholder Servicing Agent.” For performing these services, the shareholder servicing agents are entitled to receive a fee that is computed daily and paid monthly up to the following:
Share Class Fee Rate(%)
Class A Shares . . . . . . . . . . . . . . . . . . . . . . . . . . . . . . . . . . . . . . . . . . . . . . . . . . . . . . . . . . 0.60%*Class C Shares . . . . . . . . . . . . . . . . . . . . . . . . . . . . . . . . . . . . . . . . . . . . . . . . . . . . . . . . . . 0.25%Class D Shares . . . . . . . . . . . . . . . . . . . . . . . . . . . . . . . . . . . . . . . . . . . . . . . . . . . . . . . . . . 0.25%Class E Shares . . . . . . . . . . . . . . . . . . . . . . . . . . . . . . . . . . . . . . . . . . . . . . . . . . . . . . . . . . 0.10%Intermediary Class Shares . . . . . . . . . . . . . . . . . . . . . . . . . . . . . . . . . . . . . . . . . . . . . . . . . 0.05%Intermediary Service Class Shares. . . . . . . . . . . . . . . . . . . . . . . . . . . . . . . . . . . . . . . . . . . 0.10%
* Currently charging 0.40%
The aggregate fees paid to the Distributor pursuant to the Distribution Plan and to shareholder servicing agents pursuant to the Shareholder Services Plan may not exceed, in the aggregate, the following:
Share Class Fee Rate(%)
Class A Shares . . . . . . . . . . . . . . . . . . . . . . . . . . . . . . . . . . . . . . . . . . . . . . . . . . . . . . . . . . 0.60%Class C Shares . . . . . . . . . . . . . . . . . . . . . . . . . . . . . . . . . . . . . . . . . . . . . . . . . . . . . . . . . . 1.00%Class D Shares . . . . . . . . . . . . . . . . . . . . . . . . . . . . . . . . . . . . . . . . . . . . . . . . . . . . . . . . . . 0.25%Class E Shares . . . . . . . . . . . . . . . . . . . . . . . . . . . . . . . . . . . . . . . . . . . . . . . . . . . . . . . . . . 0.10%Intermediary Class Shares . . . . . . . . . . . . . . . . . . . . . . . . . . . . . . . . . . . . . . . . . . . . . . . . . 0.05%Intermediary Service Class Shares. . . . . . . . . . . . . . . . . . . . . . . . . . . . . . . . . . . . . . . . . . . 0.10%
The Trust has entered into shareholder services contracts with affiliated and unaffiliated financial intermediaries who provide shareholder services and other related services to their clients or customers who invest in the Funds under which the Funds will pay all or a portion of such fees earned to financial intermediaries for performing such services.
Transfer Agency:
DST Asset Manager Solutions, Inc. (“DST”) provides transfer agency services for each Fund. As transfer agent, DST receives a fee based on the number of funds and shareholder accounts, subject to certain minimums, and reimbursement of certain expenses.
Independent Trustees:
The Trust pays an annual retainer to each Independent Trustee, plus additional annual retainers to each Committee Chair and the Chairman of the Board. The Independent Trustees also receive a fee for each regular, special in-person, and telephonic meeting of the Board attended. The aggregate amount of the fees and expenses of the Independent Trustees are allocated amongst all the funds in the Trust and are presented in the Statements of Operations.
JOB TITLE HSBC Money Market AR REVISION 11 SERIAL <12345678> DATE Saturday, December 21, 2019 JOB NUMBER 367682(1) TYPE PAGE NO. 24 OPERATOR JOELF

HSBC FAMILY OF FUNDS 25
HSBC FAM ILY OF FUNDS
Notes to Financial Statements—as of October 31, 2019 (continued)
Fee Reductions:
The Investment Adviser has agreed to contractually limit through March 1, 2020 the total annual expenses of certain classes of the Funds, exclusive of interest, taxes, brokerage commissions, extraordinary expenses and estimated indirect expenses attributable to each Fund’s investments in investment companies, as applicable. The applicable classes of each Fund have their own expense limitations based on the average daily net assets for any full fiscal year as follows:
Fund Class
ContractualExpense
Limitations(%)
U.S. Government Money Market Fund . . . . . . . . . . . . . . . . . . . . E 0.25U.S. Government Money Market Fund . . . . . . . . . . . . . . . . . . . . I 0.14*U.S. Government Money Market Fund . . . . . . . . . . . . . . . . . . . . Intermediary Shares 0.18U.S. Government Money Market Fund . . . . . . . . . . . . . . . . . . . . Intermediary Service
Class Shares 0.20U.S. Treasury Money Market Fund. . . . . . . . . . . . . . . . . . . . . . . . E 0.25U.S. Treasury Money Market Fund. . . . . . . . . . . . . . . . . . . . . . . . I 0.14*U.S. Treasury Money Market Fund. . . . . . . . . . . . . . . . . . . . . . . . Intermediary Shares 0.18U.S. Treasury Money Market Fund. . . . . . . . . . . . . . . . . . . . . . . . Intermediary Service
Class Shares 0.20
* Effective February 28, 2019. Prior to February 28, 2019, the contractual expense limitation was 0.20%.
Any amounts contractually waived or reimbursed by the Investment Adviser will be subject to repayment by the respective Fund to the Investment Adviser within three years calculated monthly from when the waiver or reimbursement is recorded to the extent that the repayment will not cause the Fund’s operating expenses to exceed the contractual expense limit that was in effect at the time of such waiver or reimbursement. As of October 31, 2019, the repayments that may potentially be made by the Funds are as follows:
Amount Eligible Through:
Fund 2022($) 2021($) Total ($)
U.S. Government Money Market Fund . . . . . . . . . . . . . . . . . . . . . . 1,734,355 195,009 1,929,364U.S. Treasury Money Market Fund. . . . . . . . . . . . . . . . . . . . . . . . . . 482,618 147,166 629,784
Citi may voluntarily waive/reimburse fees to help support the expense limits of the Funds. In addition, HSBC, in its role as Investment Adviser and Administrator, may waive/reimburse additional fees at its discretion. Any voluntary fee waivers/reimbursements are not subject to recoupment in subsequent fiscal periods. Voluntary waivers/reimbursements may be eliminated or changed at any time. Amounts waived/reimbursed by the Investment Adviser, Administrator and Citi as Sub-Administrator are reported separately on the Statements of Operations, as applicable.
During the year ended October 31, 2019, the following amounts of expenses were voluntarily and contractually waived:
FundClass A
($)Class C
($)Class D
($)Class E
($)Class I
($)Class Y
($)Intermediary
Class ($)
IntermediaryServiceClass ($) Total ($)
U.S. Government Money Market Fund. . . . . . . . . . . . . . . 11 — 434,369 — 3,436,234 492,043 371,522 270,874 5,005,053
U.S. Treasury Money Market Fund. . . . . . . . . . . . . . . — — 57,518 — 248,686 232,434 304,024 137,517 980,179
The Funds have entered into an arrangement with their Custodian whereby credits realized as a result of uninvested cash balances are used to reduce the Custodian’s expenses. Expenses reduced during the year ended October 31, 2019 are reflected on the Statements of Operations as “Custody earnings credits,” as applicable.
JOB TITLE HSBC Money Market AR REVISION 11 SERIAL <12345678> DATE Saturday, December 21, 2019 JOB NUMBER 367682(1) TYPE PAGE NO. 25 OPERATOR JOELF

26 HSBC FAMILY OF FUNDS
HSBC FAM ILY OF FUNDS
Notes to Financial Statements—as of October 31, 2019 (continued)
Overdraft Facility:
The Funds have entered into an arrangement with the Custodian whereby an uncommitted, secured overdraft facility is made available to meet unanticipated end-of-day liquidity needs of the Funds which cannot be fulfilled by trading activities. The interest rate on overdraft amounts is calculated at an annual rate of 0.50% plus the Federal Funds Rate. The overdraft facility is limited to $750,000,000 and $50,000,000 for the U.S. Government Money Market Fund and the U.S. Treasury Money Market Fund, respectively. As of October 31, 2019, the Funds did not have any overdrafts outstanding. Fees incurred during the year ended October 31, 2019 by the Funds on overdrafts are reflected on the Statements of Operations within the “Custodian” expenses, and were as follows:
U.S. Government Money Market Fund . . . . . . . . . . . . . . . . . . . . . . . . . . . . . . . . . . . . . . . . . . . $104,396U.S. Treasury Money Market Fund . . . . . . . . . . . . . . . . . . . . . . . . . . . . . . . . . . . . . . . . . . . . . . . . $ 3,197
5. Federal Income Tax Information:
At October 31, 2019, the cost basis of investments for federal income tax purposes, gross unrealized appreciation, gross unrealized depreciation and net unrealized appreciation/depreciation were as follows:
Tax Cost ($)Tax Unrealized
Appreciation ($)Tax UnrealizedDepreciation ($)
Net UnrealizedAppreciation
(Depreciation) ($)*
U.S. Government Money Market Fund . . . 18,503,811,453 — — —U.S. Treasury Money Market Fund . . . . . . 2,111,046,641 — (13,998) (13,998)
* The difference between book-basis unrealized appreciation (depreciation) is attributable primarily to tax deferral of losses on wash sales.
The tax character of distributions paid by the Funds for the tax year ended October 31, 2019, was as follows:
Distributions paid from
Ordinary Income ($)
Total Taxable
Distributions ($)
Total Distributions
Paid ($)(1)
U.S. Government Money Market Fund . . . . . . . . . . . . . . . . . . . 292,511,316 292,511,316 292,511,316U.S. Treasury Money Market Fund . . . . . . . . . . . . . . . . . . . . . . 37,277,107 37,277,107 37,277,107
(1) Total distributions paid may differ from the amount reported in the Statements of Changes in Net Assets because distributions are recognized when actually paid for tax purposes
The tax character of distributions paid by the Funds for the tax year ended October 31, 2018, was as follows:
Distributions paid from
Ordinary Income ($)
Net Long Term
Capital Gains ($)
Total Taxable
Distributions ($)
Total Distributions
Paid ($)(1)
U.S. Government Money Market Fund . . . . . . . . . . . 150,216,854 12,281 150,229,135 150,229,135U.S. Treasury Money Market Fund . . . . . . . . . . . . . . 26,994,417 — 26,994,417 26,994,417
(1) Total distributions paid may differ from the amount reported in the Statements of Changes in Net Assets because distributions are recognized when actually paid for tax purposes.
JOB TITLE HSBC Money Market AR REVISION 11 SERIAL <12345678> DATE Saturday, December 21, 2019 JOB NUMBER 367682(1) TYPE PAGE NO. 26 OPERATOR JOELF

HSBC FAMILY OF FUNDS 27
HSBC FAM ILY OF FUNDS
Notes to Financial Statements—as of October 31, 2019 (continued)
As of the tax year ended October 31, 2019, the components of accumulated earnings/(deficit) on a tax basis for the Funds were as follows:
UndistributedOrdinary
Income ($)AccumulatedEarnings ($)
Distributions Payable ($)
AccumulatedCapital and
OtherLosses
($)
UnrealizedAppreciation
(Depreciation) ($)(1)
TotalAccumulated
Earnings(Deficit) ($)
U.S. Government Money Market Fund . . . . . . . . 9,895,387 9,895,387 (9,877,591) (17,309) — 487
U.S. Treasury Money Market Fund . . . . . . . . 929,762 929,762 (887,907) — (13,998) 27,857
(1) The difference between book-basis and tax-basis unrealized appreciation/depreciation are attributable primarily to: tax deferral of losses on wash sales.
As of the tax year ended October 31, 2019, the Funds have net capital loss carryforwards (“CLCFs”) not subject to expiration as summarized in the table below. The Board does not intend to authorize a distribution of any realized gain for the Funds until any applicable CLCF has been offset or expires.
Short Term Amount ($)
U.S. Government Money Market Fund . . . . . . . . . . . . . . . . . . . . . . . . . . . . . . . . . . . . . . . . . . . . . . . . . . . . 17,309
During the year ended October 31, 2019, the Funds utilized CLCFs as follows:
Total ($)
U.S. Government Money Market Fund . . . . . . . . . . . . . . . . . . . . . . . . . . . . . . . . . . . . . . . . . . . . . . . . . . . . 83,830U.S. Treasury Money Market Fund . . . . . . . . . . . . . . . . . . . . . . . . . . . . . . . . . . . . . . . . . . . . . . . . . . . . . . . . 34,897
Under current law, capital losses and specified ordinary losses realized after October 31 and non-specified ordinary losses incurred after December 31 (ordinary losses collectively known as “late year ordinary loss”) may be deferred and treated as occurring on the first business day of the following fiscal year. As of the tax year ended October 31, 2019, the Funds had no deferred losses.
The amount and character of net investment income and net realized gains distributed are determined in accordance with federal income tax regulations, which may differ from GAAP. These “book/tax” differences are either considered temporary or permanent in nature. To the extent these differences are permanent in nature (e.g., reclassification of market discounts, certain gain/loss, and certain distributions), such amounts are reclassified within the composition of net assets based on their federal tax-basis treatment; temporary differences (e.g., wash losses and post-October loss deferrals) do not require reclassification. To the extent distributions to shareholders from net investment income and net realized gains exceed net investment income and net realized gains for tax purposes, they are reported as distributions of capital.
JOB TITLE HSBC Money Market AR REVISION 11 SERIAL <12345678> DATE Saturday, December 21, 2019 JOB NUMBER 367682(1) TYPE PAGE NO. 27 OPERATOR JOELF
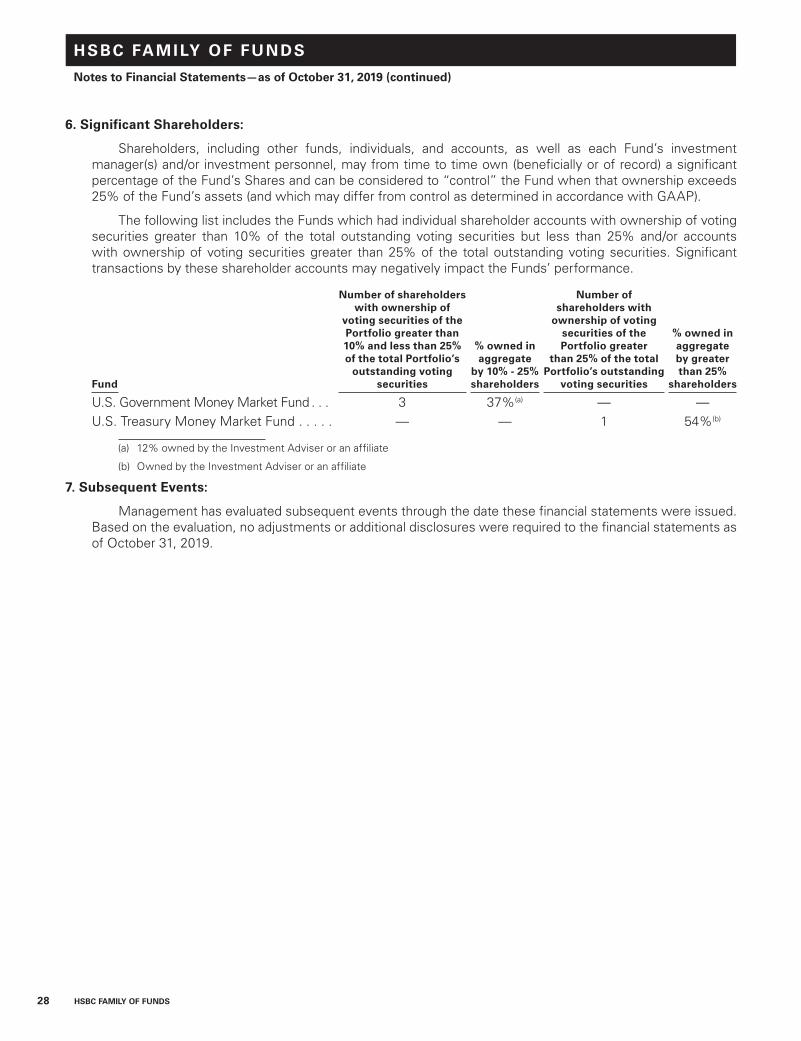
28 HSBC FAMILY OF FUNDS
HSBC FAM ILY OF FUNDS
Notes to Financial Statements—as of October 31, 2019 (continued)
6. Significant Shareholders:
Shareholders, including other funds, individuals, and accounts, as well as each Fund’s investment manager(s) and/or investment personnel, may from time to time own (beneficially or of record) a significant percentage of the Fund’s Shares and can be considered to “control” the Fund when that ownership exceeds 25% of the Fund’s assets (and which may differ from control as determined in accordance with GAAP).
The following list includes the Funds which had individual shareholder accounts with ownership of voting securities greater than 10% of the total outstanding voting securities but less than 25% and/or accounts with ownership of voting securities greater than 25% of the total outstanding voting securities. Significant transactions by these shareholder accounts may negatively impact the Funds’ performance.
Fund
Number of shareholders with ownership of
voting securities of the Portfolio greater than 10% and less than 25% of the total Portfolio’s
outstanding voting securities
% owned inaggregate
by 10% - 25%shareholders
Number of shareholders with
ownership of voting securities of the Portfolio greater
than 25% of the total Portfolio’s outstanding
voting securities
% owned in aggregate by greater than 25%
shareholders
U.S. Government Money Market Fund . . . 3 37%(a) — —U.S. Treasury Money Market Fund . . . . . — — 1 54%(b)
(a) 12% owned by the Investment Adviser or an affiliate
(b) Owned by the Investment Adviser or an affiliate
7. Subsequent Events:
Management has evaluated subsequent events through the date these financial statements were issued. Based on the evaluation, no adjustments or additional disclosures were required to the financial statements as of October 31, 2019.
JOB TITLE HSBC Money Market AR REVISION 11 SERIAL <12345678> DATE Saturday, December 21, 2019 JOB NUMBER 367682(1) TYPE PAGE NO. 28 OPERATOR JOELF

HSBC FAMILY OF FUNDS 29
Report of Independent Registered Public Accounting Firm
To the Board of Trustees of HSBC Funds and Shareholders of HSBC U.S. Government Money Market Fund and HSBC U.S. Treasury Money Market Fund
Opinions on the Financial Statements
We have audited the accompanying statements of assets and liabilities, including the schedules of portfolio investments, of HSBC U.S. Government Money Market Fund and HSBC U.S. Treasury Money Market Fund (two of the funds constituting HSBC Funds, hereafter collectively referred to as the “Funds”) as of October 31, 2019, the related statements of operations for the year ended October 31, 2019, the statements of changes in net assets for each of the two years in the period ended October 31, 2019, including the related notes, and the financial highlights for each of the periods indicated therein (collectively referred to as the “financial statements”). In our opinion, the financial statements present fairly, in all material respects, the financial position of each of the Funds as of October 31, 2019, the results of each of their operations for the year then ended, the changes in each of their net assets for each of the two years in the period ended October 31, 2019 and each of the financial highlights for each of the periods indicated therein in conformity with accounting principles generally accepted in the United States of America.
Basis for Opinions
These financial statements are the responsibility of the Funds’ management. Our responsibility is to express an opinion on the Funds’ financial statements based on our audits. We are a public accounting firm registered with the Public Company Accounting Oversight Board (United States) (“PCAOB”) and are required to be independent with respect to the Funds in accordance with the U.S. federal securities laws and the applicable rules and regulations of the Securities and Exchange Commission and the PCAOB.
We conducted our audits of these financial statements in accordance with the standards of the PCAOB. Those standards require that we plan and perform the audit to obtain reasonable assurance about whether the financial statements are free of material misstatement, whether due to error or fraud.
JOB TITLE HSBC Money Market AR REVISION 11 SERIAL <12345678> DATE Saturday, December 21, 2019 JOB NUMBER 367682(1) TYPE PAGE NO. 29 OPERATOR JOELF
30 HSBC FAMILY OF FUNDS
Report of Independent Registered Public Accounting Firm (continued)
Our audits included performing procedures to assess the risks of material misstatement of the financial statements, whether due to error or fraud, and performing procedures that respond to those risks. Such procedures included examining, on a test basis, evidence regarding the amounts and disclosures in the financial statements. Our audits also included evaluating the accounting principles used and significant estimates made by management, as well as evaluating the overall presentation of the financial statements. Our procedures included confirmation of securities owned as of October 31, 2019 by correspondence with the custodian, transfer agents and brokers; when replies were not received from brokers, we performed other auditing procedures. We believe that our audits provide a reasonable basis for our opinions.
/s/ PricewaterhouseCoopers LLP New York, New York December 20, 2019
We have served as the auditor of one or more investment companies in the HSBC Funds since 2015.
JOB TITLE HSBC Money Market AR REVISION 11 SERIAL <12345678> DATE Saturday, December 21, 2019 JOB NUMBER 367682(1) TYPE PAGE NO. 30 OPERATOR JOELF

HSBC FAMILY OF FUNDS 31
HSBC FAM ILY OF FUNDS
Other Federal Income Tax Information—as of October 31, 2019 (Unaudited)
During the year ended October 31, 2019, the following Funds designated the maximum amount allowable as interest-related dividends for certain non-U.S. resident investors:
Qualified Interest
Income %
U.S. Government Money Market Fund . . . . . . . . . . . . . . . . . . . . . . . . . . . . . . . . . . . . . . . . . . . . . . . . 100.00%U.S. Treasury Money Market Fund . . . . . . . . . . . . . . . . . . . . . . . . . . . . . . . . . . . . . . . . . . . . . . . . . . . 100.00%
JOB TITLE HSBC Money Market AR REVISION 11 SERIAL <12345678> DATE Saturday, December 21, 2019 JOB NUMBER 367682(1) TYPE PAGE NO. 31 OPERATOR JOELF

32 HSBC FAMILY OF FUNDS
HSBC FAM ILY OF FUNDS
Table of Shareholder Expenses - as of October 31, 2019 (Unaudited)
As a shareholder of the Funds, you incur two types of costs: (1) transaction costs, including sales charges (loads) on purchases, redemption fees and exchange fees; and (2) ongoing costs, including management fees, distribution fees and other Fund expenses. These examples are intended to help you understand your ongoing costs (in dollars) of investing in the Funds and to compare the cost with the ongoing costs of investing in other mutual funds.
Actual Expenses
The actual examples are based on an investment of $1,000 invested at the beginning of a six-month period beginning May 1, 2019 and held through the period ended October 31, 2019.
The columns below under the heading entitled “Actual” provide information about actual account values and actual expenses. You may use this information, together with the amount you invested, to estimate the expenses that you paid over the period. Simply divide your account value by $1,000 (for example, an $8,600 account value divided by $1,000 = 8.6), then multiply the result by the number in the table under the heading entitled “Actual Expenses Paid During the Period” to estimate the expenses you paid on your account during this period.
Hypothetical Expenses for Comparison Purposes
The hypothetical expense examples are based on an investment of $1,000 invested at the beginning of a six-month period and held throughout the period ended October 31, 2019.
The columns below under the heading entitled “Hypothetical” provide information about hypothetical account values and hypothetical expenses based on each Fund’s actual expense ratio and an assumed rate of return of 5% per year before expenses, which is not each Fund’s actual return. The hypothetical account values and expenses may not be used to estimate the actual ending account balance or expenses you paid for the period. You may use this information to compare this 5% hypothetical example with the 5% hypothetical examples that appear in the shareholder reports of other funds.
Please note that the expenses shown in the table are meant to highlight your ongoing costs only and do not reflect any transactional costs, such as sales charges (loads), redemption fees, or exchange fees. Therefore, the columns under the heading entitled “Hypothetical” are useful in comparing ongoing costs only, and will not help you determine the relative total costs of owning different funds. In addition, if these transitional costs were included, your costs would have been higher.
JOB TITLE HSBC Money Market AR REVISION 11 SERIAL <12345678> DATE Saturday, December 21, 2019 JOB NUMBER 367682(1) TYPE PAGE NO. 32 OPERATOR JOELF
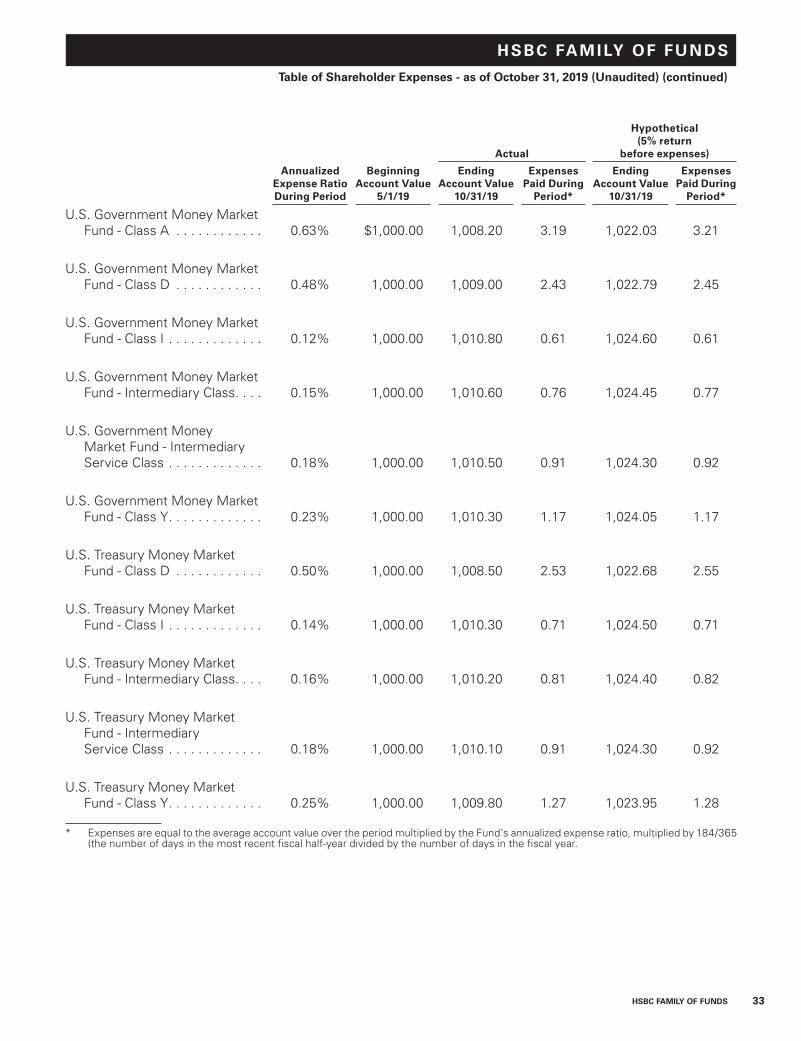
HSBC FAMILY OF FUNDS 33
HSBC FAM ILY OF FUNDS
Table of Shareholder Expenses - as of October 31, 2019 (Unaudited) (continued)
Actual
Hypothetical(5% return
before expenses)
Annualized Expense Ratio During Period
Beginning Account Value
5/1/19
Ending Account Value
10/31/19
Expenses Paid During
Period*
Ending Account Value
10/31/19
Expenses Paid During
Period*
U.S. Government Money Market Fund - Class A . . . . . . . . . . . . 0.63% $1,000.00 1,008.20 3.19 1,022.03 3.21
U.S. Government Money Market Fund - Class D . . . . . . . . . . . . 0.48% 1,000.00 1,009.00 2.43 1,022.79 2.45
U.S. Government Money Market Fund - Class I . . . . . . . . . . . . . 0.12% 1,000.00 1,010.80 0.61 1,024.60 0.61
U.S. Government Money Market Fund - Intermediary Class . . . . 0.15% 1,000.00 1,010.60 0.76 1,024.45 0.77
U.S. Government Money Market Fund - Intermediary Service Class . . . . . . . . . . . . . 0.18% 1,000.00 1,010.50 0.91 1,024.30 0.92
U.S. Government Money Market Fund - Class Y . . . . . . . . . . . . . 0.23% 1,000.00 1,010.30 1.17 1,024.05 1.17
U.S. Treasury Money Market Fund - Class D . . . . . . . . . . . . 0.50% 1,000.00 1,008.50 2.53 1,022.68 2.55
U.S. Treasury Money Market Fund - Class I . . . . . . . . . . . . . 0.14% 1,000.00 1,010.30 0.71 1,024.50 0.71
U.S. Treasury Money Market Fund - Intermediary Class . . . . 0.16% 1,000.00 1,010.20 0.81 1,024.40 0.82
U.S. Treasury Money Market Fund - Intermediary Service Class . . . . . . . . . . . . . 0.18% 1,000.00 1,010.10 0.91 1,024.30 0.92
U.S. Treasury Money Market Fund - Class Y . . . . . . . . . . . . . 0.25% 1,000.00 1,009.80 1.27 1,023.95 1.28
* Expenses are equal to the average account value over the period multiplied by the Fund’s annualized expense ratio, multiplied by 184/365 (the number of days in the most recent fiscal half-year divided by the number of days in the fiscal year.
JOB TITLE HSBC Money Market AR REVISION 11 SERIAL <12345678> DATE Saturday, December 21, 2019 JOB NUMBER 367682(1) TYPE PAGE NO. 33 OPERATOR JOELF

34 HSBC FAMILY OF FUNDS
HSBC FAM ILY OF FUNDS
Board of Trustees and Officers (Unaudited)
MANAGEMENT OF THE TRUST
The following table contains information regarding the HSBC Family of Funds’ Board of Trustees (“Trustees”). The HSBC Family of Funds’ Statement of Additional Information includes additional information about the Trustees and is available, without charge, upon request by calling (888) 525-5757.
Name, Address, Age
Position(s) Held
with Funds
Term of Office and Length of Time Served
Principal Occupation(s) During Past 5 Years
Portfolios in Fund Complex
Overseen By Trustee*
Other Directorships Held by Trustee
During Past 5 Years**
NON-INTERESTED TRUSTEES
MARCIA L. BECK P.O. Box 182845 Columbus, OH 43218-3035 Age: 64
Trustee Indefinite; 2008 to present
Private Investor (1999 – present) 8 None
SUSAN C. GAUSE P.O. Box 182845 Columbus, OH 43218-3035 Age: 67
Trustee Indefinite; 2013 to present
Private Investor (2003 - present) 8 Metropolitan Series Fund (2012 – present); and Met Investors Series Trust (2008 – present)
SUSAN S. HUANG P.O. Box 182845 Columbus, OH 43218-3035 Age: 65
Trustee Indefinite; 2008 to present
Private Investor (2000 - present) 8 None
THOMAS F. ROBARDS P.O. Box 182845 Columbus, OH 43218-3035 Age: 73
Chairman and Trustee
Indefinite; 2005 to present
Private Investor (2003 - present) 8 Ellington Residential Mortgage REIT (NYSE
listed real estate investment trust) (2013 – present);
Ellington Financial Inc. (NYSE listed financial services company) (2007 – present);
and Overseas Shipholding Group (OSG) (NYSE listed
company) (2005-2014)
INTERESTED TRUSTEE
DEBORAH A. HAZELL*** 452 Fifth Avenue New York NY 10018 Age: 56
Trustee Indefinite; 2011 to present
Director and Chief Executive Officer, HSBC Global Asset Management (USA) Inc. (2011 - present)
8 None
* Includes all series of the HSBC Funds.** This column includes only directorships of companies required to report to the SEC under the Securities Exchange Act of 1934 (i.e., “public
companies”) or other investment companies registered under the 1940 Act.*** Ms. Hazell is considered to be an “Interested Trustee” because she holds positions with HSBC Global Asset Management (USA) Inc.
JOB TITLE HSBC Money Market AR REVISION 11 SERIAL <12345678> DATE Saturday, December 21, 2019 JOB NUMBER 367682(1) TYPE PAGE NO. 34 OPERATOR JOELF

HSBC FAMILY OF FUNDS 35
HSBC FAM ILY OF FUNDS
Board of Trustees and Officers (Unaudited) (continued)
Name, Address, AgePosition(s) Held Funds
Term of Office and Length of Time Served
Principal Occupation(s) During Past 5 Years
OFFICERS
RICHARD A. FABIETTI 452 Fifth Avenue New York, NY 10018 Age: 61
President One year; 2004 to present
Senior Vice President, HSBC Global Asset Management (USA) Inc. (1998 - present)
JAMES D. LEVY 452 Fifth Avenue New York, NY 10018 Age: 56
Vice President One year; 2014 to present
Vice President, Product Management, HSBC Global Asset Management (USA) Inc. (2014 – present); Vice President, Mutual Funds Product Development, GE Asset Management Inc. (2007 – 2014)
LAUREN STUNTEBECK 4400 Easton Commons, Suite 200 Columbus, OH 43219-3035 Age: 32
Treasurer One year; 2019 to present
Vice President, Financial Administration, Citi Fund Services (2019 - present); Senior Manager, Audit, KPMG LLP (2016-2019); Manager, Audit, KPMG LLP (2014-2016)
IOANNIS TZOUGANATOS* Prudential Center 800 Boylston Street, 24th Floor Boston, MA 02199 Age: 43
Secretary One year; 2015 to present
Vice President, Regulatory Administration, Citi Fund Services (2008 - present)
CHARLES BOOTH* 4400 Easton Commons, Suite 200 Columbus, OH 43219-3035 Age: 59
Chief Compliance Officer
One year; 2015 to present
Director and Compliance Officer, CCO Services, Citi Fund Services (1988 - present)
JAMES M. CURTIS 452 Fifth Avenue New York, NY 10018 Age: 51
Chief Legal Officer One year; 2018 to present
Associate General Counsel, HSBC Securities (USA) Inc. (2005-2017); Associate General Counsel, HSBC Technology & Services (USA) Inc. (2018-present)
* Mr. Tzouganatos and Mr. Booth also are officers of other investment companies of which Citi (or an affiliate) is the administrator or sub-administrator.
JOB TITLE HSBC Money Market AR REVISION 11 SERIAL <12345678> DATE Saturday, December 21, 2019 JOB NUMBER 367682(1) TYPE PAGE NO. 35 OPERATOR JOELF

36 HSBC FAMILY OF FUNDS
HSBC FAM ILY OF FUNDS
Other Information (Unaudited)
Information regarding how the Funds voted proxies relating to portfolio securities during the most recent 12-month period ended June 30th is available (i) without charge, upon request, by calling 1-800-525-5757 for HSBC Bank USA and HSBC Brokerage (USA) Inc. clients and 1-800-782-8183 for all other shareholders; (ii) on the Funds’ website at www.investorfunds.us.hsbc.com; and (iii) on the Security and Exchange Commission’s (“SEC”) website at http://www.sec.gov.
The Funds disclose on the Investment Adviser’s website within five business days after the end of each month a complete schedule of portfolio holdings and certain other information, including the dollar-weighted average portfolio maturity and dollar-weighted average portfolio life. In addition, each Fund will file with the SEC on Form N-MFP, within five business days after the end of each month, more detailed portfolio holdings information. The Funds’ Form N-MFP filings will be available on the SEC’s website, and the Investment Adviser’s website will contain a link to such filings.
An investment in a Fund is not a deposit of HSBC Bank USA, National Association, and is not insured or guaranteed by the Federal Deposit Insurance Corporation or any other government agency.
JOB TITLE HSBC Money Market AR REVISION 11 SERIAL <12345678> DATE Saturday, December 21, 2019 JOB NUMBER 367682(1) TYPE PAGE NO. 36 OPERATOR JOELF

JOB TITLE HSBC Money Market AR REVISION 11 SERIAL <12345678> DATE Tuesday, December 24, 2019 JOB NUMBER 367682(1) TYPE PAGE NO. 37 OPERATOR JOSHUAM

HSBC FAMILY OF FUNDS:
INVESTMENT ADVISER AND ADMINISTRATOR
HSBC Global Asset Management (USA) Inc. 452 Fifth Avenue New York, NY 10018
SHAREHOLDER SERVICING AGENTS
For HSBC Bank USA, N.A. and HSBC Securities (USA) Inc. Clients: HSBC Bank USA, N.A. 452 Fifth Avenue New York, NY 10018 1-888-525-5757
For All Other Shareholders:
HSBC Funds P.O. Box 8106 Boston, MA 02266-8106 1-800-782-8183
TRANSFER AGENT
DST Asset Manager Solutions, Inc. 2000 Crown Colony Drive Quincy, MA 02169
DISTRIBUTOR
Foreside Distribution Services, L.P. Three Canal Plaza, Suite 100 Portland, ME 04101
CUSTODIAN
The Northern Trust Company 50 South LaSalle Street Chicago, IL 60603
INDEPENDENT REGISTERED PUBLIC ACCOUNTING FIRM
PricewaterhouseCoopers LLP 300 Madison Avenue New York, NY 10017
LEGAL COUNSEL
Dechert LLP 1900 K Street, N.W. Washington, D.C. 20006
Investment products are offered by HSBC Securities (USA) Inc. (HSI), member NYSE/FINRA/SIPC. HSI is an affiliate of HSBC Bank USA, N.A. Investment products: Are not a deposit or other obligation of the bank or any of its affiliates; Not FDIC insured or insured by any federal government agency of the United States; Not guaranteed by the bank or any of its affiliates; and are subject to investment risk, including possible loss of principal invested.
Investors should consider the investment objectives, risks, charges, and expenses of the investment company carefully before investing. The prospectus contains this and other important information about the investment company. For clients of HSBC Securities (USA) Inc., please call 1-888-525-5757 for more information. For other investors and prospective investors, please call the Funds directly at 1-800-782-8183 or visit our website at www.investorfunds.us.hsbc.com. Investors should read the prospectus carefully before investing or sending money.
HSB-AR-MMF-1219 12/19
Investment products:
ARE NOT A BANK DEPOSIT OR OBLIGATION OF THE BANK OR ANY OF ITS AFFILIATES
ARE NOT FDIC INSURED
ARE NOT INSURED BY ANY FEDERAL GOVERNMENT AGENCY
ARE NOT GUARANTEED BY THE BANK OR ANY OF ITS AFFILIATES
MAY LOSE VALUE
JOB TITLE HSBC Money Market AR REVISION 11 SERIAL <12345678> DATE Tuesday, December 24, 2019 JOB NUMBER 367682(1) TYPE PAGE NO. 38 OPERATOR JOSHUAM