human decision making in recommender systemsceur-ws.org/vol-893/full-volume.pdf · human decision...
TRANSCRIPT

i
Proceedings of the
RecSys 2012
Workshop on
Human Decision Making in Recommender Systems
(Decisions@RecSys’12)
In conjunction with the
6th ACM Conference on Recommender Systems
September 9-13, 2012, Dublin, Ireland

ii
Preface
Interacting with a recommender system means to take different decisions such as selecting a
song/movie from a recommendation list, selecting specific feature values (e.g., camera’s size,
zoom) as criteria, selecting feedback features to be critiqued in a critiquing based
recommendation session, or selecting a repair proposal for inconsistent user preferences when
interacting with a knowledge-based recommender. In all these scenarios, users have to solve a
decision task.
The complexity of decision tasks, limited cognitive resources of users, and the tendency to keep
the overall decision effort as low as possible lead to the phenomenon of bounded rationality,
i.e., users exploit decision heuristics rather than trying to take an optimal decision. Furthermore,
preferences of users will likely change throughout a recommendation session, i.e., preferences
are constructed in a specific decision environment and users do not know their preferences
beforehand.
Decision making under bounded rationality is a door opener for different types of non-conscious
influences on the decision behavior of a user. Theories from decision psychology and cognitive
psychology are trying to explain these influences, for example, decoy effects and defaults can
trigger significant shifts in item selection probabilities; in group decision scenarios, the visibility
of the preferences of other group members can have a significant impact on the final group
decision.
The major goal of this workshop was to establish a platform for industry and academia to
present and discuss new ideas and research results that are related to the topic of human
decision making in recommender systems. The workshop consisted of technical sessions in
which results of ongoing research as reported in these proceedings were presented, a keynote
talk given by Joseph A. Konstan on “Decision-Making and Recommender Systems: Failures,
Successes, and Research Directions” and a wrap up session chaired by Alexander Felfernig.
Marco de Gemmis, Alexander Felfernig, Pasquale Lops,
Francesco Ricci, Giovanni Semeraro and Martijn Willemsen
September 2012

iii
Workshop Committee
Workshop Co-Chairs
Marco de Gemmis, University of Bari Aldo Moro, Italy
Alexander Felfernig, Graz University of Technology, Austria
Pasquale Lops, University of Bari Aldo Moro, Italy
Francesco Ricci, University of Bozen‐Bolzano, Italy
Giovanni Semeraro, University of Bari Aldo Moro, Italy
Martijn Willemsen, Eindhoven University of Technology, Netherlands
Organization
Monika Mandl, Graz University of Technology
Gerald Ninaus, Graz University of Technology
Program Committee
Robin Burke, DePaul University, USA
Li Chen, Hong Kong Baptist University, China
Marco De Gemmis, University of Bari Aldo Moro, Italy
Benedict Dellaert, Erasmus University Rotterdam, Netherlands
Alexander Felfernig, Graz University of Technology, Austria
Gerhard Friedrich, University of Klagenfurt, Austria
Sergiu Gordea, Austrian Institute for Technology, Austria
Andreas Holzinger, Medical University Graz, Austria
Dietmar Jannach, University of Dortmund, Germany
Bart Knijnenburg, University of California, USA
Alfred Kobsa, University of California, USA
Gerhard Leitner, University of Klagenfurt, Austria
Pasquale Lops, University of Bari Aldo Moro, Italy
Walid Maalej, Technische Universität München, Germany
Monika Mandl, Graz University of Technology, Austria
Alexandros Nanopoulos, University of Hildesheim, Germany
Francesco Ricci, University of Bolzano, Italy
Olga C. Santos, UNED, Spain
Giovanni Semeraro, University of Bari Aldo Moro, Italy
Erich Teppan, University of Klagenfurt, Austria
Marc Torrens, Strands, Spain
Martijn Willemsen, Eindhoven University of Technology, Netherlands
Markus Zanker, University of Klagenfurt, Austria

iv
Table of Contents
Decision-Making in Recommender Systems: The Role of User’s Goals and Bounded Resources
P. Cremonesi, A. Donatacci, F. Garzotto, R. Turrin 1
Enhancement of the Neutrality in Recommendation
T. Kamishima, S. Akaho, H. Asoh, J. Sakuma 8
The Effect of Sensitivity Analysis on the Usage of Recommender Systems
M. Maida, K. Maier, N. Obwegeser, V. Stix 15
Recommending Personalized Query Revisions
H. Blanco, F. Ricci, D. Bridge 19
Eliciting Stakeholder Preferences for Requirements Prioritization
A. Felfernig, G. Ninaus, F. Reinfrank 27
Recommendation Systems in the Scope of Opinion Formation: a Model
M. Blattner, M. Medo 32
Effects of Online Recommendations on Consumers' Willingness to Pay
G. Adomavicius, J. Bockstedt, S. Curley, J. Zhang 40
Copyright © 2012 for the individual papers by the papers' authors. Copying permitted for
private and academic purposes. This volume is published and copyrighted by its editors.

Decision-Making in Recommender Systems:
The Role of User’s Goals and Bounded Resources
Paolo Cremonesi Politecnico di Milano p.zza L.da Vinci 32
Milano, Italy [email protected]
Antonio Donatacci Moviri srl
via Schiaffino 11 Milano, Italy
Franca Garzotto Politecnico di Milano p.zza L.da Vinci 32
Milano, Italy [email protected]
Roberto Turrin Moviri srl
via Schiaffino 11 Milano, Italy
ABSTRACT
Many factors that influence users’ decision making processes in
Recommender Systems (RSs) have been investigated by a
relatively vast research of empirical and theoretical nature, mostly
in the field of e-commerce. In this paper, we discuss some aspects
of the user experience with RSs that may affect the decision
making process and outcome, and have been marginally addressed
by prior research. These include the nature of users’ goals and the
dynamic characteristics of the resources space (e.g., availability
during the search process). We argue that these subjective and
objective factors of the user experience with a RS call for a
rethinking of the decision making process as it is normally
assumed in traditional RSs, and raise a number or research
challenges. These concepts are exemplified in the application
domain of on-line services, specifically, hotel booking- a field
where we are carrying on a number of activities in cooperation
with a large stakeholder (Venere.com – a company of Expedia
Inc.). Still, most of the arguments discussed in the paper can be
extended to other domains, and have general implications for RS
design and evaluation.
Categories and Subject Descriptors
H.5.2 [Information Interfaces and Presentation]: Multimedia
Systems, User Interfaces. H.3.3 [Information Storage and
Retrieval]: Information Search and Retrieval.
General Terms
Design, Empirical Study, Experimentation, Human Factors.
Keywords
Recommender System, decision making, Soft Goal, Bounded
Resources, design, evaluation, e-tourism, e-booking
1. INTRODUCTION Recommender Systems (RSs) help users search large amounts of
digital contents and identify more effectively the items – products
or services - that are likely to be more attractive or useful. As
such, RSs can be characterized as tools that help people making
decisions, i.e., make a choice across a vast set of alternatives [12].
A vast amount of research has addressed the problem of how RSs
influence users’ decision making processes and outcomes. A
systematic review of the literature about this topic, focused on e-
commerce, is reported by Xiao and Benbasat in [18]. These
authors pinpoint that when we regard RSs as decision support
tools, the design and evaluation of these systems should take into
account other aspects beyond the algorithms that influence users’
decision-making processes and outcomes. These aspects are
related to individuals’ subjective factors as well as the design
characteristics of the user experience with the RS. While several
theoretical arguments and empirical studies exist that support the
positive effects of RA use on decision making quality, research in
this field is still inconclusive, highlighting the need for further
research.
This paper provides some novel contribution to this research area.
Most prior work on RSs for decision support focused on e-
commerce domains where users buy on-line products or movies
[1]. Our work has instead explore decision making processes in
the wide application domain of on-line services, specifically, hotel
booking. We are carrying on a number of activities in close
cooperation with a key stakeholder in this field, Venere.com
(www.venere.com). This is a company of the Expedia Inc. group
which is leader in online hotel reservations market featuring more
than 120,000 hotels, Bed and Breakfasts and vacation rentals in
30,000 destinations worldwide. In this domain, we investigate
some subjective aspects of the user experience with RSs - the type
of users’ goals, and some objective, i.e., design related, attributes
of RSs – the nature of the resources space (e.g., the availability
of items along the time in general, and specifically during the
search process) that may affect the decision making processes
supported by RS. Still, most of our considerations can be extended
to other domains, and have implications for research and practice
in RS design and evaluation in general.
2. USER GOALS AND “BOUNDED”
RESOURCES
2.1 Scenarios Let us consider the following scenarios, in which the user is
engaged with an online hotel reservation system.
Scenario 1. You have to come to Milan and work with your
business partners from August 6 to August 10, 2012. You want to
reserve a room in a hotel in Milan for that week.
Scenario 2. You will spend a holiday in Milan from September 19
to September 25, 2012, and want to reserve a room.
Scenario 3. You have to attend a business meeting in Milan from
September 19 to September 20, 2012, and you need to reserve a
room in a hotel in Milan on that dates, for one night
Scenario 4. You are planning a holiday in Central Italy in mid
September 2012, and will visit Rome for few days. You need a
hotel in that period.
Paper presented at the 2012 Decisions@RecSys workshop in conjunction with the 6th ACM conference on Recommender Systems.
Copyright © 2012 for the individual papers by the papers' authors.
Copying permitted for private and academic purposes. This volume is published and copyrighted by its editors.
1

Scenario 1:• Milan• Business travel• 6-10 August
Scenario 2:• Milan• Holiday travel• 19-25 September
Scenario 3:• Milan• Business travel• 19-20 September
Scenario 4:• Central Italy• Holiday travel• Mid September
Goal
Rooms availabilityAvailabile Not availabile
Strict
Soft
How do the above scenarios differ?
In all of them, the user is doing a similar operational task: buying
a service, specifically, reserving hotel rooms. Still, there are some
significant differences that may influence the decision making
processes, and are induced by i) the different nature of the user’s
goal; ii) the dynamic nature of the services offered by the system
the user is interacting with (Figure 1).
In scenarios 1,2 and 3, user’s goals are sharp, users’ preferences
are well defined and have clear-cut criteria for their optimal
satisfaction. In scenario 4, the user have less strict preferences –
her dates are “flexible”, and we may not exclude that she is
flexible also with respect to other criteria, or may not know all her
preferences beforehand. Preferences are likely to be shaped and
changed throughout a session in the specific decision
environment. Using the terminology of goal oriented requirements
engineering [15], scenario 4 depicts a situation that is
characterized by soft goals [20], i.e., open-ended needs that are
progressively elaborated during the interaction with an
environment and the decision process, and may be somehow
supported by one or more combinations of solutions and
decisions1.
Further differences in the above scenarios are related to the
intrinsic nature of resources, in particular, to the dynamic, time
dependent characteristic of the items in terms of their availability.
In scenario 1, the user is making a decision in the context of a
very vast set of stable alternatives: in the second week of August,
hotel availability in Milan is huge, as most people and companies
or institutions are on holiday. No matter when and how you
reserve a hotel, it is very likely that you will find one that matches
you preferences.
In contrast, in scenarios 2, 3, and 4, the user is taking decision in
the context of limited or very limited resources, or of resources
that become limited, or even fully unavailable, as the decision
process proceeds. In scenario 2, the user is looking for hotels in a
period - from September 19 to September 25, 2012 – when Milan
will host one of the most important international events in the
fashion world, the Milan Fashion Week, attracting thousands of
1 It is worth noticing that soft goals often occur also in entertainment-
related domains, such as video-on-demand and interactive TV. For
instance, a user may wish to watch a relaxing TV program, without
expressing any other requirement
people from all over the world. Most hotels are booked one year
in advance for that event. Hence, we can reasonably expect that,
when searching a room for the whole week, no hotel is available.
Scenario 3 considers reservations in the same period of time, but
here the user’s requirement is less demanding – she is searching a
room only for the first day of Milan Fashion week. There might
be rooms available on that single date. Still, it may happen that
other people are simultaneously trying to make a similar
reservation, so that when the user takes her decision, the chosen
hotel is not available any more.
In scenario 4, the user hasn’t decided yet when she exactly will go
to Rome, and her dates are flexible. It is likely that she has not
specified the reservation period at the beginning of the process,
and finds many alternatives matching her preferences on hotel
characteristics. Still, the preferred time frame for reservation –
mid September – is high season in Rome, and finding a hotel in
that period time may be difficult. When she make a specific
choice, decides the dates and attempts to make a reservation, the
selected hotel may result to be fully booked.
2.2 The decision making process In all contexts depicted in the above scenarios, the user is facing a
problem falling in the class of so called “preferential choice
problems” [17], i.e., she needs to take decisions across an initially
vast set of potential alternatives. In this context, decision making
processes are typically modeled as “bounded rationality”
phenomena [10]. Bounded rationality – which provides a key
theoretical underpinning for RSs – is the notion that, in complex
decision-making environments, individuals are often unable to
evaluate all available alternatives in great depth prior to making
their choices, due to the cognitive limitations of their minds, and
the finite amount of time they have to make a decision; hence they
seek to attain a satisfactory, although not necessarily an optimal,
level of achievement, by applying their rationality only after
having greatly simplified the set of choices available.
Several authors suggest that the cognitive effort can be reduced
with a multiple-stage decision-making process, in which the depth
of information processing varies by stage [6][18]. Initially,
individuals screen the complete solution space (e.g., the set of all
hotels featured by the on-line reservation service provider) to
identify the (large) set of potential alternatives, or search set (e.g.,
the set of hotels that could be of some interest); then they search
through this set, and identify a subset of promising candidates (the
consideration set). Subsequently, they acquire detailed
information on selected alternatives to be seriously considered (in-
depth comparison set), evaluate and compare them in more detail,
and finally commit to a specific choice. Although some of the
above actions can be iterated, this process is intrinsically linear
and it is likely to end with the user making a specific choice and
hopefully buying a service.
The same process may not apply exactly in the same terms in the
situations described in scenarios 2, 3 and 4 (Figure 2). In scenario
2, the search set is likely to be empty (no hotel is available for the
specified period). In scenarios 3 and 4, the search set, the
consideration set and the in-depth comparison set are not empty,
initially. Still, their size decreases as the decision process proceed
(e.g., because other users buy some items, or because the user
refines her decision criteria, e.g., fixing the dates). Hence, when
the user reaches the final step and makes a decision, her choice
will likely result unfeasible. In all these cases, after experiencing
the unavailability of resources, i.e., of rooms in the desired
hotel(s), the user may either give up (e.g., she leaves the current
on-line reservation service and tries a different one) or iterate the
Figure 1: Bounded resources and task goal
2

process, providing extra input to modify their preferences,
exploring the search set, consideration set and in-depth set again,
and attempting to make a different decision.
3. CHALLENGES FOR RS DESIGN AND
EVALUATION The examples discussed in the previous section highlight that the
decision process in RSs is influenced by the characteristics of both
users’ goals and the resources meeting users’ needs and
preferences. How the nature of the goal (sharp or soft) and the
dynamic of resources play in the decision making process has
been marginally explored in current RS research, and opens a
number of research challenges.
A first challenge is to understand the degree at which some key
theoretical assumptions underlying most of the existing RSs, such
as “bounded rationality”, are valid in the context of users’ soft
goals, and how the structure of RS supported decision making
processes can be defined in these situations. On the one side, it
remains true also that a decision-maker lacks the ability and
cognitive resources to arrive at the optimal solution in a vast set of
alternatives, and at some point of time she needs to apply her
rationality after having greatly simplified the choices available.
On the other side, the decision-maker might not be modeled as a
“satisfier” - one seeking a satisfactory solution rather than the
optimal one, minimizing the cognitive effort - along the entire
decision making process. At the beginning of the process, the
user may indeed be looking for an optimal solution, because her
needs and preferences are initially poorly defined, and she does
not know yet what the characteristics of such optimal solution are.
Hence the initial step of the decision process is more a kind of
“sense making” activity that a focused “search”: the user is
attempting to understand the complexity of the domain and the
characteristics of the items in relationship to the specific field of
interest, in order to decide what she needs and wants. In this
context, the decision making process seems to include a
preliminary phase, taking place before the progressive
elaboration of alternatives, in which the user forges her own
preferences, and transforms a soft goal into a sharp goal that
characterizes an actual “preferential choice problem”. In this
preliminary “sense making phase”, optimizing cognitive resources
and reducing effort might not be an issue, as suggested by some
studies [1].
This analysis has challenging implications for RS design in
domains where both sharp and soft goals coexist. In these
contexts, a designer’s goal should go beyond the support to
findability – to enable users easily locate what they are precisely
looking for – and to the tasks involved in the decision making
process as it is conventionally intended. RS design should also
support tasks that are essentially explorative in nature [1][11], and
are oriented towards constructing preferences in the specific
domain and decision environment. The challenge is to provide a
seamlessly integrated set of interactive design strategies that
leverages existing patterns of exploratory interaction, such as
faceted navigation and search [13], with existing RS design
strategies. It is worth noticing that serendipity can be an
important goal also in this exploratory phase and not only when
providing recommendations. Promoting crucial contents the
existence of which users did not even suspect, so that users can
stumble and get interested in them (even if they were not looking
for that kind of information), can be as effective (or perhaps more
effective) in this phase than in following phases of the decision
process.
From a different perspective, also the bounded resources
condition challenges existing results concerning the decision
making process in typical RSs. The process depicted by [13] and
discussed in the previous section applies well in the context of
“unbounded resources”, exemplified by scenario 1 and
characterized by a very vast set of alternatives that remains large
when screened and filtered according to user’s preference
criteria. In this situation there are theoretical arguments as well as
a large number of empirical studies - mostly in the e-commerce
Figure 2: Decision making processes in the four scenarios
3

domain [7][8] - that claim that typical RSs can provide effective
support to users in all stages of the decision-making process. They
facilitate both the initial screening of available alternatives and the
in-depth comparison of item alternatives within the consideration
set, reducing the total size of information processed by the users
in the search set, consideration set and in-depth search set [13].
Hence we can posit that, under the unbounded resources
condition, typical RSs reduce users’ decision effort and users’
decision time, hence improving the quality of the decision process.
In all cases depicted in scenarios 2, 3 and 4, the decision process
is influenced by the “bounded” characteristics of the resources
meeting users’ needs and preferences, which may affect the
validity of the above proposition and the effectiveness of
traditional RSs for decision making purposes.
It is well known that, in any context, the RS attempt of reducing
the user decision effort risks to create the so called filter bubble
effect. This term, first coined by Eli Pariser in [5] describes a
phenomenon in which RSs tend to show only information which
agrees with users’ past viewpoints, effectively isolating the user in
a bubble that tends to exclude items that may be helpful for the
users’ goals, i.e., novel and serendipitous items. We cannot
exclude that potentially negative effects of the bubble
phenomenon get amplified in the context of bounded resources:
the bubble can result so narrow that, as pinpointed by the
discussion in the previous section, the intersection between the
bubble and the set of available items is empty. If this is the case,
the decision process must be iterated, possibly several times. This
situation is likely to increase users’ decision effort and users’
decision time, and therefore decrease the quality of the decision
process. This in turn have potentially negative effects on the
users’ perception of on her trust in, usefulness of, and satisfaction
with the RS. Even worse, the user may give up before completing
the decision process, leaving the current on-line reservation
service and trying a different one, with obvious implications for
the service provider, in terms of customers’ trust and actual
business outcomes.
In order to overcome these problems, users must be exposed to
novel and serendipitous recommendations [2]. This is a
paradigmatic shift for the role of RSs in the decision process:
from a tool that helps users in narrowing the search set and
consideration set in the case of unbounded resources, to a tool that
expands the in-depth set in the case of bounded resources.
Defining the design strategies of RSs that take into account the
possibility of bounded resources is a challenging issue. Some
requirements that need to be taking into account are the following:
- Support to decision making processes that are strongly
iterative, maximizing the usability of doing and re-doing
previous steps, particularly in the re-definition of preferences
as the user becomes aware of the lack of available items
matching her requirements.
- Need to maintain users’ trust [9] and keep the user engaged
with the decision process, in spite of the initial failures that
potentially can occur because of the lack of resources. In this
respect, specific explanation strategies [19] and appropriate
conversational interfaces [16] should be defined, which not
only improve transparency and explain how recommendations
are generated, but also make the user aware of the shortage of
resources
- Ability to act both as filter that limits the set of valuable
alternatives and as multiplier that helps the user expand her
horizons by recommending serendipitous alternatives.
Finally, the concepts of user’s goals (sharp or soft) and bounded
resources both have implications on evaluation models,
methodologies and empirical studies regarding RSs as decision
support tools.
Existing conceptual models for evaluation (e.g., [8][18]) do not
provide explicit constructs for users’ goals. Previous studies on
decision making [5] pinpoint how the nature of users’ tasks is an
important factor affecting individual’s behavior and performance.
Still, a task as defined in previous studies - “the set of functions
that a working person, unit, organization is expected to fulfill or
accomplish” [5] - has mainly a functional flavor. Our study
emphasizes the need for extending this functional perspective and
raising the level of abstraction of the task concept, to address
“goals”, i.e., broader users’ needs. In addition, the discussion
presented in the previous sections suggests extensions of existing
frameworks for RS evaluation with explicit constructs that address
the temporal and dynamic characteristics of RS resources. All
these extensions can lead to more powerful conceptual models
that can help contextualize a wider spectrum of empirical studies
in a wide range of RS application domains and situations of use.
4. OUR WORK Most prior work on RSs for decision support has focused on e-
commerce domains where users buy on-line products, pinpointing
the influence that different aspects of the user experience with the
RS induce on the decision process and outcomes. Our work is
currently exploring this issue in a different field, the wide
application domain of on-line services, such as hotel booking. We
are working in close cooperation with Venere.com, a company of
Expedia Inc. and a key stakeholder in this domain. Our work
contains methodological, technical, and empirical innovations.
4.1 Methodology We have defined a conceptual model that provides a more
comprehensive framework than the existing ones, and takes into
account a number of new aspects of the user experience with RSs
which have been neglected by previous studies and may
significantly influence users’ decision-making processes and
Figure 3: The PoliVenus web application.
Recommendations of hotels are on the lower left.
4

outcomes. These include the characteristics of the goals – sharp
vs. soft – performed with the system (e.g., booking a hotel for
vacation or for a business trip) and the dynamic characteristics of
items (e.g., availability during the search process).
4.2 Technical work We have developed a web-based software framework, PoliVenus,
for evaluation that facilitates the execution of controlled user
studies in this field driven by the constructs of our conceptual
model (Figure 3). The framework is based on a modular
architecture that can be easily customized to different datasets and
types of recommender algorithms, and enables researchers to
manipulate and control different variables in order to
systematically assess the effects of RS use on users’ decision
making processes.
PoliVenus duplicates all the functionality of the Venere.com on-
line booking system, with the exception of payment functions, and
contains a catalogue of 6000 accommodations and 500000 users’
reviews on the same accommodations. PoliVenus can simulate
high-season periods by “reducing” the number of rooms available
in a range of selected dates.
Selected users on PoliVenus can be provided with
recommendations. Recommendations, in turn, can be provided
with any type of algorithm (collaborative and content) from a
library of 20 algorithms. Hybrid recommendations can be
provided as well, combining any two algorithms. The algorithms
have been developed in cooperation with ContentWise2
(algorithms and datasets can be obtaining by mailing the authors).
The user profile is implicitly created by monitoring user’s
interaction with the “objects” (e.g., pages) describing
accommodations.
2 www.contentwise.tv
Recommendations can be provided in different phases of the
interaction process (e.g., as alternatives when watching the
description page of an accommodation, as a sorting option in a list
of hotels).
4.3 Empirical Work We have designed an experimental setup that allows three
different experimental conditions: (a) RS use conditions, (b)
bounded resources conditions, (c) RS characteristics, and (d)
consumer decision processes.
The first condition is obtained by asking the user to execute one
between different tasks, each one representing a different system
scenario.
The second condition refers to the configuration of the system,
i.e., the possibility to use the application without or with RS
support. It should be noticed that this second condition is different
from most cases of study discussed by Xiao and Benbasat in [18].
In our implementation, the RS integration doesn’t exclude the
normal functionalities of the application without RS. This
coexistence leads us to reconsider the concept of RS use in our
research.
The third condition refers to the possibility to choose a different
recommender algorithm among a wide range of recommender
algorithms either collaborative, content or hybrid.
The fourth condition allows analyzing the user behavior under
limited or unlimited items availability. In our experimental setup,
item availability can evolve with time (e.g., the longer is the user
decision process, the higher is the probability for the selected item
to be unavailable, or the higher is the final price for the selected
item).
Therefore we have used the testing environment PoliVenus in a
number of preliminary empirical studies, for three key aspects of
the bounded resources concept:
# Question Possible answers Area
1 Did you already stayed in the city where the hotel is located? yes / no product expertise
2 Did you already stayed in the selected hotel? yes / no product expertise
3 Would you have preferred to book a different hotel? yes / no decision quality
4 If yes to the previous question, would you have preferred a hotel
(more answers are feasible):
cheaper / with more stars / in another
city zone / in other dates
decision quality
5 Are you satisfied with your final choice? not much / fairly / very much decision quality
6 How much the proposed hotels match your personality? not at all / fairly / very much decision quality
7 How long have spent for booking the hotel (minutes)? 5 / 10 / 15 / 20 / 30 / 60 decision effort
8 The time required to choose the hotel is: reasonable / overmuch / short decision effort
9 The hotel selection process has been: easy / hard / very hard decision effort
10 The range of hotel presented is: poor / broad / very broad recommendation quality
11 The set of proposed hotels is: predictable / with original and
unexpected items / very surprising
recommendation quality
12 How much do you think that the characteristics of the reserved
hotel will correspond to the real one?
not much / fairly / very much perceived product risk
and trust
13 Do you use online booking systems? never / sometimes / regularly profiling
14 If you have used online booking, have you ever used
Venere.com to make reservations in the past?
never / sometimes / regularly profiling
15 Average number of journeys with accommodation per year for
holiday purpose
profiling
16 Age, Gender, Nationality, Educational qualification, Occupation profiling
17 When you travel for holiday, which are the priority criteria with
which you choose a hotel?
price / offered services / location /
suited for people traveling with me
profiling
18 Where are you in this moment? home / work / vacation / traveling context
Figure 4. Questionnaire
5

Unavailability: resources may be unavailable for the user
(e.g., after selecting hotel and accommodation period, the
system informs the user that there are no rooms available).
Time scarcity: resources may become unavailable as the time
passes (e.g., as the user session goes on, the availability of
rooms in a hotel decreases).
Price alteration: prices may change depending on availability
of resources (e.g., the system simulates price increase in
relation to rooms’ availability).
4.4 Participants and Context of Execution In this section we present the results of a preliminary study
executing by using the PoliVenus system. The study was designed
as a between subjects controlled experiment, in which we
measured the first following experimental conditions, each
condition tested with two independent variables:
RS use. We have tested two independent variables: (i) with and
(ii) without recommendations.
Resources availability. We have tested two independent
variables: (i) rooms are always available in any date for any
hotel, and (ii) no rooms are available in the first hotel in which
the user tries to book, regardless of the dates. We will refer to
the two scenarios as rooms available and shortage of rooms,
respectively
We have a total combination of four research variables. We have
recruited 15 subjects for each group. Overall, the study involved
60 male users aged between 24 and 50. None of them had been
previously used Venere.com.
Each participant was invited to browse the hotel catalog of
PoliVenus to search for a double hotel room in Rome and to
complete the simulated payment procedure booking the room for
two nights. The user was then invited to reply to a set of 18
questions related to the quality of the interaction procedure and
satisfaction of the chosen hotel (Figure 4).
4.5 Results Table 1 presents some results of our preliminary study. Only
statistically significant results are presented.
Personalization. The first row of the table summarizes the
answers to Q6 in the questionnaire and measure the degree of
perceived personalization in the hotels presented to the users
during their interaction with the system. As expected, all the
users that did not receive recommendations perceived the
presented hotels are “not personalized”. However, only 10% of
the users that did receive recommendations perceived these
recommendations as matching their personality.
Task execution time. The second row of the table estimates
users’ effort by measuring the time required for the completion
of the task. Surprisingly, users receiving recommendations
required significantly more time (almost one minute more) then
users without recommendations. This results may lead to think
that recommendations increase the effort of the decision making
process. The last two rows in the table provide a different
explanation.
Consideration set. In order to analyze why users receiving
recommendations takes longer to complete their task, we have
measured how many hotels they explore during their interaction
with the system (the consideration set). The third row of the
table shows that users receiving recommendations explore a
much larger consideration set (almost three times the number of
hotels with respect to users not receiving recommendations).
This result suggests that recommendations help user to explore a
larger number of alternatives. This effect is more evident if we
compare the two scenarios “rooms available” and “shortage of
rooms”. Users not receiving recommendations explore the same
small number of hotels, regardless of the difficulties in finding
rooms. On the contrary, users receiving recommendations
explore twice the number of hotels if there are few rooms
available. This suggests that recommendations help users in
exploring a larger number of alternatives especially in the
scenario of bounded resources.
Perceived time. The last row of the table presents the perceived
effort of the decision making process measured with the
perceived time for completion of the task (Q7 in the
questionnaire). Even if users with recommendations required a
significantly longer time to complete their task and explored a
much larger number of hotels during their session, their
perceived time is the same as the time perceived by user without
recommendations. In both cases (with and without
recommendations) users dealing with shortage of rooms
perceived a longer time for their task, even if the task
completion time does not change significantly between the
“rooms available” and “shortage of rooms” groups.
5. DISCUSSION AND CONCLUSIONS The analysis of the results presented in the previous section
suggests a number of interesting considerations.
- RSs do not reduce the time required to complete a decision
making process. On the contrary, RSs stimulate users to
explore more alternatives before making their final choice.
- The effort of the decision making process does not change
with the adoption of RSs. Users’ perception of the elapsed
time is not related to the larger number of explored choices.
- The effort of the decision making process increases in the
case of bounded resources. RSs seem not able to alleviate
this perceived effort.
Our research has its weaknesses, most notably the limited sample
size (60 participants) used for this preliminary test. In spite of the
above limitation, our work provides contributions both from a
research and practical perspective. To our knowledge, this is the
first work that systematically analyzes RSs as decision support
systems in the scenario of on-line booking services, focusing of
the correlation between resources availability and effectiveness of
the recommendations. For the practice of decision support
systems design and evaluation, our work may promote further
approaches that move beyond the attention to conventional
perceived relevance metrics and shift the emphasis to more effort-
centric factors.
Without
RS
With
RS
The proposed hotels match your
personality (very much)
0% 10%
Task execution time 5’45’’ 6’30’’
rooms always available 6’00’’ 6’30’’
shortage of rooms 5’30’’ 6’30’’
Consideration set (# of explored hotels) 3.5 11
rooms always available 3 9
shortage of rooms 4 13
Task perceived time 8’40’’ 8’20’’
rooms always available 8’15’’ 7’40’’
shortage of rooms 9’00’’ 9’00’’
Table 1: Results
6

6. REFERENCES [1] Bambini, R., Cremonesi, P., Turrin, R., A Recommender
System for an IPTV Service Provider: a Real Large-Scale
Production Environment. In Recommender Systems
Handbook , F. Ricci, L. Rokach, B. Shapira, and P. B.
Kantor, Eds. Springer, 2011, 299-331
[2] Cremonesi P., Garzotto F., Turrin R., Investigating the
Persuasion Potential of Recommender Systems from a
Quality Perspective: an Empirical Study, ACM Trans. on Interactive Intelligent Systems 2 (2) 2012.
[3] Eierman M.A., F. Niederman, and C. Adams. DSS theory: A
model of constructs and relationships. In Decision Support Systems, volume 14, 1995, 1–26.
[4] Marchionini, G. Exploratory search: from finding to understanding. CACM, 49 (4), Aprile 2006, 41 – 46.
[5] Pariser. E., The Filter Bubble: What the Internet Is Hiding
from You. Penguin Press, 2011.
[6] Payne, J. W., Bettman, J. R., and Johnson, E. Adaptive
Strategy Selection in Decision Making. J. of Experimental
Psychology: Learning, Memory, and Cognition 14 (3), 1988, 534-552
[7] Pereira, R. E. Optimizing Human-Computer Interaction for
the Electronic Commerce Environment. J. of Electronic
Commerce Research (1:1), 2000, 23-44.
[8] Pu, P., Chen L, and Hu R. A User-Centric Evaluation
Framework for Recommender Systems. Proc. RecSys 2011,
157-164
[9] Pu, P. and Chen, L. Trust building with explanation
interfaces. In Proc. Intelligent User Interfaces - IUI ’06.
ACM, 2006, 93–100.
[10] Simon, H.A., Models of bounded rationality. 3. Empirically
grounded economic reason, 1997, MIT Press
[11] Spagnolo, L., Bolchini, D., Paolini, P., & Di Blas, N. Beyond
Findability. J. of Information Architecture. 2 (1) 2010. 19-36
[12] Swaminathan V.. The impact of recommendation agents on
consumer evaluation and choice: The moderating role of
category risk, product complexity, and consumer knowledge.
J. of Consumer Psychology, 13 (1-2), Feb 2003, 93-101
[13] Todd, P., and Benbasat, I. The Influence of Decision Aids
on Choice Strategies: An Experimental Analysis of the Role
of Cognitive Effort. Organizational Behavior and Human
Decision Processes. 60 (1), 1994, 36-74.
[14] Tunkelang, D.. Faceted Search. In Marchionini, G. (ed.),
Synthesis Lectures on Information Concepts, Retrieval, and
Services. Morgan & Claypool Publishers, 2009
[15] Van Lamsweerde A.. Goal-Oriented Requirements
Engineering: A Guided Tour. Proc. Fifth IEEE Int.
Symposium on Requirements Engineering (RE '01). IEEE,
2001. 249-262
[16] Vappiani P. Pu P. Faltings B, Conversational recommenders with adaptive suggestions. Proc. RecSys 2007, 89-96
[17] Zachary W. A cognitively based functional taxonomy of
decision support techniques. Human-Computer Interaction 2 (1), March 1986 25-63
[18] Xiao B. Benbasat I. E-commerce product recommendation
agents: use, characteristics, and impact. Management Information Systems Quarterly 31 (1) 2007. 137–209
[19] Yoo, K. H. and Gretzel,U. Creating more credible and
persuasive recommender systems: The influence of source
characteristics on recommender system evaluations. In Ricci
F. et al (eds.) Recommender Systems Handbook. Springer
2011, 455–477.
[20] Yu, E., Modeling Organizations for Information Systems
Requirements Engineering. Proc. 1st International
Symposium on Requirements Engineering, RE'93, San Jose, USA, 1993
7

Enhancement of the Neutrality in Recommendation
Toshihiro Kamishima, Shotaro Akaho,and Hideki Asoh
National Institute of Advanced Industrial Scienceand Technology (AIST)
AIST Tsukuba Central 2, Umezono 1-1-1,Tsukuba, Ibaraki, 305-8568 Japan
[email protected],[email protected], [email protected]
Jun SakumaUniversity of Tsukuba
1-1-1 Tennodai, Tsukuba, 305-8577 Japan; andJapan Science and Technology Agency
4-1-8, Honcho, Kawaguchi, Saitama, 332-0012Japan
ABSTRACTThis paper proposes an algorithm for making recommenda-tion so that the neutrality toward the viewpoint specifiedby a user is enhanced. This algorithm is useful for avoid-ing to make decisions based on biased information. Sucha problem is pointed out as the filter bubble, which is theinfluence in social decisions biased by a personalization tech-nology. To provide such a recommendation, we assume thata user specifies a viewpoint toward which the user wantto enforce the neutrality, because recommendation that isneutral from any information is no longer recommendation.Given such a target viewpoint, we implemented informationneutral recommendation algorithm by introducing a penaltyterm to enforce the statistical independence between the tar-get viewpoint and a preference score. We empirically showthat our algorithm enhances the independence toward thespecified viewpoint by and then demonstrate how sets ofrecommended items are changed.
Categories and Subject DescriptorsH.3.3 [INFORMATION SEARCH AND RETRIEVAL]:Information filtering
Keywordsneutrality, fairness, filter bubble, collaborative filtering, ma-trix decomposition, information theory
1. INTRODUCTIONA recommender system searches for items and informationthat would be useful to a user based on the user’s behaviorsor the features of candidate items [21, 2]. GroupLens [19]and many other recommender systems emerged in the mid-1990s, and further experimental and practical systems havebeen developed during the explosion of Internet merchan-dizing. In the past decade, such recommender systems havebeen introduced and managed at many e-commerce sites topromote items sold at these sites.
Paper presented at the 2012 Decisions@RecSys workshop in conjunctionwith the 6th ACM conference on Recommender Systems. Copyright c©2012 for the individual papers by the papers’ authors. Copying permittedfor private and academic purposes. This volume is published and copy-righted by its editors.2012 Decisions@RecSys workshop September 9, 2012, Dublin, Ireland
The influence of personalization technologies such as recom-mender systems or personalized search engines on people’sdecision making is getting stronger and stronger. For exam-ple, at a shopping site, if a customer checks a recommen-dation list and finds a five-star-rated item, he/she wouldmore seriously consider buying the highly rated item. Thefilter bubble, which is the selection of the appropriate di-versity of information provided to users, is one of problemsaccompanying the growing influence of recommendation orpersonalization.
The problem of the filter bubble was recently posed by Pariser[17]. Via the influence of personalized technologies, the top-ics of information provided to users are becoming restrictedto those originally preferred by them, and this restriction isnot notified by users. This situation is compared to shut-ting up each individual in a separate bubble. Pariser claimedthat due to the obstruction of these bubbles, users lose theopportunity of finding new topics and that sharing publicmatters throughout our society is getting harder. To dis-cuss this filter bubble problem, a panel discussion was heldat the RecSys 2011 conference [20].
During the RecSys panel discussion, panelists made the fol-lowing assertions about the filter bubble problem. Biasedtopics would be certainly selected by the influence of per-sonalization, but at the same time, it would be intrinsicallyimpossible to make recommendations that are absolutelyneutral from any viewpoint, and the diversity of providedtopics intrinsically has a trade-off relation to the fitness ofthese topics for users’ interests or needs. To recommendsomething, or more generally to select something, one mustconsider the specific aspect of a thing and must ignore theother aspects of the thing. The panelists also pointed outthat current recommender systems fail to satisfy users’ in-formation need that they search for a wide variety of topicsin the long term.
To solve this problem, we propose an information neutralrecommender system that guarantees the neutrality of rec-ommendation results. As pointed out during the RecSys2011 panel discussion, because it is impossible to make arecommendation that is absolutely neutral from all view-points, we consider neutrality from the viewpoint or infor-mation specified by a user. For example, users can specify afeature of an item, such as a brand, or a user feature, suchas a gender or an age, as a viewpoint. An information neu-
8

tral recommender system is designed so that these specifiedfeatures will not affect recommendation results. This sys-tem can also be used to avoid the use of information thatis restricted by law or regulation. For example, the use ofsome information is prohibited for the purpose of makingrecommendation by privacy policies.
We borrowed the idea of fairness-aware mining, which weproposed earlier [11], to build this information neutral rec-ommender system. To enhance the neutrality or the inde-pendence in recommendation, we introduce a regularizationterm that represents the mutual information between a rec-ommendation result and the specified viewpoint.
Our contributions are as follows. First, we present a defini-tion of neutrality in recommendation based on the consider-ation of why it is impossible to achieve an absolutely neutralrecommendation. Second, we propose a method to enhancethe neutrality that we defined and combine it with a latentfactor recommendation model. Finally, we demonstrate thatthe neutrality of recommendation can be enhanced and howrecommendation results change by enhancing the neutrality.
In section 2, we discuss the filter bubble problem and neu-trality in recommendation and define the goal of an infor-mation neutral recommender task. An information neutralrecommender system is proposed in section 3, and its ex-perimental results are shown in section 4. Sections 5 and 6cover related work and our conclusion, respectively.
2. INFORMATION NEUTRALITYIn this section, we discuss information neutrality in recom-mendation based on the considerations on the filter bubbleproblem and the ugly duckling theorem.
2.1 The Filter Bubble ProblemWe here summarize the filter bubble problem posed by Pariserand the discussion in the panel about this problem at theRecSys 2011 conference. The filter bubble problem is aconcern that personalization technologies, including recom-mender systems, narrow and bias the topics of informationprovided to people while they don’t notice these facts [17].
Pariser demonstrated the following examples in a TED talkabout this problem [16]. In a social network service, Face-book1, users have to specify a group of friends with whomthey can chat or have private discussions. To help usersfind their friends, the service has a function to list otherusers’ accounts that are expected to be related to a user.When Pariser started to use Facebook, the system showeda recommendation list that consisted of both conservativeand progressive people. However, because he has more fre-quently selected progressive people as friends, conservativepeople have been excluded from his recommendation listby a personalization functionality. Pariser claimed that thesystem excluded conservative people without his permissionand that he lost the opportunity of getting a wide variety ofopinions.
He furthermore demonstrated a collection of search results
1http://www.facebook.com
from Google2 for the query “Egypt” during the Egyptianuprising in 2011 from various people. Even though such ahighly important event was occurring, only sightseeing pageswere listed for some users instead of news pages about theEgyptian uprising, due to the influence of personalization.In this example, he claimed that personalization technologyspoiled the opportunity to obtain information that shouldbe commonly shared in our society.
We consider that Pariser’s claims can be summarized as fol-lows. The first point is the problem that users lost opportu-nities to obtain information about a wide variety of topics.A chance to know things that could make users’ lives fruit-ful was lessened. The second point is the problem that eachindividual obtains information that is too personalized, andthus the amount of shared information is decreased. Pariserclaimed that the loss of sharing information is a serious ob-stacle for building consensus in our society. He claimed thatthe loss of the ability to share information is a serious ob-stacle for building consensus in our society.
RecSys 2011, which is a conference on recommender systems,held a panel discussion the topic of which was this filter bub-ble problem [20]. This panel concentrated on the followingthree arguing points. (1) Are there filter bubbles? Resnickpointed out the possibility that personalization technologiesnarrow users’ experience in the mid 1990s. Because select-ing specific information by definition leads to ignoring otherinformation, the diversity of users’ experiences intrinsicallyhave a trade-off relation to the fitness of information forusers’ interests. As seen in the difference between the per-spective of al-Jazeera and that of Fox News, this problemexists irrespective of personalization. Further, given signalsor expressions of users’ interest, it is difficult to adjust howmuch a system should meet those interests.
(2) To what degree is personalized filtering a problem? Thereis no absolutely neutral viewpoint. On the other hand, theuse of personalized filtering is inevitable, because it is notfeasible to exhaustively access the vast amount of informa-tion in the universe. One potential concern is the effect ofselective exposure, which is the tendency to get reinforce-ment of what people already believe. According to the re-sults of studies about this concern, this is not so serious,because people viewing extreme sites spend more time onmainstream news as well.
(3) What should we as a community do to address the filterbubble issue? To adjust the trade-off between diversity andfitness of information, a system should consider users’ im-mediate needs as well as their long-term needs. Instead ofselecting individual items separately, a recommendation listor portfolio should be optimized as a whole.
2.2 The Neutrality in RecommendationThe absence of the absolutely neutral viewpoint is pointedout in the above panel. We here more formally discuss thispoint based on the ugly duckling theorem.
The ugly duckling theorem is a classical theorem in patternrecognition literature that asserts the impossibility of classi-
2http://www.google.com
9

fication without weighing certain features or aspects of ob-jects against the others [26]. Consider a case that n duck-lings are represented by at least log2 n binary features, forexample, black feathers or a fat body, and are classified intopositive or negative classes based on these features. If thepositive class is represented by Boolean functions of binaryfeatures, it is easy to prove that the number of possible func-tions that classify an arbitrary pair of ducklings into a pos-itive class is 2n−2, even if choosing any pairs of ducklings.Provided that the similarity between a pair of ducklings ismeasured by the number of functions that classify them intothe same class, the similarity between an ugly duckling andan arbitrary normal duckling is equal to the similarity be-tween any pair of ducklings. In other words, an ugly ducklinglooks like a normal duckling.
Why is an ugly duckling ugly? As described above, an uglyduckling is as ugly as a normal duckling, if all features andfunctions are treated equally. The attention to an arbitraryfeature such as black feathers makes an ugly duckling ugly.When we classify something, we of necessity pay attentionto certain features, aspects, or viewpoints of classified ob-jects. Because recommendation is considered as a task toclassify items into a relevant class or an irrelevant one, cer-tain features or viewpoints must be inevitably weighed whenmaking recommendation. Consequently, the absolutely neu-tral recommendation is intrinsically impossible.
We propose a neutral recommendation task other than theabsolutely neutral recommendation. Recalling the ugly duck-ling theorem, we must focus on certain features or view-points in classification. This fact indicates that it is feasi-ble to make a recommendation that is neutral from a spe-cific viewpoint instead of all viewpoints. We hence advocatean Information Neutral Recommender System that enhancesthe neutrality in recommendation from the viewpoint speci-fied by a user. In the case of Pariser’s Facebook example, asystem enhances the neutrality so that recommended friendsare conservative or progressive, but the system is allowed tomake biased decisions in terms of the other viewpoints, forexample, the birthplace or age of friends.
3. AN INFORMATION NEUTRALRECOMMENDER SYSTEM
In this section, we formalize a task of information neutralrecommendation and show a solution algorithm for this task.
3.1 Task FormalizationIn [8], recommendation tasks are classified into Recommend-ing Good Items that meet a user’s interest, Optimizing Util-ity of users, and Predicting Ratings of items for a user.Among these tasks, we here concentrate on the task of pre-dicting ratings.
We formalize an information neutral variant of a predictingratings task. x ∈ 1, . . . , n and y ∈ 1, . . . ,m denote auser and an item, respectively. An event (x, y) is a pair ofa specific user x and a specific item y. Here, s denotes arating value of y as given by x. We here assume that thedomain of ratings is real values, though domain of ratingsis commonly a set of discrete values, e.g., 1, . . . , 5. Thesevariables are common for an original predicting ratings task.
To treat the information neutrality in recommendation, weadditionally introduce a viewpoint variable, v, which indi-cates a viewpoint neutrality from which is enhanced. Thisvariable is specified by a user, and its value depends on anevent. Possible examples of a viewpoint variable are a user’sgender, which depends on a user part of an event, movie’srelease year, which depends on an item’s part of an event,and a timestamp when a user rates an item, which dependson both elements in an event. In this paper, we restrict thedomain of a viewpoint variable to a binary type, 0, 1, but itis easy to extend to a multinomial case. An example con-sists of an event, (x, y), a rating value for the event, s, anda viewpoint value for the event, v. A training set is a set ofN examples, D = (xi, yi, si, vi), i = 1, . . . , N .
Given a new event, (x, y), and its corresponding viewpointvalue, v, a rating prediction function, s(x, y, v), predicts arating value of an item y by a user x. While this ratingprediction function is estimated in our task setting, a lossfunction, loss(s∗, s), and a neutrality function, neutral(s, v),are given as task inputs. A loss function represents the dis-similarity between a true rating value, s∗, and a predictedrating value, s. A neutrality function quantifies the degreeof the neutrality of a rating value from a viewpoint expressedby a viewpoint variable. Given a training set, D, a goal ofan information neutral recommendation (predicting ratingcase) is to acquire a rating prediction function, s(x, y, t), sothat the expected value of a loss function is as small as pos-sible and the expected value of a neutral function is as largeas possible over (x, y, v). We formulate this goal by finding arating prediction function, s, so as to minimize the followingobjective function:
loss(s∗, s(x, y, v))− η neutral(s(x, y, v), v), (1)
where η > 0 is a parameter to balance between the loss andthe neutrality.
3.2 A Prediction ModelIn this paper, we adopt a latent factor model for predictingratings. This latent factor model, which is a kind of a matrixdecomposition model, is defined as equation (3) in [12], asfollows:
s(x, y) = µ+ bx + cy + pxq>y , (2)
where µ, bx, and cy are global, per user, and per item biasparameters, respectively, and px and qy are K-dimensionalparameter vectors, which represent the cross effects betweenusers and items. We adopt a squared loss as a loss function.As a result, parameters of a rating prediction function canbe estimated by minimizing the following objective function:∑
(xi,yi,si)∈D
(si − s(xi, yi))2 + λR, (3)
where R represents an L2 regularizer for parameters bx, cy,px, and qy, and λ is a regularization parameter. Once welearned the parameters of a rating prediction function, wecan predict a rating value for any event by applying equa-tion (2).
We then extend this model to enhance the information neu-trality. First, we modify the model of equation (2) so as todepend on the value of a viewpoint variable, v. For each
value of v, 0 and 1, we prepare a parameter set, µ(v), b(v)x ,
10

c(v)y , p
(v)x , and q
(v)y . One of parameter sets is chosen accord-
ing as a value of v, and we get a rating prediction function:
s(x, y, v) = µ(v) + b(v)x + c(v)y + p(v)x q(v)
y
>. (4)
We next define a neutrality function to quantify the degreeof the information neutrality from a viewpoint variable, v.In this paper, we borrow an idea from [11] and quantify thedegree of the information neutrality by negative mutual in-formation under the assumption that neutrality is regardedas statistical independence. A neutrality function is definedas:
−I(s; v) =∑
v∈0,1
∫Pr[s, v] log
Pr[s|v]
Pr[s]ds
=∑
v∈0,1
Pr[v]
∫Pr[s|v] log
Pr[s|v]
Pr[s]ds. (5)
The marginalization over v is then replaced with the samplemean over a training set, D, and we get
1
N
∑(v)∈D
∫Pr[s|v] log
Pr[s|v]
Pr[s]ds. (6)
Note that Pr[s] can be calculated by∑
v Pr[s|v] Pr[v], andwe use a sample mass function as Pr[v].
Now, all that we have to do is to compute distributionPr[s|v], but this computation is difficult. This is becausea value of a function s is not probabilistic but rather de-terministic depending on x, y, and v; and thus distributionPr[s|x, y, v] has a form of collection of Dirac’s delta func-tions, δ(s(x, y, v)). Pr[s|v] can be obtained by marginalizingthis distribution over x and y. As a result, Pr[s|v] also be-comes a hyper function like Pr[s|x, y, v], and it is not easy tomanipulate. We therefore introduce a histogram model torepresent Pr[s|v]. Values of predicted ratings, s, are dividedinto bins, because sample ratings are generally discrete. Thedistribution Pr[s|v] is expressed by a histogram model. By
replacing Pr[s|v] with Pr[s|v], equation (6) becomes
1
N
∑(v)∈D
∑s∈Bin
Pr[s|v] logPr[s|v]
Pr[s], (7)
where Bin denotes a set of bins of a histogram. Note thatbecause a distribution function, Pr[s|v], is replaced with a
probability mass function, Pr[s|v], an integration over s isreplaced with the summation over bins.
By substituting equations (4) and (7) into equation (1) andadopting a squared loss function as in the original latent fac-tor case, we obtain an objective function of an informationneutral recommendation model:
L(D) =∑
(xi,yi,si,vi)∈D
(si−s(xi, yi, vi))2+η I(s; v)+λR, (8)
where a regularization term, R, is a sum of L2 regularizersof parameter sets for each value of v. Model parameters,
µ(v), b(v)x , c
(v)y ,p
(v)x ,q
(v)y , v ∈ 0, 1, are estimated so as to
minimize this objective function. However, it is very diffi-cult to derive an analytical form of gradients of this objectivefunction, because the histogram transformation used for ex-pressing Pr[s|v] is too complicated. We therefore adopt the
Powell optimization method, because it can be applied with-out computing gradients.
4. EXPERIMENTSWe implemented our information neutral recommender sys-tem in the previous section and applied it to a benchmarkdata set.
4.1 A Data SetWe used a Movielens 100k data set [7] in our experiments.As described in section 3.2, we adopted the Powell methodfor optimizing an objective function. Unfortunately, thismethod is too slow to apply to a large data set, because thenumber of evaluation times of an objective function becomesvery large to avoid the computation of gradients. Therefore,we shrank the Movielens data set by extracting events whoseuser ID and item ID were less than or equal to 200 and 300,respectively. This shrunken data set contained 9,409 events,200 users, and 300 items.
We tested the following two types of viewpoint variable. Thefirst type of variable, Year, represents whether a movie’s re-lease year is newer than 1990, which depends on an itempart of an event. In [12], Koren reported that the oldermovies have a tendency to be rated higher, perhaps becauseonly masterpieces have survived. When adopting Year as aviewpoint variable, our recommender enhances the neutral-ity from this masterpiece bias. The second type of variable,Gender, represents the user’s gender, which depends on theuser part of an event. The movie rating would depend on theuser’s gender, and our recommender enhances the neutralityfrom this factor.
4.2 Experimental ConditionsWe used the implementation of the Powell method in theSciPy package [22] as an optimizer for an objective func-tion (8). To initialize parameter, events in a training set, D,were first divided into two sets according to their viewpointvalues. For each value of a viewpoint variable, parametersare initialized by minimizing an objective function of an orig-inal latent factor model (equation (3)). For the conveniencein implementation, a loss term of an objective was scaled bydividing it by the number of training examples, and an L2
regularizer was scaled by dividing it by the number of pa-rameters. We use a regularization parameter λ = 0.01 andthe number of latent factors, K = 1, which are the lengthsof vectors p(v) or q(v). Because the original rating values are1, 2, . . . , 5, we adopted five bins whose centers are 1, 2, . . . , 5,in equation (7). We performed a five-fold cross-validationprocedure to obtain evaluation indices of the prediction ac-curacy and the neutrality from a viewpoint variable.
4.3 Experimental ResultsExperimental results are shown in Figure 1. Figure 1(a)shows the changes of prediction errors measured by a meanabsolute error (MAE) index. The smaller value of this indexindicates better prediction accuracy. Figure 1(b) shows thechanges of the mutual information between predicted rat-ings and viewpoint values. The smaller mutual informationindicates a higher level of neutrality. Mutual information isnormalized into the range [0, 1] by the method of employingthe geometrical mean in [24]. Note that distribution Pr[s|v]
11

YearGender
0.80
0.85
0.90
0 10 20 30 40 50 60 70 80 90 100
YearGender
0.005
0.010
0.050
0 10 20 30 40 50 60 70 80 90 100
(a) mean absolute error (MAE) (b) normalized mutual information (NMI)
Figure 1: Changes of the degrees of neutrality accompanying the increase of a neutrality parameter
NOTE : Figure 1(a) shows the changes of prediction errors measured by a mean absolute error (MAE) index. The smallervalue of this index indicates better prediction accuracy. Figure 1(b) shows the changes of the mutual information betweenpredicted ratings and viewpoint values. The smaller mutual information indicates a higher level of neutrality. The X-axesof these figures represent parameter values of η. Dashed lines and dotted lines show the results using Year and Gender asviewpoint variables, respectively.
is required to compute this mutual information, and we usedthe same histogram model as in equation (7). The X-axes ofthese figures represent parameter values of η, which balancethe prediction accuracy and the neutrality. These param-eters were changed from 0, at which the neutrality termwas completely ignored, to 100, at which the neutrality washighly emphasized. Dashed lines and dotted lines show theresults using Year and Gender as viewpoint variables, respec-tively.
MAE was 0.90, when offering a mean score, 3.74, for allusers and all items. In Figure 1(a), MAEs were better thanthis baseline, which is perfectly neutral from all viewpoints.Furthermore, the increase of MAEs as the neutrality param-eter, η, was not so serious. Turning to the Figure 1(b), thisdemonstrates that the neutrality is enhanced as the neutral-ity parameter, η, increases from both viewpoints, Year andGender. By drawing attention to the fact that the Y-axis islogarithmic, we can conclude that an information neutral-ity term is highly effective. In summary, our informationneutral recommender system successfully enhanced the neu-trality without seriously sacrificing the prediction accuracy.
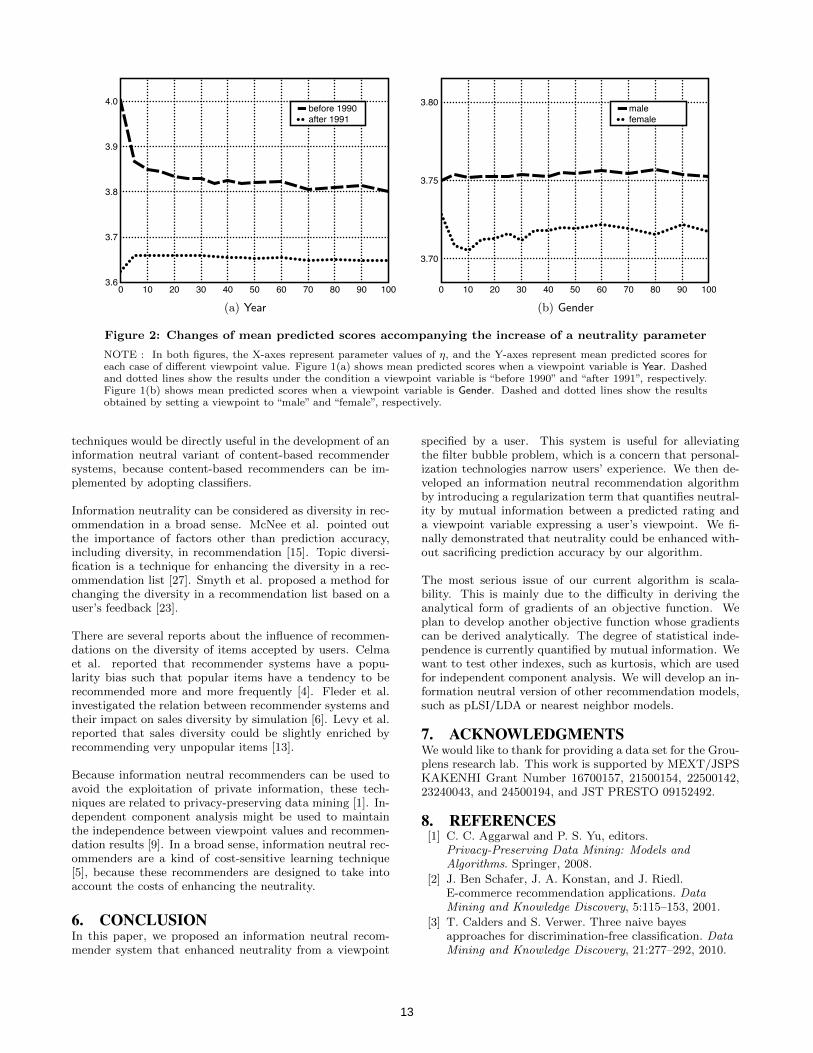
Figure 2 shows the changes of mean predicted scores. Inboth figures, the X-axes represent parameter values of η,and the Y-axes represent mean predicted scores for eachcase of using different viewpoint value. Figure 1(a) showsmean predicted scores when a viewpoint variable is Year.Dashed and dotted lines show the results under the condi-tion a viewpoint variable is “before 1990” and “after 1991”,respectively. Figure 1(b) shows mean predicted scores whena viewpoint variable is Gender. Dashed and dotted linesshow the results obtained by setting a viewpoint to “male”and “female”, respectively.
We first discuss a case that a viewpoint variable is Year. Ac-cording to Figure 1(b), neutrality was drastically improved
in the interval that η is between 0 and 10. By observingthe corresponding interval in Figure 2, two lines that wereobtained for different viewpoints became close each other.This means that prediction scores become less affected bya viewpoint value, and this corresponds the improvementof neutrality. After this range, the decrease of NMI becamesmaller in Figure 1(b), and the lines in the corresponding in-terval in Figure 2 were nearly parallel. This indicated thatthe difference between two score sequences less changes, andthe improvement in neutrality did too. We move on to a Gen-der case. By comparing the changes of NMI between Yearand Gender cases in Figure 1(b), the decrease of NMI in aGender case was much smaller than that of a Year case. Thisphenomenon could be confirmed by the fact that two lineswere nearly parallel in Figure 2(b). This is probably becausethe score differences in a Gender case are much smaller thanthose in a Year at the point η = 0, and there is less marginfor improvement. Further investigation will be required inthis point.
5. RELATED WORKTo enhance the neutrality, we borrowed an idea from ourprevious work [11], which is an analysis technique for fair-ness/discrimination-aware mining. Fairness/discrimination-aware mining is a general term for mining techniques de-signed so that sensitive information does not influence min-ing results. In [18], Pedreschi et al. first advocated suchmining techniques, which emphasized the unfairness in as-sociation rules whose consequents include serious determina-tions. Like this work, a few techniques for detecting unfairtreatments in mining results have been proposed [14, 25].These techniques might be useful for detecting biases in rec-ommendation.
Another type of fairness-aware mining technique focuses onclassification designed so that the influence of sensitive in-formation to classification results is reduced [11, 3, 10] These
12
before 1990after 1991
3.6
3.7
3.8
3.9
4.0
0 10 20 30 40 50 60 70 80 90 100
malefemale
3.70
3.75
3.80
0 10 20 30 40 50 60 70 80 90 100
(a) Year (b) Gender
Figure 2: Changes of mean predicted scores accompanying the increase of a neutrality parameter
NOTE : In both figures, the X-axes represent parameter values of η, and the Y-axes represent mean predicted scores foreach case of different viewpoint value. Figure 1(a) shows mean predicted scores when a viewpoint variable is Year. Dashedand dotted lines show the results under the condition a viewpoint variable is “before 1990” and “after 1991”, respectively.Figure 1(b) shows mean predicted scores when a viewpoint variable is Gender. Dashed and dotted lines show the resultsobtained by setting a viewpoint to “male” and “female”, respectively.
techniques would be directly useful in the development of aninformation neutral variant of content-based recommendersystems, because content-based recommenders can be im-plemented by adopting classifiers.
Information neutrality can be considered as diversity in rec-ommendation in a broad sense. McNee et al. pointed outthe importance of factors other than prediction accuracy,including diversity, in recommendation [15]. Topic diversi-fication is a technique for enhancing the diversity in a rec-ommendation list [27]. Smyth et al. proposed a method forchanging the diversity in a recommendation list based on auser’s feedback [23].
There are several reports about the influence of recommen-dations on the diversity of items accepted by users. Celmaet al. reported that recommender systems have a popu-larity bias such that popular items have a tendency to berecommended more and more frequently [4]. Fleder et al.investigated the relation between recommender systems andtheir impact on sales diversity by simulation [6]. Levy et al.reported that sales diversity could be slightly enriched byrecommending very unpopular items [13].
Because information neutral recommenders can be used toavoid the exploitation of private information, these tech-niques are related to privacy-preserving data mining [1]. In-dependent component analysis might be used to maintainthe independence between viewpoint values and recommen-dation results [9]. In a broad sense, information neutral rec-ommenders are a kind of cost-sensitive learning technique[5], because these recommenders are designed to take intoaccount the costs of enhancing the neutrality.
6. CONCLUSIONIn this paper, we proposed an information neutral recom-mender system that enhanced neutrality from a viewpoint
specified by a user. This system is useful for alleviatingthe filter bubble problem, which is a concern that personal-ization technologies narrow users’ experience. We then de-veloped an information neutral recommendation algorithmby introducing a regularization term that quantifies neutral-ity by mutual information between a predicted rating anda viewpoint variable expressing a user’s viewpoint. We fi-nally demonstrated that neutrality could be enhanced with-out sacrificing prediction accuracy by our algorithm.
The most serious issue of our current algorithm is scala-bility. This is mainly due to the difficulty in deriving theanalytical form of gradients of an objective function. Weplan to develop another objective function whose gradientscan be derived analytically. The degree of statistical inde-pendence is currently quantified by mutual information. Wewant to test other indexes, such as kurtosis, which are usedfor independent component analysis. We will develop an in-formation neutral version of other recommendation models,such as pLSI/LDA or nearest neighbor models.
7. ACKNOWLEDGMENTSWe would like to thank for providing a data set for the Grou-plens research lab. This work is supported by MEXT/JSPSKAKENHI Grant Number 16700157, 21500154, 22500142,23240043, and 24500194, and JST PRESTO 09152492.
8. REFERENCES[1] C. C. Aggarwal and P. S. Yu, editors.
Privacy-Preserving Data Mining: Models andAlgorithms. Springer, 2008.
[2] J. Ben Schafer, J. A. Konstan, and J. Riedl.E-commerce recommendation applications. DataMining and Knowledge Discovery, 5:115–153, 2001.
[3] T. Calders and S. Verwer. Three naive bayesapproaches for discrimination-free classification. DataMining and Knowledge Discovery, 21:277–292, 2010.
13

[4] O. Celma and P. Cano. From hits to niches?: or howpopular artists can bias music recommendation anddiscovery. In Proc. of the 2nd KDD Workshop onLarge-Scale Recommender Systems and the NetflixPrize Competition, 2008.
[5] C. Elkan. The foundations of cost-sensitive learning.In Proc. of the 17th Int’l Joint Conf. on ArtificialIntelligence, pages 973–978, 2001.
[6] D. Fleder and K. Hosanagar. Recommender systemsand their impact on sales diversity. In ACMConference on Electronic Commerce, pages 192–199,2007.
[7] Grouplens research lab, university of minnesota.〈http://www.grouplens.org/〉.
[8] A. Gunawardana and G. Shani. A survey of accuracyevaluation metrics of recommendation tasks. Journalof Machine Learning Research, 10:2935–2962, 2009.
[9] A. Hyvarinen, J. Karhunen, and E. Oja. IndependentComponent Analysis. Wiley-Interscience, 2001.
[10] F. Kamiran, T. Calders, and M. Pechenizkiy.Discrimination aware decision tree learning. In Proc.of the 10th IEEE Int’l Conf. on Data Mining, pages869–874, 2010.
[11] T. Kamishima, S. Akaho, and J. Sakuma.Fairness-aware learning through regularizationapproach. In Proc. of The 3rd IEEE Int’l Workshop onPrivacy Aspects of Data Mining, pages 643–650, 2011.
[12] Y. Koren. Collaborative filtering with temporaldynamics. In Proc. of the 15th Int’l Conf. onKnowledge Discovery and Data Mining, pages447–455, 2009.
[13] M. Levy and K. Bosteels. Music recommendation andthe long tail. In WOMRAD 2010: Recsys 2010Workshop on Music Recommendation and Discovery,2010.
[14] B. T. Luong, S. Ruggieri, and F. Turini. k-NN as animplementation of situation testing for discriminationdiscovery and prevention. In Proc. of the 17th Int’lConf. on Knowledge Discovery and Data Mining,pages 502–510, 2011.
[15] S. M. McNee, J. Riedl, and J. A. Konstan. Accurate isnot always good: How accuracy metrics have hurtrecommender systems. In Proc. of the SIGCHI Conf.on Human Factors in Computing Systems, pages1097–1101, 2006.
[16] E. Pariser. The filter bubble.〈http://www.thefilterbubble.com/〉.
[17] E. Pariser. The Filter Bubble: What The Internet IsHiding From You. Viking, 2011.
[18] D. Pedreschi, S. Ruggieri, and F. Turini.Discrimination-aware data mining. In Proc. of the14th Int’l Conf. on Knowledge Discovery and DataMining, 2008.
[19] P. Resnick, N. Iacovou, M. Suchak, P. Bergstrom, andJ. Riedl. GroupLens: An open architecture forcollaborative filtering of Netnews. In Proc. of theConf. on Computer Supported Cooperative Work,pages 175–186, 1994.
[20] P. Resnick, J. Konstan, and A. Jameson. Panel on thefilter bubble. The 5th ACM conference onRecommender systems, 2011.
〈http://acmrecsys.wordpress.com/2011/10/25/panel-on-the-filter-bubble/〉.
[21] P. Resnick and H. R. Varian. Recommender systems.Communications of The ACM, 40(3):56–58, 1997.
[22] Scipy.org. 〈http://www.scipy.org/〉.[23] B. Smyth and L. McGinty. The power of suggestion.
In Proc. of the 18th Int’l Joint Conf. on ArtificialIntelligence, pages 127–132, 2003.
[24] A. Strehl and J. Ghosh. Cluster ensembles — aknowledge reuse framework for combining multiplepartitions. Journal of Machine Learning Research,3:583–617, 2002.
[25] I. Zliobaite, F. Kamiran, and T. Calders. Handlingconditional discrimination. In Proc. of the 11th IEEEInt’l Conf. on Data Mining, 2011.
[26] S. Watanabe. Knowing and Guessing – QuantitativeStudy of Inference and Information. John Wiley &Sons, 1969.
[27] C.-N. Ziegler, S. M. McNee, J. A. Konstan, andG. Lausen. Improving recommendation lists throughtopic diversification. In Proc. of the 14th Int’l Conf.on World Wide Web, pages 22–32, 2005.
14

The Effect of Sensitivity Analysis on the Usage ofRecommender Systems
Martina MaidaVienna University of
Economics and BusinessAugasse 2-61090 Vienna
Konradin MaierVienna University of
Economics and BusinessAugasse 2-61090 Vienna
Nikolaus ObwegeserVienna University of
Economics and BusinessAugasse 2-61090 Vienna
[email protected] Stix
Vienna University of Economics and BusinessAugasse 2-61090 Vienna
ABSTRACTRecommender systems have become a valuable tool for suc-cessful e-commerce. The quality of their recommendationsdepends heavily on how precisely consumers are able to statetheir preferences. However, empirical evidence has shownthat the preference construction process is highly affectedby uncertainties. This has a negative impact on the robust-ness of recommendations. If users perceive a lack of accu-racy in the recommendation of recommender systems, thisreduces their confidence in the recommendation generatingprocess. This in turn negatively influences the adoption ofrecommender systems. We argue in this paper that sensi-tivity analysis is able to overcome this problem. Althoughsensitivity analysis has already been well studied, it was ig-nored to a large extent in the field of recommender systems.To close this gap, we propose a research model that showshow a sensitivity analysis and the presence of uncertaintiesinfluence decision confidence and the intention to use rec-ommender systems.
Categories and Subject DescriptorsH.3.3 [Information Search and Retrieval]; J.4 [Socialand Behavioral Sciences]
General TermsTheory, Human Factors
KeywordsRecommender systems, sensitivity analysis, uncertainties inpreference construction, technology acceptance
Paper presented at the 2012 Decisions@RecSys workshop in conjunc-tion with the 6th ACM conference on Recommender Systems. Copyrightc©2012 for the individual papers by the papers’ authors. Copying permit-
ted for private and academic purposes. This volume is published and copy-righted by its editors.
1. INTRODUCTIONRecommender systems (RS) have become an important
tool for successful e-commerce. They help consumers in e-commerce settings to overcome the problem of informationoverload, which they often face due to the vast amount ofavailable products and of product-related information. Froma consumers-perspective, the main task of RS is to supportfinding the right product. Independent from technical con-siderations, all RS have in common that they require infor-mation about their users in order to provide personalizedrecommendations. This information is basically the con-sumers’ preferences which serve as input for the recommen-dation-generating algorithm [24]. Thus, the users’ prefer-ences are clearly of high importance for the quality of theRS’ output and the more precise the preferences correspondto the user’s “real” needs, the more accurate will be the rec-ommendation of the system.
The problem we want to address here is that the prefer-ences of consumers as well as their measurement are subjectto irreducible arbitrariness [12], which potentially has a neg-ative impact on the quality of a RS’s recommendation andon the adoption of RS. To overcome this problem, we pro-pose to integrate sensitivity analysis into RS. The remain-der of this paper is structured as follows. The next Sectiondescribes the uncertainties related to the measurement ofpreferences and the implications for RS design. Section 3provides a short overview of SA methods and possible waysto address uncertainties as well as similar problems of sup-porting consumers via RS. We will propose a research modelin Section 4 and hypothesize how SA and uncertainties inthe process of generating recommendations are related to RSusage. The planned methodology for testing our hypothesesis presented in Section 5. Finally, we provide a short discus-sion of our model and present further research opportunitiesin Section 6.
2. UNCERTAINTY AND RECOMMENDERSYSTEMS
Humans often face decisions which have to be made basedon beliefs regarding the likelihood of uncertain events likefuture prices of goods or the durability of a product [21].
15

Here, uncertainty refers to a state of incomplete knowledge,which is usually rooted in either the individual’s lack of in-formation or in his limited resources to rationally processthe available information [4, 18].
The latter source of uncertainty - limited information pro-cessing capabilities - is the rationale underlying the idea tosupport consumers in making their decisions by providingpersonalized recommendations. In this sense, it is the func-tion of RS to mitigate the information overload which con-sumers often face in e-commerce settings [16]. As researchin RS deals with bounded rational consumers, it has to ac-knowledge that consumers face uncertainties while makingtheir purchase decisions, even if they are supported by aRS. The origins of uncertainty in a RS-facilitated purchasedecision can be manifold. For example, a consumer mightask himself whether the model underlying the RS is indeedappropriate to support him or whether the complex calcu-lations underlying a recommendation have been solved ac-curately or in a more heuristic way [4]. Another importantsource of uncertainty is the consumer. Often, it is assumedthat decision makers have stable and coherent preferencesand sometimes it is even supposed that they accurately knowthese preferences [9]. However, there is vast empirical evi-dence that these assumptions do not model real world deci-sion makers very well. For example, it is commonly knownthat the answers of a decision maker who is requested toexplicitly state his preferences are at least partly dependenton the framing of the questions and on what response isexpected [22]. These and other empirically observed devi-ations from rationality led to the notion that humans donot have well-defined preferences which can be elicited butthat we construct preferences on the spot, usually by apply-ing some kind of heuristic information processing strategy.Consequently, our preferences are “labile, inconsistent, sub-ject to factors we are unaware of, and not always in our ownbest interests” [9, p.2].
For the effort to support consumers with the help of RSsuch instable preferences pose a serious problem. RS try tosupport consumers by providing personalized recommenda-tions based on the consumer’s preferences. Independent ofhow the RS measures the preferences of the consumer (ei-ther explicitly by asking the consumer or implicitly by ob-serving his behavior), the ad-hoc construction of preferencesimplies that RS have to deal with an uncertain informationbase to make recommendations (cf. [4]), which might lead toinaccurate and therefore unhelpful recommendations. More-over, a consumer who faces a recommendation of a RS mightperceive a state of uncertainty regarding the recommenda-tion’s quality because the choice of the recommendation-generating algorithm, its inputs (the preferences) as well asits computation are afflicted with uncertainties. The work ofLu et al. [10] shows that a major reason for the rejection ofdecision support technologies is that humans are skepticalwhether the respective technology is indeed able to accu-rately model their preferences. In other words, the uncer-tainties related to technologically derived recommendationsmight hamper the adoption of RS. In order to avoid theseproblems, RS have to address the uncertainties related tothe generation of recommendations. Here, we propose toincorporate SA into RS to overcome this challenge.
3. SENSITIVITY ANALYSISSensitivity analysis is a widely used tool in various disci-
plines, like in chemical engineering, operations research ormanagement science [20]. According to French [5], a com-mon definition of SA involves the variation of input variablesto examine their effect on the output variables. In the caseof RS, inputs refer to preferences of consumers and out-put means the recommendation of the system. Thus, SAis a valuable tool for detecting uncertainties in inputs, ver-ification and validation of models as well as demonstratingthe robustness of outputs. Definition and purpose howevervary depending on the field of application [15]. Furthermore,there are different SA methods. They are classified e.g. inmathematical, statistical and graphical methods [6] or in lo-cal and global SA methods depending if the input variablesare varied over a reduced range of value or over the wholedomain [15]. Both classes allow to vary“one factor at a time”(OAT) or several variables simultaneously (VIC - variationin combination). Some researchers (e.g. [17]) argue that avariance-based, global SA with VIC is especially useful forcomparing input variables and identifying uncertainties.
Although SA is in general a well-studied topic, it is ig-nored to a large extent in the field of RS. Papers that treatSA as tool for decision support systems are typically fromthe field of multi-criteria decision making. They explain forinstance how SA demonstrates robust solutions or illustratesthe impact of input variations [13]. A reason why SA shouldbe integrated in decision support systems is that it addressescertain drawbacks, like a possible lack of transparency. Byconsidering RS, this would mean that consumers do not re-ceive the possibility to understand why a particular productwas recommended. Thus, consumers are not able to detectuncertainties that were introduced during preference elici-tation. As argued by [19, p. 831] “(...) users are not justlooking for blind recommendations from a system, but arealso looking for a justification of the system’s choice.”. Apossibility to provide justifications are explanation facilities.An approach that was found in literature is to regard SA asbeing similar to an explanation facility [14]. It facilitatesthe involvement of users and increases transparency of therecommendation generating process [8]. An integrated SApermits users to interact with the system such that they areable to explore possible variations of the inputs and see howtheir changes influence the robustness of the recommenda-tion. A SA is therefore especially important when uncer-tainties in the inputs are present. In contrast to the varioustypes of explanation facilities, it is based on formal sciencesand is thus capable of providing objective explanations.
4. RESEARCH MODEL AND HYPOTHESESDEVELOPMENT
Based on the descriptions of the problem of uncertain-ties and the characteristics of SA we will derive a researchmodel for RS usage in this Section. In order to understandhow SA is related to the adoption of RS, we integrate sensi-tivity analysis, perceived uncertainty and decision confidencein a common model of RS usage. The definitions of theseconcepts are given in Table 1. Our model builds on technol-ogy acceptance research and its most prominent model, thetechnology acceptance model (TAM) [2]. Figure 1 illustratesthe proposed model. Sensitivity analysis represents the de-sign feature of interest, decision confidence and perceiveduncertainty are used to describe the link between the de-sign feature and RS use in detail. The following paragraphs
16

Figure 1: Proposed research model
separately discuss each proposition of our model.Basically, a SA can lead to two different results: Depend-
ing on inputs and model parameters, it will either confirmor disprove the robustness of the recommendations providedby the RS. Though we acknowledge that the output of aSA depends on the specific situation and that the concreteoutcome of the SA is likely to influence the user’s percep-tions, we argue that there is also an effect which is indepen-dent from such contingencies (see also Section 6). SA helpsusers to filter out those recommendations which are robustto uncertainties and which thereby represent good choicesindependent from changes in the inputs [12]. Therefore, wehypothesize that
H1: Sensitivity analysis will increase users’ de-cision confidence.
The only task which RS perform is to search and suggestdecision alternatives on behalf of their users. If a user isnot sure whether a RS provides recommendations whichmatch his needs or not, the only reason to use a RS van-ishes. Therefore, we hypothesize that
H2: Decision confidence will positively affect per-ceived usefulness of recommender systems.
SA is a tool which demonstrates how the output varies wheninputs are changed. This enables user not only to analyzedifferent scenarios and to search for robust recommendationsbut also to learn about the RS and how it generates recom-mendations. In this function, SA might be directly relatedto perceived usefulness of the RS regardless of its impact ondecision confidence and independent from whether it con-firms the robustness of the recommendation or not. Basedon this argument and on the experiences of Payne et al. [12]that user perceive SA as a valuable tool, we hypothesize that
H3: Sensitivity analysis will positively influenceperceived usefulness of recommender systems.
We argue that this relationship is moderated by the degreeof perceived uncertainty: Consider a user who does not per-ceive any uncertainty related to the output of a RS. For sucha user a SA is of little to no value. But the more the user per-ceives that the recommendation generating process is proneto uncertainties, the more useful is a feature which allowsto explore the impact of the uncertainties on the outcomes.Therefore, we hypothesize that
H4: Perceived uncertainty will moderate the in-fluence of sensitivity analysis on perceived use-fulness of recommender systems.
Table 1: Definitions of Constructs
Construct Definition
SensitivityAnalysis
A RS feature which allows a user toanalyze how a recommendation (out-put) changes if the preferences (in-puts) are varied [5]
DecisionConfidence
The user’s beliefs that the recommen-dation matches his preferences [7]
PerceivedUncertainty
The user’s subjective probability as-sessment of any presence of inaccu-racy in the recommendation generat-ing process [4]
PerceivedUsefulness
The user’s perceptions of the utility ofthe RS [24]
Intention toUse
The user’s subjective probability ofadopting the RS [3]
The relationship between perceived uncertainty and decisionconfidence is similar to H4. If users perceive that a recom-mendation is based on an uncertain information base or ifthey are not sure about the appropriateness of the recom-mendation generating algorithm, they are likely not confi-dent about the quality of the recommendation. Therefore,we hypothesize that
H5: Perceived uncertainty will negatively influ-ence decision confidence.
5. PROPOSED METHODOLOGYWe will conduct a laboratory experiment to test our hy-
potheses. We will use a 2 x 2 full factorial design with SAand perceived uncertainty as independent variables. Partic-ipants will be asked to use a RS for online shopping whichexplicitly demands from users to make trade-offs in pref-erence construction. They will be randomly assigned to atreatment group and a control group which allows us to ma-nipulate SA and perceived uncertainty. We will choose pur-chase decisions with low/high familiarity to induce high/lowlevels of perceived uncertainty. After finishing the shoppingtask, questionnaires will be delivered to the participants toassess the proposed relationships.
Before we are actually able to conduct the experiment,we will develop new measures for the constructs perceiveduncertainty and decision confidence by adopting the methodof Moore and Benbasat [11] for instrument development.The validity and reliability of the items will be tested bya factor analysis in a pilot test. Items for the remainingconstructs will be taken from already validated scales, forinstance from Davis [2] for perceived usefulness.
To test our experimental design, we will conduct a t-testin order to check the manipulation of perceived uncertaintyvia familiarity of the purchase task. For testing our hypothe-ses we will use structural equation modeling (SEM). As ourstudy is the first one regarding the impact of SA and un-certainty on RS usage, it has an exploratory character. Tomanage the risks associated with exploratory research, wewill keep the sample size rather low (about 10 participantsper indicator [1]). To deal with the small sample size and the
17

exploratory character of our research, we will use a partialleast squares approach (component-based SEM) [23].
6. DISCUSSION AND CONCLUSIONSBased on a literature review, we have argued that the pro-
cess of generating recommendations for e-commerce users in-volves uncertainties, especially regarding the measurementof preferences, which might lead to users who feel insecureabout the quality of a RS’s recommendations. Moreover, wehypothesized that if users do not feel confident about a RS’srecommendations, they will not perceive RS as useful andthus are less likely to adopt the RS. We proposed to incorpo-rate SA into RS to overcome the problems associated withuncertainties. SA is a tool which enables users to explorehow changes in the inputs of the recommendation generat-ing process (the users’ preferences) are related to changes inthe output of the process (the recommendations). SA canbe used to check the robustness of recommendations whichshould help users to build confidence in the system’s adviceand the decision. Finally, we proposed a conceptual modeland corresponding hypotheses of how uncertainties, decisionconfidence and SA are related to the adoption of RS.
As outlined in Section 5 our next step is the empiricaltesting of the proposed model by conducting a laboratoryexperiment. Further research opportunities include theoret-ical work on how SA can be incorporated into the variousforms of RS, not only on computational level but also on thelevel of user interface design and how the outcomes of SAare related to user perceptions.
7. ACKNOWLEDGMENTSThis research has been funded by the Austrian Science
Fund (FWF): project number TRP 111-G11.
8. REFERENCES[1] J. Christopher Westland. Lower bounds on sample size
in structural equation modeling. Electronic CommerceResearch and Applications, 9(6):476–487, 2010.
[2] F. Davis. Perceived usefulness, perceived ease of use,and user acceptance of information technology. MISQuarterly, 13(3):319–340, 1989.
[3] M. Fishbein and I. Ajzen. Belief, attitude, intention,and behavior: an introduction to theory and research.Addison Wesley Publishing Company, 1975.
[4] S. French. Uncertainty and imprecision: modelling andanalysis. The Journal of the Operational ResearchSociety, 46(1):70–79, 1995.
[5] S. French. Modelling, making inferences and makingdecisions: the roles of sensitivity analysis. Top,11(2):229–251, 2003.
[6] H. Frey and S. Patil. Identification and review ofsensitivity analysis methods. Risk Analysis,22(3):553–578, 2002.
[7] D. Griffin and A. Tversky. The weighing of evidenceand the determinants of confidence. CognitivePsychology, 24(3):411–435, 1992.
[8] J. Herlocker, J. Konstan, and J. Riedl. Explainingcollaborative filtering recommendations. InProceedings of the 2000 ACM conference on Computersupported cooperative work, pages 241–250. ACM,2000.
[9] S. Lichtenstein and P. Slovic. The construction ofpreference: an overview. In The construction ofpreference, Lichtenstein, S. and Slovic, P. (Eds.),pages 1–40. Cambridge University Press, 2006.
[10] H. Lu, H. Yu, and S. Lu. The effects of cognitive styleand model type on dss acceptance: An empiricalstudy. European Journal of Operational Research,131(3):649–663, 2001.
[11] G. Moore and I. Benbasat. Development of aninstrument to measure the perceptions of adopting aninformation technology innovation. Informationsystems research, 2(3):192–222, 1991.
[12] J. Payne, J. Bettman, and D. Schkade. Measuringconstructed preferences: Towards a building code.Journal of Risk and Uncertainty, 19(1–3):243–270,1999.
[13] L. Proll, A. Salhi, and D. Rios Insua. Improving anoptimization-based framework for sensitivity analysisin multi-criteria decision-making. Journal ofMulti-Criteria Decision Analysis, 10(1):1–9, 2001.
[14] W. Raskob, F. Gering, and V. Bertsch. Approaches tovisualisation of uncertainties to decision makers in anoperational decision support system. In Proceedings ofthe 6th International ISCRAM Conference, pagehttp://www.iscram.org/ISCRAM2009/papers/, 2009.
[15] A. Saltelli, K. Chan, and E. Scott. Sensitivity analysis.John Wiley, New York, 2000.
[16] J. Schafer, J. Konstan, and J. Riedl. E-commercerecommendation applications. Data mining andknowledge discovery, 5(1):115–153, 2001.
[17] K. Siebertz, D. Van Bebber, and T. Hochkirchen.Statistische Versuchsplanung: Design of Experiments(DoE). Springer Verlag, 2010.
[18] H. Simon. A behavioural model of rational choice, In:Models of Man: Social and Rational. John Wiley, NewYork, 1957.
[19] R. Sinha and K. Swearingen. The role of transparencyin recommender systems. In CHI’02 extended abstractson Human factors in computing systems, pages830–831. ACM, 2002.
[20] E. Triantaphyllou and A. Sanchez. A sensitivityanalysis approach for some deterministic multi-criteriadecision-making methods*. Decision Sciences,28(1):151–194, 1997.
[21] A. Tversky and D. Kahneman. Judgment underuncertainty: Heuristics and biases. science,185(4157):1124–1131, 1974.
[22] A. Tversky and D. Kahneman. The framing ofdecisions and the psychology of choice. Science,211(4481):453–458, 1981.
[23] N. Urbach and F. Ahlemann. Structural equationmodeling in information systems research using partialleast squares. Journal of Information TechnologyTheory and Application, 11(2):5–40, 2010.
[24] B. Xiao and I. Benbasat. E-commerce productrecommendation agents: Use, characteristics, andimpact. MIS Quarterly, 31(1):137–209, 2007.
18

Recommending Personalized Query Revisions
Henry BlancoFaculty of Computer Science
Free University of BolzanoBolzano, Italy.
Center of Medical BiophysicsUniversity of Oriente
Santiago de Cuba, Cuba.
Francesco RicciFaculty of Computer Science
Free University of BolzanoBolzano, Italy.
Derek BridgeDepartment of Computer
ScienceUniversity College Cork
Cork, [email protected]
ABSTRACTObserving the queries selected by a user, among those sug-gested by a recommender system, one can infer constraintson the user’s utility function, and can avoid suggesting queriesthat retrieve products with an inferior utility, i.e., dominatedqueries. In this paper we propose a new efficient techniquefor the computation of dominated queries. It relies on thesystem’s assumption that the number of possible profiles(or utility functions), of the users it may interact with, isfinite. We show that making query suggestions is simplified,and the number of suggestions is strongly reduced. We alsofound that even if the system is not contemplating the trueuser profile, among the above mentioned finite set of profiles,its performance is still very close to the optimal one.
Categories and Subject DescriptorsH.3.3 [Information Storage and Retrieval]: InformationSearch and Retrieval—information filtering
General TermsExperimentation, Theory.
KeywordsRecommender system, conversational system, user model.
1. INTRODUCTIONConversational recommender systems offer flexible sup-
port to users as they browse a product catalogue, and helpthem to better understand and elicit their preferences. In-stead of requiring users to specify their preferences at theoutset, these are acquired and revised over a series of in-teraction steps. At each step the system makes some rec-ommendations to the user, or invites her to indicate furtherpreferences, e.g., by critiquing a recommendation [6].
In [3, 9] the authors introduce and evaluate a new con-versational technique for helping the users to select items of
Paper presented at the 2012 Decisions@RecSys workshop in conjunc-tion with the 6th ACM conference on Recommender Systems. Copyrightc2012 for the individual papers by the papers’ authors. Copying permit-
ted for private and academic purposes. This volume is published and copy-righted by its editors.
largest utility to the user. In order to accomplish this goal,when a user is querying a product catalogue the proposedtechnique suggests to the user new queries that: a) extendthe user’s current query, and b) retrieve products with higherutility. For example the user of a hotel catalogue may havesubmitted the following query: “I want an hotel with ACand parking”. The system, rather than retrieving immedi-ately the products that satisfy this query, hypothesizes thatthe user may have also other needs and makes recommenda-tions by suggesting queries that are revisions of the originalquery. These new queries may add one or more additionalfeatures to the query, e.g., the system may say: “are youinterested also in a sauna?”. Products with more features,if available, will surely increase (or, at least, not decrease)the user utility. But not all features are equally importantfor the user. So, the system’s goal is to make “informed”suggestions, i.e., to suggest those features that are likely toproduce the largest increase to the user’s utility. In fact,observing the user’s previously submitted queries, the sys-tem can deduce that certain features are more importantthan others, i.e., it can infer constraints on the user’s utilityfunction, even without knowing that function.
The major limitations of the previous work on this pro-posed technique were: a) a limited number of query editingoperations, i.e., the system could suggest only two types ofnew queries to the user (add a feature and trade one featurefor two), b) a computationally expensive method for com-puting the next best queries (undominated queries), c) along list of query suggestions could be possibly presented tothe user, making it hard for her to evaluate them and selecther preferred one. In this paper we propose a new effectivetechnique for the computation of the dominated queries, i.e.,the queries that should not be suggested to the user becausethe system can deduce that they have a lower utility. Theproposed technique relies on the system assumption that theset of profiles (or utility functions) of the users it may inter-act with is finite. This is a meaningful assumption as not allthe possible profiles are likely to ever be observed in prac-tice, and users tend to have similar profiles. We show thatthe computation of the query suggestions is simplified, andmore importantly, the number of queries that are suggestedat each conversational step is greatly reduced. We also showthat the query suggestions can be further filtered by estimat-ing the utility of each query suggestion using those profilesthat are compatible with the queries previously selected bythe user. The proposed approach has also another advan-tage, it enables a system designer to freely select the types
19

of query editing operations that he or she would like to useto generate new query suggestions to the user.
We also show that even if the system is not contemplat-ing the true user profile, among the above mentioned finiteset of profiles, its performance is still very close to the opti-mal one, i.e., at the end of the dialogue the user can selectthe best products, given her true profile and the availableproducts in the data set. Hence the finally recommendeditems are close to the optimal ones. In fact, we show in thispaper that progressively expanding the number of profilescontemplated by the system one can increase the utility ofthe final recommended products, and with a large numberof contemplated profiles the recommended products have autility that is not practically distinguishable from that ofthe best products.
The rest of the paper is structured as follows. The querylanguage used in this approach is described in Section 2.Section 3 describes our model for representing user prefer-ences. Section 4 explains the concept of “dominated query”and our query suggestion method. The experimental designis shown in Section 5. Results and discussion are reportedin Section 6. Finally the related work and conclusions aregiven in Sections 7 and 8 respectively.
2. QUERY LANGUAGEIn our model a product p is represented by an n-dimensional
Boolean feature vector p = (p1, . . . , pn). pi = 1 means thatthe i-th feature (e.g., Air Conditioning) is present in theproduct, whereas pi = 0 means that p does not have fea-ture i. A catalogue is a set of products p(1), . . . , p(k). TheBoolean features could be keywords or tags found in theproduct description, and searching for products with thesefeatures can be viewed as kind of facet search.
Queries are represented similarly as Boolean vectors: q =(q1, . . . , qn). qi = 1 means that the user is interested in prod-ucts that have the i-th feature. On the other hand qi = 0does not mean that the user is not interested in productswith that feature, but simply that she has not yet declaredher interest on it. A query is said to be satisfiable if thereexists a product in the catalogue such that all the featuresexpressed in the query as desired (qi = 1) are present inthat product. For example if the product p = (1, 1, 0, 1, 0)is present in the catalog then query q = (0, 1, 0, 1, 0) is sat-isfiable.
We are considering a scenario where the user is advisedabout how to refine her queries. Moreover, we assume thatthe system GUI offers to the user a limited number of eas-ily understood editing operations (as in critiquing-based ap-proaches). In the following we list the query editing opera-tions that, in this paper, we assume the user can make whenrevising the current query. But we observe (as will be clearin the ensuing description) that the proposed approach isnot constrained by this particular choice.
• add1(q, i), i ∈ idx0(q);• trade1,2(q, i, j, k), i ∈ idx1(q) and j, k ∈ idx0(q);• add2(q, i, j), i, j ∈ idx0(q);• trade1,3(q, i, j, k, t), i ∈ idx1(q) and j, k, t ∈ idx0(q).
Here idx0(q) and idx1(q) are the set of indexes with value0 and 1 in q respectively. The first two operations gener-ate a new query by adding to the current query a requestfor one additional feature. For example, in (1, 1, 0, 0, 1) =
add1((1, 1, 0, 0, 0), 5) the query q = (1, 1, 0, 0, 0) (where thefirst two features are requested) is extended by requestingalso the fifth feature. The second operation (trade one fea-ture present for two not present) generates a new query bydiscarding a feature, the i-th, in favor of two new ones,the j-th and k-th features. For example, (0, 1, 0, 1, 1) =trade1,2((1, 1, 0, 0, 0), 1, 4, 5).
The last two operations extend a query with two addi-tional features. For example, given the query q = (1, 1, 0, 0, 0),the fourth and fifth features can be requested in the newquery generated by the operation add2(q, 4, 5) = (1, 1, 0, 1, 1).The second “trade” operation (trade one feature present forthree not present) generates a new query by discarding thei-th feature, but now in favor of three new ones, the j-th,the k-th and t-th features. For example, (0, 1, 1, 1, 1) =trade1,3((1, 1, 0, 0, 0), 1, 3, 4, 5).
Using the above-mentioned operators the system can gen-erate a set of next queries and ask the user to select her pre-ferred one, and this step can be repeated several times (seeSection 6.1 for an example of such an interaction). However,the goal of the proposed system is not to suggest all thesepossible next queries, as a standard “query by example” in-terface might, but only those that would retrieve productswith the largest utility for the user. Hence, the goal of theproposed system is to make inferences on the true user util-ity function, and remove from the suggestions it makes atevery step those queries that appear to the system to havean inferior utility. This reasoning process is clarified in thefollowing sections.
3. USER UTILITY FUNCTIONA user’s utility function, also called her user profile, is
represented here as a vector of weights: w = (w1, . . . , wn),0 ≤ wi ≤ 1. wi is the importance that the user assigns tothe i-th feature of a product. So if wi = 0, then the userhas no desire for the i-th feature. If wi > wj , then the i-thfeature is preferred to the j-th one. If wi ≥ wj then the i-thfeature is at least as desired as the j-th one. If wi = wj ,i = j then the user is indifferent between these two features.The user’s utility for a particular product p = (p1, . . . , pn)is given by the following:
Utilityw(p) =n
i=1
wipi (1)
A product p with a higher utility than another productp is always assumed to be preferred by the user, i.e., weassume that users are rational. A user may have any of thepossible utility functions that can be defined by varying thefeature weights wi. So, the set of all possible utility functionsis infinite. But observing the queries selected by the useramong those suggested by the system the system can inferconstraints on the definition of the true user utility function.Generally speaking, features that are present in a query thatthe user selects can be inferred to be more desirable for thatuser than features that are present in the alternative queriesthat the user could have tried but did not select.
More precisely let us assume that the system recommendsto the user a set of new queries, which we will call the Ad-viceSet. The queries in the AdviceSet will, in general, be asubset of the queries that can be generated by applying thequery editing operations described in the previous sectionto the query that was selected by the user at the previous
20

interaction step. When the user selects one of these rec-ommended new queries, as the new best query for her, thesystem can deduce that the utility of the one she selects isgreater than or equal to the utility of the other queries thatwere included in the AdviceSet. If we define Utilityw(q), theutility of query q for a user with profile w, as the utility ofa product p with the same definition as q, i.e., q = p, then,if the user selects qs ∈ AdviceSet, we can infer that:
Utilityw(qs) ≥ Utilityw(q), ∀q ∈ AdviceSet. (2)
For example: Let’s assume that the previous query se-lected by the user is q0 = (0, 0, 1, 1, 0, 0, 0), i.e., there areseven features in this data set and the user would like toretrieve products having the third and fourth feature. As-sume that the system suggests that the user edits the currentquery and specifically recommends that she select one of thefollowing four queries:
AdviceSet = (1, 0, 1, 1, 0, 0, 0),(0, 1, 1, 1, 0, 0, 1),
(0, 0, 1, 1, 1, 0, 0),
(0, 0, 1, 0, 0, 1, 1)
Let us further assume that the query that the user selectsfrom these recommended ones is qs = (0, 0, 1, 1, 1, 0, 0), i.e.,she is interested in products that additionally have the 5-th feature. Then, the inferred constraints, based on notchoosing other members of the AdviceSet, are:
1. w5 >= w1
2. w5 >= w2 + w7
3. w4 + w5 >= w6 + w7
We must also explain what constraints on the true userprofile w can be deduced when the user issues the very firstquery in any interaction. In this case, if q is the initialquery, the advisor will infer that wi ≥ wj , ∀i ∈ idx1(q) and∀j ∈ idx0(q), unless qs, which is identical to q except thatits i-th feature is set to 0 and its j-th feature is set to 1,is unsatisfiable. This means that features requested in theinitial query are at least as desired as features not initiallyrequested. But, the system must “play safe”. In the casewhere qs, identical to q but with the i-th feature set to 0and the j-th feature set to 1, is unsatisfiable, it should notdeduce a constraint of the type wi ≥ wj . This is becausethere is the possibility that the user already knew this queryto be unsatisfiable and for this reason she did not try it asher initial query, even though she preferred it. A longerdiscussion of this “play safe” rule is given in [3].
4. THE QUERY ADVISORThe advisor is the recommender system in charge of sug-
gesting to the user how to extend the current query to ob-tain better products, i.e., it generates the AdviceSet. Thetrue user’s preferences, in her profile, are not known by theadvisor. Moreover, we assume that the advisor does not ex-plicitly ask the user for her preferences. Nevertheless, rightafter the user’s first query, the advisor will generate a setof candidate queries and will recommend only the undom-inated candidates, i.e. those with a utility that cannot beproved to be inferior to one of the other candidates. Eachtime the user chooses one of the recommended queries, the
advisor makes new recommendations. It does this repeat-edly until the user is happy with her current query or noadditional suggestions can be made by the system.
At each interaction step, the advisor accumulates con-straints on the true user utility function (as described inSection 3). We denote this set of constraints by Φ. More-over, given a set of next possible queries C = q(1), . . . , q(k),i.e., those that can be generated by applying the operationsdescribed in Section 2, and that are satisfiable, the advisorwill not suggest queries that have a lower utility than an-other one: these queries are called here “dominated”. Aquery q ∈ C is dominated if there exists another queryq ∈ C such that for all the possible weight vectors thatare compatible with the set of constraints Φ this relationholds: Utilityw(q
) > Utilityw(q). A weight vector w is saidto be compatible with the set of constraints in Φ if and onlyif all the constraints in Φ are satisfied when the variablesw1, . . . , wn take the values specified in w.
Removing the dominated queries is meaningful becausetheir utility is lower than the utility of another candidatequery for all the possible user utility functions that are com-patible with the preferences that have been induced by ob-serving the user’s behavior.
In our previous work, the problem of finding dominatedqueries was cast as a linear programming problem, allowingan infinite number of user profiles to be considered. Theproblems with this are discussed in Section 7. In this paperwe assume that the set of user profiles contemplated by thesystem is finite. Initially, at the beginning of the interactionwith a user, the set of all the possible utility functions oruser profiles is P = w(1), . . . , w(m). We will consider in theexperiments sets of user profiles ranging from some dozensto thousands.
With this finite assumption, having the set of deducedconstraints Φ we can prune from the set P the“incompatibleprofiles”, i.e., those not satisfying the constraints in Φ. Then,the computation of the undominated queries proceeds asfollow. Let’s assume that the set of user profiles compatiblewith the accumulated constraints is P = w(1), . . . , w(t) ⊂P and C = q(1), . . . , q(k) is the set of next possible queries,i.e., queries that are satisfiable and are generated from thelast issued query of the user by the query editing operations.Then the AdviceSet is given by the following method:
1. A query q ∈ C is labelled as dominated if and only ifthere exists another query q ∈ C, q = q, such that∀w ∈ P , Utilityw(q
) > Utilityw(q). , i.e.,ni=1 wiq
i >
ni=1 wiqi.
2. Build the AdviceSet (undominated queries) by remov-ing from C the dominated queries.
Example. Assume that Φ = w1 ≥ w3, w2 + w3 ≥ w4,P = w(1), w(2), w(3) and C = q(1), q(2), q(3), q(4),w(1) = (0.35, 0.1, 0.25, 0.3), w(2) = (0.1, 0.35, 0.3, 0.25),w(3) = (0.3, 0.35, 0.1, 0.25), q(1) = (1, 1, 0, 1),q(2) = (1, 0, 1, 1), q(3) = (0, 1, 1, 1), q(4) = (1, 1, 1, 0).
In this example the profiles w(1) and w(3) satisfy the con-straints in Φ. While, w(2) is an “incompatible profile”, sincew(2)
1 < w(2)3 , and must be pruned from P . Table 1 shows
the query utilities for these two compatible profiles. q(1) hasa higher utility than q(3) and q(4) for every profile in P ,thus q(3) and q(4) are dominated by q(1). These dominated
21
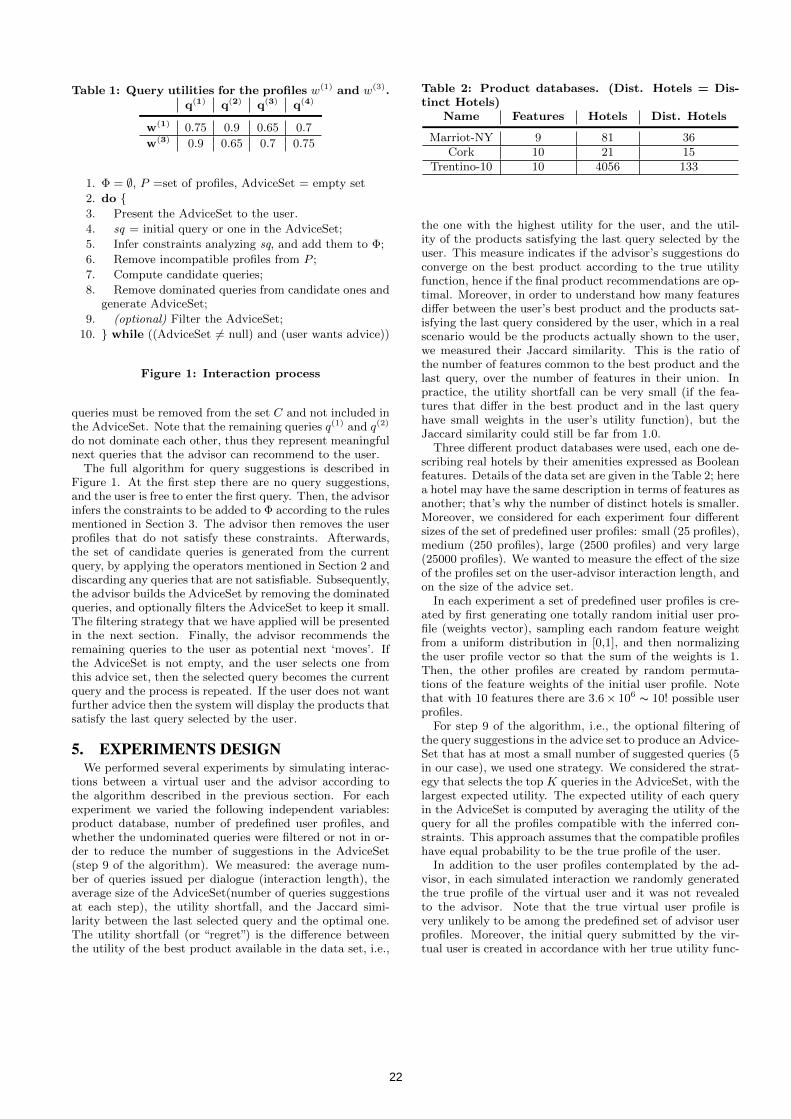
Table 1: Query utilities for the profiles w(1)and w(3)
.
q(1)
q(2)
q(3)
q(4)
w(1) 0.75 0.9 0.65 0.7
w(3) 0.9 0.65 0.7 0.75
1. Φ = ∅, P =set of profiles, AdviceSet = empty set2. do 3. Present the AdviceSet to the user.4. sq = initial query or one in the AdviceSet;5. Infer constraints analyzing sq, and add them to Φ;6. Remove incompatible profiles from P ;7. Compute candidate queries;8. Remove dominated queries from candidate ones and
generate AdviceSet;9. (optional) Filter the AdviceSet;
10. while ((AdviceSet = null) and (user wants advice))
Figure 1: Interaction process
queries must be removed from the set C and not included inthe AdviceSet. Note that the remaining queries q(1) and q(2)
do not dominate each other, thus they represent meaningfulnext queries that the advisor can recommend to the user.
The full algorithm for query suggestions is described inFigure 1. At the first step there are no query suggestions,and the user is free to enter the first query. Then, the advisorinfers the constraints to be added to Φ according to the rulesmentioned in Section 3. The advisor then removes the userprofiles that do not satisfy these constraints. Afterwards,the set of candidate queries is generated from the currentquery, by applying the operators mentioned in Section 2 anddiscarding any queries that are not satisfiable. Subsequently,the advisor builds the AdviceSet by removing the dominatedqueries, and optionally filters the AdviceSet to keep it small.The filtering strategy that we have applied will be presentedin the next section. Finally, the advisor recommends theremaining queries to the user as potential next ‘moves’. Ifthe AdviceSet is not empty, and the user selects one fromthis advice set, then the selected query becomes the currentquery and the process is repeated. If the user does not wantfurther advice then the system will display the products thatsatisfy the last query selected by the user.
5. EXPERIMENTS DESIGNWe performed several experiments by simulating interac-
tions between a virtual user and the advisor according tothe algorithm described in the previous section. For eachexperiment we varied the following independent variables:product database, number of predefined user profiles, andwhether the undominated queries were filtered or not in or-der to reduce the number of suggestions in the AdviceSet(step 9 of the algorithm). We measured: the average num-ber of queries issued per dialogue (interaction length), theaverage size of the AdviceSet(number of queries suggestionsat each step), the utility shortfall, and the Jaccard simi-larity between the last selected query and the optimal one.The utility shortfall (or “regret”) is the difference betweenthe utility of the best product available in the data set, i.e.,
Table 2: Product databases. (Dist. Hotels = Dis-
tinct Hotels)
Name Features Hotels Dist. Hotels
Marriot-NY 9 81 36Cork 10 21 15
Trentino-10 10 4056 133
the one with the highest utility for the user, and the util-ity of the products satisfying the last query selected by theuser. This measure indicates if the advisor’s suggestions doconverge on the best product according to the true utilityfunction, hence if the final product recommendations are op-timal. Moreover, in order to understand how many featuresdiffer between the user’s best product and the products sat-isfying the last query considered by the user, which in a realscenario would be the products actually shown to the user,we measured their Jaccard similarity. This is the ratio ofthe number of features common to the best product and thelast query, over the number of features in their union. Inpractice, the utility shortfall can be very small (if the fea-tures that differ in the best product and in the last queryhave small weights in the user’s utility function), but theJaccard similarity could still be far from 1.0.
Three different product databases were used, each one de-scribing real hotels by their amenities expressed as Booleanfeatures. Details of the data set are given in the Table 2; herea hotel may have the same description in terms of features asanother; that’s why the number of distinct hotels is smaller.Moreover, we considered for each experiment four differentsizes of the set of predefined user profiles: small (25 profiles),medium (250 profiles), large (2500 profiles) and very large(25000 profiles). We wanted to measure the effect of the sizeof the profiles set on the user-advisor interaction length, andon the size of the advice set.
In each experiment a set of predefined user profiles is cre-ated by first generating one totally random initial user pro-file (weights vector), sampling each random feature weightfrom a uniform distribution in [0,1], and then normalizingthe user profile vector so that the sum of the weights is 1.Then, the other profiles are created by random permuta-tions of the feature weights of the initial user profile. Notethat with 10 features there are 3.6× 10⁶ ∼ 10! possible userprofiles.
For step 9 of the algorithm, i.e., the optional filtering ofthe query suggestions in the advice set to produce an Advice-Set that has at most a small number of suggested queries (5in our case), we used one strategy. We considered the strat-egy that selects the top K queries in the AdviceSet, with thelargest expected utility. The expected utility of each queryin the AdviceSet is computed by averaging the utility of thequery for all the profiles compatible with the inferred con-straints. This approach assumes that the compatible profileshave equal probability to be the true profile of the user.
In addition to the user profiles contemplated by the ad-visor, in each simulated interaction we randomly generatedthe true profile of the virtual user and it was not revealedto the advisor. Note that the true virtual user profile isvery unlikely to be among the predefined set of advisor userprofiles. Moreover, the initial query submitted by the vir-tual user is created in accordance with her true utility func-
22

tion; thus, the initial query includes the t most importantfeatures for the user (t = 2 in our experiments). The ad-visor’s deductions about the true user utility function arebased only on the observation of the queries submitted bythe user at each interaction step. We also assumed that thevirtual user is “Optimizing” [3], that is, one who confines herqueries to the advice set provided by the advisor and alwaystries the query with the highest utility. Twenty-four experi-ments were performed corresponding to all the combinationsof the variables mentioned before (product database, num-ber of user profiles, filtering strategy). In every experimentwe ran 100 dialogues between a virtual user and the advisorand then averaged the observed measures.
6. RESULTS AND DISCUSSION
6.1 Example of Simulated InteractionBefore describing the results of the system evaluation we
want to illustrate with one example a typical user-advisorinteraction. In this example we are considering the Marriottcatalogue, and the system is using the utility-based filteringstrategy, hence no more than 5 queries will be recommendedat each step. Some of the details are in Table 3.
The features, numbered from 0 to 8 are: 0=Internet ac-
cess point, 1=Restaurant on site, 2=Room service, 3=Pets
allowed, 4=Meeting room, 5=Airport shuttle, 6=Swimming
Pool, 7=Golf camp, 8=Tennis camp. The five most im-portant features for the simulated user in this example are0,1,2,5,8, but there is no hotel with exactly these featuresin the dataset, and the best available hotel is 0,1,2,3,5.
The user starts the interaction with the query which, ac-cording to her preferences, contains the two most importantfeatures: 1,2. The system infers some initial constraintsfrom the initial query, i.e., that these features are more im-portant that the others not requested (see Section 3), anddiscards the profiles that do not satisfy these constraints.In this case it discovers that 10 out of 250 initial predefinedprofiles satisfy the inferred constraints (compatible profiles).These profiles are considered by the system as those po-tentially containing the true user profile and thus will beexamined to make new query suggestions. The system com-putes the next candidate queries and discards those thatare not satisfiable: (58 are candidates) Then the advisorremoves those that are dominated, the remaining queries(10 undominated) are ranked by computing their expectedutility, and the top 5 are suggested. Note that the queriessuggested extend the previous one with extra features. Thequery selected by the user is 1,2,5,6, since it is the onethat maximizes her utility. At this point the utility short-fall is 0.136 and the Jaccard similarity with the best hotel,0,1,2,3,5, is 0.5 (3 common features out of 6 in the union).The system infers 4 new constraints: these constraints statethat the utility of the selected query is greater than or equalto the utility of the other queries that were suggested. Thenumber of compatible profiles is now 2, and only 1, thatis 0,1,2,5,6, out of the 7 satisfiable queries, is undomi-nated, and thus suggested to the user. It is interesting tonote that the best (and satisfiable) query 0, 1, 2, 3, 5 =trade(1, 2, 5, 6, 6, 1, 3) was (erroneously) considered by thesystem to be dominated by the suggested query 0,1,2,5,6,and therefore not included in the advice set. This resultsfrom the fact that the dominated queries are computed us-ing the compatible profiles (2 in this case) not the true user
model, which is unknown to the system. These two compat-ible profiles (erroneously) assign a higher weight to feature6 (Swimming Pool) instead of feature 3 (Pets allowed) asit is stated in the true user profile. In the third interac-tion step the user is forced to select the unique query thatis suggested. At this point it is not possible to extend thecurrent query with a satisfiable one any further, the systemcannot make new query recommendations, and the interac-tion ends. The utility shortfall and the Jaccard similarityare 0.0018 and 0.67 respectively. In this example it is clearthat reasoning with a finite set of profiles causes some loss inrecommendation accuracy, which is compensated by a speedup in system performance and a reduction in the sizes of theAdviceSet compared with the approach introduced in [3] (seediscussion later).
6.2 Interaction LengthTable 4 shows the results of our experiments. The query
suggestion strategy based on the utility filtering, as well asthe baseline approach (not filtering the query suggestions),produce interaction sessions with average length ranging be-tween 2 and 4.
When the size of the user profiles set is small (25 profiles),the interaction length is even shorter, ranging between 2 and2.6; this is because it is more likely to fall into a situationwhere no user profile is compatible with the inferred con-straints and the system cannot suggest a new query.
In general, the interaction length is dependent on the num-ber of product features and the available products in thedata set. Firstly, the higher the number of product fea-tures, the longer will be the interaction. This is because theuser, at each interaction step, when she is selecting one ofthe query editing operations, extends the previous query byone or two additional features. Secondly, the smaller thenumber of products, the more likely the process is to stop,because the current query cannot be further extended with-out building a failing query. It is important to note that theinteraction length is typically low and fairly acceptable foran online application.
6.3 AdviceSet SizeThe average size of the advice set ranges between 0 and
12 when no filtering is applied. In this case, inspecting theexperiments’ log data, we detected that in the initial steps ofthe user-system interaction, i.e., when the system has poorknowledge about the user preferences, the average numberof suggested queries could be as high as 20 (when the systemis contemplating a large number of profiles). On the otherhand, when the system is filtering the AdviceSet, obviously,the size of the advice set is never greater than K = 5. Ta-ble 4 shows the average number of queries suggested and,as expected, the filtering strategy (utility-based) producessmaller AdviceSets compared to the not-filtered case. Ingeneral, when the size of the set of predefined user profiles issmall (25 profiles), the number of query suggestions rangesbetween 0 and 1.5; this is caused (as we discussed abovefor the interaction length) by the lack of compatible userprofiles, resulting in the difficulty of identifying queries tosuggest to the user.
6.4 Utility ShortfallWe expected to observe a higher utility shortfall when
filtering the advice set. In fact, in this case, the system
23

Table 3: An example of the user-system interaction
hotel features: 0 1 2 3 4 5 6 7 8true user profile: 0.134 0.264 0.188 0.025 7.0e-4 0.141 0.023 0.06 0.164
best hotel: 0, 1, 2, 3, 5 number of initial profiles: 250
User Advisor
* Issues the initial query = 1, 2
* Number of inferred constraints = 11* Number of compatible profiles = 10* Number of satisfiable queries = 58* Undominated queries = 10. Top K=5 suggested:1,2,4,6, 1,2,5,6, 1,2,3,6, 1,2,4,5, 1,2,3,4
* Selects the query: 1, 2, 5, 6
* Number of inferred constraints = 4* Number of compatible profiles = 2* Number of satisfiable queries = 7* Undominated queries = 1: 0,1,2,5,6
* Selects the query: 0, 1, 2, 5, 6
* No new constraints inferred.* The same number of satisfiable profiles remains.* Number of satisfiable queries = 0.* The system cannot make more query suggestions.
Utility shortfall = 0.0018, Jaccard Similarity = 0.667
Table 4: Averaged values of the observed measures for 100 runs in the 24 experiments performed. (DB
= Product Database; # Prof. = Number of predefined user profiles; IL = Interaction Length; AdvSS =
AdviceSet Size; USh = Utility Shortfall; JSim = Jaccard Similarity)
DB # Prof.Not filtering Utility filtering
Cork
IL AdvSS USh JSim IL AdvSS USh JSim
25 2.57 0.65 0.177 0.575 2.57 0.61 0.177 0.575250 3.09 8.32 0.063 0.778 3.6 2.98 0.031 0.8952500 3.69 8.43 0.005 0.968 3.81 3.40 0.0 0.99125000 3.81 7.69 0.0 1.0 3.84 3.43 0.0 0.993
Marriott
25 2.13 1.12 0.167 0.594 2.13 1.12 0.167 0.594250 2.61 8.66 0.033 0.857 2.93 3.33 0.037 0.8252500 2.98 7.93 0.0 0.994 3.0 4.25 0.003 0.96525000 2.99 7.82 0.0 0.996 3.0 4.22 0.004 0.965
Trentino
25 2.11 0.51 0.324 0.462 2.11 0.5 0.324 0.462250 2.95 11.31 0.163 0.626 3.65 2.95 0.080 0.7612500 3.65 12.67 0.060 0.797 3.96 3.66 0.018 0.87625000 3.99 11.55 0.015 0.890 4.01 3.62 0.012 0.891
may not include in the AdviceSet the best next query, caus-ing, at that step, a loss in the user utility compared withthe best query and thus an increase of the utility shortfall.What mitigates this problem is the fact that the systemmay still suggest the best query at a subsequent interactionstep. For instance, if the current query contains two featuresand the best query contains two additional features, the sys-tem, when filtering the suggestions, may not recommend thequery using the best of the two missing features at the firststep, but it could do it at the next suggestion step.
In general the utility shortfall decreases when the numberof user profiles increases. This is true regardless of whetherfiltering is used or not. When the number of user profilesis small (25 profiles) the utility shortfall values are higher,ranging between 0.2 and 0.3. This is essentially due to thefact that very often the user profiles do not satisfy the con-straints inferred by the system. This causes the interruptionof the interaction at an early stage. In this case there is not a
big difference in the utility shortfall whether filtering querysuggestions is used or not, because the size of the advice setnever exceeds the threshold K = 5.
When the system filters the query suggestions and the userprofiles set size is medium (250 profiles) or even larger (2500profiles), the utility shortfall is very close to that of the not-filtered case. Moreover, in some cases (e.g., Trentino and2500 profiles) the utility-based strategy may even performbetter than the not-filtering approach (0.018 vs. 0.060). Thiscould happen for a very simple reason. When the systemsuggests fewer queries, the selection of one of these queriesby the simulated user causes the system to infer fewer con-straints on the user utility function. In fact the system canonly deduce that the selected query does not have a lowerutility (for the user) than the other suggested queries. Infer-ring fewer constraints causes the system to eliminate fewerprofiles and hence enables the system to make a larger num-ber of interaction steps before arriving at the possibly failing
24

situation that no profile is compatible with the inferred con-straints. This is confirmed by the fact that in these cases(e.g., Trentino and 2500 profiles), where the utility-basedapproach behaves better than the not-filtering one, the in-teraction length is on average a bit larger (3.96 vs. 3.65).
In the case where the system is contemplating a large num-ber of user profiles (25000 profiles), filtering the query sug-gestions has a very small effect. The difference in the util-ity shortfall with the not-filtering approach is still smallerthan 0.0041 (e.g., Marriott 25000, 0.0 vs. 0.004), and thereis never a gain in utility. In general the Jaccard similaritybetween the best hotel and the last selected query increaseswhen the number of predefined profiles increases as well.The Jaccard similarity is higher than 89% when the sys-tem is contemplating 25000 profiles. Moreover, this value isbetter (96%) for the smallest data sets (e.g. Cork and Mar-riott). These results confirm the previous conclusions on theutility shortfall; it is more likely that better system querysuggestions are obtained when the number of predefined userprofiles is higher. In fact, it is not important to have manyprofiles, but rather to have an optimal set of predefined userprofiles covering the true user profiles of the subjects access-ing the system. This is a topic of further research.
6.5 Infinite Profile Set ModelFinally, in Table 5 we compare the interaction length, the
advice set size, and the average utility shortfall obtained inour experiments with those measured in our previous work,where an infinite number of profiles was considered [3]. Inthis comparison we use 25000 profiles and we confine thesystem to use only the add1 and trade1,2 operators to gen-erate new candidate queries: because in [3] the results wereobtained by considering only these two editing operations.
We can observe that the interaction length in the twosystems is more or less equivalent. The utility shortfall inthe proposed finite profiles model is always a bit larger thanin the infinite model. This is what has to be paid for theconstraining assumption that the number of possible userprofiles is finite. The major beneficial effect of the proposedapproach is the significant reduction of the advice set size bymore than 10 times. Moreover, computing the advice in ourimplementation, took just some miliseconds, even if 25000profiles were used, while with the infinite model it requiredon average some seconds.
In conclusion, we believe that in real scenarios approxi-mating the set of all possible user’s utility functions with afinite set is a reasonable assumption, and the small cost paidin terms of increased utility shortfall is compensated by thestrong reduction in the size of the advice set and computa-tional complexity, making it feasible for the user to browsethe advice set and pick her best query.
7. RELATED WORKRecommending personalized query revisions was first pro-
posed in [3] and then extended in [9]. This approach hasproved to be effective, and provides good query recommen-dations and final product recommendations. It guides theuser to the query that selects the products with maximalutility in a short number of query revision interactions. Thecited papers describe the details of this approach: the querylanguage, the user model, and the inferences made by thesystem, observing the user’s query revisions and finally thecomputation of the query suggestions for the user. [3, 9]
Table 5: Comparison of the system performance be-
tween the current finite set of profiles model and the
infinite model.
DB Averaged measures Infinite
model
Finite
model
Interaction length 6.09 5.63Cork Advice set size 69.88 4.81
Utility shortfall 0 0.003
Interaction length 4.67 3.98Marriott Advice set size 45.96 5.08
Utility shortfall 0 0.001
Interaction length 5.55 6.31Trentino Advice set size 59.02 5.17
Utility shortfall 0 0.037
left open some questions mostly related to the efficiency ofcomputing the query suggestions and the size of the adviceset. That approach uses linear programming extensively andrequire too much computation time to be exploited in an on-line application. Moreover, the average number of queriessuggested to the user at each interaction step is in manycases too large to be presented to a user.
These problems were initially tackled in a preliminaryworkshop paper [2] by assuming that the user utility func-tion is not an arbitrary one (i.e., coming from an infiniteset) but is drawn from a finite set of user profiles that areknown by the system. This set represents the possible dif-ferent users that the system considers that it may interactwith. This assumption simplifies the computation of querysuggestions (as was also shown here). Moreover, the averagenumber of query suggestions made at each interaction stepis also dramatically reduced (by a factor of 10). However,it remained the case that, during the initial steps of querysuggestion (when the system knowledge about the user pref-erences is poor), the number of queries suggested can stillbe high. Moreover, the authors artificially assumed that thetrue user utility function is included among the finite set ofuser profiles contemplated by the system. This is a crudesimplification since a totally unknown user approaching thesystem may have an arbitrary profile and the system hasno knowledge about that. We have lifted that assumptionin this paper and we have also extended the type of queryediting operations, showing that this set can be arbitrarilydefined by the system designer.
Critiquing is a conversational recommendation approachthat is related to our technique [6]. In critiquing the user isoffered query revisions in the form of critiques to the cur-rent selected product. The main difference with our pro-posed approach to building conversational recommender sys-tems is that the query processing in critiquing is based onsimilarity-based retrieval, while here we are using a logicbased approach. Interestingly, in [12, 8] the authors use amulti-attribute utility-based preference model and critiquingsuggestion technique that has similar objectives to our ap-proach. They maintain for each user an estimated profile(utility function). Then, they generate the best critiquesusing the estimated user utility and update the estimatedprofile by increasing the importance of a feature (weight) ifthe selected product has a larger feature value compared to
25

the previously selected one.Similarly to the “dominated query” concept considered in
our work, in [11, 10] the authors consider a conversationalrecommender system based on example-critiquing that sug-gest the top K options with highest likelihood to be “notdominated” by others options (Pareto optimality) [4]. Thesuggestions are based on an analysis of the user’s currentpreference model (adapted in each interaction) and the user’sreaction to the suggestions. In our case we take into accountthe query submitted by the user (user’s reaction) in orderto generate new queries, and only those that prove to havethe highest utility according to the user model inferred sofar are considered as not dominated, and thus suggested tothe user.
Reducing the number of user-system interaction in find-ing the target products has been approached in critiquing-based systems through the use of compound critiques [7, 12]which enable the user to express her preferences on multi-ple attributes at the same time, potentially shortening theinteraction cycles. In our approach we enable the user toexpress implicitly her preferences requesting more than onefeature at a time, which reduces the number of cycles neededto reach the best product for the user and making inferenceson the true user model is kept simple.
8. CONCLUSIONS AND FUTURE WORKIn this paper we have described and analyzed the perfor-
mance of a new type of conversational recommender systemthat suggests query revisions to help the user to find prod-ucts with the largest utility. We assume that the systemcontemplates only a finite set of possible user profiles, andinteracts with a user who has an unknown profile (probably)close to one of those that the system contemplates.
The results of our experiments show that the finite userprofiles set assumption has a strong effect on the process ofcomputing the best query suggestions that guide the userto the products that maximize her utility. In particular thenumber of user-advisor interaction steps (number of queriesissued by the user), and the utility shortfall are low. Wehave observed a significant reduction in the number of piecesof advice (suggested next queries) provided at each user-advisor interaction step. We have also shown that having arelatively large number of predefined user profiles, and ex-ploiting even simple techniques for filtering the suggestions,is an important ingredient for improving the system perfor-mance and producing effective support.
In the current model we consider only Boolean features.But, the proposed approach can be extended to ordinal andnumerical features (e.g. hotel category and room price). Weplan to develop such an extension in the future. It is alsoimportant to note that the user’s utility function is assumedto be linear. We plan to investigate the use of more generalintegral aggregation functions such as Choquet and Sugeno,or Ordering Weighted Averaging functions [1]. This will alsobe useful for modeling interactions between product features(redundancies, complementarities, contradictions).
Moreover, in this work we have assumed that the userpreferences do not change during the interaction with thesystem and the user is perfectly rational (always selects thebest option). In fact, the user may change her preferences ornot select the best available option (given her current util-ity function), and this may generate an inconsistent set ofinferred constraints that the system cannot use to produce
new query suggestions. We are planning to tackle these is-sues using relaxation techniques for over-constrained prob-lems [5]. Finally, we must observe that to fully evaluate theproposed approach we must perform live user experiments.Therefore, we are implementing a mobile application for ho-tel recommendation that exploits the proposed technique.
9. REFERENCES[1] G. Beliakov, T. Calvo, and S. James. Aggregation of
preferences in recommender systems. In Recommender
Systems Handbook, pages 705–734. 2011.[2] H. Blanco, F. Ricci, and D. Bridge. Conversational
query revision with a finite user profiles model. InProcs. of the 3rd Italian Information Retrieval
Workshop. CEUR-WS, 2012.[3] D. Bridge and F. Ricci. Supporting product selection
with query editing recommendations. In RecSys ’07:
Proceedings of the 2007 ACM conference on
Recommender systems, pages 65–72, New York, NY,USA, 2007. ACM Press.
[4] B. Faltings and P. Pu. The lookahead principle forpreference elicitation: Experimental results. In In
Seventh International Conference on Flexible Query
Answering Systems (FQAS, pages 378–389, 2006.[5] U. Junker. Quickxplain: Preferred explanations and
relaxations for over-constrained problems. InProceedings of the 19th National Conference on
Artificial Intelligence, pages 167–172. AAAI Press /The MIT Press, 2004.
[6] L. McGinty and J. Reilly. On the evolution ofcritiquing recommenders. In F. Ricci, L. Rokach,B. Shapira, and P. B. Kantor, editors, Recommender
Systems Handbook, pages 419–453. Springer Verlag,2011.
[7] J. Reilly, K. McCarthy, L. McGinty, and B. Smyth.Dynamic critiquing. In Advances in Case-Based
Reasoning, 7th European Conference, ECCBR 2004,
Madrid, Spain, August 30 - September 2, 2004,
Proceedings, pages 763–777, 2004.[8] J. Reilly, J. Zhang, L. McGinty, P. Pu, and B. Smyth.
Evaluating compound critiquing recommenders: areal-user study. In EC ’07: Proceedings of the 8th
ACM conference on Electronic commerce, pages114–123, New York, NY, USA, 2007. ACM.
[9] W. Trabelsi, N. Wilson, D. Bridge, and F. Ricci.Comparing approaches to preference dominance forconversational recommender systems. In E. Gregoire,editor, Procs. of the 22nd International Conference on
Tools with Artificial Intelligence, pages 113–118, 2010.[10] P. Viappiani, B. Faltings, and P. Pu. Preference-based
search using example-critiquing with suggestions. J.Artif. Intell. Res. (JAIR), 27:465–503, 2006.
[11] P. Viappiani, P. Pu, and B. Faltings. Conversationalrecommenders with adaptive suggestions. InProceedings of the 2007 ACM conference on
Recommender systems, pages 89–96. ACM, 2007.[12] J. Zhang and P. Pu. A comparative study of
compound critique generation in conversationalrecommender systems. In Procs. of 4th Intl. Conf. on
Adaptive Hypermedia & Adaptive Web-Based Systems,pages 234–243. Springer-Verlag, 2006.
26

Eliciting Stakeholder Preferences for RequirementsPrioritization
Alexander FelfernigInstitute for Software
TechnologyGraz University of Technology
Inffeldgasse 16b8010 Graz, Austria
Gerald NinausInstitute for Software
TechnologyGraz University of Technology
Inffeldgasse 16b8010 Graz, Austria
Florian ReinfrankInstitute for Software
TechnologyGraz University of Technology
Inffeldgasse 16b8010 Graz, Austria
ABSTRACTRequirements engineering is a very critical phase in software devel-opment process. Requirements can be interpreted as basic decisionalternatives which have to be negotiated by stakeholders. In thispaper we present the results of an empirical study which focusedon the analysis of key influence factors of successful requirementsprioritization. This study has been conducted within the scope ofsoftware development projects at our university where developmentteams interacted with a requirements prioritization environment.The major result of our study is that anonymized preference elici-tation can help to significantly improve the quality of requirementsprioritization, for example, in terms of the degree of team consen-sus, prioritization diversity, and quality of the resulting softwarecomponents.
Categories and Subject DescriptorsD.2 [Software Engineering]: Requirements Engineering; D.2.1[Requirements/Specifications]: Requirements Negotiation; H.5[Information Interfaces and Presentation]: Modeling Environ-ments
General TermsHuman Factors, Experimentation
KeywordsRequirements Prioritization, Group Decision Making
1. INTRODUCTIONRequirements Engineering (RE) is the branch of software en-
gineering concerned with the real-world goals for functions of andconstraints on software systems [14]. RE is considered as one of themost critical phases in software projects, and poorly implementedRE is one major risk for project failure [8]. Requirements are the
RecSys’12 9th - 13th September, 2012, Dublin, IrelandPaper presented at the 2012 Decisions@RecSys workshop in conjunc-tion with the 6th ACM conference on Recommender Systems. Copyrightc©2012 for the individual papers by the papers’ authors. Copying permit-
ted for private and academic purposes. This volume is published and copy-righted by its editors..
basis for all subsequent phases in the development process and highquality requirements are a major precondition for the success of theproject [4].
Today’s software projects still have a high probability to be can-celed or at least to significantly exceed the available resources [13].As stated by Firesmith [5], the phase of requirements engineer-ing receives rarely more that 2-4% of the overall project effortsalthough more efforts in getting the requirements right result insignificantly higher project success rates. A recent Gartner report[7] states that requirements defects are the third source of productdefects (following coding and design), but are the first source ofdelivered defects. The cost of fixing defects ranges from a low ofapproximately $70 (cost to fix a defect at the requirements phase)to a high of $14.000 (cost to fix a defect in production). Improvingthe requirements gathering process can reduce the overall cost ofsoftware and dramatically improve time to market.
Requirements can be regarded as a representation of decision alter-natives or commitments that concern the functionalities and quali-ties of the software or service [1]. Requirements engineering (RE)is then a complex task where stakeholders have to deal with variousdecisions [11]:
• Quality decisions, e.g., is the requirement non-redundant,concrete, and understandable?
• Preference decisions, e.g., which requirements should be con-sidered for the next release?
• Classification decisions, e.g., to which topic does this re-quirement belong?
• Property decisions, e.g., is the effort estimation for this re-quirement realistic?
Stakeholders are often faced with a situation where the amountand complexity of requirements outstrips their capability to sur-vey them and reach a decision [3]. The amount of knowledge andnumber of stakeholders involved in RE processes tend to increaseas well. This makes individual as well as group decisions muchmore difficult.
The focus of this paper will be preference decisions, i.e., we wantto support groups of stakeholders in the context of prioritizing soft-ware requirements for the next release. Typically, resource limi-tations in software projects are triggering the demand of a prior-itization of the defined requirements [8]. Prioritizations support
27

software project managers in the systematic definition of softwarereleases and help to resolve existing preference conflicts amongstakeholders.
Only a systematic prioritization can guarantee that the most essen-tial functionalities of the software system are implemented in-time[12]. Typically, requirements prioritization is a collaborative taskwhere stakeholders in a software project collaborate with the goalto achieve consensus regarding the prioritization of a given set ofrequirements. The earlier requirements are prioritized, the lower isthe effort of implementing irrelevant requirements and the higher isthe amount of available resources to implement the most relevantrequirements [12].
Establishing consensus between stakeholders regarding the prior-itization of a given set of requirements is challenging. Prioritiza-tions do not only have to take into account business process relatedcriteria but as well criteria which are related to technical aspectsof the software. Especially in larger projects, stakeholders needa tool-supported prioritization approach which can help to reduceinfluences related to psychological and political factors [12]. Re-quirements prioritization is a specific type of group work whichbecomes increasingly important in organizations [10].
Prioritization decisions are typically taken in groups but this taskis still ineffective due to reasons such as social blocking, censor-ship, and hidden agendas [10]. One balancing strategy is to dropor defer low priority requirements to a later release [12]. In a studyconducted at the Graz University of Technology during the courseObject Oriented Analyses and Design, the stakeholder part of thecustomer was impersonated by four course assistants. These as-sistants were not aware of the study settings and had to reviewthe software functionality developed by the different teams. Thisevaluation did not include a code review. Rather it was supposedto assess the user experience of the product and which importantfunctionality was supported. These important functions were par-tially defined by the exercise given in the course. The result of thisevaluation is represented by a quality value between 0 and 30 cred-its. The major contribution of this paper is to show how anonymityin group decision processes can help to improve the quality of re-quirements prioritizations.
The remainder of this paper is organized as follows. In Section2 we provide an overview of the basic functionalities of the IN-TELLIREQ requirements engineering environment developed at ouruniversity to collect preferences and decisions of stakeholders dur-ing the course Object-oriented Analysis and Design at the GrazUniversity of Technology. In Section 3 we introduce the basic hy-potheses that have been investigated within the scope of our empir-ical study; in this context we also provide details about the studydesign. In Section 4 we report the major results of our empiricalstudy and show the effect of anonymity on the group consensus,the decision diversity and the output quality. With Section 5 weconclude the paper.
2. INTELLIREQ DECISION SUPPORTINTELLIREQ is a group decision environment that supports com-
puter science students at our university in deciding on which re-quirements should be implemented within the scope of their soft-ware projects. For this task 219 students enrolled in a course aboutObject-Oriented Analyse and Design at the Graz University of Tech-nology had to form groups of 5–6 members. Unfortunately, it isnot possible to evaluate the existing knowledge and experience of
Figure 1: INTELLIREQ Anonymous Preference Presentation:the preferences of users are anonymized by replacing the stake-holder names with the terms "User 1", "User 2", ... , "User n".The order of stakeholders and the assignment to these terms israndomly generated.
the students and the resulting groups. We therefore distributed theresulting groups randomly on the different evaluation pools andassume that the knowledge and experience is equally distributedon each pool. Each group had to implement a software systemwith an average effort of about 8 man months. Figure 1 shows theanonymized preference presentation of stakeholders in IntelliReq.
Figure 2: INTELLIREQ Prioritization (Decision) Process. Con-struction: stakeholders define their initial preferences; Con-sensus: stakeholders adapt their preferences on the basis of theknowledge about preferences of other stakeholders. Decision:project managers take the final group decision.
In our study, 39 software development teams had to define a set ofrequirements which in the following had to be implemented. Theserequirements had to be prioritized and the resulting prioritizationserved as a major criteria for evaluating the corresponding softwarecomponents at the end of the project.
The requirements prioritization process consisted of three different
28

phases (see Figure 2) denoted as construction (collection of indi-vidual stakeholder preferences), consensus (adaptation of own pref-erences, see Figure 3), and decision (group decision defined andexplained by the project manager). This decision process structureresults in about 15.000 stakeholder decisions and 798 correspond-ing group decisions taken by the team leaders (project managers).On the basis of this scenario we conducted an empirical evaluationwith the goal to analyze the effects of supporting anonymized re-quirements prioritization. The basic settings of this study will bepresented in the following section.
Figure 3: INTELLIREQ Preference Adjustment (Consensus):stakeholders can view their initial preferences and preferencesof other stakeholder. With this information stakeholders canadjust their preferences to increase group consensus.
3. EMPIRICAL STUDYWithin the scope of our empirical study we wanted to inves-
tigate the impact of anonymous preference elicitation on the de-cision support quality of the INTELLIREQ environment. Conse-quently, each project team interacted with exactly one of two exist-ing types of preference elicitation interface. One interface (type 1:non-anonymous preference elicitation) provided an overview of thepersonal preferences of team members (stakeholders) where eachteam member was represented by her/his name. In the second typeof interface (type 2: anonymous preference elicitation) the pref-erences of team members were shown in anonymized form wherethe name of the individual team member was substituted with theterms "User 1", "User 2", etc (see Figure 1). The hypotheses (H1–H8) used to evaluate the decision process are summarized in Figure4. These hypotheses were evaluated on the basis of the followingobservation variables.
Anonymous preference elicitation. This variable indicates with whichtype of prioritization interface the team members were confronted(either summarization of the preferences of the team members in-cluding the name of the team members or not including the nameof the team members).
Consensus and Dissent. An indication to which extent the teammembers managed to achieve consensus (dissent) – see the secondphase of the group decision process in Figure 2 – is provided by thecorresponding variables. We measured the consensus of a groupon the basis of the standard deviation derived from requirement-specific group decisions. Formula 1 can be used to determine thedissent of a group x which is defined in terms of the normalizedsum of the standard deviations (sd) of the requirement-specific vot-
ings. The group consensus can then be interpreted as the counter-part of dissent (see Formula 2). As the consensus is the simpleinversion of the dissent, we will only take into account the consen-sus in the remaining paper.
dissent(x) =
∑r∈Requirements sd(r)
|Requirements| (1)
consensus(x) =1
dissent(x)(2)
Decision Diversity. The decision diversity of a group can be de-fined in terms of the average over the decision diversity of individ-ual users in the consensus phase (see Figure 2). The latter is definedin terms of the standard deviation derived from the decision du ofa user – a decision consists of the individual requirements prioriti-zations of the user.
diversity(x) =
∑u∈Users sd(du)
|Users| (3)
Output Quality. The output quality of the software projects con-ducted within the scope of our empirical study has been derivedfrom the criteria such as degree of fulfillment of the specified re-quirements. We also weighted the requirements according to theirdefined priority in the prioritization task. E.g. not including avery high important requirement enormously decreases the qual-ity value. On the opposite, low priority requirements will onlyhave a small impact on the quality value. Therefore, defining ahigh priority for a requirement which is of minor importance hasto be implemented anyway. On the other hand, each group has toimplement all important requirements for the user experience andwhich are important for the functionality. Therefore, the require-ments prioritization has a direct impact on the quality value. Thequality of the project output has been determined by teaching as-sistants who did not know to which type of preference elicitationinterface (anonymous vs. non-anonymous) the group has been as-signed to. These assignments were randomized over all teachingassistants, i.e., each teaching assistant had to evaluate (on a scaleof 0..30 credits) groups who interacted with an anonymous and anon-anonymous interface.
Within the scope of our study we wanted to evaluate the follow-ing hypotheses.
H1: Anonymous Preference Elicitation increases Consensus. Theidea behind this hypothesis is that anonymous preference elicita-tion helps to decrease the commitment [2] related to an individualdecision taken in the preference construction phase (see Figure 2),i.e., changing his/her mind is easier with an anonymous preferenceelicitation interface. Furthermore, anonymous preference elicita-tion increases the probability of detecting hidden profiles [6], i.e.,increases the probability of exchanging decision-relevant informa-tion [9].
H2: Anonymous Preference Elicitation decreases Dissent. Follow-ing the idea of hypothesis H1, non-anonymous preference elicita-tion increases commitment with regard to already taken (and pub-lished) decisions. It also decreases the probability of detecting hid-
29

den profiles [6] and thus also decreases the probability of high-quality decisions (see H3).
H3: Consensus increases Decision Diversity. As a direct conse-quence of an increased exchange of decision-relevant information(see Hypothesis H1), deep insights into major properties of the de-cision problem can be expected. As a consequence, the importantdifferentiation between important, less important, and unimportantrequirements with respect to the next release [3] can be achieved.
H4: Dissent decreases Decision Diversity. From less exchangeof decision-relevant information we can expect a lower amountof globally available decision-relevant information. As a conse-quence, the differentiation between important, less important, andunimportant requirements is a bigger challenge for the engagedstakeholders.
H5: Consensus increases Output Quality. From Hypothesis H3we assume a positive correlation between the degree of consensusand the diversity of the group decision. The diversity is an indicatorfor a meaningful triage [3] between important, less important, andunimportant requirements.
H6: Dissent decreases Output Quality. In contrary, dissent leads toa lower decision diversity and – as a consequence – to less mean-ingful results of requirements triage.
H7: Decision Diversity increases Output Quality. Group decisiondiversity is assumed to be a direct indicator for the quality of thegroup decision. With this hypothesis we want to analyze the directinterrelationship between prioritization diversity and the quality ofthe resulting software.
H8: Anonymous Preference Elicitation increases Output Quality.Finally, we want to explicitly analyze whether there exists a rela-tionship between the type of preference elicitation and the corre-sponding output quality.
4. STUDY RESULTSWe analyzed the hypotheses (H1–H8) on the basis of the vari-
ables introduced in Section 3.1 We used a Mann-Whitney U-test ifthe examined data set is not normal distributed (H1,H2) and the t-test if the data set is normal distributed (H8). The correlations (H3– H7) are calculated with Pearson correlations (normal distribution)and with the Spearman’s rank correlations (no normal distribution).
H1. The degree of group consensus in teams with anonymous pref-erence elicitation is significantly higher compared to teams withnon-anonymous preference elicitation (Mann-Whitney U-test, p <0.05). An explanation model can be the reduction of commitment[2] and a higher probability of discovering hidden profile informa-tion which improves the overall knowledge level of the team.
H2. Group dissent is an inverse function of group consensus and– as a consequence – teams with non-anonymous preference elici-tation have a significantly higher dissent (Mann-Whitney U-test, p< 0.05). In this context, non-anonymous preference elicitation canlead to higher commitment with regard to the orginially articulatedpreferences.
1We are aware of the fact that dissent is the inverse function ofconsensus, however, for reasons of understandability we decided toexplicitly include dissent as a decision variable.
Figure 4: Hypotheses defined to evaluate the INTELLIREQ De-cision Support.
H3. There is a positive correlation between the group consensusand the corresponding decision diversity (correlation 0.523, p <0.01). More group discussions can lead to a higher level of rele-vant knowledge about the decision problem. In the following thiscan lead to a development of a deeper understanding of the need ofrequirements triage [3] which leads to a higher degree of decisiondiversity.
H4. Dissent is an inverse function of group consensus – the higherthe dissent, the lower the corresponding decision diversity (corre-lation -0.523, p < 0.01). A lower degree of group decision diver-sity (prioritization diversity) can be explained by a lower degree ofdecision-relevant knowledge.
H5. Consensus in group decision making increases the output qual-ity (correlation 0.399, p < 0.01). An overlap in the personal stake-holder preferences can be interpreted as an indicator of a commonunderstanding of the underlying set of requirements. This leads toa better prioritization and a higher quality of the resulting softwarecomponents.
H6. The hypothesis can be confirmed (correlation -0.399, p < 0.01),i.e., there is a negative correlation between group dissent and thecorresponding output quality.
H7. In our analysis we could detect a positive correlation betweengroup decision diversity (diversity of prioritization) and the cor-responding output quality (correlation 0.311, p < 0.01). Decisiondiversity can be seen as an indicator of a reasonable triage pro-cess and reasonable prioritizations result in higher-quality softwarecomponents.
H8. Groups with anonymous preference elicitation performed sig-
30

nificantly better compared to groups with a non-anonymous prefer-ence elicitation (independent two-sample t-test, p < 0.05).
5. CONCLUSIONSRequirements prioritization is an important task in software de-
velopment processes. In this paper we motivated the applicationof requirements prioritization and discussed issues related to theaspect of anonymizing group decision processes in requirementsprioritization. The results of our empirical study clearly show theadvantages of applying anonymized preference elicitation, for ex-ample in terms of higher-quality software components, and canbe seen as a step towards a more in-depth integration of decision-oriented research in requirements engineering processes.
6. REFERENCES[1] A. Aurum and C. Wohlin. The fundamental nature of
requirements engineering activities as a decision-makingprocess. Information and Software Technology,45(14):945–954, 2003.
[2] R. Cialdini. The science of persuasion. Scientific American,284:76–81, 2001.
[3] A. Davis. The art of requirements triage. IEEE Computer,36(3):42–49, 2003.
[4] A. Felfernig, C. Zehentner, G. Ninaus, H. Grabner,W. Maaleij, D. Pagano, L. Weninger, and F. Reinfrank.Group decision support for requirements negotiation. InAdvances in User Modeling, pages 105–116, 2012.
[5] D. Firesmith. Prioritizing requirements. Journal of ObjectTechnology, 3(8):35–47, 2004.
[6] T. Greitemeyer and S. Schulz-Hardt. Preference-consistentevaluation of information in the hidden profile paradigm:Beyond group-level explanations for the dominance ofshared information in group decisions. Journal of Personality& Social Psychology, 84(2):332–339, 2003.
[7] G. Group. Hype cycle for application development:Requirements elicitation and simulation. 2011.
[8] H. Hofmann and F. Lehner. Requirements engineering as asuccess factor in software projects. IEEE Software,18(4):58–66, 2001.
[9] A. Mojzisch and S. Schulz-Hardt. Knowing other’spreferences degrades the quality of group decisions. Journalof Personality & Social Psychology, 98(5):794–808, 2010.
[10] A. Pinsonneault and N. Heppel. Anonymity in group supportsystems research: A new conceptualization, measure, andcontingency framework. Journal of ManagementInformation Systems, 14:89–108, 1997.
[11] B. Regnell, B. Paech, C. Aurum, C. Wohlin, A. Dutoit, andJ. ochDag. Requirements means decision! In 1st SwedishConf. on Software Engineering and Practice (SERP’01),pages 49–52, Innsbruck, Austria, 2001.
[12] K. Wiegers. First things first: Prioritizing requirements.Software Development, 1999.
[13] D. Yang, D. Wu, S. Koolmanojwong, A. Brown, andB. Boehm. Wikiwinwin: A wiki based system forcollaborative requirements negotiation. In HICCS 2008,page 24, Waikoloa, Big Island, Hawaii, 2008.
[14] P. Zave. Classification of research efforts in requirementsengineering. ACM Computing Surveys, 29(4):315–321, 1997.
31

Recommendation systems in the scope of opinionformation: a model
Marcel BlattnerLaboratory for Web Science
University of Applied Sciences FFHSRegensdorf, Switzerland
Matus MedoPhysics DepartmentUniversity of FribourgFribourg, Switzerland
ABSTRACTAggregated data in real world recommender applications of-ten feature fat-tailed distributions of the number of timesindividual items have been rated or favored. We propose amodel to simulate such data. The model is mainly based onsocial interactions and opinion formation taking place on acomplex network with a given topology. A threshold mech-anism is used to govern the decision making process thatdetermines whether a user is or is not interested in an item.We demonstrate the validity of the model by fitting atten-dance distributions from different real data sets. The modelis mathematically analyzed by investigating its master equa-tion. Our approach provides an attempt to understand rec-ommender system’s data as a social process. The model canserve as a starting point to generate artificial data sets usefulfor testing and evaluating recommender systems.
Categories and Subject DescriptorsH.1.m [Information Systems]: Miscellaneous
General TermsExperimentation, Theory
Keywordsrecommender systems, opinion formation, complex networks
1. INTRODUCTIONThis is the information age. We are witnessing informa-
tion production and consumption in a speed never seen be-fore. The WEB2.0 paradigm enables consumers and produc-ers to exchange data in a collaborative way benefiting bothparties. However, one of the key challenges in our digitally-driven society is information overload [7]. We have the ’painof choice’. Recommendation systems represent a possible so-lution to this problem. They have emerged as a research area
Paper presented at the 2012 Decisions@RecSys workshop in conjunctionwith the 6th ACM conference on Recommender Systems. Copyright 2012for the individual papers by the papers’ authors. Copying permitted forprivate and academic purposes. This volume is published and copyrightedby its editors.
on its own in the 90s [42, 20, 28, 21, 11]. The interest in rec-ommendation systems increased steadily in recent years, andattracted researchers from different fields [43]. The successof highly rated Internet sites as Amazon, Netflix, YouTube,Yahoo, Last.fm and others is to a large extent based ontheir recommender engines. Corresponding applications rec-ommend everything from CD/DVD’s, movies, jokes, books,web sites to more complex items such as financial services.
The most popular techniques related to recommendationsystems are collaborative filtering [8, 26, 11, 24, 28, 21, 41,45] and content-based filtering [14, 40, 35, 5, 30]. In ad-dition, researchers developed alternative methods inspiredby fields as diverse as machine learning, graph theory, andphysics [16, 17, 37, 52, 51, 10, 48, 50]. Furthermore, rec-ommendation systems have been investigated in connectionwith trust [2, 39, 47, 32, 33] and personalized web search [9,12, 46], which constitutes the new research frontier in searchengines.
However, there are still many open challenges in the re-search field of recommendation systems [1, 22, 25, 18, 24, 43,15]. One key question is connected to the understanding ofthe user rating mechanism. We build on a well documentedinfluence of social interactions with peers on the decision tovote, favor, or even purchase an item [44, 27]. We proposea model inspired by opinion formation taking place on acomplex network with a predefined topology. Our model isable to generate data observed in real world recommendersystems. Despite its simplicity, the model is flexible enoughto generate a wide range of different patterns. We mathe-matically analyze the model using a mean field approach tothe full Master Equation. Our approach provides an under-standing of the data in recommender systems as a productof social processes. The model can serve as a data genera-tor which is valuable for testing and evaluation purposes forrecommender systems.
The rest of the paper is organized as follows. The modelis outlined in Sec. (2). Methods, data set descriptions, andvalidation procedures are in Sec. (3). Results are presentedin Sec. (4). Discussion and an outlook for future researchdirections are in Sec. (5).
2. MODEL
2.1 MotivationOur daily decisions are heavily influenced by various infor-
mation channels: advertisement, broadcastings, social inter-actions, and many others. Social ties (word-of-mouth) playa pivotal role in consumers buying decisions [44, 27]. It was
32

demonstrated by many researchers that personal communi-cation and informal information exchange not only influencepurchase decisions and opinions, but shape our expectationsof a product or service [49, 4, 3]. On the other hand, it wasshown [23], that social benefits are a major motivation toparticipate on opinion platforms. If somebody is influencedby recommendations on an opinion platform like MovieLensor Amazon, social interactions and word-of-mouth in generalare additional forces governing the decision making processto purchase or even to rate an object in a particular way[31].
Our model is formulated within an opinion formation frame-work where social ties play a major role. We shall discussthe following main ingredients of our model:
• Influence-Network (IN)
• Intrinsic-Item-Anticipation (IIA)
• Influence-Dynamics (ID)
Influence Network.We call the network where context-relevant information
exchange takes place an Influence-Network (IN). Nodes ofthe IN are people and connections between nodes indicatethe influence among them. Note that we put no constraintson the nature of how these connections are realized. Theymay be purely virtual (over the Internet) or based on physi-cal meetings. We emphasize that INs are domain dependent,i.e., for a given community of users, the Influence Networkconcerning books may differ greatly (in topology, number ofties, tie strength, etc.) from that concerning another subjectsuch as food or movies. Indeed, one person’s opinion lead-ers (relevant peers) concerning books may be very differentfrom those for food or other subjects. In this scope, we seethe INs as domain-restricted views on social networks. Itis thus reasonable to assume that Influence Networks aresimilar to social interaction networks which often exhibit ascale-free topology [6]. However, our model is not restrictedto a particular network structure.
Intrinsic-Item-Anticipation.Suppose a new product is launched on the market. Ad-
vertisement, marketing campaigns, and other efforts to at-tract customers predate the launching process and continueafter the product started to spread on the market. Theseefforts influence product-dependent customer anticipation.It is clear that the resulting anticipation is a complex com-bination of many different components including intrinsicproduct quality and possibly also suggestions from recom-mendation systems.
In our model we call the above-described anticipation Intrinsic-Item-Anticipation (IIA) and measure it by a single number.It is based on many external sources, except for the influencegenerated by social interactions. It is the opinion on some-thing taken by individuals, before they start to discuss thesubject with their peers. Furthermore, we assume that anindividual will invest resources (time/money) into an objectonly, if the Intrinsic-Item-Anticipation is above a particularthreshold, which we call Critical-Anticipation-Threshold.
Influence-Dynamics.The Influence-Dynamics describes how individuals’ Intrinsic-
Item-Anticipations are altered by information exchange via
the connections of the corresponding Influence-Network. Fromour model’s point of view this means the following: an in-dividual’s IIA for a particular item i may be shifted dueto social interactions with directly connected peers (theseinteractions thus take place on the corresponding IN), whoalready experienced the product or service in question. Thisprocess can shift the Intrinsic-Item-Anticipation of an indi-vidual who did not yet experience product/object i closer toor beyond the critical-anticipation-threshold.
We now summarize the basic ingredients of our model.An individual user’s opinions on objects are assembled intwo consecutive stages: i) opinion making based on differentexternal sources, including suggestions by recommendationsystems and ii) opinion making based on social interactionsin the Influence-Network. The second process may shift theopinions generated by the first process.
2.2 Mathematical formulation of the modelIn this section we firstly describe how individuals’ Intrinsic-
Item-Anticipations may change due to social interactionstaking place on a particular Influence-Network. Secondly, weintroduce dynamical processes governing the opinion prop-agation.
IIA shift.We model a possible shift in the IIA as:
fij = fij +
[Θj
kj
](1−γ)
. (1)
where fij is the shifted Intrinsic-Item-Anticipation of indi-vidual j for object i, fij is the unbiased IIA, Θj is the num-ber of j’s neighbors, who already experienced and liked itemi, kj denotes the total number of j’s neighbors in the cor-responding IN, and γ ∈ (0, 1) quantifies trust of individualsto their peers. An individual j will consume, purchase, orpositively rate an item i only if
fij ≥ ∆. (2)
We identify ∆ as the Critical-Anticipation-Threshold. Val-ues of fij are drawn from a probability distribution fi. Sincethe IIA for each individual is an aggregate of many differentand largely independent contributions, we assume that fiis normally distributed, fi ∈ N (µi, σ). (Unless stated oth-erwise.) To mimic different item anticipations for differentobjects i, we draw the mean µi from a uniform distributionU(−ε, ε). We maintain µi, ε, and σ, so that fi is roughlybounded by (−1, 1), i.e., −1 ≤ µ − 3σ < µ + 3σ ≤ 1. Note
that fij can exceed these boundaries after a shift of the corre-sponding IIA occurs. The second term on the right hand sideof Eq. (1) is the influence of j’s neighborhood weighted bytrust γ. To better understand the interplay between γ andthe density of attending users in the neighborhood of useri, ρ := Θj/kj , we refer to Fig. 1. Trust γ ≈ 1 causes a bigshift on the IIA’s even for ρ ≈ 0. On the other hand, γ ≈ 0needs high ρ to yield a significant IAA shift. These prop-erties are understood as follows: people trusting strongly intheir peers need only few positive opinions to be convinced,whereas people trusting less in their social environment needconsiderable more signals to be influenced.
Influence-Dynamics.The Influence-Dynamics proceeds as follows. Firstly, we
33

Figure 1: Contour plot for γ and ρ = Θj/kj. Num-bers inside the plot quantify the shift in the IAA asa function of γ and ρ.
draw an Influence-Network IN(P) with a fixed network topol-ogy (power-law, Erdos-Renyi, or another). P refers to aset of appropriate parameters for the Influence-Network inquestion (like network type, number of nodes, etc.). Thenetwork’s topology is not affected by the dynamical pro-cesses (opinion propagation) taking place on it. We justifythis static scenario by assuming that the time scale of thetopology change is much longer then the time scale 1 of opin-ion spreading in the network. Each node in the Influence-Network corresponds to an individual. For each individualj we draw an unbiased Intrinsic-Item-Anticipation fij fromthe predefined probability distribution fi. At each time step,every individual is in one of the following states: S,A,D.S refers to a susceptible state and corresponds to the initialstate for all nodes at t = 0. A refers to an attender stateand corresponds to an individual with the property fij ≥ ∆.
D refers to a denier state with the property fij < ∆ afteran information exchange with his/her peers in the Influence-Network happened. An individual in state D or A can notchange his/her state anymore. It is clear that an individualin state A cannot back transform to the susceptible stateS, since he/she did consume or favor item i and we do notaccount for multiple attendances in our model. An indi-vidual in state D was influenced but not convinced by hisopinion leaders (directed connected peers). We make thefollowing assumption here: if individual j’s opinion leadersare not able to convince individual j, meaning that individ-ual’s j Intrinsic Item Anticipation fij stays below the criti-cal threshold ∆ after the influence process, then we assumethat j’s opinion not to attend object i remains unchangedin the future. Therefore we have the following possible tran-sitions for each node in the influence network: jS → jA orjS → jD. Node states are updated asynchronously whichis more realistic than synchronous updating, especially insocial interaction models [13]. The Influence-Dynamics issummarized in Algorithm 1.
Master Equation.We are now in the position to formulate the Master Equa-
1The term time scale denotes a dimensionless quantity andspecifies the devisions of time. A shorter time scale meansa faster spreading of opinions in the network.
Algorithm 1 RecSysMod algorithm. P contains the con-figuration parameter for the network. ∆ is the AnticipationThreshold and γ denotes the trust. O ∈ N is the number ofobjects to simulate. G(N,E) is the network. N is the set ofnodes and E is the set of edges.
1: procedure RecSysMod I(P,∆, γ, O)2: G(N,E)← GenNetwork(P)3: for all Objects in O do4: generate distribution fi from N (µi, σ)5: for each node j ∈ N in G do6: draw fij from fi7: if fij < ∆ then8: jstate ← S9: else
10: jstate ← A11: end if12: end for13: repeat14: for all j with jstate = S AND Θj > 0 do
15: fij ← fij +[
Θj
kj
](1−γ)
16: if fij < ∆ then17: jstate ← D18: else19: jstate ← A20: end if21: end for22: until |j|jstate = S AND Θj > 0| = 023: end for24: end procedure
tion for the dynamics. As already said before, two things canhappen when a non-attender is connected to an attender:a) he/she becomes an attender too, or b) he/she becomesa denier who will not attend/favor the item. For these twointeraction types we formally write:
S +Aλ−→ 2A
S +Aα−→ D +A (3)
Here λ denotes the probability that a susceptible node con-nected to an attender becomes an attender too, and α isthe probability that a susceptible node attached to an at-tender becomes a denier. To take into account the underly-ing network topology of the Influence Network it is com-mon to introduce compartments k [19]. Let NA
k be thenumber of nodes in state A with k connections, NS
k thenumber of nodes in state S with k connections, and ND
k
the number of nodes in state D with k connections, respec-tively. Furthermore we define the corresponding densities:ak(t) = NA
k /Nk, sk(t) = NSk /Nk and dk(t) = ND
k /Nk. Nk isthe total number of nodes with k connections in the network.Since every node from Nk must be in one of the three states,∀t : ak(t) + sk(t) + dk(t) = 1. A weighted sum over all kcompartments gives the total fraction of attenders at time t,a(t) =
∑k P (k)ak(t) where P (k) is the degree distribution
of the network (it also holds that a(t) = NA(t)/N). Thetime dependence of our state variables ak(t), dk(t), sk(t) is
ak(t) = λksk(t)Ω
dk(t) = αksk(t)Ω
sk(t) = −(α+ λ)ksk(t)Ω
(4)
34

where Ω is the density of attenders in the neighborhood ofsusceptible node with k connections averaged over k
Ω =∑k
P (k)(k − 1)ak/ 〈k〉 (5)
where 〈k〉 denotes the mean degree of the network. Asoutlined above, λ is the probability that a node in stateS transforms to state A if it is connected to a node instate A. This happens when fij > ∆. Therefore, we have∆− < fij < ∆ where ∆− = ∆ − (1/k)1−γ . From this we
have λ =∫∆
∆−f(x)dx, where f(x) is the expectation dis-
tribution. Similarly we write for α =∫∆−l
f(x)dx, wherel denotes the lower bound of the expectation distributionf(x). A crude mean field approximation can be obtained bymultiplying the right hand sides of Eq. (4) with P (k) andsumming over k, which yields a set of differential equations
a(t) = λ 〈k〉 s(t)a(t),
d(t) = α 〈k〉 s(t)a(t),
s(t) = −(α+ λ) 〈k〉 s(t)a(t).
(6)
which is later used to obtain analytical results for the atten-dance fraction a(t).
3. METHODSWe describe here our simulation procedures, datasets, ex-
periments, and analytical methods.
Simulations.Our simulations employ Alg. (1). As outlined in the model
section, we do not change the network topology during thedynamical processes. We experiment with two different net-work types, Erdos-Renyi (ER), and power law (PL) whichare both generated by a so-called configuration model [34].ER and PL represent two fundamentally different classesof networks. The former is characterized by a typical de-gree scale (mean degree of the network), whereas the latterexhibits a fat-tailed degree distribution which is scale free.The networks are random and have no degree correlationsand no particular community structure. To obtain repre-sentative results we stick to the following approach: we fixthe network type, number of nodes, number of objects, andnetwork type relevant parameters to draw an ER or PL net-work. We call this a configuration P. In addition, we fix thevariance σ of the anticipation distributions fi. We performeach simulation on 50 different networks belonging to thesame configuration P and on each network we simulate thedynamics 50 times. Then we average the obtained atten-dance distributions over all 2500 simulations.
Datasets.To show the validity of our model we use real world rec-
ommender datasets. MovieLens (movielens.umn.edu), aweb service from GroupLens (grouplens.org) where ratingsare recorded on a five stars scale. The data set contains1682 movies and 943 users. Only 6, 5% of possible votes areexpressed. Netflix data set (netflix.com). We use the Net-flix grand prize data set which contains 480189 users and17770 movies and also uses a five stars scale. Lastfm dataset (Lastfm.com). This data set contains social networking,tagging, and music artist listening information from usersof the Last.fm online music system. There are 1892 users,
17632 artists, and 92834 user-listended artists relations intotal. In addition, the data set contains 12717 bi-directionaluser friendship relations. These data sets are chosen becausethey exhibit very different attendance distributions and thusprovide an excellent playground to validate our model in dif-ferent settings.
Experiments.Data topologies. We firstly investigate the simulated
attendance distributions as a function of trust γ, the an-ticipation threshold ∆, and the network topology. For thispurpose we simulate the dynamics on a toy network with 500nodes and record the final attendance number of 300 objects.The simulation is conducted for ER and PL networks andperformed as outlined in the simulations paragraph above.In Fig.(2) and Fig.(3) we investigate the skewness [53] of theattendance distributions and the maximal attendance ob-tained for the corresponding parameter settings. The skew-ness of a distribution is a measure for the asymmetry aroundits mean value. A positive skewness value means that thereis more weight to the left from the mean, whereas a negativevalue indicates more weight in the right from the mean.
Fitting real data. We explore the model’s ability to fitreal world recommendation attendance distributions foundin the described data sets. For this purpose we fix for theNetflix data set a network with 480189 nodes and perform asimulation for 17770 objects. In the MovieLens case we dothe same for 943 nodes and 1682 objects and for the Lastfmdata set we simulate on a network with 1892 nodes and 17632objects. In the case of Lastfm we have the social networkdata as well. We validate our model on that data set by twoexperiments: a) we use the provided user friendship networkas simulation input and fit the attendance distribution andb) we fit the attendance distribution like in the MovieLensand Netflix case with an artificially generated network.
Mathematical analysis. We investigate the Master Equa-tions Eq. (4) and Eq. (6). We provide a full analytical solu-tion for Eq. (6) and an analytical approximation for Eq. (4)in the early spreading stage.
4. RESULTSData topologies. The landscape of attendance distribu-
tions of our model is demonstrated in Fig. (2) and Fig. (3).To obtain these results, simulations were performed as de-scribed in Sec. (3). The item anticipation fi was drawn froma normal distribution with mean values µi ∈ U(−0.1, 0.1)and variance σ = 0.25 fixed for all items. Both networkshave 500 nodes. In the Erdos-Renyi case, we used a wiringprobability p = 0.03 between nodes. The Power Law net-work was drawn with an exponent δ = 2.25. The simulatedattendance distributions in Fig.(2) and Fig.(3) show a widerange of different patterns for both ER and PL Influence-Networks. In particular, both network types can serve asa basis for attendance distributions with both positive andnegative skewness. Therefore, the observed fat-tailed distri-butions are not a result of the heterogeneity of a scale freenetwork but they are emergent properties of the dynamicsproduced by our model. The parameter region for highlypositively-skewed distributions is the same for both networktypes. The parameters γ and ∆ can be tuned so that allitems are attended by everybody or all items are attendedby nobody. While not relevant for simulating realistic atten-dance distributions, these extreme cases help to understand
35

the model’s flexibility.
Figure 2: Skewness of the attendance distributionsas a function of trust γ and the critical anticipationthreshold ∆ for Erdos-Reny networks with 500 nodesand 300 simulated items.
Figure 3: Skewness of the attendance distributionsas a function of trust γ and the critical anticipationthreshold ∆ for power-law networks with 500 nodesand 300 simulated items.
Fitting real data We fit real world recommender datafrom MovieLens, Netflix and Lastfm with results reportedin Fig. (4), Fig. (5), Fig. (6), Fig. (7), and Tab. (1), re-spectively. The real and simulated distributions are com-pared using Kullback-Leibler (KL) divergence [29]. We re-port the mean, median, maximum, and minimum of thesimulated and real attendance distributions. Trust γ, antic-ipation threshold ∆, and anticipation distribution varianceσ are reported in figure captions. We also compare the aver-aged mean degree, maximum degree, minimum degree, andclustering coefficient of the real Lastfm social network andnetworks obtained to fit the data. Results are reported inTab. (2) and Fig. (8). Note that thus obtained parametervalues can be useful also in real applications where, assum-ing that our social opinion formation model is valid, onecould detect decline of the overall trust value in an onlinecommunity, for example.
Mathematical analysis. Eq. (6) can be solved analyti-cally. We have ∀t : a(t)+s(t)+d(t) = 1 with the initial con-
Figure 4: Fit of the MovieLens attendance dis-tribution with trust γ = 0.50, critical anticipationthreshold ∆ = 0.6, anticipation distribution varianceσ = 0.25, and power law network with exponentδ = 2.25, 943 nodes, and 1682 simulated objects.
Figure 5: Fit of the Netflix attendance distributionwith trust γ = 0.52, critical anticipation threshold∆ = 0.72, anticipation distribution variance σ = 0.27,and power law network with exponent δ = 2.2, 480189nodes, and 17770 simulated objects.
ditions for the first movers a0 =∫ u
∆f(x)dx, s(0) = 1− a(0),
and d(0) = 0. In the following we use the bra-ket nota-tion 〈x〉 to represent the average of a quantity x. Standardmethods can now be used to arrive at2
a(t) =(τ 〈k〉)−1 exp(t/τ)
(α+ λ) [exp(t/τ)− 1] + (τ 〈k〉 a0)−1. (7)
Here τ is the time scale of the propagation which is definedas
τ = (a0α 〈k〉+ λ 〈k〉)−1 . (8)
This is similar to the time scale τ = (λ 〈k〉)−1 in the wellknown SI Model [38, 6]. Eq.(7) can be very useful in predict-ing the average behavior of users in a recommender system.
Since Eq. (4) is not accessible to a full analytical solution,we investigate it for the early stage of the dynamics. As-
2We give here only the solution for a(t) because we aremainly interested in the attendance dynamics.
36

Figure 6: Fit of the Lastfm attendance distributionwith trust γ = 0.4, critical anticipation threshold ∆ =0.8, anticipation distribution variance σ = 0.24, andreal Lastfm user friendship network with 1892 nodesand 17632 simulated objects.
Figure 7: Fit of the Lastfm attendance distributionwith trust γ = 0.6, critical anticipation threshold∆ = 0.8, anticipation distribution variance σ = 0.24,and power law network with exponent δ = 2.25, 1892nodes and 17632 simulated objects.
suming a(0) = a0 0, we can neglect the dynamics of d(t)to obtain
Ω(t) =
(⟨k2⟩
〈k〉 − 1
)Ω(t).
In addition, Eq. (4) yields
ak(t) = λk(1− ak(t))Ω(t)
sk(t) = −(α+ λ)k(1− ak(t))Ω(t)
(9)
Neglecting terms of order a2k(t) and summing the solution
of ak(t) over P (k), we get a result for the early spreadingstage
a(t) = a(0)(
1 + τλ(
exp(t/τ)− 1)), (10)
with the timescale τ =⟨k2⟩/[λ(⟨k2⟩− 〈k〉)
]. The obtained
time scale τ valid in the early stage of the opinion spreadingis clearly dominated by the network heterogeneity. This re-sult is in line with known disease models, e.g., SI,SIR [38, 6].
D KL Med Mean Max MinML 0.046 27/26 59/60 583/485 1/1NF 0.030 561/561 5654/5837 232944/193424 3/16LFM1 0.05 1/1 5.3/5.2 611/503 1/1LFM2 0.028 1/1 5.3/5.8 611/547 1/1
Table 1: Simulation results. ML: Movielens, NF:Netflix, LFM1: Lastfm with real network, LFM2:Lastfm with simulated network, KL: Kullback-Leibler divergence, Med: Median, Mean, Max:maximal attendance (data/simulated), Min: mini-mal attendance (data/simulated).
D 〈k〉 kmin kmax δ CLFM1 13.4 1 119 2.3 0.186LFM2 12.0 1 118 2.25 0.06
Table 2: Mean, minimum, maximum degree, clus-tering coefficient C, and estimated exponent δ of thereal (LFM1) and simulated (LFM2) social networkfor the Lastfm data set.
Figure 8: Log-log plot of real (red) and simulated(blue) social network degree distribution P (k) forthe Lastfm data set. Inset: plot of the cumulativedegree distribution.
We emphasize that Eq.(10) is valuable in predicting users’behavior of a recommender system in an early stage.
5. DISCUSSIONSocial influence and our peers are known to form and in-
fluence many of our opinions and, ultimately, decisions. Wepropose here a simple model which is based on heteroge-neous agent expectations, a social network, and a formalizedsocial influence mechanism. We analyze the model by nu-merical simulations and by master equation approach whichis particularly suitable to describe the initial phase of thesocial “contagion”. The proposed model is able to generatea wide range of different attendance distributions, includ-ing those observed in popular real systems (Netflix, Lastfm,and Movielens). In addition, we showed that these patternsare emergent properties of the dynamics and not imposedby topology of the underlying social network. Of particularinterest is the case of Lastfm where the underlying socialnetwork is known. Calibrating the observed attendance dis-
37

tribution against the model then leads not only to socialinfluence parameters but also to the degree distribution ofthe social network which agrees with that of the true socialnetwork.
The Kullback-Leibler distances (KL) for the simulatedand real attendance distributions are below 0.05 in all cases,thus demonstrating a good fit. However, the maximum at-tendances could not be reproduced exactly by the model.One reason may be missing degree correlations in the sim-ulated networks in contrast to real networks where positivedegree correlations (so-called degree assortativity) are com-mon. For the Lastfm user friendship network we observe ahigher clustering coefficient C ≈ 0.18 compared to the clus-tering coefficient C ≈ 0.06 in the simulated network. Tocompensate for this, a higher trust parameter γ is needed tofit the real Lastfm attendance distribution with simulatednetworks.
We are aware that our statistics to validate the modelis not complete. But we are confident, that our approachpoints to a fruitful research direction to understand recom-mender systems’ data as a social driven process.
The proposed model can be a first step towards a datagenerator to simulate bipartite user-object data with real-world data properties. This could be used to test and val-idate new recommender algorithms and methods. Futureresearch directions may expand the proposed model to gen-erate ratings within a predefined scale. Moreover, it couldbe very interesting to investigate the model in the scope ofsocial imitation [36].
6. REFERENCES[1] G. Adomavicius and A. Tuzhilin. Toward the next
generation of recommender systems: A survey of thestate-of-the-art and possible extensions. IEEEtransactions on knowledge and data engineering, pages734–749, 2005.
[2] R. Andersen, C. Borgs, J. Chayes, U. Feige,A. Flaxman, A. Kalai, V. Mirrokni, andM. Tennenholtz. Trust-based recommendationsystems: an axiomatic approach. In Proceeding of the17th international conference on World Wide Web,pages 199–208. ACM, 2008.
[3] E. Anderson and L. Salisbury. The formation ofmarket-level expectations and its covariates. Journalof Consumer Research, 30(1):115–124, 2003.
[4] J. Arndt. Role of product-related conversations in thediffusion of a new product. Journal of MarketingResearch, 4(3):291–295, 1967.
[5] M. Balabanovic and Y. Shoham. Fab: content-based,collaborative recommendation. Communications of theACM, 40(3):66–72, 1997.
[6] A. Barrat, M. Barthlemy, and A. Vespignani.Dynamical Processes on Complex Networks.Cambridge University Press New York, NY, USA,2008.
[7] S. Bergamaschi, F. Guerra, and B. Leiba. Informationoverload. Internet Computing, IEEE, 14(6):10–13,2010.
[8] D. Billsus and M. Pazzani. Learning collaborativeinformation filters. In Proceedings of the FifteenthInternational Conference on Machine Learning,volume 54, page 48, 1998.
[9] A. Birukov, E. Blanzieri, and P. Giorgini. Implicit: Anagent-based recommendation system for web search.In Proceedings of the fourth international jointconference on Autonomous agents and multiagentsystems, pages 618–624. ACM, 2005.
[10] M. Blattner. B-rank: A top N recommendationalgorithm. In Proceedings of The InternationalMulti-Conference on Complexity, Informatics andCybernetics (IMCIC 2010), volume 1, pages 337–341,Orlando, USA, 2010.
[11] J. Breese, D. Heckerman, and C. Kadie. Empiricalanalysis of predictive algorithms for collaborativefiltering. In Proceedings of the 14th Annual Conferenceon Uncertainty in Artificial Intelligence (UAI-98),pages 43–52, San Francisco, CA, 1998. MorganKaufmann.
[12] P. Brusilovsky, A. Kobsa, and W. Nejdl. The adaptiveweb: methods and strategies of web personalization.Springer-Verlag New York Inc, 2007.
[13] G. Caron-Lormier, R. Humphry, D. Bohan, C. Hawes,and P. Thorbek. Asynchronous and synchronousupdating in individual-based models. ecologicalmodelling, 212(3-4):522–527, 2008.
[14] M. Claypool, A. Gokhale, T. Miranda, P. Murnikov,D. Netes, and M. Sartin. Combining content-basedand collaborative filters in an online newspaper. InProc. ACM SIGIR 99, Workshop RecommenderSystems: Algorithms and Evaluation, 1999.
[15] H. Drachsler, T. Bogers, R. Vuorikari, K. Verbert,E. Duval, N. Manouselis, G. Beham, S. Lindstaedt,H. Stern, M. Friedrich, et al. Issues and considerationsregarding sharable data sets for recommender systemsin technology enhanced learning. Procedia ComputerScience, 1(2):2849–2858, 2010.
[16] F. Fouss, A. Pirotte, J. Renders, and M. Saerens.Random-walk computation of similarities betweennodes of a graph with application to collaborativerecommendation. Knowledge and Data Engineering,IEEE Transactions on, 19(3):355–369, 2007.
[17] F. Fouss, L. Yen, A. Pirotte, and M. Saerens. Anexperimental investigation of graph kernels on acollaborative recommendation task. In Data Mining,2006. ICDM’06. Sixth International Conference on,pages 863–868. IEEE, 2007.
[18] W. Geyer, J. Freyne, B. Mobasher, S. Anand, andC. Dugan. 2nd workshop on recommender systemsand the social web. In Proceedings of the fourth ACMconference on Recommender systems, pages 379–380.ACM, 2010.
[19] J. Gleeson. High-accuracy approximation ofbinary-state dynamics on networks. Physical ReviewLetters, 107(6):68701, 2011.
[20] D. Goldberg, B. D. Nichols, and D. Terry. Usingcollaborative filtering to weave an informationtapestry. Commun. ACM, 35(12):61–70, 1992.
[21] N. Good, J. Schafer, J. Konstan, A. Brochers,B. Sarwar, J. Herlocker, and J. Riedl. Combiningcollaborative filtering with personal agents for betterrecommendations. In Proc. Conf. Am. Assoc. ArtificialIntelligence (AAAI-99), pages 439–446, USA, 1999.
[22] I. Guy, A. Jaimes, P. Agullo, P. Moore, P. Nandy,C. Nastar, and H. Schinzel. Will recommenders kill
38

search?: recommender systems-an industryperspective. In Proceedings of the fourth ACMconference on Recommender systems, pages 7–12.ACM, 2010.
[23] T. Hennig-Thurau, K. Gwinner, G. Walsh, andD. Gremler. Electronic word-of-mouth viaconsumer-opinion platforms: What motivatesconsumers to articulate themselves on the Internet?Journal of Interactive Marketing, 18(1):38–52, 2004.
[24] J. Herlocker, J. Konstan, L. Terveen, and J. Riedl.Evaluating collaborative filtering recommendersystems. ACM Trans. Inf. Syst., 22(1):5–53, 2004.
[25] D. Jannach, W. Geyer, J. Freyne, S. Anand,C. Dugan, B. Mobasher, and A. Kobsa. RecommenderSystems & the Social Web. In Proceedings of the 2009ACM Conference on Recommender Systems, RecSys2009, New York, NY, USA, October 23-25, 2009.ACM, 2009.
[26] K.Goldberg, T. Roeder, D. Gupta, and C. Perkins.Eigentaste: a constant time collaborative filteringalgorithm. Information Retrieval, (4):133–151, 2001.
[27] Y. Kim and J. Srivastava. Impact of social influence ine-commerce decision making. Proceedings of the ninthinternational conference on Electronic commerce(ICEC), pages 293–302, 2007.
[28] J. Konstan, B. Miller, D. Maltz, J. Herlocker, andL. Gordon. Grouplens: Applying collaborative filteringto usenet news. Comm. ACM, 40(3):77–87, 1997.
[29] S. Kullback and R. Leibler. On information andsufficiency. The Annals of Mathematical Statistics,22(1):79–86, 1951.
[30] G. Linden, B. Smith, and J. York. Amazon. comrecommendations: Item-to-item collaborative filtering.IEEE Internet computing, 7(1):76–80, 2003.
[31] M. Mason, R. Dyer, and M. Norton. Neuralmechanisms of social influence. OrganizationalBehavior and Human Decision Processes,110(2):152–159, 2009.
[32] P. Massa and P. Avesani. Trust-aware collaborativefiltering for recommender systems. On the Move toMeaningful Internet Systems 2004: CoopIS, DOA, andODBASE, pages 492–508, 2004.
[33] P. Massa and B. Bhattacharjee. Using trust inrecommender systems: an experimental analysis. TrustManagement, pages 221–235, 2004.
[34] M.E.J.Newman. Structure and function of complexnetworks. SIAM Review, 45:167–256, 2003.
[35] P. Melville, R. Mooney, and R. Nagarajan.Content-boosted collaborative filtering for improvedrecommendations. In Proc. 18h Nat’l Conf. ARtificialIntelligence, 2002.
[36] Q. Michard and J. Bouchaud. Theory of collectiveopinion shifts: from smooth trends to abrupt swings.The European Physical Journal B-Condensed Matterand Complex Systems, 47(1):151–159, 2005.
[37] B. Mirza, B. Keller, and N. Ramakrishnan. Studyingrecommendation algorithms by graph analysis.Journal of Intelligent Information Systems,20(2):131–160, 2003.
[38] M. Newman. Spread of epidemic disease on networks.Physical Review E, 66(1):016128, 2002.
[39] J. O’Donovan and B. Smyth. Trust in recommendersystems. In Proceedings of the 10th internationalconference on Intelligent user interfaces, pages167–174. ACM, 2005.
[40] M. Pazzani and D. Billsus. Content-basedrecommendation systems. Lecture Notes ComputerScience, 4321:325–341, 2007.
[41] P. Resnick, N. Iakovou, M. Sushak, P. Bergstrom, andJ. Riedl. Grouplens: An open architecture forcollaborative filtering of netwews. In Proc. ComputerSupported Cooberative Work Conf., 1994.
[42] P. Resnick and H. Varian. Recommender systems.Commun. ACM, 40:56–58, March 1997.
[43] F. Ricci, L. Rokach, B. Shapira, and P. B. Kantor,editors. Recommender Systems Handbook. Springer,2011.
[44] M. Richins and T. Root-Shaffer. THE ROLE OFEVOLVEMENT AND OPINION LEADERSHIP INCONSUMER WORD-OF-MOUTH: AN IMPLICITMODEL MADE EXPLICIT. Advances in consumerresearch, 15:32–36, 1988.
[45] B. Sarwar, G. Karypis, J. Konstan, and J. Reidl.Item-based collaborative filtering recommendationalgorithms. In WWW ’01: Proceedings of the 10thinternational conference on World Wide Web, pages285–295, New York, NY, USA, 2001. ACM Press.
[46] K. Sugiyama, K. Hatano, and M. Yoshikawa. Adaptiveweb search based on user profile constructed withoutany effort from users. In Proceedings of the 13thinternational conference on World Wide Web, pages675–684. ACM, 2004.
[47] F. Walter, S. Battiston, and F. Schweitzer. A model ofa trust-based recommendation system on a socialnetwork. Autonomous Agents and Multi-AgentSystems, 16(1):57–74, 2008.
[48] G. Webb, M. Pazzani, and D. Billsus. Machinelearning for user modeling. User Modeling andUser-Adapted Interaction, 11(1):19–29, 2001.
[49] W. Whyte Jr. The web of word of mouth, 1954.
[50] T. Zhang and V. Iyengar. Recommender systemsusing linear classifiers. The Journal of MachineLearning Research, 2:334, 2002.
[51] Y. Zhang, M. Blattner, and Y. Yu. Heat conductionprocess on community networks as a recommendationmodel. Physical review letters, 99(15):154301, 2007.
[52] T. Zhou, J. Ren, M. Medo, and Y. Zhang. Bipartitenetwork projection and personal recommendation.Physical Review E, 76(4):46115, 2007.
[53] D. Zwillinger and S. Kokoska. CRC standardprobability and statistics tables and formulae. CRC,2000.
39

Effects of Online Recommendations on Consumers’ Willingness to Pay
Gediminas Adomavicius University of Minnesota
Minneapolis, MN [email protected]
Jesse Bockstedt University of Arizona
Tucson, AZ [email protected]
na.edu
Shawn Curley University of Minnesota
Minneapolis, MN [email protected]
Jingjing Zhang Indiana University Bloomington, IN
ABSTRACT We present the results of two controlled behavioral studies on the effects of online recommendations on consumers’ economic behavior. In the first study, we found strong evidence that participants’ willingness to pay was significantly affected by randomly assigned song recommendations, even when controlling for participants’ preferences and demographics. In the second study, we presented participants with actual system-generated recommendations that were intentionally perturbed (i.e., significant error was introduced) and observed similar effects on willingness to pay. The results have significant implications for the design and application of recommender systems as well as for e-commerce practice.
1. INTRODUCTION Recommender systems have become commonplace in online purchasing environments. Much research in information systems and computer science has focused on algorithmic design and improving recommender systems’ performance (see Adomavicius & Tuzhilin 2005 for a review). However, little research has explored the impact of recommender systems on consumer behavior from an economic or decision-making perspective. Considering how important recommender systems have become in helping consumers reduce search costs to make purchase decisions, it is necessary to understand how online recommender systems influence purchases.
In this paper, we investigate the relationship between recommender systems and consumers’ economic behavior. Drawing on theory from behavioral economics, judgment and decision-making, and marketing, we hypothesize that online recommendations1 significantly pull a consumer’s willingness to pay in the direction of the recommendation. We test our hypotheses using two controlled behavioral experiments on the recommendation and sale of digital songs. In the first study, we find strong evidence that randomly generated recommendations (i.e., not based on user preferences) significantly impact consumers’ willingness to pay, even when we control for user preferences for the song, demographic and consumption-related factors, and individual level heterogeneity. In the second study,
1 In this paper, for ease of exposition, we use the term “recommendations” in a broad sense. Any rating that the consumer receives purportedly from a recommendation system, even if negative (e.g., 1 star on a five-star scale), is termed a recommendation of the system.
we extend these results and find strong evidence that these effects still exist with real recommendations generated by a live real-time recommender system. The results of the second study demonstrate that errors in recommendation, a common feature of live recommender systems, can significantly impact the economic behaviors of consumers toward the recommended products.
2. LITERATURE REVIEW AND HYPOTHESES
Behavioral research has indicated that judgments can be constructed upon request and, consequently, are often influenced by elements of the environment. One such influence arises from the use of an anchoring-and-adjustment heuristic (Tversky and Kahneman 1974; see review by Chapman and Johnson 2002), the focus of the current study. Using this heuristic, the decision maker begins with an initial value and adjusts it as needed to arrive at the final judgment. A systematic bias has been observed with this process in that decision makers tend to arrive at a judgment that is skewed toward the initial anchor.
Past studies have largely been performed using tasks for which a verifiable outcome is being judged, leading to a bias measured against an objective performance standard (e.g., see review by Chapman and Johnson 2002). In the recommendation setting, the judgment is a subjective preference and is not verifiable against an objective standard. This aspect of the recommendation setting is one of the task elements illustrated in Figure 1, where accuracy is measured as a comparison between the rating prediction and the consumer’s actual rating, a subjective outcome. Also illustrated in Figure 1 is the feedback system involved in the use of recommender systems. Predicted ratings (recommendations) are systematically tied to the consumer’s perceptions of products. Therefore, providing consumers with a predicted “system rating” can potentially introduce anchoring biases that significantly influence their subsequent ratings of items.
One of the few papers identified in the mainstream anchoring literature that has looked directly at anchoring effects in preference construction is that of Schkade and Johnson (1989). However, their work studied preferences between abstract, stylized, simple (two-outcome) lotteries. This preference situation is far removed from the more realistic situation that we address in this work. More similar to our setting, Ariely et al. (2003) observed anchoring in bids provided by students participating in auctions of consumer products (e.g., wine, books, chocolates) in a classroom setting. However, participants were not allowed to sample the goods, an issue we address in this study.
Paper presented at the 2012 Decisions@RecSys workshop in conjunction with the 6th ACM conference on Recommender Systems. Copyright © 2012 for the individual papers by the papers' authors. Copying permitted for private and academic purposes. This volume is published and copyrighted by its editors.
40
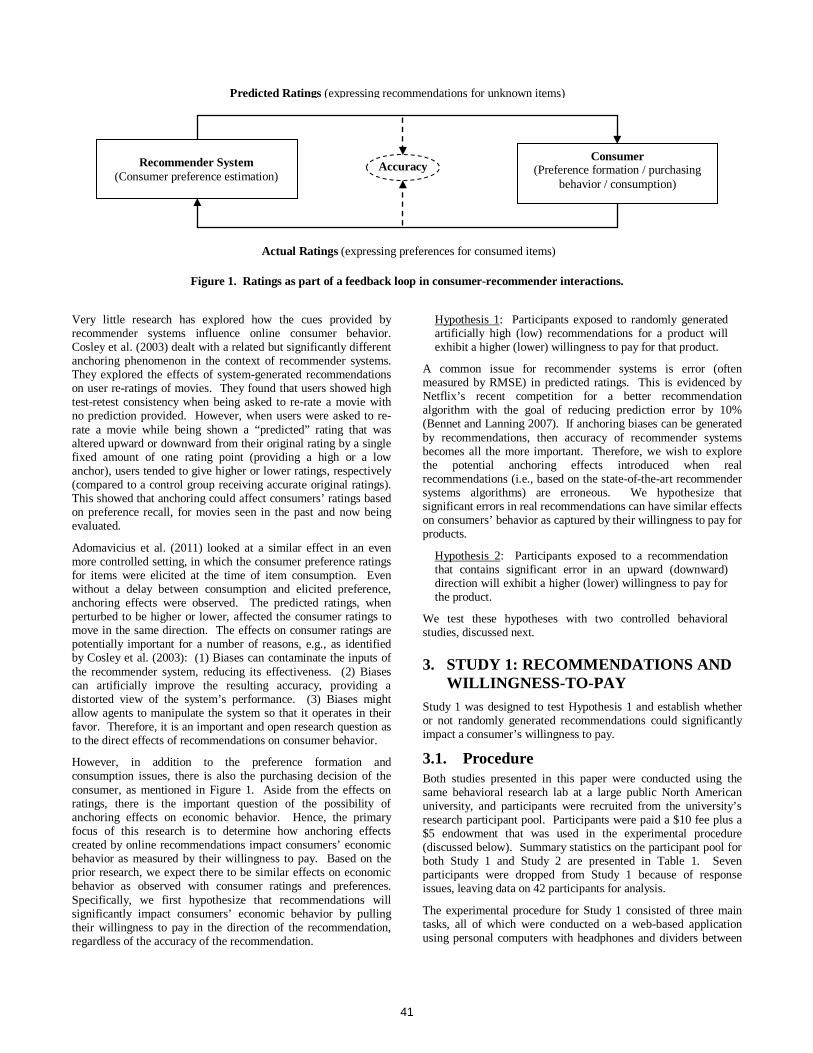
Figure 1. Ratings as part of a feedback loop in consumer-recommender interactions.
Very little research has explored how the cues provided by recommender systems influence online consumer behavior. Cosley et al. (2003) dealt with a related but significantly different anchoring phenomenon in the context of recommender systems. They explored the effects of system-generated recommendations on user re-ratings of movies. They found that users showed high test-retest consistency when being asked to re-rate a movie with no prediction provided. However, when users were asked to re-rate a movie while being shown a “predicted” rating that was altered upward or downward from their original rating by a single fixed amount of one rating point (providing a high or a low anchor), users tended to give higher or lower ratings, respectively (compared to a control group receiving accurate original ratings). This showed that anchoring could affect consumers’ ratings based on preference recall, for movies seen in the past and now being evaluated.
Adomavicius et al. (2011) looked at a similar effect in an even more controlled setting, in which the consumer preference ratings for items were elicited at the time of item consumption. Even without a delay between consumption and elicited preference, anchoring effects were observed. The predicted ratings, when perturbed to be higher or lower, affected the consumer ratings to move in the same direction. The effects on consumer ratings are potentially important for a number of reasons, e.g., as identified by Cosley et al. (2003): (1) Biases can contaminate the inputs of the recommender system, reducing its effectiveness. (2) Biases can artificially improve the resulting accuracy, providing a distorted view of the system’s performance. (3) Biases might allow agents to manipulate the system so that it operates in their favor. Therefore, it is an important and open research question as to the direct effects of recommendations on consumer behavior.
However, in addition to the preference formation and consumption issues, there is also the purchasing decision of the consumer, as mentioned in Figure 1. Aside from the effects on ratings, there is the important question of the possibility of anchoring effects on economic behavior. Hence, the primary focus of this research is to determine how anchoring effects created by online recommendations impact consumers’ economic behavior as measured by their willingness to pay. Based on the prior research, we expect there to be similar effects on economic behavior as observed with consumer ratings and preferences. Specifically, we first hypothesize that recommendations will significantly impact consumers’ economic behavior by pulling their willingness to pay in the direction of the recommendation, regardless of the accuracy of the recommendation.
Hypothesis 1: Participants exposed to randomly generated artificially high (low) recommendations for a product will exhibit a higher (lower) willingness to pay for that product.
A common issue for recommender systems is error (often measured by RMSE) in predicted ratings. This is evidenced by Netflix’s recent competition for a better recommendation algorithm with the goal of reducing prediction error by 10% (Bennet and Lanning 2007). If anchoring biases can be generated by recommendations, then accuracy of recommender systems becomes all the more important. Therefore, we wish to explore the potential anchoring effects introduced when real recommendations (i.e., based on the state-of-the-art recommender systems algorithms) are erroneous. We hypothesize that significant errors in real recommendations can have similar effects on consumers’ behavior as captured by their willingness to pay for products.
Hypothesis 2: Participants exposed to a recommendation that contains significant error in an upward (downward) direction will exhibit a higher (lower) willingness to pay for the product.
We test these hypotheses with two controlled behavioral studies, discussed next.
3. STUDY 1: RECOMMENDATIONS AND WILLINGNESS-TO-PAY
Study 1 was designed to test Hypothesis 1 and establish whether or not randomly generated recommendations could significantly impact a consumer’s willingness to pay.
3.1. Procedure Both studies presented in this paper were conducted using the same behavioral research lab at a large public North American university, and participants were recruited from the university’s research participant pool. Participants were paid a $10 fee plus a $5 endowment that was used in the experimental procedure (discussed below). Summary statistics on the participant pool for both Study 1 and Study 2 are presented in Table 1. Seven participants were dropped from Study 1 because of response issues, leaving data on 42 participants for analysis.
The experimental procedure for Study 1 consisted of three main tasks, all of which were conducted on a web-based application using personal computers with headphones and dividers between
Recommender System (Consumer preference estimation)
Consumer (Preference formation / purchasing
behavior / consumption)
Predicted Ratings (expressing recommendations for unknown items)
Actual Ratings (expressing preferences for consumed items)
Accuracy
41

participants. In the first task, participants were asked to provide ratings for at least 50 popular music songs on a scale from one to five stars with half-star increments. The songs presented for the initial rating task were randomly selected from a pool of 200 popular songs, which was generated by taking the songs ranked in the bottom half of the year-end Billboard 100 charts from 2006 and 2009.2 For each song, the artist name(s), song title, duration, album name, and a 30-second sample were provided. The objective of the song-rating task was to capture music preferences from the participants so that recommendations could later be generated using a recommendation algorithm (in Study 2 and post-hoc analysis of Study 1, as discussed later).
Table 1 Participant summary statistics.
Study 1 Study 2
# of Participants (n) 42 55
Average Age (years) 21.5 (1.95) 22.9 (2.44)
Gender 28 Female, 14 Male
31 Female, 24 Male
Prior experience with recommender systems 50% (21/42) 47.3% (26/55)
Student Level 36 undergrad, 6 grad
27 undergrad, 25 grad, 3 other
Buy new music at least once a month 66.7% (28/42) 63.6% (35/55)
Own more than 1000 songs 50% (21/42) 47.3% (26/55)
In the second task, a different list of songs was presented (with the same information for each song as in the first task) from the same set of 200 songs. For each song, the participant was asked whether or not they owned the song. Songs that were owned were excluded from the third task, in which willingness-to-pay judgments were obtained. When the participants identified at least 40 songs that they did not own, the third task was initiated.
In the third main task of Study 1, participants completed a within-subjects experiment where the treatment was the star rating of the song recommendation and the dependent variable was willingness to pay for the songs. In the experiment, participants were presented with 40 songs that they did not own, which included a star rating recommendation, artist name(s), song title, duration, album name, and a 30 second sample for each song. Ten of the 40 songs were presented with a randomly generated low recommendation between one and two stars (drawn from a uniform distribution; all recommendations were presented with a one decimal place precision, e.g., 1.3 stars), ten were presented with a randomly generated high recommendation between four and five stars, ten were presented with a randomly generated mid-range recommendation between 2.5 and 3.5 stars, and ten were presented with no recommendation to act as a control. The 30 songs presented with recommendations were randomly ordered, and the 10 control songs were presented last.
2 The Billboard 100 provides a list of popular songs released in each year. The top half of each year’s list was not used to reduce the number of songs in our database that participants would already own.
To capture willingness to pay, we employed the incentive-compatible Becker-DeGroot-Marschack method (BDM) commonly used in experimental economics (Becker et al. 1984). For each song presented during the third task of the study, participants were asked to declare a price they were willing to pay between zero and 99 cents. Participants were informed that five songs selected at random at the end of the study would be assigned random prices, based on a uniform distribution, between one and 99 cents. For each of these five songs, the participant was required to purchase the song using money from their $5 endowment at the randomly assigned price if it was equal to or below their declared willingness to pay. Participants were presented with a detailed explanation of the BDM method so that they understood that the procedure incentivizes accurate reporting of their prices, and were required to take a short quiz on the method and endowment distribution before starting the study.
At the conclusion of the study, they completed a short survey collecting demographic and other individual information for use in the analyses. The participation fee and the endowment minus fees paid for the required purchases were distributed to participants in cash. MP3 versions of the songs purchased by participants were “gifted” to them through Amazon.com approximately within 12 hours after the study was concluded.
3.2. Analysis and Results We start by presenting a plot of the aggregate means of willingness to pay for each of the treatment groups in Figure 2. Note that, although there were three treatment groups, the actual ratings shown to the participants were randomly assigned star ratings from within the corresponding treatment group range (low: 1.0-2.0 stars, mid: 2.5-3.5 stars, high: 4.0-5.0 stars).
As an initial analysis, we performed a repeated measure ANOVA, as shown in Table 2, demonstrating a statistically significant effect of the shown rating on willingness to pay. Since the overall treatment effect was significant, we followed with pair-wise contrasts using t-tests across treatment levels and against the control group as shown in Table 3. All three treatment conditions significantly differed, showing a clear, positive effect of the treatment on economic behavior.
To provide additional depth for our analysis, we used a panel data regression model to explore the relationship between the shown star rating (continuous variable) and willingness to pay, while controlling for participant level factors. A Hausman test was conducted, and a random effects model was deemed appropriate, which also allowed us to account for participant level covariates in the analysis. The dependent variable, i.e., willingness to pay, was measured on an integer scale between 0 and 99 and skewed toward the lower end of the scale. This is representative of typical count data; therefore, a Poisson regression was used (overdispersion was not an issue). The main independent variable was the shown star rating of the recommendation, which was continuous between one and five stars. Control variables for several demographic and consumer-related factors were included, which were captured in the survey at the end of the study. Additionally, we controlled for the participants’ preferences by calculating an actual predicted star rating recommendation for each song (on a 5 star scale with one decimal precision), post hoc, using the popular and widely-used item-based collaborative
42

filtering algorithm (IBCF) (Sarwar et al. 2001).3 By including this predicted rating (which was not shown to the participant during the study) in the analysis, we are able to determine if the random recommendations had an impact on willingness to pay above and beyond the participant’s predicted preferences.
Figure 2. Study 1 treatment means.
Table 2. Study 1 repeated measures ANOVA.
Partial Sum of Squares
Degrees of Freedom
Mean Square
F Statistic
P value
Participant 396744.78 41 9676.70 Treatment Level 24469.41 2 12234.70 42.27 <0.000
Residual 346142.41 1196 289.42
Total 762747.40 1239 615.62
Table 3. Comparison of aggregate treatment group means with t-tests.
Control Low Mid Low (1-2 Star) 4.436*** Mid (2.5-3.5 Star) 0.555 4.075*** High (4-5 Star) 1.138 5.501*** 1.723** * p<0.1, ** p<0.05, *** p <0.01 2-tailed t-test for Control vs. Mid, all else 1-tailed. The resulting Poisson regression model is shown below, where WTPij is the reported willingness to pay for participant i on song j, ShownRatingij is the recommendation star rating shown to participant i for song j, PredictedRatingij is the predicted recommendation star rating for participant i on song j, and Controlsi is a vector of demographic and consumer-related variables for participant i. The controls included in the model were gender (binary), age (integer), school level (undergrad yes/no binary), whether they have prior experience with recommendation systems (yes/no binary), preference ratings
3 Several recommendation algorithms were evaluated based on the Study 1 training data, and IBCF was selected for us in both studies because it had the highest predictive accuracy.
(interval five point scale) for the music genres country, rock, hip hop, and pop, the number of songs owned (interval five point scale), frequency of music purchases (interval five point scale), whether they thought recommendations in the study were accurate (interval five point scale), and whether they thought the recommendations were useful (interval five point scale). The composite error term (ui + εij) includes the individual participant effect ui and the standard disturbance term εij.
log(WTPij)= b0 + b1(ShownRatingij)+ b2(PredictedRatingij) + b3(Controlsi) + ui + εij
The results of the regression are shown in Table 4. Note that the control observations were not included, since they had null values for the main dependent variable ShownRating.
The results of our analysis for Study 1 provide strong support for Hypothesis 1 and demonstrate clearly that there is a significant effect of recommendations on consumers’ economic behavior. Specifically, we have shown that even randomly generated recommendations with no basis on user preferences can impact consumers’ perceptions of a product and, thus, their willingness to pay. The regression analysis goes further and controls for participant level factors and, most importantly, the participant’s predicted preferences for the product being recommended. As can be seen in Table 4, after controlling for all these factors, a one unit change in the shown rating results in a 0.168 change (in the same direction) in the log of the expected willingness to pay (in cents). As an example, assuming a consumer has a willingness to pay of $0.50 for a specific song and is given a recommendation, increasing the recommendation star rating by one star would increase the consumer’s willingness to pay to $0.59.
Table 4. Study 1 regression results Dependent Variable: log(Willingness to Pay)
Variable Coefficient Std. Error ShownRating 0.168*** 0.004 PredictedRating 0.323*** 0.015 Controls male -0.636** 0.289 undergrad -0.142 0.642 age -0.105 0.119 usedRecSys -0.836** 0.319 country 0.103 0.108 rock 0.125 0.157 hiphop 0.152 0.132 pop 0.157 0.156 recomUseful -0.374 0.255 recomAccurate 0.414* 0.217 buyingFreq -0.180 0.175 songsOwned -0.407* 0.223 constant 4.437 3.414 Number of Obs. 1240 Number of Participants 42 Log-likelihood -9983.3312 Wald Chi-Square Statistic (p-value)
1566.34 (0.0000)
* p<0.1, ** p<0.05, *** p <0.01
4. STUDY 2: ERRORS IN RECOMMENDATIONS
The goal of Study 2 was to extend the results of Study 1 by testing Hypothesis 2 and exploring the impact of significant error in true
43

recommendations on consumers’ willingness to pay. As discussed below, the design of this study is intended to test for similar effects as Study 1, but in a more realistic setting with recommender-system-generated, real-time recommendations..
4.1. Procedure Participants in Study 2 used the same facilities and were recruited from the same pool as in Study 1; however, there was no overlap in participants across the two studies. The same participation fee and endowment used in Study 1 was provided to participants in Study 2. 15 participants were removed from the analysis in Study 2 because of issues in their responses, leaving data on 55 participants for analysis.
Study 2 was also a within-subjects design with perturbation of the recommendation star rating as the treatment and willingness to pay as the dependent variable. The main tasks for Study 2 were virtually identical to those in Study 1. The only differences between the studies were the treatments and the process for assigning stimuli to the participants in the recommendation task of the study. In Study 2, all participants completed the initial song-rating and song ownership tasks as in Study 1. Next, real song recommendations were calculated based on the participants’ preferences, which were then perturbed (i.e., excess error was introduced to each recommendation) to generate the shown recommendation ratings. In other words, unlike Study 1 in which random recommendations were presented to participants, in Study 2 participants were presented with perturbed versions of their actual personalized recommendations. Perturbations of -1.5 stars, -1 star, -0.5 stars, 0 stars, +0.5 stars, +1 star, and +1.5 stars were added to the actual recommendations, representing seven treatment levels. The perturbed recommendation shown to the participant was constrained to be between one and five stars, therefore perturbations were pseudo-randomly assigned to ensure that the sum of the actual recommendation and the perturbation would fit within the allowed rating scale. The recommendations were calculated using the item-based collaborative filtering (IBCF) algorithm (Sarwar et al. 2001), and the ratings data from Study 1 was used as training data.
Each participant was presented with 35 perturbed, personalized song recommendations, five from each of the seven treatment levels. The song recommendations were presented in a random order. Participants were asked to provide their willingness to pay for each song, which was captured using the same BDM technique as in Study 1. The final survey, payouts, and song distribution were also conducted in the same manner as in Study 1.
4.2. Analysis and Results For Study 2, we focus on the regression analysis to determine the relationship between error in a recommendation and willingness to pay. We follow a similar approach as in Study 1 and model this relationship using a Poisson random effects regression model. The distribution of willingness to pay data in Study 2 was similar to that of Study 1, overdispersion was not an issue, and the results of a Hausman test for fixed versus random effects suggested that a random effects model was appropriate. We control for the participants’ preferences using the predicted rating for each song in the study (i.e., the recommendation rating prior to perturbation), which was calculated using the IBCF algorithm. Furthermore, the same set of control variables used in Study 1 was included in our regression model for Study 2. The resulting regression model is presented below, where the main difference
from the model used in Study 1 is the inclusion of Perturbationij (i.e., the error introduced for the recommendation of song j to participant i) as the main independent variable. The results are presented in Table 5.
log(WTPij)= b0 + b1(Perturbationij)+ b2(PredictedRatingij) + b3(Controlsi) + ui + εij
The results of Study 2 provide strong support for Hypothesis 2 and extend the results of Study 1 in two important ways. First, Study 2 provides more realism to the analysis, since it utilizes real recommendations generated using an actual real-time recommender system. Second, rather than randomly assigning recommendations as in Study 1, in Study 2 the recommendations presented to participants were calculated based on their preferences and then perturbed to introduce realistic levels of system error. Thus, considering the fact that all recommender systems have some level of error in their recommendations, Study 2 contributes by demonstrating the potential impact of these errors. As seen in Table 5, while controlling for preferences and other factors, a one unit perturbation in the actual rating results in a 0.115 change in the log of the participant’s willingness to pay. As an example, assuming a consumer has a willingness to pay of $0.50 for a given song, perturbing the system’s recommendation positively by one star would increase the consumer’s willingness to pay to $0.56.
Table 5. Study 2 regression results. Dependent Variable: log(Willingness to Pay)
Variable Coefficient Std. Error Perturbation 0.115*** 0.005 PredictedRating 0.483*** 0.012 Controls male -0.045 0.254 undergrad -0.092 0.293 age -0.002 0.053 usedRecSys 0.379 0.253 country -0.056 0.129 rock -0.132 0.112 hiphop 0.0137 0.108 pop -0.035 0.124 recomUseful 0.203* 0.112 recomAccurate 0.060 0.161 buyingFreq 0.276** 0.128 songsOwned -0.036 0.156 constant 0.548 1.623 Number of Obs. 1925 Number of Participants 55 Log-likelihood -16630.547 Wald Chi-Square Statistic (p-value)
2374.72 (0.0000)
* p<0.1, ** p<0.05, *** p <0.01
5. CONCLUSIONS Study 1 provided strong evidence that willingness to pay can be affected by online recommendations through a randomized trial design. Participants presented with random recommendations were influenced even when controlling for demographic factors and general preferences. Study 2 extended these results to demonstrate that the same effects exist for real recommendations that contain errors, which were calculated using the state-of-the-art recommendation algorithms used in practice.
44

There are significant implications of the results presented. First, the results raise new issues on the design of recommender systems. If recommender systems can generate biases in consumer decision-making, do the algorithms need to be adjusted to compensate for such biases? Furthermore, since recommender systems use a feedback loop based on consumer purchase decisions, do recommender systems need to be calibrated to handle biased input? Second, biases in decision-making based on online recommendations can potentially be used to the advantage of e-commerce companies, and retailers can potentially become more strategic in their use of recommender systems as a means of increasing profit and marketing to consumers. Third, consumers may need to become more cognizant of the potential decision making biases introduced through online recommendations. Just as savvy consumers understand the impacts of advertising, discounting, and pricing strategies, they may also need to consider the potential impact of recommendations on their purchasing decisions.
6. ACKNOWLEDGMENT This work is supported in part by the National Science Foundation grant IIS-0546443.
REFERENCES [1] Adomavicius, G., Bockstedt, J., Curley, S., and Zhang, J.
2011. Recommender Systems, Consumer Preferences, and Anchoring Effects. Proceedings of the RecSys 2011 Workshop on Human Decision Making in Recommender Systems (Decisions@RecSys 2011), Chicago IL, October 27, pp. 35-42.
[2] Adomavicius, G. and Tuzhilin, A. 2005. Towards the Next Generation of Recommender Systems: A Survey of the State-
of-the-Art and Possible Extensions. IEEE Transactions on Knowledge and Data Engineering, 17 (6) pp. 734-749.
[3] Ariely, D., Lewenstein, G., and Prelec, D. 2003. “Coherent arbitrariness”: Stable demand curves without stable preferences, Quarterly Journal of Economics (118), pp. 73-105.
[4] Becker G.M., DeGroot M.H., and Marschak J. 1964. Measuring utility by a single-response sequential method. Behavioral Science, 9 (3) pp. 226–32.
[5] Bennet, J. and Lanning, S. 2007. The Netflix Prize. KDD Cup and Workshop. [www.netflixprize.com].
[6] Chapman, G. and Johnson, E. 2002. Incorporating the irrelevant: anchors in judgments of belief and value. Heuristics and Biases: The Psychology of Intuitive Judgment, T. Gilovich, D. Griffin and D. Kahneman (eds.), Cambridge University Press, Cambridge, pp. 120-138.
[7] Cosley, D., Lam, S., Albert, I., Konstan, J.A., and Riedl, J. 2003. Is seeing believing? How recommender interfaces affect users’ opinions. CHI 2003 Conference, Fort Lauderdale FL.
[8] Sarwar, B., Karypis, G., Konstan, J., and Riedl, J. 2001. Item-based collaborative filtering algorithms. 10th Annual World Wide Web Conference (WWW10), May 1-5, Hong Kong.
[9] Schkade, D.A. and Johnson, E.J. 1989. Cognitive processes in preference reversals. Organizational Behavior and Human Decision Processes, (44), pp. 203-231.
[10] Tversky, A., and Kahneman, D. 1974. Judgment under uncertainty: Heuristics and biases. Science, (185), pp. 1124-1131.
45