human occupant contribution to secondary aerosol mass in
TRANSCRIPT

Human occupant contribution to secondary aerosol mass in the indoor environment
Journal: Environmental Science: Processes & Impacts
Manuscript ID EM-ART-02-2019-000097.R1
Article Type: Paper
Date Submitted by the Author: 09-Apr-2019
Complete List of Authors: Avery, Anita; Drexel University, Civil, Architectural, and Environmental Engineering; Aerodyne Research Inc, Center for Aerosol and Cloud Chemistry Waring, Michael; Drexel University College of Engineering, Civil, Architectural, and Environmental EngineeringDeCarlo, Peter; Drexel University College of Engineering, Civil, Architectural, and Environmental Engineering; Drexel University College of Arts and Sciences, Chemistry
Environmental Science: Processes & Impacts
Environmental Significance
Particles in the indoor environment come from a variety of different sources including transport
from outdoors, and indoor activities such as cooking, cleaning, and smoking. Human occupant
contributions to indoor aerosol loading by way of chemical reaction is not generally identified as
a significant contributor. However, in spaces with high occupancy such as a classroom and no
significant other indoor sources, we observe enhanced ozone loss attributed to reactions with
human skin oils and a subsequent increase in organic aerosol concentration. This 25% increase
in indoor organic aerosol is an additional mass burden in occupied spaces.
Page 1 of 17 Environmental Science: Processes & Impacts
123456789101112131415161718192021222324252627282930313233343536373839404142434445464748495051525354555657585960
Environmental Science: Processes & Impacts
ARTICLE
This journal is © The Royal Society of Chemistry 20xx J. Name., 2013, 00, 1-3 | 1
Please do not adjust margins
Please do not adjust margins
Received 00th January 20xx,Accepted 00th January 20xx
DOI: 10.1039/x0xx00000x
www.rsc.org/
Human occupant contribution to secondary aerosol mass in the indoor environmentAnita M. Avery, a,† Michael S. Waring a and Peter F. DeCarlo a,b *
Humans impact indoor air quality directly via emissions from skin, breath, or personal care products, and indirectly via reactions of oxidants with skin constituents, or with skin that has been shed. However, separating the influence of the many emissions and their oxidation products from the influence of outdoor-originated aerosols has been a challenge. Indoor and outdoor aerosols were alternatively sampled at 4-minute time resolution with a high-resolution time-of-flight aerosol mass spectrometer (HR-ToF-AMS) in a classroom with student occupants at regular intervals per university class schedule. Mass spectral analysis showed aerosol enhancements of oxidized and unoxidized hydrocarbon ion families during occupied periods, especially at ion fragments larger than m/z 100 and double bond equivalents consistent with squalene (C30H50) and its oxidized products from reaction with ozone, indicative of the secondary nature of the aerosol mass. Individual hydrocarbon mass fragments consistent with squalene fragmentation, including C5H9
+, and C6H9+ were especially enhanced
with room occupancy. Emissions of individual organic fragment ions were estimated using a model accounting for outdoor aerosols and air exchange. This showed occupancy related emissions at smaller fragments (C3H5
+, C4H9+) that despite
reflecting mostly outdoor-originated aerosols transported indoors, also show enhancements from occupant emissions indoors. Total emission of all fragments was 17.6 µg above unoccupied levels, translating to approximately 25% 𝛽 ―1 h ―1
increase in organic aerosol mass concentration in the classroom during an occupied hour with a median occupied ozone loss (β). Human occupants, therefore, represent an additional mass burden of organic aerosol, especially in poorly ventilated or highly occupied indoor spaces.
Introduction
Sources of aerosols indoors
Exposure to aerosols indoors has been linked to a host of adverse health effects.1 Indoor aerosol concentrations are dependent on size-dependent filtration and deposition, penetration of outdoor aerosols, and indoor emissions.2 The indoor concentration divided by that of outdoor (i.e., indoor-outdoor ratio) describes the proportion of outdoor aerosols that make their way indoors in the absence of indoor emissions. However, indoor emissions including smoking,3 cooking,4,5 and cleaning6–8 add to the aerosol population while they occur, and until they are removed via ventilation, filtration, or deposition. In spaces where some of these emissions are not common or not allowed (i.e., non-residential buildings), including classrooms and offices, the indoor aerosol population is dominated by outdoor aerosol introduction. Human contributions from breath or skin have not been considered a substantial mass addition to the aerosol phase. The outdoor contribution of aerosols in school environments have been well studied for impacts on children,9 especially in polluted urban environments. In classrooms, offices, airplanes, and other high-population density or poorly ventilated indoor environments, human presence may contribute meaningfully to
aerosol loading, and it is the purpose of this study to investigate that contribution.
Occupant influence on the indoor environment
A recent review describes the wide range of potential impacts of humans on the indoor environment.10 These include, broadly, heterogeneous reactions of gas-phase oxidants with skin constituents on people and with skin that has been shed (desquamation), and emissions from people themselves, including from the personal care products they use. Most work to date has focused on the human impact on ozone depletion, and the subsequent VOC emissions. Ozone, transported indoors from outdoors or emitted from cleaning devices11 or printers,12 reacts readily with carbon-carbon unsaturated bonds in the gas phase or on surfaces in the indoor environment to form secondary products. Human occupants provide reactive surface area (exposed skin) for ozone deposition, and leave unsaturated oils and dead skin on surfaces that can react after occupants have left. Constituents of skin oil are well known to include several types of lipids,13 but squalene (C30H50) contributes approximately 12% of the human sebum,14 and with six double bonds, is the most likely to react. It has therefore been studied as a model molecule for interaction of human skin components with ozone.
The commonly identified gas-phase products of ozone with squalene are 6-methyl-5-hepten-2-one (6-MHO), 4-oxopentanal (4-OPA), and acetone.15 These compounds and others have been identified and measured in chamber experiments using a Direct Analysis in Real Time Mass Spectrometry (DART-MS) technique,16 and in a simulated aircraft using Proton Transfer Reaction Mass Spectrometry (PTR-MS).17 Reactions of ozone with squalene sorbed to surfaces can also produce secondary aerosol mass.18 Qualitative identification of bulk aerosols in
a.Department of Civil, Architectural, and Environmental Engineering, Drexel University, Philadelphia, PA, USA.
b.Department of Chemistry, Drexel University, Philadelphia, PA, USA.† Now at: Center for Aerosol and Cloud Chemistry, Aerodyne Research, Inc., Billerica, MA, USA. Electronic Supplementary Information (ESI) available: [details of any supplementary information available should be included here]. See DOI: 10.1039/x0xx00000x
Page 2 of 17Environmental Science: Processes & Impacts
123456789101112131415161718192021222324252627282930313233343536373839404142434445464748495051525354555657585960
ARTICLE Journal Name
2 | J. Name., 2012, 00, 1-3 This journal is © The Royal Society of Chemistry 20xx
Please do not adjust margins
Please do not adjust margins
chamber experiments has been performed with Electrospray Ionization High Resolution Mass Spectrometry (ESI-HR-MS) resulting in thousands of elemental formulas,19 and indicating detectability of human influence in the aerosol phase.
Many individual VOC compounds have been identified20 and mechanisms of squalene oxidation have been proposed.21 A recent complete review of VOCs from human bodies describes the vast array of compounds identified in breath and skin.22 However, separating the influence of individuals from that of their surroundings has been challenging. A study of a classroom with real occupants separated the influence of VOCs from the building supply air from that of emissions from occupants, and found siloxanes to be the most abundant VOC.23,24 While valuable indicators of occupants, these VOC markers leave gaps in understanding the influence of occupants on the bulk aerosol population, and any exposure therein.
Connecting individual markers to bulk quantification
The Aerodyne Aerosol Mass spectrometer (AMS) has been used extensively outdoors to quantitatively measure non-refractory submicron organics, nitrate, sulfate, ammonium, and chloride in real time and at fast time resolution.25 Its use indoors is limited26–
31 but has provided the opportunity to quantitatively measure indoor and outdoor aerosol chemical composition and compare species-dependent processes between the two environments. We have performed this comparison in previous studies using the sulfate-normalized indoor-outdoor ratio, for any species, i, notated as (I/O)i/SO4.26,27 The AMS uses electron ionization (EI), which is destructive and does not provide information about the parent molecule of measured fragments. However, it is quantitative, and patterns in the mass spectrum can be probed with other techniques, usually Positive Matrix Factorization (PMF).32,33 The High-Resolution Time-of-Flight AMS (HR-AMS)34 provides the same quantitative abilities with additional mass resolution to distinguish between chemical fragments at the same nominal m/z. Fragmentation patterns and individual ion fragments analyzed in this work are possible because of this additional resolution. Here, we compare the family-level and individual molecular fragments of indoor aerosol during occupied and unoccupied periods of a university classroom, to quantify bulk aerosol impacts of occupants indoors. The family definitions are standard practice assignments, including the organic family CxHyO>1, separated from gas-phase CO2 via external gas measurements.
Experimental
Sampling Methods
Sampling took place in winter 2016 in a classroom at Drexel University in Philadelphia. The classroom had no doors or walls adjacent to the outdoors, and was surrounded by other classrooms, offices, or hallways on all sides. The floor area 49 m2 and volume 148 m3 classroom has a chalkboard and projector, painted brick walls, tiled flooring, and two non-parallel doors. Up to approx. 25 students could be seated in standalone desks during classes that were held regularly during the month-long sampling period. The HVAC system recirculated air through
other rooms on the same zone, including offices, but no other high-occupant density rooms. Sampling alternated between indoors and outdoors every 4 minutes with a custom-made valve-switching device, ensuring fast time resolution and accurate representation of the transport of aerosols and gases between the two environments. The indoor inlet reached approximately 20 m into the classroom adjacent to the instrument site. Laminar flow was maintained during indoor sampling and by a bypass during outdoor sampling, and any potential small particle losses are assumed to contribute negligibly to the aerosol mass measured here. Outdoor sampling came from a dedicated roof inlet near the HVAC system’s intake. The urban outdoor environment was influenced by regional and local emissions, including a major highway, downtown traffic, an oil refinery to the south, and food trucks operating mostly on weekdays.
Due to the cold winter season, outdoor temperatures (average 4 ± 6 ºC) were conditioned by the heating system to an indoor temperature of 22 ± 3 ºC; indoor temperatures did fluctuate some based on the outdoors (short-term low of −14 ºC outdoors corresponding to 15 ºC indoors). A time series of the temperature and humidity in each environment is in Figure S1 in the supplementary information (SI). For a full description of the weather, see Avery et al.27
Instrumentation
SOOT-PARTICLE AEROSOL MASS SPECTROMETER (SP-AMS): The SP-AMS used here was operated with the laser off as a high resolution time of flight (HR-ToF) AMS,34 measuring the standard submicron non-refractory components of organics, nitrate, sulfate, ammonium, and chloride. The size range of 100% transmission for the AMS with a standard lens is approximately 50-600 nm, with decreasing transmission efficiency for larger sizes35, such that large particles, including coarse mode resuspension particles, are not detected efficiently. A collection efficiency (CE) of 0.5 was applied to all AMS measurements in bulk, as less than 8% of the data had an ammonium nitrate mass fraction (ANMF) high enough to trigger a CE greater than 0.5.36 However, in individual fragment analysis, no CE or relative ionization efficiency (RIE) were applied, as these are not known for individual fragments. For all reported ratios of individual fragments, or derived from ratios of (sulfate-normalized) indoor and outdoor, any RIE or CE applied would be cancelled out, but emission values would be subject to changes in the CE and/or RIE. High resolution mass spectra were taken from m/z 12 to 365, although only individual fragments up to mass 146 were used in the analysis here, totalling 598 non-isotope ions fit, of which 174 fragments were detectible individually fragment level. Each fragment was assigned to its chemical family (i.e., CxHy for fragments containing only those two elements) automatically in fitting; the detection limits of individual fragments and family groups were calculated and only species above detection are included in this analysis. Specifically, CxHyO1Np and CxHyO>1Np family groups were not above detection at the family level but some individual fragments were detectible. CO2 measured by the Picarro CRDS was used for correction in the fragmentation table.37 The particle phase CO2
+ fragment in this work was separated from gas-phase
Page 3 of 17 Environmental Science: Processes & Impacts
123456789101112131415161718192021222324252627282930313233343536373839404142434445464748495051525354555657585960
Journal Name ARTICLE
This journal is © The Royal Society of Chemistry 20xx J. Name., 2013, 00, 1-3 | 3
Please do not adjust margins
Please do not adjust margins
contribution via standard methods of fragmentation table correction, including verification with filter data. Further description of this process is in the SI. PMF was used to analyze the organic aerosol (OA) spectral matrix of combined indoor and outdoor datasets. A more detailed description of factor selection and analysis for this work is provided elsewhere.27
PICARRO GAS ANALYZER: The G2401 Analyzer for CO2, CO, CH4, H2O (Picarro, Inc.) measured concentrations of given gases every 4-s. CO2 and CH4 “dry” values as automatically provided by the manufacturer were used. A pre-mixed cylinder of the target gases was used to calibrate the instrument each week.
OZONE MONITOR: The Model 211 Scrubberless Dual Beam Ozone Monitor (2B Technologies, Inc.) was used for measuring ozone at 10-s intervals. It was zeroed via scrubbed filter air daily.
METEOROLOGICAL DATA: Outdoor meteorological data (temperature, humidity, solar radiation, precipitation) was taken by a Vaisala Automatic Weather Station 310 (AWS310) housed on Drexel University campus. An Elgato Eve indoor sensor system measured indoor temperature and relative humidity (RH), was placed in the room near the sampling port.
Analytical methods
Sulfate, as a nonvolatile species, was used in two ways to account for how outdoor-originated aerosol components were lost upon reaching the indoor environment. First, a lag correction was applied to match the indoor concentration with the outdoor-originated counterparts. Second, transformations and possible emissions beyond mechanical losses were accounted for using a sulfate-normalized indoor-to-outdoor (I/O) ratio, as the indoor-outdoor ratio of any component, i, divided by that of sulfate, as (I/O)i/SO4, defined as (I/O)i/(I/O)SO4. These corrections are described in more detail in previous work.26,27
Because occupants were not counted directly in this work, CO2 was used to categorize data into “occupied” and “unoccupied” times, which will be used throughout this work. Since the classroom was attached to other rooms on the HVAC zone, CO2 varied in distinct patterns when increasing due to direct in-room occupants (steep increases in CO2 and jagged patterns at 1-min resolution while elevated) or occupants in adjacent rooms on the HVAC zone (smooth, gradual patterns). Therefore, a classification system was used to define the two cases, and compare them both to the weekend case, which was all unoccupied. Furthermore, since measured outdoor CO2 showed significant increases in plume patterns that were reflected indoors, independent of occupants (see Figure S2), hourly ∆CO2 = (CO2,indoors − CO2,outdoors) was used to classify time periods as “occupied”, “unoccupied”, or “no category”. Occupied was defined if either of the following conditions were met: (1) CO2 increasing at a rate of 100 ppm h−1 or greater; or (2) ∆CO2 above 200 ppm and not decreasing faster than 80 ppm h-1. Unoccupied was defined as ∆CO2 below 50 ppm and not increasing or decreasing faster than 50 ppm h−1. Figure S3 illustrates the categorization.
The total number of each category was similar between weekend and weekday unoccupied at 185 and 188, respectively, with 104 cases of occupied hours; this analysis excludes approx. 200 points (i.e., high ∆CO2 but decreasing rate) in an effort to improve certainty in the distinction between the two categories. No weekend times were occupied, and the unoccupied weekday times are compared with weekend times to validate the unoccupied categorization. Medians and other percentiles are used to describe differences between categories, although as will be described later, there is evidence of bimodal behavior that is not well captured by median values. These calculations of enhancement should therefore be considered a conservative estimate.
The combined HVAC average room supply (i.e., recirculation and ventilation) rate was calculated by CO2 releases, as 4.3 h−1. The ventilation rate of 0.4 h−1 was calculated with the discretized solution of change of methane indoors over time due to ventilated outdoor air. There was no observed difference in ventilation rate between time of day or day of week; that is, the HVAC-supplied outdoor air fraction was not changed over the course of the study period. The ventilation rate was used to calculate a combined deposition and reaction rate, (h−1), for 𝛽ozone ( , as the discretized solution of:𝛽O3)
d𝐶d𝑡 = 𝜆𝐶out ― 𝜆𝐶 ― 𝛽𝐶
(1)Where C (ppb) and Cout (ppb) are indoor and outdoor ozone concentrations, respectively; λ (h−1) is the ventilation air exchange rate; and t (h) is time. Indoor ozone levels were very low and frequently below 1 minute detection limits (~1 ppb). Averaging data to 1 hours drops the lower limit of detection significantly, however in this case, consideration of ozone below detection as reacted away (i.e., C = 0 ppb) is reasonable.
Equation 2 was used to calculate human-based emissions, Ei (µg −1 h−1) as a function of ozone deposition , and 𝛽 𝛽temperature-based losses as a function of the indoor-outdoor temperature difference, (ºC−1 h−1), for each measured ion 𝜏fragment from the aerosol i, using the Igor Pro (Wavemetrics, Inc.) user fit function. This equation is a practical interpretation the (I/O)i/SO4 wherein the indoor concentration is modelled based on standard mass balance concepts and solved using the parameters measured and calculated in this work. The sulfate normalized ratio (I/O)i/SO4, outdoor concentration Cout, indoor/outdoor ratio of aerosol sulfate (I/O)SO4, temperature difference ∆T, and volume V were directly measured. Ventilation air exchange rate ( ) and was calculated as described above, 𝜆 𝛽SO4
via the same method except accounting for particle-phase deposition. Due to the scatter in loss rate ( ), ΔCO2 was 𝛽O3
converted to ozone loss rate ( ) via the slope of the equation 𝛽O3
in Figure 2.
(I/O)𝑖/SO4 =[𝜆𝐶out,𝑖 + 𝛽O3(𝐸𝑖/𝑉)
𝜆 + 𝛽SO4 + Δ𝑇(𝜏𝑖) ] 1𝐶out,𝑖
(I/O)SO4(2)
Page 4 of 17Environmental Science: Processes & Impacts
123456789101112131415161718192021222324252627282930313233343536373839404142434445464748495051525354555657585960
ARTICLE Journal Name
4 | J. Name., 2012, 00, 1-3 This journal is © The Royal Society of Chemistry 20xx
Please do not adjust margins
Please do not adjust margins
To examine the contribution of important parameters (humidity, temperature, CO2, O3) on the (I/O)i/SO4 of each measured ion and chemical family (e.g. CxHy, CxHyOz) classified by the HR-AMS,34 a standardized regression coefficient (SRC)38,39 was calculated for each parameter. Each species and family was evaluated against all measured parameters, and then separately against each indoor-outdoor gradient (e.g. difference of indoor temperature minus outdoor temperature as one parameter). The R statistical package QuatPsych provided function lm.beta for this calculation. For each species or family, the SRC was evaluated, and insignificant (p>0.05) parameters were removed iteratively until only significant parameters remained.
Results
Impacts associated with occupant-emitted CO2
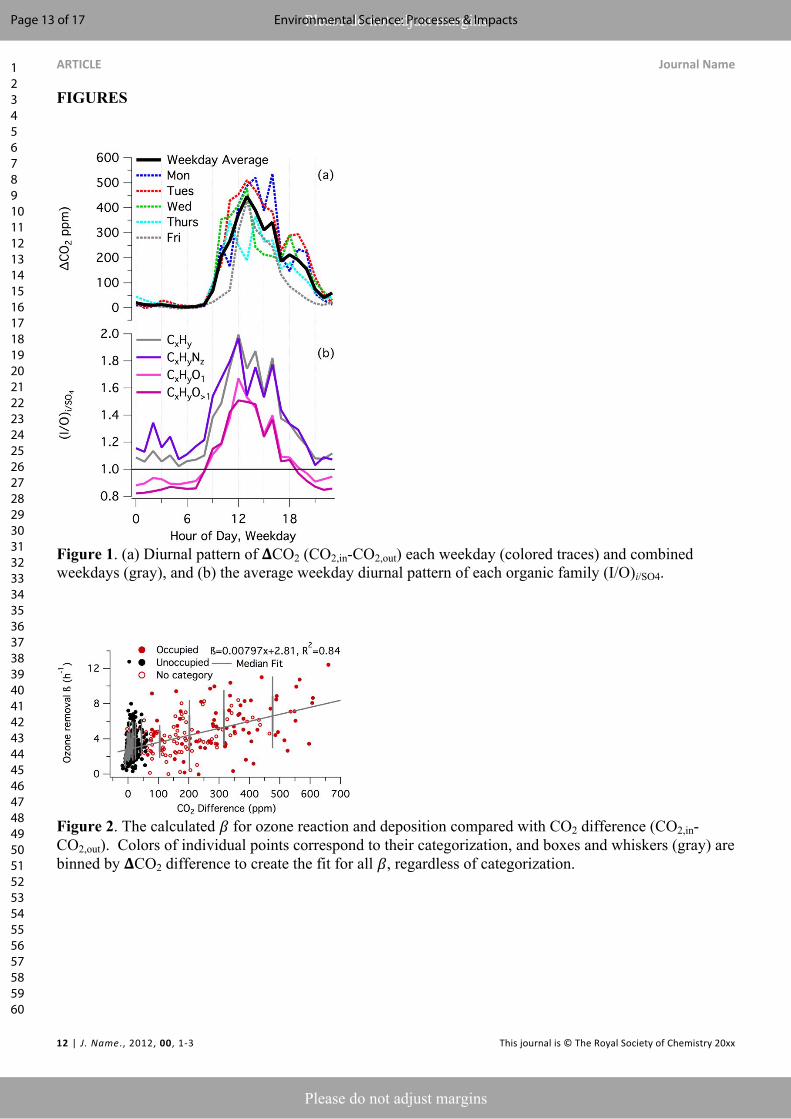
A strong effect of occupants is their breath emissions of CO2. In the classroom, CO2 increases were associated with changes in outdoor concentrations, direct occupants, and occupants in the other spaces served by the same HVAC system zone (indirect occupants). Figure 1 (a) shows the average pattern of ΔCO2 (indoor − outdoor) for each day of the week, reflecting the daily changes in course schedule for the room. Each day the concentration increased from 8am to 9am due to indirect occupants, and Monday through Thursday morning classes were held, so the concentration increased steeply as a result. On Fridays, there were no classes until noon, but the concentration increased before that as a result of indirect occupants. The slow decay after 4pm is indicative the low ventilation air exchange rate and mixing of CO2 in the entire zone. The Monday pattern is especially indicative of obvious occupants and in the morning, afternoon, and evening, with gaps (11am, 3pm, and 6pm) in each. Afternoons, especially 1pm to 5pm show elevated CO2, even after occupants have left. Wednesdays and Thursdays have nearly opposite class schedules, and all days show large CO2 differences that cannot be attributed to direct occupants. Therefore, classification of occupied/unoccupied from changes in ΔCO2 as described in the Methods section was used to isolate the impact of only direct occupants.
Based on the ΔCO2 diurnal patterns, we can investigate any aerosol-based enhancements during directly occupied times during weekdays. Figure 1 (b) shows the weekday diurnal pattern of the sulfate-normalized indoor-outdoor ratio (I/O)i/SO4 of each aerosol ion fragment family. For reference, the complementary weekend figure is provided in the SI, Figure S4. Values greater than unity indicate a source of aerosol indoors or unequal loss processes; this enhancement during occupied times is observed for all weekdays. The observed diurnal structure in the enhancement reflects the combination of daily CO2 patterns; that is, maxima and minima (I/O)CxHy/SO4 are reflective of a pattern of an individual weekday. To further investigate this, each ion family (I/O)i/SO4 was sorted into 12 ΔCO2 bins with an equal number of points. The Pearson R2 value was then calculated for the median family (I/O)i/SO4 of each bin with the median ΔCO2. Families CxHy and CxHyO1 correlate strongly (R2=0.90 and 0.89, respectively), and CxHyO>1 similarly (R2=0.84), but less so for
CxHyNp at R2=0.73. Full regressions are shown in Figure S5. Particle phase patterns are consistent across ion families and correlate strongly with the ΔCO2 measurements indicating an effect of occupancy on the organic aerosol in the classroom. The ion family-level particle phase observations will be described in more detail in the next section.
The second gas-phase impact of occupants, which has been described in detail previously,40–42 is ozone depletion. Ozone indoors was low, averaging 1.5 ± 1.4 ppb, while the outdoor ozone averaged 16 ± 8.9 ppb. The variable , accounting for 𝛽surface deposition and gas-phase reaction of ozone indoors (calculated from Equation 1), demonstrated an increase with increasing ΔCO2, as shown in Figure 2. The hourly categorization of occupied (red), unoccupied (black), and uncategorized (open) are shown here. For simplicity, the data has also been binned and shown as a box and whisker plot. A regression analysis of the median values with ΔCO2 find = 𝛽 𝛽0.00797x + 2.81 with an R2=0.84. This relationship stems from the impact that individuals, using CO2 concentration difference as a proxy for number of occupants, have on ozone reactivity indoors. The observed scatter in the vs ΔCO2 is a result of 𝛽several processes including variations in occupant characteristics (e.g. area of exposed skin and breathing rate), the contribution of CO2 from occupants in adjacent rooms, and that potentially, only a few individuals (low CO2) could consume most of the ozone and adding more occupants (CO2) had relatively less of an effect (i.e., that ozone destruction in this room was limited by new ozone being brought in, not by number of occupants).
The median during occupied times (5.2 h-1) is nearly twice 𝛽that of the unoccupied (2.9 h-1). Although absolute values for 𝛽each category are low, their difference is within ranges observed in controlled occupant number studies.43 This linkage between ozone (and ) and CO2 clearly shows the reaction chemistry and 𝛽its influence by occupants as has been previously observed, and provides a way to link O3 reactivity with observations of aerosol compositional changes with classroom occupancy.
Effects of environmental parameters on (I/O)i/SO4 and associated indoor emissions
Environmental parameters that affect the (I/O)i/SO4 of any family or individual fragment have been discussed elsewhere.26,27 In winter, heating of supply and indoor air for comfort can volatilize components, leading to decreases in (I/O)i/SO4. This impact has been quantified as a fit of the (I/O)i/SO4 to a temperature or RH gradient,27 but here, we discuss the organic families and nitrate changes by relative influence of these parameters. Figure 3 shows a standardized regression coefficient (SRC)38,39 for each component and parameter, and values are listed in Table S1. This analysis provides a relative association among multiple environmental parameters on (I/O)i/SO4 simultaneously. While still not causal, this method considers whether a change in (I/O)i/SO4 is consistent with a standard deviation change in an environmental parameter, normalized to the relative standard deviation of each environmental parameter. Some parameters are associated with each other (i.e., occupants contribute CO2, humidity, and temperature indoors), but as the
Page 5 of 17 Environmental Science: Processes & Impacts
123456789101112131415161718192021222324252627282930313233343536373839404142434445464748495051525354555657585960
Journal Name ARTICLE
This journal is © The Royal Society of Chemistry 20xx J. Name., 2013, 00, 1-3 | 5
Please do not adjust margins
Please do not adjust margins
parameters differ in magnitude, they do not prohibit the use of SRC. Here, each species and family was evaluated against all measured parameters, and then separately as the gradient difference (e.g. indoor temperature and outdoor temperature as individual parameters, and then a separate analysis of ΔT).
As shown in Figure 3, for each measured component, the most influential gradient is ΔCO2 (in – out). Relative humidity gradients, ΔRH (out-in), were not significant for any organic component. ΔT was only significant for CxHy (gray) and CxHyNp (purple) families, while ozone gradients, ΔO3 (out – in), were significant for all species. In this wintertime study, larger temperature and ozone gradients are associated with the heat that occupants contribute to the room, occupant-based destruction of ozone, and occupant emissions of CO2; positive SRC values for all gradients is consistent with occupant influence. The only shared response between nitrate and organic families for Δ parameters in Figure 3 (a) is ΔO3. However, the multiple regression R2 of each (all <0.4) indicates that gradient parameters only partially describe the variance in measured species. The individualized parameters described below generally improved correlation from the gradient parameters, although are still weak.
In individual parameters shown in Figure 3 (b), all of the organic fragment families agree in sign or direction, but differ in magnitude. For CxHy (gray), the most important parameters are ozone outdoors and CO2 indoors; each are positively correlated with (I/O)CxHy/SO4, indicating an effective indoor source of organics associated with high ozone and/or high indoor CO2. Oxygenated organics (pinks) are not highly associated with outdoor ozone, making it unlikely that (I/O)CxHyO1/SO4 and (I/O)CxHyO>1/SO4 are driven by gas-phase oxidized components from outdoors condensing indoors—that they are more associated with indoor CO2 indicates that they are produced directly or indirectly by occupants. CxHyNp groups have the least association of the organics with CO2 and temperature indoors, and they instead are strongly related with outdoor temperature (negative) and outdoor ozone (positive).
Interestingly, temperature increases both indoors and outdoors are associated with a decrease in the (I/O)CxHy/SO4 and (I/O)CxHyNz/SO4, however increases in ΔT (in-out) are weakly associated with a small increases in these quantities. Since variations in outdoor temperature are reflected indoors (see Figure S1), decreases in (I/O)i/SO4 (relative loss of i) with increasing temperature is likely due to the physical properties of outdoor-originated aerosols (including fuel and oil-based hydrocarbons), which condense more readily to the particulate phase at lower outdoor temperatures and then are volatilized (decrease in (I/O)i/SO4) in the warmer indoor environment. However, changes in gradient are at least partially driven by human-induced warming. Using the temperature gradient normalizes for the outdoor trend, and isolates the smaller, occupant-based conditions, where indoor temperature increases relative to outdoors, creating a larger gradient, and being associated with a larger (I/O)i/SO4. SRC values for ozone indoors, RH in both environments, temperature outdoors, and CO2 outdoors indicated small and infrequently significant contributors to each organic ion family (I/O)i/SO4.
With the exceptions of ΔO3 and indoor temperature, nitrate was dependent on categorically different parameters, or in the opposite direction from organics, indicating different sources and/or differences in chemical processing indoors, as expected. SRC values for (I/O)NO3/SO4 with CO2 indoors was not significant, while values for outdoor ozone showed inverse dependence for nitrate in comparison to all organic families. Nitrate was the only species consistently associated with RH, consistent with aqueous-phase processing or co-varying temperature-based volatility. Increasing temperatures indoors are associated with decrease in (I/O)NO3/SO4, consistent with volatility, but the reason for the reverse relationship with outdoor temperature is unclear, possibly more related to storm-based changes in air mass associated with temperature changes outdoors, or the effect of outdoor-indoor temperature gradients described elsewere.27 While the SRC values do not fully explain the underlying mechanism or variability of each parameter, the relative influence of each parameter to each other can inform potential influences on (I/O)i/SO4 across chemical families.
Distributions of occupied and unoccupied periods
Applying categorizations of occupied versus unoccupied to organic families reveals measurable differences in organic aerosols during occupied periods. Figure 4 shows the distribution of (I/O)i/SO4 values for each family in weekends (left), weekday unoccupied (middle) and weekday occupied (right); values of each are in Table S2. Inorganics, NH4 and NO3, show little change over the occupant categories, with a majority of (I/O)i/SO4 values overlapping between the three, consistent with non-occupant sources and values less than unity indicating additional, likely volatility-based losses.27
In contrast to inorganics, each organic family shows variability, with similar overlapping distributions between weekend and unoccupied times, and a clear increase in distribution and median during weekday occupied times. The median (I/O)CxHy/SO4 was nearly exactly unity during weekend and unoccupied times, meaning there were not observable increases or decreases in CxHy fragment families over sulfate. The slightly larger distribution in the unoccupied weekday case versus weekend case may indicate the range of potential categorization error, the detection of each component, and precision of (I/O)i/SO4. The similar 25th percentile in all three cases may be a result of potential categorization misidentification, few or low emitters, or other differences discussed in the next section. The median (I/O)CxHy/SO4 increased 43% in the occupied above unoccupied case, and the 90th percentile increased 77%. The largest values could be a measure of the range of occupied values, including that some classes were likely fuller (~25 students) than others (~10 students). Similar trends hold for CxHyO1, CxHyO>1, and CxHyNp families. The oxidized families exhibit a much smaller distribution in the two unoccupied cases of weekend and weekday unoccupied. Still, in the occupied case, the median (I/O)CxHyO1/SO4 increased by 29% and the 90th percentile by 74%. Multiply-oxidized fragments trend similarly with the singly-oxidized fragments. CxHyNp groups, associated with smoking products44 which are persistent in the indoor environment,45 and could also be emitted from
Page 6 of 17Environmental Science: Processes & Impacts
123456789101112131415161718192021222324252627282930313233343536373839404142434445464748495051525354555657585960
ARTICLE Journal Name
6 | J. Name., 2012, 00, 1-3 This journal is © The Royal Society of Chemistry 20xx
Please do not adjust margins
Please do not adjust margins
recent smokers and their clothing, exhibited the largest distributions in the base cases, and the largest difference between the two base cases (median increased 16%, all others decreased <5%). The enhancement in the occupied case versus unoccupied is similar to other families at 38% in median value. This indicates that the factors affecting CxHyNp were not unique to occupants.
Due to an often small overall mass contribution of occupants, as discussed in the next section, the effect was not visible in previous mass-based analysis methods.27 PMF apportions mass to different factors, and seeks to minimize the residual. There are two likely reasons PMF did not identify an occupant factor before:27 first, the overall mass contribution is small meaning the residual from not classifying it is not significant, and second, it has chemical similarity to other factors identified in by PMF. This second reason will be explored in later sections. The final three sets of Figure 4 shows the weekend, unoccupied, occupied box and whisker plot of each PMF factor. (I/O)HOA/SO4 is consistently above unity and (I/O)OOA/SO4 is consistently below. The median (I/O)COA/SO4 is greater than unity and does increase during occupied times, but less than any organic family (18%). However, the 75th and 90th percentiles for both occupied and unoccupied weekdays show the most extreme values observed for any family of fragment. This indicates a systematic difference between weekday and weekend cooking activities, consistent with known patterns of food truck operation, but not between occupied and unoccupied weekday times. As will be discussed later, the mass spectral similarity between occupant influence and a COA factor could mean that the effects of occupants are incorporated into this factor and contribute to the increase in (I/O)COA/SO4, but are not the direct driver of it. The COA trends could be occupant-influenced, but not direct room occupants, and while it is associated with occupant behavior (possibly cooking in a microwave or toaster in an adjacent room), the similarity between unoccupied and occupied cases indicates it is not a direct influence from occupants of the measured room.
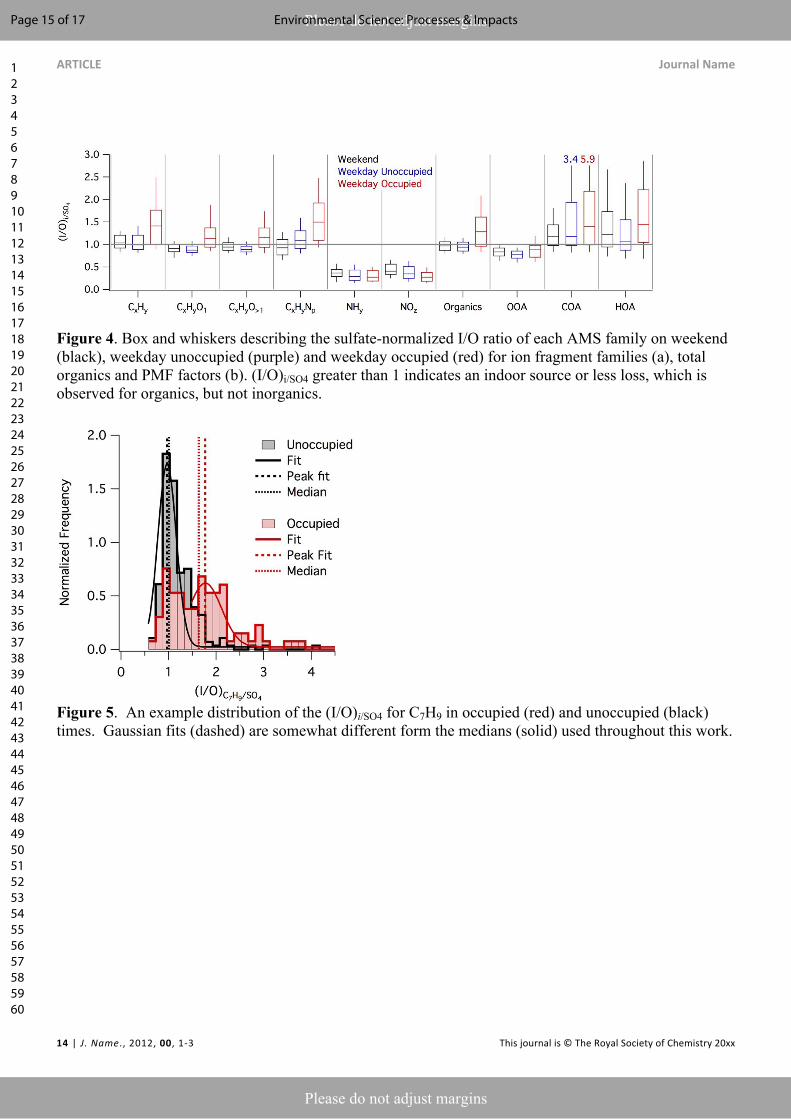
Individual ion signals can provide insight as to what chemical species occupants are contributing to the aerosol phase. Figure 5 shows the histogram of (I/O)i/SO4 values in the occupied (red) and unoccupied (gray) cases for a single ion, C7H9
+ (m/z 93). Gaussian fits were made for each distribution as an independent measure for the peak value. The median values for the occupied and unoccupied cases are included for reference of the practice of implementing comparisons of medians in the next section. The unoccupied case is well constrained with a peak of (I/O)C7H9/SO4 of 1 (fit value of 0.97). The occupied case appears bimodal, with similar 10th to 25th percentile values between unoccupied and occupied cases in the box/whisker plots of Figure 4. The first mode is similar to that of the unoccupied case, and then a second mode peaks closer to (I/O)C7H9/SO4 of 1.70 (fit 1.77). This example is representative of other fragments as shown below, and is indicative of one or two scenarios: 1) if all occupants emit equally, then there is a distribution of number of occupants in the occupied category, or 2) different occupants (body type, clothing covering, respiration rate, etc.) emit differently. Since the occupied distribution is bimodal, using medians as described for ion families above and for individual ion fragments below, is likely an underestimation because the occupied case will be
skewed low (median unoccupied 1.01, occupied 1.63). We use this conservative approach as a method to identify trends for individual ion fragments. This figure also serves to exemplify both the accuracy and limitations of the categorization used in this work. The unoccupied case is very well limited to low (I/O)C7H9/SO4 values, indicating that the base case is well described in this method. The source of the highest (I/O)C7H9/SO4 is currently unknown but could further indicate that this method produces an underestimate of the impact of occupants on the indoor environment.
Emission and enhancements of individual fragments
A similar analysis for as shown in Figure 5 was performed on each ion measured in the high-resolution mass spectra dataset. Comparison of median occupied and unoccupied data provide relative enhancements for each ion. Figure 6 (a) is a mass defect plot showing this enhancement as the size of each data point. The mass defect describes the molecular weight difference from the nominal m/z shown on the x axis. In this way, the difference from the nominal m/z increases for more reduced species, and decreases for oxidized ion fragments. Double bond equivalents (DBE, the number of unsaturations in a molecule or in this case, ion fragment) are drawn to emphasize the effects of highly unsaturated species, possibly originating from squalene (6 DBE), or aromatic fragments (4 DBE and above). The enhancement at larger fragments is a result of low signal at those fragments, the fragmentation pattern of long chain hydrocarbons, and the sources of long chain hydrocarbons (e.g squalene) that may be associated with occupant emissions. While these are small mass contributors, and the enhancement is a reflection of the very low concentrations during unoccupied periods, they signal large molecular weight and large double bond equivalent (DBE) to be source signatures of occupants, and the enhancement scales themselves are non-trivial. The C5 hydrocarbon series are enhanced 29 to 48%, and C10 hydrocarbon series are enhanced 39 to 81%. Oxidized species (CxHyO1 and CxHyO>1) are generally less enhanced, except for CO2 which is likely from decarboxylation of organic acids. In addition to the low-mass, high molecular weight fragments, smaller fragments are also emitted, although masked by dominant outdoor contributions.
To represent the magnitude of occupant emissions, the results of solving for the ozone deposition-normalized emission term in Equation 2 for each individual fragment ion are shown Figure 6 (b). By displaying the emission of individual fragments as a function of m/z, the resulting mass spectrum can be used as a source mass spectrum for occupants in the classroom. The fragments associated with highest emission are short-chain hydrocarbons, and some oxidized components, similar to that of a cooking organic aerosol (COA) PMF factor. The total emission of the CxHy, CxHyO1, and CxHyO>1 families are 15.0, 1.7, and 0.8 µg -1 h-1, respectively, where the mass increase is a function of 𝛽occupants as described by ozone depletion ( ) in each hour. This 𝛽corresponds to an estimate of 0.29 µg m-3h-1 of total organics at median occupied in this space (approximately 15 students), 𝛽and taking into account the volume of the room. Using as a 𝛽scaling factor in this analysis, the results can be used in any future modelling or experimental work that describes ozone
Page 7 of 17 Environmental Science: Processes & Impacts
123456789101112131415161718192021222324252627282930313233343536373839404142434445464748495051525354555657585960
Journal Name ARTICLE
This journal is © The Royal Society of Chemistry 20xx J. Name., 2013, 00, 1-3 | 7
Please do not adjust margins
Please do not adjust margins
depletion by reactions with humans, linking ozone measurements with impacts in the particle phase.
While these occupant-based increases in organic aerosol contribute to the total aerosol loading, it is on a much smaller magnitude compared with outdoor-originated aerosol. For this work, the median I/O ratio for sulfate was 0.35, meaning that almost 2/3 of any outdoor-originated component are removed by mechanical filtration and deposition, leaving only 1/3 of original; an increase in (I/O)i/SO4 value would need to be 3 to return to outdoor levels, and that is not observed here. An additional 43% (I/O)CxHy/SO4, which is the largest organic component, represents only 0.16 µg/m3 increase from the average indoor unoccupied value. Put another way, the average total organic loading was 3.24 µg/m3 outdoors and 1.14 µg/m3 indoors, and a median (I/O)Org/SO4 of 0.98, as shown in Figure 4.
Given the emission rates described above, and the occupant-based ozone removal β, the aerosol mass contribution of occupants in the room can be estimated. For the median occupied time, an increase of 0.29 µg/m3 over unoccupied times is observed. This is an increase of approximately 25% in organic aerosol mass, or approximately 15% increase in total aerosol mass indoors. The highest β values correspond to 0.81 µg/m3 increase from unoccupied times. Table S3 displays the full statistics of mass concentration increases for a single hour class.
The temperature-based losses ( ) from Equation 2 were 𝜏negligible (average 0.03 h-1 °C-1) for organic fragments, consistent with a median (I/O)i/SO4 of 0.98 for total organics and nearly 1 for all organic families. However, temperature-based losses for ammonium and nitrate ion fragments are notably high: 0.69, 0.25, and 0.17 h-1 °C-1 for NH3
+, NO2+, and NO+ fragments,
respectively. This is reflected in Figure S6. The lesser sensitivity of NO+ to temperature than NO2
+ is consistent with organic nitrate (NO+ could be from organic or inorganic nitrate sources) as less volatile as inorganic nitrate.46
Finally, it should be noted that siloxanes associated with personal care products23 were not observed in this dataset. This may be due to their volatility being too high to effectively partition to the aerosol phase, and/or because limits of detection are high due to background signal in the AMS from internal Si-containing components such as o-rings in the vacuum chamber. This results in the Si-containing peaks being of similar magnitude in open and closed measurements.47
DISCUSSION
While AMS mass spectral fragments cannot be directly connected to a parent molecule, some interesting trends are visible in Figure 6. Emission rate values reflect the AMS fragmentation pattern, while the enhancement values reflect the range of fragments that are emitted by occupants, including the high MW fragments that may be more directly attributed to squalene and other large unsaturated compounds. Here, we use both emission rates and enhancements to connect the observed patterns to known squalene oxidation chemistry,20 and to a lesser extent, breath emissions.22,48 The hydrocarbon emission results cannot be directly attributed to specific fragments due to the extremely complex mixture of species and the similarities of
saturated and unsaturated bond patterns, but instead provides an overview of the fragmentation patterns of the aerosols in bulk.
The observed emission spectrum characteristics shown in Figure 6 (b) are in common with signatures of a cooking organic aerosol (COA) PMF result.49 The mass spectra of the three PMF factors resolved in this study are shown in Figure S7. The commonalities in spectra include the hydrocarbon ratios of m/z 27/29, 39/41/43, 55/57, and the oxidized peak at m/z 55. The characteristics of COA in meat cooking and pan frying are from saturated and unsaturated fatty acids, and many are the same as those emitted by humans; the two spectra in UMR correlate at R2=0.78, and the CxHy family species correlate at R2=0.94. Together, these spectral similarities point to the importance of long-chain fatty acids, which are too varied in proportion to each other to be meaningful as an individual spectrum, but are identified collectively as this COA factor, and that collective signal is the same as that here for occupant-based emissions. The individual ion and ion family analysis is a non-PMF method to identify organic aerosol signatures emitted by occupants. PMF factors are driven by minimizing scaled residuals33,50 and do not appear to be well suited to identify small source contributions of organic aerosol sources that are spectrally similar to other identified factors (e.g. COA). The trends are more visible by family because there are components of occupant influence in other PMF factors.
Squalene (C30H50) is a commonly studied occupant emission, and the NIST mass spectrum51 signatures C5H9
+ and C6H9+ (m/z
69 and 81) are well represented in both emission (0.78, 0.51 µg h-1) and enhancement (47, 45 %). While both NIST and 𝛽 ―1
AMS spectra utilize EI ionization, AMS spectra have been shown to be more destructive of original compounds, through additional thermal decomposition.52 However, the relationship between occupied and unoccupied levels of high MW fragments using the same instrument are directly comparable. The signature fragments are a result of the large, repeating molecular nature of squalene: C3, C5, and C6 hydrocarbon chains repeat throughout the molecule. Each hydrocarbon series is represented in the NIST mass spectrum, including the C10 series which exhibits a cluster of ions (C10H15
+ to C10H17+) instead of neat pairs or triplets of
odd valued ions that are the signature of other carbon series. This is indicative of the variety of hydrogen atoms associated with chains of 10 carbons in the squalene molecule. These C10 fragments are observed as enhanced (69, 64, 44 %), although C10H14
+ is enhanced the most (81%). C10H16+ is likely a fragment
of a larger molecule and not originally a monoterpene, but it is enhanced 64% over unoccupied times; associated monoterpene peaks of C5H7
+, and C7H9+ are prominent in both enhancement
in and emission. The other more reduced (increased DBE) fragments are likely not directly from squalene, so reaction pathways which increase the DBE value and other potential sources of aerosol-phase impacts must be considered.
Exhaled breath could be a source of the aromatic fragments (DBE>4) observed to be enhanced during occupied times, although translating VOCs in breath to particle-phase measurements here is a challenge that cannot be directly addressed here. However, the chemical diversity in emission from breath is great22 especially in smokers,53 such that VOCs
Page 8 of 17Environmental Science: Processes & Impacts
123456789101112131415161718192021222324252627282930313233343536373839404142434445464748495051525354555657585960
ARTICLE Journal Name
8 | J. Name., 2012, 00, 1-3 This journal is © The Royal Society of Chemistry 20xx
Please do not adjust margins
Please do not adjust margins
measured in other studies could be a connection point to the particle-phase enhancements discussed here. Isoprene,54 observed as with other unsaturated hydrocarbons largely at C5H7
+ and C5H8+, is the primary VOC in exhaled breath but
many other high DBE hydrocarbons, including many benzyl hydrocarbons have been detected. Unsaturated hydrocarbons emitted from breath are elevated in smokers,53 and a study of cyclist exposure to urban pollutants found elevated BTEX compounds in breath after riding in high traffic streets.55 The highest DBE fragments enhanced in occupied over unoccupied times are potentially aromatics, that are not produced endogenously. These and other exogenous compounds could be connected to occupant exposure to outdoor pollutants (in the urban Philadelphia environment) before arrival and re-emission indoors. The previous experiences of occupants, including recent urban pollutant exposure or smoking, is not known, but cannot be ruled out as a potential exposure and re-emission source. The link between BTEX compounds in breath and these observations of increases in aerosol mass at high DBE is an indirect one but serves as a hypothetical source to be examined more closely in the future.
Oxidized components that are emitted or enhanced in the aerosol phase could be from a few sources, including primary emissions (fatty acids from skin) or reactions of unsaturated bonds with ozone or other oxidants.56,57 Products of the reaction of squalene and ozone are generally cleaved and oxidized. CO2
+ as the dominant oxidized peak is an effect of the many primary emissions of fatty acids that make up >10% of skin surface lipids,13 and oxidized products of the reaction of squalene and ozone.13,20 The large difference in enhancement and emission between CO2
+ and the next important oxidized species could be a result of that the fragmentation pattern of both small and large molecular weight acids includes a cleavage at the acid group (decarboxylation), which is known to occur in the AMS.58 Several smaller oxidized fragment ions, including CH2O+, C2H3O+, and C3H3O+, are shown here to be from emitted parent species; (C2H3O+, m/z 43) is the second largest emission of a singly oxidized species (0.35 µg ). These fragments are 𝛽 ―1 h ―1
further linked to individual traditional gas-phase tracers of occupants: 4-oxopentanal (4-OPA, C5H8O2
+, m/z 100.05) is not directly observed as a fragment ion in the aerosol, but might contribute to the short-chain oxidized species m/z 43 C2H3O+, along with other ketones. 6-Methyl-5-hepten-2-one (6-MHO) (C8H14O+, m/z 126.1) would contribute to m/z 43 (ketone) and unsaturated hydrocarbons ubiquitous in enhancement and emission results.
Of additional note are a few CxHyNp family groups that are likely related to occupants who have recently smoked, and in an unoccupied season, were a major contributor to indoor aerosol mass.45 C3H6N+ is the most enhanced at 55%, and C2H4N+ is the most emitted at 0.11 µg . As Figure 4 shows, this effect 𝛽 ―1 h ―1
is not as limited to occupants, and the difference between weekend and weekday unoccupied indicates potential influence from indirect occupants, or other parameters like aqueous aerosol availability as described in DeCarlo et al.45
The total emission of all species of 17.6 µg , applied 𝛽 ―1 h ―1
to the median during occupied times (2.4 hr-1) over unoccupied 𝛽
times and the known room volume is a volume-normalized emission of 0.29 µg m-3 h-1, an increase of about 25% in one hour. Tang et al., 2016 reported a 35% increase in VOC concentration from the building supply, and 57% contribution from occupants, of which 43.9% of was from siloxanes (not observed in the aerosol phase for this work), for an increase in non-siloxane emissions of 27.6%. Comparison of this VOC increase from the PTR-MS data from Tang, with the organic aerosol enhancements presented here, there is reasonable agreement and future studies in different environments with both measurements made together will provide additional insight into the VOC and aerosol enhancements from occupancy.
While the organic aerosol mass enhancements do not dominate the aerosol loading, this study provides a detailed quantification of aerosol-phase impacts of human occupants in an indoor environment, and in the absence of large sources (like cooking), a common scenario in offices, meeting spaces, and classrooms; this effect can scale with number of occupants and contribute more significantly in less-well ventilated spaces.
ConclusionsThis work quantifies the chemically-specific influence of occupants on the composition of indoor aerosols. In most mechanically ventilated non-residential spaces, the majority of submicron indoor particulate mass is outdoor-originated. However, by sampling an occupied classroom and outdoors simultaneously and at high time resolution, the influence of outdoor-originated aerosols was separated from occupant-related. During occupied times, mass spectral features connected to secondary oxidation products of skin oils and breath emissions were identified. While the total mass of linked to human occupants was small compared to outdoor-originated aerosols, this occupant influence is important in other high-occupancy or poorly ventilated spaces, including offices, classrooms, and airplanes. While this study represents one observational situation, the processes and results observed here are applicable to other occupied spaces
Conflicts of interestThere are no conflicts to declare.
AcknowledgementsThe authors gratefully acknowledge funding from NSF, award number 1437916.
References
1 L. Morawska, A. Afshari, G. N. Bae, G. Buonanno, C. Y. H. Chao, O. Hänninen, W. Hofmann, C. Isaxon, E. R. Jayaratne, P. Pasanen, T. Salthammer, M. Waring and A. Wierzbicka, Indoor aerosols: From personal exposure to risk
Page 9 of 17 Environmental Science: Processes & Impacts
123456789101112131415161718192021222324252627282930313233343536373839404142434445464748495051525354555657585960
Journal Name ARTICLE
This journal is © The Royal Society of Chemistry 20xx J. Name., 2013, 00, 1-3 | 9
Please do not adjust margins
Please do not adjust margins
assessment, Indoor Air, 2013, 23, 462–487.2 W. J. Riley, T. E. McKone, A. C. K. Lai and W. W. Nazaroff,
Indoor particulate matter of outdoor origin: Importance of size-dependent removal mechanisms, Environ. Sci. Technol., 2002, 36, 200–207.
3 N. E. Klepeis, M. G. Apte, L. A. Gundel, R. G. Sextro and W. W. Nazaroff, Determining Size-Specific Emission Factors for Environmental Tobacco Smoke Particles, Aerosol Sci. Technol., 2003, 37, 780–790.
4 G. Buonanno, G. Johnson, L. Morawska and L. Stabile, Volatility Characterization of Cooking-Generated Aerosol Particles, Aerosol Sci. Technol., 2011, 45, 1069–1077.
5 L. A. Wallace, S. J. Emmerich and C. Howard-Reed, Source Strengths of Ultrafine and Fine Particles Due to Cooking with a Gas Stove, Environ. Sci. Technol., 2004, 38, 2304–2311.
6 W. W. Nazaroff and C. J. Weschler, Cleaning products and air fresheners: Exposure to primary and secondary air pollutants, Atmos. Environ., 2004, 38, 2841–2865.
7 B. C. Singer, B. K. Coleman, H. Destaillats, A. T. Hodgson, M. M. Lunden, C. J. Weschler and W. W. Nazaroff, Indoor secondary pollutants from cleaning product and air freshener use in the presence of ozone, Atmos. Environ., 2006, 40, 6696–6710.
8 L. D. Knibbs, C. He, C. Duchaine and L. Morawska, Vacuum Cleaner Emissions as a Source of Indoor Exposure to Airborne Particles and Bacteria, Environ. Sci. Technol., 2012, 46, 534–542.
9 J. M. Daisey, W. J. Angell and M. G. Apte, Indoor air quality, ventilation and health symptoms in schools: An analysis of existing information, Indoor Air, 2003, 13, 53–64.
10 C. J. Weschler, Roles of the human occupant in indoor chemistry, Indoor Air, 2016, 26, 6–24.
11 M. S. Waring, J. A. Siegel and R. L. Corsi, Ultrafine particle removal and generation by portable air cleaners, Atmos. Environ., 2008, 42, 5003–5014.
12 L. Morawska, C. He, G. Johnson, R. Jayaratne, T. Salthammer, H. Wang, E. Uhde, T. Bostrom, R. Modini, G. Ayoko, P. Mcgarry and M. Wensing, An investigation into the characteristics and formation mechanisms of particles originating from the operation of laser printers, Environ. Sci. Technol., 2009, 43, 1015–1022.
13 N. Nicolaides, Skin Lipids: Their Biochemical Uniqueness, Science., 1974, 186, 19–26.
14 M. Picardo, M. Ottaviani, E. Camera and A. Mastrofrancesco, Sebaceous gland lipids, Dermatoendocrinol., 2009, 1, 68–71.
15 P. Fruekilde, J. Hjorth, N. R. Jensen, D. Kotzias and B. Larsen, Ozonolysis at vegetation surfaces: a source of acetone, 4-oxopentanal, 6-methyl-5-hepten-2-one, and geranyl acetone in the troposphere, Atmos. Environ., 1998, 32, 1893–1902.
16 S. Zhou, M. W. Forbes and J. P. D. Abbatt, Kinetics and Products from Heterogeneous Oxidation of Squalene with Ozone, Environ. Sci. Technol., 2016, 50, 11688–11697.
17 A. Wisthaler, G. Tamás, D. P. Wyon, P. Strøm-Tejsen, D. Space, J. Beauchamp, A. Hansel, T. D. Märk and C. J.
Weschler, Products of ozone-initiated chemistry in a simulated aircraft environment, Environ. Sci. Technol., 2005, 39, 4823–4832.
18 C. Wang and M. S. Waring, Secondary organic aerosol formation initiated from reactions between ozone and surface-sorbed squalene, Atmos. Environ., 2014, 84, 222–229.
19 D. R. Fooshee, P. K. Aiona, A. Laskin, J. Laskin, S. A. Nizkorodov and P. F. Baldi, Atmospheric Oxidation of Squalene: Molecular Study Using COBRA Modeling and High-Resolution Mass Spectrometry, Environ. Sci. Technol., 2015, 49, 13304–13313.
20 A. Wisthaler and C. J. Weschler, Reactions of ozone with human skin lipids: Sources of carbonyls, dicarbonyls, and hydroxycarbonyls in indoor air, Proc. Natl. Acad. Sci., 2010, 107, 6568–6575.
21 T. Moise and Y. Rudich, Reactive uptake of ozone by aerosol-associated unsaturated fatty acids: Kinetics, mechanism, and products, J. Phys. Chem. A, 2002, 106, 6469–6476.
22 B. De Lacy Costello, A. Amann, H. Al-Kateb, C. Flynn, W. Filipiak, T. Khalid, D. Osborne and N. M. Ratcliffe, A review of the volatiles from the healthy human body, J. Breath Res., 2014, 8, 1–29.
23 X. Tang, P. K. Misztal, W. W. Nazaroff and A. H. Goldstein, Siloxanes are the most abundant volatile organic compound emitted from engineering students in a classroom, Environ. Sci. Technol. Lett., 2015, 2, 303–307.
24 X. Tang, P. K. Misztal, W. W. Nazaroff and A. H. Goldstein, Volatile Organic Compound Emissions from Humans Indoors, Environ. Sci. Technol., 2016, 50, 12686–12694.
25 M. R. Canagaratna, J. T. Jayne, J. L. Jimenez, J. D. Allan, M. R. Alfarra, Q. Zhang, T. B. Onasch, F. Drewnick, H. Coe, A. Middlebrook, A. Delia, L. R. Williams, A. M. Trimborn, M. J. Northway, P. F. DeCarlo, C. E. Kolb, P. Davidovits and D. R. Worsnop, Chemical and microphysical characterization of ambient aerosols with the aerodyne aerosol mass spectrometer, Mass Spectrom. Rev., 2007, 26, 185–222.
26 A. M. Johnson, M. S. Waring and P. F. DeCarlo, Real-time transformation of outdoor aerosol components upon transport indoors measured with aerosol mass spectrometry, Indoor Air, 2017, 27, 230–240.
27 A. M. Avery, M. S. Waring and P. F. DeCarlo, Seasonal variation in aerosol composition and concentration upon transport from the outdoor to indoor environment, Environ. Sci. Process. Impacts, 2019, 21, 528–547.
28 N. Talbot, L. Kubelová, O. Makeš, J. Ondráček, M. Cusack, J. Schwarz, P. Vodička, N. Zíková and V. Ždímal, Transformations of aerosol particles from an outdoor to indoor environment, Aerosol Air Qual. Res., 2017, 17, 653–665.
29 S. L. Miller, N. A. Facciola, D. Toohey and J. Zhai, Ultrafine and fine particulate matter inside and outside of mechanically ventilated buildings, Int. J. Environ. Res. Public Health, 2017, 14, 17.
30 F. Klein, N. J. Farren, C. Bozzetti, K. R. Daellenbach, D. Kilic, N. K. Kumar, S. M. Pieber, J. G. Slowik, R. N. Tuthill, J. F.
Page 10 of 17Environmental Science: Processes & Impacts
123456789101112131415161718192021222324252627282930313233343536373839404142434445464748495051525354555657585960
ARTICLE Journal Name
10 | J. Name., 2012, 00, 1-3 This journal is © The Royal Society of Chemistry 20xx
Please do not adjust margins
Please do not adjust margins
Hamilton, U. Baltensperger, A. S. H. Prévôt and I. El Haddad, Indoor terpene emissions from cooking with herbs and pepper and their secondary organic aerosol production potential, Scientific, 2016, 6, 1–7.
31 J. Schwarz, O. Makeš, J. Ondráček, M. Cusack, N. Talbot, P. Vodička, L. Kubelová and V. Ždímal, Single Usage of a Kitchen Degreaser Can Alter Indoor Aerosol Composition for Days, Environ. Sci. Technol., 2017, 51, 5907–5912.
32 P. Paatero and U. Tapper, Positive Matrix Factorization: A non-negative factor model with optimal utilization of erro estimates of data values, Environmetrics, 1994, 5, 111–126.
33 I. M. Ulbrich, M. R. Canagaratna, Q. Zhang, D. R. Worsnop and J. L. Jimenez, Interpretation of organic components from Positive Matrix Factorization of aerosol mass spectrometric data, Atmos. Chem. Phys. Atmos. Chem. Phys., 2009, 9, 2891–2918.
34 P. F. DeCarlo, J. R. Kimmel, A. Trimborn, M. J. Northway, J. T. Jayne, A. C. Aiken, M. Gonin, K. Fuhrer, T. Horvath, K. S. Docherty, D. R. Worsnop and J. L. Jimenez, Field-Deployable, High-Resolution, Time-of-Flight Aerosol Mass Spectrometer, Anal. Chem., 2006, 78, 8281–8289.
35 X. Zhang, K. A. Smith, D. R. Worsnop, J. L. Jimenez, J. T. Jayne, C. E. Kolb, J. Morris and P. Davidovits, Numerical characterization of particle beam collimation: Part II integrated aerodynamic-lens-nozzle system, Aerosol Sci. Technol., 2004, 38, 619–638.
36 A. M. Middlebrook, R. Bahreini, J. L. Jimenez and M. R. Canagaratna, Evaluation of composition-dependent collection efficiencies for the Aerodyne aerosol mass spectrometer using field data, Aerosol Sci. Technol., 2012, 46, 258–271.
37 J. D. Allan, A. E. Delia, H. Coe, K. N. Bower, M. R. Alfarra, J. L. Jimenez, A. M. Middlebrook, F. Drewnick, T. B. Onasch, M. R. Canagaratna, J. T. Jayne and D. R. Worsnop, A generalised method for the extraction of chemically resolved mass spectra from Aerodyne aerosol mass spectrometer data, J. Aerosol Sci., 2004, 35, 909–922.
38 J. C. Helton, Uncertainty and sensitivity analysis techniques for use in performance assessment for radioactive waste disposal, Reliab. Eng. Syst. Saf., 1993, 42, 327–367.
39 J. P. C. Kleijnen and J. C. Helton, Statistical analyses of scatterplots to identify important factors in large-scale simulations, 1: Review and comparison of techniques, Reliab. Eng. Syst. Saf., 1999, 65, 147–185.
40 C. J. Weschler and H. C. Shields, Indoor ozone/terpene reactions as a source of indoor particles, Atmos. Environ., 1999, 33, 2301–2312.
41 M. S. Waring and J. A. Siegel, Indoor secondary organic aerosol formation initiated from reactions between ozone and surface-sorbed d -limonene, Environ. Sci. Technol., 2013, 47, 6341–6348.
42 D. Rim, E. T. Gall, R. L. Maddalena and W. W. Nazaroff, Ozone reaction with interior building materials: Influence of diurnal ozone variation, temperature and humidity, Atmos. Environ., 2016, 125, 15–23.
43 G. Tamás, C. J. Weschler, Z. Bakó-Biró, D. P. Wyon and P. Strøm-Tejsen, Factors affecting ozone removal rates in a
simulated aircraft cabin environment, Atmos. Environ., 2006, 40, 6122–6133.
44 C. Struckmeier, F. Drewnick, F. Fachinger, G. Paolo Gobbi and S. Borrmann, Atmospheric aerosols in Rome, Italy: Sources, dynamics and spatial variations during two seasons, Atmos. Chem. Phys., 2016, 16, 15277–15299.
45 P. F. DeCarlo, A. M. Avery and M. S. Waring, Thirdhand smoke uptake to aerosol particles in the indoor environment, Sci. Adv., 2018, 4, 1–8.
46 A. Kiendler-Scharr, A. A. Mensah, E. Friese, D. Topping, E. Nemitz, A. S. H. Prevot, M. Äijälä, J. Allan, F. Canonaco, M. R. Canagaratna, S. Carbone, M. Crippa, M. Dall Osto, D. A. Day, P. De Carlo, C. F. Di Marco, H. Elbern, A. Eriksson, E. Freney, L. Hao, H. Herrmann, L. Hildebrandt, R. Hillamo, J. L. Jimenez, A. Laaksonen, G. McFiggans, C. Mohr, C. O’Dowd, R. Otjes, J. Ovadnevaite, S. N. Pandis, L. Poulain, P. Schlag, K. Sellegri, E. Swietlicki, P. Tiitta, A. Vermeulen, A. Wahner, D. Worsnop and H. C. Wu, Ubiquity of organic nitrates from nighttime chemistry in the European submicron aerosol, Geophys. Res. Lett., 2016, 43, 7735–7744.
47 J. L. Jimenez, J. T. Jayne, Q. Shi, C. E. Kolb, D. R. Worsnop, I. Yourshaw, J. H. Seinfeld, R. C. Flagan, X. Zhang, K. A. Smith, J. W. Morris and P. Davidovits, Ambient aerosol sampling using the Aerodyne Aerosol Mass Spectrometer, J. Geophys. Res., 2003, 108, 1–13.
48 X. Sun, J. He and X. Yang, Human breath as a source of VOCs in the built environment, Part I: A method for sampling and detection species, Build. Environ., 2017, 125, 565–573.
49 C. Mohr, P. F. DeCarlo, M. F. Heringa, R. Chirico, J. G. Slowik, R. Richter, C. Reche, A. Alastuey, X. Querol, R. Seco, J. Peñuelas, J. L. Jiḿenez, M. Crippa, R. Zimmermann, U. Baltensperger and A. S. H. Prév̂ot, Identification and quantification of organic aerosol from cooking and other sources in Barcelona using aerosol mass spectrometer data, Atmos. Chem. Phys., 2012, 12, 1649–1665.
50 V. A. Lanz, A. S. H. Pŕev̂ot, M. R. Alfarra, S. Weimer, C. Mohr, P. F. DeCarlo, M. F. D. Gianini, C. Hueglin, J. Schneider, O. Favez, B. D’Anna, C. George and U. Baltensperger, Characterization of aerosol chemical composition with aerosol mass spectrometry in Central Europe: An overview, Atmos. Chem. Phys., 2010, 10, 10453–10471.
51 NIST Chem. Webb., 2017, NIST Standard Reference Database Number 69.
52 M. R. Canagaratna, J. L. Jimenez, J. H. Kroll, Q. Chen, S. H. Kessler, P. Massoli, L. Hildebrandt Ruiz, E. Fortner, L. R. Williams, K. R. Wilson, J. D. Surratt, N. M. Donahue, J. T. Jayne and D. R. Worsnop, Elemental ratio measurements of organic compounds using aerosol mass spectrometry: Characterization, improved calibration, and implications, Atmos. Chem. Phys., 2015, 15, 253–272.
53 W. Filipiak, V. Ruzsanyi, P. Mochalski, A. Filipiak, A. Bajtarevic, C. Ager, H. Denz, W. Hilbe, H. Jamnig, M. Hackl, A. Dzien and D. A. Amann, Dependence of exhaled breath composition on exogenous factors, smoking habits and
Page 11 of 17 Environmental Science: Processes & Impacts
123456789101112131415161718192021222324252627282930313233343536373839404142434445464748495051525354555657585960

Journal Name ARTICLE
This journal is © The Royal Society of Chemistry 20xx J. Name., 2013, 00, 1-3 | 11
Please do not adjust margins
Please do not adjust margins
exposure to air pollutants, J. Breath Res., 2012, 6, 1–21.54 D. Gelmont, R. A. Stein and J. F. Mead, Isoprene — The
main hydrocarbon in human breath, Biochem. Biophys. Res. Commun., 1981, 99, 1456–1460.
55 A. Y. Bigazzi, M. A. Figliozzi, W. Luo and J. F. Pankow, Breath Biomarkers to Measure Uptake of Volatile Organic Compounds by Bicyclists, Environ. Sci. Technol., 2016, 50, 5357–5363.
56 C. Weisel, C. J. Weschler, K. Mohan, J. Vallarino and J. D. Spengler, Ozone and ozone byproducts in the cabins of commercial aircraft, Environ. Sci. Technol., 2013, 47, 4711–4717.
57 S. Zhou, M. W. Forbes, Y. Katrib and J. P. D. Abbatt, Rapid Oxidation of Skin Oil by Ozone, Environ. Sci. Technol. Lett., 2016, 3, 170–174.
58 N. L. Ng, M. R. Canagaratna, Q. Zhang, J. L. Jimenez, J. Tian, I. M. Ulbrich, J. H. Kroll, K. S. Docherty, P. S. Chhabra, R. Bahreini, S. M. Murphy, J. H. Seinfeld, L. Hildebrandt, N. M. Donahue, P. F. DeCarlo, V. A. Lanz, A. S. H. Prévôt, E. Dinar, Y. Rudich and D. R. Worsnop, Organic aerosol components observed in Northern Hemispheric datasets from Aerosol Mass Spectrometry, Atmos. Chem. Phys., 2010, 10, 4625–4641.
Page 12 of 17Environmental Science: Processes & Impacts
123456789101112131415161718192021222324252627282930313233343536373839404142434445464748495051525354555657585960
ARTICLE Journal Name
12 | J. Name., 2012, 00, 1-3 This journal is © The Royal Society of Chemistry 20xx
Please do not adjust margins
Please do not adjust margins
FIGURES
Figure 1. (a) Diurnal pattern of 𝚫CO2 (CO2,in-CO2,out) each weekday (colored traces) and combined weekdays (gray), and (b) the average weekday diurnal pattern of each organic family (I/O)i/SO4.
Figure 2. The calculated for ozone reaction and deposition compared with CO2 difference (CO2,in-𝛽CO2,out). Colors of individual points correspond to their categorization, and boxes and whiskers (gray) are binned by 𝚫CO2 difference to create the fit for all , regardless of categorization.𝛽
Page 13 of 17 Environmental Science: Processes & Impacts
123456789101112131415161718192021222324252627282930313233343536373839404142434445464748495051525354555657585960

Journal Name ARTICLE
This journal is © The Royal Society of Chemistry 20xx J. Name., 2013, 00, 1-3 | 13
Please do not adjust margins
Please do not adjust margins
Figure 3. Standardized Regression Coefficient (SRC) and multiple R2 for each component (I/O)i/SO4 against environmental parameters. Delta gradients are as in-out for temperature and ozone, and out-in for humidity and ozone. No data indicates the correlation was not significant, and the multiple R2 indicates how well the combination of each parameter describes each (I/O)i/SO4 .
Page 14 of 17Environmental Science: Processes & Impacts
123456789101112131415161718192021222324252627282930313233343536373839404142434445464748495051525354555657585960
ARTICLE Journal Name
14 | J. Name., 2012, 00, 1-3 This journal is © The Royal Society of Chemistry 20xx
Please do not adjust margins
Please do not adjust margins
Figure 4. Box and whiskers describing the sulfate-normalized I/O ratio of each AMS family on weekend (black), weekday unoccupied (purple) and weekday occupied (red) for ion fragment families (a), total organics and PMF factors (b). (I/O)i/SO4 greater than 1 indicates an indoor source or less loss, which is observed for organics, but not inorganics.
Figure 5. An example distribution of the (I/O)i/SO4 for C7H9 in occupied (red) and unoccupied (black) times. Gaussian fits (dashed) are somewhat different form the medians (solid) used throughout this work.
Page 15 of 17 Environmental Science: Processes & Impacts
123456789101112131415161718192021222324252627282930313233343536373839404142434445464748495051525354555657585960

Journal Name ARTICLE
This journal is © The Royal Society of Chemistry 20xx J. Name., 2013, 00, 1-3 | 15
Please do not adjust margins
Please do not adjust margins
Figure 6. (a) Mass defect of each measured organic fragment, sized by percent enhancement of occupied times over unoccupied times, and colored by family. Double bond equivalent (DBE) lines are drawn to emphasize the types of hydrocarbons that are enhanced. (b) Emission of each fragment, stacked to unit mass resolution. Inset reflects the total emission of all families.
Page 16 of 17Environmental Science: Processes & Impacts
123456789101112131415161718192021222324252627282930313233343536373839404142434445464748495051525354555657585960

O3
Particles
People
Aerosol mass
addition
Page 17 of 17 Environmental Science: Processes & Impacts
123456789101112131415161718192021222324252627282930313233343536373839404142434445464748495051525354555657585960