human services portfolio - centrelink · pdf fileprovides a brief introduction explaining the...
TRANSCRIPT

PORTFOLIO ADDITIONAL ESTIMATES STATEMENTS 2010-11 HUMAN SERVICES PORTFOLIO
EXPLANATIONS OF ADDITIONAL ESTIMATES 2010-11


iv
Abbreviations and conventions
ENQUIRIES

v
USER GUIDETO THE
PORTFOLIO ADDITIONALESTIMATES STATEMENTS

vii
USER GUIDE

viii
STRUCTURE OF THE PORTFOLIO ADDITIONAL ESTIMATES STATEMENTS
User guide
Provides a brief introduction explaining the purpose of the PAES.
Portfolio overview
Provides an overview of the portfolio, including a chart that outlines the outcomes for agencies in the portfolio.
Agency additional estimates statements
A statement (under the name of the agency) for each agency affected by Additional Estimates.
Section 1: Agency overview and resources
This section details the total resources available to an agency, the impact of any measures since Budget, and impact on Appropriation Bills No. 3 and No. 4.
Section 2: Revisions to outcomes and planned performance
This section details changes to Government outcomes and/or changes to the planned performance of agency programs.
Section 3: Explanatory tables and budgeted financial statements
This section contains updated explanatory tables on special account flows and staffing levels and revisions to the budgeted financial statements.
Glossary Explains key terms relevant to the Portfolio.
Index (Optional) Alphabetical guide to the Statements

ix
CONTENTS
Human Services Portfolio Overview ........................................................................... 3
Agency Resources and Planned Performance Centrelink ...................................................................................................................... 10 Medicare Australia......................................................................................................... 32
Portfolio Glossary ....................................................................................................... 63


PORTFOLIO OVERVIEW


3
HUMAN SERVICES PORTFOLIO OVERVIEW
HUMAN SERVICES AGENCIES
AGENCIES WITHIN THE HUMAN SERVICES PORTFOLIO
•
3
4
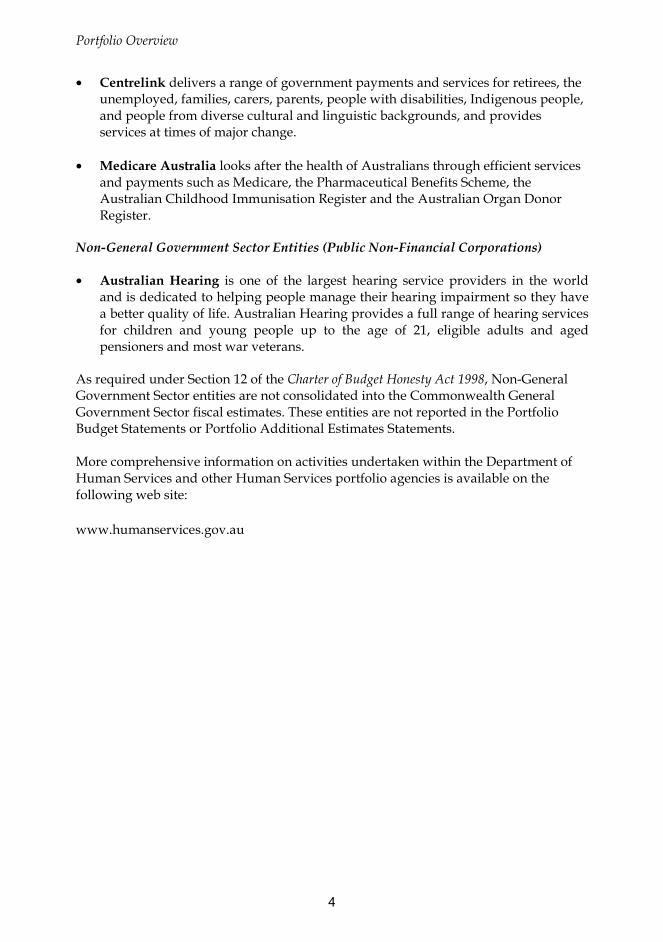
•
•
•
4

5
Figure 1: Human Services portfolio structure and outcomes
* This agency is a Non-General Government Sector entity and is not consolidated into the Commonwealth general government sector fiscal estimates. Therefore it is not reported in the Portfolio Budget Statements or Portfolio Additional Estimates Statements.
Figure 1
Portfolio Minister for Human ServicesThe Hon Tanya Plibersek MP
Department of Human Services (including the Child Support Program and CRS Australia)
Portfolio Secretary: Mr Finn Pratt, PSM
Outcome 1Informed government decisions on, and access to social, health and child support services for
Australians through policy development and advice, and the coordination and delivery of services.
Centrelink Chief Executive Officer :Ms Carolyn Hogg, PSM
Outcome 1Self sufficiency for individuals and families through
access to personalised assistance and co-ordinated delivery of payments and services on behalf of
government.
Medicare Australia Chief Executive Officer :
Ms Lynelle Briggs
Outcome 1Access to Government health and other payment
and information services to the Australian public and providers through convenient and efficient service
delivery.
Australian Hearing*Managing Director:Mr Steven Grundy
5

6
PORTFOLIO RESOURCES
Table 1: Portfolio resources 2010-11 Receipts Total
Bill No. 3 Bill No. 4 Special$m $m $m $m $m
CentrelinkAdministered appropriations - - - - - Departmental appropriations 22 6 - 59 87 Total: 22 6 - 59 87 Medicare AustraliaAdministered appropriations - - - 60 60Departmental appropriations - 1 - 42 43Total: - 1 - 102 103Portfolio total 190Less amounts transferred
within portfolio - - - - -
Resources available within portfolio: 190
Appropriation
6

7
AGENCY ADDITIONAL ESTIMATES STATEMENTS
Centrelink..................................................................................................................... 10
Medicare Australia ...................................................................................................... 32
7

9
Centrelink
Agency resources and planned performance
9

10
CENTRELINK
Section 1: Agency overview and resources............................................................. 11 1.1 Strategic Direction.................................................................................................. 11 1.2 Agency Resource Statement ................................................................................. 12 1.3 Agency Measures table.......................................................................................... 14 1.4 Additional Estimates and variations ....................................................................... 16 1.5 Breakdown of Additional Estimates by appropriation bill ....................................... 18
Section 2: Revisions to agency resources and planned performance.................. 20 2.1 Resources and performance information............................................................... 20
Section 3: Explanatory tables and budgeted financial statements ....................... 22 3.1 Explanatory tables.................................................................................................. 22 3.2 Budgeted financial statements ............................................................................... 23
10

11
CENTRELINK
Section 1: Agency overview and resources
1.1 STRATEGIC DIRECTION
•
•
•
•
•
•
•
11

12
1.2 AGENCY RESOURCE STATEMENT
Table 1.1: Centrelink resource statement — Additional estimates for 2010-11 as at Additional Estimates February 2011
Estimate as Proposed Total Totalat Budget + Additional = estimate available
Estimate at Additional appropriationEstimates
2010-11 2010-11 2010-11 2009-10$'000 $'000 $'000 $'000
Ordinary annual services1
Departmental appropriationPrior year departmental appropriation2 444,810 - 444,810 362,604 Departmental appropriation3 2,621,496 22,121 2,643,617 2,775,399 s31 Relevant agency receipts4 89,043 59,083 148,126 223,942 Total 3,155,349 81,204 3,236,553 3,361,945
Total ordinary annual services A 3,155,349 81,204 3,236,553 3,361,945
Other services5
Departmental non-operatingEquity injections 54,961 6,229 61,190 17,341 Departmental Supplementation - - - 1,903
Total other services B 54,961 6,229 61,190 19,244 Total available annual
appropriations 3,210,310 87,433 3,297,743 3,381,189 Special Accounts
Opening balance6 - - - 362,604 Appropriation receipts - - - 541,382 Non-appropriation receipts to Special Accounts - - - -
Total Special Account C - - - 903,986 Total resourcingA+B+C 3,210,310 87,433 3,297,743 4,285,175 Less appropriations drawn from
annual appropriations aboveand credited to special accountsthrough annual appropriations - - - (903,986)
Total net resourcing for Centrelink 3,210,310 87,433 3,297,743 3,381,189 1 Appropriation Bill (No.1 & 3) 2010-11. 2 Appropriation receivable and cash and equivalent adjusted for 2009-10 supplementary appropriation disclosed
under Departmental appropriation. 3 Includes an amount of $144.9m in 2010-11 for the Departmental Capital Budget (refer to table 3.2.5 for further
details). For accounting purposes this amount has been designated as 'contributions by owners'. 4 s31 Relevant Agency receipts – estimate. 5 Appropriation Bill (No.2 & 4) 2010-11. 6 The Commonwealth Social Services Special Account was abolished on 31 March in accordance with Determination 2009/26.
Reader note: All figures are GST exclusive
12

13
Table 1.1: Centrelink resource statement — Additional estimates for 2010-11 as at Additional Estimates February 2011 (continued)
Third Party Payments from and on behalf of other agencies Estimate at Estimate at
Budget AdditionalEstimates
2010-11 2010-11$'000 $'000
Centrelink has authority to make the following estimated payments on behalf of other agencies: 1,2,3,4
(disclosed in the respective agency's Resource Statement)
Department of Families, Housing, Community Servicesand Indigenous Affairs (FaHCSIA)
19,002,663 19,098,443 Special Appropriations - Social Security (Administration) Act 1999 50,316,250 50,552,316 Special Appropriation - Paid Parental Leave Act 2010 441,152 445,925 Annual Appropriations - Ex Gratia and Act of Grace Payments 3,630 3,837
Department of Education, Employment and WorkplaceRelations (DEEWR)
3,333,271 3,443,385 13,384,456 13,586,356 3,123,242 3,089,962
264,704 269,428 52,675 52,675
- 198
Department of Agriculture, Fisheries and Forestry (DAFF)
134,847 139,681 Annual Appropriation - Interim Income Support - 1,094 Annual Appropriation - Exceptional Circumstances 39,500 39,500 Annual Appropriation - Climate Change Adjustment Program 17,950 17,950 Annual Appropriation - WA Pilot 2,863 2,863
90,117,203 90,743,613
Receipts received from other agencies for the provision of services 76,066 129,508 (disclosed above within Departmental section 31)
Annual Appropriation - Job Education Training Child Care Fees Assistance
Special Appropriations - A New Tax System (Family Assistance) (Administration) Act 1999
Special Appropriations - A New Tax System (Family Assistance) (Administration) Act 19995
Special Appropriations - Social Security (Administration) Act 1999Special Appropriations - Social Security Act 1991Special Appropriations - Student Assistance Act 1973
Annual Appropriation - Compensation & Debt Relief (Act of Grace)
Special Appropriation - Farm Household Support Act 1992 (Exceptional Circumstances Relief Payment)
Notes: 1 Centrelink arrangements with the above agencies (i.e. FaHCSIA, DEEWR, DAFF) include the delivery of payments
to customers. 2 Centrelink has no drawdown access to the above agencies' administered appropriations that are required to be
drawn and paid to customers. 3 The respective agencies are responsible for the policy, estimates and reporting of these administered
appropriations. 4 The figures disclosed above are based on the estimates as provided to Centrelink by the respective agencies. 5 The figures disclosed above includes Child Care Benefit program appropriation amounting to $2,052.4m which
both Centrelink and DEEWR deliver to the customers on behalf of DEEWR.
13

14
1.3 AGENCY MEASURES TABLE
Table 1.2: Agency 2010-11 Measures since Budget
Program 2010-11 2011-12 2012-13 2013-14$'000 $'000 $'000 $'000
Expense measuresDepartment of Families, Housing, Community Services and Indigenous Affairs
Community Development Employment Projects (CDEP) 1.1
Departmental expenses 1 - (2,238) - -
Age Pension - new work bonus 1.1Departmental expenses 108 2,542 1,111 833
Paid Paternity Leave 1.1Departmental expenses 58 692 3,675 3,477
More Flexible Family Tax Benefit Advances 1.1
Departmental expenses 1 3,478 22,042 11,580 11,247
Healthy Start for School 1.1Departmental expenses 1 4,736 3,513 1,216 1,202
Supporting Families with Teenagers 1.1Departmental expenses 1 1,004 (3,415) (19,201) (24,862)
Department of Education, Employment and Workplace Relations
Welfare reform - tougher rules for job seekers 1.1
Departmental expenses - - - - Job seeker engagement - increased support 1.1
Departmental expenses - - - - Child Care Rebate – fortnightly payments 1.1
Departmental expenses 2,795 4,651 3,876 564 Child Care Rebate – additional payment option 1.1
Departmental expenses 1 10,701 2,346 2,109 4,498 Department of Agriculture, Fisheries and Forestry
Drought Assistance - Exceptional Circumstances assistance for primary producers 1.1
Departmental expenses 393 102 - - Drought Assistance - Exceptional Circumstances assistance for small businesses 1.1
Departmental expenses 13 2 - - Prepared on a Government Financial Statistics (fiscal) basis
14

15
Table 1.2: Agency 2010-11 Measures since Budget (continued)
Program 2010-11 2011-12 2012-13 2013-14$'000 $'000 $'000 $'000
Expense measuresDrought Assistance - Interim Income Support for primary producers 1.1
Departmental expenses 1 120 - - -
Drought Assistance - Interim Income Support for small businesses 1.1
Departmental expenses 1 14 - - -
Department of the TreasuryPersonal income tax - 50 per cent tax discount for interest income - revised policy 1.1
Departmental expenses (369) (482) 1,496 752 Department of Immigration and Citizenship
Migration Program - allocation of places for 2010-11 1.1
Departmental expenses (622) (708) (1,109) (1,409)
Total expense measures 22,429 29,047 4,753 (3,698)
Capital measuresDepartment of Families, Housing, Community Services and Indigenous Affairs
Age Pension - new work bonus 1.1Departmental capital 2,500 - - -
More Flexible Family Tax Benefit Advances 1.1
Departmental capital1 1,588 1,288 - -
Supporting Families with Teenagers 1.1Departmental capital1 438 5,526 - -
Department of Education, Employment and Workplace Relations
Child Care Rebate – additional payment option 1.1
Departmental capital 1 1,703 959 775 -
Total capital measures 6,229 7,773 775 -
Prepared on a Government Financial Statistics (fiscal) basis. Note: The lead agency for each measure is included in the Table above. The full measure description and package
details appear in the Mid-Year Economic and Fiscal Outlook (MYEFO) under the relevant portfolio except for measures decided post MYEFO. 1 Measure relates to a decision made post MYEFO.
15
16
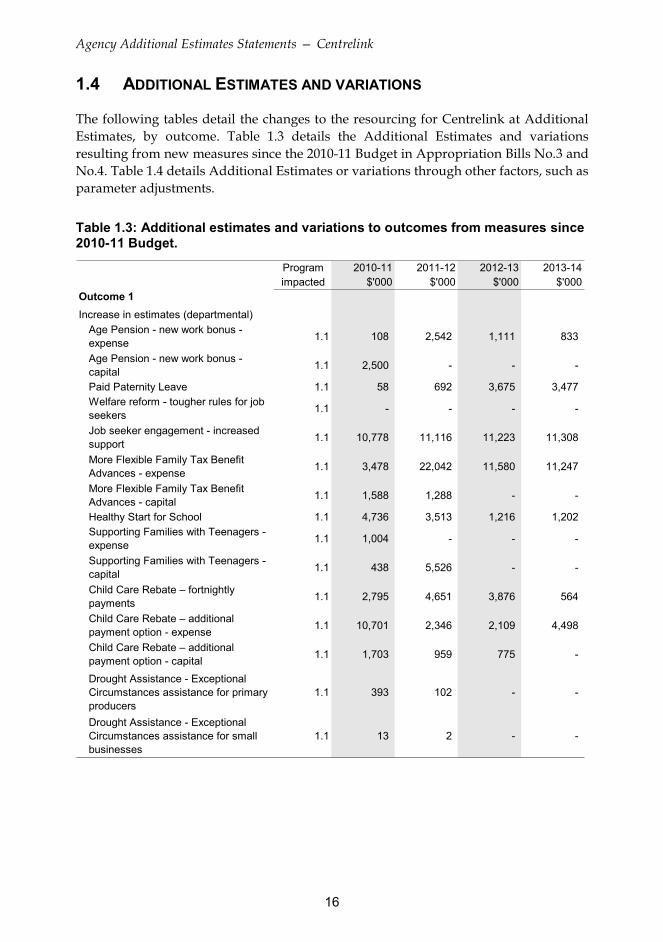
1.4 ADDITIONAL ESTIMATES AND VARIATIONS
Table 1.3: Additional estimates and variations to outcomes from measures since 2010-11 Budget.
Program 2010-11 2011-12 2012-13 2013-14impacted $'000 $'000 $'000 $'000
Outcome 1Increase in estimates (departmental)
Age Pension - new work bonus - expense 1.1 108 2,542 1,111 833
Age Pension - new work bonus - capital 1.1 2,500 - - -
Paid Paternity Leave 1.1 58 692 3,675 3,477 Welfare reform - tougher rules for job seekers 1.1 - - - -
Job seeker engagement - increased support 1.1 10,778 11,116 11,223 11,308
More Flexible Family Tax Benefit Advances - expense 1.1 3,478 22,042 11,580 11,247
More Flexible Family Tax Benefit Advances - capital 1.1 1,588 1,288 - -
Healthy Start for School 1.1 4,736 3,513 1,216 1,202 Supporting Families with Teenagers - expense 1.1 1,004 - - -
Supporting Families with Teenagers - capital 1.1 438 5,526 - -
Child Care Rebate – fortnightly payments 1.1 2,795 4,651 3,876 564
Child Care Rebate – additional payment option - expense 1.1 10,701 2,346 2,109 4,498
Child Care Rebate – additional payment option - capital 1.1 1,703 959 775 -
Drought Assistance - Exceptional Circumstances assistance for primary producers
1.1 393 102 - -
Drought Assistance - Exceptional Circumstances assistance for small businesses
1.1 13 2 - -
16

17
Table 1.3: Additional estimates and variations to outcomes from measures since 2010-11 Budget (continued)
Program 2010-11 2011-12 2012-13 2013-14impacted $'000 $'000 $'000 $'000
Outcome 1
Increase in estimates (departmental)
Drought Assistance - Interim Income Support for primary producers 1.1 120 - - -
Drought Assistance - Interim Income Support for small businesses 1.1 14 - - -
Personal income tax - 50 per cent tax discount for interest income - revised policy
1.1 - - 1,496 752
Decrease in estimates (departmental)Community Development Employment Projects (CDEP) 1.1 - (2,238) - -
Supporting Families with Teenagers - (3,415) (19,201) (24,862)
Migration Program - allocation of places for 2010-11 1.1 (622) (708) (1,109) (1,409)
Job seeker engagement - increased support 1.1 (10,778) (11,116) (11,223) (11,308)
Personal income tax - 50 per cent tax discount for interest income - revised policy
1.1 (369) (482) - -
Net impact on estimates for Outcome 1 (departmental) 28,658 36,820 5,528 (3,698)
Table 1.4: Additional estimates and variations to outcomes from other variations
Program 2010-11 2011-12 2012-13 2013-14impacted $'000 $'000 $'000 $'000
Outcome 1Increase in estimates (departmental)
Changes in price and wage indices 1.1 - 13,232 18,082 20,527
Decrease in estimates (departmental)Application of efficiency dividend 1.1 - (1,900) (1,998) (1,887) Property Lease Savings 1.1 (308) (498) (508) (572)
Net impact on estimates for Outcome 1 (departmental) (308) 10,834 15,576 18,068
17

18
1.5 BREAKDOWN OF ADDITIONAL ESTIMATES BY APPROPRIATION BILL
Table 1.5: Appropriation Bill (No. 3) 2010-11 2009-10 2010-11 2010-11 Additional Reduced
Available Budget Revised Estimates Estimates$'000 $'000 $'000 $'000 $'000
DEPARTMENTAL PROGRAMSOutcome 1Self sufficiency for individuals and families through access to personalised assistance and co-ordinated delivery of payments and services on behalf of government 2,775,399 2,621,496 2,643,617 34,198 (12,077) Total 2,775,399 2,621,496 2,643,617 34,198 (12,077) Total departmental 2,775,399 2,621,496 2,643,617 34,198 (12,077)
Note 1: 2009-10 available appropriation is included to allow a comparison of this year's appropriation with what was made available for use in the previous year.
Note 2: The net addition in Centrelink's direct appropriation of $22.12 m is made up of: - Job seeker engagement – increased support: $10.78m - Child Care Rebate – additional payment option: $10.70m- Healthy Start for School: $4.74m - More Flexible Family Tax Benefit Advances: $3.48m - Child Care Rebate – fortnightly payments: $2.80m - Supporting Families with Teenagers: $1.00m - Drought assistance - Exceptional Circumstances assistance: $0.41m - Drought assistance - Interim Income Support: $0.13m - Age Pension - new work bonus: $0.11m - Paid Paternity Leave: $0.05m - Job seeker engagement – increased support: -$10.78m- Migration Program – allocation of places for 2010-11: -$0.62m- Personal Income tax - 50 per cent tax discount for interest income – revised policy: -$0.37m - Property Lease Savings: -$0.31m.
18

19
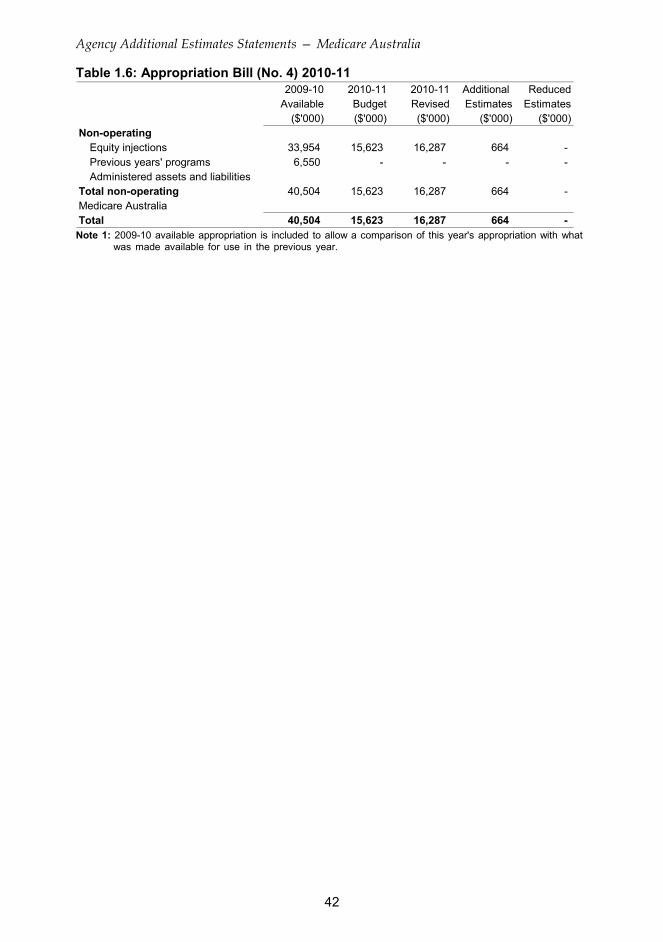
Table 1.6: Appropriation Bill (No. 4) 2010-11 2009-10 2010-11 2010-11 Additional Reduced
Available Budget Revised Estimates Estimates$'000 $'000 $'000 $'000 $'000
Non-operatingEquity injections 17,341 54,961 61,190 6,229 - Departmental Supplementation 1,903 - - - -
Total non-operating 19,244 54,961 61,190 6,229 -
Total 19,244 54,961 61,190 6,229 - Note 1: 2009-10 available appropriation is included to allow a comparison of this year's appropriation with what was
made available for use in the previous year. Note 2: The addition in Centrelink's equity injection of $6.23m is made up of:
- Age Pension - new work bonus: $2.50m - Child Care Rebate - additional payment option: $1.70m - More Flexible Family Tax Benefit Advances: $1.59m - Supporting Families with Teenagers: $0.44m.
19
20
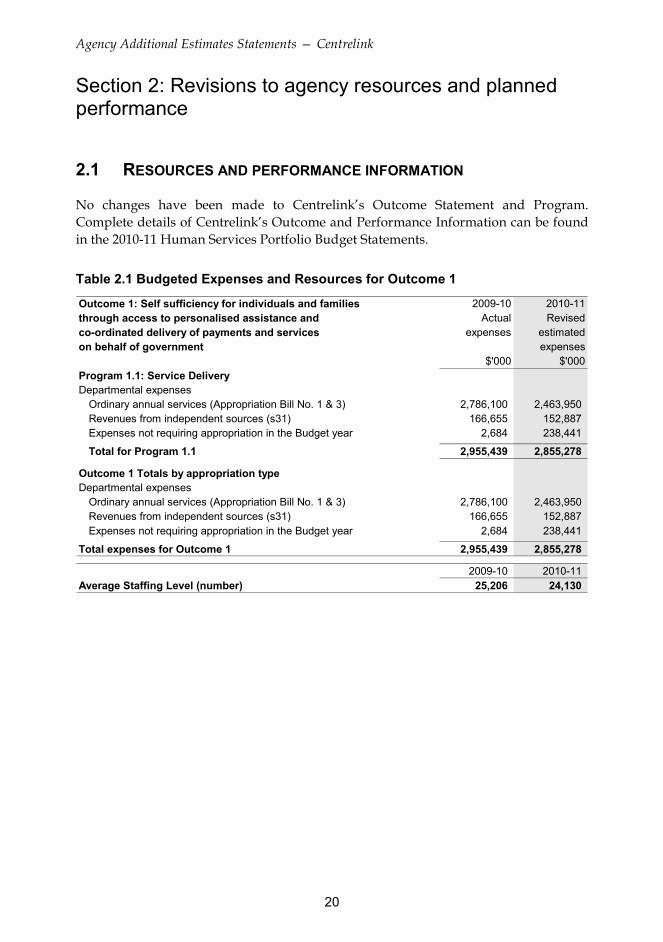
Section 2: Revisions to agency resources and planned performance
2.1 RESOURCES AND PERFORMANCE INFORMATION
Table 2.1 Budgeted Expenses and Resources for Outcome 1
Outcome 1: Self sufficiency for individuals and families 2009-10 2010-11through access to personalised assistance and Actual Revisedco-ordinated delivery of payments and services expenses estimatedon behalf of government expenses
$'000 $'000Program 1.1: Service DeliveryDepartmental expenses
Ordinary annual services (Appropriation Bill No. 1 & 3) 2,786,100 2,463,950 Revenues from independent sources (s31) 166,655 152,887 Expenses not requiring appropriation in the Budget year 2,684 238,441
Total for Program 1.1 2,955,439 2,855,278
Outcome 1 Totals by appropriation typeDepartmental expenses
Ordinary annual services (Appropriation Bill No. 1 & 3) 2,786,100 2,463,950 Revenues from independent sources (s31) 166,655 152,887 Expenses not requiring appropriation in the Budget year 2,684 238,441
Total expenses for Outcome 1 2,955,439 2,855,278
2009-10 2010-11Average Staffing Level (number) 25,206 24,130
20
21
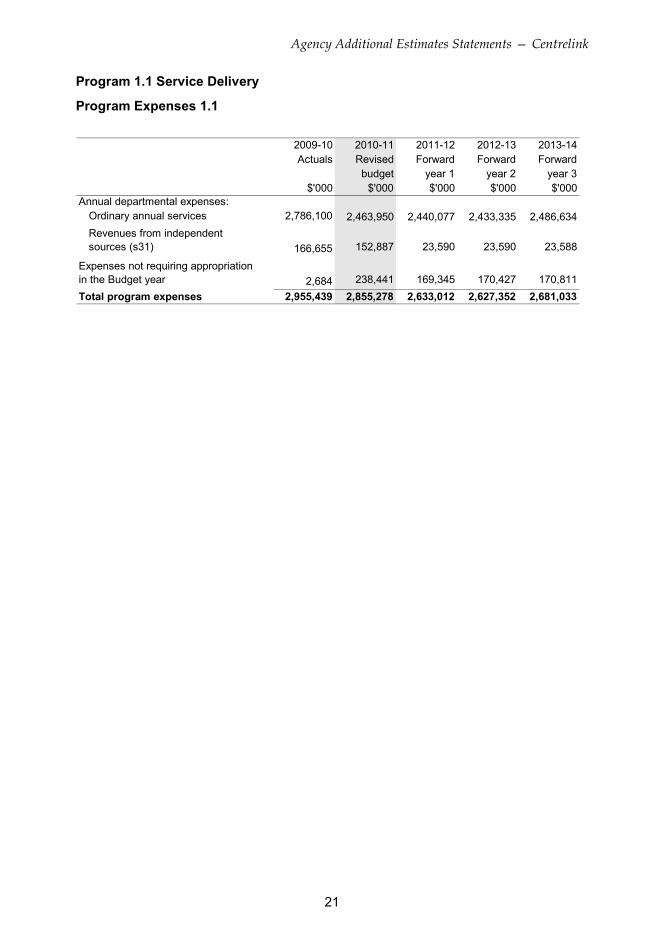
Program 1.1 Service Delivery
Program Expenses 1.1
2009-10 2010-11 2011-12 2012-13 2013-14Actuals Revised Forward Forward Forward
budget year 1 year 2 year 3$'000 $'000 $'000 $'000 $'000
Annual departmental expenses:Ordinary annual services 2,786,100 2,463,950 2,440,077 2,433,335 2,486,634Revenues from independent sources (s31) 166,655 152,887 23,590 23,590 23,588
Expenses not requiring appropriation in the Budget year 2,684 238,441 169,345 170,427 170,811Total program expenses 2,955,439 2,855,278 2,633,012 2,627,352 2,681,033
21

22
Section 3: Explanatory tables and budgeted financial statements
3.1 EXPLANATORY TABLES
Estimates of special account flows
Table 3.1.1: Estimates of special account flows Opening Closingbalance Receipts Payments balance2010-11 2010-11 2010-11 2010-112009-10 2009-10 2009-10 2009-10
Outcome $'000 $'000 $'000 $'000Commonwealth Social 1 - - - - Services Special Account (D) 362,604 541,382 (903,986) -
Commonwealth Services DeliveryAgency Other Trust Moneys 123 2,652 (2,775) - Account (T) 370 1,401 (1,648) 123
Total Special Accounts 2010-11 Budget estimate 123 2,652 (2,775) -
Total Special Accounts2009-10 estimate actual 362,974 542,783 (905,634) 123
(T) = Asset held in Trust (D) = Departmental Note 1: Total Special Accounts 2009-10 estimate actual is updated with 2009-10 Actual figures. Note 2: The Commonwealth Social Services Special Account was abolished on 31 March 2010 in accordance with
Determination 2009/26.Note 3: The Commonwealth Service Delivery Agency Other Trust Moneys Account will be abolished on 30 June
2011.
22

23
3.2 BUDGETED FINANCIAL STATEMENTS
3.2.1 Analysis of budgeted financial statements
Departmental financial statements
Budgeted departmental comprehensive income statement
Budgeted departmental balance sheet
23

24
3.2.2 Budgeted financial statements
Table 3.2.1: Budgeted departmental Comprehensive Income Statement (Showing Net Cost of Services)
Actual Revised Forward Forward Forwardbudget estimate estimate estimate
2009-10 2010-11 2011-12 2012-13 2013-14$'000 $'000 $'000 $'000 $'000
EXPENSESEmployee benefits 1,885,372 1,795,613 1,596,584 1,581,736 1,634,007 Supplier expenses 898,029 889,444 865,357 873,520 874,602 Depreciation and amortisation 166,332 165,721 166,571 167,596 167,924 Write-down and impairment of assets 5,532 4,500 4,500 4,500 4,500 Other 174 - - - - Total expenses 2,955,439 2,855,278 2,633,012 2,627,352 2,681,033 LESS: OWN-SOURCE INCOMERevenueSale of goods and rendering of services 164,999 152,887 23,590 23,590 23,588 Total revenue 164,999 152,887 23,590 23,590 23,588 GainsSale of assets 1,656 - - - - Other 2,684 2,720 2,774 2,831 2,887 Total gains 4,340 2,720 2,774 2,831 2,887 Total own-source income 169,339 155,607 26,364 26,421 26,475
Net cost of services 2,786,100 2,699,671 2,606,648 2,600,931 2,654,558 Revenue from Government 2,810,212 2,463,950 2,440,077 2,433,335 2,486,634 * * * *Surplus (Deficit) 24,112 (235,721) (166,571) (167,596) (167,924) Surplus (Deficit) attributable to
the Australian Government 24,112 (235,721) (166,571) (167,596) (167,924) Total comprehensive income
attributable to the Australian Government 24,112 (235,721) (166,571) (167,596) (167,924)
Note: Reconciliation of operating result attributable to the agency2009-10 2010-11 2011-12 2012-13 2012-13
$'000 $'000 $'000 $'000 $'000Operating result attributable to the
Australian Government 24,112 (235,721) (166,571) (167,596) (167,924)0 0 0 0plus non-appropriated expenses
depreciation and amortisation expenses - 165,721 166,571 167,596 167,924
Operating result attributable toCentrelink 24,112 (70,000) - - -
Prepared on Australian Accounting Standards basis.
(for the period ended 30 June)
24

25
Table 3.2.2: Budgeted departmental balance sheet (as at 30 June) Actual Revised Forward Forward Forward
budget estimate estimate estimate2009-10 2010-11 2011-12 2012-13 2013-14
$'000 $'000 $'000 $'000 $'000ASSETSFinancial assets
Cash and equivalents 31,086 13,569 13,596 13,559 13,510 Trade and other receivables 479,857 453,556 469,544 483,492 463,337
Total financial assets 510,943 467,125 483,140 497,051 476,847 Non-financial assets
Land and buildings 242,299 239,045 237,493 219,118 200,978 Property, plant and equipment 103,525 134,010 170,018 151,365 119,480 Intangibles 236,274 244,361 245,815 218,430 202,333 Other 53,971 55,208 56,784 58,440 60,145
Total non-financial assets 636,069 672,624 710,110 647,353 582,936 Total assets 1,147,012 1,139,749 1,193,250 1,144,404 1,059,783 LIABILITIESPayables
Suppliers 97,458 98,042 93,447 93,459 93,231 Other 138,222 140,599 146,266 150,293 156,366
Total payables 235,680 238,641 239,713 243,752 249,597 Provisions
Employee provisions 529,488 558,381 575,316 592,322 609,686 Other 30,856 34,578 29,662 23,684 18,362
Total provisions 560,344 592,959 604,978 616,006 628,048 Total liabilities 796,024 831,600 844,691 859,758 877,645 Net assets 350,988 308,149 348,559 284,646 182,138 EQUITY*
Contributed equity 289,984 482,866 689,847 793,528 858,944 Reserves 46,203 46,203 46,203 46,205 46,205 Retained surplus
(accumulated deficit) 14,801 (220,920) (387,491) (555,087) (723,011) Total equity 350,988 308,149 348,559 284,646 182,138 Prepared on Australian Accounting Standards basis.
* Equity is the residual interest in assets after deduction of liabilities
25

26
Table 3.2.3: Departmental statement of changes in equity — summary of movement (Budget year 2010-11)
Retained Asset Contributed Totalearnings revaluation equity/ equity
reserve capital$'000 $'000 $'000 $'000
Opening balance as at 1 July 2010Balance carried forward from
previous year 14,801 46,203 289,984 350,988 Adjusted opening balance 14,801 46,203 289,984 350,988
Deficit for the year (235,721) - - (235,721)
Total comprehensive incomerecognised directly in equity (235,721) - - (235,721)
Transactions with ownersContributions by owners
Appropriation (equity injection) - - 48,020 48,020 Appropriation (departmentalcapital budget) - - 144,862 144,862
Sub-total transactions with owners - - 192,882 192,882 Estimated closing balance
as at 30 June 2011 (220,920) 46,203 482,866 308,149 Prepared on Australian Accounting Standards basis.
26

27
Table 3.2.4: Budgeted departmental statement of cash flows (for the period ended 30 June)
Actual Revised Forward Forward Forwardbudget estimate estimate estimate
2009-10 2010-11 2011-12 2012-13 2013-14$'000 $'000 $'000 $'000 $'000
OPERATING ACTIVITIESCash received
Goods and services 238,828 153,711 28,738 28,734 28,727 Appropriations 2,363,586 2,502,462 2,424,319 2,419,621 2,507,028 Net GST received 90,261 99,707 79,721 81,802 82,457 Cash from the Official Public Account 314,513 - - - -
Total cash received 3,007,188 2,755,880 2,532,778 2,530,157 2,618,212 Cash used
Employees 1,864,981 1,779,826 1,575,852 1,560,666 1,609,832 Suppliers 985,473 963,181 956,899 965,528 967,543
Total cash used 2,850,454 2,743,007 2,532,751 2,526,194 2,577,375 Net cash from (used by)
operating activities 156,734 12,873 27 3,963 40,837 INVESTING ACTIVITIESCash received
Proceeds from sales of property,plant and equipment 145 - - - -
Total cash received 145 - - - - Cash used
Purchase of property, plant and equipment 108,315 162,708 147,769 76,450 63,623
Purchase of intangibles 49,423 73,734 59,212 31,231 42,679 Total cash used 157,738 236,442 206,981 107,681 106,302 Net cash used by
investing activities (157,593) (236,442) (206,981) (107,681) (106,302)
FINANCING ACTIVITIESCash received
Contributed equity 17,341 206,052 206,981 103,681 65,416 Total cash received 17,341 206,052 206,981 103,681 65,416 Cash used
Other - - - - - Total cash used - - - - - Net cash from
financing activities 17,341 206,052 206,981 103,681 65,416 Net increase (decrease)
in cash held 16,482 (17,517) 27 (37) (49) Cash and cash equivalents at the
beginning of the reporting period 14,604 31,086 13,569 13,596 13,559 Cash and cash equivalents at the
end of the reporting period 31,086 13,569 13,596 13,559 13,510 Prepared on Australian Accounting Standards basis.
27

28
Table 3.2.5: Capital Budget Statement — Departmental Actual Revised Forward Forward Forward
budget estimate estimate estimate2009-10 2010-11 2011-12 2012-13 2013-14
$'000 $'000 $'000 $'000 $'000CAPITAL APPROPRIATIONS
Capital budget - Bill 1 (DCB) - 144,862 192,050 102,491 65,416 Equity injections - Bill 2 & 4 17,341 61,190 14,931 1,190 - Previous years' outputs - Bill 2 & 4 1,903 - - - -
Total capital appropriations 19,244 206,052 206,981 103,681 65,416 Total new capital appropriationsRepresented by:
Purchase of non-financial assets 17,341 196,501 206,981 103,681 65,416 Other Items 1,903 9,551 - - -
Total Items 19,244 206,052 206,981 103,681 65,416 PURCHASE OF NON-FINANCIAL
ASSETSFunded by capital appropriations 17,341 51,639 14,931 1,190 - Funded by capital appropriation - DCB - 144,862 192,050 102,491 65,416 Funded internally from
departmental resources1 171,299 9,039 - 4,000 40,886 TOTAL 188,640 205,540 206,981 107,681 106,302 RECONCILIATION OF CASH
USED TO ACQUIRE ASSETSTO ASSET MOVEMENT TABLE
Total purchases2 157,738 236,442 206,981 107,681 106,302 Total cash used to
acquire assets 157,738 236,442 206,981 107,681 106,302 Prepared on Australian Accounting Standards basis. 1 Includes the following sources of funding: - annual and prior year appropriations - donations and contributions - internally developed assets - s31 relevant agency receipts - proceeds from the sale of assets. 2 The 2010-11 total purchases of $236.4m, includes asset purchases received in 2009-10 of $30.9m and paid for in
2010-11.
28

Tabl
e 3.
2.6:
Sta
tem
ent o
f Ass
et M
ovem
ents
(201
0-11
)La
ndB
uild
ings
Oth
er p
rope
rty,
Inta
ngib
les
Tota
lpl
ant a
ndeq
uipm
ent
$'00
0$'
000
$'00
0$'
000
$'00
0As
at 1
Jul
y 20
10G
ross
boo
k va
lue
3,97
5
304,
068
158,
639
52
9,53
4
996,
216
Acc
umul
ated
dep
reci
atio
n/am
ortis
atio
n an
d im
pairm
ent
-
(6
5,74
4)
(5
5,11
4)
(293
,260
)
(414
,118
)
O
peni
ng n
et b
ook
bala
nce
3,97
5
238,
324
103,
525
23
6,27
4
582,
098
CAP
ITAL
ASS
ET A
DD
ITIO
NS
Estim
ated
exp
endi
ture
on
new
or r
epla
cem
ent a
sset
sB
y pu
rcha
se -
appr
opria
tion
equi
ty-
-
18
,493
33
,146
51,6
39
By
purc
hase
- ap
prop
riatio
n or
dina
ryan
nual
ser
vice
s-
55,6
93
66,1
91
22,9
78
14
4,86
2
B
y pu
rcha
se -
othe
r-
-
-
9,03
9
9,
039
Tota
l add
ition
s-
55,6
93
84,6
84
65,1
63
20
5,54
0
O
ther
mov
emen
tsD
epre
ciat
ion/
amor
tisat
ion
expe
nse
-
(5
8,44
6)
(5
3,19
9)
(54,
076)
(1
65,7
21)
Oth
er-
(500
)
(1
,000
)
(3
,000
)
(4
,500
)
As a
t 30
June
201
1G
ross
boo
k va
lue
3,97
5
359,
260
242,
323
59
1,69
7
1,19
7,25
5
A
ccum
ulat
ed d
epre
ciat
ion/
amor
tisat
ion
and
impa
irmen
t-
(124
,190
)
(1
08,3
13)
(347
,336
)
(579
,839
)
C
losi
ng n
et b
ook
bala
nce
3,97
5
235,
070
134
,010
244,
361
617
,416
P
repa
red
on A
ustra
lian
Acc
ount
ing
Sta
ndar
ds b
asis
.
2929
30
Notes to the financial statements
Departmental
• •
30

31
Medicare Australia
Agency resources and planned performance
31

32
MEDICARE AUSTRALIA
Section 1: Agency overview and resources............................................................. 33 1.1 Strategic Direction.................................................................................................. 33 1.2 Agency Resource Statement ................................................................................. 35 1.3 Agency Measures table.......................................................................................... 38 1.4 Additional Estimates and variations ....................................................................... 39 1.5 Breakdown of Additional Estimates by appropriation bill ....................................... 41
Section 2: Revisions to agency resources and planned performance.................. 43 2.1 Resources and performance information............................................................... 43
Section 3: Explanatory tables and budgeted financial statements ....................... 50 3.1 Explanatory tables.................................................................................................. 50 3.2 Budgeted financial statements ............................................................................... 51
32

33
MEDICARE AUSTRALIA
Section 1: Agency overview and resources
1.1 STRATEGIC DIRECTION
33

34
34

35
1.2 AGENCY RESOURCE STATEMENT
Table 1.1: Medicare Australia resource statement — Additional estimates for 2010-11 as at Additional Estimates February 2011
Estimate as Proposed Total Totalat Budget + Additional = estimate available
Estimates at Additional appropriationEstimates
2010-11 2010-11 2010-11 2009-10$'000 $'000 $'000 $'000
Ordinary annual services1
Departmental appropriationPrior year departmental appropriation2 171,111 - 171,111 113,007 Departmental appropriation3 656,255 - 656,255 654,219 s31 Relevant agency receipts4 66,697 41,685 108,382 130,497
Total 894,063 41,685 935,748 897,723
Administered expensesOutcome 1 3 2 - 2 4,786 Total 2 - 2 4,786
Total ordinary annual services A 894,065 41,685 935,750 902,509 Other services5
Departmental non-operatingEquity injections6 47,434 664 48,098 55,674
Total 47,434 664 48,098 55,674 Total other services B 47,434 664 48,098 55,674 Total available annual
appropriations 941,499 42,349 983,848 958,183 Special appropriationsTotal special appropriations C - - - - Total appropriations excluding
special accounts 941,499 42,349 983,848 958,183
35
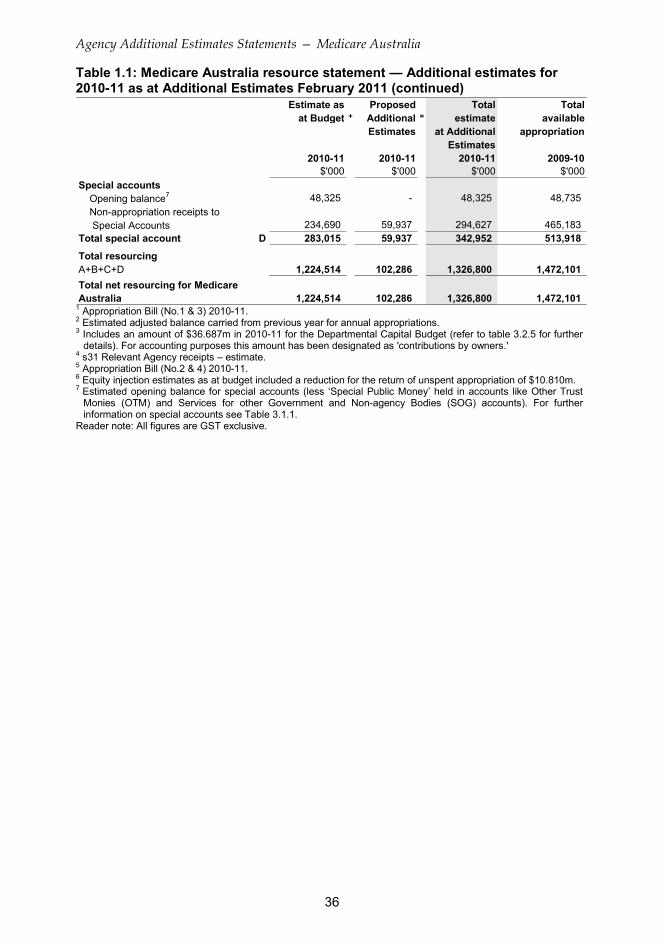
36
Table 1.1: Medicare Australia resource statement — Additional estimates for 2010-11 as at Additional Estimates February 2011 (continued)
Estimate as Proposed Total Totalat Budget + Additional = estimate available
Estimates at Additional appropriationEstimates
2010-11 2010-11 2010-11 2009-10$'000 $'000 $'000 $'000
Special accountsOpening balance7 48,325 - 48,325 48,735 Non-appropriation receipts to Special Accounts 234,690 59,937 294,627 465,183
Total special account D 283,015 59,937 342,952 513,918
Total resourcingA+B+C+D 1,224,514 102,286 1,326,800 1,472,101 Total net resourcing for Medicare Australia 1,224,514 102,286 1,326,800 1,472,101
1 Appropriation Bill (No.1 & 3) 2010-11. 2 Estimated adjusted balance carried from previous year for annual appropriations. 3 Includes an amount of $36.687m in 2010-11 for the Departmental Capital Budget (refer to table 3.2.5 for further
details). For accounting purposes this amount has been designated as 'contributions by owners.' 4 s31 Relevant Agency receipts – estimate. 5 Appropriation Bill (No.2 & 4) 2010-11. 6 Equity injection estimates as at budget included a reduction for the return of unspent appropriation of $10.810m. 7 Estimated opening balance for special accounts (less ‘Special Public Money’ held in accounts like Other Trust
Monies (OTM) and Services for other Government and Non-agency Bodies (SOG) accounts). For further information on special accounts see Table 3.1.1.
Reader note: All figures are GST exclusive.
36

37
Table 1.1: Medicare Australia resource statement — Additional estimates for 2010-11 as at Additional Estimates February 2011 (continued)
Third Party Drawdowns from and on behalf of other agencies
Estimate at Estimate atBudget Additional
Estimates2010-11 2010-11
$'000 $'000Payments made on behalf of other agencies
(disclosed in the respective agency Resource Statement)Department of Veterans' AffairsVeterans’ Entitlements Act 1986 3,527,783 3,751,995 Military Rehabilitation and Compensation Act 2004 3,020 3,020 Department of Health and AgeingHealth Insurance Act 1973 - Medical Benefits 16,239,979 16,396,829 Dental Benefits Act 2008 66,196 68,523 National Health Act 1953 - Pharmaceutical Benefits 7,190,859 8,924,662 National Health Act 1953 - Aids and Appliances 86,166 78,107 Private Health Insurance Act 2007 4,426,001 4,714,502
115,409 115,408 Aged Care Act 1997 7,431,202 7,678,000
9,517 9,104 Department of Climate Change and Energy EfficiencyAppropriation (Water Entitlements and Home Insulation) Act 2009–2010 384,220 64,500
Total Third party payments 39,480,351 41,804,650
Receipts received from other agencies for the provision of services(disclosed above within Departmental section 31)Centrelink 7,587 8,985 Department of Climate Change and Energy Efficiency 7,311 Department of Defence 609 609 Department of Education, Employment and Workplace Relations 153 153
9,222 9,222 Department of Health and Ageing 21,929 31,655 Department of Veterans' Affairs 15,613 16,029 Other external entities 11,584 34,418
Total s31 Relevant agency receipts 66,697 108,382
Department of Families, Housing, Community Services and Indigenous Affairs
Medical Indemnity Agreement (Financial Assistance Binding Commonwealth Obligations) Act 2002
Financial Management and Accountability Act 1987 - Australian Childhood Immunisation Register Special Account
37

38
1.3 AGENCY MEASURES TABLE
Table 1.2: Agency 2010-11 measures since Budget Program 2010-11 2011-12 2012-13 2013-14
$'000 $'000 $'000 $'000
Expense measuresDepartment of Health and Ageing
Connecting health services to the future 1.1Departmental expenses 1,348 1,649 856 931
National Health and Hospitals Network – General Practice and Primary Care – coordinated diabetes care (reversal of 2010-11 Budget measure) 1.1
Departmental expenses (1,308) (2,051) (3,257) (3,573) Pharmaceutical Benefits Scheme: - minor new listings 1.2
Departmental expenses 32 57 76 87 - new listings 1.1, 1.2
Departmental expenses1 342 733 749 769 Department of Families, Housing, Community Services and Indigenous Affairs
Paid Paternity Leave 1.3Departmental expenses - 397 1,189 1,187
Healthy Start for School 1.3Departmental expenses1 87 - - -
Department of Immigration and Citizenship
Migration Program- allocation of places in 2010-11 1.1,1.2
Departmental expenses (8) (25) (44) (64) Total expense measures
Departmental 493 760 (431) (663) Total 493 760 (431) (663)
Capital measuresDepartment of Health and Ageing
Connecting health services to the future 1.1Departmental capital 664 1,401 - -
National Health and Hospitals Network – General Practice and Primary Care – coordinated diabetes care (reversal of 2010-11 Budget measure) 1.1
Departmental capital - (1,319) - - Total capital measures
Departmental 664 82 - - Total 664 82 - - Prepared on a Government Financial Statistics (fiscal) basis. Note: The lead agency for each measure is included in the table above. The full measure description and package
details appear in the Mid-Year Economic and Fiscal Outlook (MYEFO) under the relevant portfolio except for measures decided post MYEFO. 1 Measure relates to a decision made post MYEFO.
38

39
1.4 ADDITIONAL ESTIMATES AND VARIATIONS
Table 1.3: Additional estimates and variations to outcomes from measures since 2010-11 Budget
Program 2010-11 2011-12 2012-13 2013-14impacted $'000 $'000 $'000 $'000
Outcome 1Increase in estimates (departmental)
Connecting health services to the future 1.1 2,012 3,050 856 931
Pharmaceutical Benefits Scheme - - minor new listings 1.2 32 57 76 87 - new listings 1.1, 1.2 342 733 749 769 Paid Paternity Leave 1.3 - 397 1,189 1,187 Healthy Start for School 1.3 87 - - -
Decrease in estimates (departmental)National Health and Hospitals Network - General Practice and Primary Care - coordinated diabetes care (reversal of 2010-11 Budget measure)
1.1 (1,308) (3,370) (3,257) (3,573)
Migration Program- allocation of places in 2010-11 1.1,1.2 (8) (25) (44) (64)
Net impact on estimates for Outcome 1 (departmental) 1,157 842 (431) (663)
39

40
Table 1.4: Additional estimates and variations to outcomes from other variations
Program 2010-11 2011-12 2012-13 2013-14impacted ($'000) ($'000) ($'000) ($'000)
Outcome 1Increase in estimates (departmental)
Changes in the wage and price indices
1.1,1.2,1.3 - 1,118 2,156 2,699
Decrease in estimates (departmental)Change in transaction volumes 1.1, 1.2 (871) (4,448) (8,588) (11,348) Application of Efficiency Dividend 1.1,1.2,
1.3- (538) (756) (1,030)
Net impact on estimates for Outcome 1 (departmental) (871) (3,868) (7,188) (9,679)
40

41
1.5 BREAKDOWN OF ADDITIONAL ESTIMATES BY APPROPRIATION BILL
Table 1.5: Appropriation Bill (No. 3) 2010-11 2009-10 2010-11 2010-11 Additional Reduced
Available Budget Revised Estimates Estimates($'000) ($'000) ($'000) ($'000) ($'000)
ADMINISTERED ITEMSOutcome 1
Access to Government health and other payment and information services to the Australian public and providers through convenient and efficient service delivery
4,381 - - - -
Total 4,381 - - - - DEPARTMENTAL PROGRAMSOutcome 1
Access to Government health and other payment and information services to the Australian public and providers through convenient and efficient service delivery
655,768 656,255 655,877 3,065 (3,443)
Total 655,768 656,255 655,877 3,065 (3,443) Total administered and
departmental 660,149 656,255 655,877 3,065 (3,443) Note 1: 2009-10 available appropriation is included to allow a comparison of this year's appropriation with what
was made available for use in the previous year. Available appropriation is the amount available to be drawn down, and is equal to: Budget Appropriation + Additional Estimates Appropriation + AFM - Savings - Rephasings - Other Reductions +/- Section 32
41
42
Table 1.6: Appropriation Bill (No. 4) 2010-11 2009-10 2010-11 2010-11 Additional Reduced
Available Budget Revised Estimates Estimates($'000) ($'000) ($'000) ($'000) ($'000)
Non-operatingEquity injections 33,954 15,623 16,287 664 - Previous years' programs 6,550 - - - - Administered assets and liabilities
Total non-operating 40,504 15,623 16,287 664 - Medicare AustraliaTotal 40,504 15,623 16,287 664 -
Note 1: 2009-10 available appropriation is included to allow a comparison of this year's appropriation with what was made available for use in the previous year. Available appropriation is the amount available to be drawn down, and is equal to: Budget Appropriation + Additional Estimates Appropriation + AFM - Savings - Rephasings - Other Reductions +/- Section 32
42

43
Section 2: Revisions to agency resources and planned performance
2.1 RESOURCES AND PERFORMANCE INFORMATION
OUTCOME 1
Outcome 1 strategy
43

44
Table 2.1 Budgeted Expenses and Resources for Outcome 1
2009-10 2010-11Actual Revised
expenses estimatedexpenses
$'000 $'000Program 1.1: Medical Benefits and ServicesDepartmental expenses
Ordinary annual services (Appropriation Bill No. 1 & 3) 462,555 463,243 Revenues from independent sources (s31) 29,874 29,298 Expenses not requiring appropriation in the Budget year - 32,759 Total for Program 1.1 492,429 525,300
Program 1.2: Pharmaceutical Benefits and ServicesDepartmental expenses
Ordinary annual services (Appropriation Bill No. 1 & 3) 151,209 148,042 Revenues from independent sources (s31) 1,017 3,980 Expenses not requiring appropriation in the Budget year - 10,917 Total for Program 1.2 152,226 162,939
Program 1.3: Other Benefits and ServicesDepartmental expenses
Ordinary annual services (Appropriation Bill No. 1 & 3) 142 7,452 Revenues from independent sources (s31) 79,061 60,942 Expenses not requiring appropriation in the Budget year 390 1,527 Total for Program 1.3 79,593 69,921
Program 1.4: Medicare Rebates - Electronic ClaimingAdministered expenses
Ordinary annual services (Appropriation Bill No. 1 & 3) 3,614 - Total for Program 1.4 3,614 -
Outcome 1 Totals by appropriation typeAdministered Expenses
Ordinary annual services (Appropriation Bill No. 1 & 3) 3,614 - Departmental expenses
Ordinary annual services (Appropriation Bill No. 1 & 3) 613,906 618,737 Revenues from independent sources (s31) 109,952 94,220 Expenses not requiring appropriation in the Budget year 390 45,203
Total expenses for Outcome 1 727,862 758,160
2009-10 2010-11Average Staffing Level (number) 5,089 5,210
Outcome 1: Access to Government health and other payment and information services to the Australian public and providers through convenient and efficient service delivery.
44

45
Program 1.1 Delivery of Medical Benefits and Services
Program 1.1 Objective
Program 1.1 Expenses 2009-10 2010-11 2011-12 2012-13 2013-14Actuals Revised Forward Forward Forward
('000) budget year 1 year 2 year 3Annual departmental expenses:
Ordinary annual services (Appropriation Bill No. 1 & 3)
462,555 463,243 471,392 477,523 498,791
Revenue from other sources(FMA Act s31)
29,874 29,298 14,448 10,277 9,416
Expenses not requiring appropriation inthe Budget year 32,759 39,014 34,405 33,389
Total program expenses 492,429 525,300 524,854 522,205 541,596 Program 1.1 Deliverables
2009-10 2010-11 2011-12 2012-13 2013-14Actuals Revised Forward Forward Forward
Deliverables budget year 1 year 2 year 3Medicare - volume of services payments (million)1
367 385 401 416 437
Medicare - accuracy of processing (%) 97.9% ≥ 98% ≥ 98% ≥ 98% ≥ 98%Medicare - prompt processing (%) 99.5% ≥ 90% ≥ 90% ≥ 90% ≥ 90%
1 The Total Volume of Services includes processing of billable transactions for Medicare Claims, Private Health Fund rebates, Medical Indemnity, Hearing Services, Immunisation, GP and Practice Incentives, Organ Donor Register, and Compensation Recoveries.
45

46
Program 1.1 Key Performance Indicators (KPIs) 2009-10 2010-11 2011-12 2012-13 2013-14
Key Performance Actuals Revised Forward Forward ForwardIndicators budget year 1 year 2 year 3
targetMinister is satisfied with the timeliness and relevance of advice
100% 95% 95% 95% 95%
Ministerial replies to correspondence are submitted within agreed timeframes
96% 95% 95% 95% 95%
The proportion of Medicare Bulk Bill claims processed electronically1
91% ≥ 95% ≥ 95% ≥ 95% ≥ 95%
The proportion of Medicare Patient Claims processed electronically2
25% ≥ 30% ≥ 30% ≥ 30% ≥ 30%
Average appropriated expense per billable service3
1.26 1.20 1.18 1.15 1.14
Community satisfaction 96% ≥ 90% ≥ 90% ≥ 90% ≥ 90%Practice manager satisfaction 91% ≥ 85% ≥ 85% ≥ 85% ≥ 85%Practitioner satisfaction 85% ≥ 70% ≥ 70% ≥ 70% ≥ 70%The portfolio will work together to deliver a Bill for introduction to Parliament (in the Autumn sitting 2011) for the portfolio to be established as one Department of State.4
100.00%
By the end of 2010 the portfolio will have another 20 co-located offices around Australia.4
100.00%
By the end of 2010 the portfolio will have a single phone number and a single website.4
100.00%
1 The 2010-11 KPI should have been ≥95%, not ≥ 90% as reported in the 2010-11 Portfolio Budget Statements. 2 The 2010-11 KPI should have been ≥30%, not ≥ 25% as reported in the 2010-11 Portfolio Budget Statements. 3 The "Average appropriated expense per billable service" reflects the appropriated cost of all billable services
provided under program 1.1. 4 Responsibility for achieving these KPIs is shared jointly across portfolio agencies.
46
47
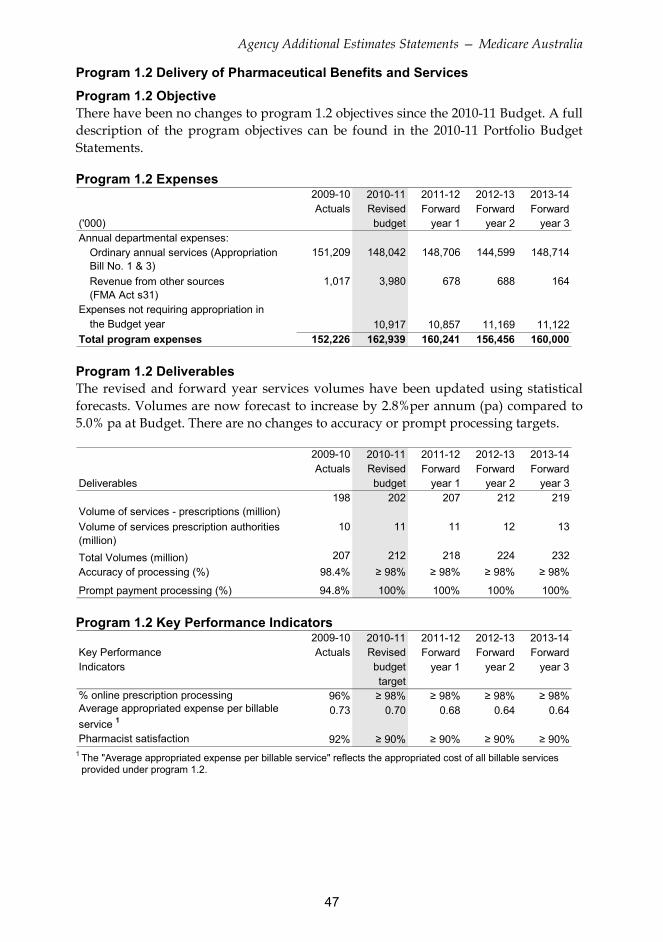
Program 1.2 Delivery of Pharmaceutical Benefits and Services
Program 1.2 Objective
Program 1.2 Expenses 2009-10 2010-11 2011-12 2012-13 2013-14Actuals Revised Forward Forward Forward
('000) budget year 1 year 2 year 3Annual departmental expenses:
Ordinary annual services (Appropriation Bill No. 1 & 3)
151,209 148,042 148,706 144,599 148,714
Revenue from other sources(FMA Act s31)
1,017 3,980 678 688 164
Expenses not requiring appropriation inthe Budget year 10,917 10,857 11,169 11,122
Total program expenses 152,226 162,939 160,241 156,456 160,000
Program 1.2 Deliverables
2009-10 2010-11 2011-12 2012-13 2013-14Actuals Revised Forward Forward Forward
Deliverables budget year 1 year 2 year 3
Volume of services - prescriptions (million) 198 202 207 212 219
Volume of services prescription authorities (million)
10 11 11 12 13
Total Volumes (million) 207 212 218 224 232 Accuracy of processing (%) 98.4% ≥ 98% ≥ 98% ≥ 98% ≥ 98%
Prompt payment processing (%) 94.8% 100% 100% 100% 100%
Program 1.2 Key Performance Indicators 2009-10 2010-11 2011-12 2012-13 2013-14
Key Performance Actuals Revised Forward Forward ForwardIndicators budget year 1 year 2 year 3
target% online prescription processing 96% ≥ 98% ≥ 98% ≥ 98% ≥ 98%Average appropriated expense per billable service 1
0.73 0.70 0.68 0.64 0.64
Pharmacist satisfaction 92% ≥ 90% ≥ 90% ≥ 90% ≥ 90%1 The "Average appropriated expense per billable service" reflects the appropriated cost of all billable services provided under program 1.2.
47

48
Program 1.3 Delivery of Other Benefits and Services
Program 1.3 Objective
Program 1.3 Expenses2009-10 2010-11 2011-12 2012-13 2013-14Actuals Revised Forward Forward Forward
('000) budget year 1 year 2 year 3Annual departmental expenses:
Ordinary annual services (Appropriation Bill No. 1 & 3)
142 7,452 8,517 3,240 2,552
Revenue from other sources (FMA Act s31)
79,061 60,942 33,605 33,456 33,215
Expenses not requiring appropriation in theBudget year 390 1,527 2,031 208 152
Total program expenses 79,593 69,921 44,153 36,904 35,919 Program 1.3 Deliverables
Program 1.3 Key Performance Indicators2009-10 2010-11 2011-12 2012-13 2013-14
Key Performance Actuals Revised Forward Forward ForwardIndicators budget year 1 year 2 year 3
targetAged Care 1:Residential Entry Record (RER) Admissions Form
44% ≥63%
Residential Classification (Aged Care Funding Instrument)
81% ≥82%
Residential Care Claim 31% ≥63% Community Care Claim 7% ≥15% Aged Care Client Record (ACCR) Aged Care Assessment Teams online
38% ≥78%
1 The Aged Care service agreement with Department of Health and Ageing expires at 30 June 2011.
48

49
Program 1.4: Medicare Rebates – Electronic Claiming
Program 1.4 Objective
Program 1.4 Expenses2009-10 2010-11 2011-12 2012-13 2013-14Actuals Revised Forward Forward Forward
('000) budget year 1 year 2 year 3Annual administered expenses:
Ordinary annual services (Appropriation Bill No. 1 & 3) 3,614 - - - -
Total program expenses 3,614 - - - - Program 1.4 Deliverables
2009-10 2010-11 2011-12 2012-13 2013-14Actuals Revised Forward Forward Forward
Deliverables budget year 1 year 2 year 3Number of sites for which Software incentives are paid 1,790 - - - - Program 1.4 Key Performance Indicators
2009-10 2010-11 2011-12 2012-13 2013-14Key Performance Actuals Revised Forward Forward ForwardIndicators budget year 1 year 2 year 3
targetPrompt payment of Software vendor incentive 90% - - - -
49

50
Section 3: Explanatory tables and budgeted financial statements
3.1 EXPLANATORY TABLES
Estimates of special account flows
Table 3.1.1: Estimates of special account flows Opening Closingbalance Receipts Payments Adjustments balance2010-11 2010-11 2010-11 2010-11 2010-112009-10 2009-10 2009-10 2009-10 2009-10
Outcome $'000 $'000 $'000 $'000 $'000Recovery of Compensation1 1 48,325 241,073 240,873 8,061 56,586
48,616 465,183 465,474 - 48,325
Superannuation Clearing House2 1 - 53,554 53,554 - -
- - - - -
Services for Other Entities and Trust Moneys3 1 99 1,470 1,470 - 99
119 1,312 1,332 - 99
Total special accounts 2010-11 Budget estimate 48,424 296,097 295,897 8,061 56,685
Total special accounts2009-10 actual 48,735 466,495 466,806 - 48,424
A) = Administered (D) = Departmental
1 Recovery of Compensation for Health Care and Other Services Special Account, s20 FMA Act Determination 2005/24 (Administered). Funds are held pending a determination of the amount recoverable in respect of Medicare benefits and Nursing Home or Residential Subsidies paid. The amount recovered is returned to the Official Public Account via DoHA. Funds held in special accounts are not available for use by Medicare Australia for departmental or administered purposes.
2 Superannuation Clearing House Special Account, s20 FMA Act Determination 2010/05 (Administered). The purpose of this account is for the receipt of employer superannuation contributions by eligible employers and payment to the relevant superannuation funds by Medicare Australia. Funds held in special accounts are not available for use by Medicare Australia for departmental or administered purposes.
3 Services for Other Entities and Trust Moneys - Medicare Australia Special Account, s20 FMA Act Determination 2009/18 (Departmental). The purpose of this account is for the expenditure of funds held on trust or otherwise for the benefit of a person other than the Commonwealth. Funds held in special accounts are not available for use by Medicare Australia for departmental or administered purposes.
50

51
3.2 BUDGETED FINANCIAL STATEMENTS
3.2.1 Analysis of budgeted financial statements
Departmental financial statements
Budgeted Departmental Comprehensive Income Statement
Budgeted Departmental Balance Sheet
Administered financial statements
51

52
3.2.2 Budgeted financial statements
Table 3.2.1: Budgeted departmental Comprehensive Income Statement (Showing Net Cost of Services)
Actual Revised Forward Forward Forwardbudget estimate estimate estimate
2009-10 2010-11 2011-12 2012-13 2013-14$'000 $'000 $'000 $'000 $'000
EXPENSESEmployee benefits 385,251 381,592 362,321 358,417 369,382 Supplier 295,338 329,778 314,111 311,262 323,917 Depreciation and amortisation 42,939 46,790 52,816 45,886 44,216 Write-down and impairment of assets 196 - - - - Finance costs 524 - - - - Total expenses 724,248 758,160 729,248 715,565 737,515 LESS: OWN-SOURCE INCOMERevenueSale of goods and rendering of services 108,563 95,070 50,014 48,065 46,728 Interest 510 - - - - Other 878 621 485 323 - Total revenue 109,951 95,691 50,499 48,388 46,728 GainsSale of assets 1 - - - - Other 390 250 250 250 250 Total gains 391 250 250 250 250 Total own-source income 110,342 95,941 50,749 48,638 46,978 Net cost of (contribution by)
services 613,906 662,219 678,499 666,927 690,537 Revenue from Government 652,041 618,737 628,615 625,362 650,057 * * * *Surplus (Deficit) 38,135 (43,482) (49,884) (41,565) (40,480) Surplus (Deficit) attributable to
the Australian Government 38,135 (43,482) (49,884) (41,565) (40,480) OTHER COMPREHENSIVE INCOMEChanges in asset revaluation reserves 17,633 - - - -
Total other comprehensive income 17,633 - - - - Total comprehensive income 55,768 (43,482) (49,884) (41,565) (40,480) Total comprehensive income
attributable to theAustralian Government 55,768 (43,482) (49,884) (41,565) (40,480)
Note: Reconciliation of operating result attributable to the agency2009-10 2010-11 2011-12 2012-13 2013-14
$'000 $'000 $'000 $'000 $'000Operating result attributable to the
Australian Government 55,768 (43,482) (49,884) (41,565) (40,480) plus non-appropriated expenses
depreciation and amortisation expenses 44,953 51,652 45,532 44,413
Operating result attributable to theAgency 55,768 1,471 1,768 3,967 3,933
Prepared on Australian Accounting Standards basis.
52
(for the period ended 30 June)

53
Table 3.2.2: Budgeted departmental balance sheet (as at 30 June) Actual Revised Forward Forward Forward
budget estimate estimate estimate2009-10 2010-11 2011-12 2012-13 2013-14
$'000 $'000 $'000 $'000 $'000ASSETSFinancial assets
Cash and equivalents 7,708 9,954 9,954 9,954 9,954 Trade and other receivables 216,499 168,730 162,731 158,023 156,790 Other 28,116 28,116 28,116 28,116 28,116
Total financial assets 252,323 206,800 200,801 196,093 194,860 Non-financial assets
Land and buildings 84,569 84,657 86,909 91,323 96,204 Infrastructure, plant and equipment 679 598 683 754 894 Intangibles 59,735 104,701 117,267 111,080 103,019 Heritage and cultural assets 89 89 89 89 89 Other 9,929 9,929 9,929 9,929 9,929
Total non-financial assets 155,001 199,974 214,877 213,175 210,135 Total assets 407,324 406,774 415,678 409,268 404,995 LIABILITIESProvisions
Employees 113,420 117,338 116,293 113,526 115,844 Other 15,210 15,210 15,210 15,210 15,210
Total provisions 128,630 132,548 131,503 128,736 131,054 Payables
Suppliers 52,455 48,806 48,017 47,142 45,339 Other 29,410 29,410 29,410 29,410 29,410
Total payables 81,865 78,216 77,427 76,552 74,749 Total liabilities 210,495 210,764 208,930 205,288 205,803 Net assets 196,829 196,010 206,748 203,980 199,192 EQUITY*
Contributed equity 162,236 204,899 265,521 304,318 340,010 Reserves 17,657 17,657 17,657 17,657 17,657 Retained surpluses
(accumulated deficits) 16,936 (26,546) (76,430) (117,995) (158,475)
Total equity 196,829 196,010 206,748 203,980 199,192 Prepared on Australian Accounting Standards basis.
* Equity is the residual interest in assets after deduction of liabilities.
53

54
Table 3.2.3: Budgeted departmental statement of cash flows (for the period ended 30 June)
Actual Revised Forward Forward Forwardbudget estimate estimate estimate
2009-10 2010-11 2011-12 2012-13 2013-14$'000 $'000 $'000 $'000 $'000
OPERATING ACTIVITIESCash received
Goods and services 130,187 96,182 52,539 48,052 46,685 Appropriations 626,138 703,494 632,089 630,083 651,333 Interest 510 - - - - Dividends - - - - - Net GST received 23,834 31,291 29,244 28,901 30,131 Other - 621 485 323 -
Total cash received 780,669 831,588 714,357 707,359 728,149 Cash used
Employees 381,072 404,774 363,366 361,184 367,064 Suppliers 283,367 344,177 314,650 311,887 325,470 Borrowing costs - - - - - Net GST paid 33,584 31,291 29,244 28,901 30,131
Total cash used 698,023 780,242 707,260 701,972 722,665 Net cash from or (used by)
operating activities 82,646 51,346 7,097 5,387 5,484 INVESTING ACTIVITIESCash received
Proceeds from sales of property,plant and equipment 5 - - - -
Total cash received 5 - - - - Cash used
Purchase of property, plant and equipment 65,666 91,763 67,719 44,184 41,176
Total cash used 65,666 91,763 67,719 44,184 41,176 Net cash from or (used by)
investing activities (65,661) (91,763) (67,719) (44,184) (41,176)
FINANCING ACTIVITIESCash received
Contributed equity (15,150) 42,663 60,622 38,797 35,692 Total cash received (15,150) 42,663 60,622 38,797 35,692 Cash usedTotal cash used - - - - - Net cash from or (used by)
financing activities (15,150) 42,663 60,622 38,797 35,692 Net increase or (decrease)
in cash held 1,835 2,246 - - - Cash and cash equivalents at the
beginning of the reporting period 5,873 7,708 9,954 9,954 9,954 Cash and cash equivalents at the
end of the reporting period 7,708 9,954 9,954 9,954 9,954 Prepared on Australian Accounting Standards basis.
54
55
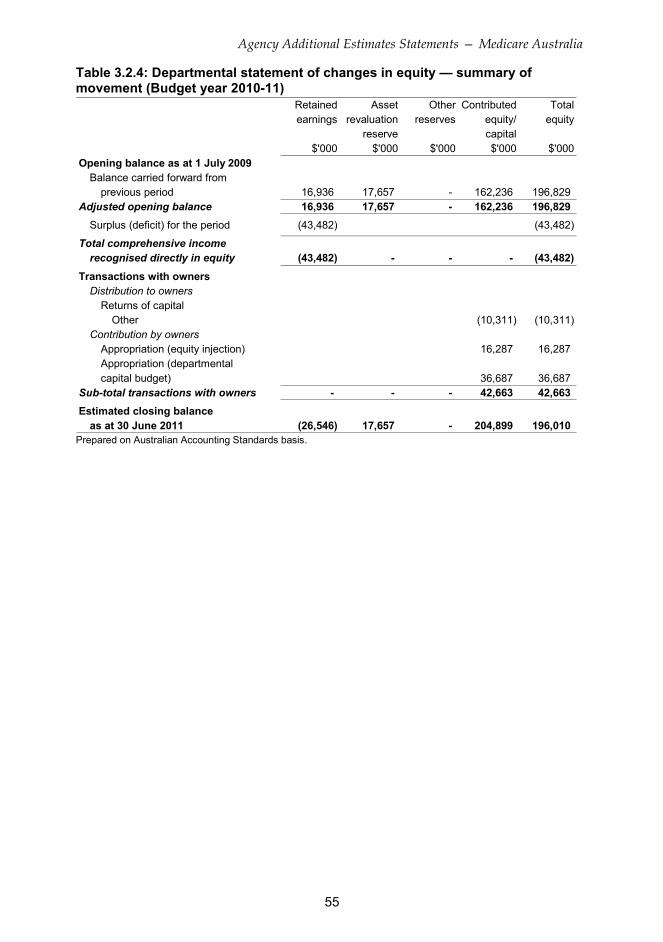
Table 3.2.4: Departmental statement of changes in equity — summary of movement (Budget year 2010-11)
Retained Asset Other Contributed Totalearnings revaluation reserves equity/ equity
reserve capital$'000 $'000 $'000 $'000 $'000
Opening balance as at 1 July 2009Balance carried forward from
previous period 16,936 17,657 - 162,236 196,829 Adjusted opening balance 16,936 17,657 - 162,236 196,829
Surplus (deficit) for the period (43,482) (43,482)
Total comprehensive incomerecognised directly in equity (43,482) - - - (43,482)
Transactions with ownersDistribution to owners
Returns of capitalOther (10,311) (10,311)
Contribution by ownersAppropriation (equity injection) 16,287 16,287 Appropriation (departmentalcapital budget) 36,687 36,687
Sub-total transactions with owners - - - 42,663 42,663 Estimated closing balance
as at 30 June 2011 (26,546) 17,657 - 204,899 196,010 Prepared on Australian Accounting Standards basis.
55

56
Table 3.2.5: Capital Budget Statement — Departmental Actual Revised Forward Forward Forward
budget estimate estimate estimate2009-10 2010-11 2011-12 2012-13 2013-14
$'000 $'000 $'000 $'000 $'000CAPITAL APPROPRIATIONS
Capital budget - Bill 1 (DCB) 36,687 54,367 38,797 35,692 Equity injections - Bill 2 34,962 16,287 6,255 - - Previous years' outputs - Bill 2 6,550 - - - -
Total capital appropriations 41,512 52,974 60,622 38,797 35,692 Total new capital appropriationsRepresented by:
Purchase of non-financial assets 34,962 52,974 60,622 38,797 35,692 Annual finance lease costs - - - - - Other Items 6,550 - - - -
Total Items 41,512 52,974 60,622 38,797 35,692 PURCHASE OF NON-FINANCIAL
ASSETSFunded by capital appropriations 11,866 48,450 6,255 - - Funded by capital appropriation - DCB1
- 36,687 54,367 38,797 35,692 Funded by finance leases - - - - -
53,800 6,626 7,097 5,387 5,484 TOTAL 65,666 91,763 67,719 44,184 41,176
RECONCILIATION OF CASHUSED TO ACQUIRE ASSETSTO ASSET MOVEMENT TABLE
Total purchases 65,666 91,763 67,719 44,184 41,176 Total cash used to
acquire assets 65,666 91,763 67,719 44,184 41,176
Funded internally from departmental resources2
Prepared on Australian Accounting Standards basis. 1 Does not include annual finance lease costs. Include purchase from current and previous years Departmental
Capital Budgets. 2 Includes the following sources of funding: - annual and prior year appropriations - donations and contributions - gifts - internally developed assets - s31 relevant agency receipts (for FMA agencies only) - proceeds from the sale of assets.
56
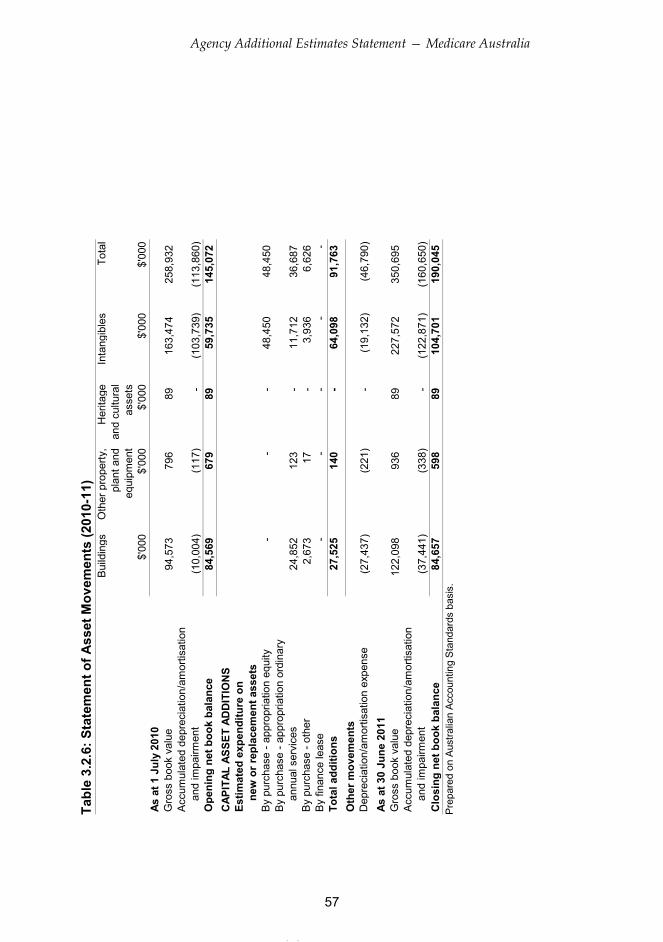
Ta
ble
3.2.
6: S
tate
men
t of A
sset
Mov
emen
ts (2
010-
11)
Bui
ldin
gsO
ther
pro
perty
,H
erita
geIn
tang
ible
sTo
tal
plan
t and
and
cultu
ral
equi
pmen
tas
sets
$'00
0$'
000
$'00
0$'
000
$'00
0As
at 1
Jul
y 20
10G
ross
boo
k va
lue
94,5
73
79
6
89
16
3,47
4
258,
932
A
ccum
ulat
ed d
epre
ciat
ion/
amor
tisat
ion
and
impa
irmen
t(1
0,00
4)
(1
17)
-
(1
03,7
39)
(113
,860
)
O
peni
ng n
et b
ook
bala
nce
84,5
69
67
9
89
59
,735
14
5,07
2
CAP
ITAL
ASS
ET A
DD
ITIO
NS
Estim
ated
exp
endi
ture
on
new
or r
epla
cem
ent a
sset
sB
y pu
rcha
se -
appr
opria
tion
equi
ty-
-
-
48,4
50
48,4
50
By
purc
hase
- ap
prop
riatio
n or
dina
ryan
nual
ser
vice
s24
,852
123
-
11
,712
36
,687
B
y pu
rcha
se -
othe
r2,
673
17
-
3,93
6
6,
626
By
finan
ce le
ase
-
-
-
-
-
To
tal a
dditi
ons
27,5
25
14
0
-
64,0
98
91,7
63
Oth
er m
ovem
ents
Dep
reci
atio
n/am
ortis
atio
n ex
pens
e(2
7,43
7)
(2
21)
-
(1
9,13
2)
(46,
790)
-
As a
t 30
June
201
1G
ross
boo
k va
lue
122,
098
936
89
227,
572
35
0,69
5
Acc
umul
ated
dep
reci
atio
n/am
ortis
atio
nan
d im
pairm
ent
(37,
441)
(338
)
-
(122
,871
)
(1
60,6
50)
Clo
sing
net
boo
k ba
lanc
e84
,657
598
89
104,
701
19
0,04
5
Pre
pare
d on
Aus
tralia
n A
ccou
ntin
g S
tand
ards
bas
is.
57
57

58
Table 3.2.7: Capital Budget Statement — Reconciliation of Heritage and Cultural Asset Funding
Schedule of administered activity
Table 3.2.8: Schedule of budgeted income and expenses administered on behalf of government (for the period ended 30 June)
Actual Revised Forward Forward Forwardbudget estimate estimate estimate
2009-10 2010-11 2011-12 2012-13 2013-14$'000 $'000 $'000 $'000 $'000
INCOME ADMINISTERED ONBEHALF OF GOVERNMENT
RevenueTotal revenues administered
on behalf of government - - - - -
GainsTotal gains administered
on behalf of government - - - - -
Total income administeredon behalf of government - - - - -
EXPENSES ADMINISTERED ONBEHALF OF GOVERNMENTSubsidies 3,614 - - - -
Total expenses administeredon behalf of government 3,614 - - - -
Prepared on Australian Accounting Standards basis.
58
59
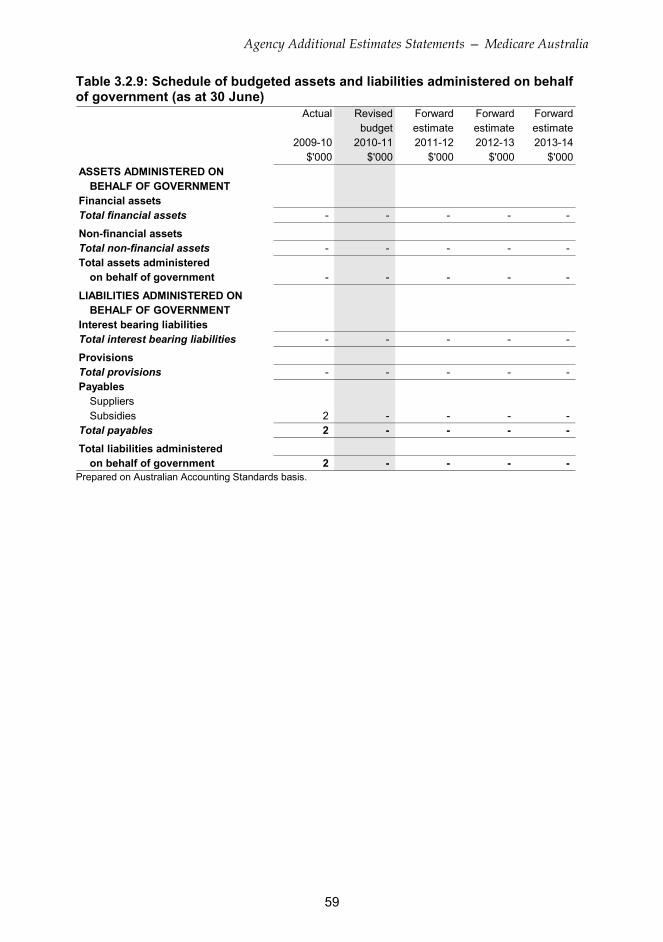
Table 3.2.9: Schedule of budgeted assets and liabilities administered on behalf of government (as at 30 June)
Actual Revised Forward Forward Forwardbudget estimate estimate estimate
2009-10 2010-11 2011-12 2012-13 2013-14$'000 $'000 $'000 $'000 $'000
ASSETS ADMINISTERED ON BEHALF OF GOVERNMENT
Financial assetsTotal financial assets - - - - -
Non-financial assetsTotal non-financial assets - - - - - Total assets administered
on behalf of government - - - - -
LIABILITIES ADMINISTERED ON BEHALF OF GOVERNMENT
Interest bearing liabilitiesTotal interest bearing liabilities - - - - -
ProvisionsTotal provisions - - - - - Payables
SuppliersSubsidies 2 - - - -
Total payables 2 - - - - Total liabilities administered
on behalf of government 2 - - - - Prepared on Australian Accounting Standards basis.
59

60
Table 3.2.10: Schedule of budgeted administered cash flows (for the period ended 30 June)
Actual Revised Forward Forward Forwardbudget estimate estimate estimate
2009-10 2010-11 2011-12 2012-13 2013-14$'000 $'000 $'000 $'000 $'000
OPERATING ACTIVITIESCash receivedTotal cash received - - - - -
Cash usedSubsidies paid 4,017 2 - - -
Total cash used 4,017 2 - - - Net cash from or (used by)
operating activities (4,017) (2) - - - INVESTING ACTIVITIESCash receivedTotal cash received - - - - - Cash usedTotal cash used - - - - - Net cash from or (used by)
investing activities - - - - -
FINANCING ACTIVITIESCash receivedTotal cash received - - - - - Cash usedTotal cash used - - - - - Net cash from or (used by)
financing activities - - - - -
Net increase or (decrease) in cash held (4,017) (2) - - - Cash at beginning of reporting periodCash from Official Public Account for:
- appropriations 4,017 2 - - - Cash at end of reporting period - - - - -
Prepared on Australian Accounting Standards basis. Table 3.2.11: Schedule of Administered Capital Budget
Table 3.2.12: Statement of Administered Asset Movements (2010-11)
60

61
Notes to the financial statements
Basis of accounting
61


63
PORTFOLIO GLOSSARY
63

64
64

65
65

66
66

67
67
