humber estuary coastal authorities group flamborough …...humber estuary coastal authorities group...
TRANSCRIPT
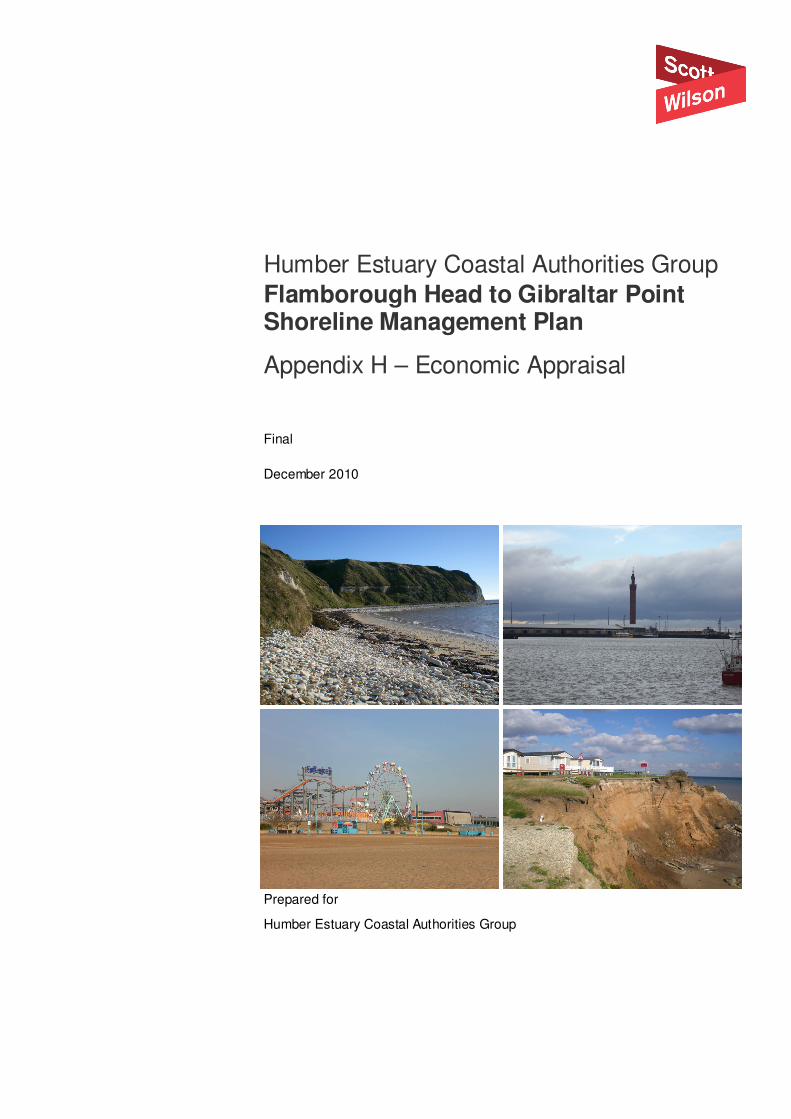
Humber Estuary Coastal Authorities Group
Flamborough Head to Gibraltar Point Shoreline Management Plan
Appendix H – Economic Appraisal
Final
December 2010
Prepared for
Humber Estuary Coastal Authorities Group
Humber Estuary Coastal Authorities Group
Flamborough Head to Gibraltar Point Shoreline Management Plan
Scott Wilson Scott House Alençon Link Basingstoke Hampshire RG21 7PP Tel 01256 310200 Fax 01256 310201 www.scottwilson.com
This document has been prepared in accordance with the scope of Scott Wilson's appointment with its client and is subject to the terms of that appointment. It is addressed to and for the sole and confidential use and reliance of Scott Wilson's client. Scott Wilson accepts no liability for any use of this document other than by its client and only for the purposes for which it was prepared and provided. No person other than the client may copy (in whole or in part) use or rely on the contents of this document, without the prior written permission of the Company Secretary of Scott Wilson Ltd. Any advice, opinions, or recommendations within this document should be read and relied upon only in the context of the document as a whole. The contents of this document do not provide legal or tax advice or opinion. © Scott Wilson Ltd 2010
Revision Schedule Flamborough Head to Gibraltar Point Shoreline Management Plan Appendix H – Economic Appraisal December 2010
Rev Date Details Prepared by Reviewed by Approved by
CD1 9 November 2009
Consultation draft
Nicholas Clarke Coastal Engineer
David Dales Director Dr John Pos Associate
David Dales Director
F1 20 December 2010
Final Nicholas Clarke Coastal Engineer Jonathan Short Assistant Coastal Engineer
Dr John Pos Associate
David Dales Director

Humber Estuary Coastal Authorities Group
Flamborough Head to Gibraltar Point Shoreline Management Plan
Appendix H - Economic Appraisal December 2010 1
Table of Contents
H1 Introduction........................................................................................ 2
H2 Methodology ...................................................................................... 3
H3 Appraisal ............................................................................................ 5
Policy Unit A – Flamborough Head to Sewerby ................................................................... 5
Policy Unit B – Bridlington to Hilderthorpe ............................................................................ 5
Policy Unit C – Wilsthorpe to Atwick...................................................................................... 6
Policy Unit D – North Cliff to Hornsea Burton (Hornsea)..................................................... 6
Policy Unit E – Rolston to Waxholme .................................................................................... 8
Policy Unit F – Owthorne to Hollym (Withernsea)................................................................ 9
Policy Unit G – Hollym to Dimlington Cliffs ......................................................................... 10
Policy Unit H – Dimlington and Easington Gas Terminals................................................. 10
Policy Unit I – Easington to Kilnsea..................................................................................... 11
Policy Unit J – Kilnsea to Spurn Point ................................................................................. 12
Policy Unit K – Easington Road to Stone Creek ................................................................ 12
Policy Unit L – East Immingham to Cleethorpes ................................................................ 13
Policy Unit M – Humberston Fitties ..................................................................................... 14
Policy Unit N – South of Humberston Fitties to Theddlethorpe St Helen......................... 14
Policy Unit O – Viking Gas Terminal (Mablethorpe) to southern end of Skegness ............................................................................................................................... 15
Policy Unit P – Seacroft to Gibraltar Point .......................................................................... 16
H4 Summary .......................................................................................... 18
H5 References ....................................................................................... 19

Humber Estuary Coastal Authorities Group
Flamborough Head to Gibraltar Point Shoreline Management Plan
Appendix H - Economic Appraisal December 2010 2
H1 Introduction
H1.1 The Shoreline Management Plan guidance (Defra, 2006) requires that proposed policy
scenarios are robust against a range of criteria.
H1.2 This appendix assesses the economics of the preferred policies in terms of the benefits
afforded by them and the costs to implement them. This includes:
a. Sensitivity testing: to identify uncertainties in key variables and potential impacts of the
preferred policy scenario;
b. A socio-economic assessment: to consider costs/benefits and also cumulative human and
natural implications for the preferred policy scenario.
H1.3 The socio-economic assessment used broad scale information on the cost of existing defences
and the value of assets protected to test the preferred policy for each Policy Unit. On the basis
of this assessment of the preferred policy it was determined if:
• The benefits clearly outweigh the costs;
• The benefits marginally outweigh the costs; or
• The costs clearly outweigh the benefits.
H1.4 An SMP is an aspirational, broad scale plan for the future, and consequently the SMP guidance
(Defra, 2006b) recognises that the justification of a particular policy does not depend purely on
whether or not benefits outweigh costs; non-quantifiable criteria such as environmental issues,
sediment continuity and the policies of adjacent areas must also be evaluated. However high
level economic assessments have been an integral part of the Plan development to ensure that
the preferred policies are not economically nonsensical.
H1.5 Funding has not been a key driver of policy development as it is not the scope of an SMP to
account for the current funding system as it is a forward looking aspirational Plan. Neither is it
the role of an SMP to prescribe precisely how policies should be funded in the future; however,
the economic assessments undertaken provide a broad indication of the potential funding that
maybe needed to implement the preferred policy. This SMP acknowledges that funding issues
will provide a major hurdle in the implementation of some aspirational policies. It is prudent to
recognise that in some instances Government funding may not always be available (especially
where benefits only marginally outweigh, or are similar to, the costs), and funding maybe
required from other sources, otherwise policy delivery maybe at risk.
H1.6 It is the role of coastal strategies to provide the policy delivery mechanisms and consider the
economics and funding issues in greater detail. In 2009 the Environment Agency issued a long
term investment strategy which sets out the best available evidence on the choices the people
of England face about how much should be invested in managing the increasing risk of flooding
and coastal erosion, and how the Environment Agency should deliver a long-term programme
of investment. This document provides a useful insight into potential funding sources, and how
much funding is likely to be required in the future; this document can be viewed at:
http://publications.environment-agency.gov.uk/pdf/GEHO0609BQDF-E-E.pdf

Humber Estuary Coastal Authorities Group
Flamborough Head to Gibraltar Point Shoreline Management Plan
Appendix H - Economic Appraisal December 2010 3
H2 Methodology
H2.1 Economic appraisal of the SMP is carried out in accordance with Defra’s Flood and Coastal
Defence Project Appraisal Guidance Note 3: Economic Assessment (FCDPAG3). FCDPAG3
sets out the basis for calculation of whole life costs, discounting future costs, as well as
outlining what benefits can be included in the economic appraisal. Benefit cost ratios are then
calculated on the cost of the policy implementation and the benefits received from the policy
over the “No Active Intervention” scenario.
H2.2 Where Benefit / Cost ratios are much greater than 1 the benefits received from the
implementation of the policy are clearly greater than the cost of the defences required. Where
Benefit / Cost ratios are less than 1 the benefits provided by the implementation of the policy
are clearly less than the cost of the defences required. Where the benefits produced through
implementing a policy are similar, to or just greater than costs, the economic case is
considered marginal.
H2.3 The economic appraisal is based on the best available information for each Policy Unit. The
appraisal used two approaches depending on the availability of suitably detailed information:
1. In many areas existing strategies have already undertaken an economic analysis using
FCDPAG3 for sections of the coastline. In such cases, the information has been reviewed
and details of the outcomes in relation to the preferred policies are presented. For details
of the benefits (assets and intangibles) and options appraised reference should be made
to the appropriate report. The coastal strategies used to inform the economic assessment
included:
• Bridlington Coastal Strategy (Posford Haskoning, 2005)
• Withernsea coastal Strategy (Posford Duvivier, 2001)
• Humber Flood Risk Management Strategy (RPA, 2003)
• Lincshore Performance Review, 2008
2. Where no previous economic analysis has been performed a strategic economic
assessment was undertaken using FCDPAG3. Defence costs were estimated and
assessed against the potential benefits of readily identifiable assets, such as residential
properties. This method is used to determine only if the benefits generated by the policy
are greater, similar to, or less than the costs. Benefits in this analysis are based only on
residential and commercial properties. No assessment under this method has been made
of intangible benefits. This makes the benefits significantly conservative as it excludes all
infrastructure, amenity and farm land value.
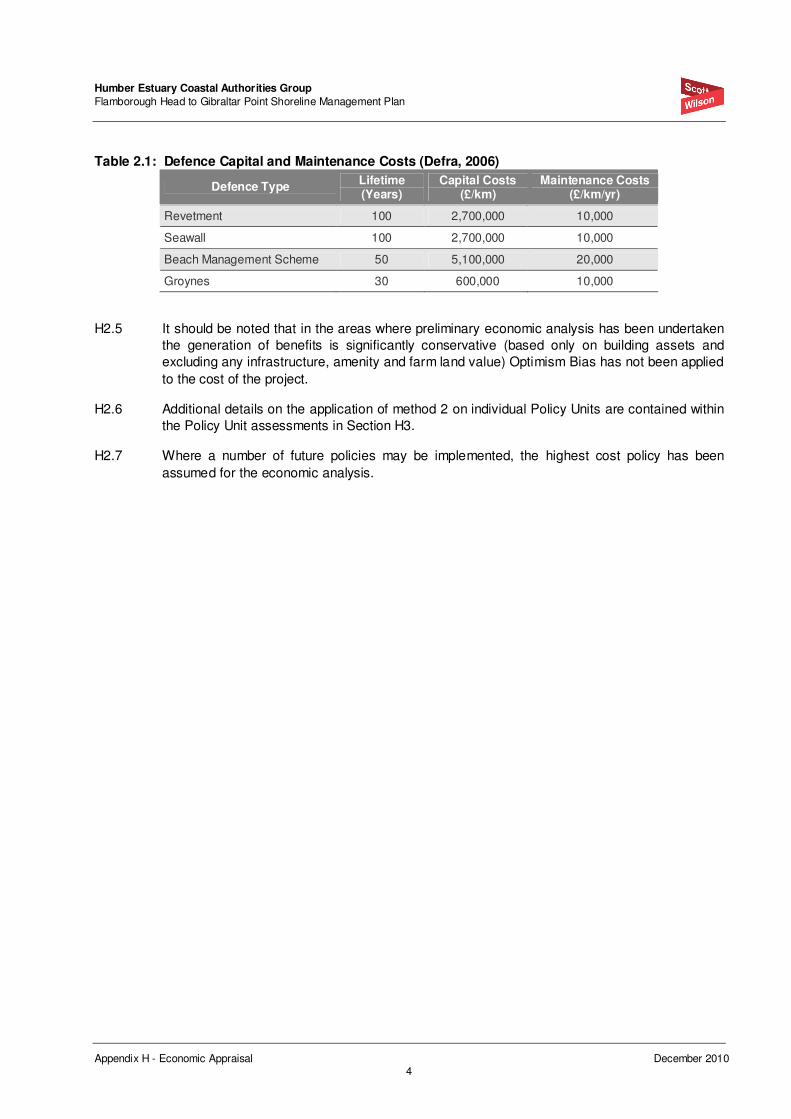
H2.4 For method 2, where required, coastal defence capital and maintenance costs have been built
up using the typical defence costs as outlined in Appendix C of the SMP Guidance (Defra
2006), see Table 2.1 for a summary. Benefits have been generated based on readily
identifiable assets, predominantly residential properties. Property values have been obtained
from the National Properties Dataset, corrected to present day values using appropriate index
values. Where property values are not available, a conservative property value has been
estimated.
Humber Estuary Coastal Authorities Group
Flamborough Head to Gibraltar Point Shoreline Management Plan
Appendix H - Economic Appraisal December 2010 4
Table 2.1: Defence Capital and Maintenance Costs (Defra, 2006)
Defence Type Lifetime (Years)
Capital Costs (£/km)
Maintenance Costs (£/km/yr)
Revetment 100 2,700,000 10,000
Seawall 100 2,700,000 10,000
Beach Management Scheme 50 5,100,000 20,000
Groynes 30 600,000 10,000
H2.5 It should be noted that in the areas where preliminary economic analysis has been undertaken
the generation of benefits is significantly conservative (based only on building assets and
excluding any infrastructure, amenity and farm land value) Optimism Bias has not been applied
to the cost of the project.
H2.6 Additional details on the application of method 2 on individual Policy Units are contained within
the Policy Unit assessments in Section H3.
H2.7 Where a number of future policies may be implemented, the highest cost policy has been
assumed for the economic analysis.

Humber Estuary Coastal Authorities Group
Flamborough Head to Gibraltar Point Shoreline Management Plan
Appendix H - Economic Appraisal December 2010 5
H3 Appraisal
Policy Unit A – Flamborough Head to Sewerby
H3.1 The preferred policy for Policy Unit A is “No Active Intervention” for all epochs (Present to
2105).
H3.2 This policy has no costs associated with its implementation. However, it should be noted that
losses to assets may occur during the lifetime of the SMP.
Policy Unit B – Bridlington to Hilderthorpe
H3.3 The preferred policy for Policy Unit B is “Hold The Line”. For this Policy Unit this also includes
maintaining the current standard of protection over all epochs (Present to 2105).
H3.4 Maintaining the standard of protection over the lifetime of the SMP has both maintenance and
capital costs associated with the implementation of the Policy.
H3.5 The “Review of Bridlington Coastal Defence Strategy Update” (Posford Haskoning, 2005) has
undertaken a review of potential options for protecting Bridlington at Strategy level. A number
of options were assessed to determine the most economic solution for maintaining the
defences over a 100 Year period. The defences focused on in the strategy update covered
approximately 20% of the Bridlington frontage. For the purpose of the SMP it is assumed that
similar cost benefit ratios would be achieved for schemes which extended along the entire
frontage.
H3.6 The economic assessment of the Bridlington frontage was undertaken in two sections; a variety
of options were provided for the Royal Princess Parade (Table 3.1) and an option for the Spa
Promenade (Table 3.2).
Table 3.1: Bridlington Strategy Economics - Royal Princess Parade including works to Harbour Road (Reproduced from Posford Haskoning, 2005)
PV Benefits (£)
Option PV Costs
(£) Tangible Benefits
Intangible Benefits
Total PV Benefits
Benefit Cost Ratio (Tangible Benefits Only)
Benefit Cost Ratio (All Benefits)
Rock Breakwater 1,592,000 3,620,000 19,942,000 23,563,000 2.27 14.80
Reinforced Concrete Toe
939,000 3,620,000 19,942,000 23,563,000 3.86 25.09
Rock Armour Toe 563,000 3,620,000 19,942,000 23,563,000 6.43 41.81
Table 3.2: Bridlington Strategy Economics - Spa Promenade (Reproduced from Posford Haskoning, 2005)
PV Benefits (£)
Option PV Costs
(£) Tangible Benefits
Intangible Benefits
Total PV Benefits
Benefit Cost Ratio (Tangible Benefits Only)
Benefit Cost Ratio (All Benefits)
Concrete Seawall Encasement
596,000 9,432,000 20,053,000 29,485,000 15.82 49.47
H3.7 The Posford Haskoning (2005) Report included an analysis of “Intangible Benefits”. These
benefits are derived from income figures from visitors to the frontage. These figures may not
be typically included in economic analysis as they are considered as “Transfer Payments”.

Humber Estuary Coastal Authorities Group
Flamborough Head to Gibraltar Point Shoreline Management Plan
Appendix H - Economic Appraisal December 2010 6
H3.8 For the SMP economic analysis the two sections (Royal Princess Parade and Spa Promenade)
have been combined to provide a total analysis for the 20% of the frontage covered by the
strategy (Table 3.3).
Table 3.3: Economic analysis for Bridlington
PV Benefits (£)
Option PV Costs
(£) Tangible Benefits
Intangible Benefits
Total PV Benefits
Benefit / Cost Ratio (Tangible Benefits Only)
Benefit / Cost Ratio (All Benefits)
Rock Breakwater + Spa Promenade
2,188,000 13,052,000 39,995,000 53,047,000 5.96 24.24
Reinforced Concrete Toe + Spa Promenade
1,535,000 13,052,000 39,995,000 53,047,000 8.50 34.56
Rock Armour Toe+ Spa Promenade
1,159,000 13,052,000 39,995,000 53,047,000 11.26 46.77
H3.9 The table above shows that the economics for the protection of Bridlington have Benefit / Cost
Ratios in excess of 5 for all options, even when excluding the “Intangible Benefits”.
H3.10 This analysis covers only 20% of the Bridlington frontage. Assuming that no further benefits
were accrued, but defence costs along the frontage were similar (i.e. they were 5 times that
currently included in the analysis), then the Benefit / Cost ratio would remain greater than 1.
H3.11 The benefits of the Preferred Policy clearly outweigh the costs for Policy Unit B.
Policy Unit C – Wilsthorpe to Atwick
H3.12 The preferred policy for Policy Unit C is “No Active Intervention” for all epochs (Present to
2105), with the exception of works to maintain the outfall at Barmston Drain.
H3.13 This policy has no costs associated with its implementation. However, it should be noted that
losses to assets may occur during the lifetime of the SMP.
H3.14 Works to Barmston Drain should be appraised at Project Appraisal Report (PAR) level to
ensure that the proposed options are suitable and economically justified.
Policy Unit D – North Cliff to Hornsea Burton (Hornsea)
H3.15 The preferred policy for Policy Unit D is “Hold The Line”. For this Policy Unit this also includes
maintaining the standard of protection over all epochs (Present to 2105).
H3.16 Maintaining the standard of protection over the lifetime of the SMP has both maintenance and
capital costs associated with the implementation of the Policy.
H3.17 The defences at Hornsea consist of promenade and seawall, with sections of the seawall
protected with rock toe armour. The entire length is also fronted with groynes to stabilise the
beach. Lengths and costs (from Table 2.1) of the defences at Hornsea are summarised in
Table 3.4.

Humber Estuary Coastal Authorities Group
Flamborough Head to Gibraltar Point Shoreline Management Plan
Appendix H - Economic Appraisal December 2010 7
Table 3.4: Hornsea Defence Costs
Defence Type Length
(km) Capital Costs
(£) Maintenance Costs
(£/yr)
Seawall/Promenade 1.6 4,320,000 16,000
Groynes 1.8 1,080,000 18,000
H3.18 Current estimates of the residual life of the defences at Hornsea are greater than 20 years and
therefore failure would only occur during epoch 2 at the earliest. For the economic appraisal
maintenance costs have been included from Year 0 and for all years except where construction
costs are included. Capital construction costs have been included in year 20 for both the
revetment and the groynes, based on the residual life of the current structures; this is a
conservative assumption. Costs for replacing the groynes have also been included in years 50
and 80 owing to the 30 year life of groynes.
H3.19 The Present Value of the “Hold the Line” policy for Hornsea would be £4.2Million. For the
benefits of the policy to outweigh the costs over the 100 Years, benefits would need to total at
least £4.2Million to achieve a Benefit / Cost Ratio of 1.
H3.20 For Hornsea, the residual life of the defences is greater than 20 Years, therefore under a “Do
Nothing” scenario no benefits are accrued in epoch 1. During epoch 2 of the “Do Nothing”
Scenario only 5 residential and 2 commercial properties would be lost. Epoch 3 sees the loss
of approximately 175 residential and 8 commercial properties (this excludes all static
caravans). Benefits for this economic appraisal are based on property losses and exclude an
assessment of infrastructure and amenity losses.
H3.21 Average house prices for Hornsea were estimated at £148,000 (Source: www.zoopla.co.uk,
based on HU18). Commercial properties were conservatively estimated as 1.5 times the value
of residential properties.
H3.22 It should be noted that as the generation of benefits is significantly conservative (based only on
building assets and excluding any infrastructure, amenity and farm land value) Optimism Bias
has not been applied to the cost of the project.
H3.23 FCDPAG3 calculation sheets were used to estimate the Present Value of properties lost due to
erosion. Benefits totalled a cash value of approximately £29Million, however as the majority of
the losses are accrued in epoch 3 the discounted Present Value is £2.7Million.
Table 3.5: Economic Analysis for Hornsea
Option PV Costs
(£) PV Damage
(£) PV Benefits
(£) Benefit / Cost Ratio
“Hold The Line” 4,184,528 - 2,673,585 <1
H3.24 The economic analysis (summarised in Table 3.5) for Hornsea gives a Benefit / Cost ratio of
less than 1, suggesting that the costs of the policy outweigh the benefits, based purely on the
inclusion of properties in the assessment.
H3.25 It should be noted that the assessment of Present Value damages is only based on properties
identified as lost over the three epochs and that no infrastructure or amenity benefits have been
included. Data for Bridlington showed that when amenity benefits were included the Benefit /
Cost ratio increased by a factor of 4 to 5 times.

Humber Estuary Coastal Authorities Group
Flamborough Head to Gibraltar Point Shoreline Management Plan
Appendix H - Economic Appraisal December 2010 8
H3.26 The inclusion of infrastructure benefits would improve the Benefit / Cost ratio further raising the
Benefit / Cost ratio. Allowing for a conservative doubling of the Benefit / Cost ratio for amenity
benefits would easily make the benefits outweigh the costs (Benefit / Cost ratio greater than 1).
Policy Unit E – Rolston to Waxholme
H3.27 The preferred policy for Policy Unit E is “No Active Intervention” for all epochs (Present to
2105), with the exception of the area of existing defences at Mappleton.
H3.28 This policy (in all areas other than Mappleton) has no costs associated with its implementation.
However, it should be noted that losses to assets may occur during the lifetime of the SMP.
H3.29 At Mappleton, the Policy will be “Hold The Line” for epochs 1 and 2 (Present to 2055) and
thereafter will be reviewed and either maintained as “Hold the Line” or will revert to “No Active
Intervention”. As there are no implementation costs associated with the implementation of “No
Active Intervention” policies the economic appraisal has been carried out based on “Hold the
Line” for all epochs (Present to 2105).
H3.30 The defences at Mappleton consist of rock revetments and groynes to stabilise the beach. The
defence length is 0.44km. Using the values from Table 2.1 gives a defence value of
£1,188,000 for the rock revetment and £264,000 for the groynes. Maintenance costs for these
defences would be £8,800 per annum.
H3.31 Current estimates of the residual life of the defences are greater than 20 years and therefore
failure would only occur during epoch 2 at the earliest. For the economic appraisal
maintenance costs have been included at £8,800/yr for from Year 0 and for all years except
where construction costs are included. Capital construction costs have been included in year
30 for both the revetment and the groynes, based on the residual life of the current structures;
this is a conservative assumption. Costs for replacing the groynes have also been included in
years 60 and 90 owing to the 30 year life of groynes.
H3.32 The Present Value Cost of the Hold the Line policy for Mappleton would be £1.1Million. For the
policy to be economically viable, benefits over the 100 Years would need to total at least
£1.1Million to achieve a Benefit / Cost Ratio of 1.
H3.33 For Mappleton the residual life of the defences is greater than 20 Years, therefore no benefits
are accrued in epoch 1 for the “Do Nothing” scenario. During epoch 2 of the “Do Nothing”
scenario only 1 residential and 1 commercial property would be lost. Epoch 3 sees the loss of
approximately 11 residential and 5 commercial/agricultural properties. Benefits for this
economic appraisal are based on property losses and exclude an assessment of infrastructure
and amenity losses.
H3.34 Average house prices for Mappleton were estimated at £148,000 (Source: www.zoopla.co.uk,
based on HU18). Commercial properties were conservatively estimated as 1.5 times the value
of residential properties.
H3.35 It should be noted that as the generation of benefits is significantly conservative (based only on
building assets and excluding any infrastructure, amenity and farm land value) Optimism Bias
has not been applied to the cost of the project.
H3.36 FCDPAG3 calculation sheets were used to estimate the Present Value of properties lost due to
erosion. Benefits totalled a cash value of approximately £3.1Million, however as the majority of
the losses are accrued in epoch 3 the discounted Present Value is £326,000.

Humber Estuary Coastal Authorities Group
Flamborough Head to Gibraltar Point Shoreline Management Plan
Appendix H - Economic Appraisal December 2010 9
Table 3.6: Economic Analysis for Mappleton
Option PV Costs
(£) PV Damage
(£) PV Benefits
(£) Benefit / Cost Ratio
“Hold The Line” 870,614 - 325,947 <1
H3.37 The economic analysis (summarised in Table 3.6) for Mappleton gives a Benefit / Cost ratio of
less than 1. It should be noted that the assessment of Present Value damages is only based
on properties identified as being lost over the three epochs and that no infrastructure or
amenity benefits have been included. However, doubling the benefits would still result in a
Benefit / Cost ratio less than 1 suggesting the economic case is marginal at best and this may
fail to attract Government funding. A detailed strategy study is required to investigate this in
greater detail as recommended in the Action Plan.
Policy Unit F – Owthorne to Hollym (Withernsea)
H3.38 The preferred policy for Policy Unit F is “Hold The Line”. For this Policy Unit this also includes
maintaining the current standard of protection over all epochs (Present to 2105).
H3.39 Maintaining the current standard of protection over the lifetime of the SMP has both
maintenance and capital costs associated with the implementation of the Policy.
H3.40 The “Withernsea Coastal Defence Strategy Study” (Posford Duvivier, 2001) has undertaken a
review of potential options for protecting Withernsea at the Strategy level. A number of options
were assessed to determine the most economic solution for maintaining the defences over a
100 Year period. The strategy covered the entire defended and undefended Withernsea
frontage.
H3.41 The options presented for each section of the frontage were combined to form three preferred
options which were then economically assessed. Table 3.7 shows a summary of the economic
analysis for the three options.
Table 3.7: Withernsea Coastal Defence Economics (Reproduced from Posford Duvivier, 2001)
PV Benefits (£)
Option PV Costs
(£) Tangible Benefits
Intangible Benefits
Total PV Benefits
Benefit / Cost Ratio (Tangible Benefits Only)
Benefit / Cost Ratio (All Benefits)
2P - Timber Groynes
2,373,000 2,611,000 14,407,000 17,018,000 1.10 7.17
2Q – Groynes and Toe Protection
2,136,000 2,611,000 14,407,000 17,018,000 1.22 7.97
2R – Rock Revetment and Groynes
2,644,000 2,611,000 11,042,000 13,653,000 1.00 5.16
H3.42 The Posford Duvivier (2001) Report included an analysis of “Intangible Benefits” (Amenity
Benefits). These benefits are derived from income figures from visitors to the frontage. These
figures may not be typically included in economic analysis as they are considered as “Transfer
Payments”.

Humber Estuary Coastal Authorities Group
Flamborough Head to Gibraltar Point Shoreline Management Plan
Appendix H - Economic Appraisal December 2010 10
H3.43 The table above shows that the economics for the protection of Withernsea is marginal (Benefit
/ Cost ratios just above 1) when considering only “Tangible Benefits” (those attributed to assets
lost due to erosion and flooding). When considering “Intangible Benefits” the Benefit / Cost
ratios are significantly improved owing to the income from Amenity within the area.
H3.44 The benefits of the Preferred Policy clearly outweigh the costs for Policy Unit F.
Policy Unit G – Hollym to Dimlington Cliffs
H3.45 The preferred policy for Policy Unit G is “No Active Intervention” for all epochs (Present to
2105).
H3.46 This policy has no costs associated with its implementation. However, it should be noted that
losses to assets may occur during the lifetime of the SMP.
Policy Unit H – Dimlington and Easington Gas Terminals
H3.47 The preferred policy for Policy Unit H is “No Active Intervention” for all epochs (Present to
2105), with the exception of currently defended areas (at Easington).
H3.48 This policy (in all undefended areas) has no costs associated with its implementation. However,
it should be noted that losses to assets may occur during the lifetime of the SMP.
H3.49 At the currently defended areas the Policy will be “Hold the Line” for epoch 1 (Present to 2025)
and thereafter will be reviewed and either maintained as “Hold the Line” or will revert to “No
Active Intervention” (2025 to 2105). As there are no implementation costs associated with the
implementation of “No Active Intervention” policies the economic appraisal has been carried out
based on “Hold the Line” for all epochs (Present to 2105).
H3.50 The defences at Easington Gas Terminals consist of rock revetments. The defended length of
shoreline is 1.0km. Using the values from Table 2.1 gives a defence capital cost of £2,700,000
and maintenance costs would be £10,000 per annum.
H3.51 Current estimates of the residual life of the defences are greater than 20 years and therefore
failure would only occur during epoch 2 at the earliest. For the economic appraisal
maintenance costs have been included at £10,000/yr for from Year 0 and for all years except
where construction costs are included. Capital construction costs have been included in year
20, based on the residual life of the current structures; this is a conservative assumption.
H3.52 The Present Value Cost of the “Hold the Line” policy for the Easington Gas Terminal defences
would be £1.7Million. For the benefits generated by the policy over the 100 Years would
therefore need to be at least £1.7Million to achieve a Benefit / Cost Ratio of 1.

Humber Estuary Coastal Authorities Group
Flamborough Head to Gibraltar Point Shoreline Management Plan
Appendix H - Economic Appraisal December 2010 11
H3.53 The residual life of the defences at Easington Gas Terminals is greater than 20 Years,
therefore no benefits are accrued in epoch 1 for the “Do Nothing” scenario. During epoch 2 of
the “Do Nothing” scenario some areas of land are lost and these may have short term impacts
on the operation of the Gas Terminals. Under the “Do Nothing” scenario erosion during epoch
3 would be significant enough that it would require some Gas Terminal operations to be halted
or relocated. Associating damages/benefits to this depends on the operation of Easington Gas
Terminals in the future. Currently the Easington Gas Terminals are a significant strategic asset
in the UK Power Infrastructure and the economic benefits are likely to significantly outweigh the
cost of maintaining the current defence line. In the future, further reviews will need to
determine if the Easington Gas Terminals remain as strategic an asset, particularly if gas
production in the North Sea declines over the SMP period.
H3.54 On the basis of the strategic nature of the Easington Gas Terminals and the low Present Value
costs of maintaining the current line of defences the benefits of this policy clearly outweigh the
costs.
Policy Unit I – Easington to Kilnsea
H3.55 The preferred policy for Policy Unit I combines a number of Policy approaches. Existing
defences within the Policy Unit will be managed under a “Hold the Line” policy for all epochs.
Other areas currently undefended will be managed under a “No Active Intervention” policy for
all epochs (Present to 2105).
H3.56 The defences within this unit consist of 2.5km of earth embankment providing flood protection.
Maintaining the existing defences over the lifetime of the SMP has both maintenance and
capital costs associated with the implementation of the Policy. The present value cost of
maintaining the defences over the lifetime of the SMP is estimated as approximately £3.2
Million.
H3.57 The defences along this stretch of coastline provide protection against tidal inundation for the
areas of land behind the Policy Unit I and Policy Unit K, and therefore the economic analysis of
the two Policy Units are linked to some extent. To avoid double counting of benefits the costs
of implementing the Policy Unit I has been combined with the costs of implementing Policy Unit
K and assessed against the benefits accrued for Policy Unit K. The results are presented in
Table 3.8.
Table 3.8: Humber SMP2 Economics (From RPA (2003), amended to include Policy Unit I costs)
Option PV Costs
(£) PV Damage
(£) PV Benefits
(£) Benefit / Cost Ratio
Maintain Low Standard (1 in 10)
30,700,000 13,500,000 266,059,000 8.7
Maintain High Standard (1 in 100)
60,600,000 386,000 279,317,000 4.6
H3.58 The combined economic analysis of Policy Units I and K shows that the benefits of the policy
clearly outweigh the costs. However, given the fact that alternative options are considered,
subject to monitoring in epochs 2 and 3, it is considered prudent to categorise the economic
case for Policy Unit I as more marginal.
H3.59 The Humber Flood Risk Management Strategy (HFRMS) is a live document and further work is
currently being undertaken on the costs. Therefore, this conclusion should be reviewed as the
HFRMS is updated.

Humber Estuary Coastal Authorities Group
Flamborough Head to Gibraltar Point Shoreline Management Plan
Appendix H - Economic Appraisal December 2010 12
Policy Unit J – Kilnsea to Spurn Point
H3.60 The preferred policy for Policy Unit J is “Managed Realignment” for epoch 1 (Present to 2025),
with either “Managed Realignment” or “No Active Intervention” for epochs 2 and 3 (2025 to
2105) depending on the evolution of Spurn.
H3.61 The Managed Realignment for Spurn will require some maintenance cost to ensure that the
infrastructure on the barrier remains operational. However, this maintenance will be required
only to the infrastructure and not to provide additional defences to the barrier.
H3.62 This policy has no costs associated with its implementation. However, it should be noted that
some costs will be associated with maintenance of infrastructure along the barrier during the
lifetime of the SMP.
H3.63 The Humber Flood Risk Management Strategy (HFRMS) is a live document and further work is
currently being undertaken on the costs. Therefore, this conclusion should be reviewed as the
HFRMS is updated.
Policy Unit K – Easington Road to Stone Creek
H3.64 The preferred policy for Policy Unit K is “Hold the Line” for all epochs (Present to 2105),
however, some managed realignment will occur but this will not affect the assets along the
shoreline.
H3.65 Holding the line will require maintenance of the current defences over the lifetime of the SMP
therefore there are costs associated with the implementation of the Policy.
H3.66 The “Humber Shoreline Management Plan – Stage 2: Economic Appraisal” RPA (2003) has
undertaken Benefit / Cost analysis for the Humber Estuary. Management Unit 1: Spurn Head
to Paull, within the Humber SMP covers approximately the same frontage as the Easington
Road to Stone Creek Policy Unit.
H3.67 Two options were assessed against the “Do Nothing” policy in the RPA (2003) Economic
Appraisal. One option held the defence line with a low standard of protection (1 in 10 Year)
and the other with high standard (1 in 100 Year). The economic analysis for both options is
reproduced in Table 3.9.
Table 3.9: Humber SMP2 Economics (Reproduced from RPA, 2003)
Option PV Costs
(£) PV Damage
(£) PV Benefits
(£) Benefit / Cost
Ratio
Benefit / Cost Ratio
(Sensitivity Range)
“Do Nothing” - 279,558,000 - - -
Maintain Low Standard (1 in 10)
27,492,000 13,500,000 266,059,000 9.68 5.66 – 10.67
Maintain High Standard (1 in 100)
57,358,000 386,000 279,317,000 4.87 2.85 – 5.55
H3.68 Sensitivity analysis was undertaken during the economic analysis to ensure that the options
were robust. The final column in Table 3.9 shows the variation in the Benefit / Cost ratio which
shows that all options maintain a Benefit / Cost ratio greater than 1.
Humber Estuary Coastal Authorities Group
Flamborough Head to Gibraltar Point Shoreline Management Plan
Appendix H - Economic Appraisal December 2010 13
H3.69 Both options have Benefit / Cost ratios above 1 and therefore the benefits of a “Hold the Line”
policy clearly outweigh the costs for Policy Unit K.
H3.70 The Humber Flood Risk Management Strategy (HFRMS) is a live document and further work is
currently being undertaken on the costs. Therefore, this conclusion should be reviewed as the
HFRMS is updated.
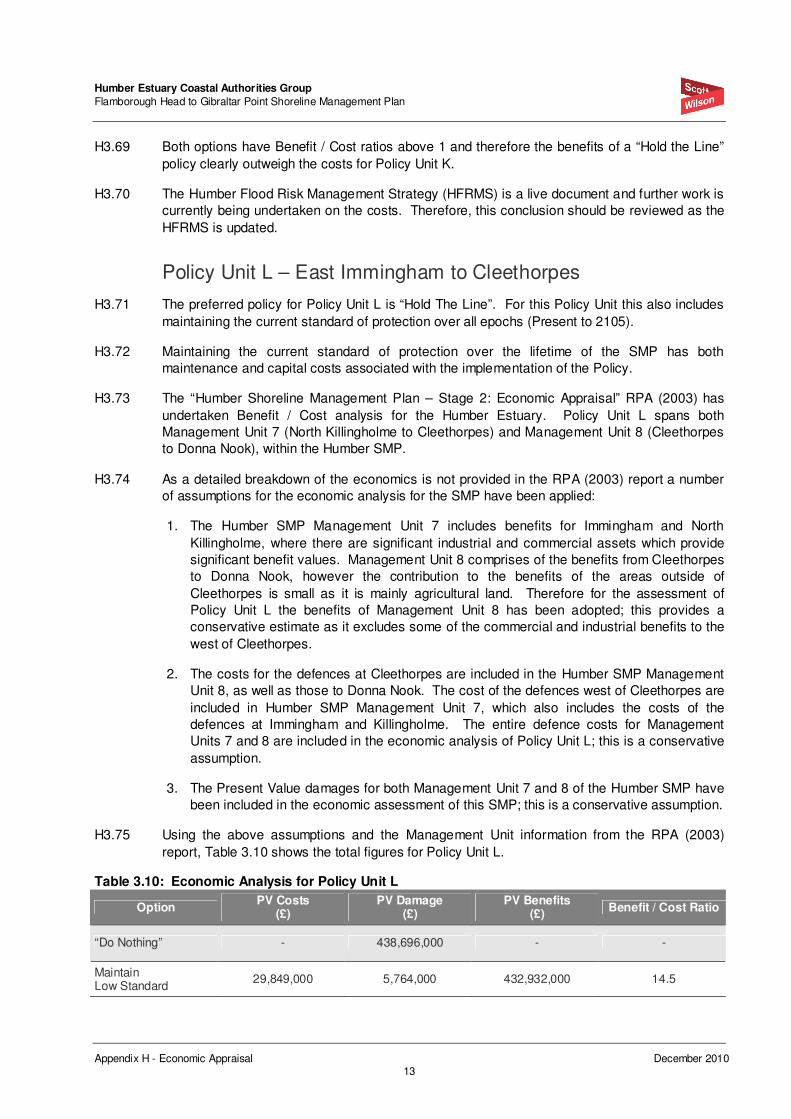
Policy Unit L – East Immingham to Cleethorpes
H3.71 The preferred policy for Policy Unit L is “Hold The Line”. For this Policy Unit this also includes
maintaining the current standard of protection over all epochs (Present to 2105).
H3.72 Maintaining the current standard of protection over the lifetime of the SMP has both
maintenance and capital costs associated with the implementation of the Policy.
H3.73 The “Humber Shoreline Management Plan – Stage 2: Economic Appraisal” RPA (2003) has
undertaken Benefit / Cost analysis for the Humber Estuary. Policy Unit L spans both
Management Unit 7 (North Killingholme to Cleethorpes) and Management Unit 8 (Cleethorpes
to Donna Nook), within the Humber SMP.
H3.74 As a detailed breakdown of the economics is not provided in the RPA (2003) report a number
of assumptions for the economic analysis for the SMP have been applied:
1. The Humber SMP Management Unit 7 includes benefits for Immingham and North
Killingholme, where there are significant industrial and commercial assets which provide
significant benefit values. Management Unit 8 comprises of the benefits from Cleethorpes
to Donna Nook, however the contribution to the benefits of the areas outside of
Cleethorpes is small as it is mainly agricultural land. Therefore for the assessment of
Policy Unit L the benefits of Management Unit 8 has been adopted; this provides a
conservative estimate as it excludes some of the commercial and industrial benefits to the
west of Cleethorpes.
2. The costs for the defences at Cleethorpes are included in the Humber SMP Management
Unit 8, as well as those to Donna Nook. The cost of the defences west of Cleethorpes are
included in Humber SMP Management Unit 7, which also includes the costs of the
defences at Immingham and Killingholme. The entire defence costs for Management
Units 7 and 8 are included in the economic analysis of Policy Unit L; this is a conservative
assumption.
3. The Present Value damages for both Management Unit 7 and 8 of the Humber SMP have
been included in the economic assessment of this SMP; this is a conservative assumption.
H3.75 Using the above assumptions and the Management Unit information from the RPA (2003)
report, Table 3.10 shows the total figures for Policy Unit L.
Table 3.10: Economic Analysis for Policy Unit L
Option PV Costs
(£) PV Damage
(£) PV Benefits
(£) Benefit / Cost Ratio
“Do Nothing” - 438,696,000 - -
Maintain Low Standard
29,849,000 5,764,000 432,932,000 14.5

Humber Estuary Coastal Authorities Group
Flamborough Head to Gibraltar Point Shoreline Management Plan
Appendix H - Economic Appraisal December 2010 14
Maintain High Standard
48,235,000 1,115,000 437,581,000 9.07
H3.76 The economic analysis for Policy Unit L has been undertaken using conservative assumptions
of the benefits and costs. However, the Benefit / Cost ratios still demonstrate that the “Hold the
Line” policy produces benefits that clearly outweigh the costs in Policy Unit L.
H3.77 The Humber Flood Risk Management Strategy (HFRMS) is a live document and further work is
currently being undertaken on the costs. Therefore, this conclusion should be reviewed as the
HFRMS is updated.
Policy Unit M – Humberston Fitties
H3.78 The preferred policy for Policy Unit M combines a number of Policy approaches. Defences at
Humberston Fitties form two lines. The front line defences consist of groynes to stabilise the
beach and sand dunes reinforced by a rock gabion. Within the Chalet Park is the second
defence line consisting of a flood embankment to protect against inundation.
H3.79 During epoch 1 (Present to 2025) the frontline of defences will be maintained but their standard
of protection will not be increased to account for sea level rise. The secondary defence will be
maintained and improved to maintain the current standard of protection. During epochs 2 and
3, the secondary defence will be maintained and the standard of protection will be maintained.
Further policy evaluation will take place to determine the preferred policy for the front line of
defence in epochs 2 and 3.
H3.80 Although the policy for the front line of defence is uncertain in epochs 2 and 3, by inspection
continuing to hold the secondary defence line will continue to produce benefits which clearly
outweigh the costs since this area is part of a large flood cell extending southwards.
H3.81 The Humber Flood Risk Management Strategy (HFRMS) is a live document and further work is
currently being undertaken on the costs. Therefore, this conclusion should be reviewed as the
HFRMS is updated.
Policy Unit N – South of Humberston Fitties to Theddlethorpe St Helen
H3.82 The preferred policy for Policy Unit N is “Hold the Line” over all epochs (Present to 2105).
Maintaining the current standard of defences, over the lifetime of the SMP, has both
maintenance and capital costs associated with the implementation of the Policy.
H3.83 The defences along this shoreline consist mainly of earth embankments to prevent flooding.
The foreshore is reasonably wide in areas and the area at Donna Nook has been accreting.
H3.84 “Hold the Line” policy costs have been based on provision of hard defences along the entire
shoreline as a conservative estimate of maintenance and future construction costs.
H3.85 The shoreline along Policy Unit N is approximately 30km. Therefore, capital construction costs
would be in the order of £81Million with annual maintenance fees of £300,000. Present Value
costs are based on annual maintenance fees of £300,000 from year 0. Capital Construction
costs totalling £81Million have been added in as three £21Million payments in years 20, 30,
and 40.

Humber Estuary Coastal Authorities Group
Flamborough Head to Gibraltar Point Shoreline Management Plan
Appendix H - Economic Appraisal December 2010 15
H3.86 The Present Value Cost of the “Hold the Line” policy for the Policy Unit N would be
£40.8Million. Over the 100 Years the policy would need provide benefits totalling at least
£40.8Million to achieve a Benefit / Cost Ratio of 1.
H3.87 Damages for the “Do Nothing” scenario for this Policy Unit have been based on the flood zones
of each epoch. Using the flood extent, the properties inundated have been identified for the
stretch of land immediately within the boundaries of the Policy Unit – in practice the flood cell is
not compartmentalised and inundation would extend further; this is a conservative assumption.
The total property values have been calculated using the National Property Dataset, where
values are missing they have been supplemented with average house prices per Post Code.
H3.88 As the damages are from flooding rather than erosion the total value of the properties will not
be lost. Therefore, the following conservative assumptions have been applied:
1. In epoch 1, only 15% of the total property asset value is lost due to flooding;
2. In epoch 2, only 25% of the total property asset value is lost due to flooding;
3. In epoch 3, only 40% of the total property asset value is lost due to flooding.
H3.89 FCDPAG3 sheets have been used to discount the future damages to a Present Value.
Conservatively only one incident of damage, using the above assumptions on the percentage
of asset value lost, has been applied per epoch. The analysis has not taken into account
property values written off due to frequent inundation, nor has it accounted for any benefits
from Infrastructure or Agricultural Land; these are highly conservative assumptions.
H3.90 It should be noted that as the generation of benefits is significantly conservative (based only on
building assets and excluding any infrastructure, amenity and farm land value) Optimism Bias
has not been applied to the cost of the project.
Table 3.11: Economic Analysis for Policy Unit N
Option PV Costs
(£) PV Damage
(£) PV Benefits
(£) Benefit / Cost Ratio
“Hold the Line” 40,806,255 - 88,843,364 >1
H3.91 Despite the conservative assumptions relating to the cost of implementing the Policy and the
generation of “Do Nothing” damages the preferred policy has a Benefit / Cost ratio greater than
1. This demonstrates that the benefits of a “Hold the Line” policy clearly outweigh the costs for
Policy Unit N.
H3.92 The stretch of shoreline south of Humberston Fitties to Saltfleet is covered under the Humber
Flood Risk Strategy (HFRMS). This is a live document and further work is currently being
undertaken on the costs. Therefore, this conclusion should be reviewed as the HFRMS is
updated.
Policy Unit O – Viking Gas Terminal (Mablethorpe) to southern end of Skegness
H3.93 The preferred policy for Policy Unit O is “Hold the Line” over all epochs (Present to 2105),
including maintaining the standard of defence. In epoch 3 some localised “Managed
Realignment” will also be implemented. Maintaining the defences, over the lifetime of the SMP,
has both maintenance and capital costs associated with the implementation of the Policy.

Humber Estuary Coastal Authorities Group
Flamborough Head to Gibraltar Point Shoreline Management Plan
Appendix H - Economic Appraisal December 2010 16
H3.94 This section of shoreline is maintained as part of the Lincshore scheme with the beaches
managed through a programme of renourishment. The economic assessment of the Lincshore
scheme was reviewed and updated in 2008 to ensure that the benefits will continue to outweigh
the costs, and is presented in Table 3.12.
Table 3.12: Lincshore Benefit / Cost Analysis
Option PV Costs
(£) PV Damage
(£) PV Benefits
(£) Benefit / Cost Ratio
Lincshore Scheme 227,334,000 109,010,000 1,879,233,000 8.3
H3.95 The economic analysis of the Lincshore Scheme demonstrates that the “Hold the Line” policy
produces benefits which clearly outweigh the costs for Policy Unit N.
Policy Unit P – Seacroft to Gibraltar Point
H3.96 The preferred policy for Policy Unit P is “Hold the Line” over all epochs (Present to 2105) and
maintaining the current standard of protection of the defences. Maintaining the defences, over
the lifetime of the SMP, has both maintenance and capital costs associated with the
implementation of the Policy.
H3.97 Currently this shoreline consists of beaches and dunes protecting against flooding. “Hold the
Line” policy costs have been based on provision of hard defences along the entire shoreline as
a conservative estimate of maintenance and future construction costs.
H3.98 The shoreline along Policy Unit P is approximately 4.7km. Capital construction costs would be
in the order £9.9Million with annual maintenance fees of £47,000. Present Value costs, with
construction in year 20 and annual maintenance thereafter, are £5.8Million. For the policy to
be economically viable, benefits over the 100 Years would need to total at least £5.8Million to
achieve a Benefit / Cost Ratio greater than 1.
H3.99 Damages for the “Do Nothing” scenario for this Policy Unit have been based on the flood zones
of each epoch. Using the flood extent, the properties inundated have been identified for the
stretch of land immediately within the boundaries of the Policy Unit – in practice the flood cell is
not compartmentalised and inundation would extend further; this is a conservative assumption.
The total property values have been calculated using the National Property Dataset, where
values are missing they have been supplemented with average house prices per Post Code.
H3.100 As the damages are from flooding rather than erosion the total value of the properties will not
be lost. Therefore, the following conservative assumptions have been applied:
1. In epoch 1, only 15% of the total property asset value is lost due to flooding;
2. In epoch 2, only 25% of the total property asset value is lost due to flooding;
3. In epoch 3, only 40% of the total property asset value is lost due to flooding.
H3.101 FCDPAG3 sheets have been used to discount the future damages to a Present Value.
Conservatively only one incident of damage, using the above assumptions on the percentage
of asset value lost, has been applied per epoch. The analysis has not taken into account
property values written off due to frequent inundation, nor has it accounted for any benefits
from infrastructure or agricultural land; these are conservative assumptions.

Humber Estuary Coastal Authorities Group
Flamborough Head to Gibraltar Point Shoreline Management Plan
Appendix H - Economic Appraisal December 2010 17
H3.102 It should be noted that as the generation of benefits is significantly conservative (based only on
building assets and excluding any infrastructure, amenity and farm land value) Optimism Bias
has not been applied to the cost of the project.
Table 3.13: Economic Analysis for Policy Unit P
Option PV Costs
(£) PV Damage
(£) PV Benefits
(£) Benefit / Cost Ratio
“Hold the Line” 7,180,685 - 11,827,049 >1
H3.103 Despite the conservative assumptions relating to the Cost of implementing the Policy and the
generation of “Do Nothing” damages the preferred policy has a Benefit / Cost ratio greater than
1. This demonstrates that the “Hold the Line” policy produces benefits which clearly outweigh
the costs for Policy Unit P.
Humber Estuary Coastal Authorities Group
Flamborough Head to Gibraltar Point Shoreline Management Plan
Appendix H - Economic Appraisal December 2010 18
H4 Summary
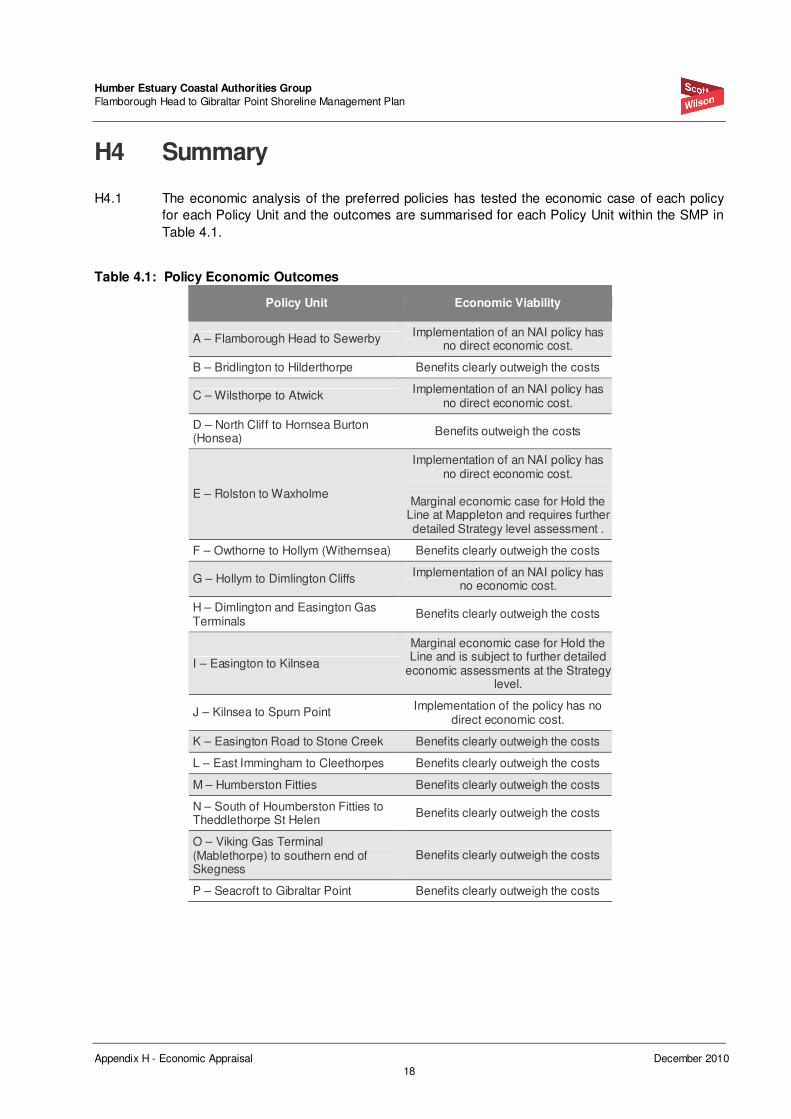
H4.1 The economic analysis of the preferred policies has tested the economic case of each policy
for each Policy Unit and the outcomes are summarised for each Policy Unit within the SMP in
Table 4.1.
Table 4.1: Policy Economic Outcomes
Policy Unit Economic Viability
A – Flamborough Head to Sewerby Implementation of an NAI policy has
no direct economic cost.
B – Bridlington to Hilderthorpe Benefits clearly outweigh the costs
C – Wilsthorpe to Atwick Implementation of an NAI policy has
no direct economic cost.
D – North Cliff to Hornsea Burton (Honsea)
Benefits outweigh the costs
E – Rolston to Waxholme
Implementation of an NAI policy has no direct economic cost.
Marginal economic case for Hold the
Line at Mappleton and requires further detailed Strategy level assessment .
F – Owthorne to Hollym (Withernsea) Benefits clearly outweigh the costs
G – Hollym to Dimlington Cliffs Implementation of an NAI policy has
no economic cost.
H – Dimlington and Easington Gas Terminals
Benefits clearly outweigh the costs
I – Easington to Kilnsea
Marginal economic case for Hold the Line and is subject to further detailed
economic assessments at the Strategy level.
J – Kilnsea to Spurn Point Implementation of the policy has no
direct economic cost.
K – Easington Road to Stone Creek Benefits clearly outweigh the costs
L – East Immingham to Cleethorpes Benefits clearly outweigh the costs
M – Humberston Fitties Benefits clearly outweigh the costs
N – South of Houmberston Fitties to Theddlethorpe St Helen
Benefits clearly outweigh the costs
O – Viking Gas Terminal (Mablethorpe) to southern end of Skegness
Benefits clearly outweigh the costs
P – Seacroft to Gibraltar Point Benefits clearly outweigh the costs
Humber Estuary Coastal Authorities Group
Flamborough Head to Gibraltar Point Shoreline Management Plan
Appendix H - Economic Appraisal December 2010 19
H5 References
Defra, 2006. Shoreline Management Plan Guidance Volume 2: Procedures. London: Department for
Environment, Food and Rural Affairs. Defra, 2003. Flood and Coastal Defence Project Appraisal Guidance. London: Department for
Environment, Food and Rural Affairs. Lincshore Performance Review, 2008. Update of Economic Appraisal from Q1 2003 to Q1 2008. Posford Duvivier, 2001. Withernsea Coastal Defence Strategy Study. Final Report, Dec 2001. Posford Haskoning, 2005. Bridlington Coastal Defence Strategy Study Update. Draft Report, Apr 2005. RPA, 2003. Humber Estuary Shoreline Management Plan – Stage 2: Economic Appraisal. Final Report,
Nov 2003.