sediment management in the humber estuary: dredging …€¦ · sediment management in the humber...
TRANSCRIPT
Sediment Management in the Humber Estuary: Dredging and Disposal Strategies – Study in the framework of the Interreg IVB project TIDE
March 2013
Authors: J. Lonsdale1, S. Manson
2, T. Jeynes
1
1. Associated British Ports: Humber 2. Environment Agency

2
Disclaimer
The authors are solely responsible for the content of this report. Material included herein does not
represent the opinion of the European Community, and the European Community is not responsible
for any use that might be made of it.
Project Management: Susan Manson
Environment Agency, UK
http://www.environment-agency.gov.uk
in co-operation with:
Jemma Lonsdale and Tom Jeynes
Associated British Ports (Humber)
http://www.abports.co.uk
Citation:
Lonsdale, J. Manson, S. & T. Jeynes (2013): ‘Sediment Management in the Humber Estuary:
Dredging and Disposal Strategies – Study in the framework of the Interreg IVB project TIDE. 58
pages. Hull.
aASSOCIATED BRITISH PORTS
HUMBER PORTS

3
Table of contents
Table of contents ..................................................................................................................................... 3
List of figures ........................................................................................................................................... 4
List of tables ............................................................................................................................................ 4
1 Overview on the estuary and its ports ............................................................................................ 5
2 Traffic ............................................................................................................................................... 7
3 Shipping channels .......................................................................................................................... 10
4 General aspects of dredging and disposal ..................................................................................... 11
4.1 Quantities of dredged material ............................................................................................. 11
4.1.1 Dredging sites and sediment quality in the Port of the Humber Estuary ..................... 11
4.2 Placement sites ..................................................................................................................... 33
4.2.1 Relocation within the aquatic environment .................................................................. 33
4.2.2 Deposition of sediments at the North Sea .................................................................... 39
4.3 Land Treatment of Sediments ............................................................................................... 39
5 Strategies for dredging .................................................................................................................. 40
5.1 General aspects ..................................................................................................................... 40
5.2 Capital dredging of fairways .................................................................................................. 41
5.3 Maintenance dredging of fairways ........................................................................................ 42
5.4 Maintenance dredging of harbours (open) ........................................................................... 42
5.5 Placement in open water ...................................................................................................... 42
5.6 Land treatments, Confined disposal facility (CDF), alternative utilization ............................ 44
6 References ..................................................................................................................................... 45
Annex ..................................................................................................................................................... 46

4
List of figures
Figure 1.1: Location of the ports, disposal sites and zones of the Humber Estuary (HES, 2012). .......... 5
Figure 2.1: The volume of cargo that has come through the Humber from 1965 until 2010 (thousand
tonnes) based on port. .................................................................................................................. 7
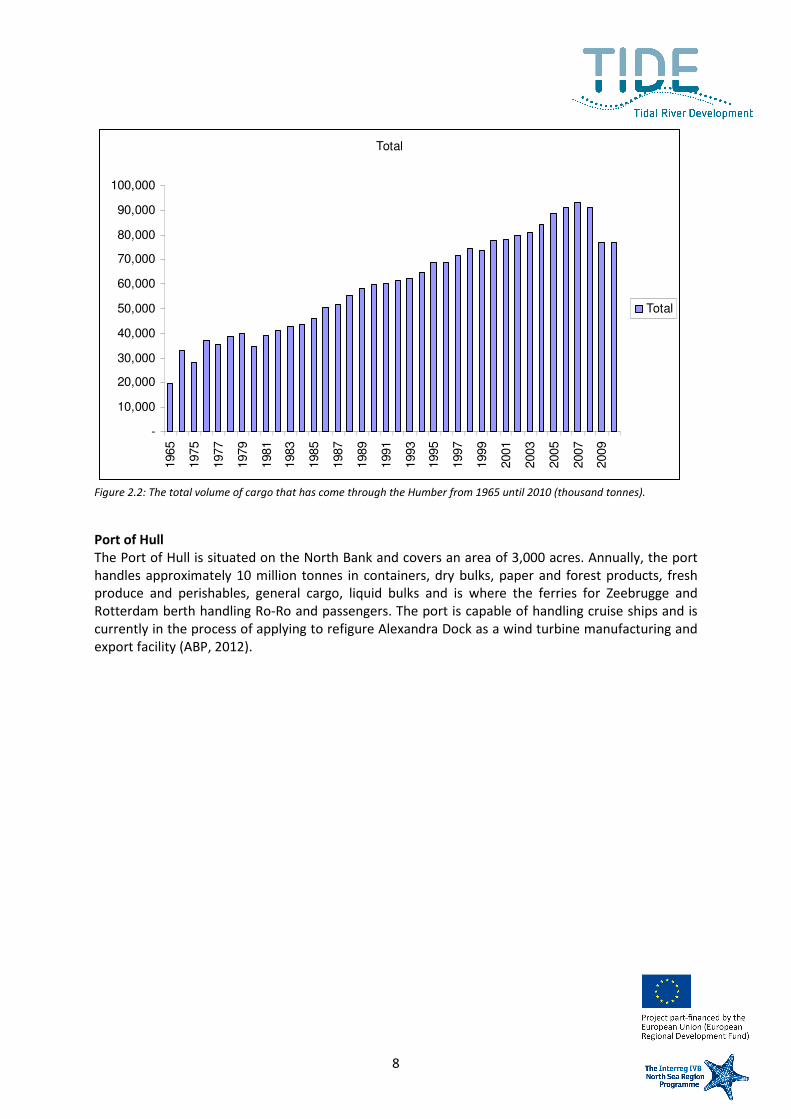
Figure 2.2: The total volume of cargo that has come through the Humber from 1965 until 2010
(thousand tonnes). ........................................................................................................................ 8
Figure 4.1: Total dredge volumes for the Humber between 2004-2010 .............................................. 11
Figure 4.2: The dredge volumes per estuary zone for 2004-2010. ....................................................... 12
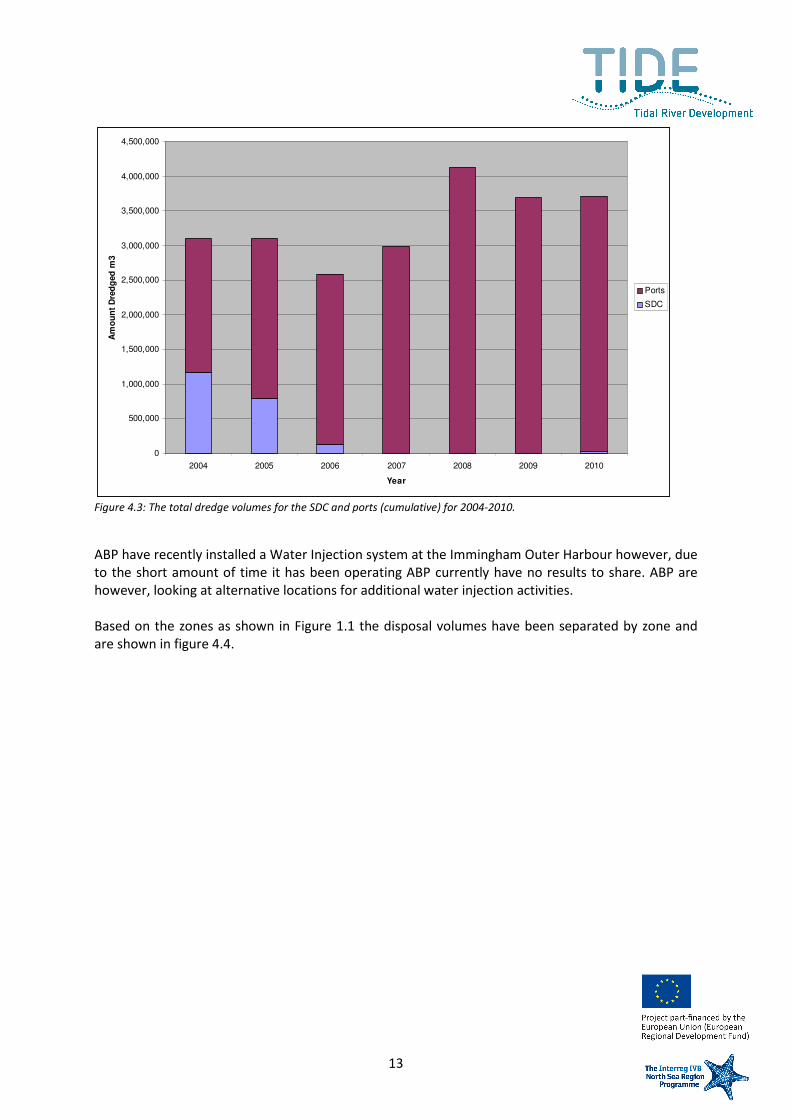
Figure 4.3: The total dredge volumes for the SDC and ports (cumulative) for 2004-2010. .................. 13
Figure 4.4: The disposal volumes per estuary zone between 1986-2010. ............................................ 14
Figure 4.5: ABP Maintenance Dredging Volumes for the SDC (2004 to 2010) ..................................... 16
Figure 4.6: ABP Maintenance Dredging Volumes for Grimsby Docks (2004 to 2010) .......................... 19
Figure 4.7: ABP Maintenance Dredging Volumes for Immingham Docks and Waterfront Berths (2004
to 2010) ....................................................................................................................................... 21
Figure 4.8: ABP Maintenance Dredging Volumes for the Saltend Jetty (2004 to 2010) ....................... 23
Figure 4.9: ABP Maintenance Dredging Volumes for Hull Docks and Waterfront Berths (2004 to 2010)
..................................................................................................................................................... 26
Figure 4.10: ABP Maintenance Dredging Volumes for Goole Docks (2004 to 2010) ............................ 28
List of tables
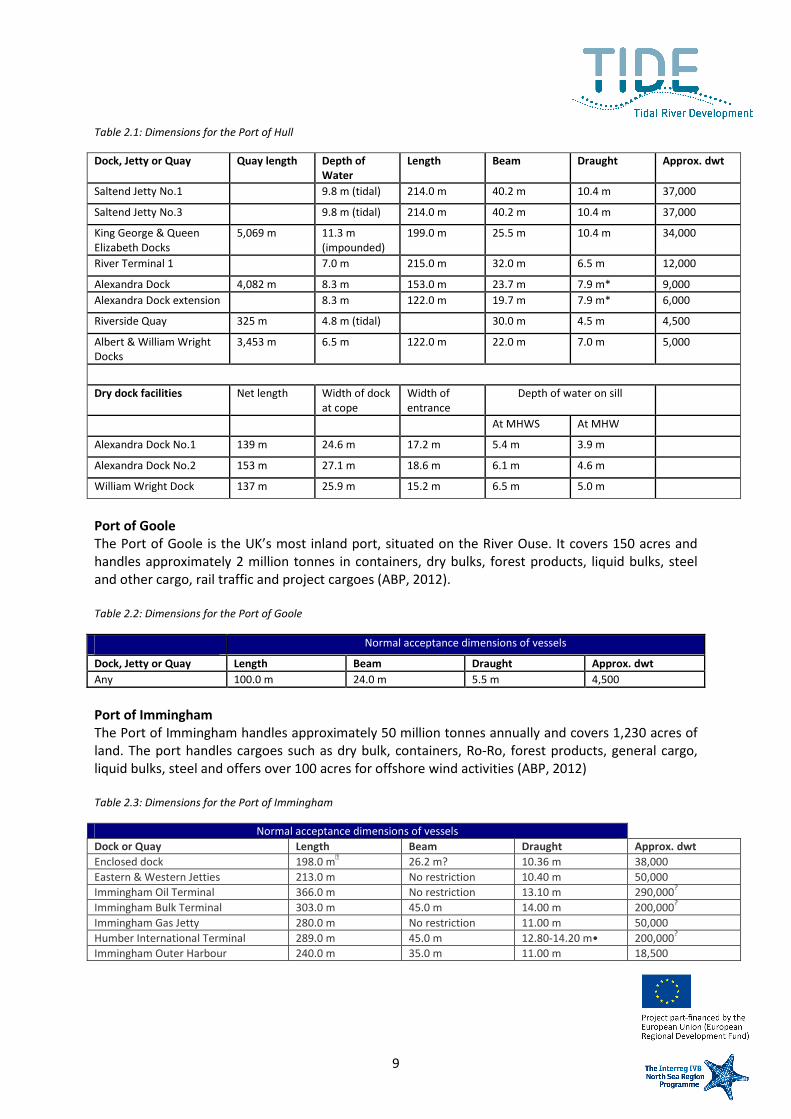
Table 2.1: Dimensions for the Port of Hull .............................................................................................. 9
Table 2.2: Dimensions for the Port of Goole ........................................................................................... 9
Table 2.3: Dimensions for the Port of Immingham ................................................................................. 9
Table 2.4: Dimensions for the Port of Grimsby ..................................................................................... 10
Table 4.1: Dredge material volume (m³) handled by UKD from 2004 to 2010 for ABP operations only
..................................................................................................................................................... 15
Table 4.2: Maintenance dredging volumes (m³) for Grimsby Fish Docks (No.1 and 3) and the external
entrance channel ........................................................................................................................ 29
Table 4.3: Maintenance dredging volumes (m³) for the Immingham Bulk Terminal ............................ 29
Table 4.4: Maintenance dredging volumes (m³) for the Humber Sea Terminal ................................... 30
Table 4.5: Sea disposal sites within the study area ............................................................................... 34
Table 4.6: Summary of DAS records for maintenance dredging returns at relevant Humber disposal
sites (wet tonnes) ........................................................................................................................ 37

5
1 Overview on the estuary and its ports
The Humber is one of the largest estuaries in the UK, measuring some 280km². It is approximately
6.5km wide at its entrance, opening to 9.5km wide immediately past its entrance at Spurn Point, with
its upper reaches (some 48km upriver) at 2.5km wide. Major tributaries include the Trent, Ouse, Don
and Aire (National Rivers Authority, 1991). The Estuary has a number of significant conurbations
including on the north bank Kingston-upon-Hull, Hessle and North Ferriby; and on the south bank
Cleethorpes, Barton-upon-Humber, Grimsby, Immingham, plus North and South Killingholme, see
Figure 1.1 for locations.
Figure 1.1: Location of the ports, disposal sites and zones of the Humber Estuary (HES, 2012).
The Humber Estuary is one of the busiest waterways in the United Kingdom, with around 29,500
commercial shipping movements in 2010, bound for 27 principal dock, jetty and river locations
(including anchorages). The vast majority of the Humber Estuary is open water, buoys and light
floats mark the main navigational channels. The channel chosen by vessels and the track followed
will vary from tide to tide, depending on the tidal height and draught of the transiting vessel.
The major Humber ports of Hull, Goole and Grimsby, and Immingham account for 86% of all shipping
tonnage. These ports handled 9.8 million tonnes, 1.6 million tonnes and 54.7 million tonnes of cargo
respectively in 2009 (Department for Transport (DfT, 2011)). The principal commercial dock
operations of Hull, Goole, Grimsby and Immingham are owned, managed and operated by Associated
British Ports (ABP). In addition to these dock and jetty facilities, a number of other facilities are
offered at terminals such as Salt End Jetties (owned by ABP), Immingham Oil Terminal (owned by
ABP), North and South Killingholme, New Holland, Humber Sea Terminal and various smaller wharf
operators above the Humber Bridge in the Upper Humber and the River Trent.

6
In addition to commercial activity, the Estuary is also used by recreational clubs and individuals for
leisure activities. A large proportion of recreational vessel movements are composed of vessels
transiting between the network of rivers and canals connecting the Humber with inland waterways.
Larger marina facilities exist at Grimsby, Hull and Goole, with smaller moorings available in creeks
around the Estuary.
Maintaining safe port access for commercial and recreational maritime transport is an important
function for Harbour Authorities. This necessitates the maintenance dredging of access channels and
berth pockets to remove recently deposited sediment. Most of the dredging occurs in the lower and
middle estuary (down estuary of the Humber Bridge) to maintain access to berth pockets and
enclosed dock systems. In addition to the port facilities, the Sunk Dredged Channel provides access
for larger vessels using the Humber Ports. The Channel was created in 1969 and has required regular
dredging to maintain its depth against ongoing siltation events.

7
2 Traffic
The Humber is one of the busiest and fastest-growing trading areas in Europe. Almost one quarter of
the UK's seaborne trade passes through the Humber; this includes 25 per cent of the country's
natural gas and 25 per cent of its refined petroleum products. Consequently, the Humber is a vital
component of the country's wellbeing and is a major contributor to the UK's economy.
The Humber Ports owned by ABP are the Ports of Hull on the North Bank of the estuary; Grimsby and
Immingham on the south bank and the Port of Goole located on the River Ouse (see Figure 1.1).
Together they handle 60 million tonnes of cargo a year and 20,000 ship movements.
Figure 2.1: The volume of cargo that has come through the Humber from 1965 until 2010 (thousand tonnes) based on port.
-
10,000
20,000
30,000
40,000
50,000
60,000
70,000
1965
1975
1977
1979
1981
1983
1985
1987
1989
1991
1993
1995
1997
1999
2001
2003
2005
2007
2009
Grimsby and Immingham Goole Hull River Ouse River Trent Rivers Hull and Humber
8
Figure 2.2: The total volume of cargo that has come through the Humber from 1965 until 2010 (thousand tonnes).
Port of Hull
The Port of Hull is situated on the North Bank and covers an area of 3,000 acres. Annually, the port
handles approximately 10 million tonnes in containers, dry bulks, paper and forest products, fresh
produce and perishables, general cargo, liquid bulks and is where the ferries for Zeebrugge and
Rotterdam berth handling Ro-Ro and passengers. The port is capable of handling cruise ships and is
currently in the process of applying to refigure Alexandra Dock as a wind turbine manufacturing and
export facility (ABP, 2012).
Total
-
10,000
20,000
30,000
40,000
50,000
60,000
70,000
80,000
90,000
100,000
1965
1975
1977
1979
1981
1983
1985
1987
1989
1991
1993
1995
1997
1999
2001
2003
2005
2007
2009
Total
9
Table 2.1: Dimensions for the Port of Hull
Dock, Jetty or Quay Quay length Depth of
Water Length Beam Draught Approx. dwt
Saltend Jetty No.1 9.8 m (tidal) 214.0 m 40.2 m 10.4 m 37,000
Saltend Jetty No.3 9.8 m (tidal) 214.0 m 40.2 m 10.4 m 37,000
King George & Queen
Elizabeth Docks 5,069 m 11.3 m
(impounded) 199.0 m 25.5 m 10.4 m 34,000
River Terminal 1 7.0 m 215.0 m 32.0 m 6.5 m 12,000
Alexandra Dock 4,082 m 8.3 m 153.0 m 23.7 m 7.9 m* 9,000 Alexandra Dock extension 8.3 m 122.0 m 19.7 m 7.9 m* 6,000
Riverside Quay 325 m 4.8 m (tidal) 30.0 m 4.5 m 4,500
Albert & William Wright
Docks 3,453 m 6.5 m 122.0 m 22.0 m 7.0 m 5,000
Dry dock facilities Net length Width of dock
at cope Width of
entrance Depth of water on sill
At MHWS At MHW Alexandra Dock No.1 139 m 24.6 m 17.2 m 5.4 m 3.9 m Alexandra Dock No.2 153 m 27.1 m 18.6 m 6.1 m 4.6 m William Wright Dock 137 m 25.9 m 15.2 m 6.5 m 5.0 m
Port of Goole
The Port of Goole is the UK’s most inland port, situated on the River Ouse. It covers 150 acres and
handles approximately 2 million tonnes in containers, dry bulks, forest products, liquid bulks, steel
and other cargo, rail traffic and project cargoes (ABP, 2012).
Table 2.2: Dimensions for the Port of Goole
Normal acceptance dimensions of vessels
Dock, Jetty or Quay Length Beam Draught Approx. dwt Any 100.0 m 24.0 m 5.5 m 4,500
Port of Immingham
The Port of Immingham handles approximately 50 million tonnes annually and covers 1,230 acres of
land. The port handles cargoes such as dry bulk, containers, Ro-Ro, forest products, general cargo,
liquid bulks, steel and offers over 100 acres for offshore wind activities (ABP, 2012)
Table 2.3: Dimensions for the Port of Immingham
Normal acceptance dimensions of vessels Dock or Quay Length Beam Draught Approx. dwt Enclosed dock 198.0 m
♦ 26.2 m? 10.36 m 38,000 Eastern & Western Jetties 213.0 m No restriction 10.40 m 50,000 Immingham Oil Terminal 366.0 m No restriction 13.10 m 290,000
? Immingham Bulk Terminal 303.0 m 45.0 m 14.00 m 200,000
? Immingham Gas Jetty 280.0 m No restriction 11.00 m 50,000 Humber International Terminal 289.0 m 45.0 m 12.80-14.20 m• 200,000
? Immingham Outer Harbour 240.0 m 35.0 m 11.00 m 18,500

10
Port of Grimsby
The Port of Grimsby is the most easterly ABP port on the Humber Estuary and covers 550 acres of
land. The port handles Ro-Ro cargo (cars), fresh produce and perishables (fish), dry bulks, forest
products, general cargo, minerals and ores, steel and other metals and is home to an established
centre of excellence for operations and maintenance activities for wind farms in the North Sea (ABP,
2012).
Table 2.4: Dimensions for the Port of Grimsby
Normal acceptance dimensions of vessels Dock, Jetty or Quay Length Beam Draught Approx. dwt Commercial Docks 145.0 m* 20.5 m 5.8 m 6,000 Fish Docks 73.0 m 12.8 m 5.8 m
3 Shipping channels
The Sunk Dredged Channel is the deep water channel through the outer Humber that allows access
to the ports. It is maintained at a depth of 8.8m below Chart Datum. Further information on this is
provided in Table 5 and Figure 1 (both Annex).

11
4 General aspects of dredging and disposalQuantities of dredged
material
4.1.1 Dredging sites and sediment quality in the Port of the Humber Estuary
The Harbour Authorities within the Humber Estuary and tidal Rivers of Trent and Ouse have a
statutory duty to maintain advertised depths of water in navigable channels, along riverside berths
and within enclosed docks. This is achieved through regular, carefully planned maintenance dredge
campaigns and additional capital dredge campaigns when required. The following sections describe
historic and current known dredge activities, outlining dredge quantities, dredge techniques and
identifying open, closed and disused dredge disposal sites. In addition to dredging carried out by
established Harbour Authorities, it is known that circa 12 other organisations carry out, or have
carried out maintenance dredging within the last 10 years. Where information on dredge methods,
volumes and times are known, this has been included.
The total volume of maintenance dredging which has taken place by ABP per year between 2004 and
2010 ranges from 2,588,524 to 4,133,536m³; the equivalent of approximately 3,365,100 to 5,373,600
wet tonnes (Table 4.1). Specific details relating to dredge locations, quantities and dredge
methodology are provided within this Section (4.3.1).
Figure 4.1: Total dredge volumes for the Humber between 2004-2010
1. Dredging volumes per estuary zone (+/- TIDE zones) (graph)
Based on the zones as shown in figure 1.1 the dredging volumes have been separated by zone and
are shown in figure 4.2.
Total Dredged Material (ABP)
0
500,000
1,000,000
1,500,000
2,000,000
2,500,000
3,000,000
3,500,000
4,000,000
4,500,000
2004 2005 2006 2007 2008 2009 2010
Year
To
tal
dre
dg
ed
mate
rial
m3

12
Figure 4.2: The dredge volumes per estuary zone for 2004-2010.
The Grimsby Ro-Ro project is currently still under construction and therefore no accurate dredge
volume can be ascertained.
There has been no sand winning during the study period.
In the context of the Humber Estuary, the only “fairway” that ABP maintain is the SDC. Therefore
Figure 4.3 shows the relevant dredge volumes.
0
500,000
1,000,000
1,500,000
2,000,000
2,500,000
3,000,000
3,500,000
4,000,000
4,500,000
2004 2005 2006 2007 2008 2009 2010
Year
Dre
dg
ed
Vo
lum
e m
3
Outer
Middle
Upper
Inner
13
Figure 4.3: The total dredge volumes for the SDC and ports (cumulative) for 2004-2010.
ABP have recently installed a Water Injection system at the Immingham Outer Harbour however, due
to the short amount of time it has been operating ABP currently have no results to share. ABP are
however, looking at alternative locations for additional water injection activities.
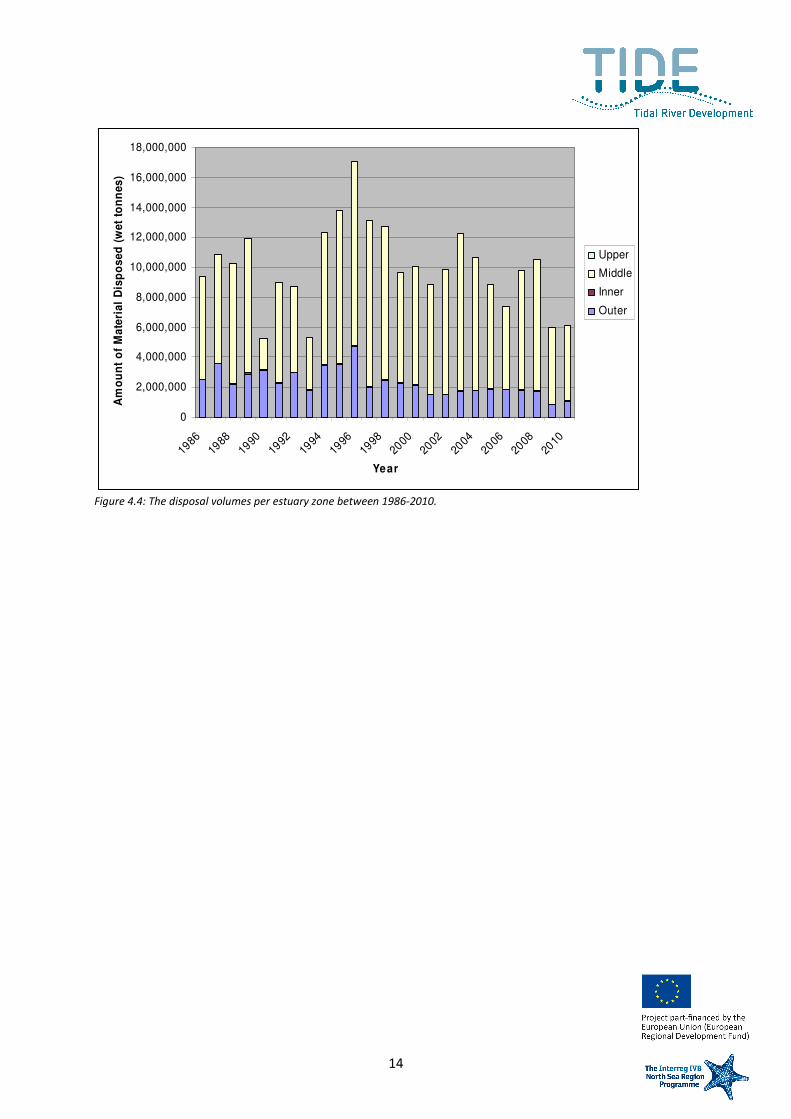
Based on the zones as shown in Figure 1.1 the disposal volumes have been separated by zone and
are shown in figure 4.4.
0
500,000
1,000,000
1,500,000
2,000,000
2,500,000
3,000,000
3,500,000
4,000,000
4,500,000
2004 2005 2006 2007 2008 2009 2010
Year
Am
ou
nt
Dre
dg
ed
m3
Ports
SDC
14
Figure 4.4: The disposal volumes per estuary zone between 1986-2010.
0
2,000,000
4,000,000
6,000,000
8,000,000
10,000,000
12,000,000
14,000,000
16,000,000
18,000,000
1986
1988
1990
1992
1994
1996
1998
2000
2002
2004
2006
2008
2010
Year
Am
ou
nt
of
Ma
teri
al
Dis
po
se
d (
we
t to
nn
es
)
Upper
Middle
Inner
Outer

15
Table 4.1: Dredge material volume (m³) handled by UKD from 2004 to 2010 for ABP operations only
Location 2004 2005 2006 2007 2008 2009 2010 2011
Sunk Dredged Channel
Sunk Dredged Channel 1,172,718 791,829 124,467 0 0 0 23,489
Grimsby Docks
Grimsby Entrances 0 0 0 7,294 104,885 109,167 186,561
Grimsby No.2 Fish Dock & Marina 0 0 0 36,198 17,381 6,828 12,324
Grimsby Alexandra Dock 46,772 3,345 13,964 21,357 2,276 10,098 25,491
Grimsby Royal Basin 97,975 36,309 14,778 35,300 14,760 5,997 946
Grimsby Royal Dock 63,158 165,188 119,232 114,218 106,354 111,615 73,570
Immingham Docks and Waterfront Berths
Humber International Terminal 130,162 290,098 392,802 370,222 537,686 339,683 284,900
Immingham Bellmouth (inc East Jetty) 207,634 215,962 110,038 184,249 260,609 187,288 184,401
Immingham Dock 298,191 260,692 229,980 148,660 257,418 196,994 146,032
Immingham Gas Terminal 31,780 84,475 51,138 54,276 85,207 40,654 32,061
Immingham West Jetty Ext 278,614 479,710 41,893 65,933 87,433 24,495 63,011
Immingham Outer Harbour 0 0 724,488 1,344,167 2,076,000 2,014,179 1,948,11
7
South Killingholme Oil Jetty 0 0 0 0 0 13,784 10,315
Saltend Jetty Saltend Jetty 40,026 155,983 234,517 164,090 62,326 38,168 177,054
Hull Docks and Waterfront Berths
King George Dock 155,051 196,348 189,922 140,295 137,854 129,666 85,094
King George Dock Entrance 159,416 113,885 68,171 139,347 199,257 247,616 221,519
Queen Elizabeth (QE) Docks 0 0 0 1,115 0 0 0
Albert Dock Entrance 47,730 16,725 23,300 4,255 2,230 9,435 19,480
Albert Dock 128,540 101,894 78,202 33,277 52,530 26,238 9,757
William Wright Dock 0 0 0 0 0 0 0
Alexandra Dock Entrance 70,512 42,755 49,141 14,909 2,292 80,676 84,780
Alexandra Dock 153,478 113,306 100,491 84,177 69,469 19,398 47,365
River Terminal 1 0 0 0 12,346 53,314 69,048 74,266
Goole Docks Goole Docks 22,300 33,020 22,300 9,663 4,255 14,581 4,288
Total 3,104,057 3,101,524 2,588,824 2,985,348 4,133,536 3,695,608 3,714,82
1 Note: All values given in the table are in m³. For in-situ density (tonnes) all values are subject to a 1.3 multiplier (i.e. 1,000m³ = 1,300 tonnes). William Wright Dock is excluded from dredging/disposal due to contamination issues.

16
(1) Sunk Dredged Channel
The SDC (references to this channel also include the Hawke Channel) was originally dredged to
enable deep-draughted vessels to use the deep-water terminals of the Immingham Oil Terminal
and the Immingham Bulk Terminal. The Harbour Master is responsible for determining the safe
navigable depth for the SDC, the position of which is shown in the Annex, Figures 1.1 and 4.5. In
this role, they are responsible for initiating dredging of the channel to maintain a least available
advertised depth over the minimum controlling width of 150m. The present buoy line gives a
channel width of 180m.
Siltation Regime
Material tends to accumulate on the south side of the western two-thirds of the channel.
Siltation in the channel tends to be variable with average siltation rates being at a maximum
during the summer months, although rapid siltation can occur at any time. Historical records
indicate a cyclic pattern with a period of circa 14-15 years, although this has modified during most
recent years. Figure 4.5 summarises the dredge volumes for the SDC for the period 2004 to 2010.
Current Dredging Operations
The SDC is dredged as often as necessary in order to maintain the advertised depth. Due to the
dynamic nature of the channel, whereby sand migrating into the channel is highly variable from
day to day, seasonally and over long period of many years, there is not an established consistent
regime for dredging frequency; the necessity for dredging is determined by frequent bathymetric
surveys. Figure 4.5 identifies that no maintenance dredging was undertaken along the SDC from
2007 to 2009, with only a small campaign taking place during 2010. However, it is quite possible
that the channel will need more substantial dredging in the near future; i.e. similar to those seen
historically as part of the cyclic pattern.
Figure 4.5: ABP Maintenance Dredging Volumes for the SDC (2004 to 2010)
0
200,000
400,000
600,000
800,000
1,000,000
1,200,000
1,400,000
Dredge Volume (m
3 )
Sunk Dredged Channel 1,172,718 791,829 124,467 0 0 0 23,489
2004 2005 2006 2007 2008 2009 2010

17
When maintenance dredging is undertaken along the SDC, this is generally carried out by a TSHD.
To maintain the levels of the navigable width, the majority of dredging is required within a buffer
zone of approximately 63m width on the southern edge of the channel. The channel in the past
has been maintained to provide a Least Available Depth of 8.8-9.4m below CD, however from
2007-2010 it has been self maintained at in excess of 9.8m CD. This provides a depth of around
14 to 16m at high water. This variation in depth reflects the dynamic nature of the channel, and is
the reason for the fortnightly surveys (weather permitting) and continual notification of the
changing depth.
Material Type
The material dredged from the SDC in the years before the period of self maintenance was
predominantly sand with a mean/medium grain size of 100-200 microns. In the early years of the
channel, silt with a median particle size of <63 microns was mainly dredged. This material is still
from time to time present, but less frequently than seen in the past. The average bed density for
the sand has been established as approximately 1,550kg/m³, although material deposited from
the dredger at the Humber 1A/Middle Shoal (HU080) disposal site can range in density from
under 1,200kg/m³ to in excess of 1,400kg/m³.
(2) Grimsby Docks
In order to maintain vessel access and ABP operations at Grimsby Docks, maintenance dredging is
undertaken at five locations. The locations of these dredged areas are as follows (see Annex,
Figure 4.6):
• Grimsby Entrances;
• Grimsby No.2 Fish Dock & Marina;
• Grimsby Alexandra Dock;
• Grimsby Royal Basin; and
• Grimsby Royal Dock.
Additional third party maintenance dredging is also undertaken within the Grimsby Fish Docks
(No.1 and No.3) and within the outer Fish Dock Entrance by GFDE.
Siltation Regime
The commercial docks at Grimsby are not impounded. The sediment therefore enters the dock
system due to density interchange during the lock penning process and at times of levelling, i.e.
the dock level is allowed to rise at the same rate as the tide towards high water. Siltation within
the main dock therefore occurs due to the operation of the lock gates. Given that the lock gates
are located in Royal Dock it is understandable that the majority of the deposits occur there. The
movement of water within the dock forms a circulatory pattern entering via the lock gate,
progressing down the West Quay under and through the coal berth extension at the south end of
the dock and finally back up the dock following the East Quay. This circulatory effect assists
deposition at number 1 quay (the northernmost berth on the east side). Some material also
deposits in the corners of the dock and under the Coal Jetty in addition to along the quay walls.

18
Transit of vessels restricts the formation of large amounts of material in the centre of the dock.
The only other area to experience a build up of material is the entrance to the Union Dock cutting.
Within Alexandra Dock the majority of accumulated material is at the end of the Union Dock
cutting and around the edges of the Union Dock due to the wash of vessels swinging in the
turning area. Alexandra Dock experiences accretion but at a reduced rate compared to Royal
Dock. This is partly due to sluicing and the distance from the lock gates together with the turning
action of vessel traffic.
The tidal basin in the dock entrance requires regular work to keep access clear. The accumulation
of material is concentrated within the area protected by the piers. The material that settles on
the intertidal areas is drawn down with the tide or slumps into the navigable channel. Deposits in
this area are dominated by the tidal and wave regime, thus providing a constant maintenance
dredge requirement.
Current Dredging Operations
The present in-dock and basin maintenance dredging operations at Grimsby Docks are tidally
restricted since the dredger must pass through the lock gates to deposit the dock sediments at
the Humber 2/Burcom Sand (HU090) disposal site (situated approximately 2km to the north), or
can only work in the basin over the higher water periods.
Dredging is typically achieved by a GHD for about 13 days a year in total, but these days are
distributed fairly evenly over approximately 6 months of the year. TSHD is undertaken for
approximately 17 days over the year, principally in a spring and autumn campaign of 5 days each
with the remaining days used as required. A plough (bed-leveller) works for around 20 days a
year, with its role split between pulling material out to a reachable position for the TSHD, and
smoothing off the dock bottom after the GHD. Figure 4.6 summarises ABP maintenance dredging
volumes across the Grimsby Dock for the period 2004 to 2010.
The Royal Dock entrance is dredged to a depth of 1.2m below CD, which means that at high water
the entrances are generally deep enough to allow access to those vessels with the necessary
beam to pass through the locks. Royal Dock is dredged to maintain a depth of 6.8m and
Alexandra Dock a depth of 6.6m as measured on the inner sill of the dock. This allows access to
vessels with a draught of 5.8m, assuming the height of the tide is sufficient for them to navigate
the entrances, although larger vessels can be admitted with the Dock Master’s approval and a
sufficient tide.
The Fish Docks (in its entirety) was originally dredged to maintain a depth of 6.7m on the inner sill
at mean high water springs, although in recent years, the change of operation and usage has
resulted in the maintenance of shallower depths. However, increased sedimentation in the
vicinity of the No.2 Fish Dock, site of the Humber Cruising Association (HCA), meant that dredging
was needed to meet operational requirements. As such the HCA (with ABP’s assistance)
contacted the Marine and Fisheries Agency (MFA) with a view to carry out a small dredging
campaign. As the area had not been dredged for some 14 years, Cefas advised that sampling of
the sediments must take place first; on the basis that no anomalies were detected, the dredge
was undertaken by a small independent operator (mv Coquetmouth). Dredging has now been
undertaken within the No.2 Fish Dock & Marina since 2007 through UKD.

19
Figure 4.6: ABP Maintenance Dredging Volumes for Grimsby Docks (2004 to 2010)
Material Type
The material dredged from the Grimsby Docks is composed predominantly of fine silts, clay and
some sand. The in-situ bed density is generally of the order of 1,300-1,400kg/m³. The GHD
removes the material at approximately in-situ density, whereas the average density at the point
of disposal from the TSHD will generally be between 1,150-1,250kg/m³, depending on material
type, when last dredged and amount of material to be dredged.
(3) Immingham Docks and Waterfront Berths
In order to maintain vessel access and ABP operations at Immingham Docks, within the entrance
and along the waterfront (river) berths, maintenance dredging is undertaken at eight locations.
The locations of these dredged areas are as follows (see Figure 4.7):
• Immingham Bellmouth (including East Jetty);
• Immingham Dock;
• Immingham West Jetty Ext;
• Immingham Outer Harbour;
• Humber International Terminal;
• Immingham Gas Terminal; and
• South Killingholme Oil Jetty.
0
50,000
100,000
150,000
200,000
250,000
300,000
350,000
Dredge Volume (m
3 )
Grimsby Royal Dock 63,158 165,188 119,232 114,218 106,354 111,615 73,570
Grimsby Royal Basin 97,975 36,309 14,778 35,300 14,760 5,997 946
Grimsby Alexandra Dock 46,772 3,345 13,964 21,357 2,276 10,098 25,491
Grimsby No.2 Fish Dock
& Marina
0 0 0 36,198 17,381 6,828 12,324
Grimsby Entrances 0 0 0 7,294 104,885 109,167 186,561
2004 2005 2006 2007 2008 2009 2010

20
Additional third party maintenance dredging is also undertaken locally at the Immingham Bulk
Terminal (IBT) for Tata Steel, and at the Humber Sea Terminal (Berths 1 to 6) at North
Killingholme Jetty by Humber Sea Terminal Ltd (Simon Group plc).
Siltation Regime
Siltation within the dock occurs primarily along the quay walls, with a large depression forming in
front of the lock entrance due to the turning action of dock traffic. This turning action causes the
expulsion of fine material towards the two dock arms. Material does not accrete at the end of the
Ro/Ro berth dock arm, (southwest arm), due to the ferries berthing action. The ingress of
suspended material is via the impounding pumps and lock gates. Studies have been carried out to
determine the most appropriate times for operating the pumps in order to minimise ingress of
material. However, the vessel traffic through the lock necessitates the use of the pumps at all
times irrespective of the ‘most favourable’ operational periods.
Current Dredging Operations
Immingham is similar to Grimsby in that there is a programme of maintenance dredging of the
main dock in order to maintain a constant depth for vessels. However, there is a far larger
waterfront berth dredging programme at Immingham which has riverside terminals providing
berthing facilities for larger vessels requiring deeper water.
A TSHD and GHD operate at Immingham for approximately 28 and 30 days per year in total
respectively, working Immingham Dock, the entrances and the waterfront berths. A plough (bed-
leveller) works for about 34 days per year, pulling material out to be reached by the TSHD, and
smoothing off the dock bottom after the GHD. This is normally programmed to be fairly evenly
spread throughout the year by arranging a dredging presence in the Grimsby and Immingham
area every 3 to 4 weeks, for periods of up to a week at a time. The established dredging
commitment to the port is based on the number of days worked the previous year. The dredger
is booked and carries out work based on the Dock Master’s requirements combined with available
survey information, meaning that the dock system may not be maintained to the same levels at all
times. Further variations may occur depending on the commercial requirements within the dock.
In addition to these requirements, the recently completed Immingham Outer Harbour (IOH)
provides a workload of around 72 days per year for both a TSHD and plough.
Figure 4.7 summarises dredging volumes undertaken by ABP across the Immingham Docks and
waterfront berths for the period 2004 to 2010. At the present time, all maintenance dredge
material arising from Immingham Dock, its entrance and waterfront berths, and from the
terminals at Immingham and South Killingholme is deposited at the Humber 3A/Clay Huts
(HU060) disposal site.
The main Immingham Dock is dredged by a TSHD to remove fine silts, and to maintain a depth of
11m as shown on the dock sill gauge at the normal impounded water level. It is difficult to reach
some areas, such as adjacent to the dock walls, so a GHD is used to remove the build up of
sediment and a plough is employed to pull material to a reachable position for the TSHD. The
plough is also used to smooth off the dock bottom after the GHD. An area two to three times the
width of the berth needs to be dredged in front of the East and West Jetties as well as in the
Bellmouth. Fine silt deposits in the immediate lock entrance within the dock Bellmouth tend to

21
be removed using the GHD due to lack of manoeuvring space. The Bellmouth is dredged to a
depth of 7.6m below CD, therefore allowing vessels with a draught of 10.36m being admitted to
the docks at Immingham. The two jetties either side of the lock entrance known as the Eastern
and Western jetties are dredged to an advertised depth of 9.8m below CD although in reality this
depth may vary. Should the current trade at the jetties and berths not require these depths then
dredging is postponed in order to reduce the dredging requirement. Deepening back to the
original depth may however be required at any time and will be carried out as and when
appropriate.
Figure 4.7: ABP Maintenance Dredging Volumes for Immingham Docks and Waterfront Berths (2004 to 2010)
Up-estuary of from the Western Jetty, the waterfront berths at Immingham are dredged using a
TSHD, with the principle dredging commitment being required at Humber International Terminal
(HIT 1 & 2) and IOH. These jetties require dredging in order to remove sediment that accumulates
within the deep berthing pockets. The HIT berths are designed to handle much larger vessels, and
are dredged to 14.7m below CD for vessels of 14.2m draught. The IOH is dredged to 10m below
CD. In addition to the TSHD used within IOH, a jetting system has recently been installed (during
2011) below the IOH pontoon. By maintaining a constant flow rate beneath the pontoon,
0
500,000
1,000,000
1,500,000
2,000,000
2,500,000
3,000,000
3,500,000
4,000,000
Dredge Volume (m
3 )
South Killingholme Oil Jetty 0 0 0 0 0 13,784 10,315
Immingham Outer Harbour 0 0 724,488 1,344,167 2,076,000 2,014,179 1,948,117
Immingham West Jetty Ex t 278,614 479,710 41,893 65,933 87,433 24,495 63,011
Immingham Gas Terminal 31,780 84,475 51,138 54,276 85,207 40,654 32,061
Immingham Dock 298,191 260,692 229,980 148,660 257,418 196,994 146,032
Immingham Bellmouth 207,634 215,962 110,038 184,249 260,609 187,288 184,401
Humber International Terminal 130,162 290,098 392,802 370,222 537,686 339,683 284,900
2004 2005 2006 2007 2008 2009 2010

22
sediment deposition is being prevented, which has in the past lead to the grounding of the
pontoon structure at low water on a spring tide. The use of this jetting system should hopefully
lead to the long-term reduction in maintenance dredging around the IOH pontoon.
Again further up-estuary, a TSHD is also used to maintain the berthing pocket of the Immingham
Gas Jetty (IGJ) at a depth of approximately 10m below CD, although it was constructed with the
capacity to be deepened to 14.8m below CD; if and when this is required, the necessary
deepening work will be undertaken. The South Killingholme Jetty, run by the Oil and Pipelines
Agency, is dredged to 11m below CD.
The Immingham Oil Terminal (IOT) does not currently require any dredging as it is located on the
main deep water channel in the river and the depth is maintained naturally.
The future dredging requirements at ABP Immingham may be subject to change depending on a
variety of factors including natural sedimentation rates, commercial pressures, and new
developments and developing dredging technology. Indeed, it has become apparent in recent
times that sedimentation rates on the new IOH development have been in excess of that
indicated by the numerical modelling; leading to a request in 2007 for an extension to the deposit
amount in the Humber 3A/Clay Huts (HU060) disposal site. At the time, this was considered to be
a temporary aberration, caused by excessive flood waters draining out of the Humber, although
as a precautionary action, a high dredge tonnage has subsequently been assumed for the berths.
Material Type
The bed material in Immingham Dock and the Bellmouth consists mainly of silt with some clay and
sand, with finer sediments in-dock compared to the waterfront berths. There is a bed density of
up to 1,300kg/m³in the dock (varies from 1,200-1,250kg/m³in the dock arms). In most areas, this
material is constantly re-distributed by shipping movements, currents or discharge from the
impounding pumps and by the action of dredging. Such activities prevent consolidation of the
bed particularly in areas where more than one of these processes occurs. Average densities
deposited at the disposal ground will be of the order of 1,200kg/m³ or less.
(4) Saltend Jetty
The Saltend Jetty comprises two berths owned and operated by ABP which are currently used
mainly for the discharge and loading of Chemical Tankers. There is one berthing pocket that is
dredged to provide an adequate depth across both berths, see Annex, Figure 4.8.
Siltation Regime
Occasional dredging is required to remove material that slips into the vessel berthing areas from
the bank to the landward side and bed material that accumulates between the jetty piles.
Current Dredging Operations
The dredging requirement for the two berths at Saltend is relatively low with the frequency of the
vessels themselves maintaining depths in the relatively strong estuary flows. On average the
berths are dredged by a TSHD for a total of about 2 days per year, with a GHD to remove material
from along the jetty face for 1-2 days a year (if at all). This total dredging commitment tends to
be split over a number of more frequent operations (lasting a few hours each). Both berths at

23
Saltend are dredged to 9.8m below CD, which enables, depending on the state of the tide,
berthing of vessels with a draught of 10.4m. Figure 4.8 summarises ABP maintenance dredging
volumes across at the Saltend Jetty for the period 2004 to 2010.
Figure 4.8: ABP Maintenance Dredging Volumes for the Saltend Jetty (2004 to 2010)
(5) Hull Docks and Waterfront Berths
In order to maintain vessel access and ABP operations at Hull Docks, within the entrances and
along the waterfront (river) berths, maintenance dredging is undertaken at eleven locations. The
locations of these dredged areas are as follows (see Annex, Figures 4.9 and 4.10):
• King George Dock;
• King George Dock Entrance;
• Queen Elizabeth Dock;
• River Terminal 1;
• East Middle;
• Alexandra Dock;
• Alexandra Dock Entrance;
• Victoria Dock Basin;
• Albert Dock;
• Albert Dock Entrance; and
• William Wright Dock (currently excluded from the FEPA Licence)
Additional third party maintenance dredging is also undertaken locally at the Old Harbour (River
Hull) and for the Hull Marina Dock & Basin Area.
0
50,000
100,000
150,000
200,000
250,000
Dredge Volume (m
3 )
Saltend Jetty 40,026 155,983 234,517 164,090 62,326 38,168 177,054
2004 2005 2006 2007 2008 2009 2010

24
Siltation Regime
Siltation at the King George and Queen Elizabeth Docks is caused by river water entering the dock
through the lock and the impounding pumps, carrying suspended sediment which falls out along
the dock wall opposite the lock entrance. The remaining sediment is dispersed around the dock
by vessel activity. Deposition is noticeable along the boundary of an old dock retaining wall and
also at the ends of the docks. A two metre depression tends to form in the centre of the dock
towards the location of the ferry Ro/Ro terminal. This is due to the turning actions of the ferries
located in this area and other vessels entering the dock. Material deposition is also found at the
seaward entrance to the lock to the east of the lock entrance.
River Terminal 1 (RT1) is comprised of a ‘T’ shaped boarding jetty with a link span to a Ro/Ro Ferry
moored against breasting dolphins. For the purpose of keeping the vessel afloat at all states of
the tide, a dredged box has been created beginning at the link span location and extending to a
point well clear of the bows. The main sedimentation at RT1 is next to the link span. The action
of the ship’s main engines causes slippage from the steep bank of bed material around the jetty.
To a lesser degree, similar action causes slippage at the location that corresponds to the vessel’s
bow thrusters. The remainder of the deposited material is evenly distributed along the length of
the box by the river’s natural siltation process
Sediment enters Alexandra Dock through the lock gates and drops out of suspension. There are
no impounding pumps in this dock and the lock gates are the only source of ingress of suspended
material. Additionally, sediment also enters the Victoria Dock Basin from the estuary culminating
in a requirement for dredging.
Finally, sediment enters Albert Dock through the lock gates and accretes in the lock entrance.
Further hydrodynamic effects move finer particulates along the dock through the open entrance
into William Wright Dock. Due to low level dock usage the lock itself sometimes requires small
quantities removing. Another area where sediment accumulates is the lock approaches which is
angled towards the flood tide. A back water is formed which causes material to be deposited.
There are no impounding pumps in either dock therefore the lock gates are the only source of
ingress of suspended material.
Current Dredging Operations
At the King George and Queen Elizabeth Docks, a TSHD presently works in conjunction with a
GHD, with the GHD able to access close to the dock walls and in-dock recesses; the two dredgers
do not necessarily work together simultaneously. Based on recent figures (see Figure 4.9), a TSHD
is required on average to dredge King George and Queen Elizabeth Docks and the approaches for
about 16 days in a year, whilst a GHD is generally used for around 20 days. This dredging
commitment is spread fairly evenly over the year. Dredging is not affected by tidal constraints as
the dredger can be penned out under most states of tide (extreme springs being the exception),
although significant delays can result from a high volume of dock traffic. In addition to the TSHD
and GHD, there has been an occasional use of a bed leveller in the docks to maximise the dredge
efficiency. The King George and Queen Elizabeth Docks are both maintained to a sill depth of
11.5m at the impounded water level to allow vessels of up to 10.4m draught to navigate safely in
the dock, thereby meaning that the docks are dredged to 5.5m below CD.

25
Historically at RT1, a combination of a TSHD and a GHD has been used for maintenance dredging.
More recently, a bed leveller has been deployed to maintain the dredge box, achieved through 5-
6 hours of dredging every month. The bed leveller relies on the principle that the operation keeps
the material in a fluid state and the agitation action of the leveller drags the material out of the
box into the tidal stream. This operation is usually carried out on an ebb tide for maximum
efficiency. The dredged box has been maintained to such effect using the bed leveller that it is
not envisaged that either a TSHD or a GHD will be required in the foreseeable future. RT1 is
currently dredged (if necessary) to maintain a depth of 7.0m below CD, although the frequent
vessel usage at the terminal tends to assist the maintenance of the berth. The surrounding area is
typically maintained by a TSHD or GHD (with some bed levelling if required), whereby the dredge
volumes are shown in Figure 4.9. However, natural self-scouring in this part of the estuary
generally keeps the dredging requirement low. The future dredging method and frequency will
be whatever is required to keep the berth operational and safe for vessels.
Dredging occurs at East Middle where the bank encroaches into the main navigation channel on
the approaches to Hull’s Docks. This area is dredged on an ad hoc basis in response to
navigational safety concerns and the requirement to maintain navigable width and depths. A
TSHD is used when necessary to maintain this area.
The Alexandra Dock and its entrance are dredged using a TSHD and a GHD for around 7 days and
10 days per year respectively. The dredging tends to be concentrated into 4 main campaigns over
the course of the year. The dock shape lends itself well to the deployment of a TSHD with the
exception of the pencil jetties and enclosed dock extension which to date have been worked by
the GHD, which is far more manoeuvrable and capable of getting into restricted areas where
sediment may accumulate. Alexandra Dock is dredged to maintain a sill depth of 8.2m, allowing
access to vessels of up to 7.9m draught. The dock entrance is dredged to 3m below CD. The
Victoria Dock Basin and its entrance (slightly further up-estuary from Alexandra Dock) are
currently plough dredged once or twice a year, although this may vary depending on siltation
rates.
Albert Dock and its approaches are currently dredged for approximately 5 days and 8 days per
year by a TSHD and GHD respectively. This dredging is generally distributed evenly over the year
but is also tidally restricted due to the relatively shallow maintained depths in the entrance. The
long pencil shape of the dock does not suit vessels needing space to manoeuvre, especially if
vessels are berthed along the quay. A plough (bed leveller) is used in the entrance around 3 to 4
times annually. The Albert Dock is dredged to maintain a sill depth of 7m, while the dock
entrance is dredged to 1.3m below CD. The dock can cater for vessels of up to a 7m draught. Due
to sediment contamination issues within the William Wright Dock, adjacent to Albert Dock, no
dredging or disposal activities are currently being undertaken (as shown in Figure 4.9).
ABP will continue to dredge as frequently as required at Hull in order to ensure advertised depths
are maintained, with the Humber 4B/Hook (HU020), Humber 4B/Hook Extension (HU021) and
Humber 4 (HU030) disposal sites receiving dredged material originating from Hull (docks and
waterfront berths) and the Saltend Jetty. However, the future dredging commitment may change
depending on the sedimentation regime both within the docks and the river, and the nature of
the dredging operation undertook. If more cost efficient dredging methods can be adopted at the

26
port to minimise the annual dredging commitment then such measures will be adopted wherever
possible.
Figure 4.9: ABP Maintenance Dredging Volumes for Hull Docks and Waterfront Berths (2004 to 2010)
Material Type
The material removed from within King George and Queen Elizabeth Dock is comprised of fine silt
and clays with an approximate bed density of 1,300kg/m³. The density is controlled by allowing
consolidation to occur. At RT1, Albert and Alexandra Dock, the material removed is comprised of
silt, sand and clay with bed densities of approximately 1,200kg/m³, 1,275kg/m³ and 1,250kg/m³
respectively.
(6) Goole Docks
The Port of Goole and its associated docks are located on the River Ouse, approximately 80km
from the mouth of the Humber. The location of dredging undertaken within the Goole Dock
system (including the dock entrances) is shown in the Annex, Figure 4.11.
0
100,000
200,000
300,000
400,000
500,000
600,000
700,000
800,000
Dredge Volume (m
3 )
River Terminal 1 0 0 0 12,346 53,314 69,048 74,266
Alexandra Dock 153,478 113,306 100,491 84,177 69,469 19,398 47,365
Alexandra Entrance 70,512 42,755 49,141 14,909 2,292 80,676 84,780
William Wright Dock 0 0 0 0 0 0 0
Albert Dock 128,540 101,894 78,202 33,277 52,530 26,238 9,757
Albert Entrance 47,730 16,725 23,300 4,255 2,230 9,435 19,480
QE Docks 0 0 0 1,115 0 0 0
King George Entrance 159,416 113,885 68,171 139,347 199,257 247,616 221,519
King George Dock 155,051 196,348 189,922 140,295 137,854 129,666 85,094
2004 2005 2006 2007 2008 2009 2010
27
Siltation Regime
Sediment enters the Goole Dock system through Ocean Lock (main lock), via Victoria Lock or
directly from the canal; although it is accepted that the canal water does not contain significant
amounts of sediment. The main ingress of suspended sediment is that which enters through the
operation of the lock gates. The accumulation of this sediment is centred in and around Ship and
Barge Docks which are the first two docks adjacent to the main lock. Sediment is also deposited
in Ouse Dock and under the road bridge spanning the dock exit. The accumulation in this area is
due to material entering through Victoria Lock.
The fairway between Ocean Lock, running through Ship Dock into Aldam and Railway Dock, is kept
clear by vessel movements. The recess of Aldam Dock accretes slowly whilst the corner of
Railway Dock has a more significant build up. Deposition in these areas can be attributed to
vessels turning action in order to transit the docks. Stanhope, South and West Docks currently
have no siltation issues, although localised ridges may form along the berths due to ships lying
along the quays (also seen in the other docks). A significant siltation problem occurs in the mouth
of the recessed Ocean lock due to the angle of the lock entrance to the river, where flood tide
material is deposited at this location; less significant siltation occurs on the ebb tide in the mouth
of Victoria Dock.
Goole also has fresh water entering from the canal, whereby the flow is unpredictable as the
amount can change from a sizeable influx to a minimal flow in times of little or no rainfall. During
1999 the freshwater input was considerable, allowing the docks to be flushed out. This process
can clear fluid mud and keep South Dock, Barge Dock and Ocean Lock clear. However the biggest
differences are noted in the Bellmouth area, where the dredging requirement was much reduced
in 1999. When there has been limited rainfall, the sluicing facility is not available and the
dredging requirement is increased. This makes prediction for maintenance dredging difficult.
Current Dredging Operations
Historically, Goole Docks has been dredged by the GHD “Goole Bight”, operated by the Port of
Goole, which extracted small amounts of material almost daily. Since the beginning of 1999, UK
Dredging took over the dredging requirement with a GHD which is used for up to three campaigns
annually of 6 to 10 days each in conjunction with a plough (bed leveller). As Goole has a tidal
restriction, the GHD can only take a single dredge load per tide to either the Whitgift Bight
(HU040) or Goole Reach (HU041) disposal sites. It should also be noted that West Dock is
currently excluded from the FEPA Licence due to contamination issues. The annual dredge
volumes for Goole Docks can be seen in Figure 4.10. The docks at Goole are dredged in order to
maintain a generally uniform 6.2m water level on the River Gauge throughout the dock system,
however, this may in reality vary between individual docks depending on the movement of
shipping and natural sedimentation rates. The lock entrances are dredged to 2.4m below CD,
typically allowing vessels with a draught of up to 6m to enter the dock system.

28
Figure 4.10: ABP Maintenance Dredging Volumes for Goole Docks (2004 to 2010)
Material Type
The sediment in Goole dock is composed of medium to fine silt and clay with an in-situ density of
approximately 1,300kg/m³in the inner docks and about 1,450-1,500kg/m³ where sediments have
been allowed to accumulate in the corners of the outer docks.
Non-ABP (Third Party) Dredging
ABP is the navigation and conservancy authority for the river and has extensive powers over the
control of dredging in the river. A third party must seek the permission of the Harbour Master to
undertake dredging works as well as secure their own FEPA/Marine licence from the MMO.
Certain Acts of Parliament, Harbour Revision Orders etc. may also convey certain powers to
dredge but only with the written consent of the Harbour Master (which shall not be unreasonably
withheld). Any consents to dredge are accompanied by certain conditions which must be strictly
adhered to. Part of these conditions is an assurance, supported by an assessment, that the
proposed works will not have a detrimental effect on the river regime and adjacent facilities.
They will also include a requirement to forward records to the Harbour Master’s office of the
location from which material is being dredged as well as the quantities involved. Dredgers are
also monitored on radar through the VTS control centre.
Therefore, although ABP has no direct responsibility for the dredging operations of other
organisations it is through these existing controls associated with the consents mechanism that
ABP seek to ensure that consents issued to third parties to dredge in the Humber are consistent
with its own operations. Operators of non-ABP facilities contributed advice and data to this
baseline document and have actively commented on the end document. This baseline is a joint
exercise between all the operators on the Estuary, and it is envisaged that all contributory
companies and facility operators will continue to work together to achieve updates when
requested by the lead authority. An overview of the non-ABP (third party) maintenance dredge
operators on the Humber Estuary is detailed in the following sections.
0
5,000
10,000
15,000
20,000
25,000
30,000
35,000Dredge Volume (m
3 )
Goole Docks 22,300 33,020 22,300 9,663 4,255 14,581 4,288
2004 2005 2006 2007 2008 2009 2010
29
(7) Grimsby Fish Docks
Grimsby Fish Dock Enterprises employ Van Oord to carry out their dredging requirement for the
Grimsby No. 1 and 3 Fish Docks and the external entrance channel (up to the main navigation
channel), as shown in Figure 4.6. Prior to 2009, dredging in the Fish Docks was undertaken by
TSHD and a plough once or twice per year, with each campaign lasting around 4 to 6 weeks. This
material was disposed at the licensed Humber 2/Burcom Sand (HU090) disposal site,
approximately 2km to the north. Since 2009, WID has been taking place for approximately 3
weeks per year, and has proved to be a more efficient and cost productive process compared to
using a TSHD. The Fish Dock entrance channel is currently dredged to a depth of 1.2m below CD,
whilst the No.1 and No.3 Fish Docks are dredged to maintain a depth of 6.7m on the inner sill at
high water springs. The volume of material dredged by Grimsby Fish Dock Enterprises is
summarised in Table 4.2 for the period 2002-2010.
Table 4.2: Maintenance dredging volumes (m³) for Grimsby Fish Docks (No.1 and 3) and the external entrance channel
Location 2002 2003 2004 2005 2006
Grimsby Fish Docks (No. 1 & 3 Docks and the External Entrance Channel)
94,518 109,934 50,000 27,000 80,380
2007 2008 2009 2010 2011
126,079 81,900 46,800 85,000
Note: All values given in the table are in m³. For in-situ density (tonnes), values are subject to a 1.4 multiplier.
(8) Immingham Bulk Terminal
The Immingham Bulk Terminal (IBT) is currently operated by Tata Steel (formerly Corus), and has a
FEPA licence to dispose of maintenance dredge material originating from the berths (see Annex,
Figure 4.7) at the licensed Humber 3A/Clay Huts (HU060) disposal site. The maintenance dredge
commitment for IBT is approximately 18 days each year using a TSHD and GHD, whereby the
berths are dredged to 14.5m below CD for vessels of 14m draught. Dredging is also required
behind the IBT to remove material that may slump through the jetty to the berthing pocket, which
would compromise the depth; however, this dredging is undertaken by ABP. The volume of
material dredged from the IBT berths for the period 2004 to 2010 is shown in Table 4.3.
Table 4.3: Maintenance dredging volumes (m³) for the Immingham Bulk Terminal
Location 2004 2005 2006 2007
Immingham Bulk Terminal
298,163 635,339 430,916 485,177
2008 2009 2010 2011
606,748 484,810 304,218
Note: All values given in the table are in m³. For in-situ density (tonnes), values are subject to a 1.3 multiplier.
(9) Humber Sea Terminal
The Humber Sea Terminal (HST) at North Killingholme (Immingham) is currently operated by
Humber Sea Terminal Ltd (Simon Ports plc), and has three separate FEPA licenses for the disposal
of dredge material originating from its approaches and six berths (Annex, Figure 4.12). All
maintenance dredging at the HST is carried out by UK Dredging using a TSHD, where there is on
average one dredge campaign a month which lasts around 3 days, with this material being
disposed at the licensed Humber 3A/Clay Huts (HU060) disposal site. The volume of material

30
dredged for the HST is summarised in Table 4.4 for the period 2004-2010; earlier dredge volumes
for the HST are not known. Dredging is undertaken to try and maintain a depth of 6.3m below CD
in the approaches to the terminal and berths (although the design depth is 7.2m below CD),
however, the berths themselves generally maintain their own depth without any dredging. This
being said, berth 6 has been neglected since its construction in 2007 (where approximately 19,405
wet tonnes of material was dredged as part of a capital works scheme for berths 5 and 6) and
would therefore require some work before it could be used. At the time of writing (September
2011), berth 4 had not been dredged since November 2010 and can only be approached at certain
states of the tide, although the depth of this berth is still sufficient. Capital dredge works were
undertaken at berths 1-4 during 2000 using a TSHD and a GHD for close work around the jetty
face, but dredge volumes for this are not known.
Table 4.4: Maintenance dredging volumes (m³) for the Humber Sea Terminal
Location 2004 2005 2006 2007
Humber Sea Terminal (Approaches and Berths 1-6)
152,472 210,476 390,850 539,424
2008 2009 2010 2011
1,435,339 773,785 702,806
Note: All values given in the table are in m³. For in-situ density (tonnes), values are subject to a 1.3 multiplier.
(10) Old Harbour and River Hull
Dredging of the Old Harbour and River Hull is under the jurisdiction of the River Hull Harbour
Master (Mike Monday, Hull City Council). Dredging of the Old Harbour occurs approximately once
a year (maybe more often if required), and is typically achieved using a plough or a cutter suction
dredger (where the dredge material is dispersed back into the water column) to a depth of
around 0.5m below the lowest tide level. The location of this dredge area is shown in the Annex,
Figure 4.10. Dredging may also be carried out along the River Hull, where there is a potential for
dredging within the vessel turning area below Drypool Bridge (Annex, Figure 4.10). This dredging
is undertaken when required, generally on an annual basis, and is also achieved through a plough
or cutter suction dredger. Prior to 2009, dredging in the Old Harbour and River Hull was achieved
by a small GHD with bottom opening doors over high water, with the dredged material being
deposited at a licensed sea disposal site.
(11) Hull Marina Dock (‘Humber’ Dock) and Dock Basin
Dredging of the Hull Marina Dock (Annex, Figure 4.10) is under the jurisdiction of British
Waterways, who lease the Dock from Hull County Council. Hull Marina Dock requires major
maintenance dredging on average once every 20 years, and is dependant on lock usage and
rainfall. No dredging has been undertaken in recent years (i.e. the last 5-10 years). Material from
the Dock can also be removed (to a degree) on a regular basis by sluicing and other hydrodynamic
techniques (i.e. via flexi-hose into the main flow).
The entrance to Hull Marina Dock is termed ‘Dock Basin’ and requires maintenance dredging to
remove the slow accumulation of material. The Dock Basin was last dredged in 2009 by Hull City
Council for a clipper event, where ploughing was undertaken through side-casting using the
‘Pelagic II’ vessel owned by Barry Hughes Marine. Prior to this, it is believed that the Dock Basin
was plough dredged on average once or twice a year, although this may have varied depending on
usage, finance and siltation rates.
31
(12) Winteringham and Brough Havens
Every year, for the last 10-12 years, the Humber Yawl Club have washed off the berths at
Winteringham Haven (Annex, Figure 4.13) using a 4 inch diesel displacement pump, in which the
mud is then dispersed into the estuary using an outboard motor. This work is undertaken
between December and March, and takes approximately 170 man hours annually to complete.
The same technique is also undertaken at Brough Haven (Annex, Figure 4.13), although the
volume of work is approximately half of that at Winteringham Haven.
(13) River Trent
A number of independent operators carry out periodic maintenance dredging on the River Trent,
the locations of which are shown in the Annex, Figure 4.13. These activities are carried out in
order to maintain operational depths at individual berths and approaches, the details of which are
discussed separately below.
The berths at Flixborough Wharf and Top Gunness Wharves (Keadby Bridge) are currently
maintained by RMS Group Holdings Ltd., who utilise a shore-side crane to grab mud, which is side-
cast through the water and re-deposited on the river bed 10-15m from the jetty. This dredging is
required to ‘level’ the build up of mud against the jetty face(s), and takes approximately 1.5 man
hours every month to achieve, generally undertaken during quiet periods or as and when is
required. Maintenance dredging is essential to the operation of these wharves, but is kept to a
minimum to reduce disturbance to the river bed. A plough dredger trial was previously
undertaken at Flixborough Wharf, which was along the length of the quay (to the width of the
plough), however this process did not achieve any better results than the current methodology
and was subsequently discontinued.
At the Neap House and Grove Wharves, maintenance dredging is undertaken by Grove Wharf Ltd.
using a shore-side crane, which removes mud from against the jetty face approximately 3 times
per year during low tide. This mud is then dumped around the wharf site or nearby into the river.
The berths at Keadby Lock Wharf, which are operated by PD Port Services, are maintenance
dredged by shore-side cranes approximately five or six times a year and for a period of around
four hours on an ebb tide. Material is grabbed with shore-side equipment and dragged into the
outgoing tidal flow as a form of agitation dredging.
Keadby Lock and the navigation channel allowing entry to the lock are maintained on a regular
basis through hydrodynamic techniques, which is controlled by British Waterways. No further
information is available on timings or methodology. The lock is maintained to the sill level to
allow access and lock operation.
(14) Drainage Channels
As a result of flooding, due to the apparent inability of certain drainage channels (ditches) to cope
with the volume of water from abnormal amounts of rainfall, the Environment Agency embarked
on a campaign of dredging in early 2008. Two drainage ditches on the north side of the estuary
were targeted, and sediment build-up was removed with the use of a small cutter suction dredger
mounted on a ‘jack-up’ rig, which disposed of sediment into the flow of the estuary through flexi-
hoses. Around 17,000m³ of material was removed from Hedon Haven at the Burstwick Drain
32
Outfall during January 2008, and about 19,500m³ of material was removed from Stone Creek at
the Keyingham Drain Outfall during February 2008.
In addition to these campaigns, some localised dredging at the Stone Creek outfall structure has
been done in the past using a long reach excavator. The removed material was placed and spread
on the adjacent foreshore. This dredging was carried out to ensure the tidal gates continued to
function properly. No dredging has been undertaken at the Holderness Drain to date, however,
ABP have been asked to dredge between the Hedon Road Doors and their tidal doors (for which a
land Drainage Consent has been granted by the Environment Agency), with works due to start
once site access difficulties have been overcome. No previous dredging operations have been
undertaken at Fleet Drain (Hessle), however, there are outline proposals to dredge the A63
culvert downstream at Hessle Clough.
b) Sediment Quality within the Study Area
Sediment quality data for a number of locations within the Humber Estuary for the period 2008 to
2010 are presented in ABP 2012, with a summary provided below. The most recent data for each
location is considered first, with the appropriate tables listed in succession from old to new
(allowing the document to be updated efficiently).
Metals
Data from the 2008 to 2010 sampling exercises indicate that metal concentrations within the
Humber Estuary sediments are typically below Cefas ALs or slightly above Cefas AL 1. However,
there were a few sediment samples that exceeded Cefas AL 2, these are for Zinc at West Dock,
Goole (2008, Table A3) and William Wright Dock, Hull (2008, Table A6), and for Copper at South
Dock, Goole (2008, Table A3).
Organotins
Levels of Tributyltin (TBT) are generally below Cefas ALs for all sediment samples. However, once
again there were a few tested samples that exceeded Cefas AL 2. These samples originated from
West Dock, Ouse Dock and South Dock at Goole (2008, Table A3) and William Wright Dock, Hull
(2008, Table A6). No sampling results have been provided by Cefas for Dibutyltin (DBT) for the
period 2008 to 2010, and therefore it is assumed no analysis was undertook.
Polychlorinated Biphenyls (PCBs)
Historically, PCB contamination levels within the Humber Estuary and dock systems are relatively
low, and as such, there has been little sampling undertaken in recent years. However, sampling
was undertaken within Goole Docks during 2009, as shown in Table A16. Analysis of the sediment
samples show that Cefas AL 2 was exceeded at South Dock, Ship Dock, Stanhope Dock and Ouse
Dock for CB no.47 (2,2’,4,4’-Tetrachlorobiphenyl) and g-HCH (Lindane), whilst Ouse Dock also
exceeded Cefas AL 2 for CB no. 156 (2,3,3’,4,4’,5-Hexachlorobiphenyl) and CB no. 158
(2,3,3’,4,4’,6-Hexachlorobiphenyl).
Polyaromatic Hydrocarbons (PAHs)
Within the Humber Estuary, many locations exceed Cefas AL 1 for a range of PAH substances,
although the Total Hydrocarbons (THC) range largely from 164ppm to 1755ppm. As such, THC
exceeds Cefas AL 1 for all sampled locations between 2008 and 2010.
33
c) Summary of Sediment Quality
The sediment quality of material licensed for maintenance dredging on the Humber Estuary has
been routinely monitored by Cefas. Prior to 2005, it had not been necessary to place licence
restrictions on any applicants on the Humber in relation to the sediment quality of maintenance
dredge material. However, in December 2005, it was necessary to place a restriction on dredging
activities both within Alexandra Dock and William Wright Dock (Hull), due to unacceptably high
TBT levels in sediment samples. TBT contamination in Alexandra Dock was subsequently found to
have reduced to acceptable levels, and this restriction was lifted; although the restriction on
William Wright Dock has remained. In addition to these, West Dock (Goole) has also been
excluded from FEPA licenses since 2006, due to high levels of Zinc within the dock. These issues
are further noted in ABP 2012.
In more recent times (i.e. since 2008), the docks at Goole have also been the subject of further
investigation, primarily with relation to Zinc, Copper, PAH and DDT (g-HCH) contamination.
Further details are provided in ABP 2012, whereby monitoring and subsequent analysis was
undertook to satisfy licence conditions on the present FEPA licence.
However, although there have been contamination issues at select locations in recent years,
contamination levels within sediment samples across the Humber Estuary are typically below
Cefas ALs or slightly above AL 1. In general, contaminant levels in dredged material below AL 1
are of no concern with respect to their potential to cause pollution, and are unlikely to influence
the decision to issue a licence. These action levels are not absolute ‘pass/fail’ levels, but are used
as guidance in conjunction with other assessment criteria. Where contamination levels in
sediment samples exceeded Cefas AL 1, these concentrations would have been taken into account
by the licensing authority, and have nonetheless been deemed acceptable for disposal to sea.
4.2 Placement sites
4.2.1 Relocation within the aquatic environment
Disposal Sites
Within the Humber Estuary there are a number of disposal sites which can be used under FEPA
licence for the disposal of maintenance and capital dredge material. Table 4.5 lists these sites
along with their current status, i.e. open, closed or disused, and their locations can be seen in
Figures 4.1 to 4.4 (all Annex).

34
Table 4.5: Sea disposal sites within the study area
Disposal Site Status
Site No. Site Name
HU020 Humber 4B / Hook Open
HU021 Humber 4B / Hook Extension Open
HU025 Alexandra Dock (Pipeline) Closed
HU030 Humber 4 Open
HU040 WhitgiftBight (River Ouse) Open
HU041 GooleReach Open
HU045 Redcliffe Disused
HU046 Hull Marina Open
HU050 Humber 3 Closed
HU055 Foul Holme Deposit Closed
HU056 Holme Channel Deep Open
HU057 Foul Holme (Circular) Closed
HU060 Humber 3A / Clay Huts / Buoy 11A Open
HU080 Humber 1A / MiddleShoal Open
HU081 North Sunk / SDC Window Site ‘B’ Open
HU082 SDC Window Site ‘C’ Open
HU083 SDC Window Site ‘A’ Open
HU090 Humber 2 / Burcom Sand / Burcom Middle Open
HU091 Humber 2 Extension A Disused
HU092 Humber 2 Extension B Closed
HU093 Humber 2 Extension C Closed
HU109 Bull Sand Fort Extension Open
HU110 Humber 1 / Haile Channel Closed
HU111 Bull Sand Fort Open
HU112 Pyewipe Channel Open
HU162 North Killingholme Cargo Haven Open
HU201 Conoco Pipeline Trench Open
- Foul Holme Spit - Capital Works Beneficial Use Site
(IOH) Closed
- Clay Huts Capital Site - Capital Works Beneficial Use
Site (IOH) Open
- Albert Dock Pipeline (Hull) Open
- Holme RidgeBuoy Proposed
Of the disposal locations detailed in Table 4.5, only a small proportion are currently used for
maintenance dredging purposes by ABP and non-ABP (third party) organisations within the
Humber, for which a FEPA/Marine licence is required for the disposal of material at these sites.
Details of these disposal sites are given in the subsequent sections, along with the disposal
returns for maintenance dredging as recorded in the Disposal at Sea (DAS) database (available
from Cefas), shown in Table 4.6.

35
(1) Humber 1A / Middle Shoal (HU080)
The Humber 1A/Middle Shoal (HU080) disposal site is located immediately to the south of the
SDC in the Outer Humber Estuary (seen in the Annex, Figure 4.1). This deposit site was licensed
for the first time in the early 1970s and has received nearly all of the maintenance material
dredged from SDC, except for some of the early years of the channel.
The proximity of the deposit site improves the efficiency of dredging despite the greater potential
for sediment directly returning to the channel than disposal further from the site. In effect, the
sediment is displaced laterally by the dredging processes and thereby minimising any impact on
the sediment dynamics of the estuary. Occasionally cargoes from Immingham and Grimsby will
be deposited at the Humber 1A disposal site when in transit between the various dredge
locations.
Table 4.6 indentifies the disposal records for Humber 1A, as taken from the DAS database, for the
period 1986 to 2010. The peak amount being disposed at this site occurred in 1997, when around
8.95 million wet tonnes of material was disposed. The average yearly amount of material being
disposed at this site for this 25-year period is approximately 3.87 million wet tonnes, of which the
majority has originated from the SDC.
(2) Humber 2 / Burcom Sand (HU090)
The Humber 2/Burcom Sand (HU090) disposal site is situated on the edge of Burcom Sand,
approximately 1nm (nautical mile) north of Grimsby Docks (seen in the Annex, Figure 4.1). The
site has been used for in excess of 100 years, predominantly receiving material dredged from the
Grimsby Docks system. The peak amount of material disposed at the site for a 25-year period
(between 1986 and 2010) occurred in 1996, when some 917,795 wet tonnes of material was
disposed (see Table 4.6). Over this same period, the average annual disposal amount was
approximately 633,615 wet tonnes.
(3) Humber 3A / Clay Huts (HU060)
The Humber 3A/Clay Huts (HU060) disposal site is situated just off Immingham Dock, adjacent to
Clay Huts and Holme Ridge in the river (see in the Annex, Figure 4.2). This site is mainly used for
material arising from the dredging of the enclosed Immingham Dock, plus its entrance and
riverside berths, from the terminals at Immingham and South Killingholme and any requirement
from the Humber Sea Terminal at North Killingholme. Occasionally, dredged material from
Saltend will also be deposited at the site if dredging is required on neap tides when the Hull
disposal sites (HU030 and HU020) are inaccessible, or where the dredger is in transit between
dredge locations.
Table 4.6 indentifies the disposal records for Humber 3A, as taken from the DAS database, for the
period 1986 to 2010. The peak amount being disposed at this site occurred in 2008, when around
8.21 million wet tonnes of material was disposed. The average yearly amount of material being
disposed at this site for this 25-year period is approximately 3.15 million wet tonnes.
(4) Humber 4B / Hook and Extension (HU020 & HU021) and Humber 4 (HU030)
The Humber 4B/Hook (HU020), Humber 4B/Hook Extension (HU021) and Humber 4 (HU030)
disposal sites are located adjacent to Hull Docks, as shown in the Annex, Figure 4.3. The majority
36
of material deposited at these three sites comes predominantly from the various docks and dock
entrances at Hull, River Terminal 1 and the berths at Saltend. The same sites are used should any
dredging be required from non-ABP (third party) jetties and wharves in the area of Hull. It should
be noted that the Humber 4B Extension disposal site was both characterised and used for dredge
disposal for the first time during 2010.
The peak amount of material disposed at the Humber 4B and Humber 4 sites for a 25-year period
(between 1986 and 2010) occurred in 1996 and 1999, respectively, when some 3.74 and 2.01
million wet tonnes of material was disposed (see Table 4.6). Over this same period, the average
annual disposal amount at each site was approximately 1.22 and 1.07 million wet tonnes
respectively. With regards to the recently opened Humber 4B Extension disposal site, circa
30,000 tonnes of material was disposed during 2010. It is also worth highlighting that there has
been a marked decline in the dredge and disposal requirement at Hull since 1996.

37
Table 4.6: Summary of DAS records for maintenance dredging returns at relevant Humber disposal sites (wet tonnes)
Disposal Site 1986 1987 1988 1989 1990 1991 1992 1993 1994
HU020 1,241,897 2,003,313 1,983,780 2,673,175 2,871,865 2,154,130 2,907,866 1,784,060 1,569,023
HU021 - - - - - - - - -
HU030 1,222,536 1,536,421 205,360 196,990 249,730 99,580 24,000 20,930 1,866,497
HU040 74,210 63,035 54,420 78,890 52,240 49,715 41,010 45,890 43,620
HU041 - - - - 19,345 13,880 7,855 6,945 5,740
HU046 - - - - - - - - -
HU060 3,016,875 3,432,605 2,047,285 1,798,265 1,407,085 1,347,612 1,764,605 1,245,246 2,326,894
HU080 3,057,600 2,995,200 5,293,600 6,592,300 0 4,811,300 3,190,200 1,758,640 5,651,604
HU090 776,870 864,350 632,235 612,330 670,455 519,925 740,310 482,740 837,926
Disposal Site 1995 1996 1997 1998 1999 2000 2001 2002 2003
HU020 2,344,045 3,735,181 1,353,613 1,576,273 235,314 331,415 252,833 166,580 141,965
HU021 - - - - - - - - -
HU030 1,146,331 985,788 649,011 848,355 2,009,174 1,828,187 1,289,602 1,343,826 1,543,189
HU040 50,455 55,576 32,425 43,310 38,180 6,575 5,575 0 1,115
HU041 19,255 31,310 17,480 17,385 42,040 6,690 9,720 10,220 33,451
HU046 - - - - - - - - 44,400
HU060 2,030,341 3,010,452 1,697,240 2,371,148 2,993,101 2,547,476 2,388,177 3,336,997 2,768,711
HU080 7,729,597 8,332,745 8,945,818 7,170,342 3,506,220 4,719,030 4,190,217 4,241,355 7,307,587
HU090 483,480 917,795 462,266 676,375 809,118 639,142 713,975 708,221 423,099
Disposal Site 2004 2005 2006 2007 2008 2009 2010 2011 2012
HU020 264,945 197,235 216,905 156,460 114,390 127,685 84,851
HU021 - - - - - - 30,076
HU030 1,472,404 1,635,917 1,594,512 1,620,639 1,624,536 679,197 980,214
HU040 3,345 15,565 10,035 10,105 3,380 5,765 2,230
HU041 18,500 21,855 14,565 28,125 8,305 17,010 5,725
HU046 29,600 0 0 0 0 0 -
HU060 3,799,975 3,935,056 4,483,622 7,298,446 8,213,693 4,851,564 4,566,517
HU080 4,366,425 2,485,842 448,446 0 0 0 30,536
HU090 681,309 610,857 626,677 682,177 559,482 316,251 393,019

38
(5) Whitgift Bight (HU040) and Goole Reach (HU041)
The Whitgift Bight (HU040) and Goole Reach (HU041) disposal sites are located in the River Ouse (see
Annex, Figure 4.4), on the approaches to Goole, and are used solely for the disposal of material
dredged from the Goole Docks and lock entrances. Disposal of material dredged from Goole Docks is
permitted anywhere within the designated boundaries of the two disposal sites.
The peak amount of material disposed at the Whitgift Bight site for a 25-year period (between 1986
and 2010) occurred in 1989, when some 78,890 wet tonnes of material was disposed (see Table 4.6).
Over this same period, the average annual disposal amount was approximately 31,467 wet tonnes.
In comparison, the peak amount of material disposed at the Goole Reach site between 1990 and
2010 occurred in 1999, a value of 42,040 wet tonnes. Over this 21-year period, the annual disposal
amount was around 14,216 wet tonnes. The combination of these values would therefore suggest
that the long-term average yearly dredge/disposal amount for the Goole Dock system is in the region
of 45,683 wet tonnes.
(6) Pipeline disposal Hull
In addition to the disposal sites mentioned above, there are two disposal pipelines located within the
Humber; one is located in Alexandra Dock (HU025) and the other in Albert Dock, Hull. The exact
locations of these pipelines are shown in the Annex, Figure 4.3.
The pipelines were installed in both docks in order to improve the efficiency of the dredging
operation. Due to the fact that the docks are not impounded, the fixed pipelines reduce dredger
transits, which assist in maintaining the dock water level and reduce the ingress of sediment. By
using the pipelines, a TSHD dredger can undertake dredging within the docks, then as opposed to
negotiating the lock, they can simply hook up the pipeline and pump the dredged material out into
the estuary over the dock wall (into the strong tidal flows). However, although the Albert Dock
pipeline is still currently being used, the pipeline at Alexandra Dock is now closed.
Dredging Methods
Trailer Suction Hopper Dredging: TSHD uses suction to raise loosened material from the bed through
a pipe connected to a centrifugal pump. Suction alone is normally sufficient for naturally loose
material, such as recently deposed material within deepened areas such as the approach channel or
berthing areas. TSHD is most efficient when working with fine substrates such as mud, silt, sand and
loose gravel as the material can be easily held in suspension. Coarser materials can also be dredged
using this method, but with a greater demand on pump power and with greater wear on pumps and
pipes. Material dredged by TSHD then requires depositing either within a licensed sea or land
disposal site usually by direct bottom dumping (at sea) or through pumped discharge (to a land
disposal or beneficial use site).
Grab Hopper Dredging: A GHD is a vessel which has one or more dredging cranes mounted around a
receiving hopper. The cranes are fitted with grabs that pick up material from the seabed, and
discharge the material into the hopper. GHD are usually held in position while working by anchors
and moorings but a few are fitted with a spuds, or piles, which can be dropped onto the seabed
whilst the dredger is operating. Once loaded, the vessel moves to a disposal site to discharge
material, which is normally achieved through direct placement at the site by direct bottom dumping.
39
Water Injection Dredging: WID consists of injecting large amounts of water at low pressure into
surface sediments on the seabed. This generates a high density layer on the seabed, normally being
a maximum of 1.0m deep, with the highest density part of the cloud being 0.5m above the bed. The
density cloud acts as a fluid layer and flows over the bed through the action of gravity along the
seabed contours. The aim of this form of dredging is not to suspend sediments within the water
column, but rather to move sediments from one area to another, and thus keep the sediment within
the system. Some re-suspension of fine sediment fractions often occurs locally to the WID site, or
where tidal flows are higher thereby mobilising material. If the density cloud flows over a
pronounced change in bed gradient, material also has the potential to be re-suspended.
Plough Dredging (Bed Levelling): Plough dredging utilises a tug equipped with a plough unit. The
plough is lowered to a predetermined depth and is used to drag sediment along the seabed.
Ploughing is typically used in confined areas due to the small size and manoeuvrability of the vessel,
moving material from inaccessible areas such as dock entrances, corners or complicated areas of
bathymetry to areas accessible by TSHD or WID vessels, or is used for bed-levelling purposes only. As
with WID, ploughing should not typically lead to significant re-suspension of sediment in to the upper
water column, but if the sediment ploughed is soft it may be sufficiently disturbed to raise smaller
sediment fractions into suspension.
4.2.2 Deposition of sediments at the North Sea
This practice is not carried out on the Humber Estuary.
4.3 Land Treatment of Sediments
This practice is not carried out on the Humber Estuary.

40
5 Strategies for dredging
5.1 General aspects
Few cost effective beneficial uses have been identified to date due to the nature of much of the
material arising from maintenance dredging in the Humber Estuary, which predominantly consist of
coarse to fine silts, of which the remainder is mostly fine sand mixed with silt. When there is a
maintenance requirement in the SDC (see Table 4.1), well sorted sand of 120-180 microns is dredged
from the south side of SDC.
In the past some sand has been used as general fill for reclamation or foundation material for
construction works within the river, even though not of ideal quality. It is considered that when
dredging of this material is required, this could represent a resource for general fill material that
could be used within the estuary. In general, the material is too fine for beach nourishment
purposes. ABP will continually look to use a proportion of this material wherever possible to reduce
the need of using a more valuable natural resource, therefore minimising any environmental impacts
when considered on a wider, more holistic basis, whilst also taking account of maintaining the
sediment budget of the estuary.
One of the main concerns relating to maintenance dredging is the loss of fine material
(predominantly silts) from estuaries due to disposal sites outside of the system, therefore depleting
material that could potentially contribute to accretion of the intertidal areas within the estuary. In
the case of the Humber Estuary, fine maintenance dredge material is deposited within the estuary
system which prevents direct material loss. The disposal of material from the docks nearby in the
estuary returns the material which has become cut off from the dynamics of the sedimentary system.
The disposal of material from SDC is relocated adjacent to the channel in a similar flow environment,
thus minimising any additional indirect loss from the estuary that may occur.
Deposit grounds within the Humber Estuary are all located as near as practically possible to the areas
where dredging takes place; thus relocation in terms of distance is minimised. The deposited
sediments are rapidly dispersed into the tidal flow joining the fine sediments that are already in
suspension and pass in and out of the estuary on every tide. Modelling by both Delft Hydraulics
(2004) and ABPmer (2004b) indicates that a proportion of the relocated sediments move out of the
estuary and therefore could represent a small risk of loss. However, these models do not take into
account:
• Recirculation back to the estuary, which almost certainly occurs;
• Background concentrations which will influence the transport and settling of material; and
• If the material did not settle in the docks or channel it would pass through the estuary, the
same as the relocated sediment. This suggests that considerable care is required in analysing
the results of modelling and in general, modelling will lead to an overestimation of the loss of
sediment. Also, the total annual maintenance dredging is approximately equivalent to the
amount of sediment in the estuary on a spring tide, therefore the sediment relocated
represents less than 0.2% of the suspended sediment in the estuary over a year.

41
Surveys of the deposit grounds over the last century indicate that most (if not all) of the deposited
fine silts have been dispersed throughout the system. Modelling of the dispersal from the deposit
grounds indicates that the material relocated in these areas contributes to the sediment supply of
the intertidal areas throughout the estuary. Also as no significant change in the bathymetry has
occurred, the disposals have not changed the local hydrodynamics. This type of disposal of fine
material has been called sediment cell maintenance (sustainable relocation), which is considered to
be beneficial to the system compared to removal of fine silt sized sediment to land or taken out to
sea into a different sediment system.
Modelling the size distribution of sediments throughout the estuary indicates that the removal of
coarser, sand material from the outer estuary for beneficial use, as described above, is unlikely to
significantly affect the estuary system. This is due to the volumes involved being small compared
with the large volumes of change that occur annually within the outer estuary and the fact that the
size of the material makes little overall contribution to the build up of the intertidal areas within the
estuary.
The existing maintenance dredging is long established and the estuary morphology is working
towards a dynamic equilibrium with this process. Work on the entropy of the system suggests that
any changes could be in the order of 350 years to come to equilibrium. If this is correct, then the
estuary is still changing from the significant reclamation and other work in previous centuries. The
system is therefore not in a stationary state. In this respect the dredging is so small in context to the
scale of the estuary system that any response signal will be difficult to detect. At present there is no
evidence that any part of the estuary is starved of sediment or that continuation of the current
disposal practices or the associated small scale beneficial use of a proportion of the coarser sediment
are likely to significantly modify the existing morphology of the estuary, which has adapted to these
activities over many decades.
As part of the licensing process, ABP also actively seek, by consultation wherever possible, to find a
beneficial use for the maintenance dredged material taken from the Humber. The bodies consulted
include:
• Environment Agency;
• East Riding District Council;
• East Lindsey District Council;
• North Lincolnshire Council; and
• North East Lincolnshire Council.
5.2 Capital dredging of fairways
In the context of the Humber Estuary, the only “fairway” that ABP maintain is the SDC. This was
capital dredged in 1969 and has been maintained at its current depth of 8.8m chart datum since.
Maintenance dredging is carried out on an Ad Hoc basis. It is hard to say whether any avoidance of
maintenance dredging was considered in the process but even at present, it is almost impossible to
predict how much maintenance dredging will be required. This is because of the Humber Estuary’s
dynamics and high turbidity content.

42
5.3 Maintenance dredging of fairways
Maintenance dredging is carried out on an Ad Hoc basis. ABP place the clay dredged material at the
SDC windows to primarily fill natural depressions and level out the estuary bed, but it can also act as
a training wall to the SDC and encourage scour.
Maintenance dredging of the SDC is not constrained by tide. The only constraint is that the dredging
activities must avoid commercial vessels who need to use the channel to reach the ports.
With regards to special features, ABP have to take into consideration the designated species and
features, which is the purpose of the Maintenance Dredge Baseline Document. This is to be reviewed
when a new project is consented and constructed. This document take assesses the baseline activity
against all of the designations.
5.4 Maintenance dredging of harbours (open)
In the context of the Humber Estuary, the term “harbour” has been understood to mean “port”.
The general strategy of maintenance dredging is outlined in the Baseline Document (ABP 2012), and
the primary reasons are given here in section 5.1. Again, maintenance dredging is carried out on an
ad hoc basis and it is impossible to design out future maintenance dredging activities due to the high
turbidity of the Humber, however, on the rare occasion that shipping activity is greatly reduced, ABP
have not opened the lock gates so as to prevent further sediment laden water entering the docks.
Maintenance dredging is not constrained by tide. The only constraint is that the dredging activities
must avoid commercial vessels which need to reach the ports
With regards to special features, ABP have to take into consideration the designated species and
features, which is the purpose of the Maintenance Dredge Baseline Document (ABP 2012). This has
to be reviewed when a new project is consented and constructed. This document take assesses the
baseline activity against all of the designations
5.5 Placement in open water
General approach
The main reasons why dredged material is disposed of within the estuary being:
1. for sedimentary budget reasons. Humber Estuary Services (HES) aim to deposit the sediment
back to it’s place of origin.
2. sites are based on a like for like basis i.e. sandy dredged material is placed in a location that is
predominantly sand

43
3. for economic and resource reasons. Aim is to keep sediment away from the dredged areas
but not too far away so as to mean that there is more time spent steaming than dredging/
dumping of the material.
4. aid to intertidal
5. minimal change to the estuary bed levels
6. minimal change to designated features; and
7. to dispose of the material evenly over an area to avoid smothering of benthic organisms.
Use of dredged sediments for re-establishing habitats or hydro-engineering
The sediment is primarily deposited based on the criteria given above, namely sediment budget, like
for like basis and economic reasons. Dredged material has not been used for the re-establishment of
habitats at an intertidal level due to the high accretion levels from the Humber’s high turbidity.
Placing dredged material on these areas would potentially facilitate the development of the mudflats
to saltmarsh and eventually terrestrial habitat.
The placement of dredged material has been used for hydro-engineering purposes but not
extensively. The SDC windows for example were identified because they were natural depressions
and by depositing material here it would level out the estuary bed. The deposition of material here
would have a secondary beneficial effect of acting as a training wall to direct the SDC.
The Bull Sand Fort disposal sites were temporary disposal sites for clay to reduce natural scour that
occurred around the base. The material for this was taken from primarily SDC dredging but also
others.
Placement time, e.g. dependant on tidal phase, current velocities and/or season
This practice is not carried out for maintenance dredge disposal due to operational restriction.
Special aspects referring to ecology/water quality/habitats and species protection
The focus of protecting the estuarine habitat is to ensure that the sediment budget remains within
the estuary to protect the estuarine ecosystem by not altering the dynamics etc and therefore
ensuring the other designated features are not affected. The assessment of maintenance dredging
on the designated features is given in the Baseline Document.
Water quality of the Humber Estuary is monitored by Cefas. When a new application is submitted,
the sediment must be tested for contaminants etc to determine if consent should be granted and the
best course of action. Additional sampling and testing may be required if the Marine Licenses have
special conditions requiring sampling at more often intervals if there is a concern over an area.
44
5.6 Land treatments, Confined disposal facility (CDF), alternative
utilization
This practice is not carried out on Humber.

45
6 References
ABP Humber Estuary Services. 2012. “Humber Estuary: Maintenance Dredge Protocol and Water Framework Directive
Compliance Baseline Document. R1872.
ABP. 2011. Green Port Hull. D136322. Environmental Statement: Non Technical Summary. November
2011. URS
Humber Estuary Services. 2012. http://www.humber.com/
46
Annex
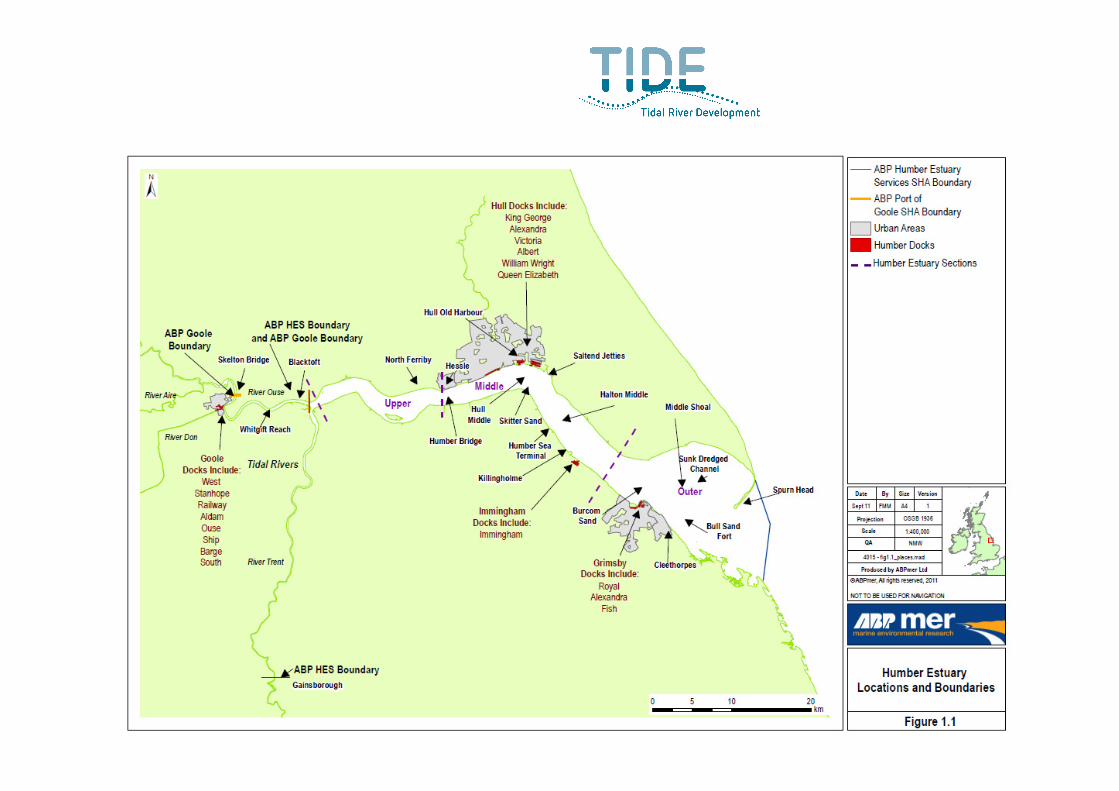
47

48
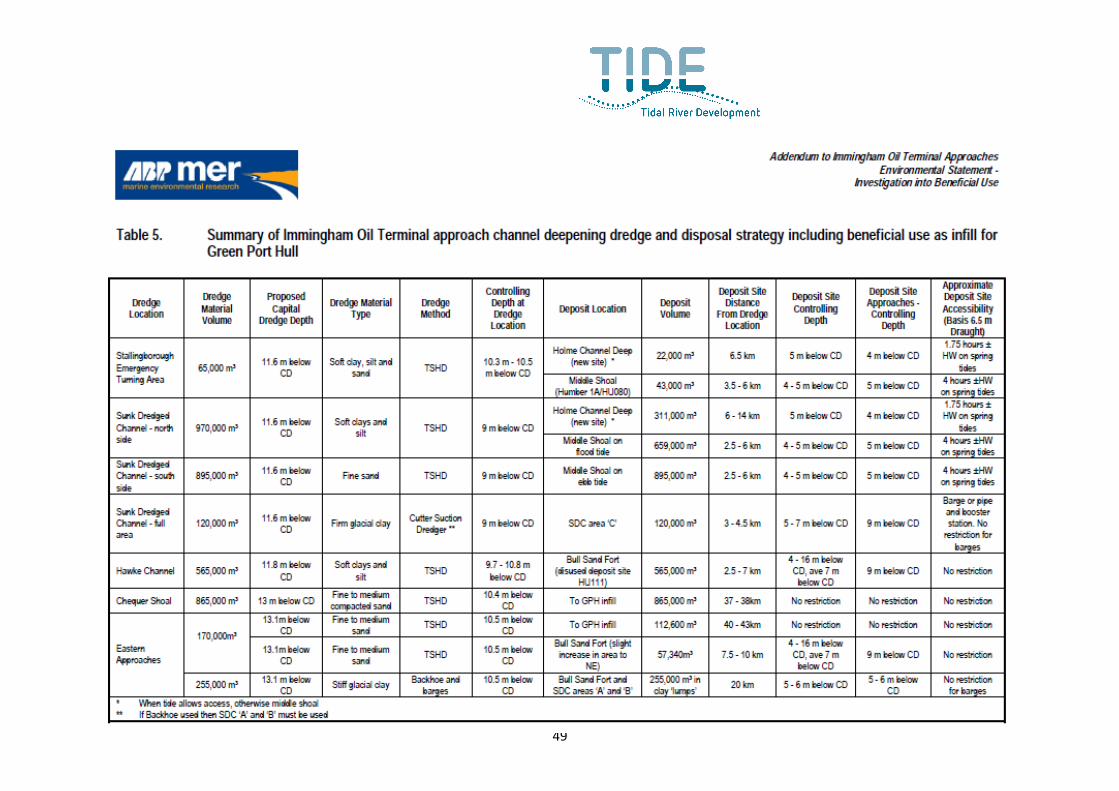
49
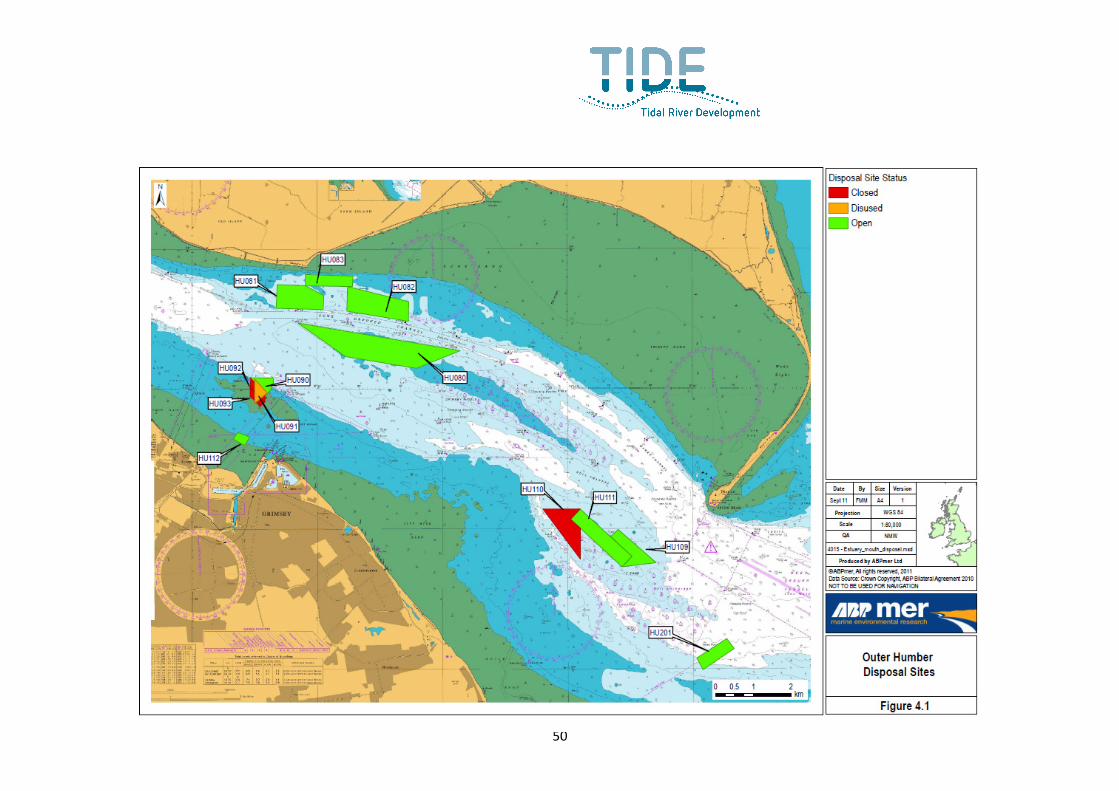
50

51

52
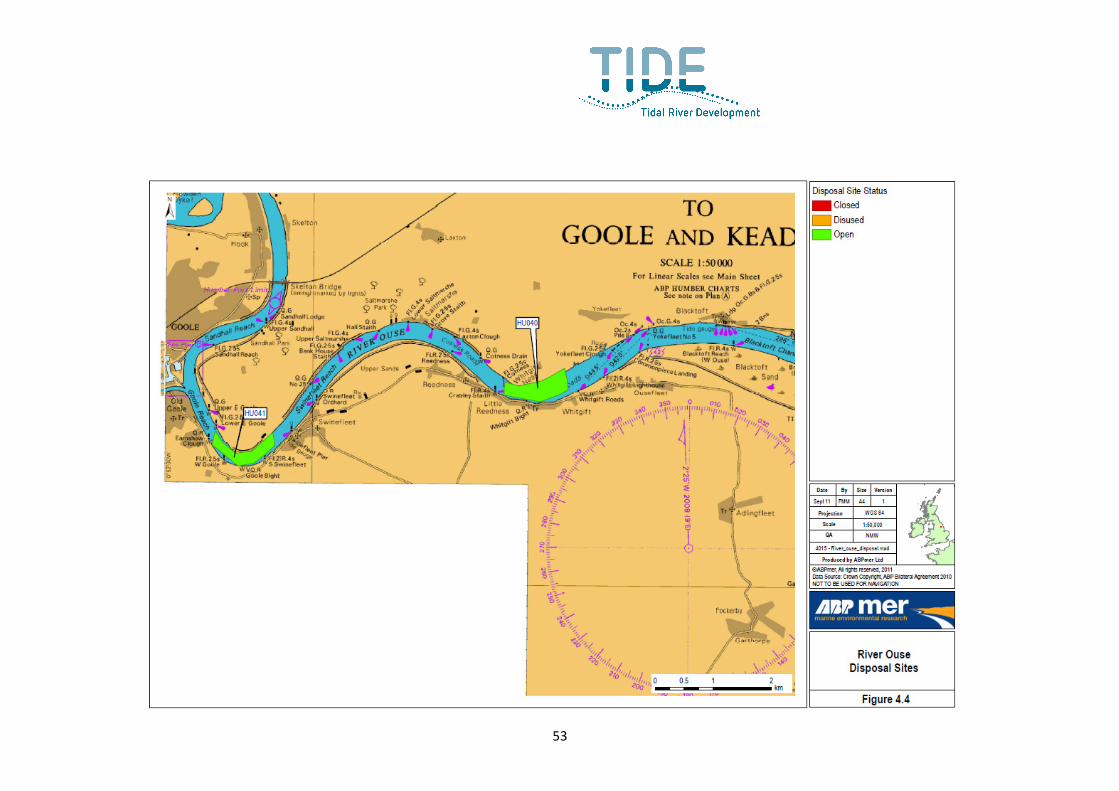
53

54
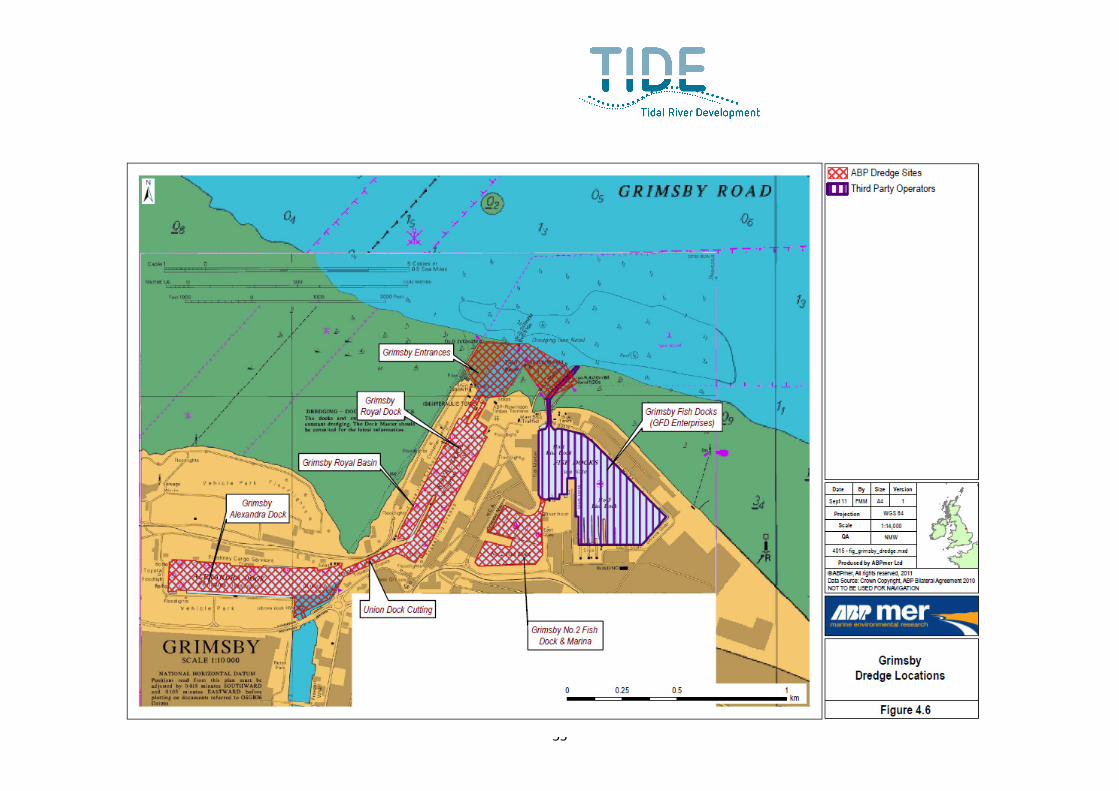
55
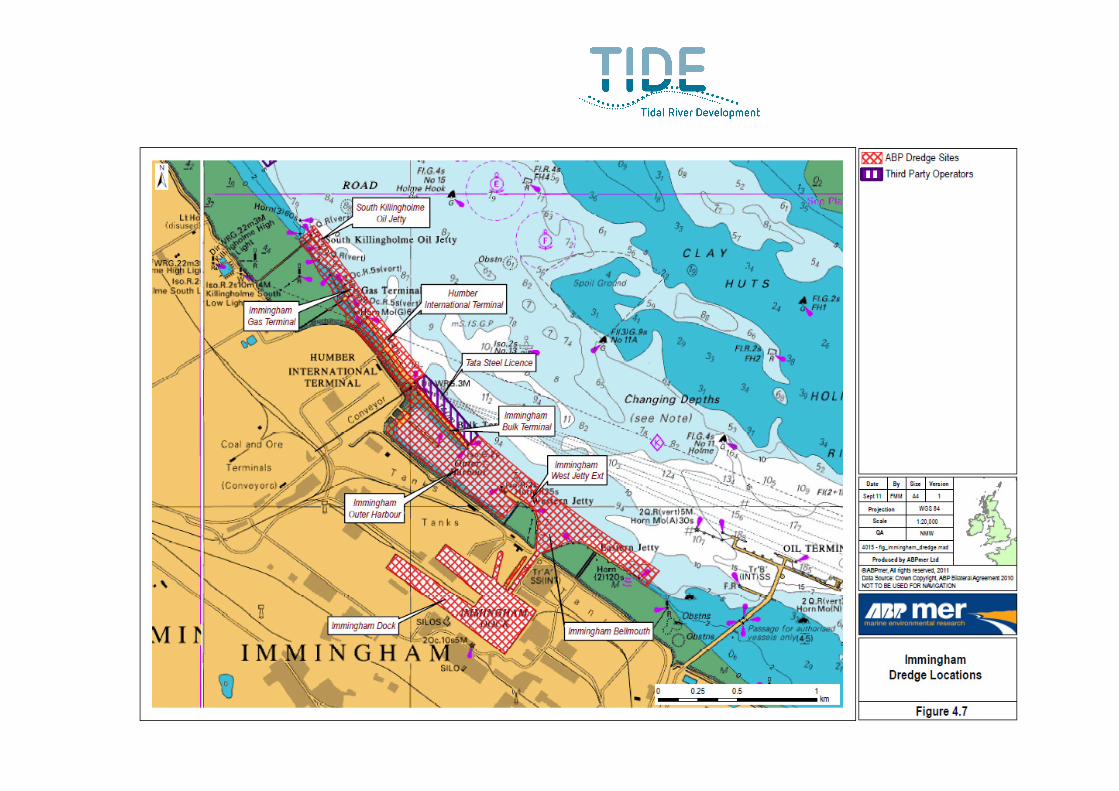
56
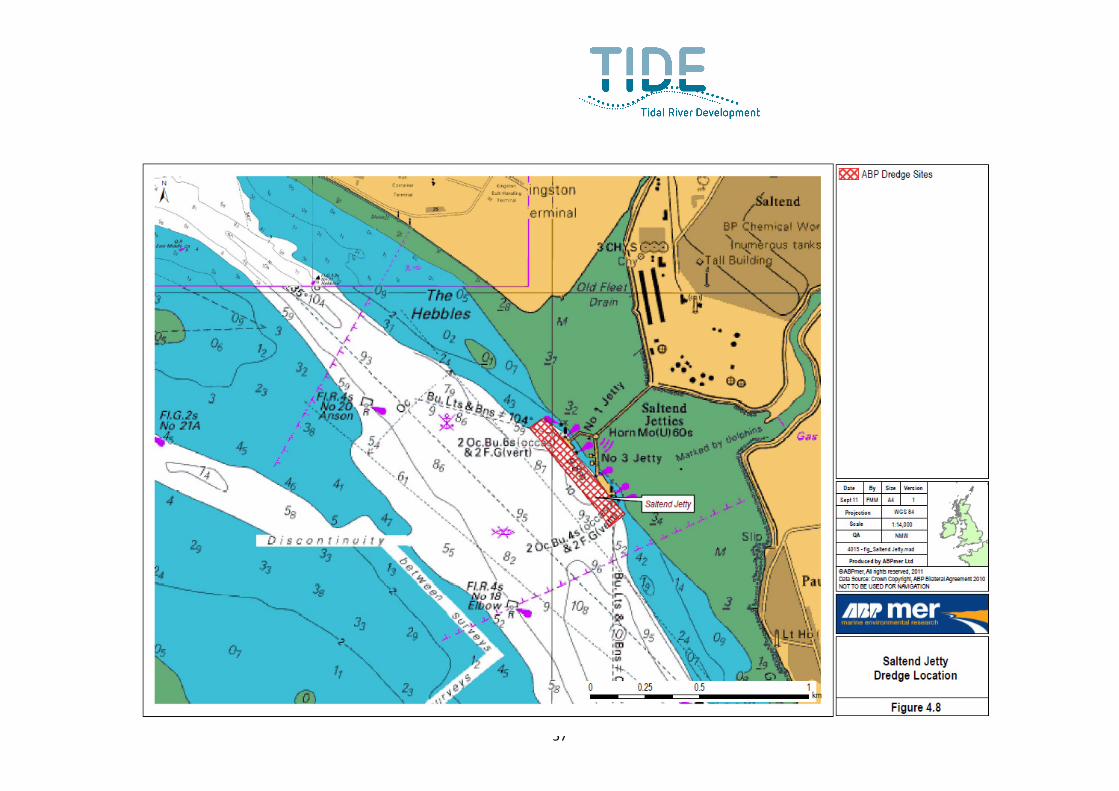
57
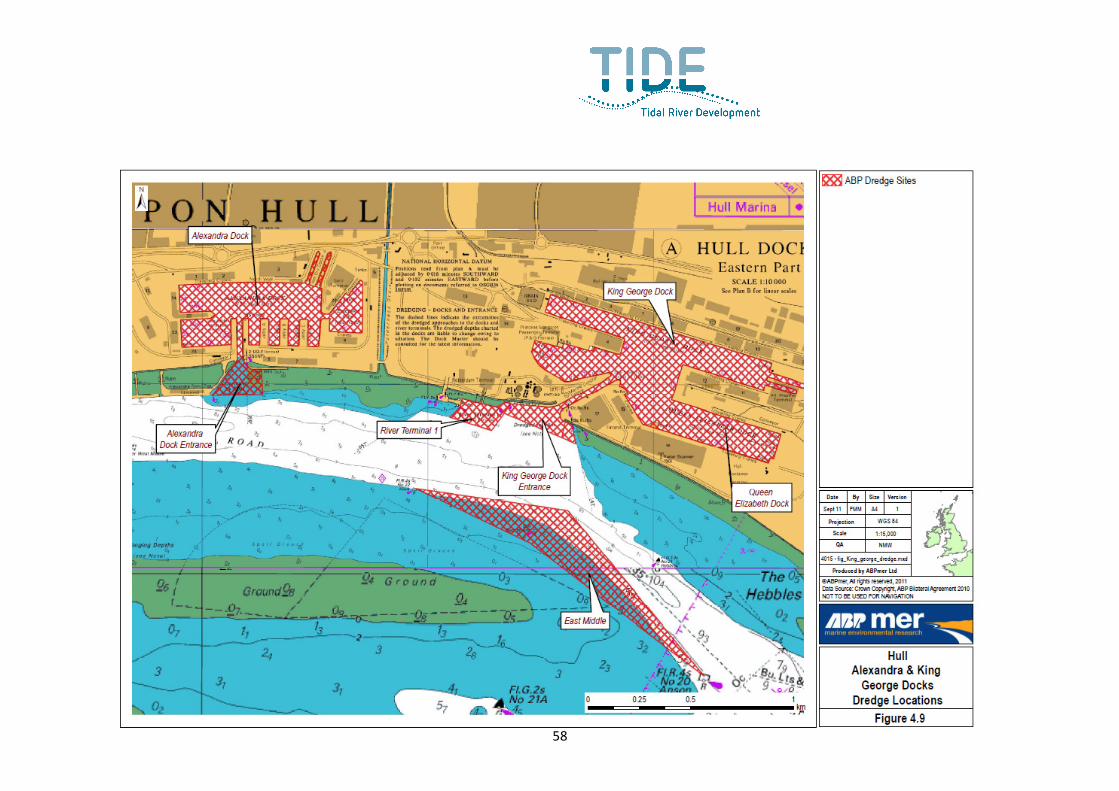
58

59

60

61

62