huntingdonshire strategic assessment 2011... · community safety partnership to carryout the...
TRANSCRIPT

Huntingdonshire Strategic Assessment 2011
An analysis of community safety issues
Draft Report Version 3.1 (Please note this version is an advanced draft for limited circulation only)
Produced by the Research & Performance Team of LGSS and Commissioned by
Huntingdonshire Community Safety Partnership

Notes
This report has been produced by the Research & Performance Team of LGSS. LGSS is a joint services arrangement between Cambridgeshire and
Northamptonshire County Councils. For further information about the team visit http://www.cambridgeshire.gov.uk/business/research/
The lead authors of this report are Leigh Roberts and Michael Soper and we
can also be contacted on: [email protected]
This report was commissioned by
Huntingdonshire Community Safety Partnership
Acknowledgements We would also like to acknowledge the considerable support and assistance
with developing this report of: Claudia Deeth, Huntingdonshire District Council
Tina Le, Cambridgeshire County Council Brin Hodgkiss and Mark Buckingham both of Cambridgeshire Constabulary and also all those in local agencies who supplied the research team with
team data and other contextual information.
About Huntingdonshire Community Safety Partnership Huntingdonshire Community Safety Partnership was set up in response to the Crime and Disorder Act 1998 and aims to tackle crime, disorder and anti-social behaviour through the close partnership working of a wide range of organisations such as: District Council, Police, County Council (including Youth Offending Service and Probation), Fire Service, NHS Cambridgeshire, Luminus Group, Addaction, Crown Prosecution Service, Dial Drug Link, Huntingdonshire Accent Nene Housing Association, Cambridgeshire Drug and Alcohol Action Team (DAAT) and the Children and Young Peoples Service. The Partnership also has close links with a number of countywide groups such as the Violent Crime Working Group; Domestic Violence Forum; Open Out Scheme (Racial and Hate Crime) and Huntingdonshire Business Against Crime, as well as many other groups working towards reducing crime and anti-social behaviour. The Huntingdonshire Community Safety Partnership is supported the Community Safety team employed by Huntingdonshire District Council. Tel: 01480 388388. About Huntingdonshire Huntingdonshire is the disitrict with the largest population in the county of Cambridgeshire. The Cambridgeshire County Council Research & Performance Group (CCCRPG) mid-2010 population estimate for Huntingdonshire is 165,300. The population has increased by 5% since 2001 and it is forecast to increase by a further 7% by 2031. It is of note that Huntingdonshire has the highest proportion of its residents aged 40-64 of all the districts. In future, its age structure is forecast to age, with all age groups younger than 64 decreasing as proportions of total population and all older age groups increasing. In terms of local economy, 80% of Huntingdonshire’s working age population is economically active. In December 2010 the Jobseekers’ Allowance claimant count unemployment rate was 2% compared to a national level of 3.5%. Huntingdonshire has the second lowest average house price in the county. Between Jun-Nov 2002 and Jun-Nov 2010 house prices increased by 84%. Over the last five years the percentage of pupils gaining 5 or more A*-C grades in Huntingdonshire has increased from 59% to 75%. Life expectancy at birth is higher in Huntingdonshire than in England. The difference is statistically significant for both males and females. Females are expected to live 4 years longer than men. Huntingdonshire has the third lowest levels of overall mortality in Cambridgeshire. The most common causes of premature deaths are circulatory diseases and cancer.

Index Executive Summary .........................................................................................................7
Scanning...................................................................................................................... 7 Analysis and Recommendations.................................................................................. 7
Domestic Violence ....................................................................................................7 Anti-Social Behaviour ................................................................................................8 Alcohol Related Violence ..........................................................................................8 Adult Offending .........................................................................................................8 Young People as Offenders ......................................................................................9
Introduction ................................................................................................................ 10 Purpose...................................................................................................................10 Methodology............................................................................................................10 Challenges ..............................................................................................................10 Introduction .............................................................................................................12 Priority Topics .........................................................................................................12 Issues Identified as Secondary after the Scanning Process....................................13
Analysis ..........................................................................................................................16 Domestic Violence in Huntingdonshire ...................................................................... 16
Data Sources ..........................................................................................................16 The Scale of Domestic Violence .............................................................................16 The nature of domestic violence – A link with deprivation.......................................17 Other Factors Associated with Domestic Violence..................................................18 Cost of Domestic Violence ......................................................................................20 Location of Domestic Violence ................................................................................21 Domestic Violence - Discussion and recommendations..........................................21 Scale of the problem ...............................................................................................22 Location of the Problem ..........................................................................................23 Nature of problem ...................................................................................................23 Vulnerable Adults ....................................................................................................25 Children & Young People’s experiences of ASB .....................................................26 Wider victimisation of children and young people ...................................................27 Tackling the Problem – Partnership Progress .........................................................28 Discussion and recommendations: .........................................................................29
Alcohol-related violence............................................................................................. 30 Scale of the Problem...............................................................................................30 Nature of the Problem .............................................................................................31 Profile of Pub Cluster Violence................................................................................31 Victim profile............................................................................................................33 Offender profile .......................................................................................................34 Tackling the Problem...............................................................................................34
Adult Offending .......................................................................................................... 36 Profile of adult offenders .........................................................................................36 Offending and Mental Health...................................................................................37 Offending and Substance Misuse ...........................................................................37 Tackling the problem...............................................................................................38

Other Substance Misuse issues..............................................................................39 Discussion and Recommendations .........................................................................39 Offending Profile .....................................................................................................41 Young People Offending for the first time................................................................41 The Causes of Offending Amongst Young People..................................................43 Discussion and Recommendations .........................................................................45
Appendices.....................................................................................................................46 Appendix 1: Methodology .......................................................................................... 46
Structure..................................................................................................................46 Appendix 2: Summary of Data Sources & Technical Notes....................................... 47
Data Sources ..........................................................................................................47 Technical Notes on Analysis ...................................................................................49
Appendix 3: Additional Scanning Data Tables ........................................................... 51 Understanding the level of seriousness of Domestic Violence ................................52
Appendix 4: DIP Case Study ..................................................................................... 58 Appendix 5: Constabulary Risk Matrix ....................................................................... 59
List of Tables Table 1: Topic requiring further analysis ........................................................................12 Table 2: Recent crime trends for St. Neots ....................................................................15 Table 3: A Brief profile of identified domestic violence offenders ...................................20 Table 4: Research Development & Statistics Directorate typology of anti-social behaviour18.....................................................................................................................22 Table 5: Comparison of ASB reporting...........................................................................23 Table 6: Categorisation of ASB by harm and frequency for Huntingdonshire ................24 Table 7: Long term trend in violent crime .......................................................................30 Table 8: Comparison of Cambridgeshire Pub Clusters ..................................................32 Table 9: Identified need for Huntingdonshire probation clients.......................................36 Table 10: the most frequent offences committed by young people in Huntingdonshire..41 Table 11: Long Term Trend in Arson..............................................................................51 Table 12: Violent offences within the ‘pub clusters’ of Huntingdon.................................51 Table 13: The relative seriousness of domestic violence in Huntingdonshire ................52 List of Maps Map 1: Rates of Anti-Social Behaviour...........................................................................23 Map 2: Violent offences within Huntingdon Town Centre location and day/time ............33 Map 3: Rate of First Time Entrants to the Criminal Justice System................................42 Map 4: Police Recorded Domestic Violence Incidents ...................................................56 Map 5: Rate of Episodes of Exclusion for Primary Schools............................................57 List of Charts

Chart 1: Police recorded domestic violence incidents ....................................................16 Chart 2: The association between domestic violence and deprivation ...........................17 Chart 3: Association between domestic violence and different types of referral.............18 Chart 4: Comparison of the relative size of age groups between known and expected victims of domestic violence ...........................................................................................19 Chart 5: Proportion of costs to public services ...............................................................20 Chart 6: Trends in police recorded ASB .........................................................................22 Chart 7 : Rates of child (aged 10-15) victimisation by ward, Sept 2010 to Aug 2011 .....27 Chart 8: long term trend for assault less serious injury...................................................30 Chart 9: Typography of violent offences within Huntingdonshire....................................31 Chart 10: Victim age profile for the Huntingdon Pub Cluster ..........................................33 Chart 11: Age profile of offenders for offences within the Huntingdon pub cluster .........34 Chart 12: Proportion of probation clients by tier .............................................................36 Chart 13: The Rate per 1000 child referrals to children’s social care services ...............44 Chart 14: Rates of child (aged 10-15) offending by ward, Sept 2010 to Aug 2011.........44 Chart 15: Monthly trend of dwelling burglary in Huntingdonshire ...................................51

Executive Summary • The Research & Performance Team - LGSS1 was commissioned by Huntingdonshire
Community Safety Partnership to carryout the partnership’s annual assessment of crime, anti-social behaviour and offending. The purpose of the assessment is to enable the partnership to set its strategic priorities (the crime or anti-social behaviour issues we are going to tackle) for the next 12 months.
• The process followed matches national guidance and includes a scanning phase to identify
the issues we will look at in detailed followed by a report and recommendations based on the analysis. Due to the challenges with producing the strategic assessments we’ve made the following recommendation.
RECOMMENDATION ONE: The partnership adopts a concept of ‘rolling assessment’ where the assessment document is regularly updated as part of an on-going programme of analysis to support current actions. An improvement plan is agreed a year in advance for enhancing data sources. Within this data sharing becomes an ongoing process rather than a yearly occurrence.
Scanning
• The scanning phase was completed in August 2011; a summary is included in this document.
Analysis and Recommendations
Domestic Violence
RECOMMENDATION TWO: We need awareness that the police recorded domestic violence incident rate in Huntingdonshire is no longer increasing. Now, changes in the figures have tended to only be short term. There are some geographical areas where possible under-reporting has been estimated and HCSP is recommended to consider focusing awareness raising activity in these areas; as well as within newly built social housing. It has been noted that younger women (those aged 16+) are not as well represented within current caseloads as expected therefore awareness could be targeted at this group. RECOMMENDATION THREE: The profile of victims supports the recommendation that there needs to be an assessment of how to reach and provide services to people of diverse backgrounds suffering from domestic violence both within specialist and main stream services; but there is probably not a need for specialist provision in Huntingdonshire. RECOMMENDATION FOUR: Some domestic violence incidents in Huntingdonshire are judged to be at a medium or high level of seriousness (17). HCSP has had a policy of supporting services that particularly target high risk cases through the MARAC. Future service provision is an area that should be planned. This would be sensible given the risk of domestic violence homicide.
1 LGSS: Local Government Shared Services, a shared service arrangement between Cambridgeshire and Northamptonshire County Councils.
Huntingdonshire Strategic Assessment Page 7 of 59

RECOMMENDATION FIVE: The cost of domestic violence falls heavily upon the NHS. Engagement with NHS partners in the issue of domestic violence and services to support victims is an area of service development. It is recommended that the partnership consider the extent to which the NHS is currently engaged in partnership working. It is worth noting and investigating the lack of referrals to the IDVAS service from health agencies.
Anti-Social Behaviour
RECOMMENDATION SIX: The strategic assessment has identified a possible gap between the number of potential vulnerable victims of ASB and the level of reporting. It is recommended that case reviews for victim-vulnerability are routinely undertaken and recorded. The information collected/assessed can be interrogated in future to identify any potential service gaps. In order for the partnership to focus on this issue there will need to be considerable involvement of County Council Social Care teams and key workers within the NHS. RECOMMENDATION SEVEN: Within Huntingdon North ward we can see a pattern of deprivation, child and family stress and resulting anti-social behaviour by young people. This contributes to the ward being a ‘hotspot’ for anti-social behaviour and other issues such as arson. It is recommended that the partnership invest in projects to actively target young people at risk and divert them away from this behaviour. Some examples of best practice included in the ASB section.
Alcohol Related Violence
RECOMMENDATION EIGHT: Alcohol-related violence should remain a priority for Huntingdonshire for 2012/13 as the current work needs time for real progress to be seen. Huntingdon should remain the priority area for the partnership because of the relatively high rate of alcohol related violence within the pub cluster. The partnership should ensure that it is fully implementing the lessons learnt from successful initiatives carried out elsewhere.
Adult Offending
RECOMMENDATION NINE: To ensure that Lord Bradley’s recommendation: “improved services for prisoners who have a dual diagnosis of mental health and drugs/alcohol problems” is implemented in Cambridgeshire. RECOMMENDATION TEN: To ensure that there is an effective link between Alcohol treatment services and IOM by identify named workers within Alcohol services to link with the scheme. Currently the DIP is only funded to provide support for offenders with Class A drug habit and whilst CARAT (Counseling Assessment Referral Advice and Throughcare) is a drug service that is available in every prison in the UK, there is a gap in alcohol treatment services in many establishments. Therefore, it is important that the offenders with alcohol dependence have sufficient support in prisons and post release. RECOMMENDATION ELEVEN: It is recommended that an evaluation of the effectiveness of IOM during its first year of operation is commissioned.
Huntingdonshire Strategic Assessment Page 8 of 59

Young People as Offenders
• RECOMMENDATION TWELVE: The partnership should consider the strength of initiatives in the district that are aimed to reduced young people offending; particularly covering Huntingdon North Ward. Are we intervening early enough to divert young people away from offending behaviour?
• RECOMMENDATION THIRTEEN: Given the link between young people offending and
Community, Personal and Parenting factors (particularly during early years) it is vital that the partnership considers if the current level of engagement with the partnership by Children’s Services, Children’s Health Services and the Youth Offending Service is sufficient. This is particularly the case given the level of intervention required to reduce the high rate of offending by young people living in Huntingdon North.
Huntingdonshire Strategic Assessment Page 9 of 59

Introduction
Purpose
The purpose of the strategic assessment is to present and interpret a summary of analysis for crime, anti-social behaviour and offending. This is to enable the partnership board to set strategic priorities (the crime or anti-social behaviour issues we are going to tackle) for the next 12 months for Huntingdonshire. The precise duties under which this work is undertaken are laid out in detail within government legislation and guidance2. The structure of the analysis section will follow the 2010 strategic assessment and follow the “Crime Problem Analysis Triangle” (PAT) of victim, offender and location. Underlying data will be made available as a supporting package.
Methodology
The approach used for the strategic assessment follows the SARA model3. After scanning was carried out a meeting was held with key officers for the district where all the areas of concern were agreed for further analysis. A variety of data sources were used in both the scanning and analysis stages. These broadly covered; district ASB data, police recorded crime and incidents, fire service recorded arson, offending data from probation, youth offending service (YOS), Cambridgeshire drug intervention program (CDIP) and prolific and priority offenders (PPO), social care data (including adult services, domestic violence data, child protection services’ and education) health data (including A&E and DAAT4), socioeconomic data and national reports such as the British Crime Survey. See the appendices for precise date source information. The Research and Performance team are uniquely placed in the county to provide analysis of this type. Supported by a range of information sharing agreements, jointly funded posts and collaborative working arrangements. The expertise within the team and close collaboration means we can make clear links with other needs assessments such as, the joint strategic needs assessments in health and housing. The most up-to-date information has been used where available. However, please note that not all data sources will cover the exact same timeframe. Unless otherwise stated the timeframe for the data is the 12 months from September 2010 to August 2011.
Challenges
A key issue that has come to light through this process is that some data sources are shared only once a year, which has a large impact on analytical capacity for the team. Further some of these data sources required cleansing in order to be analysed in-line with multiple data sources, resulting in limiting the time available for analysis and writing. Therefore we have made the following recommendations to support future assessments:
2 Delivering Safer Communities: A guide to effective partnership working, Home Office 2008 3 SARA: Scanning, Analysis, Reaction, Assessment – Herman Goldstein (1979) 4 Drugs and Alcohol Action Team
Huntingdonshire Strategic Assessment Page 10 of 59

RECOMMENDATION ONE: The partnership adopts a concept of ‘rolling assessment’ where the assessment document is regularly updated as part of an on-going programme of timely analysis to support current actions. An improvement plan is agreed for the forthcoming year for enhancing data sources. Within this data sharing becomes an ongoing process rather than a yearly occurrence.
Huntingdonshire Strategic Assessment Page 11 of 59

Scanning
Introduction
The scanning exercise reviewed a range of information sources including a look at current crime trends and the partnership’s performance against a group of similar partnerships5. The process concluded with a meeting of officers from the partnership to agree a focus for the main strategic assessment document.
Scanning Prioritising Analysis
(Of selected topics)
Reporting
(Writing the assessment)
Planning and action
(What are the greatest problems?)
Priority Topics
The topics selected for further analysis and there reasons for selection are shown below in table 1. Table 1: Topic requiring further analysis Topic Reason further analysis is required Domestic Violence
- Highest score on Constabulary risk matrix6 - Repeat referral rate to the IDVAS7 was off target - High risk for victims and family - Current CSP priority
Anti-Social Behaviour
- Current CSP priority - Area of concern for residents
Alcohol Related Violence
- Current priority for the partnership - An increase in violence associated with the night-time economy seen
since last year - Emergency department data recently available and needs
considering - Residents expressed concern in 2010 survey
Offenders - Statuary responsibility for CSP - Impact of not working in partnership to reduce offending could
increase recorded crime - Integrated Offender Management not yet bedded in
Children & young people
- Account for some of the most vulnerable individuals - Early intervention can reduce likelihood of offending
5 Similar Partnerships as defined by the Home Office, see appendix 1 6 See Appendix 3 7 Independent Domestic Violence Advocacy Service.
Huntingdonshire Strategic Assessment Page 12 of 59

Topic Reason further analysis is required
Vulnerable adults
- Some of the counties most vulnerable victims - Equality and Human Rights Commission report Hidden in Plain Sight
highlights under-reporting of crimes potential high impact on victims. - Victims not always to access services
Substance misuse
- Drug and alcohol related issue will not be covered separately but will the appropriate section
Issues Identified as Secondary after the Scanning Process
The following section summarises the levels and patterns of crime and disorder, anti-social behaviour (including behaviour negatively impacting on the environment) and substance misuse for those topics that are not recommended as a current priority for the partnership. • Arson
Fire service data has shown a reduction of 58% (187 fires) in the last four years, which is slightly more than the county average.8 In 2007/08 Huntingdonshire recorded the highest number of fires compared to other districts and now in 2010/11 recorded the second highest. The district accounted for 27% of the recorded arson in the county in 2010/11. This is an excellent result for the district. It was agreed that no further specific analysis is required although arson would feature within the anti-social behaviour section if relevant. • Criminal Damage
Counts of criminal damage have decreased by 3.5% (1808-1744), the most significant drop being for ‘all damage to other buildings’ – 29% (200 – 142). An increase was seen in vehicle damage of 10.9% (715-793). Comparing the CSP against its most similar group around the country, iQuanta places it as only just within the “average” boundaries, and 13th out of 15 districts. Last years perception survey of residents showed that criminal damage was an area causing low level concern in the community. It was agreed that no further analysis was required, except where it is related to a particular location or aspect of anti-social behaviour raising concern. • Business Crime
There are no significant changes in the trend of offences committed against / at business premises (including shop theft). It was therefore agreed that no further analysis was required other than acknowledging the relevance to the business community of tackling alcohol related violence within the night-time economy. • Farm Crime
Following an increase during 2010/11 the volume of offences committed against farms has decreased to 2009/10 levels. It was agreed that no further analysis was required. • Hate Crime
8 See appendix 2: Scanning Data Tables
Huntingdonshire Strategic Assessment Page 13 of 59

With regards to CADET9 recordings of racially aggravated crime, incidents have declined by 31.7% (63 to 43), and all subsets have decreased/remained unchanged. Violence is down 31% (58 – 40), harassment is down 66.7% (3 – 1), and criminal damage remains unchanged (2). Clearly, due to the very low numbers, this cannot be used as a stand-alone guide. No further evidence has been provided by agencies to indicate that this is an area of concern for the partnership. It was therefore agreed that no further analysis was required at this time, but that more information sources should be sought. Information relating to harassment and bullying is included within the ASB section of the document. • Road Safety
The road accident report 2010 shows that 26% of accidents within the county in 2010 occurred in the district (this is hardly surprising given the length of significant A Roads in the area). The number of accidents was less than last year, the year before and the 5 year average. On average (2008-10 data page 16) 14% those injured were killed or seriously injured (KSI). A similar proportion was seen in all districts except city. The report did not indicate that Huntingdonshire was experiencing a disproportionate level of accidents or that there was any particular problem for the district to tackle. Therefore it was agreed that no further investigation was required. • Acquisitive Crime
The annual count of dwelling burglaries has increased by 22.1% (389-475). However, previous analysis has shown that the level of burglary fluctuates significantly from month to month and the level of concern shown by the partnership should reflect this. The experience of 2010/11, although higher, is still within the boundaries of previous experience. Analysis of the monthly data suggests that the CSP need not look at dwelling burglary unless the monthly level exceeds 51 offences frequently or over consecutive months. It is recommended, that burglary is not analysed separately. Theft from vehicles has also increased by 77 offences (13%) over the last year, due mainly to a peak in October and November 2010. Since then levels have remained consistent with the 3 year average. It is therefore recommended that we do not analyse this topic further and we review and set parameters for raising performance concerns for this area in the future. • St Neots
For 2011/12 it was decided that ASB (including criminal damage) in St Neots should be tackled as a topic of concern for the CSP. The 2010 Strategic Assessment highlighted the area as a hotspot for various crime types. Four wards were selected for further observation: • St. Neots Eaton Socon Ward • St. Neots Eaton Ford Ward • St. Neots Eynesbury Ward • St. Neots Priory Park Ward
Table two below is based on police-recorded data coded to these four wards, and changes that have (or have not) taken place over the past five quarters. It shows decreases in criminal damage, violence against the person and ASB incidents comparing the most recent quarter to the same period in the previous year. It was agreed that further analysis was not required.
9 Police performance management tool
Huntingdonshire Strategic Assessment Page 14 of 59

Table 2: Recent crime trends for St. Neots 2010/11 2011/12
Crime /incident type Qtr 1 Qtr 2 Qtr 3 Qtr 4 Qtr 1 Qtr 2 Qtr 3 Qtr
4Burglary 45 74 59 52 52 Criminal damage 123 127 109 90 99 Drug offences 16 23 21 18 14 Fraud & forgery 9 12 7 19 14 Other offences 4 7 9 5 8 Theft & handling stolen goods 142 186 152 123 139 Robbery 3 1 4 2 1 Sexual offences 8 9 0 6 5 Violence against the person 89 83 86 86 69 Asb incidents10 458 545 392 290 389
10 NB changes in police recording of ASB may have an impact on the figures since April 2011.
Huntingdonshire Strategic Assessment Page 15 of 59

Analysis
Domestic Violence in Huntingdonshire
Data Sources
There are a limited range of local sources for domestic violence most of which only provide a partial picture as much domestic violence goes unreported or unrecorded. The police record domestic violence incidents and recorded crimes are given a ‘domestic violence marker’ depending on the relationship between the victim and the offender. Information is available on the workload of the Independent Domestic Violence Advocacy Service (IDVAS). Information is also available from Children’s Social Care records where concern has been reported that domestic violence is having an adverse impact on a young person. This section seeks to combine all these different datasets into a coherent picture for the partnership and makes recommendations for further action.
The Scale of Domestic Violence
All reported incidents to the police call centre are recorded against a set framework. Incidents are recorded that either directly involve domestic violence or where domestic violence is a secondary factor. The graph below shows the recent trend in the number of incidents that have been recorded by the police in Huntingdonshire. Chart 1: Police recorded domestic violence incidents
Recent trend in police recorded domestic violence incidents
0
50
100
150
200
250
Apr
-09
May
-09
Jun-
09
Jul-0
9
Aug
-09
Sep-
09
Oct
-09
Nov
-09
Dec
-09
Jan-
10
Feb-
10
Mar
-10
Apr
-10
May
-10
Jun-
10
Jul-1
0
Aug
-10
Sep-
10
Oct
-10
Nov
-10
Dec
-10
Jan-
11
Feb-
11
Mar
-11
Apr
-11
May
-11
Jun-
11
Jul-1
1
Aug
-11
Month
Num
ber o
f Dom
estic
Vio
lenc
e In
cide
nts
Huntingdonshire
Mean Incidents
One Standard Deviation
One Standard Deviation
Linear (Huntingdonshire)
Note: Figures for July 2010 are considered unreliable so are not shown
There is no significant upward trend in domestic violence figures for Huntingdonshire with variations above and below the mean. However there are some seasonal variations, particular increases in early summer which do need further investigation.
Huntingdonshire Strategic Assessment Page 16 of 59

The nature of domestic violence – A link with deprivation
There is a strong relationship between the rate of deprivation within a ward and the rate of domestic violence. This relationship is demonstrated in the graph below; generally the higher the rate of deprivation the higher the rate of domestic violence. Chart 2: The association between domestic violence and deprivation
Cambridgeshire Ward Domestic Violence Rates compared to the Index of Multiple Deprivation
0
5
10
15
20
25
30
35
40
45
0.0 5.0 10.0 15.0 20.0 25.0 30.0 35.0
Domestic Violence Rate (Per 1000 population 2009/10)
Inde
x of
Mul
tiple
Dep
rivat
ion
Scor
e 20
10
We carried out an exercise to identify wards within Huntingdonshire where there was under-reporting of domestic violence. The analysis identified St Ives West as having a lower than expected rate of domestic violence incidents. In the case of St Ives West there is a population of 2,840 people but only 8 police recorded incidents in the whole of last year. Under-reporting means DV services are unsighted on potential problems identified areas could be the focus of future work. The other areas with relative low levels of reporting given the rate of deprivation were predominantly rural. Huntingdon West ward has a relatively high level of domestic violence compared to its deprivation rate. Analysis at a County level shows that the areas that have more domestic violence than expected tend to be areas where there is recently built social rented housing e.g. on the edge of St Neots at Loves Farm. In some respects this is because the Index of Multiple Deprivation no longer reflects the nature of the areas population. However, high levels of domestic violence should be investigated as an opportunity to provide appropriate services.
Huntingdonshire Strategic Assessment Page 17 of 59

Other Factors Associated with Domestic Violence
The research team has been provided with information from the County Council’s Children’s Services regarding child care referrals11. The information provided shows that during the last twelve months there were 309 new referrals in Huntingdonshire that involved domestic violence. Chart 3: Association between domestic violence and different types of referral
Types of referral that are associated with Domestic Violence
0%
5%
10%
15%
20%
25%
30%
35%
40%
Chi
ld p
aren
tal a
lcoh
olm
isus
e
Chi
ld E
mot
iona
l Abu
se(a
lone
)
Chi
ld p
oor a
ttach
men
tto
car
er
Chi
ld p
aren
tal
subs
tanc
e m
isus
e
Chi
ld M
enta
lly Il
l Par
ent
Chi
ld p
oor p
aren
ting
skill
s
Chi
ld lo
w b
ound
ary
cont
rol
Chi
ld D
isor
derly
beha
viou
r
Chi
ld in
tem
pora
ryac
com
mod
atio
n
Chi
ld P
hysi
cal A
buse
(alo
ne)
Chi
ld M
enta
l Ill
Hea
lth
Chi
ld N
egle
ct (a
lone
)
Chi
ld N
egle
ct a
ndP
hysi
cal A
buse
Chi
ld S
exua
l Abu
se(a
lone
)
Referral type
% o
f Ref
erra
ls th
at in
clud
e D
omes
tic V
iole
nce
The chart above shows that there is a very strong relationship between domestic violence and childcare referrals involving either parental alcohol abuse or neglect with over 1/3 of such cases also involving domestic violence. Over 1/5 of referrals involving ‘poor attachment to carer’ and ‘parental substance misuse’ also involves domestic violence. Other common links are with cases involving parental mental ill health, ‘poor parenting skills’ and ‘low boundary control of children’. In terms of ethnic origin for 85% of the child care cases that involved domestic violence the children where recorded as White British. Of the remaining 15%, 3% were of Asian origin and 4% were white-other (a category that tends to hold those of eastern European origin), 1% were of white Irish or Romany origin. The recorded age of the children who are the subject of the referrals regarding DV have ranges evenly between 2 and 18 with the exception of there being a heightened level of referral for children aged 0-1. It is acknowledged within DV risk assessment that this is a time of increased family stress arising out of pregnancy and child-birth. Evidence from the Balding Survey shows that that children are aware of domestic violence occurring within their households. 6% of Huntingdonshire pupils reported violence or shouting at home due to someone drinking alcohol, (county average of 7%).
11 See appendix 4 for an explanation of each data source
Huntingdonshire Strategic Assessment Page 18 of 59

We have also looked at the relative size of age groups within the case load of the Independent Domestic Violence Advocacy Service (IDVAS) and compared it to the expected age group size (given what we know about the population age structure and the rate of reported abuse for different age groups) and the age structure of the victims of crimes involving violence by partners or ex-partners. This comparison is shown in the chart below. Chart 4: Comparison of the relative size of age groups between known and expected victims of domestic violence
Huntingdonshire - Age of Clients Registered During Sept 10 to Aug 11 with IDVAS Service Compared to expected age*
0%
5%
10%
15%
20%
25%
30%
35%
40%
16-1
8
19-2
5
26-3
0
31-4
0
41-5
0
51-6
0
61-7
0
71+
Age
% in
age
gro
up
Hunts IDVAS ClientsExpected age profilePartner DV Victims
* Expected DV age profile is based on apply age prevalance rates for DV from the British Crime Survey to current age group estimates for the district population.
Broadly the chart shows that a higher than expected proportion of older women are reporting domestic violence (recorded being victims of crime) and represented on the IDVAS caseload. There are not as high a proportion of younger women as there should be given what we know about the incidence of domestic violence within this age group.
Huntingdonshire Strategic Assessment Page 19 of 59

A brief profile of domestic violence offenders is shown in the table below. Generally the age range of offenders tends to be slightly higher than that of their victims. Table 3: A Brief profile of identified domestic violence offenders District Number Peak age Ethnicity Cambridge 114 19-40 White British 68%
White Other 11% East Cambs 40 31-40 White British 88%
White Other 8% Fenland 110 31-40 White British 75%
White Other 17% Huntingdonshire 138 31-40 White British 82%
White Other 6% South Cambs 71 41-50 White British 80%
White Other 7%
Cost of Domestic Violence
Whilst the level of threat to the individual provide impetuous for the funding for domestic violence services, having a clear understanding of the costs of domestic violence to public services and where those costs fall is very valuable when discussing the relative funding required. The most authoritative work on the costs involved was carried out by Walby in 200412 Chart 5: Proportion of costs to public services
Proportionate Cost of Domestic Violence to Public Services (Walby 2004)
17%
16%
39%
6%
7%
5%
10%
Criminal Justice - Other
Criminal Justice - Police
Health Care - Physical
Health Care - Mental
Social Services
Emergency Housing
Civil Legal
It is important to note that within the cost model developed by Walby almost half of the costs to public services were incurred by the NHS for the treatment of physical injury as well as long term mental health problems. To set the cost figures in context it is estimated that the cost of domestic violence represents an estimated 1.54% of the NHS budget, 1.6% of combined local authority budgets and 7% of the policing budget13. The relative seriousness of offences is shown appendix 1.
12 The cost of domestic violence 2004, Professor Sylvia Walby, Women & Equality Unit, University of Leeds (funded by the DTI) 13 Costs proportions created by dividing Walby’s cost estimates by published national spending costs estimates (Guardian 2008)
Huntingdonshire Strategic Assessment Page 20 of 59

Location of Domestic Violence
The distribution of the last years’ domestic violence incidents is shown in appendix five and identifies a considerable ‘hotspot’ over the Oxmoor area of Huntingdon. It also shows the presence of domestic violence within the newly built housing area of Loves Farm on the edge of St. Neots.
Domestic Violence - Discussion and recommendations
RECOMMENDATION TWO: We need awareness that the police recorded domestic violence incident rate in Huntingdonshire is no longer increasing. Now, changes in the figures have tended to only be short term. There are some geographical areas where possible under-reporting has been estimated and HCSP is recommended to consider focusing awareness raising activity in these areas; as well as within newly built social housing. It has been noted that younger women (those aged 16+) are not as well represented within current caseloads as expected therefore awareness could be targeted at this group. RECOMMENDATION THREE: The profile of victims supports the recommendation that there needs to be an assessment of how to reach and provide services to people of diverse backgrounds suffering from domestic violence both within specialist and main stream services; but there is probably not a need for specialist provision in Huntingdonshire. RECOMMENDATION FOUR: Some domestic violence incidents in Huntingdonshire are judged to be at a medium or high level of seriousness (17). HCSP has had a policy of supporting services that particularly target high risk cases through the MARAC. Future service provision is an area that should be planned. This would be sensible given the risk of domestic violence homicide. RECOMMENDATION FIVE: The cost of domestic violence falls heavily upon the NHS. Engagement with NHS partners in the issue of domestic violence and services to support victims is an area of service development. It is recommended that the partnership consider the extent to which the NHS is currently engaged in partnership working. It is worth noting and investigating the lack of referrals to the IDVAS service from health agencies.
Huntingdonshire Strategic Assessment Page 21 of 59

Anti-Social Behaviour (ASB) Definition of ASB ASB can be categorised into four core areas, misuse of public space, disregard for community/personal well-being, acts directed at people and environmental damage.14 Examples of each category are given below Table 4: Research Development & Statistics Directorate typology of anti-social behaviour18
Misuse of public space
Disregard for community/personal well-being
Acts directed at people
Environmental damage
Drug misuse/dealing Noise Intimidation Criminal damage Begging Rowdy behaviour Harassment Graffiti Street drinking Nuisance behaviour Bullying Vandalism Abandoned cars Hoax calls Litter/rubbish Vehicle related nuisance
Animal related problems
Can be based on race, sexual orientation, age, religion disability etc
Scale of the problem
The evidence shows that Huntingdonshire residents do no think they have a very big problem with ASB and overall reductions in the volume are being consistently recorded. The police survey (PIC) shows that the district had on average less than 10 out of 600 (<2%) respondents who thought ASB was a very big or fairly big problem (rolling 12 months data July 2011). 64% of the respondents’ to the community safety survey said they were rarely or never affected by ASB. Huntingdonshire District Council (HDC), Luminus Housing15 and Cambridgeshire Constabulary data all show a reduction in reported ASB. Luminus Housing has reported a reduction in the number of complaints over the last 2 years of 26% whilst the constabulary incident data shows a 32% reduction since Sept07-Aug08. Chart 6: Trends in police recorded ASB
Police recorded ASB incidents
0
2000
4000
6000
8000
10000
12000
CSP
Num
ber o
f inc
iden
ts
Sep07-Aug08 10541 3383 7387 9682 5599Sep08-Aug09 9414 2987 6675 9075 4908Sep09-Aug10 8424 2600 6239 7879 4249Sep10-Aug11 6971 2316 5453 6582 3700
Cambridge East Cambridgeshire Fenland Huntingdonshire South Cambridgeshire
14 Defining and measuring anti-social behaviour, Home Office 2004 15 It should be noted that Luminus has a limited data capture limited to Police and HDC as their reports are restricted to their tenants. Not all social-tenants are Luminus tenants, there 30 other registered housing providers locally.
Huntingdonshire Strategic Assessment Page 22 of 59

Location of the Problem
Map 1: Rates of Anti-Social Behaviour
Reviewing the district council data, the data from social registered landlords and the police recorded data for this year, the following locations are identified as being of significance; Huntingdon, St Neots and St Ives. Table 5: Comparison of ASB reporting Luminus HDC Police (Parish) Huntingdon (22) Huntingdon (62) Huntingdon (1,692 = 75.9 per 1,000population) St Neots (31) St Neots (29) St Neots (1,610 = 54.7 per 1,000 population) St Ives (15) St Ives (20) St Ives (862 = 52.7 per 1,000 population)
Nature of problem
ASB can also by analysed on the basis of level of harm/ seriousness experienced by the victim. The diagram demonstrates where these acts of ASB feature when applying comparative frequency and risk of harm scales for Huntingdonshire. Those acts of ASB which have the highest
Huntingdonshire Strategic Assessment Page 23 of 59

risk of harm have a direct victim. The people most likely to experience these are often those that a vulnerable. Table 6: Categorisation of ASB by harm and frequency for Huntingdonshire
Hig
h Infrequent but high risk of harm Drug misuse/dealing Rowdy behaviour
High frequency & high risk of harm Intimidation Harassment Bullying
Low
Infrequent & low risk of harm Abandoned cars Animal-related problems Street drinking/begging Hoax calls
High frequency but low risk of harm Litter/rubbish Noise Graffiti/vandalism /criminal damage Nuisance behaviour Vehicle-related nuisance
Low High
S
erio
usne
ss
Frequency Whilst there is a larger volume of low level ASB reported that predominately feature within environmental damage and disregard for community/personal well-being, there is also a smaller number cases which can be ongoing, serious, or high harm. These are those acts directed against individuals. Low Risk of Harm The incidents recorded by the district council’s community safety team for August 2010 - July 2011 were compared against August 2009 - July 2010 data. The comparison shows a big reduction (56%) in calls received about 'youth ASB/nuisance'. This appears to be across the board and not in any one locality. Remaining categories that could be considered low risk of harm: neighbour nuisance; football/outdoor games nuisance; alcohol related nuisance; vehicle related nuisance; rubbish/littering; animal related nuisance; environmental nuisance; are at a constant level, if not slightly down. Local data shows that largest number of complaints to Luminus this year were related to noise. The PIC survey showed that the perceived problem that scored highest was rubbish or litter lying around, followed by teenagers hanging around.16 A breakdown of police recorded ASB by type is not possible at this time because of changes to the recording practices which occurred part way through the year. Anti-social use of vehicles (e.g. parking, speeding) was noted as being of most concern by residents in 2010. High Risk of Harm A key aspect of analysing the problem is establishing who suffers the highest proportion of ASB and who is most vulnerable. A current weakness of the existing data sources is that this information is not readily available. However, we can predict who is likely to be victimised by which locations experience high levels of ASB and understanding what makes someone vulnerable. Vulnerable victims are children & young people and vulnerable adults. A vulnerable adult is
16 Data from all respondents
Huntingdonshire Strategic Assessment Page 24 of 59

defined as a person over 18 in receipt of or entitlement to care by reason of mental or other disability, age or illness and unable to protect themselves from significant harm.17 Vulnerability can be defined either by personal characteristics or environment. The data shows that crime and disorder is not evenly distributed. That some locations are more likely to experience high levels of crime and disorder because of ‘vulnerabilities’ in either the physical environment or because of other socio-economic factors such as deprivation. Evidence demonstrates that Huntingdon North ward’s is densely populated and comprises a large proportion of social tenants. These factors along with the level of deprivation are likely to increase the rate of anti-social beavhoiur seen. The second largest categories of complaints to Luminus this year were for by “verbal abuse/harassment” and “intimidating/threatening behaviour”. These harassment/intimdation complaints accounted for 22.5% (58) and 28.7% (74) of total complaints respectively. Intimidation/harassment and bullying accounted for 16% (24) of the complaints recorded for this year by the district’s ASB team. The district council’s ASB team report that their main complaint is in relation to neighbour disputes. Ongoing disputes may be complex cases where the victim(s) are also offenders. This is where the use of a variety of partnership data sources is invaluable. The police data when considered in isolation would not have shown the relatively high reporting of harassment type ASB but in context there seems to be an issue either of harassment/intimidation or the perception of it for about a fifth of those who complain. In terms of frequency 12.5 % of responses to the community safety survey (496 completed forms were analysed from the 2010 survey), felt that ASB affected them frequently. 1.8% felt ASB affected them on a daily basis, 10.7% several times a week. Nearly a quarter felt it affected them once or twice a month. ADD HDC complex case info – waiting for Tracey ADD - Repeat victims / location analysis could be added at a later time
Vulnerable Adults
The case of Fiona Pilkington and her daughter brought to light some of the complex needs of vulnerable victims and the importance of agencies working together and taking seriously the impact that ASB has. It is important to bear in mind that the people who are the most vulnerable in relation to ASB are likely to suffer disproportionately from its consequences. These, in turn, can also lead to significant further consequences which can for instance be on the duties of care for some public bodies and the lives of relatives and network support of those vulnerable people In an attempt to understand the problem of harassment and bullying more, local population estimates and nationally reported prevalence can be used to produce a local estimate of the scale of harassment/bullying. The Research & Performance Group estimates that approximately 10% of Huntingdonshire’s adult population (16-64) has a disability or long-term illness (LLTI). The British Crime Survey estimates that 19% of disabled adults have been victims of crime.18 When you
17 No Secrets - Department of Health, 2000 18 Hidden in plain sight: Inquiry into disability-related harassment
Huntingdonshire Strategic Assessment Page 25 of 59

apply this to the district population it can be estimated that 1,983 residents could have been the victim of crime/harassment. Some key findings from the Equality Commission inquiry into disability-related harassment found; Disabled people often do not report harassment when it occurs, for a range of reasons including fear of consequences, concerns that they won’t be believed and lack of information about who to report it to. Disabled people have told us not just about attacks on themselves, but also attacks on their families, friends, support workers, assistance dogs, equipment and adaptations.” Mental health issues certainly feature pretty regularly when discussing anti-social behaviour problems. These complex cases are quite often the sort that is referred by all agencies in the partnership to the multi-agency problem solving group. The team have had some success fairly recently with engaging mental health services, but this is certainly not always the case; likewise engaging with Social Care.
Children & Young People’s experiences of ASB
Following the recommendation of the crime statistics review (Smith, 2006; Statistics Commission, 2006) a supplementary survey was conducted between January and December 2009, nationally, with a representative sample of children aged 10 to 15. (Children’s experience and attitudes towards the police, personal safety and public spaces: Findings from the 2009/10 British Crime Survey interviews with children aged 10 to 15, May 2011). Key findings from this national study showed that 22% of children had been bullied within the previous 12 months. If that figure is applied to the population of Huntingdonshire, it could indicate that approximately 1,500 children have been bullied. The national survey indicates that the majority of bullying took place at school and 30% of those bullied reported that it took place at least once a week. This agrees with local data which showed that 23% of children interviewed19 had at least “sometimes” been afraid to go to school because of bullying. Locally there was a drop of 5% of reported incidents (compared to the 2008 data).Currently the government’s anti-bullying policies are focused through schools and teachers. Differences were seen within genders, with young boys and older girls experiencing higher levels of bullying. Children in low income or lower socio-economic OAC groups also reported higher levels of bullying. Older children reported more cyberbullying, this is likely to relate to greater availability and use of technology in older children. One initiative is the safer schools partnership, which aims to reduce bullying, truancy and exclusions by placing a police officer within a school. National results show the most common form of bullying was verbal abuse, although% reported that the bullying had resulted in injury. This could indicate that nearly 400 children have been injured in the last 12 months. Locally: 8% of Huntingdonshire pupils said that they are “fairly sure”/“certain” that they have friends who carry weapons for protection when going out. (Cambridgeshire rate is 9%, national rate 13%). Factors that increased this were; increased age, reporting having felt drunk, having truanted or having been suspended.20 35% of the children reported that teenagers hanging
19 Health related behaviour questionnaire (Balding survey) 2010 20 Children’s experience and attitudes towards the police, personal safety and public spaces: Findings from the 2009/10 British Crime Survey interviews with children aged 10 to 15
Huntingdonshire Strategic Assessment Page 26 of 59

around was a problem (this is compared to 27% in adults), this was higher in urban areas or children either from ethnic backgrounds other than white or with a long-standing illness or disability. Of the total sample 13% of 10 to 15 year olds reporting having felt drunk in the last 12 months. Overall, Huntingdonshire pupils have similar good experience in terms of safety at school, at home, in their neighbourhood compared to their peers in Cambridgeshire.
- Huntingdonshire pupils have similar views about the safety of their neighbourhood compared to the rest of the county. 15% of pupils rate their area when going out after dark as ‘unsafe’ or ‘very unsafe’. 46% rated it as ‘safe’ or ‘very safe’. (Cambridgeshire figures are 16% and 47%).
- 11% of Year 8 girls and 24% of Year 10 girls in Huntingdonshire reported that they had met in real life someone they first met online through internet chat rooms, which are similar to the county figures.
- 79% of pupils reported that they had been taught how to stay safe while chatting online (80% for Cambridgeshire)
Wider victimisation of children and young people
The offences that young people are most commonly the victim of are either theft offences such as theft of bicycles and the minor violent offences of common assault and actual bodily harm. Of interest is the balance of offences reported for Huntingdon North ward (which has the highest rate of victimisation) where violent offences amongst young people were relative high. Chart 7 : Rates of child (aged 10-15) victimisation by ward, Sept 2010 to Aug 2011
Rate of victimisation for children aged 10-15
0.0
0.5
1.0
1.5
2.0
2.5
3.0
3.5
Alc
onbu
ry a
nd T
he S
tuke
leys
Bra
mpt
on
Buc
kden
Ear
ith
Elli
ngto
n
Elto
n an
d Fo
lksw
orth
Fens
tant
on
God
man
ches
ter
Gra
nsde
n an
d Th
e O
fford
s
Hun
tingd
on E
ast
Hun
tingd
on N
orth
Hun
tingd
on W
est
Kim
bolto
n an
d S
taug
hton
Littl
e P
axto
n
Ram
sey
Saw
try
Som
ersh
am
St I
ves
Eas
t
St I
ves
Sou
th
St I
ves
Wes
t
St N
eots
Eat
on F
ord
St N
eots
Eat
on S
ocon
St N
eots
Eyn
esbu
ry
St N
eots
Prio
ry P
ark
Stil
ton
The
Hem
ingf
ords
Upw
ood
and
The
Rav
eley
s
War
boys
and
Bur
y
Yax
ley
and
Farc
et
Ward
Rat
e pe
r 100
0
Huntingdonshire Strategic Assessment Page 27 of 59

Tackling the Problem – Partnership Progress
The partnership has employed a variety of initiatives to tackle anti social behaviour. The following examples are included to show where progress has been made over the previous 12 months. Huntingdon - Through the FUSION Holiday Scheme, the Police, HCSP and Fire Service commissioned the youth service to specifically target young people in the Huntingdon area who have historically been involved in ASB. St Neots - The Youth Service were awarded funding to establish a skate park users group attached to the skate facility at Riverside Park. As part of this work, weekly workshops were proposed and two skate park events. Although some of this work has taken place, the youth service have not delivered exactly what was expected but it is hoped that some diversionary activities were beneficial. The Police also funded a sexual exploitation project via Dial Drug Link which worked with vulnerable young girls and was specifically as a result of the incidents of rape that had occurred in St Neots last year. Loves Farm - 12 week Street Sports Project to divert young people away from ASB and criminal damage resulting in the installation of a Multi-Use Games Area (MUGA). Stukeley Meadows - Continued weekly sessions via the youth service at the skate park finishing with the annual event that was held on 3rd September and was attended by over 300 young people. Across the District - Streetwise - An interactive day in all seven secondary schools before the school holidays with all year 8 pupils to raise awareness about the repercussions of becoming involved in crime, disorder or ASB. Also, the Junior PCSO Scheme - six schemes held across the District. All current focus of partnership activity appears to be on ‘high frequency but low risk of harm’ ASB. Particularly within areas that would normally fit in to mainstream working of youth work services.
National examples of best practice
Family Interventions: A national network of Family Intervention Projects (FIPs) was set up as part of the Respect Action Plan, launched in January 2006. These projects aimed to reduce anti-social behaviour (ASB) perpetrated by the most anti-social and challenging families, prevent cycles of homelessness due to ASB and achieve the five Every Child Matters outcomes for children and young people. FIPs use an ‘assertive’ and ‘persistent’ style of working to challenge and support families to address the root causes of their ASB. Family Intervention Projects (FIP) are described as ‘part of the Prime Minister’s commitment to turn around the lives of families with multiple problems’. Complex Cases: This secure, web based database provides a central information gathering point that aids the Crime and Disorder Reduction Team, Youth Services, Metropolitan Police, CityWest Homes and other Partners in the identification, monitoring and tracking of individuals involved in anti-social behaviour. The database is monitored by the Anti-Social Behaviour Unit. Nominated staff members for each Partner Agency receive training in order for them to be able to access the system. This database provides Westminster with an instant mechanism of consultation on specific individuals and cases,
Huntingdonshire Strategic Assessment Page 28 of 59

speeds up the case conferencing approach and ensures more effective, appropriate and earlier intervention. This database will encourage increased multi-agency working. This anti-social behaviour database is capable of progressing specific cases of anti-social behaviour. This means that the database will have the capabilities to prioritise cases dependent on the most persistent and serious localised problems. Information stored on the database will provide insight in terms of the extent, nature and location of anti-social behaviour in Westminster. The Crime and Disorder Reduction Team can then use this information to update crime audits, advise the MPS at tasking meetings and thus further develop joint initiatives to tackle anti-social behaviour.
Discussion and recommendations:
RECOMMENDATION SIX:: The strategic assessment has identified a possible gap between the number of potential vulnerable victims of ASB and the level of reporting. It is recommended that case reviews for victim-vulnerability are routinely undertaken and recorded. The information collected/assessed can be interrogated in future to identify any potential service gaps. In order for the partnership to focus on this issue there will need to be considerable involvement of County Council Social Care teams and key workers within the NHS. It is further recommended that the partnership continue to build on its joint sharing of information on ASB to enable it to demonstrate it is supporting vulnerable victims. RECOMMENDATION SEVEN: Within Huntingdon North ward we can see a pattern of deprivation, child and family stress. Resulting in anti-social behaviour by young people and victimisation of young people. This contributes to the ward being a ‘hotspot’ for anti-social behaviour and other issues such as arson. The profile of victimisation supports the recommendation that there is value in working with young people about the risks of becoming a victim or an offender with a view to them protecting themselves from risky situations. A number of different agencies could work cooperatively together on this project, but children’s services must lead this work.
Huntingdonshire Strategic Assessment Page 29 of 59

Alcohol-related violence
Scale of the Problem
The table below provides the police recorded figures for violent crime in the district over the past four years. It shows that total violence and violence most associated with alcohol21 have not followed the same pattern during this time. Total violence peaked during Sep09 – Aug10 and assault with less serious injury peaked during Sep08 – Aug09. Further, comparing the most recent year with the previous year total violent crime decreased, whilst assault with serious injury saw a small increase (6% or 35 offences). Table 7: Long term trend in violent crime Sep07-Aug08 Sep08-Aug09 Sep09-Aug10 Sep10-Aug11Total violent crime 1664 1684 1784 1690 Violence against the person 1507 1520 1595 1526 Sexual offences 110 107 139 114 Robbery 47 57 50 50 Assault with less serious injury 588 629 559 594
When examining the rate of violence per 1,000 residents, the data shows that total violence and assault with less serious injury in Huntingdonshire have remained relatively static over the fours years. The CSP is inline with both county average and it’s most similar group average22 for the rate of assault with less serious injury. HCSP is slightly below both the county average and it’s most similar group average for the rate of total violence. Chart 8: long term trend for assault less serious injury23
0
10
20
30
40
50
60
70
80
Apr-07
Jun-0
7
Aug-07
Oct-07
Dec-07
Feb-0
8
Apr-08
Jun-0
8
Aug-08
Oct-08
Dec-08
Feb-0
9
Apr-09
Jun-0
9
Aug-09
Oct-09
Dec-09
Feb-1
0
Apr-10
Jun-1
0
Aug-10
Oct-10
Dec-10
Feb-1
1
Apr-11
Jun-1
1
Aug-11
Crimes Trend
21 Currently Assault with less serious injury is used to measure alcohol-related violence. 22 iQuanta most similar group data is 12 months recorded crime to July 2011 23 Reproduced from CADET
Huntingdonshire Strategic Assessment Page 30 of 59

Nature of the Problem
In the past 12 months there were approximately 1,600 violent crime offences in Huntingdonshire. The typography of these offences can be divided proportionally into the groups shown within the pie chart below. Chart 9: Typography of violent offences within Huntingdonshire.
Typograph of violent offences within Huntingdonshire
6%2%
10%
3%
15%
3%
18%
12%
31%
Young People - Non Partner Domestic Violence
Young People - Partner Domestic Violence
Young People - All other violent offences
Young People - Within Major Pub Clusters
Major Pub Cluster Violence
Partner Domestic Violence - Within Major PubClustersPartner Domestic Violence
Non Parter Domestic Violence
All Other Violent Offences
Typography created using available offence descriptions, location information and link to victim/offender data set. Some offences may not have the appropriate descriptions codes so the % of DV offences is possibly slighty higher than shown. Major Pub clusters are those in St Neots, Huntingdon, St Ives and Ramsey.Young People's Offences are where the victim or offender is identifed as being under 18.
Offences involving all forms of domestic violence = 41%
Offences involving Young people= 21%
Offences involving the major pub clusters = 21%
Over two thirds of violence in Huntingdonshire can be divided into one of three groups (with some overlap).
• Domestic Violence (covered within the domestic violence section of this report).
• Violence involving children & young people (covered within the ASB and Young people sections).
• Violence associated with the night-time economy within the major pub clusters
Profile of Pub Cluster Violence
Earlier this year an agreement was reached with Hinchingbrooke NHS Hospital to support the reduction of alcohol-related violence by collected and sharing assault victim data relating to attendance at the emergency department (ED) at the Trust. Data is now received on a monthly basis and dates from February 2011. The data received so far shows in seven months a total of 53 attendances were recorded for assault. Of these;
• 55% were on Friday or Saturday
Huntingdonshire Strategic Assessment Page 31 of 59

• 34% of patients were female & 66% male. This is slightly higher than expected. The Addenbrooke’s NHS Trust ED data received indicated just under a quarter of victims were female.
• Those attending the ED were aged between 11 and 52. 25% were aged 16 or under and 40% were 17 – 30
• 36% involved weapons (the remained involved no weapon or just hands and feet)
• Knifes were only reported by 2 patients The indication that 55% of A&E attendances are on a Friday or Saturday night clearly shows the impact of alcohol related night-time violence on local services. We compared the major ‘pub clusters’ of the partnership area against those elsewhere in the County. Table 8: Comparison of Cambridgeshire Pub Clusters
Pub Clusters
Count of Licenced premises
All Violence Offences
All Drug Offences
All Violence Offences
All Drug Offences
All Violence Offences
All Drug Offences
Cambridge Cambridge Centre 77 814 200 10.6 2.6 911 224Wisbech 22 263 80 12.0 3.6 993 302St Neots East 19 124 18 6.5 0.9 476 69March 12 121 40 10.1 3.3 815 269Huntingdon 8 115 15 14.4 1.9 1122 146Ely 14 99 32 7.1 2.3 477 154Cambridge Mitchams Corner 6 70 22 11.7 3.7 813 255St.Ives Centre 12 66 4 5.5 0.3 574 35Cambridge Hills Road & Leisure Park Inc Junction 9 53 15 5.9 1.7 368 104Whittlesey 11 46 18 4.2 1.6 256 100Cambridge East Chesterton 5 35 14 7.0 2.8 355 142Ramsey 5 28 1 5.6 0.2 381 14Soham 4 27 5 6.8 1.3 733 136Cambridge Romsey Town (Mill Road North) 4 20 9 5.0 2.3 279 125Cambridge Upper Newmarket Road 4 18 15 4.5 3.8 233 195Cambridge Lensfield Road / Bateman Street 4 11 3 2.8 0.8 190 52St Neots West 7 9 3 1.3 0.4 68Cambridge Trumpington 3 8 3 2.7 1.0 117 44Cambridge Cherry Hinton 3 4 3 1.3 1.0 78
Sept 2010 to Aug 2011 Rate per premises Rate per Sq mile
23
59 * Pub clusters were developed for the 2010/11 Strategic Assessments as areas with three or more pubs/clubs in close proximity (150metres to each other) It is notable that Huntingdon Pub Cluster in particular has the highest rate of violence compared to anywhere else in the County particularly given the relatively small number of licensed premises. The distribution of offences within the town centre shows issues in relation to certain passage ways on the northern edge of the centre as well as the area immediately around the market square and the Market Inn pub / Level 2 night club.
Huntingdonshire Strategic Assessment Page 32 of 59

Map 2: Violent offences within Huntingdon Town Centre location and day/time
Victim profile
85% of all victims of violence in Huntingdonshire were residents of the district. Those aged 18 and under accounted for 18% of victims of total violent crime. Chart 10: Victim age profile for the Huntingdon Pub Cluster
Age of victims inside and outside the Huntingdon pub cluster
0%
5%
10%
15%
20%
25%
30%
35%
40%
45%
Unknown Under 18 18-24 25-30 31-40 41-50 51-60 61-70 70+
Age Group
% in
age
gro
up
Victims injured outside a pub cluster
Victims injured within the Huntingdon pub cluster
Huntingdonshire Strategic Assessment Page 33 of 59

Within the Huntingdon pub cluster the 18-24 age group where considerably over represented within the victim profile whilst both the under 18s and over 31s were underrepresented. This is a classic pattern for alcohol related night-time violence.
Offender profile
Most offenders within the Huntingdon pub cluster were between 18 and 24 years old and a significant number were within the 25-30 age group indicating a slightly wider age profile to victims. This is another classic pattern associated with night-time economy. Chart 11: Age profile of offenders for offences within the Huntingdon pub cluster
Age of offenders inside and outside the Huntingdon pub cluster
0%
10%
20%
30%
40%
50%
60%
Unknown Under 18 18-24 25-30 31-40 41-50 51-60 61-70 70+
Age group
% in
age
gro
up
Offenders offending outside the pub clusters
Offenders offending inside the Huntingdon pub clusters
Tackling the Problem
During the last two years the partnership has run initiatives tackling alcohol-related violence across the district. These included operations Hartwell – targeting St Ives, and Titan – targeting St Neots & Huntingdon town centres. Evaluations indicated that operation Hartwell in particular was a success in reducing violence. Huntingdon - Pub Watch has been re-introduced into the Huntingdon town area and there are currently 12 members signed up to the scheme. As part of the scheme, each member has been given a radio on a free trial until the 1st December 2011 after which time it is hoped that the members will recognise the benefits and pay weekly for the radios. To date, four individuals have received bans under the scheme from the 12 premises, all of these individuals have historically been involved in alcohol related violence. As part of the scheme, the members are working towards a zero tolerance to violence and ASB within their premises and the town.
Huntingdonshire Strategic Assessment Page 34 of 59

It should be noted that the rate of drug offences committed in Huntingdon centre is relatively low compared to other centres; particularly given the rate of violence. The rate of offences is normally an indicator of the level of police activity (leading to offences being uncovered). In this case we can speculate that the level of activity within Huntingdon maybe relatively low compared to other centres. St Neots - As well as the information provided below, the St Neots NH Policing Team have changed the way in which they 'police' the area. All officers are aware of the priority premises and are requested to patrol certain routes on key days that have historically been associated with alcohol related violence and disorder. The St Neots area also has a very successful Pub watch Scheme and the 'Traffic Light Scheme' also operates in this area. Ahead of the summer holidays, a letter was sent to every parent of children who attend the secondary schools in St Neots advising them that both the Police and LA were aware that underage drinking was occurring in the St Neots area and that as parents it is their responsibility to ensure that they are aware of where their children are and what they are doing. Although this letter did anger some parents, it seems to have had a positive effect with fewer reports of underage drinking/ alcohol related incidents of disorder. Discussions & Recommendations RECOMMENDATION EIGHT: Alcohol-related violence should remain a priority for Huntingdonshire for 2012/13 as the current work needs time for real progress to be seen. Huntingdon should remain the priority area for the partnership because of the relatively high rate of alcohol related violence within the pub cluster. The partnership should therefore ensure that it is fully implementing the lessons learnt from successful initiatives carried out elsewhere.
Huntingdonshire Strategic Assessment Page 35 of 59

Adult Offending
Profile of adult offenders
The number of offenders who are part of the probation service caseload at the end of August 2011 that were coded to Huntingdonshire was 271. Of these, 19% were assessed as tier 4; this is much higher than any other district (county average 12.7%). These are the very high risk offenders and can include prolific offenders, MAPPA or MARAC cases. Chart 12: Proportion of probation clients by tier
Probation Tier by CSP
0%
10%
20%
30%
40%
50%
60%
70%
80%
90%
100%
Cambridge City East Cambridgeshire Fenland Huntingdonshire South Cambridgeshire
432
The assessed needs of offenders in the district identified through probation are on the whole in line with the county picture. The two highest needs identified for offenders were ‘thinking’ and their current ‘lifestyle’. Alcohol misuse was an issue with almost 50% of clients. Table 9: Identified need for Huntingdonshire probation clients
Need Type
Number of Huntingdonshire clients
Percentage of Huntingdonshire Clients
Percentage of clients -Cambridgeshire
Thinking 230 84.9% 86.2% Lifestyle 164 60.5% 61.3% Relationship 143 52.8% 54.0% Attitudes 140 51.7% 48.9% Alcohol Misuse 126 46.5% 43.4% Emotional Well-Being 92 33.9% 39.2% Finance 81 29.9% 34.4% Drug Misuse 72 26.6% 31.5% Accommodation 55 20.3% 24.8% ETE 50 18.5% 22.2%
The data does not provide a clear picture of the number of offenders with mental health or learning disability issues.
Huntingdonshire Strategic Assessment Page 36 of 59
Offender needs
“When I consider what the needs of offenders are, I always try to always bear in mind that offenders want the same things as everyone else - health care, a job, a family, and somewhere to live. Of these issues, health is vitally important. With the high number of offenders with mental health problems, or difficulties with drugs, the contribution made by health professionals in addressing the needs of the offender population is absolutely crucial.” (Lord Hunt 2008)
In 2007, Forensic Pathways was commissioned to provide insight into offender need for the purposes of the West Midlands Regional Offender Manager’s Commissioning Plan24. A specific, complex database containing over 1.8 billion items of data was built and analysed. The data was analysed to look at offender need, therefore the sample was separated into male adults, female adults, male young offenders and female young offenders. 16 recommendations were made by the project to commissioners. Overall, the project identified the following areas of offender need that increase risk:
- Alcohol - Mental Health - Thinking Behaviour - Combination of pathways involving Alcohol - Combination of pathways involving Mental Health
Offending and Mental Health
Surveys have shown that as many as 90% of prisoners have a diagnosable mental disorder, substance abuse problem or, frequently, both. Among young offenders and juveniles that figure is even higher, 95%. It is also known that mental illness can contribute to re-offending and problems of social exclusion.25
The most common mental disorders among prisoners was personality disorders (64% in males sentenced prisoners, 50% in females sentenced prisoners) and neurotic disorders (40% in males sentenced prisoners, 63% in females sentenced prisoners). This raises particular questions about ways of managing and treating these difficulties. The Bradley Report clearly identifies recommendation for improving intervention for both adult and young offenders with mental health problems and learning disabilities. Implementing these should be considered a key priority in the county when considering the potential impact on improving the outcomes of offenders and reducing re-offending. Early appropriate intervention is essential so that opportunities are not lost to impact on immediate offending and re-offending but also to deter children and young people away from adult offending.
Offending and Substance Misuse
The number of DIP clients in Huntingdonshire on the scheme per month fluctuated between 30 and 43 between July 2010 and August 2011. On average there were 37 clients per month on the scheme. The majority were male and half were over 34 years old, all clients were white - British. Nearly 60% were in temporary accommodation. 70% stated heroin as their main drug, these 24 West Midlands Regional Offender Manager Offender Need Data, 2007, Forensic Pathways Ltd. 25 Offender Mental Health – A Case for Change -?possibly 2005 DoH
Huntingdonshire Strategic Assessment Page 37 of 59
clients require a high level of intervention. 50% of clients had theft/burglary offences, while approximately 16% had committed drug offences. These types of offences are likely to be linked to their drug misuse. Of those offenders being managed through the central division PPO scheme as at September 2011 all had burglary and /or theft offences. Half had had heroin as their main drug and 70% had an alcohol marker, showing that this group of offenders have high substance misuse issues that require support if they are to be diverted away from further offending.
Tackling the problem
During 2011/12 the county has been working towards joining up partnership delivery of reducing offending through Integrated Offender Management (IOM). Initially this has focused on combining the CDIP and PPO schemes. Agencies delivering frontline services for offenders need to integrate this approach to their mainstream work if IOM is going to be successful. It should be noted that the outcome of the Constabulary Operation Redesign will impact on policing resource across Cambridgeshire in respect of IOM is currently unknown. To date the following progress has been made;
• Outcome measures have been now agreed. • Assessment matrix now applied to all DIP/PPO and probation referrals for IOM • Central BCU currently consolidating PPO meeting to monthly IOM partner meetings • 2 x Mental Health posts currently being recruited to support Bradley recommendations for
diversion of offender with mental health issues from custody and providing community based support.
CDIP effectiveness In Cambridgeshire, the CDIP has been in operation since April 2005. CDIP is delivered in the community via two teams, the Southern team covers Cambridge city, East Cambs and South Cambs, the Central team covers Huntingdonshire and Fenland.
− National evidence Since being introduced nationally in 2003, the Drug Intervention Programme has proved a clear success in engaging offenders into treatment. Over 4,500 drug misusing offenders enter treatment through DIP each month and eight out of every ten persons are being retained in treatment for 12 weeks or more. Since DIP began, recorded acquisitive crime – to which drug related crime makes a significant contribution – has fallen by around 32% to end of year 2009. The major benefit of DIP is that it focuses on the needs of offenders by providing new ways of cross-partnership working, as well as linking pre-existing ones, across the criminal justice system, healthcare and drugs treatment services and a range of other supporting and rehabilitative services. This multi-agency approach is the model for IOM.
− Cambridgeshire evidence The CDIP carried out an offending analysis in March 2011 which tracked clients offending history one year before and after the CDIP start date. The Estimated decrease in known offending26 comparing one year before and one year27 after engagement is 46% (comparable to Jan 2010
26 Those offences recorded on the police national computer (PNC) 27 Estimated for those not engaged for the full 12 months
Huntingdonshire Strategic Assessment Page 38 of 59

was 52%). Accounting for 7.3 months engagement, the estimated decrease in Acquisitive Crime one year after was 47% and Serious Acquisitive Crime was 91%. This is calculated for all offenders in the sample and may not reflect the average individual change. Feedback from the 2010 CDAAT service user events held throughout the county was very positive about the accessibility of the DIP to clients, the quality of treatment and key working whilst engaged with the service. It is rewarding to note that the qualitative feedback on DIP treatment provides a positive endorsement of the service over and above the quantitative performance measures. In addition, according to the CDIP client survey in April 2011 (n=19), the clients drug spend has reduced nearly 80% after they completed DIP compared with prior engagement. The current self admitted drug usage data suggested that 32% (n=6) of clients have been clean after working with DIP. In terms of areas of support, most clients surveyed cited “treatment” as a main factor that helped with engaging with CDIP. Well being, Accommodation and Employment are identified as the other most important areas of support.
Other Substance Misuse issues
Luminus ASB data shows that reporting of drugs misuse by their tenants is up on 2 years ago, whereas most categories have shown reductions. Whilst the number are low (26 complaints this year) this is almost double the figure for 2 years ago. The rate of people in treatment for Drug misuse 2.14 per 1000 population is lower than the County figure, 2.53. The rate of people in treatment for alcohol misuse 1.37 per 1000 is slightly higher than the County figure 1.27. 27% of probation clients had a drug misuse problem and nearly half had an alcohol misuse problem. Drug offences in Huntingdonshire have decreased slightly by 5.9% (2009/10 compared with 2010/11). The police risk / harm matrix scores this topic area relatively highly. As noted previously the rate of offences detected in Huntingdon town centre is relatively low.
Discussion and Recommendations
RECOMMENDATION NINE :To ensure that Lord Bradley’s recommendation: “improved services for prisoners who have a dual diagnosis of mental health and drugs/alcohol problems” is implemented in Cambridgeshire. RECOMMENDATION TEN: To ensure that there is an effective link between Alcohol treatment services and IOM by identify named workers within Alcohol services to link with the scheme. Currently the DIP is only funded to provide support for offenders with Class A drug habit and whilst CARAT (Counselling Assessment Referral Advice and Throughcare) is a drug service that is available in every prison in the UK, there is a gap in alcohol treatment services in many establishments. Therefore, it is important that the offenders with alcohol dependence have sufficient support in prisons and post release. RECOMMENDATION ELEVEN: It is recommended that an evaluation of the effectiveness of IOM during its first year of operation is commissioned.
Huntingdonshire Strategic Assessment Page 39 of 59

Understanding the effectiveness of interventions is crucial to making the most of resources and structuring future work. The CDIP analysis has limitations. It is recommended that a more robust evaluation is commissioned. This should include calculations of modal change in offending i.e. the change in offending seen by ‘most’ offenders, analysis examining the change in the level of seriousness of offending, long-term changes in behaviour and offending and treatment. This would enable a more balanced look at the whether DIP is effecting long-term sustained impact.
Huntingdonshire Strategic Assessment Page 40 of 59

Young People as Offenders
Offending Profile
The profile of younger victims of crime is shown in Chart five on page sixteen. A similar profile of young people as offenders was also produced. It showed that young people committed a broader range of offences compared to that which they were victims of (this is unsurprising given the limited property ownership amongst young people). Table 10: the most frequent offences committed by young people in Huntingdonshire
% of all offences
committed by Young
People Theft From A Shop 15% Criminal Damage 15% Common Assault 13% Actual Bodily Harm 10% Theft From A Vehicle 7% Possession Of Controlled Drugs (Cannabis) 6% (Causing) Public Fear, Alarm Or Distress 6% Burglary In a Dwelling 5% Burglary In a Building Other Than A Dwelling 3% Other Offences Against The State & Public Order 2% Other Theft 2% Theft In A Dwelling Other Than From An Automatic Machine Or Meter 2% Other offences 13%
Young People Offending for the first time
Data from the youth offending service provides us with an insight into the rates of young people committing offences and entering the criminal justice system for the first time. Averaged over three years there are particular wards within the County that generate more first-time offenders than others. The Huntingdonshire figures show that the Huntingdon North ward and the area immediately adjacent to it consistently produce a high rate of first time offenders (see Map 3 over the page).
Huntingdonshire Strategic Assessment Page 41 of 59

Map 3: Rate of First Time Entrants to the Criminal Justice System
Huntingdonshire Strategic Assessment Page 42 of 59

The Causes of Offending Amongst Young People There has been a significant amount of work carried out to show both the casues and the protective factors regarding offending amongst young people. Theses are summed up below with the summary of a study carried out by Sutton & Utting28.
28 Support from the Start, DfES Research Report 524, Sutton, Utting & Farrington, 2004
Huntingdonshire Strategic Assessment Page 43 of 59

Looking at the age profile of Cambridgeshire Young Offenders; relatively few come to the attention of criminal justice agencies prior to the age of nine so many of the opportunities for diversion present themselves to agencies such as social services. There are prior indicators of the risks such as the rates of truancy (see map 4 below) which highlights Huntingdon North. Chart 13: The Rate per 1000 child referrals to children’s social care services
Rate per 1000 child referrals to children's social care services
0.0
5.0
10.0
15.0
20.0
25.0
30.0
35.0A
lcon
bury
and
The
Stu
kele
ys
Bra
mpt
on
Buc
kden
Ear
ith
Elli
ngto
n
Elto
n an
d Fo
lksw
orth
Fens
tant
on
God
man
ches
ter
Gra
nsde
n an
d Th
e O
fford
s
Hun
tingd
on E
ast
Hun
tingd
on N
orth
Hun
tingd
on W
est
Kim
bolto
n an
d S
taug
hton
Littl
e P
axto
n
Ram
sey
Saw
try
Som
ersh
am
St I
ves
Eas
t
St I
ves
Sou
th
St I
ves
Wes
t
St N
eots
Eat
on F
ord
St N
eots
Eat
on S
ocon
St N
eots
Eyn
esbu
ry
St N
eots
Prio
ry P
ark
Stil
ton
The
Hem
ingf
ords
Upw
ood
and
The
Rav
eley
s
War
boys
and
Bur
y
Yax
ley
and
Farc
et
Ward
Rat
e pe
r 100
0
Also looking at the data on victimization it is clear that children living in some parts of the partnership area are much more likely to be referred to children’s social care compared to others. Again Huntingdon North ward is highlighted as the main area of risk. The ward rate for identified offenders is shown in the following graph. It shows that the level of offending in Huntingdon North ward is much more marked compared to the level of victimization (see chart 6). For this ward, as well as shop theft and common assault being common the more serious offences of dwelling burglary were also relatively high compared to the general offending profile for young people. Chart 14: Rates of child (aged 10-15) offending by ward, Sept 2010 to Aug 2011
Rate of offending for children aged 10-15
0.0
1.0
2.0
3.0
4.0
5.0
6.0
7.0
Alc
onbu
ry a
nd T
he S
tuke
leys
Bra
mpt
on
Buc
kden
Ear
ith
Elli
ngto
n
Elto
n an
d Fo
lksw
orth
Fens
tant
on
God
man
ches
ter
Gra
nsde
n an
d Th
e O
fford
s
Hun
tingd
on E
ast
Hun
tingd
on N
orth
Hun
tingd
on W
est
Kim
bolto
n an
d S
taug
hton
Littl
e P
axto
n
Ram
sey
Saw
try
Som
ersh
am
St I
ves
Eas
t
St I
ves
Sou
th
St I
ves
Wes
t
St N
eots
Eat
on F
ord
St N
eots
Eat
on S
ocon
St N
eots
Eyn
esbu
ry
St N
eots
Prio
ry P
ark
Stil
ton
The
Hem
ingf
ords
Upw
ood
and
The
Rav
eley
s
War
boys
and
Bur
y
Yax
ley
and
Farc
et
Ward
Rat
e pe
r 100
0
* Figure for Upwood has been adjusted to take account of a group of ‘spree’ offences, theft from vehicles one specific day.
Huntingdonshire Strategic Assessment Page 44 of 59

Discussion and Recommendations
RECOMMENDATION TWELVE: The partnership should consider the strength of initiatives in the district that are aimed to reduced young people offending; particularly covering Huntingdon North Ward. Are we intervening early enough to divert young people away from offending behaviour? RECOMMENDATION THIRTEEN: Given the link between young people offending and Community, Personal and Parenting factors (particularly during early years) it is vital that the partnership considers if the current level of engagement with the partnership by Children’s Services, Children’s Health Services and the Youth Offending Service is sufficient. This is particularly the case given the level of intervention required to reduce the high rate of offending by young people living in Huntingdon North.
Huntingdonshire Strategic Assessment Page 45 of 59

Appendices
Appendix 1: Methodology
Structure
From 2010 it was decided that the structure of the document should follow the “Crime Problem Analysis Triangle” (PAT):
The model stems from the Routine Activity Theory29. The theory states that crime is normal and levels of crime are dependant on the opportunities available. The role of victims, their environment, and the context around which a crime occurs is considered to be more important and have greater impact on the likelihood of a crime occurring than social issues such as poverty or financial depression. The PAT incorporates this, looking at the opportunity structure around a crime or set of crimes. The concept is that for a crime to occur, it is necessary to have the following:
• A suitable victim – either a person or an object, suitably vulnerable and offering an attractive ‘reward’.
• An appropriate place – for example a deserted park, or an unlit alleyway. • The ‘likely’ offender – with a motive, and present with the target at the right place, and the
right time. For each of these three there is a deterrent, as highlighted in the triangle above, and it is the deterrent that the CSP will need to consider. By analysing victims, places and offenders in turn, we aim to identify commonalities and trends, and offer guidance on points where a handle, manager or guardian could be placed to reduce the level of crime.
29 (Cohen & Felson, 1979)
Huntingdonshire Strategic Assessment Page 46 of 59

Appendix 2: Summary of Data Sources & Technical Notes
Data Sources
The following data sources were used as part of the 2011 strategic assessments for Cambridgeshire. Where information is not directly available with a particular strategic assessment then it may have been used for another district assessment or analyzed by the research team but not quoted directly. • Cambridgeshire County Council - First time entrants to the criminal justice system 2007/08 & 2008/09 - Educational attainment 2008/09 - Unauthorized absence 2008/09 - School exclusions 2009 - Children Referred to Children’s Services (Social Services) 2008/09 - Cases referred to the Independent Domestic Violence Advocacy Service (IDVAS) 2008/09 - ‘Letters to schools’ relating to DV 2006/07 to 2008/09 - Cases referred to the Multi-Agency Risk Assessment Conference (for domestic abuse/violence), MARAC, 2008/09 - Cases referred to the Vulnerable Adults Service 2008/09 - Results of the 2010 neighbourhood survey & other consultation findings - Demographic and other data provided by the County Council Research & Performance team • Cambridgeshire DAAT - Numbers in treatments 2008/09 - Results of the Balding Health Survey 2008 and Tellus Survey 2008 - Numbers in treatment (Inc background) with Cambridgeshire DIP 2008/09 - General background material on drug-misuse in Cambridgeshire • Cambridge City Council - Recent data from environmental service teams including Intravenous Needle Finds, reports of fly-tipping, abandoned vehicles and graffiti. (Exact content varies between district council). - Incidents of anti-social behavior reported to the district council. - Update on CDRP performance - Consultation with residents • East Cambridgeshire District Council - Recent data from environmental service teams including Intravenous Needle Finds, reports of fly-tipping, abandoned vehicles and graffiti. (Exact content varies between district council). - Incidents of anti-social behavior reported to the district council. - Update on CDRP performance • Huntingdonshire District Council - Recent data from environmental service teams including Intravenous Needle Finds, reports of fly-tipping, abandoned vehicles and graffiti. (Exact content varies between district council). - Incidents of anti-social behavior reported to the district council. - Update on CDRP performance • Fenland District Council - Recent data from environmental service teams including Intravenous Needle Finds, reports of fly-tipping, abandoned vehicles and graffiti. (Exact content varies between district council). - Update on CDRP performance
Huntingdonshire Strategic Assessment Page 47 of 59

- Incidents of anti-social behavior reported to the district council. • South Cambridgeshire District Council - Recent data from environmental service teams including Intravenous Needle Finds, reports of fly-tipping, abandoned vehicles and graffiti. (Exact content varies between district council). - Incidents of anti-social behavior reported to the district council. - Update on CDRP performance • Cambridgeshire Constabulary - All offences committed between Sept 2008 to August 2009 - Past data on offences committed - CORA performance reporting tool - Identified offenders and victims of all offences committed between Sept 2008 to August 2009 - Various analytical products and documents produced by the analytical team of Cambridgeshire Constabulary - Neighborhood Police priorities for the previous 12 months - All incidents of ASB reported to the Constabulary up until August 2009 - Past data on ASB incidents. • Cambridgeshire Fire & Rescue Service - All arson incidents reported to the fire service up to August 2009 • East of England Ambulance Service NHS Trust - Historic data on incidents of violence assault, overdoes and unconsciousness reported to the Ambulance Trust. However it should be noted that the Ambulance Trust has withdrawn from information sharing and declined to share data for the 2009 assessments. • Addenbrookes Hospital (Cambridge University Hospitals NHS Foundation Trust - Reports of time / location of assault from victims presenting themselves to the A&E department. • NHS Cambridgeshire - See Cambridgeshire DAAT and trust information above - Summary of Road Traffic Accident Report 2008/09 • Cambridgeshire Probation Service - Analysis of current case-load of Cambridgeshire Probation Service including CDRP location, Tier of Offender, Needs Assessment and Order Type.
Huntingdonshire Strategic Assessment Page 48 of 59

Technical Notes on Analysis
Geographical Coding Data supplied to the County Council Research Team from the Constabulary on offences committed in the County contains grid references. For the sake of consistency the Research Group uses the grid references supplied to label the data with a large set of geographical labels which includes the following:
• District • Ward • Parish • LSOA • Neighbourhood • Town Centre • Pub Cluster
This labelling is done within the MapInfo Geographical Information System. Subsequent analysis of the data for geographical units such as wards use the Research Group labels rather than any that might have been supplied with the data. This can lead to a slight difference in counts in the number of crimes occurring in a particular ward for the same time period between the Research Group and the Police but the advantage is that all partnership data is coded to the same level of consistency and accuracy and that this accuracy is controlled by those carrying out the analysis. Identifying Town Centres Ward and other administrative boundary lines can cut across town centres e.g. for the town centre of March. Therefore an alternative standard set of town centre boundaries is needed. For the strategic assessment the boundaries of ‘Retail Cores in England & Wales for 2004’ were used. The names of the Retail Cores, together with their boundary sizes and statistics on the number of retail employees and the floorspace and rateable value of retail properties within the retail cores have been published on the CLG State of the Cities Database (http://www.socd.communities.gov.uk/SOCD). Boundaries are also available and can be obtained by emailing [email protected]. A small number of towns in Cambridgeshire were not on the published ‘retail core’ layer (these included Littleport and Soham) for these an approximation for each town centre was produced by the Research Group. This was done with reference to the relative size of other ‘retail cores’. Hot Spot Mapping The method of crime ‘hotspot’ mapping used by the Research Group is called Kernel Density Estimation and it is an accepted standard in producing crime hotspot maps. See http://www.jdi.ucl.ac.uk/crime_mapping/index.php for more details on the methodology for crime mapping. The specific tool we used is an add-in to MapInfo called HS Gridder and it is sold under licence in the UK by the CDR group. See the following link for more information. http://www.cdrgroup.co.uk/index.htm?sales_3rdparty_HS_Gridder.htm~mainframe Balding Survey The Health Related Behaviour Questionnaire (Balding Survey) is completed every two years by most year 8 (12-13 years old) and year 10 students (14-15 years old) in Cambridgeshire. A total of 2,852 Huntingdonshire pupils completed the 2010 survey. There are 15 questions around “Stay safe” topic, which are ranging from bullying at school, safety in the neighbourhood, carrying weapons, violence at home and internet safety. A summary of the responses from Huntingdonshire pupils are as follows:
Huntingdonshire Strategic Assessment Page 49 of 59
IQuanta For the strategic assessments we used data and comparative information from iQuanta. The iQuanta website provides a large repository of analyses on current policing and community safety performance in England and Wales. It helps the policing and crime reduction community to focus on performance management and to track progress in improving performance. The analyses are provided in a range of graphical charts and tables. They allow you to compare current performance against peers, identify significant changes in performance and track progress towards Local Area Agreement (LAA) targets. Analyses are available at force, Basic Command Unit (BCU) and Crime and Disorder Reduction Partnership (CDRP) level. iQuanta supports the Assesments in Policing and Community Safety (APACS) framework with analysis of APACS performance indicators and key diagnostic indicators, as well as, transitionally, the policing performance measures in the former Policing Performance Assessment Framework (PPAF). iQuanta is provided by the Performance Strategy Directorate of the Home Office. Most Similar Groups (MSGs) Peer comparisons in iQuanta are made using ‘Most Similar’ comparison groups. These groups provide a benchmark for comparison of crime rates and other indicators with similar areas elsewhere in England & Wales. They also help to identify similar areas which are performing well, to promote the sharing of good practice. How are the MSF and Most Similar groups calculated? Analysis identified a number of socio-demographic and geographic variables which were strongly linked to increased levels of crime, fear of crime, or incidents. These variables were then combined using a technique called principal components analysis (PCA) to determine new, independent factors that best describe the variation between areas. The Most similar groups are determined by identifying the units which are most similar on the basis of these factors. Units are compared in pairs to find the difference or 'distance' between them for each variable. The overall difference between the pairs of units is calculated by summing the squared difference for all the variables. For CDRPs the 14 units with the smallest overall distance from the selected unit are identified. Road Safety The joint casualty report was based on the casualty data from the following sources: • STATS19 data collected by Cambridgeshire Constabulary about personal injury accidents occurring in
Cambridgeshire and Peterborough. • National Statistics mortality data taken from the Compendium of Clinical and Health Indicators about the
numbers of Cambridgeshire residents’ deaths attributed to motor vehicle traffic accidents; and • NHS data about people attending accident and emergency departments as a result of road traffic
accidents, and people admitted to hospital as a result of land based transport accidents. Risk of being killed in a land based transport accident Standardised mortality ratios (SMRs) are based on registered deaths to Cambridgeshire residents, irrespective of place of occurrence. SMRs allow comparison of populations with different age and sex structures. Calculation of SMRs involves applying national age-specific deaths rates to the local population in order to calculate a ratio of expected to observed deaths. This figure is then multiplied by 100. The comparative national figure will conventionally be 100 – a local figure of 105 therefore indicates an increased incidence or risk of 5%, a local figure of 95 indicates a risk 5% lower. SMRs are indirectly age-standardised so the SMR itself can only be compared with the population it is standardised to, i.e. in our case England (SMR=100), and individual SMRs cannot be compared to one another.
Huntingdonshire Strategic Assessment Page 50 of 59

Appendix 3: Additional Scanning Data Tables
Table 11: Long Term Trend in Arson Arson: Total Fires - Fire Service Data
Cambs East C Fenland Hunts South C Total2010/11 90 49 177 137 59 512% of Total 18% 10% 35% 27% 12% 100%
2009/10 113 63 189 252 110 727Percentage of Total 16% 9% 26% 35% 15% 100%
2008/09 191 89 236 271 161 948Percentage of Total 20% 9% 25% 29% 17% 100%
2007/08 210 97 250 324 216 1097Percentage of Total 19% 9% 23% 30% 20% 100%
# change from 07/08-01/11 -120 -48 -73 -187 -157 -585% change from 07/08-01/11 -57% -49% -29% -58% -73% -53% Table 12: Violent offences within the ‘pub clusters’ of Huntingdon
District Pub ClustersCount of Premises
Square Meters
Square Miles
All Violence Offences
All Drug Offences
All Violence Offences
All Drug Offences
All Violence Offences
All Drug Offences
HuntingdonSt Neots East 19 674712 0.26 124 18 6.5 0.9 476 69HuntingdonSt Neots West 7 343226 0.13 9 3 1.3 0.4 68 23HuntingdonSt.Ives Centre 12 297666 0.11 66 4 5.5 0.3 574 35HuntingdonHuntingdon 8 265419 0.10 115 15 14.4 1.9 1122 146HuntingdonRamsey 5 190441 0.07 28 1 5.6 0.2 381 14
Rate per Premises Rate per Sq Mile
Chart 15: Monthly trend of dwelling burglary in Huntingdonshire
Dwelling Burglary - Monthly Trends
0
10
20
30
40
50
60
70
80
90
100
April
MayJu
ne July
Augus
t
Septem
ber
Octobe
r
Novem
ber
Decem
ber
Janu
ary
Februa
ryMarc
h
Month
Num
ber o
f Offe
nces
3-year rolling average 2010/11 2011/12 Tipping point - burglary
Huntingdonshire Strategic Assessment Page 51 of 59

Understanding the level of seriousness of Domestic Violence
Crimes recorded by the police can be allocated a domestic violence marker to indicate the relationship between the offender and the victim. For the purposes of our analysis we have looked at offences where the offender is either a partner or ex-partner. Unsurprisingly the vast majority of the offences committed are violent crimes. Within the violent crime category the offences range from harassment to attempted murder. The level of seriousness of offences shown within the table below provides some guidance as to the level of risk that the Huntingdonshire partnership faces in regards to its duties should there be a domestic violence related homicide. Table 13: The relative seriousness of domestic violence in Huntingdonshire
Offence Seriousness Volume Cumulative Percentage
% of all offences in Hunts
Harassment (inc alarm & distress)
Low 25 9% 11%
Common Assault 126 52% 28% Actual Bodily Harm 123 94% 22%
Sexual Assault Medium 1 95% 2% Wounding 7 97% 20%
Threats to kill 5 99% 22% Rape 3 100% 17%
Attempted Murder High 1 100% 50% Total 291 - -
Total Recorded Incidents 2,316
- -
Ratio of incidents to crimes 13 to 1 - -
Huntingdonshire Strategic Assessment Page 52 of 59

Table 14: Latest Crime Performance Figures – Last Three Months
From To From To From ToAug-10 Aug-11 Jun-10 Aug-10 Jun-11 Aug-11
All Crime 744 653 -91 - 12.2% -332 - 13.6%BCS Comparator Crime 391 340 -51 - 13.0% -145 - 11.8%Serious Acquisitive Crime 5.2 / 16 102 94 -8 - 7.8% 36 + 12.7%
+ 27.7%+ 400.0% + 87.5%
+ 1.6%
+ 4.9%
+ 133.3%
+ 400.0% + 87.5%
+ 16.7%
+ 66.7% + 22.7%
+ 500.0% + 75.0%
+ 100.0%
Burglary Dwelling 39 29 -10 - 25.6% 26All Robbery 1 5 4 7
Vehicle Crime 62 60 -2 - 3.2% 3Aggravated vehicle taking 2 0 -2 - 100.0% -4 - 57.1%
Theft from vehicle 48 48 0 = 7Theft of a Vehicle 12 12 0 = 0 No Calc
Handling Stolen Goods 4 1 -3 - 75.0% -2 - 28.6%Most Serious Violence 5.1 / 15 6 4 -2 - 33.3% -6 - 24.0%Homicides 1 0 -1 - 100.0% -1 - 100.0%Wounding Endangering Life 4 4 0 = -9 - 42.9%Grievous Bodily Harm without Intent 1 0 -1 - 100.0% 4Assaults With Less Serious Injury 5.3 / 20 61 48 -13 - 21.3% -56 - 28.7%All Recorded Violence with Injury 67 52 -15 - 22.4% -61 - 27.7%Public Fear, Alarm or Distress 21 26 5 23.8% -29 -34.5%Serious Sexual Offences 14 4 -10 - 71.4% -16 - 41.0%
Rapes 7 1 -6 - 85.7% -10 - 58.8%Sexual Assaults 5 3 -2 - 40.0% -3 - 16.7%
Other Serious Sexual Offences 2 0 -2 - 100.0% -3 - 75.0%All Violent Crime 162 139 -23 - 14.2% -124 - 22.4%
All Violence Against the Person 141 127 -14 - 9.9% -109 - 22.1%All Sexual Offences 20 7 -13 - 65.0% -22 - 42.3%
All Robbery 1 5 4 7Criminal Damage 150 119 -31 - 20.7% -81 - 17.8%
All Damage to Dwellings 36 31 -5 - 13.9% -5 - 5.9%All Damage to Other Buildings 16 9 -7 - 43.8% -17 - 44.7%
All Damage to Vehicles 56 51 -5 - 8.9% -15 - 8.3%All Other Damage 36 21 -15 - 41.7% -37 - 28.9%
Arson 6 7 1 -7 - 29.2%All Theft and Handling 263 235 -28 - 10.6% -87 - 10.0%
Shoplifting 65 42 -23 - 35.4% -25 - 16.0%Theft from the Person 8 7 -1 - 12.5% -16 - 37.2%
Theft in a Dwelling 3 5 2 5Theft of Pedal Cycles 26 26 0 = -14 - 15.6%
Other Classified Thefts & Handling 98 89 -9 - 9.2% -46 - 12.5%Vehicle Interference 1 6 5 6
All Racially Aggravated Crime 4 4 0 = -8 - 50.0%All Racially Aggravated Violence 2 4 2 -6 - 42.9%
All Racially Aggravated Harassment 1 0 -1 - 100.0% -1 - 100.0%All Racially Aggravated Damage 1 0 -1 - 100.0% -1 - 100.0%
All Drugs Offences 31 36 5 16.1% 2 1.5%Drugs (Trafficking) 6 5 -1 -16.7% 10 50.0%
Drugs (Simple Possession) 25 31 6 24.0% -8 -7.1%Drugs (Other Offences) 0 0 0 No Calc 0 No Calc
38 21
429384
18
84 55
15
151
553
12
7
220 159
17
4
455
If inaccurate dates are entered in the period searches (e.g. if the end date precedes the
start date) all cells will display zeros.
25
PI / NI No Numeric Change
182
19
195 139
39 23
7
0
3
121
156 131
8
91180 165
85 80
17
374
43 2727
133 135
14 81 01 0
30113 105
814
76323
Categories coloured white constitute a breakdown of the category in grey immediately above it.
20
22
168
90369
0 0
Single MonthApparent Change
Earlier Period
7
Apparent Change
2,445 2,113
870
12824
49352 30
783
Numeric Change
284 32094 120
1,234
Later Period
1,089
5
1858
714332
315032
15
Huntingdonshire Strategic Assessment Page 53 of 59

Table 15:Latest Crime Performance Figures – Last Six Months
From To From To From ToAug-10 Aug-11 Mar-10 Aug-10 Mar-11 Aug-11
All Crime 744 653 -91 - 12.2% -729 - 15.3%BCS Comparator Crime 391 340 -51 - 13.0% -226 - 9.4%Serious Acquisitive Crime 5.2 / 16 102 94 -8 - 7.8% 28 + 4.8%
+ 23.5%+ 400.0%
Burglary Dwelling 39 29 -10 - 25.6% 42All Robbery 1 5 4 -1 - 4.0%
Vehicle Crime 62 60 -2 - 3.2% -13 - 3.4%Aggravated vehicle taking 2 0 -2 - 100.0% -4 - 40.0%
Theft from vehicle 48 48 0 = 1Theft of a Vehicle 12 12 0 = -10 - 15.2%
Handling Stolen Goods 4 1 -3 - 75.0% 0 No CalcMost Serious Violence 5.1 / 15 6 4 -2 - 33.3% -19 - 43.2%Homicides 1 0 -1 - 100.0% -2 - 100.0%Wounding Endangering Life 4 4 0 = -22 - 59.5%Grievous Bodily Harm without Intent 1 0 -1 - 100.0% 5Assaults With Less Serious Injury 5.3 / 20 61 48 -13 - 21.3% -53 - 16.3%All Recorded Violence with Injury 67 52 -15 - 22.4% -71 - 19.2%Public Fear, Alarm or Distress 21 26 5 23.8% -62 -38.8%Serious Sexual Offences 14 4 -10 - 71.4% -19 - 31.7%
Rapes 7 1 -6 - 85.7% -17 - 60.7%Sexual Assaults 5 3 -2 - 40.0% -5 - 16.7%
Other Serious Sexual Offences 2 0 -2 - 100.0% 3All Violent Crime 162 139 -23 - 14.2% -223 - 22.1%
All Violence Against the Person 141 127 -14 - 9.9% -195 - 21.7%All Sexual Offences 20 7 -13 - 65.0% -27 - 31.8%
All Robbery 1 5 4 -1 - 4.0%Criminal Damage 150 119 -31 - 20.7% -132 - 14.1%
All Damage to Dwellings 36 31 -5 - 13.9% -14 - 8.0%All Damage to Other Buildings 16 9 -7 - 43.8% -33 - 35.5%
All Damage to Vehicles 56 51 -5 - 8.9% -15 - 4.1%All Other Damage 36 21 -15 - 41.7% -73 - 27.2%
Arson 6 7 1 3All Theft and Handling 263 235 -28 - 10.6% -136 - 8.3%
Shoplifting 65 42 -23 - 35.4% -28 - 9.7%Theft from the Person 8 7 -1 - 12.5% -9 - 18.0%
Theft in a Dwelling 3 5 2 -1 - 2.3%Theft of Pedal Cycles 26 26 0 = -15 - 8.9%
Other Classified Thefts & Handling 98 89 -9 - 9.2% -83 - 12.0%Vehicle Interference 1 6 5 13
All Racially Aggravated Crime 4 4 0 = -18 - 54.5%All Racially Aggravated Violence 2 4 2 -15 - 50.0%
All Racially Aggravated Harassment 1 0 -1 - 100.0% -2 - 100.0%All Racially Aggravated Damage 1 0 -1 - 100.0% -1 - 100.0%
All Drugs Offences 31 36 5 16.1% -13 -5.9%Drugs (Trafficking) 6 5 -1 -16.7% 8 25.8%
Drugs (Simple Possession) 25 31 6 24.0% -21 -11.1%Drugs (Other Offences) 0 0 0 No Calc 0 No Calc
93 60
787705
30
160 98
24
255
1,010
15
11
370 299
28
2
938
If inaccurate dates are entered in the period searches (e.g. if the end date precedes the
start date) all cells will display zeros.
44
PI / NI No Numeric Change
385
25
326 273
60 41
10
0
5
237
289 261
25
195363 348
176 162
41
806
50 4142
220 207
30 152 01 0
39189 168
1529
154611
Categories coloured white constitute a breakdown of the category in grey immediately above it.
31
43
3316
169694
0 0
Single MonthApparent Change
Earlier Period
8
Apparent Change
4,770 4,041
1,646
26838
90085 58
1,510
Numeric Change
589 617179 221
2,401
Later Period
2,175
8
37225
1030966
631056
24
+ 0.3%
+ 100.0%
+ 150.0%
+ 400.0%
+ 16.7% + 7.9%
+ 66.7%
+ 500.0% + 81.3%
+ 100.0%
Huntingdonshire Strategic Assessment Page 54 of 59
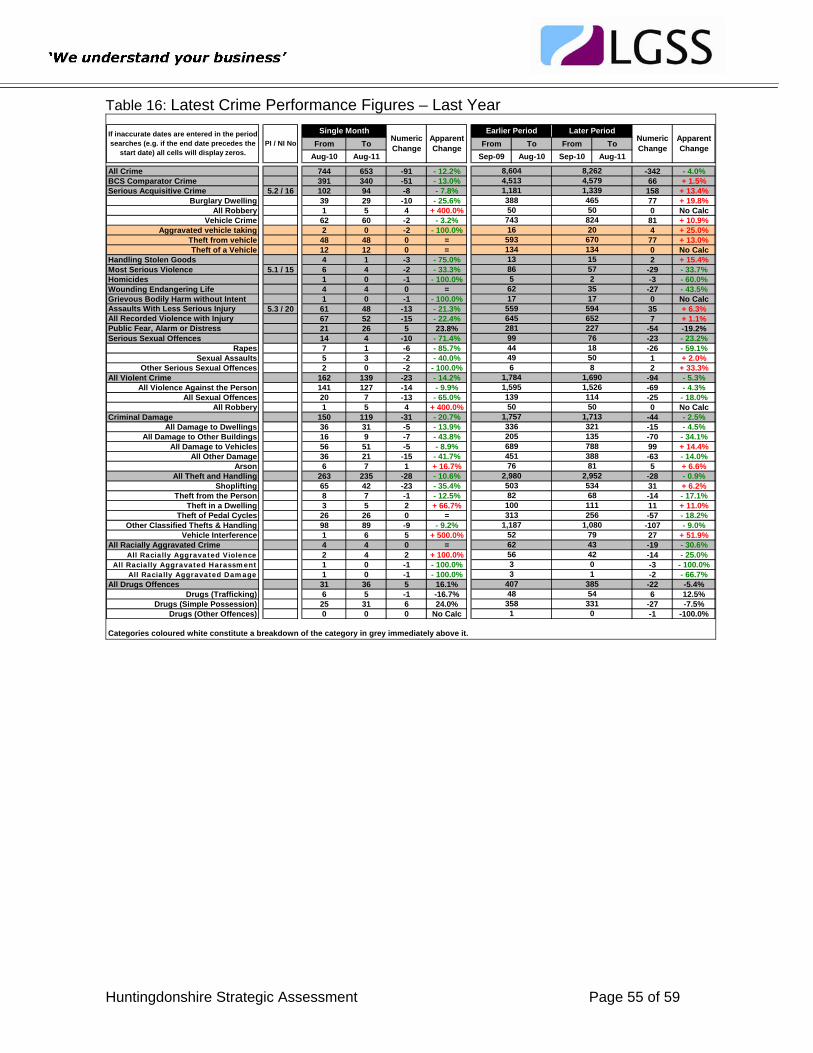
Table 16: Latest Crime Performance Figures – Last Year
From To From To From ToAug-10 Aug-11 Sep-09 Aug-10 Sep-10 Aug-11
All Crime 744 653 -91 - 12.2% -342 - 4.0%BCS Comparator Crime 391 340 -51 - 13.0% 66 + 1.5%
+ 13.4%+ 19.8%
+ 400.0%+ 10.9%+ 25.0%+ 13.0%
+ 15.4%
+ 6.3%+ 1.1%
+ 2.0%+ 33.3%
+ 400.0%
+ 14.4%
+ 16.7% + 6.6%
+ 6.2%
+ 66.7% + 11.0%
+ 500.0% + 51.9%
+ 100.0%
Serious Acquisitive Crime 5.2 / 16 102 94 -8 - 7.8% 158Burglary Dwelling 39 29 -10 - 25.6% 77
All Robbery 1 5 4 0 No CalcVehicle Crime 62 60 -2 - 3.2% 81
Aggravated vehicle taking 2 0 -2 - 100.0% 4Theft from vehicle 48 48 0 = 77Theft of a Vehicle 12 12 0 = 0 No Calc
Handling Stolen Goods 4 1 -3 - 75.0% 2Most Serious Violence 5.1 / 15 6 4 -2 - 33.3% -29 - 33.7%Homicides 1 0 -1 - 100.0% -3 - 60.0%Wounding Endangering Life 4 4 0 = -27 - 43.5%Grievous Bodily Harm without Intent 1 0 -1 - 100.0% 0 No CalcAssaults With Less Serious Injury 5.3 / 20 61 48 -13 - 21.3% 35All Recorded Violence with Injury 67 52 -15 - 22.4% 7Public Fear, Alarm or Distress 21 26 5 23.8% -54 -19.2%Serious Sexual Offences 14 4 -10 - 71.4% -23 - 23.2%
Rapes 7 1 -6 - 85.7% -26 - 59.1%Sexual Assaults 5 3 -2 - 40.0% 1
Other Serious Sexual Offences 2 0 -2 - 100.0% 2All Violent Crime 162 139 -23 - 14.2% -94 - 5.3%
All Violence Against the Person 141 127 -14 - 9.9% -69 - 4.3%All Sexual Offences 20 7 -13 - 65.0% -25 - 18.0%
All Robbery 1 5 4 0 No CalcCriminal Damage 150 119 -31 - 20.7% -44 - 2.5%
All Damage to Dwellings 36 31 -5 - 13.9% -15 - 4.5%All Damage to Other Buildings 16 9 -7 - 43.8% -70 - 34.1%
All Damage to Vehicles 56 51 -5 - 8.9% 99All Other Damage 36 21 -15 - 41.7% -63 - 14.0%
Arson 6 7 1 5All Theft and Handling 263 235 -28 - 10.6% -28 - 0.9%
Shoplifting 65 42 -23 - 35.4% 31Theft from the Person 8 7 -1 - 12.5% -14 - 17.1%
Theft in a Dwelling 3 5 2 11Theft of Pedal Cycles 26 26 0 = -57 - 18.2%
Other Classified Thefts & Handling 98 89 -9 - 9.2% -107 - 9.0%Vehicle Interference 1 6 5 27
All Racially Aggravated Crime 4 4 0 = -19 - 30.6%All Racially Aggravated Violence 2 4 2 -14 - 25.0%
All Racially Aggravated Harassment 1 0 -1 - 100.0% -3 - 100.0%All Racially Aggravated Damage 1 0 -1 - 100.0% -2 - 66.7%
All Drugs Offences 31 36 5 16.1% -22 -5.4%Drugs (Trafficking) 6 5 -1 -16.7% 6 12.5%
Drugs (Simple Possession) 25 31 6 24.0% -27 -7.5%Drugs (Other Offences) 0 0 0 No Calc -1 -100.0%
205 135
1,6901,526
49
281 227
50
508
1,784
35
18
645 652
44
6
1,757
If inaccurate dates are entered in the period searches (e.g. if the end date precedes the
start date) all cells will display zeros.
86
PI / NI No Numeric Change
743
57
559 594
99 76
17
2
17
562
503 534
50
388689 788
336 321
81
1,713
82 68111
407 385
56 423 03 1
54358 331
4379
2561,080
Categories coloured white constitute a breakdown of the category in grey immediately above it.
48
100
6252
3131,187
1 0
Single MonthApparent Change
Earlier Period
13
Apparent Change
8,604 8,262
2,980
45176
1,595139 114
2,952
Numeric Change
1,181 1,339388 465
4,513
Later Period
4,579
15
82450
16593134
20670134
50
Huntingdonshire Strategic Assessment Page 55 of 59

Additional Maps Map 4: Police Recorded Domestic Violence Incidents
Huntingdonshire Strategic Assessment Page 56 of 59

Map 5: Rate of Episodes of Exclusion for Primary Schools
Huntingdonshire Strategic Assessment Page 57 of 59

Appendix 4: DIP Case Study
Andy (pseudonym) - Male 25 years
Type Of Intervention Involved:
- Access to prescribing
- One-to-one work
- Motivational Interviewing
- Preparation for employment
The case and outcome:
Andy began smoking heroin at the age of 16 years. At the age of 22 years he began shoplifting to fund his habit. Andy’s offending behaviour led to him being adopted as a Prolific or Priority Offender (PPO) and made subject of an Anti Social Behaviour Order (ASBO). His heroin use peaked in 2009 at which point he was smoking between 5-8 bags a day.
Andy came to CDIP in May 2010 when he was released from Prison. He briefly engaged with mainstream services but asked to transfer to CDIP as he felt that he required more intensive support. When Andy came to CDIP he was at a high risk of re-offending.
We immediately started Andy on a 40ml methadone script. He was allocated a Case Manager and a key worker and was offered two appointments per week. Some of these appointments were with either the PPO co-ordinator or the local sector intelligence officer.
Our first challenge was to get Andy free of all illicit drugs and stabilise him on his methadone prescription. After being with the CDIP team for just three weeks Andy was testing negative for all substances except his prescribed methadone.
When Andy first came to DIP he had very little motivation and did not want to work or engage in any training. Once Andy was consistently testing negative his case manager began motivational work with him during his appointments. After being in treatment with CDIP for four months Andy decided that he would like to find employment or start a training course.
Andy and his case manager looked into vocational courses at the local college and Andy decided that he would like to start a plumbing course. However as it was near to Christmas he decided that he would get a job to enable him to buy Christmas presents for his family (as this was the first Christmas that he had spent outside of Prison for three years).
Andy applied for a job in a local factory. He had to undergo a literacy and numeracy test which he passed with flying colours. He then attended an interview (which his case manager had discussed and prepared him for beforehand). Andy did well in the interview and was offered the job.
As a result of Andy remaining drug free and engaging well with CDIP, the Police and the PPO scheme he is now assessed as being at a low risk of re-offending and will be removed from the PPO scheme in the near future. He still has his ASBO in force but has not breached this. He has not offended for over 12 months and has abstained from heroin for 8 months. He has held his job down and continues to work.
Andy has shown an interest in going into schools and youth clubs to talk to teenagers about the danger of drugs and offending. This is a project that he is currently working on with his case manager.
Andy’s success is down to the excellent multi agency working co-ordinated by the Drug Intervention Programme.
Huntingdonshire Strategic Assessment Page 58 of 59

Appendix 5: Constabulary Risk Matrix
To be Inserted
Huntingdonshire Strategic Assessment Page 59 of 59