st neots air quality modelling report - huntingdonshire
TRANSCRIPT

Air Quality Modelling for St Neots
Final report
Prepared forHuntingdonshire District Council
11th August 2017

Report Information
CERC Job Number: FM1129
Job Title: Air quality modelling for St Neots
Prepared for: Huntingdonshire District Council
Report Status: Final
Report Reference: FM1129/Hunts/R2/17
Issue Date: 11th August 2017
Author(s): Catheryn Price, Matthew Williams
Reviewer(s): Sarah Strickland
Issue Date Comments
12
07/08/1711/08/17
DraftFinal

Air quality modelling for St Neots
1
Contents
1 SUMMARY..............................................................................................................................................2
2 INTRODUCTION ......................................................................................................................................3
3 AIR QUALITY STANDARDS.......................................................................................................................4
4 AIR QUALITY MANAGEMENT AREA.........................................................................................................6
5 MEASURED CONCENTRATIONS...............................................................................................................7
6 MODEL SETUP.........................................................................................................................................9
6.1 MODELLING SOFTWARE .................................................................................................................................. 9
6.2 SURFACE ROUGHNESS .................................................................................................................................... 9
6.3 MONIN-OBUKHOV LENGTH ............................................................................................................................. 9
6.4 METEOROLOGICAL DATA............................................................................................................................... 10
6.5 BACKGROUND DATA..................................................................................................................................... 11
6.6 STREET CANYONS ........................................................................................................................................ 11
7 SOURCE DATA.......................................................................................................................................12
7.1 ROAD TRAFFIC ............................................................................................................................................ 12
7.1.1 DfT traffic data.............................................................................................................................. 12
7.1.2 Cambridgeshire County Council traffic data ................................................................................. 13
7.1.3 Transport Assessments ................................................................................................................. 13
7.1.4 Traffic speeds ................................................................................................................................ 13
7.1.5 Emission factors ............................................................................................................................ 13
7.2 HOURLY TRAFFIC VARIATION .......................................................................................................................... 14
7.3 INDUSTRIAL SOURCES ................................................................................................................................... 14
7.4 OTHER SOURCES ......................................................................................................................................... 14
8 MODELLED CONCENTRATIONS .............................................................................................................15
8.1 MODEL VERIFICATION .................................................................................................................................. 15
8.2 CONCENTRATION CONTOUR MAPS .................................................................................................................. 16
9 DISCUSSION..........................................................................................................................................19
APPENDIX A: SUMMARY OF ADMS-URBAN ...................................................................................................20

Air quality modelling for St Neots
2
1 Summary
Part of the centre of St Neots is currently an Air Quality Management Area (AQMA). TheAQMA was declared in 2005, due to concentrations of nitrogen dioxide (NO2) exceeding thenational air quality objectives. This AQMA initially comprised a small area of the HighStreet around a single junction, and was subsequently extended slightly to coverapproximately 500 metres along the High Street, including the junctions of HuntingdonStreet/Church Street and New Street.
In recent years, measured concentrations in St Neots have been decreasing and, since 2010,diffusion tube monitoring in the AQMA has not shown any exceedences of the air qualityobjective. Cambridge Environmental Research Consultants Ltd (CERC) were commissionedby Huntingdonshire District Council (the Council) to carry out modelling to determinewhether or not the air quality objectives are likely to be exceeded in the St Neots AQMA, tosupport the possible revoking of the AQMA.
Air quality modelling was carried out using the ADMS-Urban dispersion model. Themodelling used traffic data from Department for Transport and Cambridgeshire CountyCouncil, together with transport assessments for local planning applications. These wereused with emission factors published by Defra, which were adjusted to take into accountevidence of real-world driving emissions. The modelling also included emissions from LittleBarford Power Station and other sources, taken from the National Atmospheric EmissionsInventory.
Concentrations were calculated at the locations of diffusion tubes in St Neots and themeasured and modelled concentrations compared to verify the suitability of the model inputdata and assumptions. The modelled concentrations generally show very good agreement,with modelled annual average NO2 concentrations at five of the seven monitoring sites within10% of the measured values. In particular, at the two monitoring sites within the AQMA, themodelled concentrations were within 1% and 3% of the measured values, respectively. Themodel setup can therefore be considered appropriate for the modelled area.
Exceedences of the objective value for annual average NO2 concentrations are predictedalong sections of the High Street. However, all of these exceedences occur at locations wherethere is no relevant exposure over the averaging time of a year, so the annual average airquality objective does not apply. Concentrations at the building facades, where the annualaverage objective is relevant, are all below 40 µg/m³.
To take into account uncertainty in the modelling, a value of 36 µg/m³ is sometimes alsoconsidered. The only building façade location at which the modelled concentration exceeds36 µg/m³ is outside the Thomas Morris office, where it reaches 39 µg/m³.
Exceedences of the objective value for hourly average concentrations are only predicted inthe centre of the New Street and Huntingdon Street junctions, i.e. not in areas where thepublic would be expected to have regular access.

Air quality modelling for St Neots
3
2 Introduction
Part of the centre of St Neots is currently an Air Quality Management Area (AQMA). TheAQMA was declared in 2005, due to concentrations of nitrogen dioxide (NO2) exceeding thenational air quality objectives. This AQMA initially comprised a small area of the HighStreet around a single junction, and was subsequently extended slightly to coverapproximately 500 metres along the High Street, including the junctions of HuntingdonStreet/Church Street and New Street.
In recent years, measured concentrations in St Neots have been decreasing and, since 2010,diffusion tube monitoring in the AQMA has not shown any exceedences of the air qualityobjective. Cambridge Environmental Research Consultants Ltd (CERC) were commissionedby Huntingdonshire District Council (the Council) to carry out modelling to determinewhether or not the air quality objectives are likely to be exceeded in the St Neots AQMA, tosupport the possible revoking of the AQMA.
This report describes the data used and assumptions made in the assessment, and presents themodel results. The air quality objectives with which the calculated concentrations are comparedare presented in Section 3. The location and extent of the AQMA is described in Section 4, withmeasured concentrations presented in Section 5. The model setup and source data are describedin Sections 6 and 7, respectively, with the modelled concentrations presented in Section 8. Adiscussion of the results is provided in Section 9.
Air quality modelling for St Neots
4
3 Air quality standards
The Air Quality Strategy for England, Scotland, Wales and Northern Ireland, WorkingTogether for Clean Air, January 2000, defines Air Quality Objective values for NO2 to beachieved by 2005. These objectives are the subject of Statutory Instrument 2000 No. 928,The Air Quality (England) Regulations 2000, which came into force on 6th April 2000.
In the more recent document The Air Quality Strategy for England, Scotland, Wales andNorthern Ireland, July 2007, PM10 objectives to be achieved by 2010 have been removed andan objective for PM2.5 has been added. The NO2 objectives are unchanged.
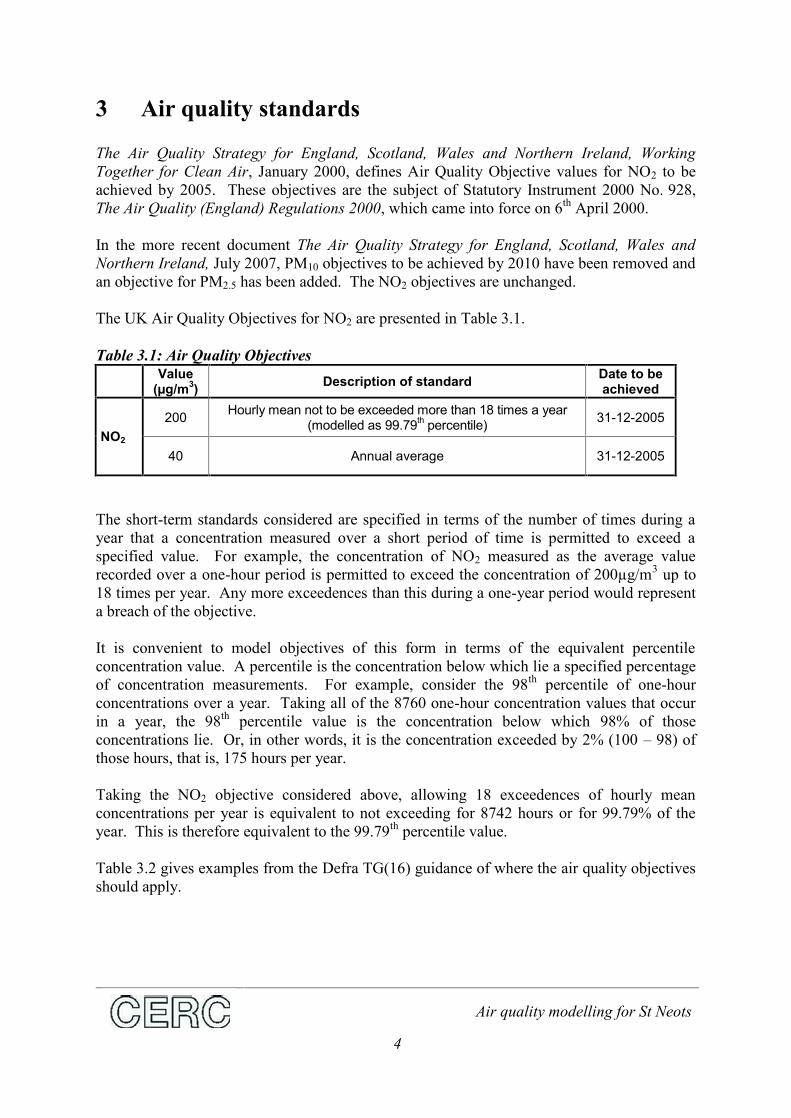
The UK Air Quality Objectives for NO2 are presented in Table 3.1.
Table 3.1: Air Quality ObjectivesValue
(µg/m3) Description of standard Date to beachieved
NO2
200 Hourly mean not to be exceeded more than 18 times a year(modelled as 99.79th percentile) 31-12-2005
40 Annual average 31-12-2005
The short-term standards considered are specified in terms of the number of times during ayear that a concentration measured over a short period of time is permitted to exceed aspecified value. For example, the concentration of NO2 measured as the average valuerecorded over a one-hour period is permitted to exceed the concentration of 200µg/m3 up to18 times per year. Any more exceedences than this during a one-year period would representa breach of the objective.
It is convenient to model objectives of this form in terms of the equivalent percentileconcentration value. A percentile is the concentration below which lie a specified percentageof concentration measurements. For example, consider the 98th percentile of one-hourconcentrations over a year. Taking all of the 8760 one-hour concentration values that occurin a year, the 98th percentile value is the concentration below which 98% of thoseconcentrations lie. Or, in other words, it is the concentration exceeded by 2% (100 – 98) ofthose hours, that is, 175 hours per year.
Taking the NO2 objective considered above, allowing 18 exceedences of hourly meanconcentrations per year is equivalent to not exceeding for 8742 hours or for 99.79% of theyear. This is therefore equivalent to the 99.79th percentile value.
Table 3.2 gives examples from the Defra TG(16) guidance of where the air quality objectivesshould apply.

Air quality modelling for St Neots
5
Table 3.2: Examples of where the air quality objectives should applyAveragingperiod
Objectives should apply at:Objectives should generally notapply at:
Annual average All locations where members of thepublic might be regularly exposed.Building facades of residentialproperties, schools, hospitals, carehomes etc
Building facades of offices or otherplaces of work where members of thepublic do not have regular access.Hotels, unless people live there astheir permanent residence.Gardens of residential propertiesKerbside sites (as opposed tolocations at the building façade), orany other location where publicexposure is expected to be short term.
Hourly average All locations where the annual meanand:HotelsGardens of residential propertiesKerbside sites (for example pavementsof busy shopping streets).Those parts of car parks, bus stationsand railway stations etc. Which are notfully enclosed, where members of thepublic might reasonably be expectedto spend one hour or longer.
Kerbside sites where the public wouldnot be expected to have regularaccess.

Air quality modelling for St Neots
6
4 Air Quality Management Area
The total AQMA area is around 40,000 m2, or 4 hectares. It comprises the entirety of theHigh Street, which is a busy shopping street around 500 m in length, plus several junctions.The junction with New Street/South Street is included, plus around 220 m of New Street,north of the High Street, incorporating the junction with Tan Yard and Tebbutts Road.
The junction with Huntingdon Street/Cambridge Street/Church Street is also included in theAQMA, plus around 100 m of Cambridge Street, to the east of the High Street. At the farwest of the High Street, the road becomes St Neots Road. The stretches of road within theAQMA all form street canyons.
The location of the AQMA within St Neots, and its extent, are shown in Figure 4.1
Figure 4.1: The location of the St Neots AQMA
Ordnance Survey data © Crown copyright and database right 2016. OS 100030994 , Contains OS data ©Crown Copyright and database right 2016
0 500 1,000 1,500 2,000250metres
Contains OS data © Crown Copyright and databaseright 2016

Air quality modelling for St Neots
7
5 Measured concentrations
Although there are no automatic monitoring sites in or around St Neots, there are sevenpassive diffusion tubes in the area, for the measurement of NO2. The details of these diffusiontubes are shown in Table 5.1 and the locations are shown in Figure 5.1.
Table 5.1: Diffusion tube information and concentrations for 2015
Figure 5.1: Locations of NO2 diffusion tubes
Eynesbury
Eaton Socon
Ordnance Survey data © Crown copyright and database right 2016. OS 100030994 , Contains OS data ©Crown Copyright and database right 2016
0 500 1,000 1,500 2,000250metres
St Neots 5
St Neots 4St Neots 3
St Neots 2
St Neots 1
Contains OS data © Crown Copyright and databaseright 2016
Site Name Locationx, y
location(m)
Height(m) Site Type In
AQMA?
Distance tokerb (m) of
nearestroad
Worst-case
location?
St Neots 1 Avenue Rd 518925,260503 3 Urban
background N 1 N
St Neots 2 Harland Rd 518489,260871 3 Urban
background N 1 N
St Neots 3 High St(Post Office)
518323,260263 3 Kerbside Y 1 Y
St Neots 4 High St(Traffic lts)
518433,260321 3 Kerbside Y 1 Y
St Neots 5 ThePaddocks
517869,260132 3 Kerbside N 1 N
Eynesbury 17 ArundelCrescent
518424,258566 3 Suburban N 17 Y
EatonSocon
5 DuchessClose
516370,259514 3 Suburban N 24
(to trunk rd) N
Air quality modelling for St Neots
8
Table 5.2 shows measured concentrations for 2010 to 2015 and the applied bias adjustmentfactors for each year. Figure 5.2 shows the trends in measured concentrations compared to theair quality objective of 40 µg/m³.
Table 5.2: Diffusion tube locations and heights used for the modelling
Site Name Location 2010 2011 2012 2013 2014 2015
Bias adjustment factors 0.82 0.85 0.84 0.79 0.82 0.81
St Neots 1 Avenue Road 21.7 18.2 18.5 18.7 19.0 16.6
St Neots 2 Harland Road 19.9 16.7 15.8 15.4 15.3 13.0
St Neots 3 High Street(Post Office) 40.0 39.3 35.9 36.8 36.0 31.7
St Neots 4 High Street(Traffic lights) 39.9 37.4 35.5 31.0 31.6 28.7
St Neots 5 The Paddocks 27.9 23.5 22.8 20.6 19.6 20.5
Eynesbury 17 ArundelCrescent 25.4 23.4 22.3 21.4 20.3 19.9
EatonSocon
5 DuchessClose 33.5 29.3 27.9 24.5 23.5 24.5
Figure 5.2: Measured annual average NO2 concentrations in St Neots
0
5
10
15
20
25
30
35
40
45
2010 2011 2012 2013 2014 2015
Year
Avenue Road
Harland Road
High Street (Post Office)
High Street (Traffic Lights)
The Paddocks
17 Arundel Crescent
5 Duchess Close
Air quality standard

Air quality modelling for St Neots
9
6 Model setup
6.1 Modelling software
Modelling of pollutant concentrations was carried out using the ADMS-Urban model(version 4.1.1)1. ADMS-Urban is an advanced dispersion model which is widely used byUK local authorities for the assessment of air quality as part of the Local Air QualityManagement process.
6.2 Surface roughness
A parameter called the surface roughness length is used in the model to characterise the area interms of the effects it will have on wind speed and turbulence, which are key factors in themodelling. The modelling used a roughness length of 0.5 m, which represents relatively open,less built-up, urban areas.
The difference in land use at the meteorological site compared to the modelled area was takeninto account, by entering a different surface roughness for the meteorological site. SeeSection 6.4 for further details.
6.3 Monin-Obukhov length
In urban areas a significant amount of heat is absorbed and re-emitted by buildings and othervegetation-free urban surfaces, which means that the area will tend to warmer than surroundingrural areas, particularly at night. This is known as the urban heat island and its effect is toprevent the atmosphere from becoming very stable. In general, the larger the area the more heatis generated and the stronger the effect.
In the ADMS-Urban model, the stability of the atmosphere is represented by theMonin-Obukhov length parameter, which has the dimension of length. In very stable conditionsit has a positive value of between 2 m and 20 m. The effect of the urban heat island is that, instable conditions the Monin-Obukhov length will never fall below some minimum value; thelarger the urban area, the larger the minimum value. As the St Neots urban area is compact andsurrounded by rural areas, a minimum Monin-Obukhov length of 30 m was used in themodelling, which is generally intended to represent small towns with populations of less thanaround 50,000 inhabitants.
1 http://cerc.co.uk/environmental-software/ADMS-Urban-model.html

Air quality modelling for St Neots
10
6.4 Meteorological data
A year of hourly sequential meteorological data measured at the Bedford site in 2015 wasused for the modelling. The measurement site is located approximately 13 km to the west ofthe St Neots AQMA. Table 6.1 shows the proportion of useable data and Table 6.2summarises the data used in the modelling. A surface roughness of 0.2 m was used for themeteorological site.
Table 6.1: Hours of meteorological data usedTotal number of hours used 8655
Percentage of hours used 98.8
Table 6.2: Summary of meteorological dataMinimum Maximum Mean
Temperature (°C) -5.5 33.3 10.4
Wind speed (m/s) 0.0 16.5 4.7
Cloud cover (oktas) 0 8 4.8
The ADMS meteorological pre-processor, written by the Met Office, uses the data providedto calculate the parameters required by the program. Figure 6.1 shows a wind rose for theBedford site, giving the frequency of occurrence of wind from different directions for anumber of wind speed ranges.
Figure 6.1: Wind rose for Bedford, 2015P:\FM\FM1129_Hunts\Run_data\Met\Bedford_15.met
0
0
3
1.5
6
3.1
10
5.1
16
8.2
(knots)
(m/s)
Wind speed
0° 10°20°
30°
40°
50°
60°
70°
80°
90°
100°
110°
120°
130°
140°
150°160°
170°180°190°200°
210°
220°
230°
240°
250°
260°
270°
280°
290°
300°
310°
320°
330°340°
350°
200
400
600
800

Air quality modelling for St Neots
11
6.5 Background data
A proportion of the emitted nitrogen oxides (NOx) from the modelled sources will be in theform of nitrogen dioxide (NO2) and a further proportion will be converted to NO2 during thetime spent in the atmosphere. In order to calculate the conversion of nitric oxide (NO) toNO2, the ADMS-Urban chemistry module was used in the modelling. The NOx chemistrycalculations in ADMS-Urban take into account emissions and background concentrations ofNOx, NO2, volatile organic compounds (VOCs) and ozone (O3). See Appendix A for furtherinformation about the NOx chemistry used in ADMS-Urban.
For the inclusion of NOx chemistry, and to allow for ambient concentrations of NOx and NO2,hourly average background concentrations of NOx, NO2 and ozone were input to the model.These data were taken from the rural site at Wicken Fen, downloaded from the National AirQuality Information Archive.2 Wicken Fen is situated around 40 km to the east of St Neots.
Some statistics calculated from the background data are shown in Table 3.3, to give an ideaof the typical concentrations.
Table 3.3: Summary of 2015 background data used in the modelling (µg/m3)
Annual average 99.79th percentile of hourlyaverage
NO2 7.3 43.9
NOx 9.1 64.3
O3 54.4 n/a
6.6 Street canyons
The presence of buildings either side of a road can introduce street canyon effects that resultin pollutants becoming trapped, leading to increased pollutant concentrations. Street canyoneffects were taken into account using the ADMS Advanced Canyon option, which makes useof detailed information for roadside buildings. Street canyon parameters were calculatedusing building outline data were taken from Ordnance Survey Open Map Local data3 andheight data from the Environment Agency LIDAR data4.
2 http://www.airquality.co.uk/archive/data_and_statistics.php3 https://www.ordnancesurvey.co.uk/opendatadownload/products.html4 http://environment.data.gov.uk/ds/survey/index.jsp#/survey

Air quality modelling for St Neots
12
7 Source data
7.1 Road traffic
Traffic data were available from the following sources, listed in order of preference: Department for Transport (DfT) traffic counts Cambridgeshire County Council traffic counts Transport assessments for planning applications at Loves Farm and Wintringham Park
Figure 7.1 shows the source of traffic data for each of the modelled roads.
Figure 7.1: Sources of traffic data
7.1.1 DfT traffic data
Traffic counts for major roads are available from the DfT.5 These comprise counts formotorcycles, cars, buses and coaches, light goods vehicles (LGV), three categories of rigidheavy goods vehicles (HGV), and three categories of articulated HGVs for 2015.
5 http://www.dft.gov.uk/traffic-counts/area.php?region=East+of+England&la=Cambridgeshire
!.
!.
!.
!. !.
!.!.!.
#0 #0
#0
#0
#0
#0
© OpenStreetMap (and) contributors, CC-BY-SA0 1 2 30.5
Kilometres
®
#0 Contains OS data © Crown Copyright and databaseright 2017
AQMA
#0 CCC counts!. DfT counts
Modelled roadsData Source
CouncilDfT
Loves FarmWintringham
0 200 400 600100Metres

Air quality modelling for St Neots
13
7.1.2 Cambridgeshire County Council traffic data
Traffic counts for other major roads in the city are available from the Cambridgeshire CountyCouncil website.6 These data comprise counts of motorcycles, cars, LGVs, buses and HGVsfor 2015. These are 12-hour counts which were converted to 24 hour by factors in theCambridgeshire County Council 2015 Traffic Monitoring Report7.
7.1.3 Transport Assessments
For roads where no DfT or County Council data were available, data were taken fromplanning application transport assessments. The two planning applications referred to were:
the proposed residential development at Loves Farm East; and the mixed-use development at Wintringham Park.
7.1.4 Traffic speeds
Traffic speeds for all roads in Cambridge were taken from previous air quality modellingcarried out for the city. These were refined by reducing speeds close to junctions and incongested areas; in particular the High Street was modelled with an average speed of20 km/hr.
7.1.5 Emission factors
Traffic emissions of NOx and NO2 were calculated from traffic flows using NAEI 2014emission factors based on Euro vehicle emissions categories. The emissions calculationsused the vehicle fleet composition published by the DfT.
The NAEI 2014 emission factors include speed-emissions data for NOx based on theCOPERT 4 version 10 software tool8. The emissions data include primary NO2 emissionfactors for each vehicle type resulting in accurate road-by-road NOx and NO2 emission rates.Note that there is large uncertainty surrounding the current emissions estimates of NOx fromall vehicle types, in particular diesel vehicles, in these factors; refer to for example an AQEGreport from 20079 and a Defra report from 201110. In order to address this discrepancy, theNOx emission factors were modified based on recently published Remote Sensing Data(RSD)11 for vehicle NOx emissions in London. Scaling factors were applied to each vehiclecategory and Euro standard.
6 https://www.cambridgeshire.gov.uk/residents/travel-roads-and-parking/roads-and-pathways/road-traffic-data/7 https://ccc-live.storage.googleapis.com/upload/www.cambridgeshire.gov.uk/residents/travel-roads-and-parking/Traffic_monitoring_report_2015.pdf?inline=true8http://www.emisia.com/copert/General.html9 Trends in primary nitrogen dioxide in the UK10 Trends in NOx and NO2 emissions and ambient measurements in the UK11 Carslaw, D and Rhys-Tyler, G 2013: New insights from comprehensive on-road measurements of NOx, NO2and NH3 from vehicle emission remote sensing in London, UK. Atmos. Env. 81 pp 339–347.
Air quality modelling for St Neots
14
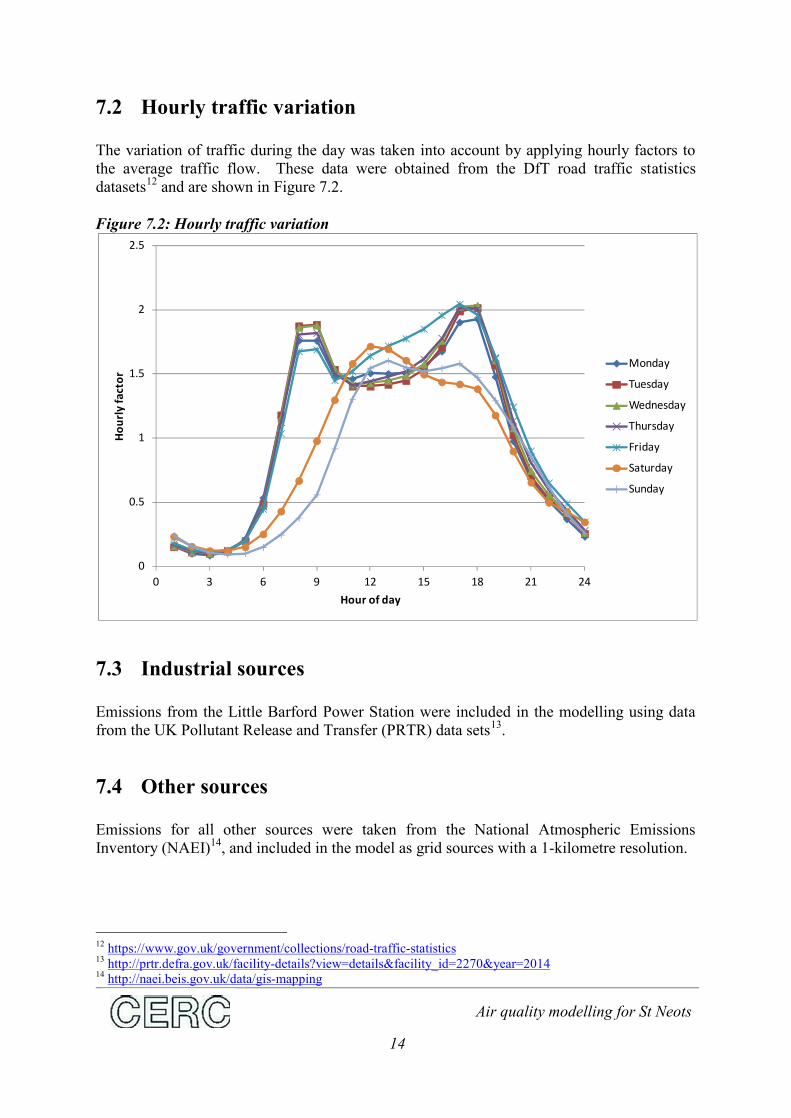
7.2 Hourly traffic variation
The variation of traffic during the day was taken into account by applying hourly factors tothe average traffic flow. These data were obtained from the DfT road traffic statisticsdatasets12 and are shown in Figure 7.2.
Figure 7.2: Hourly traffic variation
7.3 Industrial sources
Emissions from the Little Barford Power Station were included in the modelling using datafrom the UK Pollutant Release and Transfer (PRTR) data sets13.
7.4 Other sources
Emissions for all other sources were taken from the National Atmospheric EmissionsInventory (NAEI)14, and included in the model as grid sources with a 1-kilometre resolution.
12 https://www.gov.uk/government/collections/road-traffic-statistics13 http://prtr.defra.gov.uk/facility-details?view=details&facility_id=2270&year=201414 http://naei.beis.gov.uk/data/gis-mapping
0
0.5
1
1.5
2
2.5
0 3 6 9 12 15 18 21 24
Hour of day
Monday
Tuesday
Wednesday
Thursday
Friday
Saturday
Sunday

Air quality modelling for St Neots
15
8 Modelled concentrations
8.1 Model verification
The first stage of dispersion modelling is to model a current case in order to verify that theinput data and model setup are representative of the area. This was carried out by comparingthe modelled concentrations of NO2 with those measured at the dispersion tube monitoringsites described in Section 5.
Table 8.1 presents the measured and modelled annual average NO2 concentrations at themonitoring locations for 2015, together with the modelled concentrations expressed as apercentage of the measured values. A value of 100% indicates perfect agreement betweenmeasured and modelled data, with values greater than 100% indicating that the model isover-predicting concentrations and values less than 100% showing model under-prediction.Figure 8.1 shows the same data as a scatter plot.
Table 8.1: Measured and modelled NO2 concentrations, 2015, µg/m3
Site name LocationAnnual average NO2
Measured Modelled %
St Neots 1 Avenue Road 16.6 13.2 80%St Neots 2 Harland Road 13.0 12.3 95%St Neots 3 High Street (Post Office) 31.7 32.6 103%St Neots 4 High Street (Traffic lights) 28.7 28.4 99%St Neots 5 The Paddocks 20.5 22.6 110%Eynesbury 17 Arundel Crescent 19.9 19.5 98%
Eaton Socon 5 Duchess Close 24.5 19.0 77%
Figure 8.1: Measured and modelled annual average NO2 concentrations
0
10
20
30
40
0 10 20 30 40
Measured NO2 (µg/m³)
y=x
Modelled concentrations
+ 10%
- 10%
+ 25%
- 25%

Air quality modelling for St Neots
16
The modelled annual average NO2 concentrations show generally very good agreement.There is no consistent over or underprediction of concentrations, with five of the seven sitesshowing agreement within 10%. In particular, at the two sites in the AQMA, the modelledconcentrations are within 1% and 3% of the measured values.
These results show that the model setup accurately predicts concentrations at urbanbackground and roadside locations in and around St Neots, and provide confidence in modelresults.
8.2 Concentration contour maps
Ground level concentrations of NO2 were calculated for the year 2015, on a regular grid ofreceptor points covering the AQMA with a resolution of 10 metres. In addition to this regulargrid, concentrations were also calculated at additional points along the roads, inside andoutside the street canyons, with an along-road resolution of 2 metres.
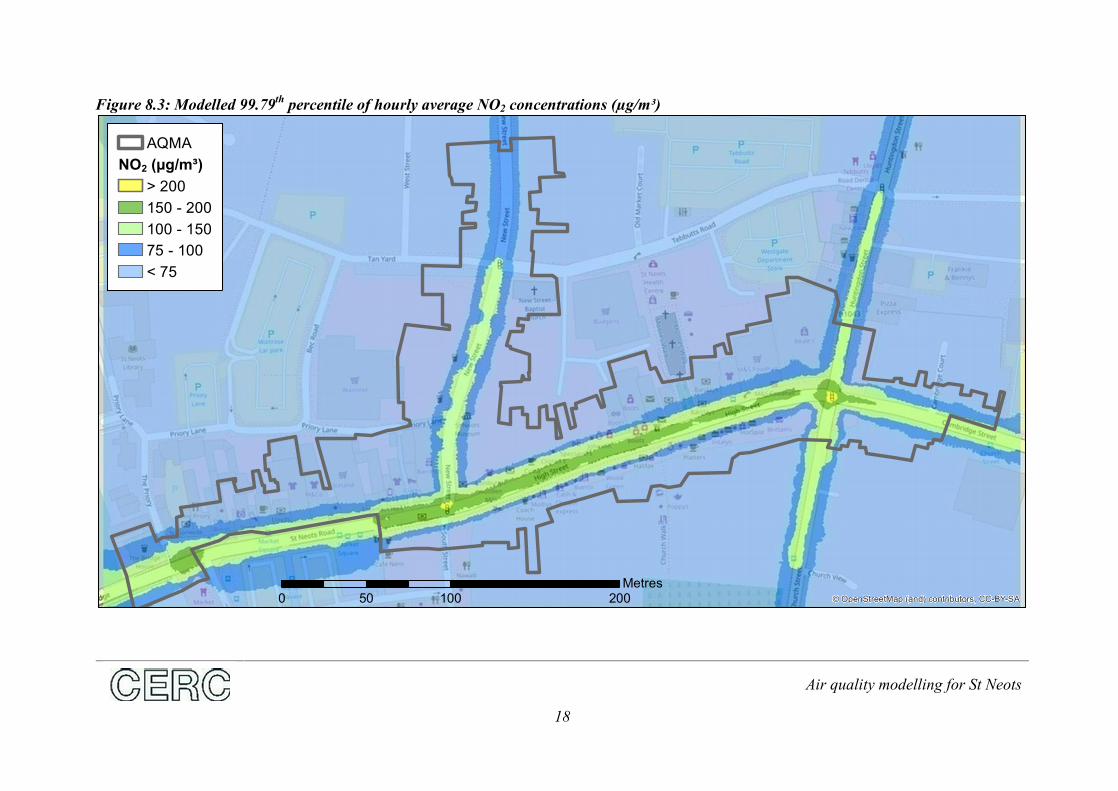
Figure 8.2 shows the modelled annual average NO2 concentrations in the AQMA. Figure 8.3shows the modelled 99.79th percentile of hourly average NO2 concentrations. In each case,areas coloured yellow and orange show exceedences of the air quality objectives, with greenand blue showing areas which meet the objectives.
Exceedences of the objective value for annual average NO2 concentrations are predictedalong sections of the High Street, however, the concentrations at the building facades are allbelow 40 µg/m³.
Exceedences of the objective value for hourly average concentrations are only predicted inthe centre of the junctions of the New Street and Huntingdon Street junctions.

Air quality modelling for St Neots
17
Figure 8.2: Modelled annual average NO2 concentrations (µg/m³)
© OpenStreetMap (and) contributors, CC-BY-SA0 100 20050Metres
AQMANO2 (µg/m³)
> 4440 - 4436 - 4032 - 3628 - 3224 - 2820 - 24< 20
Air quality modelling for St Neots
18
Figure 8.3: Modelled 99.79th percentile of hourly average NO2 concentrations (µg/m³)
© OpenStreetMap (and) contributors, CC-BY-SA0 100 20050Metres
AQMANO2 (µg/m³)
> 200150 - 200100 - 15075 - 100< 75

Air quality modelling for St Neots
19
9 Discussion
Air quality modelling was carried out using the ADMS-Urban dispersion model.
Concentrations were calculated at the locations of the diffusion tubes in St Neots and themeasured and modelled concentrations compared to verify the suitability of the model inputdata and assumptions. The modelled concentrations generally shows very good agreement,with modelled annual average NO2 concentrations at five of the seven monitoring sites within10% of the measured values. In particular, at the two monitoring sites within the AQMA, themodelled concentrations were within 1% and 3% of the measured values, respectively. Themodel setup can therefore be considered appropriate for the modelled area.
Exceedences of the objective value for annual average NO2 concentrations are predictedalong sections of the High Street, however, these exceedences all occur at locations where theannual average air quality objective does not apply. Concentrations at the building facades,where the annual average objective does apply, are all below 40 µg/m³.
To take into account uncertainty in the modelling, a value of 36 µg/m³ is sometimes alsoconsidered. The only building façade location at which the modelled concentration exceeds36 µg/m³ is outside the Thomas Morris office, where it reaches 39 µg/m³.
Exceedences of the objective value for hourly average concentrations are only predicted inthe centre of the New Street and Huntingdon Street junctions, i.e. not in areas where thepublic would be expected to have regular access.

Air quality modelling for St Neots
20
APPENDIX A: Summary of ADMS-Urban
ADMS-Urban is a practical air pollution modelling tool, which has been developed toprovide detailed predictions of pollution concentrations for all sizes of study area. Themodel can be used to look at concentrations near a single road junction or over a regionextending across the whole of a major city. ADMS-Urban has been extensively used forthe Review and Assessment of Air Quality carried out by Local Authorities in the UK.The following is a summary of the capabilities and validation of ADMS-Urban. Moredetails can be found on the CERC web site at www.cerc.co.uk.
ADMS-Urban is a development of the Atmospheric Dispersion Modelling System(ADMS), which has been developed to investigate the impacts of emissions from industrialfacilities. ADMS-Urban allows full characterisation of the wide variety of emissions inurban areas, including an extensively validated road traffic emissions model. It alsoboasts a number of other features, which include consideration of:
the effects of vehicle movement on the dispersion of traffic emissions; the behaviour of material released into street-canyons; the chemical reactions occurring between nitrogen oxides, ozone and Volatile Organic
Compounds (VOCs); the pollution entering a study area from beyond its boundaries; the effects of complex terrain on the dispersion of pollutants; and the effects of a building on the dispersion of pollutants emitted nearby.
More details of these features are given below.
Studies of extensive urban areas are necessarily complex, requiring the manipulation of largeamounts of data. To allow users to cope effectively with this requirement, ADMS-Urban hasbeen designed to operate in the widely familiar PC environment, under Microsoft Windows.The manipulation of data is further facilitated by the possible integration of ADMS-Urbanwith a Geographical Information System (GIS) such as MapInfo or ArcGIS, and with theCERC Emissions Inventory Toolkit, EMIT.
Dispersion Modelling
ADMS-Urban uses boundary layer similarity profiles in which the boundary layer structure ischaracterised by the height of the boundary layer and the Monin-Obukhov length, a lengthscale dependent on the friction velocity and the heat flux at the ground. This has significantadvantages over earlier methods in which the dispersion parameters did not vary with heightwithin the boundary layer.
In stable and neutral conditions, dispersion is represented by a Gaussian distribution. Inconvective conditions, the vertical distribution takes account of the skewed structure of thevertical component of turbulence. This is necessary to reflect the fact that, under convectiveconditions, rising air is typically of limited spatial extent but is balanced by descending airextending over a much larger area. This leads to higher ground-level concentrations than wouldbe given by a simple Gaussian representation.

Air quality modelling for St Neots
21
Emissions
Emissions into the atmosphere across an urban area typically come from a wide variety ofsources. There are likely to be industrial emissions from chimneys as well as emissionsfrom road traffic and domestic heating systems. To represent the full range of emissionsconfigurations, the explicit source types available within ADMS-Urban are: Industrial points, for which plume rise and stack downwash are included in the
modelling. Roads, for which emissions are specified in terms of vehicle flows and the additional
initial dispersion caused by moving vehicles is also taken into account. Areas, where a source or sources is best represented as uniformly spread over an area. Volumes, where a source or sources is best represented as uniformly spread
throughout a volume.
In addition, sources can also be modelled as a regular grid of emissions. This allows thecontributions of large numbers of minor sources to be efficiently included in a studywhile the majority of the modelling effort is used for the relatively few significant sources.
ADMS-Urban can be used in conjunction with CERC’s Emissions Inventory Toolkit,EMIT, which facilitates the management and manipulation of large and complex data setsinto usable emissions inventories.
Presentation of Results
For most situations ADMS-Urban is used to model the fate of emissions for a large numberof different meteorological conditions. Typically, meteorological data are input for everyhour during a year or for a set of conditions representing all those occurring at a givenlocation. ADMS-Urban uses these individual results to calculate statistics for the whole dataset. These are usually average values, including rolling averages, percentiles and the numberof hours for which specified concentration thresholds are exceeded. This allowsADMS-Urban to be used to calculate concentrations for direct comparison with existingair quality limits, guidelines and objectives, in whatever form they are specified.
ADMS-Urban can be integrated with the ArcGIS or MapInfo GIS to facilitate both thecompilation and manipulation of the emissions information required as input to the modeland the interpretation and presentation of the air quality results provided.

Air quality modelling for St Neots
22
Complex Effects - Street Canyons
ADMS-Urban includes two options for modelling the effects of street canyons:1. The basic street canyon option uses the Operational Street Pollution Model (OSPM)15
,developed by the Danish National Environmental Research Institute (NERI). The OSPMuses a simplified flow and dispersion model to simulate the effects of the vortex thatoccurs within street canyons when the wind-flow above the buildings has a componentperpendicular to the direction of the street. The model takes account of vehicle-inducedturbulence. The model has been validated against Danish and Norwegian data.2. The advanced street canyon option modifies the dispersion of pollutants from a roadsource according to the presence and properties of canyon walls on one or both sides ofthe road. It differs from the basic canyon option in the following ways:(i) It can consider a wide range of canyon geometries, including tall canyons and
asymmetric canyons;(ii) The modelled concentrations vary with height within the canyon;(iii) Emissions can be restricted only to the carriageway with no emissions on pedestrian
areas; and(iv) Concentrations both inside and outside a particular street canyon are affected.
1.1.1.1..1
Complex Effects - Chemistry
ADMS-Urban includes the Generic Reaction Set (GRS)16 atmospheric chemistry scheme.The original scheme has seven reactions, including those occurring between nitrogenoxides and ozone. The remaining reactions are parameterisations of the large number ofreactions involving a wide range of Volatile Organic Compounds (VOCs). In addition,an eighth reaction has been included within ADMS-Urban for the situation when highconcentrations of nitric oxide (NO) can convert to nitrogen dioxide (NO2) usingmolecular oxygen.
In addition to the basic GRS scheme, ADMS-Urban also includes a trajectory model17 foruse when modelling large areas. This permits the chemical conversions of the emissionsand background concentrations upwind of each location to be properly taken into account.
15 Hertel, O., Berkowicz, R. and Larssen, S., 1990, ‘The Operational Street Pollution Model (OSPM).’ 18th
International meeting of NATO/CCMS on Air Pollution Modelling and its Applications. Vancouver,Canada, pp741-749.16 Venkatram, A., Karamchandani, P., Pai, P. and Goldstein, R., 1994, ‘The Development and Applicationof a Simplified Ozone Modelling System.’ Atmospheric Environment, Vol 28, No 22, pp3665-3678.17 Singles, R.J., Sutton, M.A. and Weston, K.J., 1997, ‘A multi-layer model to describe the atmospherictransport and deposition of ammonia in Great Britain.’ In: International Conference on AtmosphericAmmonia: Emission, Deposition and Environmental Impacts. Atmospheric Environment, Vol 32, No 3.

Air quality modelling for St Neots
23
Complex Effects – Terrain and Roughness
Complex terrain can have a significant impact on wind-flow and consequently on the fate ofdispersing material. Primarily, terrain can deflect the wind and therefore change the route takenby dispersing material. Terrain can also increase the levels of turbulence in the atmosphere,resulting in increased dilution of material. This is of particular significance during stableconditions, under which a sharp change with height can exist between flows deflected over hillsand those deflected around hills or through valleys. The height of dispersing material istherefore important in determining the route it takes. In addition, areas of reverse flow, similarin form and effect to those occurring adjacent to buildings, can occur on the downwind side of ahill. Changes in the surface roughness can also change the vertical structure of the boundarylayer, affecting both the mean wind and levels of turbulence.
The ADMS-Urban Complex Terrain Module models these effects using the wind-flow modelFLOWSTAR 18 . This model uses linearised analytical solutions of the momentum andcontinuity equations, and includes the effects of stratification on the flow. Ideally hillsshould have moderate slopes (up to 1 in 2 on upwind slopes and hill summits, up to 1 in 3 inhill wakes), but the model is useful even when these criteria are not met. FLOWSTAR hasbeen extensively tested with laboratory and field data.
Complex Effects - Buildings
A building or similar large obstruction can affect dispersion in three ways:1. It deflects the wind flow and therefore the route followed by dispersing material;2. This deflection increases levels of turbulence, possibly enhancing dispersion; and3. Material can become entrained in a highly turbulent, recirculating flow region or cavity on
the downwind side of the building.
The third effect is of particular importance because it can bring relatively concentrated materialdown to ground-level near to a source. From experience, this occurs to a significant extent inmore than 95% of studies for industrial facilities.
The buildings effects module in ADMS-Urban has been developed using extensive publisheddata from scale-model studies in wind-tunnels, CFD modelling and field experiments on thedispersion of pollution from sources near large structures. It operates in the following stages:(i) A complex of buildings is reduced to a single rectangular block with the height of the
dominant building and representative streamwise and crosswind lengths.(ii) The disturbed flow field consists of a recirculating flow region in the lee of the
building with a diminishing turbulent wake downwind, as shown in Figure A1.(iii) Concentrations within the well-mixed recirculating flow region are uniform and based
upon the fraction of the release that is entrained.(iv) Concentrations further downwind in the main wake are the sum of those from two
plumes: a ground level plume from the recirculating flow region and an elevatedplume from the non-entrained remainder.
18 Carruthers D.J., Hunt J.C.R. and Weng W-S. 1988. ‘A computational model of stratified turbulent airflowover hills – FLOWSTAR I.’ Proceedings of Envirosoft. In: Computer Techniques in Environmental Studies,P. Zanetti (Ed) pp 481-492. Springer-Verlag.

Air quality modelling for St Neots
24
Data Comparisons – Model Validation
ADMS-Urban is a development of the Atmospheric Dispersion Modelling System(ADMS), which is used throughout the UK by industry and the Environment Agency tomodel emissions from industrial sources. ADMS has been subject to extensive validation,both of individual components (e.g. point source, street canyon, building effects andmeteorological pre-processor) and of its overall performance.
ADMS-Urban has been extensively tested and validated against monitoring data for largeurban areas in the UK, including Central London and Birmingham, for which a largescale project was carried out on behalf of the DETR (now DEFRA).
Further details of ADMS-Urban and model validation, including a full list of references, areavailable from the CERC website at www.cerc.co.uk.
Figure A3.1: Stages in the modelling of building effects