hurricane keith jack beven national hurricane center · once inland, keith beg an moving west-nor...
TRANSCRIPT
Tropical Cyclone ReportHurricane Keith
28 September - 6 October 2000
Jack BevenNational Hurricane Center
revised deaths and damage 29 January 2001
Keith was a rapidly-intensifying tropical cyclone over the northwestern Caribbean Sea,reaching Category 4 on the Saffir-Simpson Hurricane Scale as it stalled just off the coast of Belize.Keith affected the coastal islands of Belize as a Category 3 hurricane, but weakened to a tropicalstorm before actually making landfall in mainland Belize. After weakening to a tropical depressionwhile crossing the Yucatan Peninsula, Keith re-intensified over the southwestern Gulf of Mexico andmade landfall in northeastern Mexico as a Category 1 hurricane.
a. Synoptic history
A tropical wave moved off the west coast of Africa on 16 September. The wave showedsigns of organization over the Atlantic from 19-22 September, but strong vertical shear preventeddevelopment then. The wave continued westward into the Caribbean Sea and started to becomebetter organized on 27 September, when the first Dvorak satellite intensity estimate was made.Development continued, and an Air Force Reserve Hurricane Hunter aircraft found that the systembecame a tropical depression about 60 n mi north-northeast of Cape Gracias a Dios, Nicaragua,around 1800 UTC 28 September (Table 1 and Figure 1). The depression moved northwestward, anda second flight around 1800 UTC 29 September indicated that the cyclone had become TropicalStorm Keith.
Rapid intensification began near that time, and Keith’s central pressure fell from 1000 mbat 1814 UTC on the 29 to 939 mb at 0708 UTC 1 October -- a 61 mb fall in about 37 h. A 38 mbth
fall occurred from 1808 UTC on the 30 to the time of minimum pressure, which qualifies asth
explosive deepening as defined by Dunnavan (1981). Maximum winds reached 120 kt -- Category4 on the Saffir-Simpson hurricane scale near the time of minimum pressure. During this rapiddevelopment, Keith slowed and turned westward, with the eye moving to a position just southeastof the coastal islands of Belize. A slight weakening occurred later on the 1 , and Keith was ast
Category 3 hurricane when the eyewall moved over Ambergris Cay and Caye Caulker, Belize near1800 UTC.
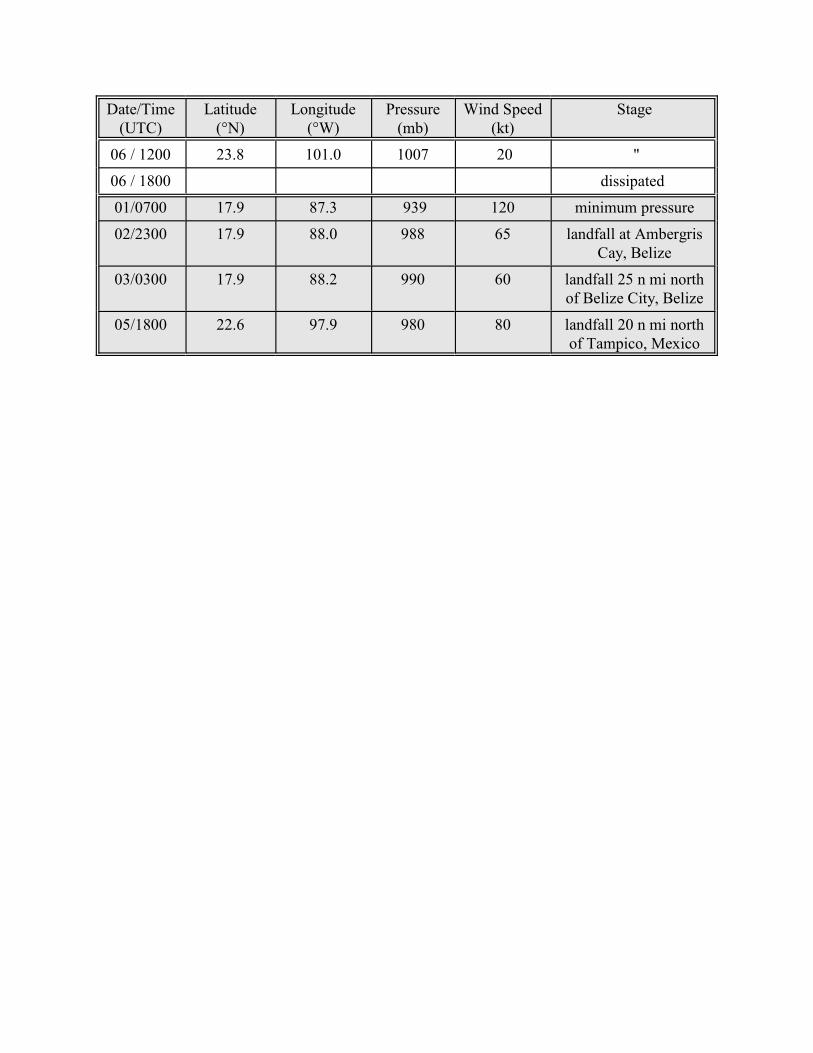
Motion then became slow and erratic, with the eye of Keith meandering just off the Belizecoast into 3 October. This was partly due to high pressure over the Gulf of Mexico blocking thehurricane’s path, and partly due to formation of a tropical disturbance (later to become TropicalStorm Leslie) near western Cuba. The cyclone weakened dramatically during this time. Keith wasa Category 1 hurricane when the center crossed Ambergris Cay, Belize near 2300 UTC on the 2nd
and a 60-kt tropical storm when the center crossed the Belize mainland coast between Belize Cityand Chetumal, Mexico around 0300 UTC on the 3 .rd
Once inland, Keith began moving west-northwestward, and this direction of general motioncontinued with a gradual acceleration until its final landfall. It weakened to a depression over theYucatan Peninsula, then re-intensified to a tropical storm over the Bay of Campeche on 4 October.Keith regained hurricane status on 5 October, and maximum winds increased to 80 kt as thehurricane made landfall about 20 n mi north of Tampico Mexico around 1800 UTC that day. Keithagain weakened over land, and the cyclone dissipated over northeastern Mexico the next day.
b. Meteorological statistics
Table 1 shows the best track positions and intensities for Keith, with the track plotted inFigure 1. Figures 2 and 3 depict the curves of minimum central sea-level pressure and maximumsustained one-minute average “surface” (10 m above ground level) winds, respectively, as a functionof time. These figures also contain the data on which the curves are based: aircraft reconnaissanceand dropsonde data from the Air Force Reserve Hurricane Hunters, and satellite-based Dvoraktechnique intensity estimates from the Tropical Analysis and Forecast Branch (TAFB), the SatelliteAnalysis Branch (SAB) of the National Environmental Satellite Data and Information Service(NESDIS), and the Air Force Weather Agency (AFWA).
The Hurricane Hunters flew 11 missions into Keith with a total of 34 center fixes. Themaximum flight-level wind reported during the storm was 133 kt at 850 mb at 2220 UTC 1 October,while the maximum wind reported from dropsondes in the eyewall was 153 kt at 883 mb at 0705UTC 1 October. The maximum surface wind estimated from the dropsondes was 115 kt at 0600UTC 1 October. The best track minimum pressure was 939 mb, which requires further comment.Observed dropsonde pressures at peak intensity were 943 and 942 mb. However, the reported surfacewinds from those sondes were in excess of 40 kt, indicating they did not splash in the center of theeye. The 939 mb pressure is based on extrapolation of pressure values from the 700 mb flight levelusing the temperature and moisture data from the sondes.
The core of Keith missed most observing stations near the track. The maximum reportedwind from any official station was 40 kt sustained with gusts to 55 kt at Tampico, Mexico at 1445UTC 5 October. The few other significant land observations are summarized in Table 2. Amateurradio operators reported measured winds of 90-110 kt in San Pedro (on Ambergris Cay) and CayeCaulker, Belize on 1 October while under the eyewall. While these observations are significant, theirreliability is uncertain and they are not included in Table 2. Also not included is a 35 kt report froma Mexican oil platform in the Bay of Campeche at 1700 UTC 4 October, as the height of theanemometer is unknown.
The only ship to report tropical storm-force winds in Keith was the Edyth L (call signC6YC), which reported 60 kt winds and a 1009.0 mb pressure in the northwestern Caribbean Seaat 1800 UTC 30 September.
The only known storm surge observation was from Caye Caulker, where a 4-5 ft surge fromthe west occurred. Tides of 4 ft below normal were noted on the Belize mainland coast while Keithwas just offshore of the coastal islands. The National Hurricane Center also received reports thatnortherly winds associated with Keith had temporarily blown the water out of the Bay of Chetumal
and people were walking on the exposed bay bottom. This was a potentially dangerous situation, asthe water could have quickly returned had Keith moved and the winds shifted.
Keith’s slow motion led to torrential rainfall over portions of Central America, especiallyBelize. The largest storm total was 32.67 in at the Philip Goodson International Airport in BelizeCity. Several other totals exceed 10 in. Table 2a summaries the available rainfall data.
c. Casualty and damage statistics
Reports from the Meteorological Service of Belize and the media indicate the death toll fromKeith is 24: 5 in Belize, 12 in Nicaragua, 6 in Honduras, and 1 in Mexico. The deaths in Belizeoccurred when two catamarans broke loose during the storm. Five of the deaths in Hondurasoccurred when an aircraft disappeared near Roatan Island during the storm. The other deaths areapparently due to flooding from heavy rains. The estimated damage to property, agriculture, andtourism in Belize is near $225 million. Much of the property damage occurred on Ambergris Cayand Caye Caulker.
There are no reports of damage or casualties from Keith’s final landfall in northeasternMexico. Heavy rains in Guatemala caused flooding in ten towns, but no estimates of the damageare available.
d. Forecast and warning critique
Table 3 shows the average track forecast errors during Keith, including the official forecasterror, the 10-year average forecast error, and the track guidance errors. The official forecast errorswere better than the 10-year average at 12 and 24 h and significantly worse than the 10-year averageat longer times. The official forecasts were worse than the CLImatology and PERsistence (CLIPERor CLIP in the table) forecasts and thus had no skill. Many of the numerical guidance models alsooutperformed the official forecast, with the most notable being the U.S. Navy version of the GFDLmodel (GFDN), which had errors of 25, 33, 68, 97, and 136 n mi at 12, 24, 36, 48, and 72 hrespectively. This model likely performed well due to both it and its parent NOGAPS model (NGPSin the table) doing a better (although not perfect) job of catching Keith’s westward motion. TheAVN model and its associated guidance (including the GFDL) showed a consistent bias of being toofar to the north partly due to mislocation of the vortex in the model.
NHC track forecasts of Keith also showed a consistent bias to the north, likely in responseto the AVN, GFDL, and UKMET guidance. Figure 4 shows an example of the available guidanceat 1200 UTC 2 October. Note that all the guidance forecasts a northward to northwestward motioneven when initialized with a stationary storm, and that the official forecast followed the right sideof the guidance. Also note that in this example the actual track was outside the envelope of theguidance. NHC’s 72 h track forecast errors were never less than 225 n mi, and most were in the 325-390 n mi range. It should be noted that once Keith moved into the Gulf of Mexico the forecastaccuracy improved considerably: a 36 h forecast issued 30 h before the final landfall had an error of66 n mi and a 24 h forecast verifying at landfall had only a 70 n mi error, both better than therespective 10-year averages.
The official intensity forecast errors for Keith were 13, 22, 23, 18, and 23 kt for 12, 24, 36,48, and 72 h. This is significantly worse than the 10-year average of 7, 11, 13, 16, and 19 kt at thosetimes. The largest intensity forecast error was a 60 kt underforecast of the 36 h intensity from the1800 UTC 29 September forecast. The poor forecasts had four causes: 1) Underestimating howquickly Keith would strengthen over the open Caribbean, 2) Incorrect track forecasts that led toforecasting a weakening Keith over the Yucatan Peninsula when the storm actually stayed overwater, 3) An underestimation of how quickly Keith would weaken after it neared the coast of Belize,and 4) An underestimation of how much Keith would re-intensify over the Gulf of Mexico.
The poor track forecasts had an impact on watches and warnings. Watches and Warningswere posted for the Mexican portion of the Yucatan Peninsula late on the 29 and early on the 30 .th th
However, most of these areas were not seriously affected by Keith. Hurricane warnings for theactual landfall area in Belize were issued about 24 h before the eyewall of Keith arrived over thecoastal islands.
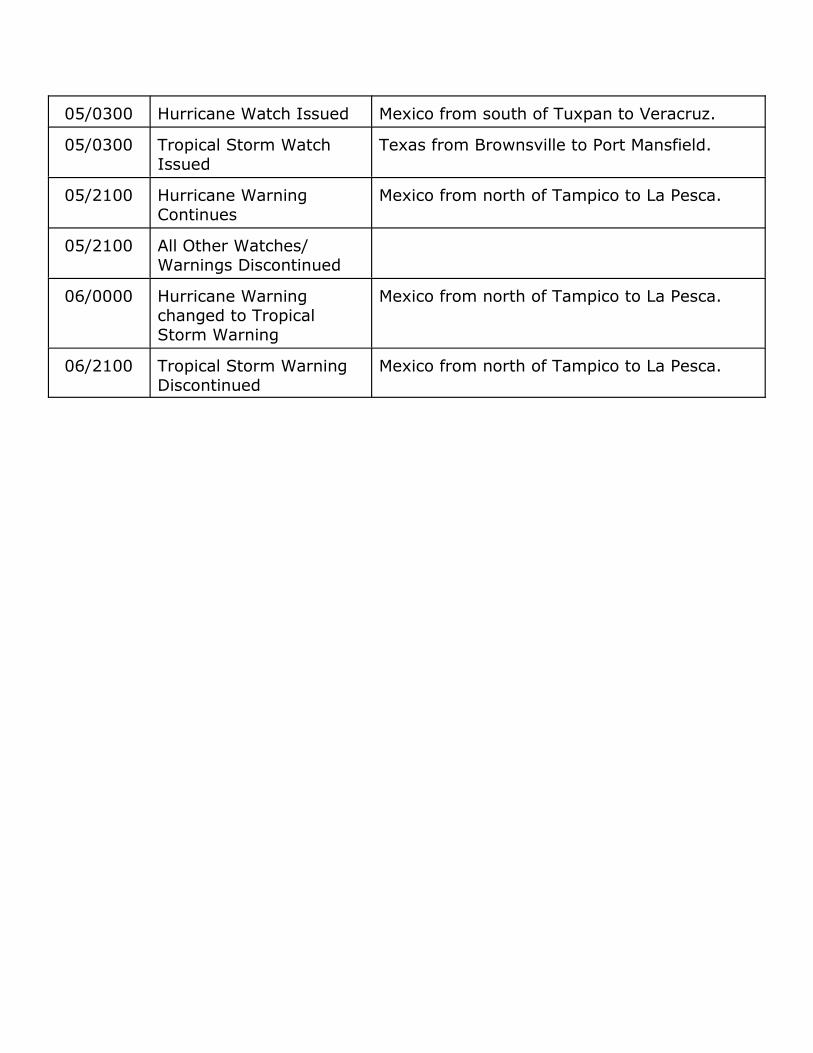
Table 4 lists the watches and warnings associated with Keith.
Acknowledgements
Carlos Fuller of the Meteorological Service of Belize provided many of the observations usedin this report. James Franklin created several of the figures.
References
Dunnavan, G. M., 1981: Forecasting intense tropical cyclones using 700-mb equivalent potentialtemperature and sea-level pressure. NOCC/JTWC Technical Note 81-1, 12 pp.
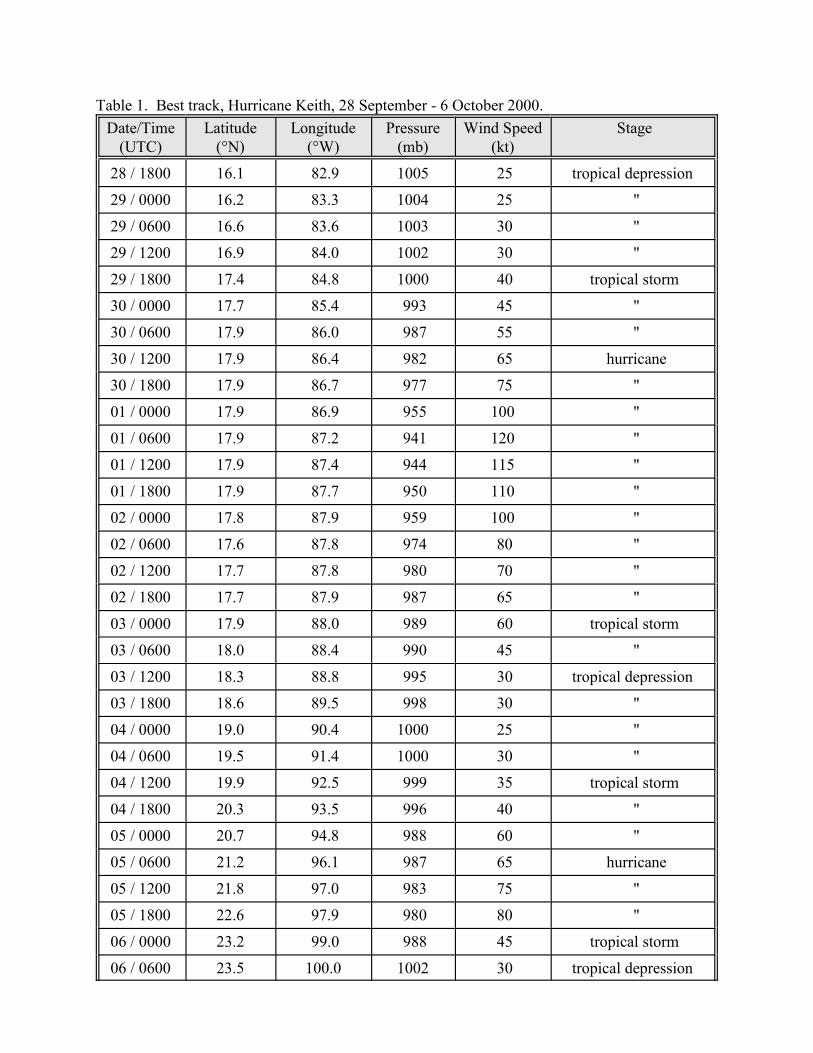
Table 1. Best track, Hurricane Keith, 28 September - 6 October 2000.
Date/Time(UTC)
Latitude(°N)
Longitude(°W)
Pressure(mb)
Wind Speed(kt)
Stage
28 / 1800 16.1 82.9 1005 25 tropical depression
29 / 0000 16.2 83.3 1004 25 "
29 / 0600 16.6 83.6 1003 30 "
29 / 1200 16.9 84.0 1002 30 "
29 / 1800 17.4 84.8 1000 40 tropical storm
30 / 0000 17.7 85.4 993 45 "
30 / 0600 17.9 86.0 987 55 "
30 / 1200 17.9 86.4 982 65 hurricane
30 / 1800 17.9 86.7 977 75 "
01 / 0000 17.9 86.9 955 100 "
01 / 0600 17.9 87.2 941 120 "
01 / 1200 17.9 87.4 944 115 "
01 / 1800 17.9 87.7 950 110 "
02 / 0000 17.8 87.9 959 100 "
02 / 0600 17.6 87.8 974 80 "
02 / 1200 17.7 87.8 980 70 "
02 / 1800 17.7 87.9 987 65 "
03 / 0000 17.9 88.0 989 60 tropical storm
03 / 0600 18.0 88.4 990 45 "
03 / 1200 18.3 88.8 995 30 tropical depression
03 / 1800 18.6 89.5 998 30 "
04 / 0000 19.0 90.4 1000 25 "
04 / 0600 19.5 91.4 1000 30 "
04 / 1200 19.9 92.5 999 35 tropical storm
04 / 1800 20.3 93.5 996 40 "
05 / 0000 20.7 94.8 988 60 "
05 / 0600 21.2 96.1 987 65 hurricane
05 / 1200 21.8 97.0 983 75 "
05 / 1800 22.6 97.9 980 80 "
06 / 0000 23.2 99.0 988 45 tropical storm
06 / 0600 23.5 100.0 1002 30 tropical depression
Date/Time(UTC)
Latitude(°N)
Longitude(°W)
Pressure(mb)
Wind Speed(kt)
Stage
06 / 1200 23.8 101.0 1007 20 "
06 / 1800 dissipated
01/0700 17.9 87.3 939 120 minimum pressure
02/2300 17.9 88.0 988 65 landfall at AmbergrisCay, Belize
03/0300 17.9 88.2 990 60 landfall 25 n mi northof Belize City, Belize
05/1800 22.6 97.9 980 80 landfall 20 n mi northof Tampico, Mexico
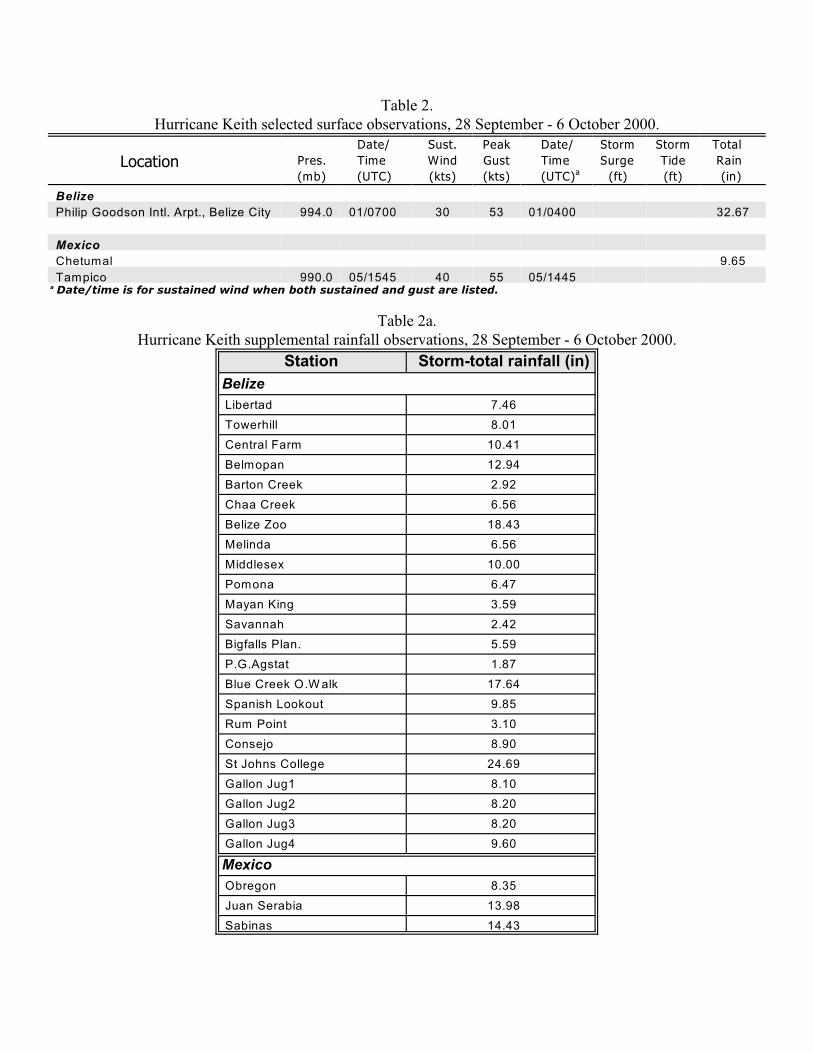
Table 2.Hurricane Keith selected surface observations, 28 September - 6 October 2000.
Location Pres.
(mb)
Date/
Time
(UTC)
Sust.
Wind
(kts)
Peak
Gust
(kts)
Date/
Time
(UTC)a
Storm
Surge
(ft)
Storm
Tide
(ft)
Total
Rain
(in)
Belize
Philip Goodson Intl. Arpt., Belize City 994.0 01/0700 30 53 01/0400 32.67
Mexico
Chetumal 9.65
Tampico 990.0 05/1545 40 55 05/1445Date/time is for sustained wind when both sustained and gust are listed. a
Table 2a.Hurricane Keith supplemental rainfall observations, 28 September - 6 October 2000.
Station Storm-total rainfall (in)
Belize
Libertad 7.46
Towerhill 8.01
Central Farm 10.41
Belmopan 12.94
Barton Creek 2.92
Chaa Creek 6.56
Belize Zoo 18.43
Melinda 6.56
Middlesex 10.00
Pomona 6.47
Mayan King 3.59
Savannah 2.42
Bigfalls Plan. 5.59
P.G.Agstat 1.87
Blue Creek O.W alk 17.64
Spanish Lookout 9.85
Rum Point 3.10
Consejo 8.90
St Johns College 24.69
Gallon Jug1 8.10
Gallon Jug2 8.20
Gallon Jug3 8.20
Gallon Jug4 9.60
Mexico
Obregon 8.35
Juan Serabia 13.98
Sabinas 14.43
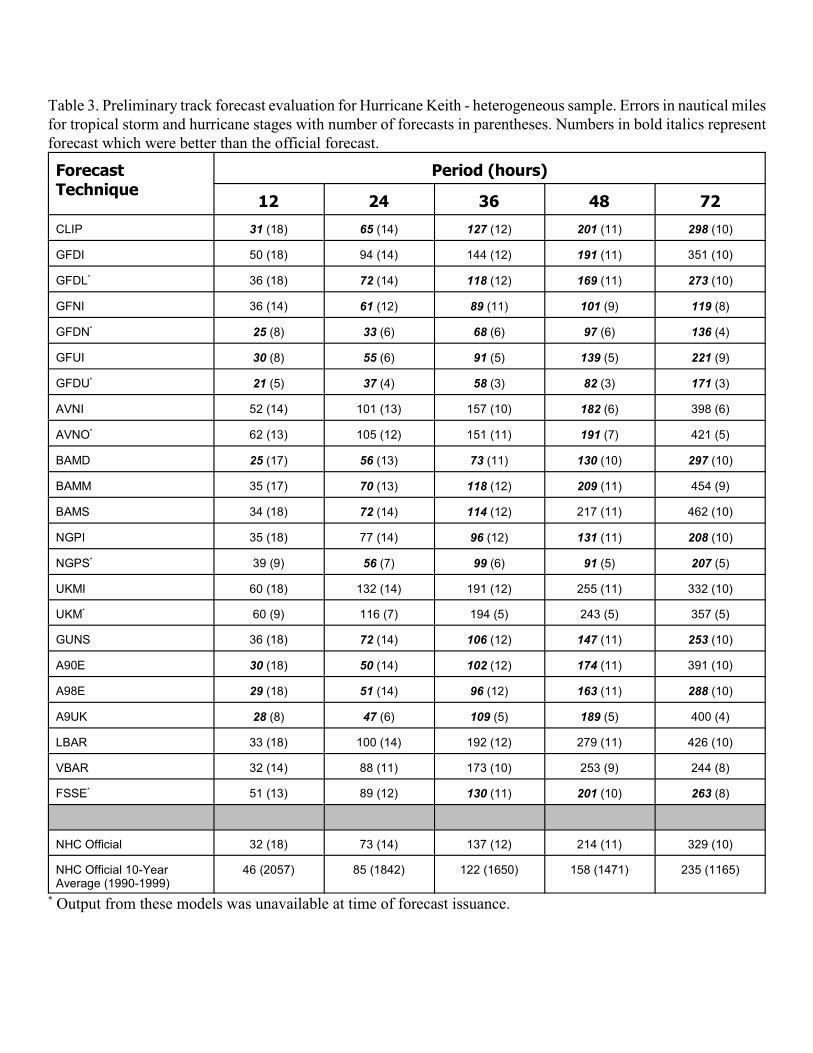
Table 3. Preliminary track forecast evaluation for Hurricane Keith - heterogeneous sample. Errors in nautical milesfor tropical storm and hurricane stages with number of forecasts in parentheses. Numbers in bold italics representforecast which were better than the official forecast.
ForecastTechnique
Period (hours)
12 24 36 48 72
CLIP 31 (18) 65 (14) 127 (12) 201 (11) 298 (10)
GFDI 50 (18) 94 (14) 144 (12) 191 (11) 351 (10)
GFDL 36 (18)* 72 (14) 118 (12) 169 (11) 273 (10)
GFNI 36 (14) 61 (12) 89 (11) 101 (9) 119 (8)
GFDN* 25 (8) 33 (6) 68 (6) 97 (6) 136 (4)
GFUI 30 (8) 55 (6) 91 (5) 139 (5) 221 (9)
GFDU* 21 (5) 37 (4) 58 (3) 82 (3) 171 (3)
AVNI 52 (14) 101 (13) 157 (10) 182 (6) 398 (6)
AVNO 62 (13) 105 (12) 151 (11)* 191 (7) 421 (5)
BAMD 25 (17) 56 (13) 73 (11) 130 (10) 297 (10)
BAMM 35 (17) 70 (13) 118 (12) 209 (11) 454 (9)
BAMS 34 (18) 72 (14) 114 (12) 217 (11) 462 (10)
NGPI 35 (18) 77 (14) 96 (12) 131 (11) 208 (10)
NGPS 39 (9)* 56 (7) 99 (6) 91 (5) 207 (5)
UKMI 60 (18) 132 (14) 191 (12) 255 (11) 332 (10)
UKM 60 (9) 116 (7) 194 (5) 243 (5) 357 (5)*
GUNS 36 (18) 72 (14) 106 (12) 147 (11) 253 (10)
A90E 30 (18) 50 (14) 102 (12) 174 (11) 391 (10)
A98E 29 (18) 51 (14) 96 (12) 163 (11) 288 (10)
A9UK 28 (8) 47 (6) 109 (5) 189 (5) 400 (4)
LBAR 33 (18) 100 (14) 192 (12) 279 (11) 426 (10)
VBAR 32 (14) 88 (11) 173 (10) 253 (9) 244 (8)
FSSE 51 (13) 89 (12)* 130 (11) 201 (10) 263 (8)
NHC Official 32 (18) 73 (14) 137 (12) 214 (11) 329 (10)
NHC Official 10-YearAverage (1990-1999)
46 (2057) 85 (1842) 122 (1650) 158 (1471) 235 (1165)
Output from these models was unavailable at time of forecast issuance.*
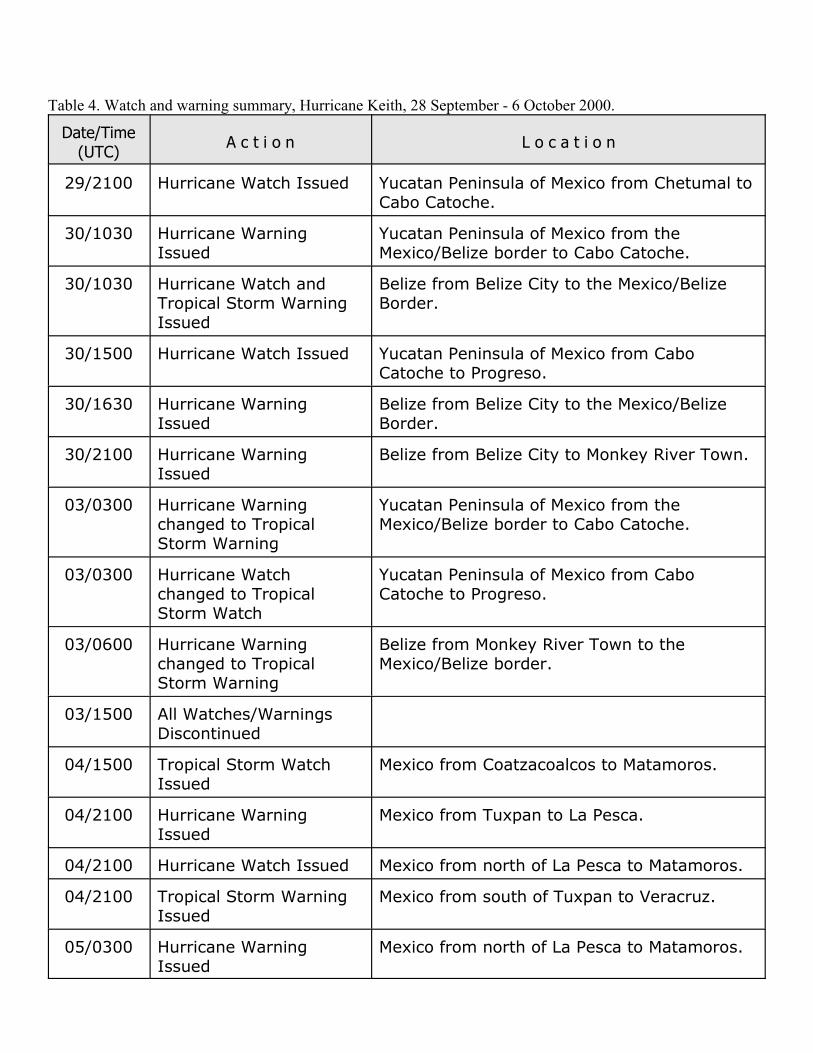
Table 4. Watch and warning summary, Hurricane Keith, 28 September - 6 October 2000.
Date/Time(UTC)
A c t i o n L o c a t i o n
29/2100 Hurricane Watch Issued Yucatan Peninsula of Mexico from Chetumal toCabo Catoche.
30/1030 Hurricane WarningIssued
Yucatan Peninsula of Mexico from theMexico/Belize border to Cabo Catoche.
30/1030 Hurricane Watch andTropical Storm WarningIssued
Belize from Belize City to the Mexico/BelizeBorder.
30/1500 Hurricane Watch Issued Yucatan Peninsula of Mexico from CaboCatoche to Progreso.
30/1630 Hurricane WarningIssued
Belize from Belize City to the Mexico/BelizeBorder.
30/2100 Hurricane WarningIssued
Belize from Belize City to Monkey River Town.
03/0300 Hurricane Warningchanged to TropicalStorm Warning
Yucatan Peninsula of Mexico from theMexico/Belize border to Cabo Catoche.
03/0300 Hurricane Watchchanged to TropicalStorm Watch
Yucatan Peninsula of Mexico from CaboCatoche to Progreso.
03/0600 Hurricane Warningchanged to TropicalStorm Warning
Belize from Monkey River Town to theMexico/Belize border.
03/1500 All Watches/WarningsDiscontinued
04/1500 Tropical Storm WatchIssued
Mexico from Coatzacoalcos to Matamoros.
04/2100 Hurricane WarningIssued
Mexico from Tuxpan to La Pesca.
04/2100 Hurricane Watch Issued Mexico from north of La Pesca to Matamoros.
04/2100 Tropical Storm WarningIssued
Mexico from south of Tuxpan to Veracruz.
05/0300 Hurricane WarningIssued
Mexico from north of La Pesca to Matamoros.
05/0300 Hurricane Watch Issued Mexico from south of Tuxpan to Veracruz.
05/0300 Tropical Storm WatchIssued
Texas from Brownsville to Port Mansfield.
05/2100 Hurricane WarningContinues
Mexico from north of Tampico to La Pesca.
05/2100 All Other Watches/Warnings Discontinued
06/0000 Hurricane Warningchanged to TropicalStorm Warning
Mexico from north of Tampico to La Pesca.
06/2100 Tropical Storm WarningDiscontinued
Mexico from north of Tampico to La Pesca.
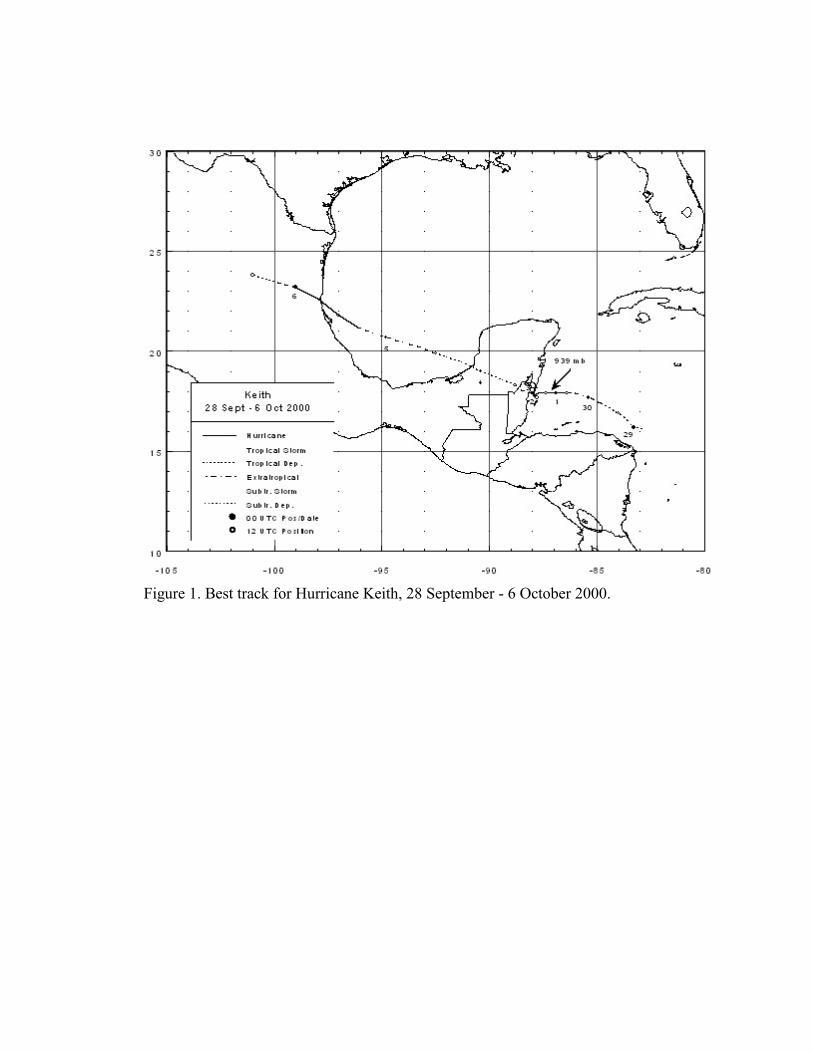
Figure 1. Best track for Hurricane Keith, 28 September - 6 October 2000.
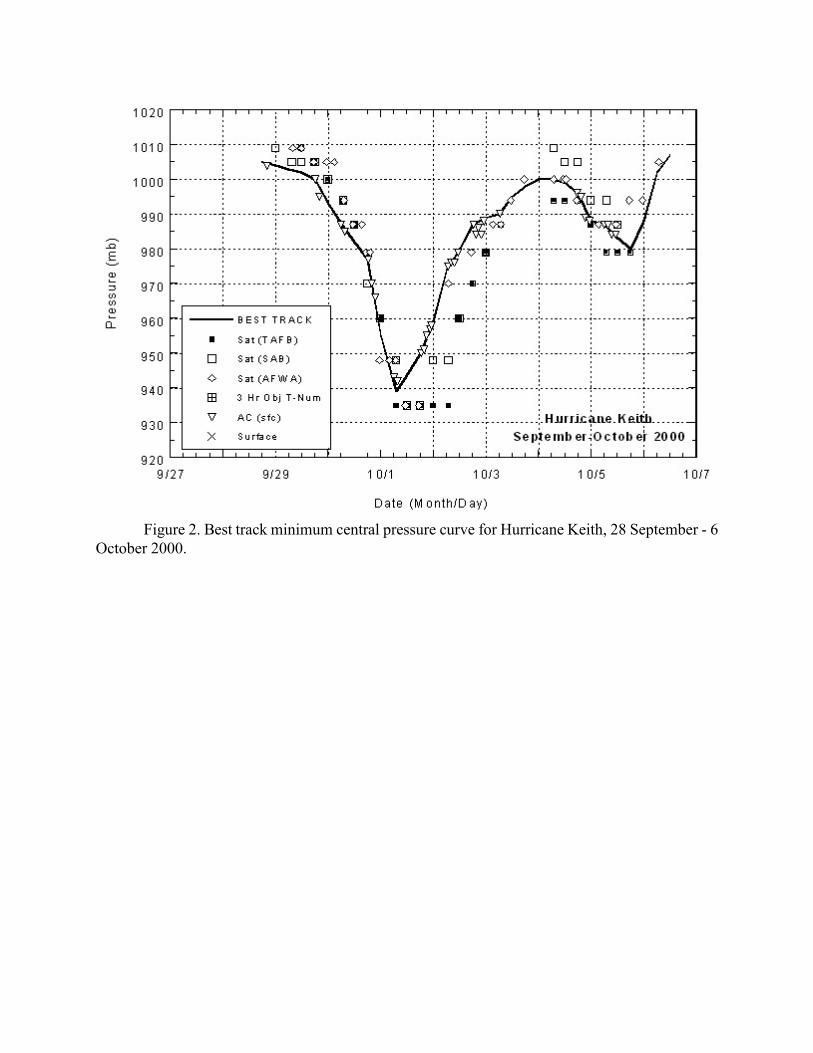
Figure 2. Best track minimum central pressure curve for Hurricane Keith, 28 September - 6October 2000.
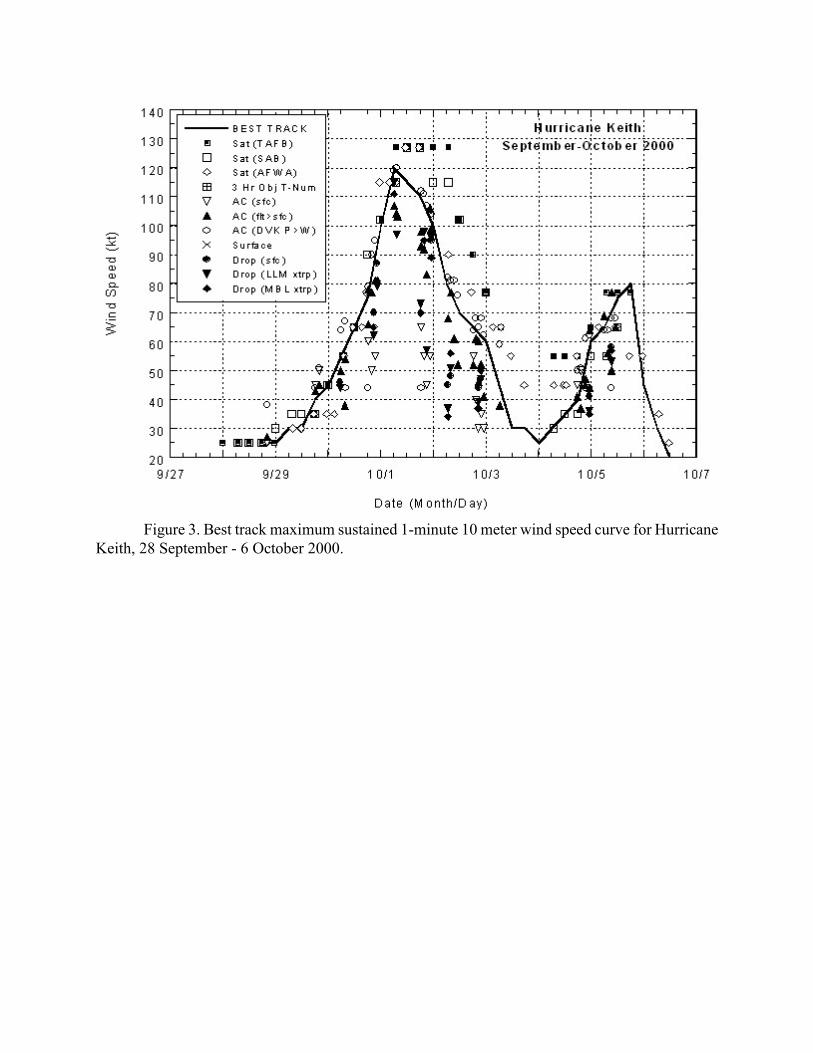
Figure 3. Best track maximum sustained 1-minute 10 meter wind speed curve for HurricaneKeith, 28 September - 6 October 2000.
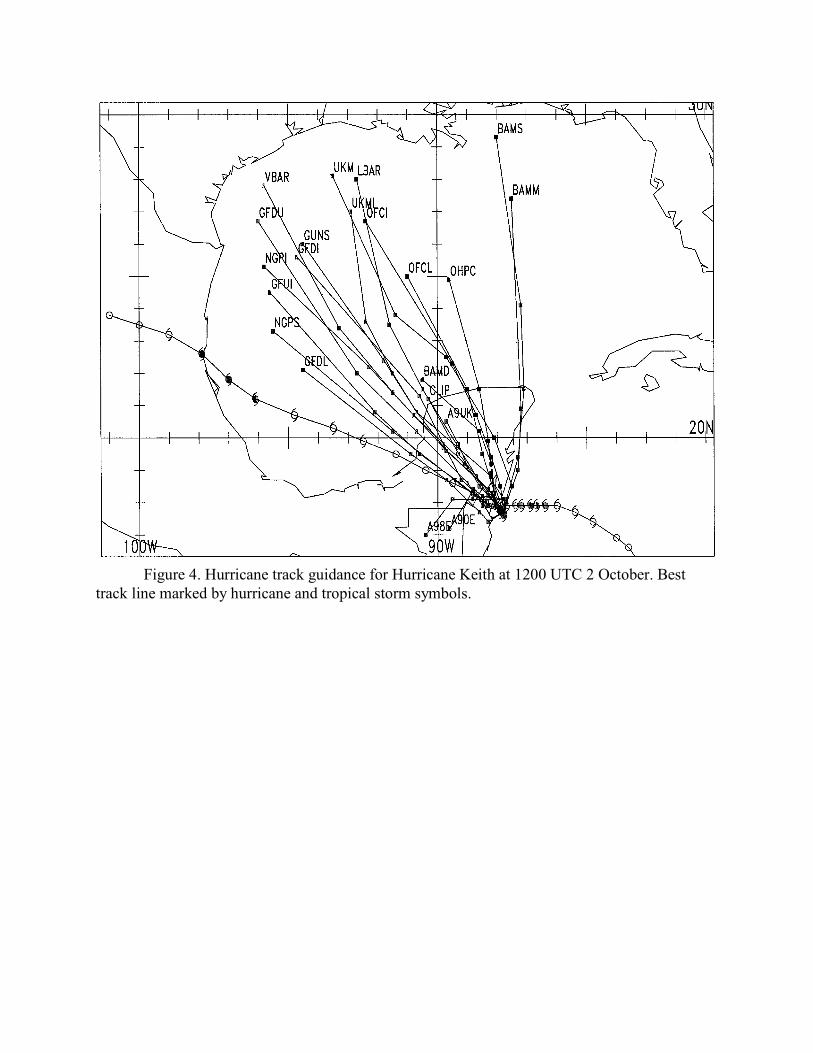
Figure 4. Hurricane track guidance for Hurricane Keith at 1200 UTC 2 October. Besttrack line marked by hurricane and tropical storm symbols.