hurricanes katrina and rita: implications for …. s. shyam sunder, deputy director building and...
TRANSCRIPT
Dr. S. Shyam Sunder, Deputy DirectorBuilding and Fire Research Laboratory
National Institute of Standards and [email protected]
Hurricanes Katrina and Rita:Implications for Hurricane Science and Engineering
National Science Board WorkshopTowards a National Agenda for Hurricane Science and Engineering:
Perspectives from Federal Agencies
January 24, 2006
BackgroundBackgroundHurricanes Katrina and Rita caused extensive loss to physical structures (major buildings, infrastructure, residential structures) over a large geographic area
Hurricane KatrinaNumber of deaths: ~1300Insured loss estimates: $40-60 billion
Hurricane RitaNumber of deaths: 119Insured loss estimates: ~$4.7 billion
Damage to structures resulted from:Extreme winds and wind borne debrisStorm surge and surge-borne debrisFlooding
The Economic ContextThe Economic Context• Total economic losses due to Hurricane Katrina expected to be at least $125 billion,
including:• Tourism losses• Costs of repairs to and rebuilding of homes, businesses, roads, bridges, and other infrastructure• Lost income of people whose place of employment has closed
• Federal investment of ranging $200K to $400K for each of roughly 500,000 displaced families.
• Hurricane Katrina was the deadliest hurricane to strike the United States since 1928.
• Seven of the 10 most expensive hurricanes in U.S. history occurred in the 14 months from August 2004 to October 2005.
• Hurricane Katrina appears to have destroyed 10 times as many homes as Hurricane Andrew in 1992 or the 4 storms to hit Florida and the Southeast in 2004.
• Hurricane Katrina caused $44 billion in flood and storm surge damage, most of it uninsured, 88% in Louisiana.
NIST PreNIST Pre--Reconnaissance DeploymentsReconnaissance Deployments
NIST roofing materials expert deployed with Roofing Industry Committee on Weathering Issues (RICOWI) Sept. 6-10, 2005.
Deployment focused on area between Bay St. Louis, MS and Pascagoula, MS.Team conducted reconnaissance of roofing damage to essential facilities, schools, hotels, and residences.
Four NIST structural engineers deployed with the FEMA MitigationAssessment Team (MAT) Sept. 26-Oct. 1, 2005.
NIST staff operated independently but in cooperation with FEMA MAT.Deployment focused on Mississippi Gulf Coast.Team coordinated with US Army Corps of Engineers to visit levee breaches in New Orleans.
Scope of NIST ReconnaissanceScope of NIST Reconnaissance
NIST contracted with the Applied Technology Council (ATC) to assemble a team of experts to augment NIST expertise
A total of 26 experts were assembled and organized into three teams to conduct field reconnaissance in:
Mississippi Gulf Coast (Hurricane Katrina)New Orleans (Hurricane Katrina)Southeast Texas (Hurricane Rita)
Each of the three teams was further subdivided to focus on major buildings, infrastructure, residential structures
Organizations Participating in NIST TeamOrganizations Participating in NIST TeamFederal agencies
National Institute of Standards and TechnologyFederal Highway AdministrationU.S. Army Corps of Engineers
Private Sector OrganizationsApplied Technology CouncilAmtech Roofing Consultants, Inc.Applied Residential Engineering ServicesImageCat, Inc.International Code Council, Inc.Scawthorn Porter Associates, LLCShiner Moseley and Associates, Inc.Smith & Huston, Inc.
Academic and Research InstitutionsNational Research Council, CanadaTexas Tech University University at Buffalo, Multidisciplinary Center for Earthquake Engineering ResearchUniversity of Puerto Rico
ObjectivesObjectivesCollect and analyze:
Perishable field data (e.g., first-hand observations, photographic data) on performance of physical structures.
Environmental data on wind speed, storm surge, and flooding, andrelate environmental data to observed structural damage.
Review and analyze relevant data collected by other sources (e.g., government agencies, academic and research institutions, industry groups).
Document field observations, environmental conditions, and data gathered from other sources, and make recommendations for:
Repair and reconstruction in the devastated regions.
Improving building codes, standards, and practices.
Further study of structures or classes of structures that warrant detailed performance assessments.
Coordination with Other TeamsCoordination with Other TeamsFEMA Mitigation Assessment Team
Damage reconnaissance with focus on mitigation of risks in new or replacement buildings in hurricane-affected areasNIST coordinated pre-reconnaissance with FEMA MAT
U.S. Army Corps of EngineersFocus on performance of flood control system in New OrleansUSACE staff participating on NIST reconnaissance and providing access to data on flood protection system
Federal Highway AdministrationFocus on reconnaissance of highway structuresTwo FHWA staff participating on NIST reconnaissance
National Science FoundationTwo NSF-funded researchers participating on NIST reconnaissanceData from NSF-funded reconnaissance reviewed as part of NIST effort
Katrina Rita
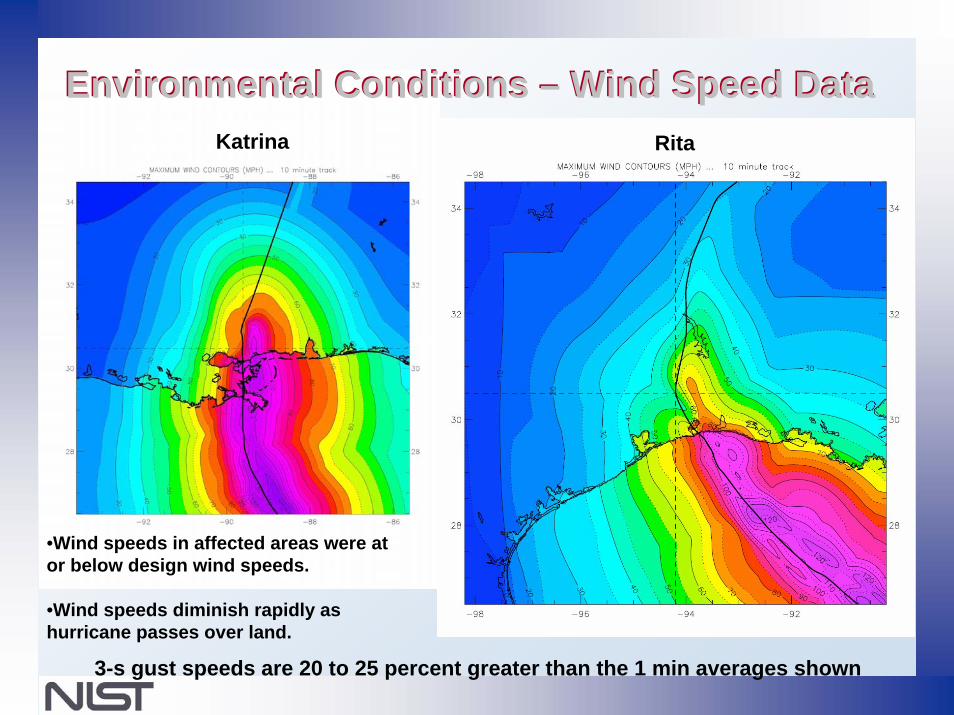
Environmental Conditions Environmental Conditions –– Wind Speed DataWind Speed Data
•Wind speeds in affected areas were at or below design wind speeds.
•Wind speeds diminish rapidly as hurricane passes over land.
3-s gust speeds are 20 to 25 percent greater than the 1 min averages shown
Storm SurgeStorm Surge
Hurricane Katrina24’- 26’ above Mean Sea Level at east end of Biloxi, MS30’- 35’ in Pass Christian-Bay St Louis-Waveland, MS13’ at Mobile, ALExceeded Hurricane Camille (1969) – up to 12’ higher
Hurricane RitaApproximately 6’ storm surge measured in Sabine Pass, TX15’ storm surge in Holly Beach, LACameron, LA devastated by storm surge
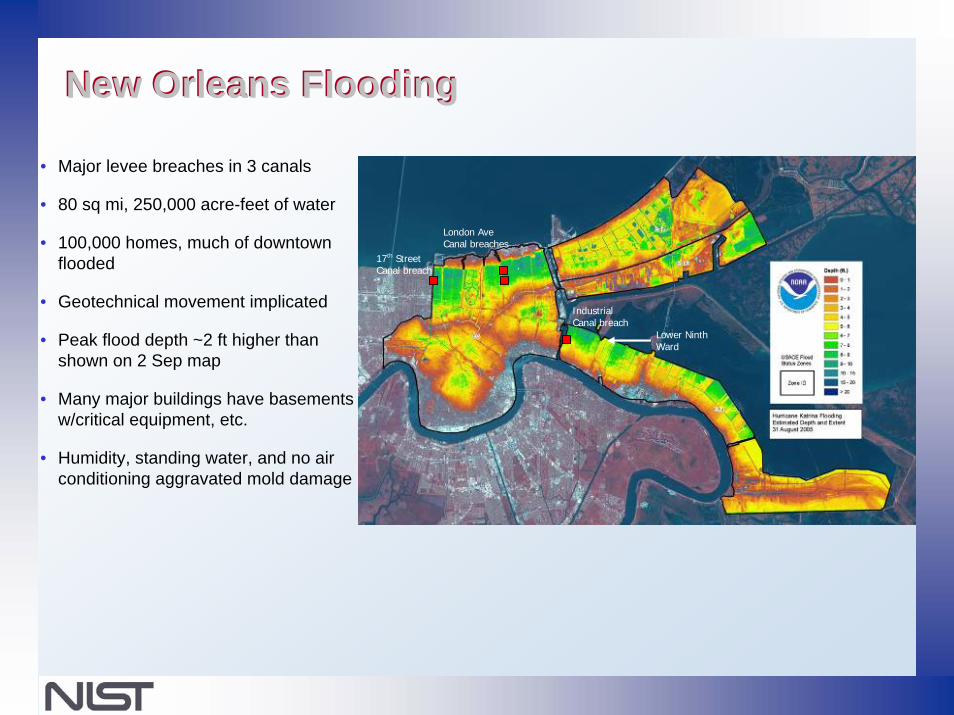
New Orleans FloodingNew Orleans Flooding
• Major levee breaches in 3 canals
• 80 sq mi, 250,000 acre-feet of water
• 100,000 homes, much of downtown flooded
• Geotechnical movement implicated
• Peak flood depth ~2 ft higher than shown on 2 Sep map
• Many major buildings have basements w/critical equipment, etc.
• Humidity, standing water, and no air conditioning aggravated mold damage
17th Street Canal breach
London Ave Canal breaches
IndustrialCanal breach
Lower Ninth Ward
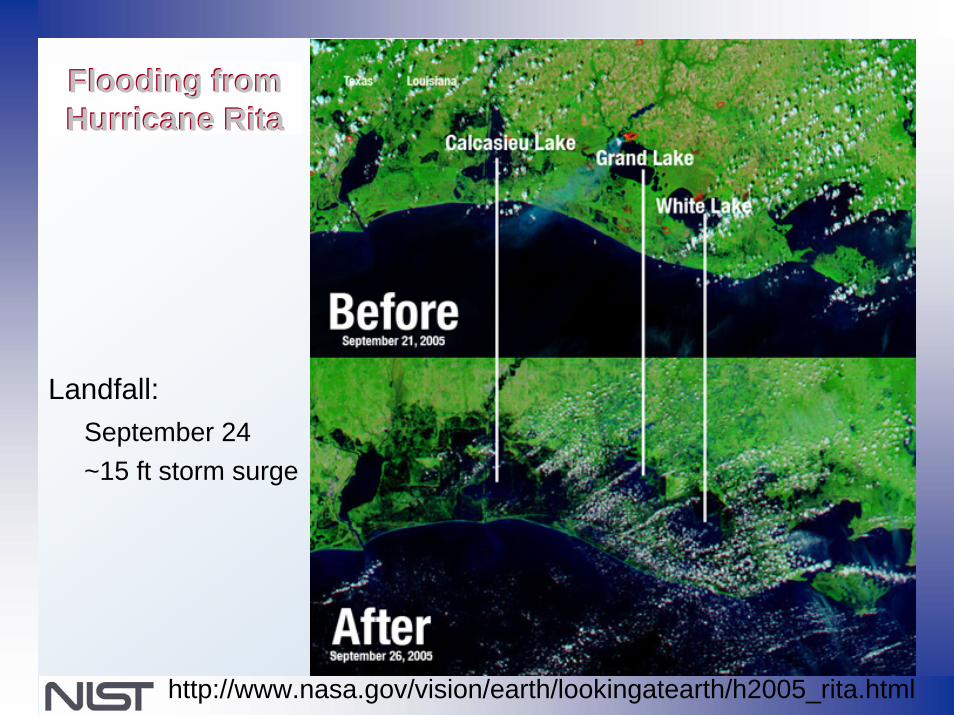
http://www.nasa.gov/vision/earth/lookingatearth/h2005_rita.html
Landfall: September 24~15 ft storm surge
Flooding from Flooding from Hurricane RitaHurricane Rita
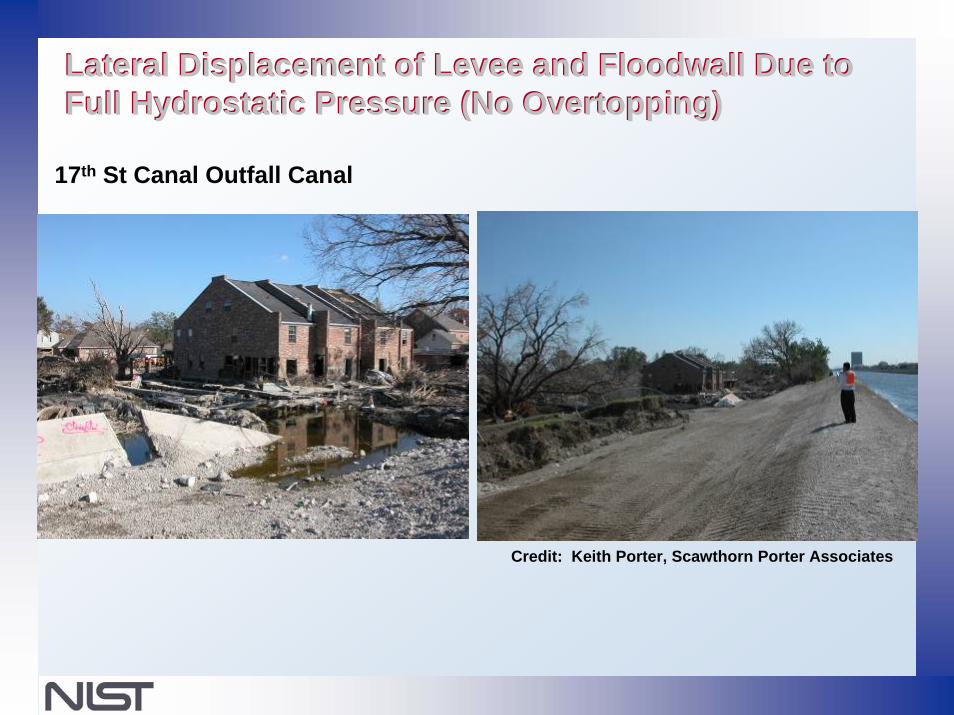
Lateral Displacement of Levee and Floodwall Due to Lateral Displacement of Levee and Floodwall Due to Full Hydrostatic Pressure (No Overtopping)Full Hydrostatic Pressure (No Overtopping)
17th St Canal Outfall Canal
Credit: Keith Porter, Scawthorn Porter Associates
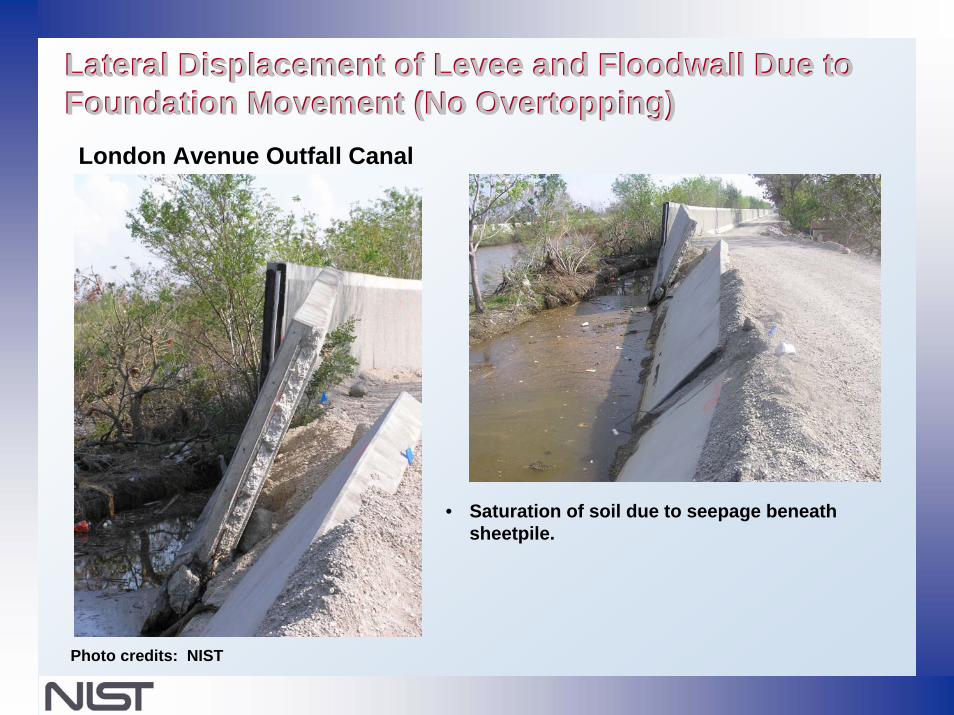
Lateral Displacement of Levee and Floodwall Due to Lateral Displacement of Levee and Floodwall Due to Foundation Movement (No Overtopping)Foundation Movement (No Overtopping)
• Saturation of soil due to seepage beneath sheetpile.
London Avenue Outfall Canal
Photo credits: NIST
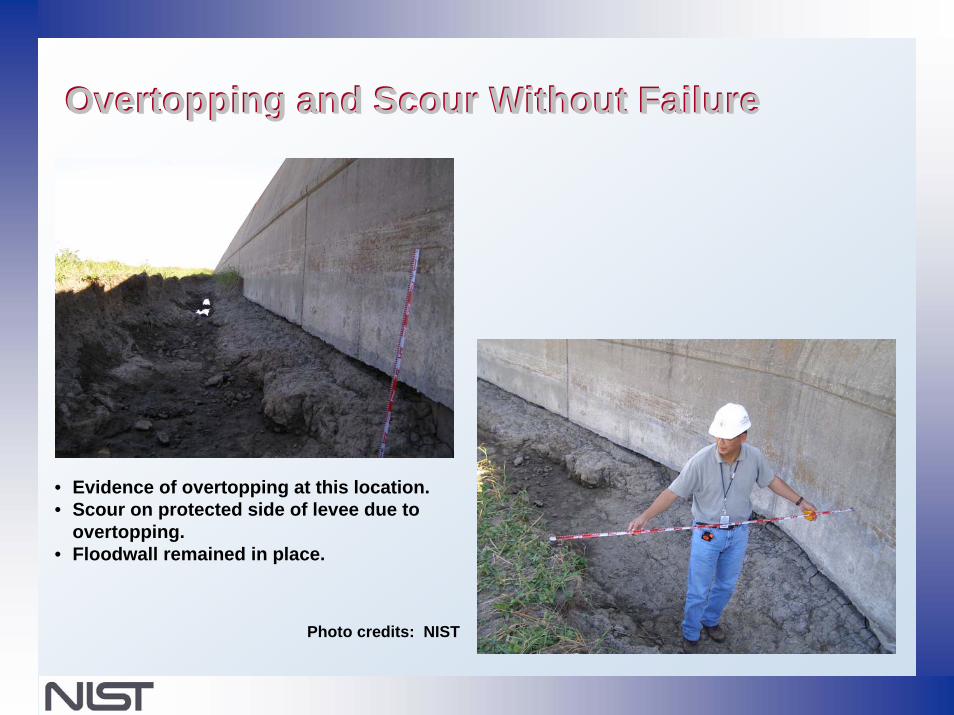
Overtopping and Scour Without FailureOvertopping and Scour Without Failure
• Evidence of overtopping at this location.• Scour on protected side of levee due to
overtopping.• Floodwall remained in place.
Photo credits: NIST
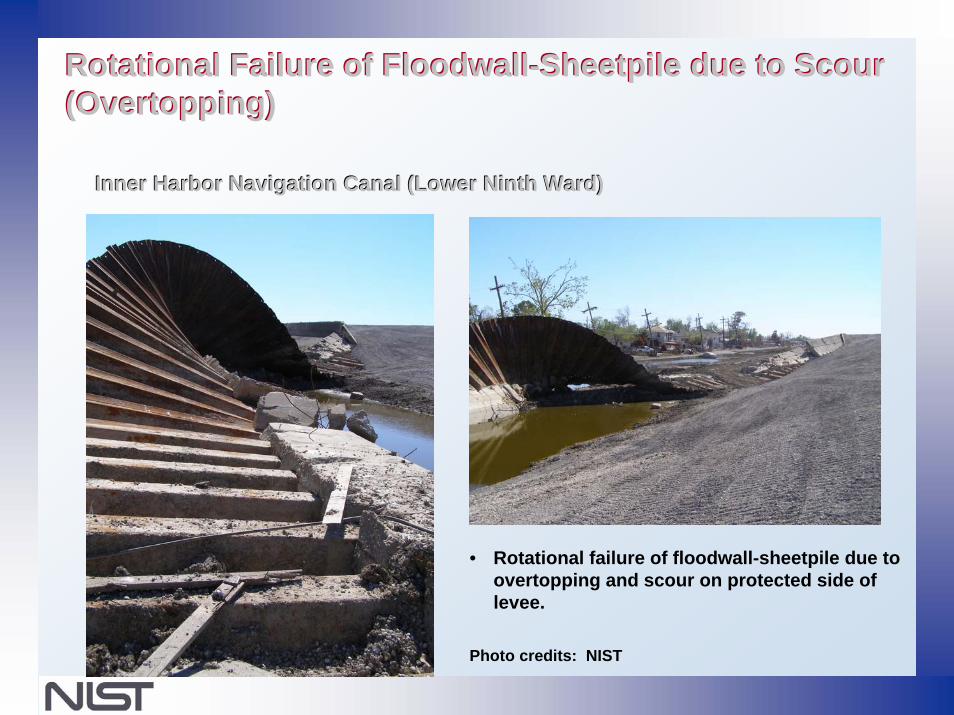
Rotational Failure of FloodwallRotational Failure of Floodwall--SheetpileSheetpile due to Scour due to Scour (Overtopping)(Overtopping)
• Rotational failure of floodwall-sheetpile due to overtopping and scour on protected side of levee.
Inner Harbor Navigation Canal (Lower Ninth Ward)Inner Harbor Navigation Canal (Lower Ninth Ward)
Photo credits: NIST
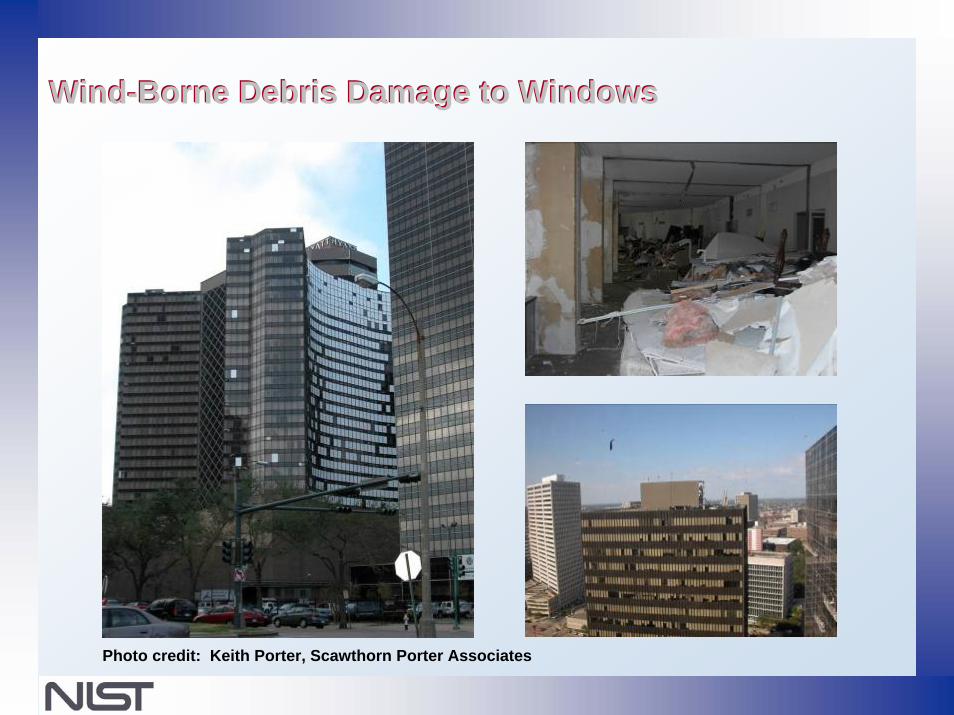
WindWind--Borne Debris Damage to WindowsBorne Debris Damage to Windows
Photo credit: Keith Porter, Scawthorn Porter Associates
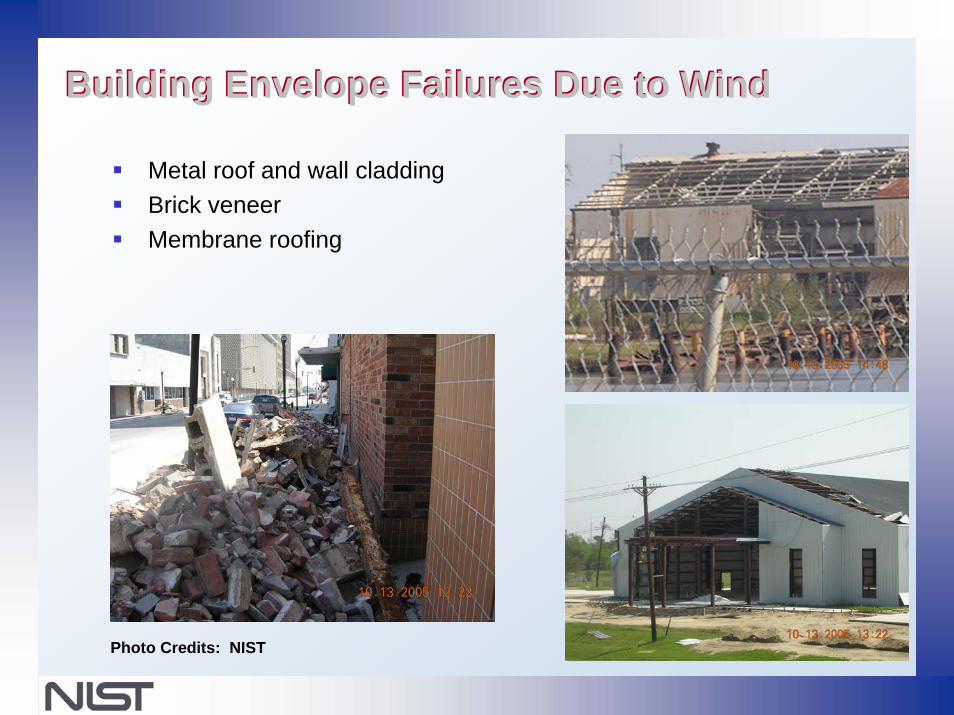
Building Envelope Failures Due to WindBuilding Envelope Failures Due to Wind
Metal roof and wall claddingBrick veneerMembrane roofing
Photo Credits: NIST
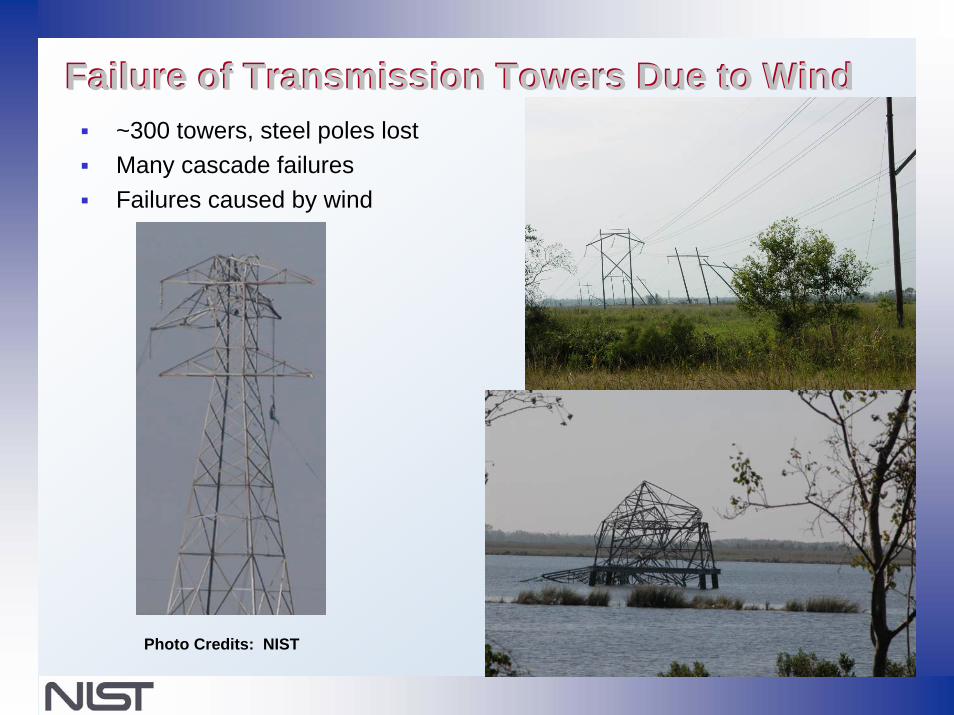
Failure of Transmission Towers Due to WindFailure of Transmission Towers Due to Wind
Photo Credits: NIST
~300 towers, steel poles lostMany cascade failuresFailures caused by wind
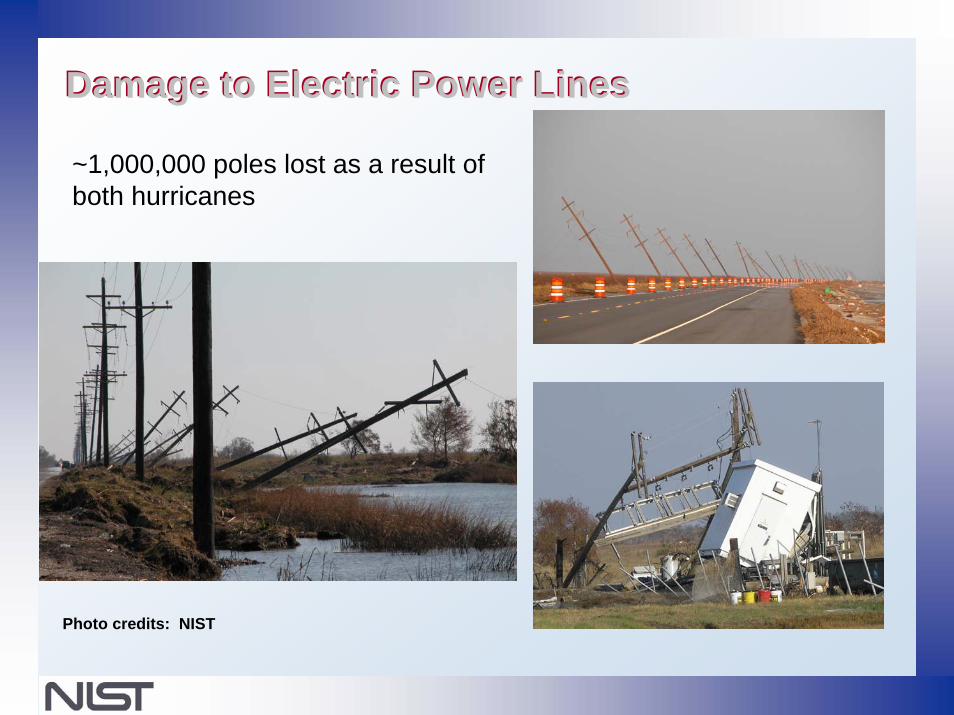
Damage to Electric Power LinesDamage to Electric Power Lines
~1,000,000 poles lost as a result of both hurricanes
Photo credits: NIST
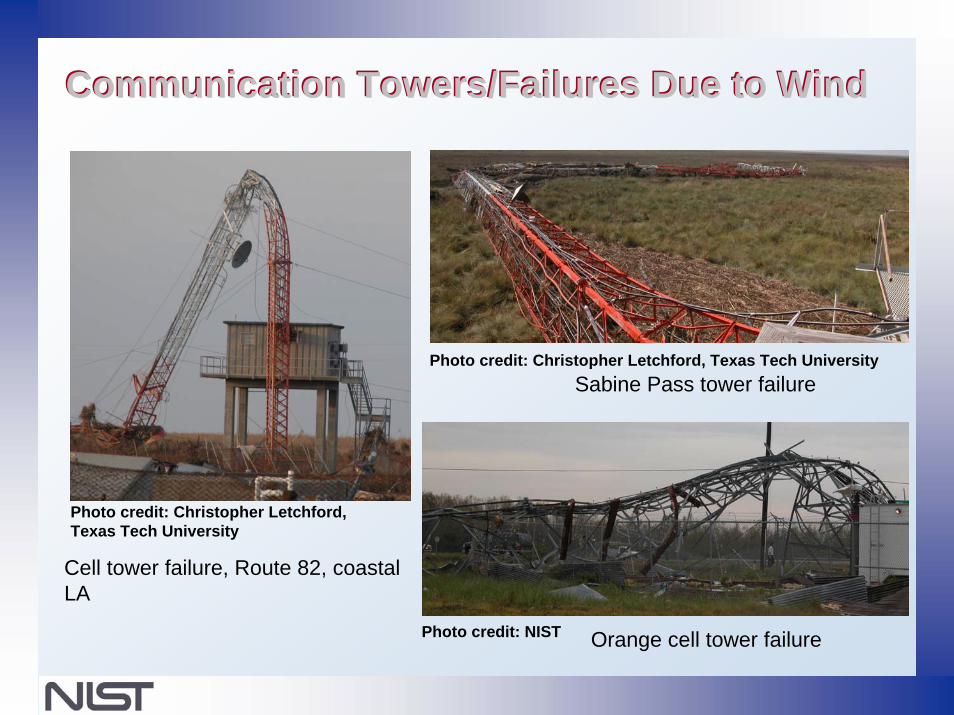
Communication Towers/Failures Due to WindCommunication Towers/Failures Due to Wind
Sabine Pass tower failure
Orange cell tower failure
Photo credit: Christopher Letchford, Texas Tech University
Cell tower failure, Route 82, coastal LA
Photo credit: NIST
Photo credit: Christopher Letchford, Texas Tech University
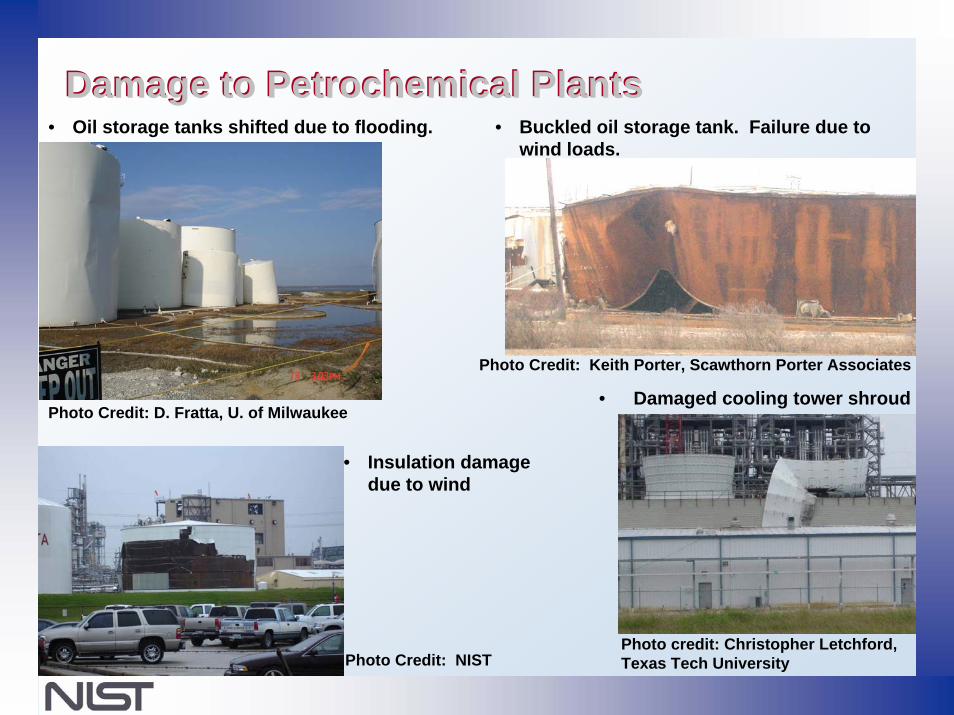
Damage to Petrochemical PlantsDamage to Petrochemical Plants
•
• Oil storage tanks shifted due to flooding.
Insulation damage due to wind
Photo Credit: NIST
• Buckled oil storage tank. Failure due to wind loads.
Photo Credit: D. Fratta, U. of Milwaukee
Photo Credit: Keith Porter, Scawthorn Porter Associates
Photo credit: Christopher Letchford, Texas Tech University
• Damaged cooling tower shroud
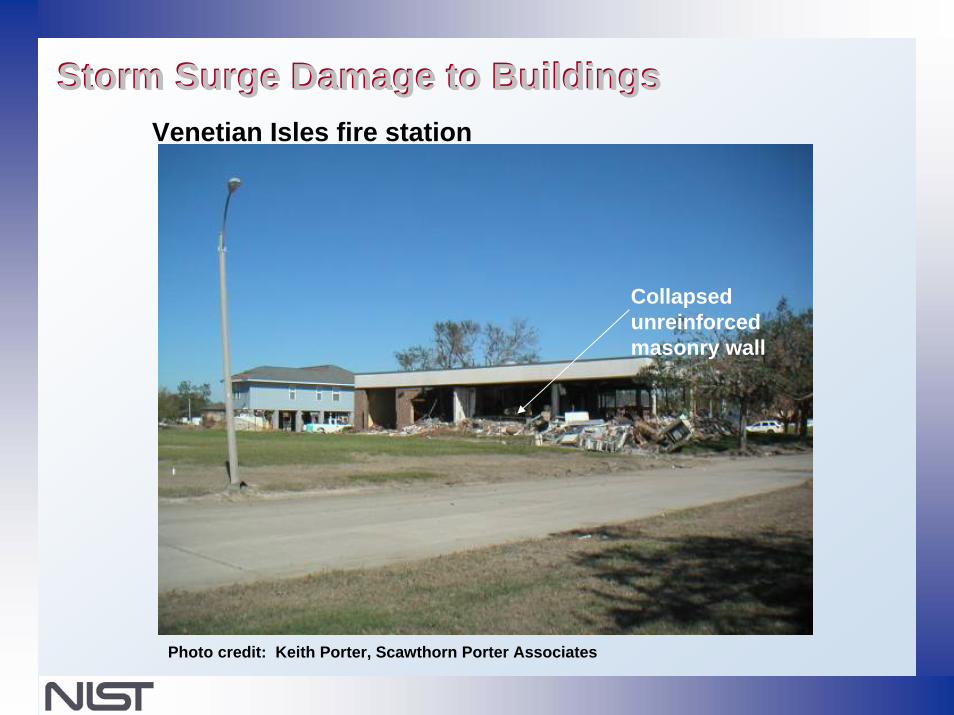
Storm Surge Damage to BuildingsStorm Surge Damage to Buildings
Collapsed unreinforced masonry wall
Venetian Isles fire station
Photo credit: Keith Porter, Scawthorn Porter Associates
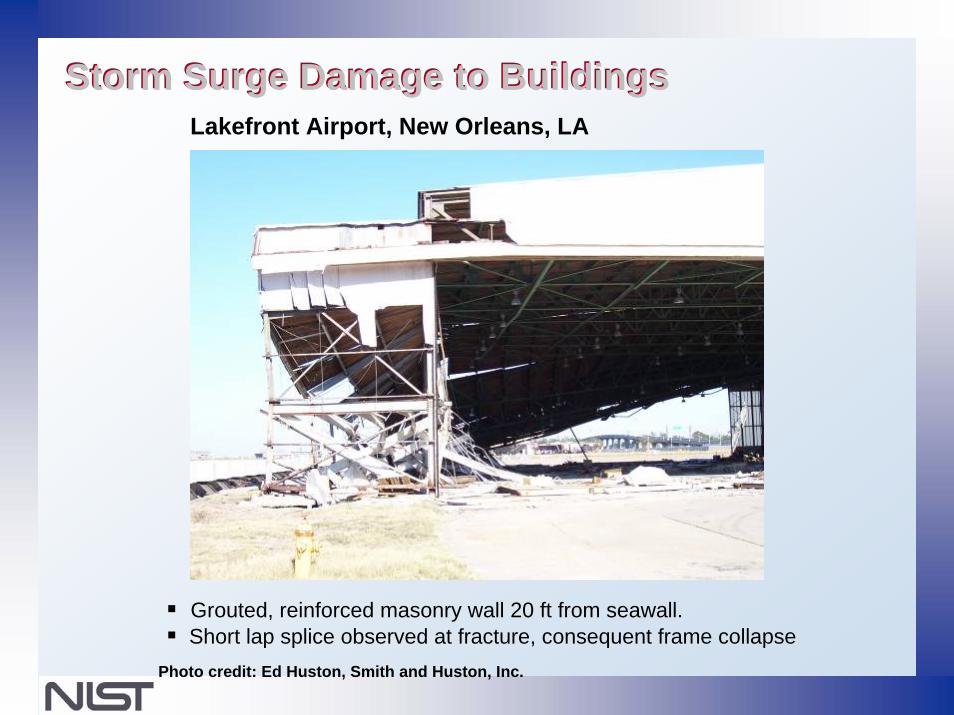
Storm Surge Damage to BuildingsStorm Surge Damage to Buildings
Grouted, reinforced masonry wall 20 ft from seawall.Short lap splice observed at fracture, consequent frame collapse
Photo credit: Ed Huston, Smith and Huston, Inc.
Lakefront Airport, New Orleans, LA
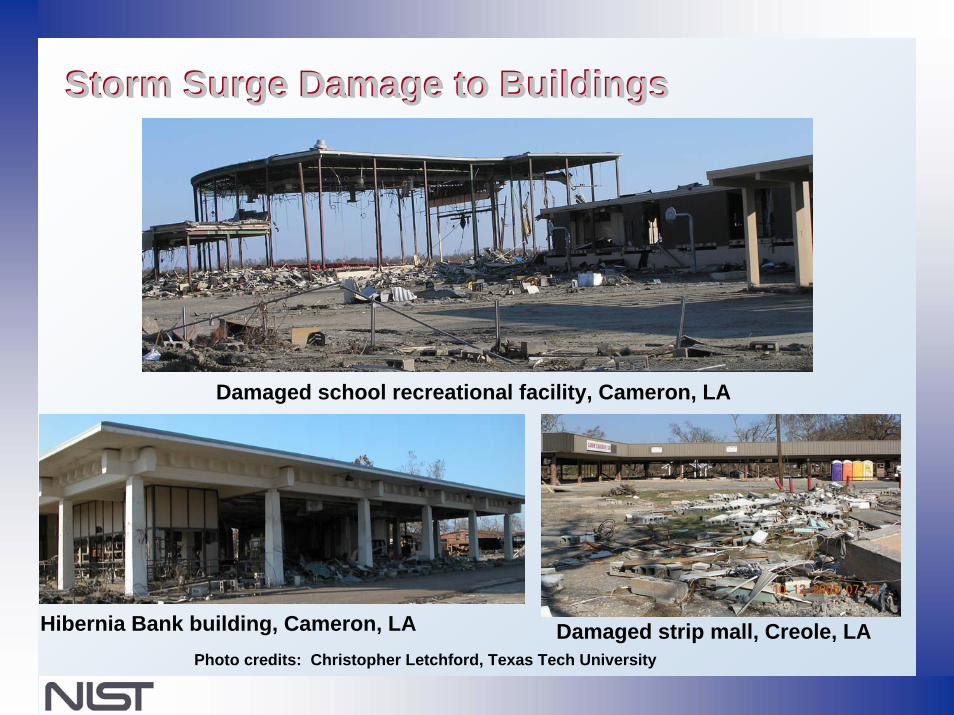
Storm Surge Damage to BuildingsStorm Surge Damage to Buildings
Damaged school recreational facility, Cameron, LA
Damaged strip mall, Creole, LAHibernia Bank building, Cameron, LAPhoto credits: Christopher Letchford, Texas Tech University
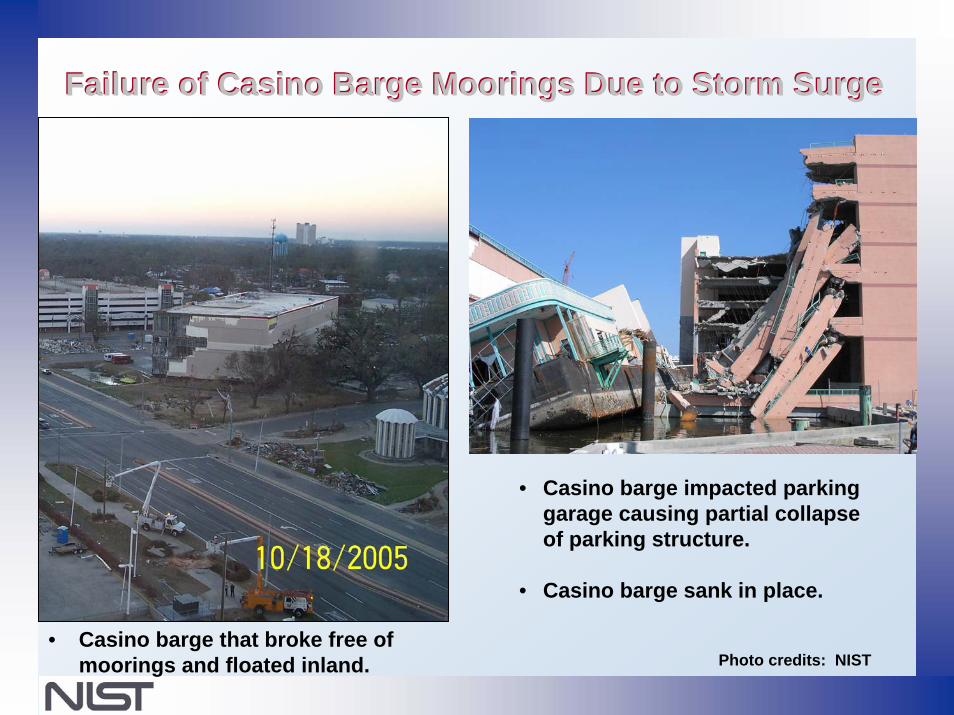
Failure of Casino Barge Moorings Due to Storm SurgeFailure of Casino Barge Moorings Due to Storm Surge
• Casino barge that broke free of moorings and floated inland.
• Casino barge impacted parking garage causing partial collapse of parking structure.
• Casino barge sank in place.
Photo credits: NIST
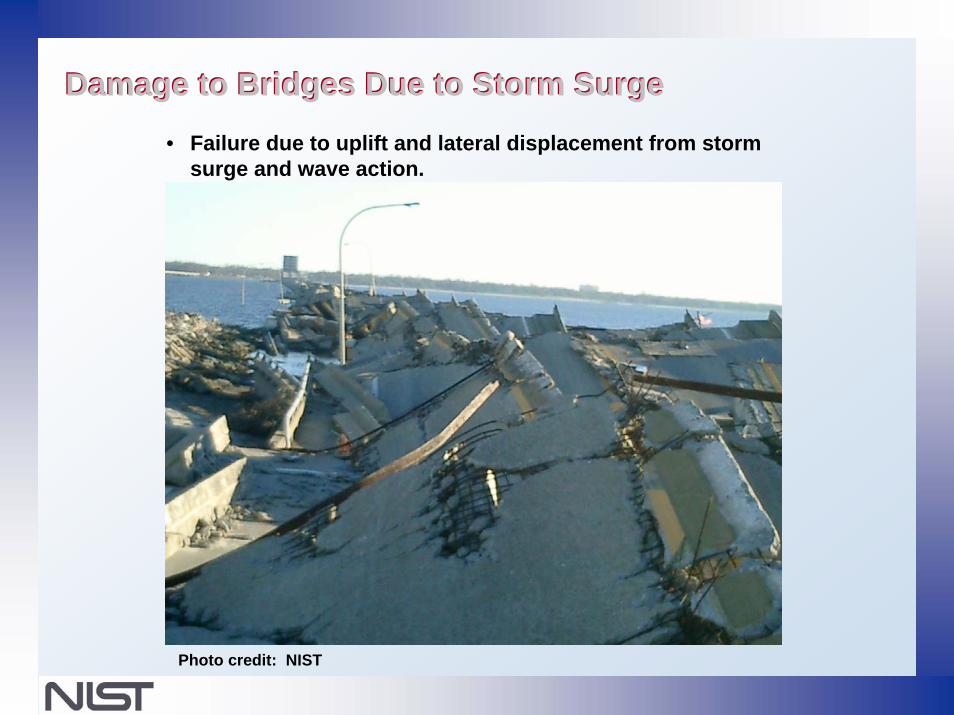
Damage to Bridges Due to Storm SurgeDamage to Bridges Due to Storm Surge• Failure due to uplift and lateral displacement from storm
surge and wave action.
Photo credit: NIST
Issues Issues –– Major BuildingsMajor Buildings
Rooftop construction – aggregate surfaces, screen walls and other materials – source of wind-borne debrisBuilding envelope construction – rain water ingress, wind-borne debrisLocation of equipment at critical facilities – flooding Mooring requirements for floating casinos – run aground or sink-in-placeMasonry building construction – storm surge damage to URM and reinforced masonry, anchoringMetal building construction – failure of roofing and claddingPre-cast, pre-stressed parking garage systems – failure of first-level due to surge-induced lateral and uplift forces
Issues Issues -- InfrastructureInfrastructure
Performance of flood control structures (e.g., levees, floodwalls) – protection against overtopping (floodwall), scour (armor), seepage (sheet pile penetration)Connection of bridge deck sections to piles – surge-induced uplift and lateral forcesTransmission and communication towers – wind-induced failuresLocation of major electrical generating, transmission and distribution equipment in below-grade facilities in low-lying coastal areas – flooding Anchoring systems for cargo handling cranes in port facilities – failures due to wind (New Orleans) and storm surge (Gulfport)
Issues Issues –– Residential StructuresResidential Structures
Construction codes in all areas, especially where design wind speeds exceed 100 mph – adoption of national model building codesBuilding anchorage – displacement from foundationRoofing shingles – type (architectural versus three-tab shingles), installation, and wind resistance Performance of metal roofing systems – flashing, attachment, laminar strength of insulation, adhesion between membrane and insulation, old versus newPerformance of porous and non-porous cladding systems –wood, brick or masonry versus vinyl or aluminum – rain ingressUndamaged temporary construction – portable classrooms
Next StepsNext Steps
Team leads met on November 14 to review observations and discuss possible recommendations
Team is now working to prepare draft report for internal review
Final draft for agency review scheduled for February
Final report to be issued in March
Priority Research NeedsPriority Research Needs• Meteorology for Hurricanes:
• What are the intensification and decay phenomena characterizing hurricanes?
• Hurricanes spawn tornadoes, but little knowledge exists on this phenomenon.
• Micrometeorology: Near Surface Wind Profiles Over Land and Water.• Over the ground away from the eye are not yet sufficiently well defined.
• Available criteria are inadequate for prescribing near-surface mean wind profiles and turbulence features relevant to designing buildings (typically less than 1,500 ft).
• For design purposes it is necessary to estimate 3-s peak gust speed counterparts to the 10-m elevation 1-min speeds that define the Saffir-Simpson hurricane classification.
• Wind profiles over water are poorly defined owing to uncertainties with respect to the surface roughness over the ocean.
Priority Research Needs (2)Priority Research Needs (2)• Risk-Based Storm Surge Maps for Design in Coastal Regions:
• The unexpectedly high storm-surge heights encountered during Hurricane Katrina (exceeding a Category 5 hurricane on the Saffir-Simpson intensity scale) caused numerous failures to major structures along the Louisiana-Mississippi coast line.
• Storm surge caused a disproportionately higher economic and death toll when compared with damage due to wind.
• Estimates of storm surge heights and velocities used in design are inadequate.
• There is a critical need to develop risk-based storm-surge maps for use in the design of structures in the U.S. Atlantic and Gulf Coast regions, considering:
• Hurricane related parameters (forward speed, barometric pressure, track, size, etc.)
• Geographic features associated with specific areas along the coastline (water depths, slope of the continental shelves, shielding conditions, etc.)
• Mean return period consistent with return period used for wind speeds in design standards.
Priority Research Needs (3)Priority Research Needs (3)• Revised Saffir-Simpson Hurricane Intensity Scale:
• Each intensity level in the Saffir-Simpson scale is associated with both a specific range of wind speeds and a specific range of storm-surge heights.
• Hurricane Katrina wind speeds were consistent with a Category 3 storm on the Saffir-Simpson hurricane intensity scale. Structures designed in accordance with current building codes performed as excepted for the wind speeds encountered during Hurricane Katrina.
• The unexpectedly high storm-surge heights encountered during Hurricane Katrina, however, exceeded Category 5 on the hurricane intensity scale.
• Given the inconsistency in the Saffir-Simpson hurricane intensity scale between the observed wind speeds and storm surge heights during Hurricane Katrina, this event demonstrated that the intensity scale was deficient in characterizing the event.
• There is a critical need to improve the widely-used Saffir-Simpson hurricane intensity scale, which is used to provide public warnings and support decision-making on evacuation.
Priority Research Needs (4)Priority Research Needs (4)
• Wind Effects on Structures Based on Aerodynamics and Computational Fluid Dynamics:• Development of extreme wind databases and innovative methodologies for
defining design wind speeds.• Methodologies and software tools for use by practicing engineers and standards
developers; including extraction of extreme wind speed data from NOAA Automated Surface Observing Systems (ASOS) and correction of the data for anemometer elevation effects.
• Database of simulated hurricane wind speeds for the entire Gulf and Atlantic coasts.
• Consider design practices for buildings experiencing dynamic effects. Estimates of wind effects by wind engineers can differ from each other by almost 50% for tall buildings and by even larger amounts for low-height buildings.
Priority Research Needs (5)Priority Research Needs (5)• Wind Effects on Structures Based on Aerodynamics and
Computational Fluid Dynamics: • Advanced wind measurement and computational tools for determining
realistic wind loads in the built environment• Database-assisted design software tools for the analysis of buildings, rigorously
accounting for wind directionality effects, including directionality effects on the dynamic response. Incorporate advanced aerodynamics, statistics, structural dynamics, structural reliability theory, and nonlinear structural theory.
• Validated computational fluid dynamics (CFD) modeling tools to produce a “computational wind tunnel”, i.e., a set of tools for predicting wind effects on structures that will reduce the dependence on or substitute for more expensive and less effective wind tunnel testing.
Effects of highly variable, non-uniform hurricane wind fields.Effects of heavy rainfall on aerodynamic interaction between wind and building.Relate local wind and rain field with much larger scale hurricane dynamics.
• A methodology for estimation of aeroelastic effects on tall buildings.• Advances in information technology allow solution of these highly computer-
intensive problems—both on the desktop (for use by practicing engineers) and via high-performance parallel processors (for research in support of codes and standard provisions).
Priority Research Needs (6)Priority Research Needs (6)• Wind Effects on Structures Based on Aerodynamics and
Computational Fluid Dynamics:• Methods for predicting ultimate structural capacities and estimating safety
margins. • Current codes and standards are based largely on tables which provide over-
simplified and unrealistic design wind loads.• Advanced techniques will allow for allocation of structural strength with optimal
effectiveness to enhance the security of physical structures, and reduce loss of life, in most instances at virtually no increase in construction costs for new buildings or at modest cost for existing buildings.
• This goal will be achieved through the development of performance-based methods that better reflect actual behavior in strong winds, including:
• Procedures for estimating ultimate capacity of rigid structures subjected to wind loads using nonlinear analyses.
• Procedure for calculating safety margins by accounting for simultaneous effects of uncertainties with respect to all significant parameters of the wind loading.
• System of analysis that integrates climatological and aerodynamic databases, computational wind tunnel and database-assisted design tools, statistical analysis of simulated results, and estimation of prediction uncertainties against measured data.
Priority Research Needs (7)Priority Research Needs (7)
• Community Scale Damage Forecasting and Loss Estimation:• Policy, operational, and risk management decisions must be based on
reasonably accurate predictions of the economic losses induced by various natural and man-made hazardous events, as well as on the anticipated benefits from protection against those events.
• Loss components include:• Physical damage to the built environment, including residential, commercial,
institutional, industrial, infrastructure construction, and building appurtenances.• Interior, utility, and contents damage caused by penetration of wind and water
(rain or flooding) once the envelope is breached during hurricanes.• Increased living expenses, medical expenses, loss of income and other socio-
economic consequences of the hurricane event.
Priority Research Needs (8)Priority Research Needs (8)• Community Scale Damage Forecasting and Loss Estimation:
• A large number of loss prediction models exist—most of them proprietary “black boxes”—and their predictions can vary widely.
• Comparative calculations carried out on behalf of the State of Florida showed hurricane loss prediction models differed in some cases on the order of 400%.
• Florida supported development of The Florida Public Hurricane Loss Projection Model, aimed at providing a dependable basis for decisions on insurance rates.
• The Florida model uses state-of-the-art-methodologies, and is a significant step forward with respect to other prediction models.
• Technical basis for improved loss estimation tools needed by forecasters, and also by policy makers for planning response, recovery, and rebuilding activities and estimating budget requirements for such activities in the immediate aftermath of disasters. Research should consider:
• developing or improving requisite models (e.g., hurricane, surge simulations).• organizing the collection of statistics concerning the exposed building and
infrastructure stock (GIS), and historical records of losses (esp. repetitive losses).• producing measurements and statistics of component and system performance.• identifying and modeling community cost components.• producing draft standards for modeling losses.