husqvarna group annual report 2014
TRANSCRIPT

Annual Report 2014

Heritage
1 The Year in Summary
2 Husqvarna Group in Brief
4 Report by the President
6 The Market
8 Financial Goals
9 Strategy
10 Accelerated Improvement Program
12 Strategy 2020
15 The New Organization
16 Husqvarna
20 Gardena
24 Consumer Brands
28 Construction
32 Sustainable and Responsible Business
37 Content Financial Information
38 Report by the Board of Directors
46 Risk Management
50 Corporate Governance Report
58 Internal Control over Financial Reporting
60 Board of Directors and Auditors
62 Group Management
64 Annual General Meeting 2015
65 Financial Statements – Group
65 Income Statement
66 Comprehensive Income Statement
67 Balance Sheet
68 Cash Flow Statement
69 Statement of Changes in Equity
70 Notes
94 Financial Statements – Parent Company
94 Income Statement
94 Comprehensive Income Statement
95 Balance Sheet
96 Cash Flow Statement
97 Statement of Changes in Equity
98 Notes
106 The Board of Directors’ and the President and CEO’s declaration
107 Auditor’s Report
108 Five-Year Review
110 Quarterly Data
112 Restatement of business area reporting 2014
113 Definitions
114 The Share
116 Contact and Website
Contents

1689 –1989Rifle factory Swedish weapons produc-tion takes off and a plant is built in Huskvarna, Sweden.
1874 –1978Kitchen equipmentProduction expands to kitchen equipment in cast iron such as meat mincers, stoves and ovens.
1896 –1962BicyclesHusqvarna bicycles become very popular.
1872–1997Sewing machinesThe machinery for producing rifles turns out to be well suited for manufacturing sewing machines.
Heritage
Passionate about innovationEver since our start in 1689, our passion for innovation, development and precision has led to a long line of successful products and solutions in very different areas – from weapons, sewing machines and motorcycles to market-leading outdoor power products for customers around the globe.
Today, our commitment to increasing usability to fulfill end-customer needs, together with our respect for nature and caring for people, is guiding us to produce more ergonomic products with lower emissions and better energy efficiency than ever before.

2002 Diamond toolsThe construction business doubles in size through acquisition.
2005X-Torq®
New standard for two-stroke engines increases gear ratio, while reducing fuel consumption and emissions.
1918 Lawn mowersWhen Norrahammars Ironworks in Sweden is acquired, the product range expands.
2007 Watering equipment and expansion in JapanAcquisitions of Gardena, Zenoah and Klippo bring strong brands, complementary prod-ucts and geographic expansion.
1969 Anti-vibrationLaunch of the world’s first chainsaw with an integrated anti-vibration system. Ergonomics has been important ever since.
1973Automatic chain brakeThe first automatic chain brake followed by the Trio Brake™ (1999) decreases the risk of injury for for-estry workers.
2008 Expanded presence in ChinaExpand production in China through acquisition and a new production facility.
2009 Demolition robotHusqvarna’s first remote-controlled demolition robot is launched.
2009 AutoTune™Automatic optimization of fuel flow.
2013All-wheel-drive lawnmowerThe world’s first AWD lawn mower is launched.
2012Battery-powered rangeThe same performance as that of petrol-powered machines, but without the noise and direct emissions.
2014 Saw chain productionA new production facility for manufacturing chain-saw chains in Huskvarna, Sweden.
1995Robotic lawn mowerWorld’s first commer-cialized solar-powered robotic mower.
1980’sStrengthened positions in the U.S.Organic growth and acquisitions expand Husqvarna’s operations in the U.S.
1978 Power products in focusHusqvarna is acquired by Electrolux and the outdoor product opera-tions continue to expand through acquisitions.
1959 ChainsawsHusqvarna’s expertise in engines leads to production of chainsaws.
1968 Power cuttersHusqvarna’s first power cutter is a redesigned chainsaw.1903 –1987
MotorcyclesLightweight yet powerful engines give Husqvarna a worldwide reputation in motorcycles.
2006 On its own feetHusqvarna is listed on Nasdaq Stockholm.
Heritage
1947 Powered lawn mowersHusqvarna’s first motor-ized lawn mower for commercial use.

The Year in Summary
2014 – a year of progressl Net sales increased 6%, adjusted for changes in exchange rates, with
higher sales in all business areas.
l The gross margin improved to 28.5% (26.5).
l Operating income for the Group increased by 47% to SEK 2,358m (1,608), excluding items affecting comparability.
l Initiatives within the Accelerated Improvement Program accounted for more than half of the improvement, mainly as a result of: – More favorable product mix due to increased sales in
the focus areas handheld products, robotic lawn mowers, watering products, as well as accessories and parts.
– Material cost reductions.
l Items affecting comparability refer to an impairment of goodwill amounting to SEK –767m, related to the implementation of the new organization.
l The operating margin rose to 7.2% (5.3), excluding items affecting comparability.
l Operating income and margin improved for all business areas.
l The net debt/equity ratio at year-end amounted to 0.59 (0.58).
l Market capitalization increased to SEK 33bn (22).
l A new brand-driven organization was fully implemented as of January 1, 2015.
l The Board of Directors proposes a dividend of SEK 1.65 per share (1.50) for 2014, divided into two payments: SEK 0.55 in April, 2015 and SEK 1.10 to be paid in October, 2015.
SEKm 2014 2013 20121 2011 2010
Net sales 32,838 30,307 30,834 30,357 32,240
Gross margin, % 28.5 26.5 26.9 27.7 28.5
EBITDA 3,325 2,586 2,737 2,671 3,666
Operating income 1,591 1,608 1,675 1,551 2,445
Operating income, excl. items affecting comparability 2,358 1,608 1,931 1,615 2,652
Operating margin, % 4.8 5.3 5.4 5.1 7.6
Operating margin, excl. items affecting comparability, %
7.2 5.3 6.3 5.3 8.2
Income for the period 831 916 1,027 997 1,749
Earnings per share, SEK 1.44 1.60 1.78 1.73 3.03
Dividend per share, SEK2 1.65 1.50 1.50 1.50 1.50
Return on capital employed, % 7.6 7.7 7.4 7.4 11.0
Return on equity, % 6.7 8.1 8.8 8.0 13.9
Capital turnover rate, times 1.7 1.6 1.5 1.6 1.7
Operating cash flow 868 1,813 1,144 – 472 962
Average number of employees 14,337 14,156 15,429 15,698 14,954
Key figures
1) 2012 has been restated due to the amended IAS 19. 2010–2011 are not restated. 2) The dividend for 2014 as proposed by the Board.
n EMEA, 46%
n North America, 43%
n Rest of the world, 11%
Net sales by geographical area, 2014
Operating income and margin1 2010–2014
n Operating income, SEKm Operating margin, %
SEKm %
10 11 12 13 14
1) Excluding items affecting comparability.
0
1,000
2,000
3,000
4,000
0
3
6
9
12
Net sales 2010–2014
n Net sales, SEKm
SEKm
10 11 12 13 140
10,000
20,000
30,000
40,000
Annual Report 2014 Husqvarna Group 1

Husqvarna Group in brief
A world leading producer of forest, park and garden, and construction productsHusqvarna Group is a world leading producer of out-door power products including chainsaws, trimmers, robotic lawn mowers and garden tractors. The Group is also the European leader in garden watering products and a world leader in cutting equipment and diamond tools for the construction and stone industries. The Group’s products and solutions are sold under brands including Husqvarna, Gardena, McCulloch, Poulan Pro, Weed Eater, Flymo, Zenoah and Diamant Boart via dealers and retailers to end-customers in more than 100 countries. Net sales in 2014 amounted to SEK 33 billion, and the Group had more than 14,000 employees in 40 countries.
MissionWe provide innovative quality products and solutions to make garden, park and forest care as well as construction easier for professionals and consumers around the world.
Vision We envision a world where people can enjoy well-maintained gardens, parks and forests and experience refined buildings and roads.
Core brands
DIVISIONS
Husqvarna
Consumer Brands
Gardena
Construction
Develops, manufactures and sells forest, park and garden products such as chainsaws, trimmers, clearing saws, hedge trimmers and tillers as well as robotic, walk-behind and ride-on mowers and accessories. Products are sold mainly through the dealer channel and target the professional and prosumer (demanding
consumer) market segments. Leading brands include Husqvarna, Zenoah and Jonsered.
Develops, manufactures and sells forest and garden products such as chainsaws, trimmers, hedge trimmers, leaf blowers and brush cutters, as well as walk-behind and ride-on mowers, tillers, snow throwers and accessories. Products are sold mainly through the retail channel and target the broad mass consumer market
segment. Leading brands include McCulloch, Poulan Pro, Weed Eater and Flymo.
Develops, manufactures and sells mainly watering products, secateurs, loppers and other non-powered tools, as well as electric and battery-powered garden products. Products are mainly sold through the retail channel and target the passionate gardener, predominantely in the European market
under the Gardena brand.
Develops, manufactures and sells mainly light construction products and diamond tools for cutting, drilling, grinding, polishing and demolish-ing concrete, steel, natural stone and other hard materials. Customers are mainly rental companies, dealers, contractors within the construction industry and companies within the stone industry.
Most sales are in Europe and North America, although business is increasing in the emerging markets. Husqvarna is the brand for construction products and Diamant Boart for stone products.
Share of Group net sales
47%
Share of Group net sales
30%
Share of Group net sales
13%
Share of Group net sales
10%
Annual Report 2014 Husqvarna Group 2

Husqvarna Group in brief
Wheeled productsRiders, garden tractors, zero-turn mowers, lawn mowers, tillers and snow throwers.
Electric products Robotic mowers, electric- and battery- powered handheld and wheeled products.
Handheld products Petrol-powered chainsaws, trimmers, clearing saws, leaf blowers and hedge trimmers.
Watering and hand toolsWater-hoses, couplings, sprinklers, water controls, pumps and hand tools.
AccessoriesAccessories and parts such as cutting equipment, lubricants, safety equipment and clothing.
Construction productsPower cutters, demolition robots, drilling equipment, wall- and wire saws, tile saws, floor grinders and all related diamond tools. Diamond tools for stone.
PRODUCT CATEGORIES
GLOBAL PRESENCE
l Major production facilities l Subsidiaries or distributors
• Leading market positions
• Strong distribution channel positions
• Strong brands
• Product and technology leader-
ship
• Global R&D and supply capability
• 325 year heritage
Fundamental strengths
Annual Report 2014 Husqvarna Group 3

Report by the President
2014 – A year of steady progress, more to followAs we conclude 2014, we can proudly look back on some of the key developments. Firstly, thanks to our Accelerated Improvement Program, we completed the initial step in our profitability improvement target of 10 percent for 2016. Secondly, we widened our horizons and looked beyond current short-term improvement initiatives. The result is a revised strategy and a new organizational structure that was fully implemented from January 1, 2015. With this new structure, we aspire to realize the full potential of market leadership by 2020.
Let me begin with a few words about our financial performance in 2014. Operating income, excluding impairment of goodwill of SEK –767m, rose 47 percent to SEK 2,358m (1,608). Sales grew 6 percent, adjusted for currency and the operating margin
increased by 1.9 percentage points to 7.2 percent. It was especially pleasing to see all areas of the Group contributing to the progress we made. More than half of this improvement is attributable to our Accelerated Improvement Program. But favorable weather conditions, especially in Europe and a general good demand in the Americas gave us further support.
Improved results in all business areasFor Europe & Asia/Pacific, operating income rose 28 percent to SEK 1,904m (1,488), largely as a result of good growth in the product segments where the Group has leadership positions and are part of the most profitable segments included in the Accelerated Improve-ment Program – professional handheld products, robotic lawn mowers and watering products, as well as for accessories and parts. Husqvarna-branded products sold through the dealer channel also showed good growth.
Americas took a big step towards achieving a 5 percent operating margin by 2016, increasing from a break-even level in 2013 to 2.5 percent margin in 2014. The turnaround is a broad-based effort with the largest impact from the Operational Excellence Initiative (i.e. to secure the right product cost and complexity and to drive productivity and efficiency savings in manufacturing) within the improvement program. Sales rose 7 percent, with the increase mainly in the dealer channel. Investing in expanded dealer distribution continues to be a priority to drive a favora-ble channel mix. It was also encouraging to note strong performance in Latin America, driven by Brazil, one of the Group’s prioritized emerging markets.
Construction continued to add to the Group’s strong results, increasing operating income and margin for the fifth year running to SEK 356m (277) and 10.7 percent (9.2) respectively. Several markets experienced a healthy demand in the area of products used for renovations and upgrades, as well as in the natural stone processing market, which are two of our core segments. We are building success by focusing on end-customer needs through providing products with the best reputation, usability and productivity, paired with investing in expanded sales and service in key markets.
Profitability and focus first – 10 percent margin by 2016The Accelerated Improvement Program, which was launched externally in October 2013, is a Group-wide set of measures that will have full financial impact in 2016. The target is to more or less double our operating margin to 10 percent by 2016 compared to 2013. It is this boost in profitability that will make us ready for long-term profitable growth.
Now, more than halfway through the program, we are increasingly focusing on selling more of the products represented by our leader-ship areas. All these product categories are now outperforming average sales growth for the Group.
Our improvement in Americas is on track, mainly because of the Operational Excellence Initiative where the product cost savings and productivity improvements achieved are substantial, combined with a positive channel mix through expanded dealer sales. This achievement is supported by Group-wide collaboration across functions including purchasing, research and development and manufacturing units.
Operational Excellence does not only deliver good progress in cost-out as a consequence of good value engineering, more efficient purchasing and improved productivity, but also in respect of r educing complexity where we are on plan to reach our target of reducing numbers of platforms and stock-keeping units (SKU) by 30 percent by 2016. Process enhancements are also being made in the sales and operations planning.
Furthermore, we are growing our sales in a few vital emerging markets like China and Brazil, although the general development in Russia has somewhat hampered our progress.
Summing up, the operating margin for the Group, excluding the impairment of goodwill, improved from 5.3 percent to 7.2 percent in 2014 which represents a significant step towards our 10 percent target for 2016.
The next step – Market leadership 2020Achieving profitable growth beyond 2016 will be all about exceed-ing the expectations of our customers. This is why our end-customers are the fundamental starting point. A thorough review of the end-customer segments has helped us characterize and define our priority segments even further going forward.
In 2020, we aim to be the market leader in our industry. This means being in, or competing for, the number one market share position, leading the evolution of the industry and exceeding the market growth in priority segments. Today, we may have the credentials of a market
Annual Report 2014 Husqvarna Group 4

Report by the President
Our brands represent a direct link
to our end-customers. By focusing brands on different end-customer segments with differen-tiated offerings, we can eliminate undesirable overlap and optimize the impact of our full product portfolio.
leader in terms of market share and innovation in some segments, but we still need improved financials to translate this into full potential value creation.
We have conducted in-depth investigations of the opportunities and challenges related to a strategy for 2020. The next logical step was to align our organization to support our strategic direction. From January 1, 2015, we have been operating under a new brand-driven organization. We see this as a proactive measure to position ourselves for 2020, and a shift toward expansion and profitable growth beyond 2016. Having said this, we still recognize that Consumer Brands will require a short term turn-around focus followed by a mid-term profitability improvement focus.
Turning breadth into a winning focusOur market is fundamentally attractive and we have a strong starting position. From high-end professionals to mass consumer segments, Husqvarna Group has always served a broad range of customers. Our breadth is a fundamental strength, but to leverage on it and compete successfully, we need, at the same time, to create the conditions for focus.
Our brands represent a direct link to our end-customers. By focusing brands on different end-customer segments with differentiated offerings, we can eliminate undesirable overlap and optimize the impact of our full product portfolio. Value differentiation is prioritized for professional and premium brands, while cost differentiation is prioritized for consumer brands.
By aligning our need for differentiated business models with brands and operational resources and a global profit and loss responsibility to execute the strategies of each division, we expect to create empowered divisions. Looking at our own role model, Construction, we have good reason to believe this will create the right focus.
The new organization contains three forest and garden divisions: Husqvarna, which is a dealer-centric, premium product offering for professionals and prosumers; Gardena, which is a highly appreciated, multi-channel brand for the passionate gardener; and Consumer Brands, which is a retail channel-centric product offering for the mass consumer market. Construction has not been affected by the reorganization.
The size and breadth of the Group provide a scale opportunity that no one else in the market has. Naturally, we aim to explore this competitive advantage. For this reason, Operational Excellence will remain vital in areas like sourcing, logistics and technology. Group functions and a governance framework included in the new organization are designed and implemented to safeguard it.
Honesty and fairnessThe Group has a long and successful history, with a culture characterized by honesty and fairness, of which we are very proud. Since starting out in 1689, our goal has been to combine engineering skills with our strong entrepreneural spirit and innovative products to help our end-customers become more productive.
Internally, we strive to have zero work-related accidents and a workforce boosted with knowledge and prepared for a changing environment. We stay committed to the UN Global Compact, a policy initiative for businesses that aligns its operations and strategies with ten universally accepted principles for human rights, labor, environment and anti-corruption.
What to expect in 2015Our focus on margin recovery remains through the Accelerated Improvement Program – laying the foundation for growth.
From a market point of view we expect a stable demand in 2015. North America might in general look more promising, but on the other hand we will still remain in a turn-around phase with Consumer Brands and will need to prioritze margin before volume.
Most of our trade partners seem to be entering the year with normal inventory levels. Our aim is to continue to grow selectively in the defined product leadership segments. In combination with a firm execution of Operational Excellence improvements, I am convinced that we will take another vital step towards our 10 percent margin ambition for 2016.
The new brand-driven organization is a proactive measure to position Husqvarna Group for the next phase – profitable growth and market leadership 2020. By having the new organization already installed while still finalizing the Accelerated Improvement Program as our priority in 2015, we will move into 2016 with a clear direction and a strong momentum.
With this in mind, I would like to conclude by sincerely thanking all of our employees for a job very well done in 2014.
Stockholm, March, 2015
Kai WärnPresident and CEO
Annual Report 2014 Husqvarna Group 5

The Market
An attractive marketThe addressable global market for forest and garden products in the regions and product segments where Husqvarna Group is active is estimated at SEK 150bn. In addition, there is an addressable market of around SEK 20bn for construction and stone products.
The overall forest and garden market is attractive and can be characterized as a mature market with stable growth. Average
growth has kept pace with gross domestic product (GDP) at between two to three percent per year. Demand is driven mainly by general economic trends. Housing starts, employment levels, consumer purchasing power and confidence, as well as weather conditions are important. A large portion of demand is estimated to be driven by replacement needs.
Europe and the Americas, where a significant part of the world’s forest, park and garden areas are located, are the biggest markets. Combined, the two regions make up around 80 percent of the global market. The Asia/Pacific region, where the largest markets are Japan and China, accounts for the remaining 20 percent. Consumers in these markets generally show less interest in gardening and there is no widespread tradition of garden care among individuals.
Over the last ten years, Europe has demonstrated higher growth than North America, although the growth rate in North America is expected to increase in the next years. In Europe, growth has varied significantly between countries. Germany and Russia have performed well, while Southern Europe has decreased. In terms of volume, Asia/Pacific has been the fastest growing region.
Lawn mowers make up the largest product segmentThe wheeled product segment, which includes ride-on and walk-behind lawn mowers, is the largest in terms of market value, followed by the handheld segment, mainly chainsaws and trimmers. The electric category, which includes corded and battery-powered products, is the smallest segment but it currently has the strongest growth rate in the market.
Construction market growing by about three percent The long-term annual growth rate for the Group’s product offering for the construction and stone industries is around 3 percent for construc-tion industry products and slightly higher for stone industry products. Demand normally correlates strongly with activity in the construction industry, which is characterized by substantial cyclical variations.
Customers and distributionThe Group sells forest, park and garden products to more than 25,000 dealers and leading retailers worldwide that sell them to end- customers. Dealers sell primarily products in the high-price segments to professional users and prosumers (demanding consumers) and offer product service. Retailers sell products in the low and medium-price ranges, mainly to consumers. In terms of value, the market is split approximately 50/50 between the two channels, with the retail channel dominating in North America and the dealer channel in the rest of the world.
Q1 Q2 Q3 Q4
Net sales, seasonalityAverage distribution per quarter 2010–2014, %
Operating income, seasonality1
Average distribution per quarter 2010–2014, %
SEASONAL VARIATIONSForest and garden products, which represent the majority of the Group’s total sales, are highly seasonal due to end-customer buying patterns. The majority of equipment is sold during the spring and summer months when most lawn care and gardening activities take place. Because the main markets are located in the Northern hemisphere, sales are highest towards the end of the first quarter and during the second quarter. The third quarter is generally the end of the garden season, given average weather patterns. The season for watering products is normally even shorter and often ends after the second quarter. Demand for forestry products tends to be somewhat higher during the second half of the year.
0
10
20
30
40
-20
-10
0
10
20
30
40
50
60
30%34%
21%16%
Q1
40%
60%
12%
-12%
Q2 Q3 Q4
1) Excluding items affecting comparability.
Annual Report 2014 Husqvarna Group 6

The Market
Consumer Brands
Estimated addressable market value, SEK
60bn
Estimated addressable market value, SEK
20bn
Construction Husqvarna
Estimated addressable market value, SEK
70bn
Estimated addressable market value, SEK
20bn
Gardena
Global market long-term growth rate
2-3%The overall forest and garden
market is attractive and can be characterized as a mature market with stable growth.
Forest, park and garden
Main competitors Main products Main markets
STIHL Group Handheld products for forest, park and garden such as chain-saws, clearing saws and trimmers for professional users and prosumers.
Global
Deere & Company Garden tractors and zero-turn mowers for professionals and prosumers.
North Americaand Europe
Toro Mowing equipment for professional lawn care as well as lawn mowers for prosumers.
North Americaand Europe
Yamabiko Corporation Handheld products for forest, park and garden for professional users and prosumers.
Global
Bosch Group Electric and battery-powered garden products for consumers. Europe
Stanley Black & Decker
Electric and battery-powered garden products for consumers. Global
Fiskars Tools for gardening and lawn care such as secateurs, loppers and rakes.
Europe and North America
Kärcher Home and garden products including watering systems. Global
Hozelock Watering products for consumers. Europe
Global Garden Products (GGP)
Ride-on and walk-behind lawn mowers. Europe
Modern Tool and Die Company (MTD)
Lawn mowers and ride-on lawn mowers for consumers. North Americaand Europe
TTI Handheld products for forest, park and garden as well as lawn mowers for consumers.
Global
Construction and stone industries
Main competitors Main products
Hilti Drilling equipment, wall saws, drills and diamond tools.
STIHL Group Power cutters.
Tyrolit Wall saws, floor saws, diamond tools and stone diamond tools.
Ehwa and Shinhan Diamond tools.
Construction and stone industry products are sold directly to end-customers such as sawing and drilling contractors and quarry opera-tors, to rental companies that rent the equipment to end-customers, or to dealers who sell to professional construction end-customers.
Market demand in 2014Global demand for forest and garden products developed positively in 2014. The market in Europe was supported by an early spring resulting in strong demand in the first half of the year. The
North American market had almost the opposite conditions. The winter was long, resulting in a late spring and start to the gardening season, while a long summer with favorable growing conditions late in the year supported demand in the second half of the year. From a macro perspective the U.S. forest and garden market was supported by continued recovery in the overall economy.
For construction and stone industry products, overall demand was good, especially driven by North and Latin America, while demand in Europe had a mixed development.
Annual Report 2014 Husqvarna Group 7

Financial Goals
The Group’s long-term financial goals were defined in connection with the stock exchange listing in 2006. Dividend and capital structure targets were met in 2014. The operating margin improved to 7.2 percent from 5.3 percent, moving closer to the target of 10 percent. As a consequence of the medium-term priority to focus on improving the operating margin, the sales growth target was removed in 2013.
Two down – one to go
>10%
Operating marginOperating margin of more than 10 percent over the course of a business cycle.
Operating margin, excluding items affecting comparability, amounted to 7.2 percent.
Average operating margin was 6.5 percent 2010–2014, and 7.8 percent 2005–2014, excluding items affecting comparability.
<2.5× >40%
Capital structureCapital structure should meet the criteria for long-term credit rating corresponding to at least BBB. This is considered to require that seasonally-adjusted net debt in relation to EBITDA should not exceed a multiple of 2.5 in the long term.
DividendThe dividend shall normally exceed 40 percent of income for the year.
Seasonally-adjusted net debt/EBITDA was 2.0 at year-end.
The Board proposes a dividend for 2014 of SEK 1.65.
The payout ratio for 2014 corresponds to 114 percent of income for the year. Excluding impairment of goodwill, the payout ratio corresponds to 59 percent of income for the year.
LONG-TERM FINANCIAL GOALS
àGOAL ACHIEVE-MENT
à
n Operating margin, %1
1) Excluding items affecting comparability.
n Net debt/EBITDA, times n Dividend as share of income for the year, %
1) As proposed by the Board.
10 1011 1112 1214 14113 130
1
2
3
0
40
80
120
10 11 12 14130
2
4
6
8
10
Annual Report 2014 Husqvarna Group 8

Strategy
To earn the right to grow, the Group first needs to prioritize margin recovery. The aim of the Accelerated Improvement Program, which will run until the end of 2015, is to improve the Group’s profitability, to reduce complexity and to increase focus. In 2016 and beyond, priority will gradually shift towards expansion and profitable growth. The goal is to realize the full potential of market leadership by 2020.
First things first
…THEN EXPANSION AND PROFITABLE GROWTH
PROFITABILITY AND FOCUS FIRST…
Strategic priorities for 2020• Continued Operational Excellence
• Accelerated profitable growth for Husqvarna, Gardena and Construction
• Turn-around of Consumer Brands performance
• Innovative products and solutions
• Multi-channel distribution
• Emerging markets growth
Accelerated Improvement Program• Focus on core brands and the most attractive
product segments (”profit pools”)
• Operational Excellence
• Dealer and retail business model differentiation
• Further measures to turn around Americas’ results
• Emerging markets growth
Annual Report 2014 Husqvarna Group 9

Accelerated Improvement Program
The Accelerated Improvement Program is the Group’s vehicle for profitability and focus. It was launched in October 2013 and includes five initiatives. In short, the program aims to increase the operating margin to at least 10 percent in 2016 by improving the mix of products and brands sold and reducing the cost of products sold. The program will be finalized in 2015 and will deliver full financial impact in 2016. In 2014, the Group’s operating margin increased by 1.9 percentage points to 7.2 percent.
Our road to profitability
FOCUS ON CORE BRANDS AND THE MOST ATTRAC- TIVE PRODUCT SEGMENTS (”PROFIT POOLS”)
Husqvarna Group has a wide and diversified assortment of products and accessories under many different brands that are sold to both the retail and dealer channel to reach targeted end-customers.
Selling the right mix of products, accessories and spare parts is keyThe main objective of this initiative is to grow selectively, to sell the right mix of products to the right customers. Product categories and brands vary in terms of profitability; some are more attractive than others. Naturally, it is essential to focus on areas with above average profitability.
For Husqvarna Group, this translates into Husqvarna and Gardena in terms of brands, and to product segments where the Group has leadership positions: professional handheld products, robotic lawn mowers and watering products. In addition, accessories and parts is an attractive area and thus an important part of the initiative.
Focusing resources an important enablerThese prioritized product segments and brands represent a large portion of sales and a significant share of profitability. Resources in marketing, product development and sales have been focused to these areas accordingly during the program.
In 2014, sales in all four prioritized areas showed a higher rate of growth than the average for the Group.
Core brands
Product leadarship positions Accessories and parts
1
Annual Report 2014 Husqvarna Group 10
Accelerated Improvement Program
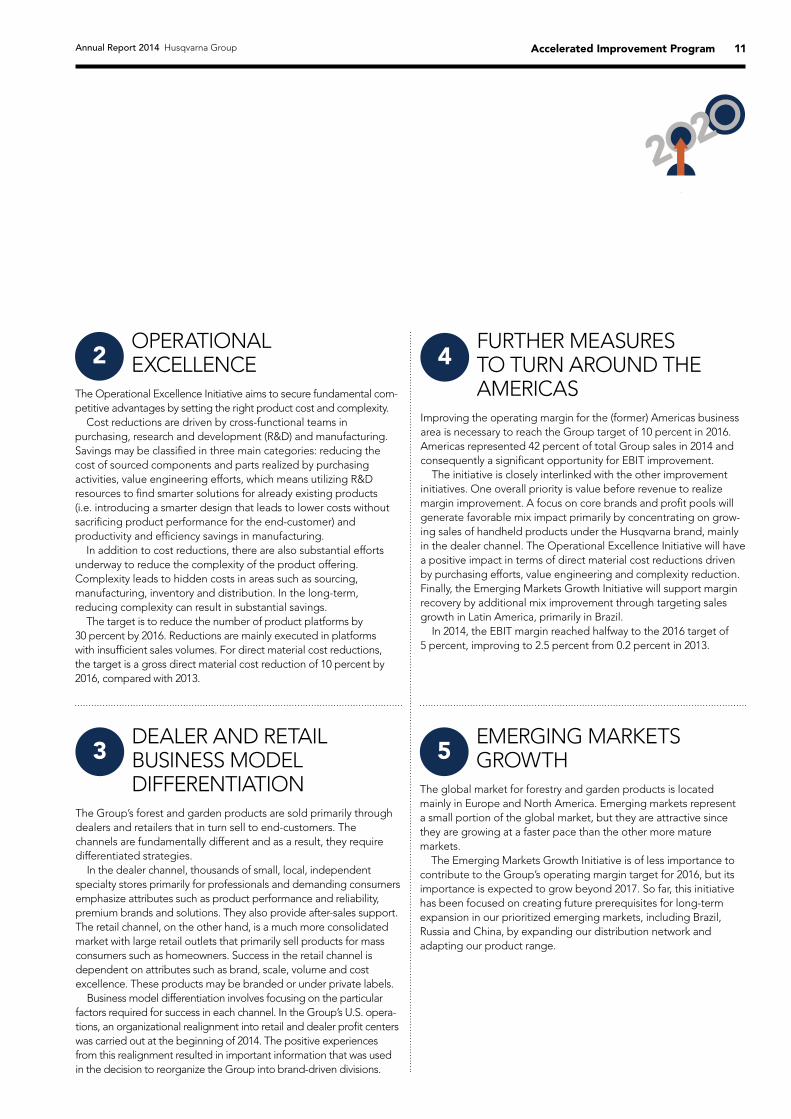
OPERATIONAL EXCELLENCE
The Operational Excellence Initiative aims to secure fundamental com-petitive advantages by setting the right product cost and complexity.
Cost reductions are driven by cross-functional teams in purchasing, research and development (R&D) and manufacturing. Savings may be classified in three main categories: reducing the cost of sourced components and parts realized by purchasing activities, value engineering efforts, which means utilizing R&D resources to find smarter solutions for already existing products (i.e. introducing a smarter design that leads to lower costs without sacrificing product performance for the end-customer) and productivity and efficiency savings in manufacturing.
In addition to cost reductions, there are also substantial efforts underway to reduce the complexity of the product offering. Complexity leads to hidden costs in areas such as sourcing, manufacturing, inventory and distribution. In the long-term, reducing complexity can result in substantial savings.
The target is to reduce the number of product platforms by 30 percent by 2016. Reductions are mainly executed in platforms with insufficient sales volumes. For direct material cost reductions, the target is a gross direct material cost reduction of 10 percent by 2016, compared with 2013.
FURTHER MEASURES TO TURN AROUND THE AMERICAS
Improving the operating margin for the (former) Americas business area is necessary to reach the Group target of 10 percent in 2016. Americas represented 42 percent of total Group sales in 2014 and consequently a significant opportunity for EBIT improvement.
The initiative is closely interlinked with the other improvement initiatives. One overall priority is value before revenue to realize margin improvement. A focus on core brands and profit pools will generate favorable mix impact primarily by concentrating on grow-ing sales of handheld products under the Husqvarna brand, mainly in the dealer channel. The Operational Excellence Initiative will have a positive impact in terms of direct material cost reductions driven by purchasing efforts, value engineering and complexity reduction. Finally, the Emerging Markets Growth Initiative will support margin recovery by additional mix improvement through targeting sales growth in Latin America, primarily in Brazil.
In 2014, the EBIT margin reached halfway to the 2016 target of 5 percent, improving to 2.5 percent from 0.2 percent in 2013.
EMERGING MARKETS GROWTH
The global market for forestry and garden products is located mainly in Europe and North America. Emerging markets represent a small portion of the global market, but they are attractive since they are growing at a faster pace than the other more mature markets.
The Emerging Markets Growth Initiative is of less importance to contribute to the Group’s operating margin target for 2016, but its importance is expected to grow beyond 2017. So far, this initiative has been focused on creating future prerequisites for long-term expansion in our prioritized emerging markets, including Brazil, Russia and China, by expanding our distribution network and adapting our product range.
DEALER AND RETAIL BUSINESS MODEL DIFFERENTIATION
The Group’s forest and garden products are sold primarily through dealers and retailers that in turn sell to end-customers. The channels are fundamentally different and as a result, they require differentiated strategies.
In the dealer channel, thousands of small, local, independent specialty stores primarily for professionals and demanding consumers emphasize attributes such as product performance and reliability, premium brands and solutions. They also provide after-sales support. The retail channel, on the other hand, is a much more consolidated market with large retail outlets that primarily sell products for mass consumers such as homeowners. Success in the retail channel is dependent on attributes such as brand, scale, volume and cost excellence. These products may be branded or under private labels.
Business model differentiation involves focusing on the particular factors required for success in each channel. In the Group’s U.S. opera-tions, an organizational realignment into retail and dealer profit centers was carried out at the beginning of 2014. The positive experiences from this realignment resulted in important information that was used in the decision to reorganize the Group into brand-driven divisions.
3
2
5
4
Annual Report 2014 Husqvarna Group 11

Strategy 2020
Everything starts with the end-customers
The Group’s competitiveness depends on the ability to drive and respond to customer needs. As the Group gradually shifts focus to profitable growth beyond 2016, the organization will have an even stronger end- customer and market focus. The uniqueness in the breadth of the product offering will remain, however, paired with an increased focus on the differentiating factors for success in each end-customer segment, aiming for market leadership by 2020.
END-CUSTOMER SEGMENTSEnd-customer segmentation is the starting point and the most important platform of Strategy 2020. Knowing which segments to target and how to serve them effectively determines success in the market, and end-customers have been put at the center to understand their needs. Interviews with more than 5,000 consumers and 1,000 professionals were conducted around the world, resulting in profiles of the specific needs and requirements of different segments. The Group’s ability to drive customer insight based developments and respond to these requirements is key for the Group’s competitiveness.
More efficient use of resourcesUnderstanding the different end-customer segment profiles will help the Group develop better offerings, a more balanced product mix, clear brand positioning and more targeted communication. This will also create new opportunities in the development of products and solutions that will allow the Group to prioritize high value segments to make the best use of resources. The different brands play an important role here, as they are the direct link to end-customers.
MARKET FUNDAMENTALSThe overall forestry, lawn and garden industry segments where the Group is present are attractive and demonstrate stable growth in volume and value. Average growth has been around 2-3% per year, long-term. Geographically, the market is dominated by Europe and North America that together account for around 80 percent of the global market. Husqvarna Group is well positioned with high market shares in many segments.
Profitable growth opportunitiesThe market offers segments of high growth as well as areas of high profitability. The attractiveness of the segments varies and selecting the right mix is important for the Group’s overall performance. The market is mature and fairly stable, but some trends are challenging the established structure. For example, battery technology is taking share, the importance of emerging markets is growing and new buying behavior, such as online shopping, is evolving.
Market leader ambitionHusqvarna Group’s main ambition for 2020 is to be the market leader. Market leadership means being the number one or number two player – and competing for the number one position. It also means having the ability to capture the full financial potential of such market leadership. A market leader drives industry evolu-tion in terms of innovation, end-customer focus and Operational Excellence. A market leader is a value grower with the ability to outperform peers in both profitability and growth.
No. 1 or 2A market leader drives industry evolution in terms of innovation, end-customer focus and Operation-
al Excellence. A market leader is a value grower with the ability to outperform peers in both profitability and growth.
Annual Report 2014 Husqvarna Group 12

Strategy 2020
TECHNOLOGY AND INNOVATIONOver the Group’s 325 years of operations, one of the key success factors has always been the understanding of end-customer needs. In Strategy 2020, the ability to leverage end-customer insight into product development to drive differentiation between customer segments, brands and channels is a key success factor. The importance of placing end-customers at center stage and quickly responding to their needs by offering the most innovative products and solutions cannot be stressed enough.
Ever-evolving demandsEnd-customer demands are constantly evolving and new business opportunities will arise as demand changes and new technology has an impact. One example is the emergence of “intelligent experience” where sensor technologies, connected products and machine-to-machine interaction are leading to automated products and new markets. A robotic lawn mower can now be integrated with an irrigation system. Sensors detect when the lawn needs mowing or the grass needs watering, and the user monitors the system via a smartphone app. Another example is connected sensor technology installed on a fleet of commercial lawn and garden products. Collected data allows the operator to optimize run-time and service intervals, which minimizes downtime and maximizes productivity.
CHANNEL DEVELOPMENTThere are fundamental differences between the main channels to the market. The dealer channel is characterized by best-in-class products and services under strong brands. These are recognized by professionals and prosumers who value powerful and reliable products built for several hours of productive run-time every day. The retail channel is characterized by products that are adequate for the mass consumer who demands a few hours of weekly run-time at an attractive price. Brand, scale and cost excellence are survival criteria for suppliers in the retail channel.
Online impactIn general, the differences between the dealer and retail channels are expected to remain and continue to co-exist with their respective specific characteristics. Online buying, however, will im-pact them both. Retailers, dealers and end-customers increasingly expect a multi-channel approach and it is up to suppliers to respond. Husqvarna Group aims to help and support channel partners to be successful in their online efforts.
Husqvarna’s new Smart Switch, a one-touch keyless system that does much
more than just turn your tractor or zero-turn mower on and off.
Annual Report 2014 Husqvarna Group 13

Strategy 2020
SIX FUNDAMENTAL STRENGTHS FOR BUILDING FUTURE PROFITABLE GROWTHHusqvarna Group has a unique set of strengths that represent a strong starting point and a valuable asset on which to build future success. The Group has leading market share positions in many segments, and has a strong presence in both the dealer and retail sales channels, serving leading retailers and more than 25,000 independent dealers worldwide. In terms of brands, the portfolio consists of strong global brands complemented by important regional ones. Product and technology leadership with long- standing proven capacity for innovation, global research and development and supply capacity and a 325-year-long heritage are other fundamental strengths that the Group can leverage.
• Leading market positions
• Strong distribution channel positions
• Strong brands
• Product and technology leadership
• Global R&D and supply capacity
• 325 year heritage
BREADTH AND FOCUSGiven the fundamental strengths of the Group, a challenge for the future is to establish the right focus without sacrificing breadth and scale. There is a large diversity of requirements coming from different customers, channels, products and brands. For example, to successfully serve professional forestry experts requires different focus and attention compared with serving urban home owners. To reach full potential, the Group needs to focus on the differences that are essential for success in each business model. At the same time, the scale advantages in the areas of manufacturing, sourcing, technology etc. of belonging to a larger Group must be captured to ensure competitiveness. This is why the Group’s broad business model has been transformed into differentiated divisions to be even more focused, to compete successfully and to win.
STRATEGIC PRIORITIES 2020
Diverse professional and consumer needs
Different channel requirements
Broad product range
Large portfolio of brands
• Continued Operational Excellence
• Accelerated profitable growth for Husqvarna, Gardena and Construction
• Turn-around of Consumer Brands performance
• Innovative products and solutions
• Multi-channel distribution
• Emerging markets growthWireless Machine Sensor (Data Collector). By mounting a small wireless
machine sensor to an outdoor power product, it becomes possible to optimize
the use and service of the equipment.
Annual Report 2014 Husqvarna Group 14

Strategy: 2020
Brand-driven organization
Brands End-customer segments
Distribution channels
Divisions
Capture scale, coordinate and secure
• Strategy
• Brands
• Technology
• Sourcing
• Products
Professional and prosumer (demanding consumer)
Dealer-centric, multi-channel
Husqvarna
Consumers – Passionate gardeners
Retail-centric, multi-channel
Gardena
Mass market consumer
Retail-centric, multi-channel
Consumer Brands
Professionals in construction and stone industries
DirectRentalDealer
Construction
The New Organization
It is people and teams that will make Strategy 2020 happen, and the Group’s employees will make the difference.
• Focus
• Speed
• Energy
• Drive
Annual Report 2014 Husqvarna Group 15

Brands Product range End-customers Distribution channels Main competitors
• Petrol-powered handheld products such as chainsaws, brush cutters, trimmers and leaf blowers
• Wheeled products such as front riders, garden tractors, zero-turn mowers, walk-behind mowers and snow throwers
• Electric products, i.e. battery-powered and corded products, robotic mowers and handheld products such as trim-mers, leaf blowers and chainsaws
• Accessories and spare parts
• Professional users
• Prosumers
Dealer-centric,multi-channel
• STIHL Group• Deere & Company• Toro• Yamabiko Corporation
Husqvarna
Husqvarna is a market leader in forest and garden. Key strengths are the broad and competitive product range, global distribution through dealer partnerships built over many years, proven innovation capability and brand recognition. Husqvarna enjoys a heritage position in professional handheld products and robotic mowers. The target end-customers are professionals and prosumers (demanding consumers) that have high demands and expectations on product performance and quality.
Strong brands, products and technology leadership
Net sales 2014
SEK 15.4 bnNorth America
31%EMEA
52%Rest of the world
17%
Share of Group net sales• Market leader in forest and garden
• Professional and prosumer
• Dealer-centric, multi-channel
47%
Annual Report 2014 Husqvarna Group 16

Husqvarna Division
category, followed by handheld products, accessories, spare parts and electric products. The overall global market share is around 20 percent, with a relatively higher share in the European market. By product category, market positions are strong for handheld products, especially chainsaws, and wheeled products. For robotic mowers, Husqvarna is the undisputed global market leader.
Flexible global supply chainThe Division has a global manufacturing and sourcing footprint, with the main facilities in North America and Europe, close to the main markets in order to achieve a flexible supply chain. The ability to serve customers with short lead times is a necessity due to industry seasonal-ity as well as potential short-term fluctuations in demand driven by weather patterns.
Substantial R&D resourcesThe Husqvarna Division is the main research and development (R&D) driver of the Group. The R&D has a broad, multi-segment approach. Resources are located primarily in Sweden, the U.S., China and Japan, with specific focus and expertise at each site to serve the market with innovative products and solutions across a broad range of forest and garden applications.
The Division incorporates the core brand Husqvarna and tactical/regional brands such as
Zenoah and Jonsered. The tactical/regional brands serve specific segments that the Husqvarna brand currently does not reach and also provide an op-portunity to address the premium retail segment. Net sales for the Division in 2014 amounted to SEK 15.4bn, which represented 47 percent of Group net sales, and the operating margin was 13.0 percent.
The Division operates globally, with the majority of sales in mature European and North American markets, which means that further opportunities exist in emerging markets. Sustained technologi-cal and innovation leadership is imperative for market acceptance of products and solutions. An opportunity to leverage the scale of the full Husqvarna Group to drive long-term cost efficiencies is a key strength.
Heritage position in handheld products and robotic mowersHusqvarna reaches its end-customers mainly through the dealer channel, which is a global network of thousands of small, local and inde-pendent stores. Given the dealer-centric model, driving dealer channel business development in partnership relationships with dealers is a priority. Product areas are professional handheld products, such as chainsaws, trimmers, clearing saws, hedge trimmers, leaf blowers and tillers as well as robotic mowers and wheeled products including riders, zero-turn mowers, garden tractors and walk-be-hind mowers. Spare parts and accessories are also important segments. End-customers are found in areas such as forestry, tree care, landscaping and commercial lawn and garden services, as well as among home- and landowners.
Strongest market positions in EuropeThe largest product segment is the wheeled
Sustained techno-logical and
innovation leadership is imperative for market acceptance of prod-ucts and solutions. An opportunity to lever-age the scale of the full Husqvarna Group to drive long-term cost efficiencies is a key strength.
PRIORITIES• Deliver according to the Accelerated
Improvement Program
• Grow professional and prosumer positions
• Develop the dealer channel
• Continue product and solutions innovation
• Drive operational excellence and leverage Group scale
• Grow emerging market positions
Annual Report 2014 Husqvarna Group 17

Husqvarna Division
It is enabling businesses to gain substantially improved insight into their operations, right at their fingertips. And
no one is more excited about Fleet Services than Douwe Snoek.
“With Husqvarna Fleet Services, I now have the right data and the right fleet. And downtime is much lower than before.”
Douwe owns Snoek Hoveniers, a landscaping firm in Grou, the Netherlands. His 80 employees keep the grounds of private and public properties – including a Dutch cheese factory – in tip-top condition.
For the past year, he has been testing Husqvarna’s Fleet Services.
Each of Snoek Hoveniers’ Husqvarna ride-on mowers and handheld trimmers uses a unique sensor to collect data on engine-on time, engine rpm, vibrations, tempera-ture and operator ID. This data is uploaded wirelessly onto a dashboard, giving an overview of the fleet and team.
Douwe can see a machine’s uptime, handling and service needs in real time on his computer screen or any mobile device. And he is instantly notified as issues arise. Today, downtime is virtually zero.
Sustainability also gets a boost, since knowing exactly when to service equipment means that it can perform bet-ter and longer.
Douwe is also pleased that Fleet Services is helping him keep his employees healthy.
Now, thanks to Fleet Services’ vibration reports, Douwe can monitor his crew’s exposure to harmful vibrations, leading to safer, more productive landscaping operations.
Fleet Services also showed Douwe that he could perform better by switching to battery-powered products. The result: less fuel, less noise.
“The battery-powered products allow us to work close to cemeteries and around schools, hospitals and retirement homes with a lower noise level and without fuel emissions,” he explains.
In short, Snoek Hoveniers is busier than ever.“After telling customers that we’ve modified our fleet,
everyone wants to use us,” says Douwe.
The new Husqvarna Fleet Services™ is a cloud-based service that connects a machine fleet and landscaping teams to an online portal.
FROM QUALIFIED ESTIMATES TO INDISPUTABLE FACTS
Annual Report 2014 Husqvarna Group 18

Husqvarna Division
The photo is not an illustration of the case presented on the previous page.
Annual Report 2014 Husqvarna Group 19

Brand Product range End-customers Distribution channels Main competitors
• Watering management: garden hoses, connectors, reels and sprayers; sprinklers and sprinkler systems; water pumps and watering controls
• Corded and battery-powered products such as robotic mowers, trimmers, hedge cutters and shrub shears
• Garden tools such as secateurs, loppers, axes, digging tools and winter tools
Consumers – the passionate gardeners
Retail-centric, multi-channel
• Hozelock• Fiskars• Kärcher• Bosch Group• Private labels
Gardena
Gardena is Europe’s number one watering brand. The brand is built on strengths that provide substantial competitive advantages: premium brand, superior distribution, product innovation driven by consumer insight, and leading design and quality. Going forward, there are many opportunities to leverage the brand by expanding core segments geographically and by adding more product categories.
A strong European gardening brand
Share of Group net sales
Net sales 2014
SEK 4.2 bnNorth America
2%EMEA
94%Rest of the world
4%
• The premium and powerful European gardening brand
• Passionate gardeners
• Retail-centric, multi-channel
13%
Annual Report 2014 Husqvarna Group 20

Gardena Division
There are significant opportuni-
ties to expand the core offering beyond the current core markets, as well as to leverage on Gardena’s brand strength into new or adjacent product categories.
The brand for passionate gardenersThe Gardena brand enjoys very strong brand awareness and recognition in the European markets. It has the strength to attract all of the main consumer segments, but its main focus is on end-customers with a passion for gardening. The passionate gardener takes pride in crafting unique results in the garden and truly enjoys the different activities involved in gardening, which means that this consumer demands reliable, user-friendly products with high quality.
Opportunity to expand geographicallyThe core markets are Germany, Austria, Switzer-land, Belgium and the Netherlands. Gardena is also well represented in other areas of Europe as well as in Australia, Canada and South Africa. Taking into account the fact that the U.S. market has certain different technical standards for watering products, the total market potential is estimated at SEK 20bn.
There are significant opportunities to ex-pand the core offering beyond the current core markets, as well as to leverage on Gardena’s brand strength into new or adjacent product categories.
Flexible supply chain to support seasonality and weather impact Watering products are highly seasonal and also extremely weather dependent as dryness supports sales of watering products. In a “normal“ year, the first half year will account for around 70 percent of full-year sales. Gardena’s production facilities are located in the core market Germany, and in the Czech Republic and are optimized to achieve short lead times, e nsuring customers quick delivery readiness.
The Division incorporates the core Gardena brand, complemented by the Neta brand
in Australia. Net sales for the Division in 2014 totaled SEK 4.2bn, which accounted for 13 percent of Group net sales. The operating margin amounted to 9.1 percent.
The Division operates globally, but at the moment, more than 90 percent of sales are in Europe. Distribution is increasingly multi- channel: retail, dealer and online. Consumer shopping behavior is increasingly turning to online purchasing; however, distribution is still mainly through the retail channel, which represents almost 90 percent of the Division’s sales.
A leader in consumer watering products, growing in electrical productsGardena offers the broadest range of gardening products in its markets and leads the market in Europe for watering and hand tools. Its products are typically in the medium to high price ranges. Strengths include high quality, leading consumer insight-driven innovation and design language. The product range is characterized by a solution and system character and much of its success has come from systems such as the Original Gardena System (OGS) in watering products (garden hoses, hose connectors, hose reels, hose sprayers, sprinklers and sprinkler systems, water pumps and control systems, etc.) and the Combisystem for hand tools (secateurs, loppers, branch pruners, axes, etc.).
Electrical products such as trimmers, hedge cutters and shrub shears are also included in the Gardena offering. One of the most recent additions to the portfolio is a robotic mower, a Gardena range built on the great experience from Husqvarna Automower®, which is the undisputed market leader in robotic mowers.
PRIORITIES• Deliver according to the
Accelerated Improvement Program
• Geographical expansion of core segments
• Increase product range in core regions
• Enhance and drive multi-channel distribution
Annual Report 2014 Husqvarna Group 21

Gardena Division
Ines is an architect. After she designed their landscaping, the couple used a range of Gardena hoses and sprayers
to maintain the garden, but the watering simply took too much time.
“After work, Ines wanted to go running. I wasn’t very happy since I had to stay behind to do the watering, which took hours. We needed another solution,” explains H-P.
The answer was an underground water pipeline system from Gardena. That changed everything. Both now have time to train for marathons and H-P even gets to play golf.
Because the system uses untreated groundwater, their plants are healthier than before. And their new automatic drip irrigation system ensures each plant is perfectly watered.
Best of all, they can travel to visit inspiring gardens in Thailand and South Africa without worrying about keeping their garden lush.
Even the neighbors are looking better and enjoying life more now.
“After we installed our Gardena system, they asked us how we were able to enjoy life so much,” beams H-P. “Once they found out, they all bought the same system.”
Ines also recommends Gardena to her clients. She always suggests an automatic watering system from Gardena teamed with the robotic lawn mower when planning the landscaping.
“It’s extremely important for me to recommend products that are beautifully designed and work well. I wouldn’t endorse anything that I wouldn’t want to look at myself,” she gushes.
So it is true. With a Gardena watering system, you can look as good as your garden.
Hortensia, roses and bamboo shoots flourish in an emerald garden in Ulm, Germany. They are not alone. Their passionate owners, Ines Ewinger and Hans-Peter (H-P) Rehn, are equally radiant. Their secret: An automated watering system from Gardena. “We both work full time. Our garden is luscious thanks to Gardena,” they say.
WORKING OUT WITH A GARDENA WATERING SYSTEM
Annual Report 2014 Husqvarna Group 22

Gardena Division
The photo is not an illustration of the case presented on the previous page.
Annual Report 2014 Husqvarna Group 23

Brands Product range End-customers Distribution channels Main competitors
• Ride-on lawn mowers: mainly garden tractors and zero-turn mowers
• Walk-behind lawn mowers, snow throwers and tillers
• Handheld products, both petrol-powered and electric, such as chainsaws, trimmers, hedge trimmers and leaf blowers
• Accessories and spare parts
Mass market consumers
Retail-centric,multi-channel
• Modern Tool and Die Company (MTD)
• Global Garden Products (GGP)
• TTI• Private labels
Consumer Brands
The Consumer Brands Division possesses a broad and strong product offering, a portfolio of well-recognized brands and long-standing retail relationships. Being part of Husqvarna Group gives competitive advantages and additional key strengths such as access to industry- leading technology, innovation and scale. By leveraging on a renewed focus on its key strengths the Division has the opportunity to turn around the financial performance.
Opportunities to leverage a turnaround
Share of Group net sales
Net sales 2014
SEK 9.8 bnNorth America
80%EMEA
19%Rest of the world
1%
Private labels
• Recognized brands and strong product portfolio
• Mass consumer
• Retail-centric, multi-channel
30%
Annual Report 2014 Husqvarna Group 24

Consumer Brands Division
The Division will utilize the ability to
leverage on technology flow and innovation from other parts of the Group, which will give it an advantage over many competitors.
will give it an advantage over many competitors. This will allow the Division to benefit from new features and technology in the product offering to keep brands relevant and exciting. The Division also has an opportunity to leverage on and provide scale in the Group. It also aims to protect premium and professional focus in other areas of the Group by providing compelling alternatives in the mass distribution retail channel without unnecessary overlap.
Profitability firstThe Division will improve profitability in several steps. In the first step, the priority is to deliver on the initiatives of the Accelerated Improvement Program, where actions focus on reducing overall costs across the Division, as well as optimizing manufacturing, warehouse practices, distribution methods and service levels. Complexity reduc-tion continues to be a priority and inefficiencies resulting from complexity will be eliminated. Maintaining critical flexibility, which is important due to strong industry seasonality, in the supply chain to ensure timely customer service will be a key consideration.
Consumer Brands targets the broad mass consumer segments in the forest and garden
areas. The Division incorporates the main brands McCulloch, Poulan Pro, Weed Eater and Flymo, as well as private labels. It also includes sales to U.S. retail channel customers under the Husqvarna brand. Net sales in 2014 totaled SEK 9.8bn, representing 30 percent of total Group sales. The corresponding operating margin amounted to –1.6 percent.
North America, retail channel and wheeled products dominateNorth America represents almost 80 percent of sales, Europe approximately 20 percent and the remaining fraction comes from other markets. Products are sold mainly through retail chan-nel trade partners such as Lowe’s and Walmart in the U.S. and Castorama and B&Q in Europe. The majority of sales are petrol-powered ride-on lawn mowers and walk-behind lawn mowers or petrol and electric handheld products including chainsaws, trimmers and leaf blowers.
The estimated addressable market opportunity amounts to approximately SEK 65bn, of which around 60 percent in North America, 30 percent in Europe and about 10 percent in the rest of the world. Market demand has correlated historically with housing market activity, employment levels and consumer confidence and purchasing power.
The retail channel is the main distribution channel for mass consumer products. The retail landscape is highly consolidated in North America. Competition in the mass consumer seg-ment is fierce, with a strong emphasis on price.
Leveraging on Group innovation and scaleConsumer Brands has an important role in Husqvarna Group. The Division will utilize the ability to leverage on technology flow and innovation from other parts of the Group, which
PRIORITIES• Deliver according to the Accelerated
Improvement Program
• Drive cost excellence
• Focus on retail-relevant products, services and brands
• Target mass opportunities globally
• Instill new divisional attitude: Simple, Lean and Nimble
Annual Report 2014 Husqvarna Group 25

Consumer Brands Division
EVERY DAY IS FRIDAY WITH MCCULLOCH
T hey each give a powerful impression thanks to a bold, black and muscular design. Hints of yellow
suggest bursts of energy. Matching protective gear and accessories hang on the wall, ready to go. Henrik is serious about his yard. And his tools are McCulloch.
Design and brand continuity are important to Henrik when buying tools. He works in advertising as an account manager and demands the right look and feel to reflect his intent to work outdoors quickly and efficiently. Robust tools that appear as powerful as they are.
“It’s quite simple. McCulloch makes cool, powerful products that get the job done,” he says.
Looks and performance, however, aren’t the only things that are important to Henrik. Value for money is as important, if not more so.
“My McCulloch tools don’t just look good. They’re also competitively priced and robust,” he says.
Clever features like adjustable handles, cruise control and anti-vibration systems add value to an already great product for Henrik. And the ergonomic design keeps his shoulders and back in shape, too.
Best of all, Henrik saves time using McCulloch products. “Now the work goes faster and I can trim my hedges
much easier,” he explains. “And my blower vac makes cleaning up leaves and cuttings a breeze.”
In the eyes of his family, Henrik is a true hero. Thanks to his McCulloch products, he has the time to set up a home theater. Or just build things with Lego. So with McCulloch, every day can be like Friday.
In Henrik Melkner’s shed in Jönköping, Sweden, you’ll see that his hedge trimmer, trimmer, chainsaw, leaf blower, lawn mower and the tractor he sometimes borrows have a lot in common.
Annual Report 2014 Husqvarna Group 26

Consumer Brands Division
The photo is not an illustration of the case presented on the previous page.
Annual Report 2014 Husqvarna Group 27

Brands Product range End-customers Distribution channels Main competitors
• Power cutters• Floor, tile and masonry saws, wall-
and wire saws• Drill motors with stands• Floor grinding machines• Demolition robots• Diamond tools for construction and
stone industries
• Construction industry: infra-structure projects such as road and bridge construc-tion, renovation and construction of commer-cial residential properties
• Stone industry
• Direct sales to professional end-customers: sawing, floor grinding and demolition contractors
• Rental companies that rent equip-ment to building companies and contractors
• Construction dealers and stone processing industry
• Hilti• STIHL Group• Tyrolit• Ehwa and Shinhan
Construction
Construction is a world leader in machinery and diamond tools for the construction and stone industries. The foundation is built on product and technology leadership ensured by high investment levels in user-focused product development to offer professional end-customers the most efficient and powerful products. Products and services are distributed globally in all relevant sales channels.
Strong foundation for continued profitable growth
Net sales 2014
SEK 3.3 bnNorth America
43%EMEA
38%Rest of the world
19%
• Market-leading brand and product portfolio
• Contruction and stone industries
• Direct/rental/ dealer
Share of Group net sales
10%
Annual Report 2014 Husqvarna Group 28

Construction Division
of the production that is the most exposed to competition has been transferred to China.
High investment level is keyOperations are founded on offering access to a global service network, distribution through dealers and rental companies as well as direct sales to construction contractors and a high level of investments to maintain the widest, most in-novative and powerful range of products in the market.
New product launches continued to perform well in the market. Key launches in 2014 included the PRIME range of light and powerful electric equipment for handheld cutting, drilling and wall sawing. The range includes power cutters, wall saws and drill motors that provide customers with increased power, productivity and usability.
Continued profitable growthSales grew for the fourth year in a row. Sales in North America increased, driven by continued market recovery as well as market share gains in the U.S. Sales in Europe were also up, however with significant differences in performance between countries. In the rest of the world, the sales increase was primarily driven by strong performance in Brazil. The operating margin increased to 10.7 percent (9.2).
The Division develops, manufactures and sells mainly light construction products for cutting,
drilling, grinding, polishing and demolishing concrete, steel and other hard materials. Prod-ucts include power cutters, demolition robots, drilling equipment, wall and wire saws, floor and tile saws, floor grinding equipment and all related diamond tools. The Division also develops, manufactures and sells a full range of diamond tools for the natural stone cutting market.
The largest product categories for the industry include power cutters, diamond wire, floor saws and drill systems. The products are primarily used in the renovation and construction of commercial properties, in infrastructure projects such as high-ways and bridges and in the stone industry.
Products are used exclusively by professionals who demand high-level performance, reliability and superior levels of technical service. Satisfying these demands is crucial for success.
Strong global market positionsThe global market for the product range for the construction and stone industries is valued at approximately SEK 20bn. The market is fragmented, with many small, local competitors and a few global suppliers.
The Group’s combined global market share in relevant product categories is about 15 percent, with leading positions in several product categories. Positions are strongest in power cutters as well as floor, wall and wire sawing.
Successful restructuring journeyThe Division has completed significant restructuring of its operations since the deep market downturn in 2009. The brand portfolio has been consolidated to mainly one brand, com-plexity in the product offering has been reduced, acquisitions have been fully integrated and some
Products are used exclusively
by professionals who demand high-level performance, reliability and superior levels of technical service. Satisfying these demands is crucial for success.
PRIORITIES• Grow emerging market presence
• Expand sales force and expertise in mature markets
• Capture growth in stone multi-wire market
• Continued focus on Operational Excellence
• Maintain high R&D investment levels
Annual Report 2014 Husqvarna Group 29

Construction Division
HUSQVARNA HiPERFLOOR® SHEDS LIGHT ON PORTLAND’S ARTHOUSE
New student housing was needed at the Pacific North-west College of Art (PNCA) in Portland, Oregon.
Daylight was the central architectural feature designers wanted to capture to awaken creativity, supply comfort and stoke interest in a sustainable, low-energy-use facility. Out of the embers of this inspiration arose ArtHouse and Portland’s downtown Pearl District was reborn.
Husqvarna HiPERFLOOR, one of the world’s greenest, cleanest, most durable floors, was specifically selected to satisfy green building requirements. The diamond-polished concrete was used to reflect daylight from windows to reduce electricity use in the facility.
The HiPERFLOOR concrete finish process transforms new or existing concrete into an extremely wear-resistant floor. It uses low VOC chemicals that react with natural calcium in the slab to create crystals that harden the floor and reflect light. The surface is then polished using Husqvarna’s pat-ented Dual-Drive Technology™. The result: a brilliant finish!
The floor retains the original thermal mass needed to create a comfortable environment. At ArtHouse, thanks to HiPERFLOOR’s light-reflecting qualities, traditional heating and cooling systems were not required, drastically reducing the building’s energy needs.
Even the stone was chosen with sustainability in mind and locally sourced in Portland.
“One of the things I love about these types of floors is that they use aggregate from the surrounding areas,” says architect Thomas Robinson.
The building has received LEED® Silver certification. LEED (Leadership in Energy & Environmental Design) is a globally recognized certification that verifies best-in-class building practices. For ArtHouse, Husqvarna’s glossy concrete floors were an important part in achieving this milestone.
ArtHouse, however, isn’t just about green solutions. The structure operates as art on three different scales – from the building as art to spaces that showcase art and places to make art. And it has added luster to the Pearl District, illustrating that sustainable design can also be dazzling.
Architect Thomas Robinson: Husqvarna’s HiPERFLOOR® provides “a really beautiful finish that pulls the entire ground floor together in a way that wouldn’t be possible with any other type of material.”
Annual Report 2014 Husqvarna Group 30

Construction Division
The photo is not an illustration of the case presented on the previous page.
Annual Report 2014 Husqvarna Group 31

Sustainable and Responsible Business
HIGHLIGHTS 2014• Husqvarna’s handheld battery range includes trimmers, hedge
trimmers and chainsaws. These products are free from direct emissions, have low vibration levels and are ergonomic and quiet.
• Husqvarna Fleet Services™ is a solution where sensors are used on outdoor power products and on the operators themselves, giving the landscaping businesses and their teams improved control of up-time, machine handling and vibration reports, thus creating safer, more sustainable and productive operations. During 2014, a beta version of the solution was launched in seven countries.
• Gardena’s new garden hoses are free from phthalates.
• New Gardena watering computers make efficient watering even easier.
• Husqvarna flat saws were the first in the world to comply with both European and U.S. legislation regarding emission regulations. These saws were also developed with a clear focus on improved ergonomics.
• A new product range of light and powerful electric equipment for handheld cutting, drilling and wall sawing was launched by Husqvarna. These high-frequency construction products have low vibration levels and replace hydraulic products.
Focus on health and safety• A new injury rate KPI for safety was implemented to establish a
baseline for less severe/more frequent injuries to increase focus on corrective actions.
Sustainability is high on the agenda
Closer to our suppliers• Husqvarna Group has established closer cooperation with its top
150 suppliers. The program, called EXCITE, aims at excellence through common initiatives and teamwork.
• Environmental, health and safety (EHS) training was conducted for selected suppliers in China.
Husqvarna Group participates in the UN Global Compact’s initiative and supports the ten principles in the areas of human rights, labor, the environment and anti-corruption. These principles are closely aligned with the Group’s way of doing business.
The Group is ranked on the 2014 Global 100 list of the world’s most sustainable companies.
The Group is listed in the FTSE4Good Index, which brings together world-leading companies in terms of environmental, social and governance practices.
Member 2014/2015
The Group is part of the STOXX® Global ESG Leaders indexes.
At Husqvarna Group we believe that innovative products and profitable growth can go hand- in-hand with respecting nature and caring for people.
Annual Report 2014 Husqvarna Group 32

Sustainable and Responsible Business
Long-term goals Objectives 2013–2015 Achievements 2014
Develop environmentally sound products
Develop and implement a roadmap for phasing out hazardous chemicals and substances in products and processes.
• Efforts to phase out hazardous chemicals are a priority. Surveys were sent to suppliers to collect information about chemical content in delivered components. Achievements have been made, e.g. phasing out DEHP, but work remains.
Implement and apply the concept of environmental design in the product creation process.
• Improvements are continually beeing made to reduce products’ environmental impact. Progress has been made, but work remains.
More efficient use of energy and input materials
Reduce energy consumption by 10 percent per produced equivalent unit and/or added value at production facilities.
• Reduction of 3.4 percent, thanks to energy conservation initiatives.
Reduce carbon dioxide emissions per tonnes kilometer from transportation of goods.
• Increased by 11 percent due to larger shipments over longer distances.
Implement and maintain ISO 14001 on production facilities with more than 100 employees. The goal is 100 percent, baseline 2012: 88 percent.
• 92 percent of production facilities with more than 100 employees were certified.
Select suppliers that operate in a responsible manner
Implement a unified program for risk mapping, supplier evaluation and supplier selection based on Husqvarna Group’s Code of Conduct.
• Supplier Code of Business Ethics updated• 10 supplier sustainability audits conducted in China• Training in Environmental, Health and Safety for selected
suppliers in China
Reduce workplace accidents to zero
Reduce the number of accidents (measured in lost days) per million hours worked. Baseline 2012: 5.1.
• Improved to 3.8 (4.5).
Implement a unified health and safety management system within the Group.
• Implemented at all production facilities and most supporting operations.
Contribute to the professional development of each employee
80 percent of employees should undergo a performance review. Baseline 2012: 67 percent.
• Increased to 69 percent (64).
Employee Satisfaction Index target 85, as measured in the annual employee survey. Baseline 2012: 82.
• Increased to 84 (79).
Ensure employee adherence to the Code of Conduct
100 percent of managers in tier 1–3 to attend web-based training in Husqvarna Group’s Code of Conduct, with additional key roles, for instance within purchasing and sales, covered in tier 4 and below.
• Web-based training rolled out to 100% of managers in tier 1-4, with 82% of these having completed the training in 2014.
Code of Conduct included in the induction program for all new employees.
• Included in induction programs.
Contribute to the develop-ment of communities
Two community engagement projects per year at pro-duction facilities with more than 100 employees.
• A Group-wide cooperation with UNHCR was established. Some 500 chainsaws were donated to people in the Philippines to help them clear the ground and build houses after the typhoon in 2013.
• Several local community engagement projects started.
Information on community engagement projects and contributions to be gathered at Group level.
• Data and stories from biggest sites collected and shared.
OBJECTIVES AND ACHIEVEMENTSThe management of Husqvarna Group has identified both long- and short-term objectives to measure progress towards becoming a more sustainable company. New objectives will be developed during 2015.
Annual Report 2014 Husqvarna Group 33

➊ Product developmentErgonomics, ease-of-use, energy efficiency and high quality are important features when designing products. Product improvements are continually made to reduce our products’ environmental footprint.
➍ LogisticsCarbon emissions from transpor-tation (air, ocean and outbound truck) have been tracked for a number of years.
➌ ManufacturingManufacturing is located close to end-customers mainly in North America and in Europe but also in Asia. Each production facility works on continually improving its environ-mental performance, for example, by reducing water and energy consumption through modernizing heating, ventilation and air conditio-ning systems and changing to high-efficiency compressed air systems, as well as installing lighting systems with motion sensors.
To improve skills and expertise in the environmental management system ISO 14001, a training course for environmental managers was carried out in the U.S.
➐ RecyclingAgreements with external parties regarding producer responsibility and recycling have been developed further.
➎ SalesHusqvarna Group is increasing its efforts to sell more battery products, such as robotic mowers and battery-powered chainsaws, hedge trimmers and trimmers.
These products have a considerably lower carbon dioxide impact compared to petrol- powered products.
➋ SourcingClose connections have been established with the 150 largest suppliers covering about 65 percent of the Group’s purchasing spend.
The Supplier Code of Business Ethics has been updated. It clarifies what Husqvarna Group expects from suppliers in relation to fairness in business relations, human rights and workplace practice, the environment, health and safety and fire prevention.
➏ UseThe largest part of a product’s environmental impact is determined at the design stage. Approximately 70 percent of the carbon dioxide impact of a petrol-powered product is estimated to come from when the product is being used.
CONTINUOUS IMPROVEMENTS ON ENVIRONMENTAL ASPECTS
Husqvarna Group strives to improve the environmental impact of its products and processes in every phase of the product life cycle, from raw material sourcing, manufacturing and distribution to use-of- products and recycling of materials and disposal.
Sustainable and Responsible Business
1
2
3
4
5
6
7
Annual Report 2014 Husqvarna Group 34

à ShareholdersShareholders provide funds to finance the asset base used to create economic value and currently some 64 percent (72) of the capital is held by Swedish shareholders, mainly institutions and pension funds.
à SuppliersTogether with its main suppliers, the Group started a program called EXCITE that aims at excel-lence through common initiatives and teamwork. Quality, cost effi-ciency, supply chain flexibility and innovation have been key topics. Husqvarna Group was awarded the 2014 Procurement Award from the global procurement associa-tion, the Procurement Leaders for this program which was named the best supply chain initiative.
As part of the program, a two-day supplier conference was held in Charlotte, U.S., with 116 of the largest suppliers attending.
Suppliers, dealers, subcon-tractors, consultants and other business partners are required to adopt and follow the principles outlined in the Supplier Code of Business Ethics and the Restricted Materials List.
à SocietyThe Group contributes to economic development within the regions it operates by paying wages to people who benefit from employment and by contributing to pension funds and social security plans. It also contributes to society by paying taxes, social security costs, etc.
Husqvarna Group has a long tradition of community engage-ment on the local level. Support is offered in the form of products, time or money.
During 2014, a Group-wide initiative was run to donate 500 chainsaws to UNHCR to help people in the Philippines clear the ground and rebuild their homes after typhoon Haiyan.
Sustainable and Responsible Business
OUR STAKEHOLDERS IN FOCUS
à EmployeesThe Group has employees in more than 40 countries. The average number of employees was 14,337 (14,156). Seasonal variations affect the number of temporary employees in production facilities by slightly more than 20 percent.
Employment terms and wages shall be fair and reasonable, and the Group shall comply with applicable laws and industry standards on working hours.
All employees are free to join, form or refrain from joining unions or similar organizations as well as to bargain collectively or individually.
Health and safety The Group’s structured approach to health and safety continued with global health and safety standards, global follow-up and reporting as well as the implementation of a new injury rate KPI for safety to establish a baseline for less severe/more frequent injuries to increase focus on corrective actions.
Employee development The professional development needs of employees are identi-fied through a variety of talent management processes such as
annual performance planning and review and talent review and succession planning. Together with their managers, employees prioritize and plan their profes-sional development activities.
Employees in production facilities are offered training and workshops on a regular basis covering a variety of topics related to lean manufacturing.
The Group’s management development program is being revised to include two new programs piloted in 2014; a Practical Leader program that provides managers entering a people- management role or those wishing to refresh their skills and gain a more solid platform for their leadership, and a Global Leader program that targets middle managers in or preparing for senior roles in an international context.
Employee SurveyAs many as 90 percent (89) of Husqvarna Group’s employ-ees participated in the annual employee survey. The survey is used as a tool to support teams in their continual work to develop their strengths further, improve working climate and discuss issues openly. On an aggregated Group level, the results show:
• Significant increase in knowledge about and belief in the Group strategy. The perception of how the Group is managed also improved.
• All questions related to communication improved, especially timely information from managers.
• Working climate improved.
Performance reviews 69 percent (64) of employees underwent a performance review. It covers the previous year’s performance, defines new objectives and creates an action plan for an employee’s development. Performance Reviews correlate with higher satisfaction levels as measured in the employee survey follow-up.
RecruitingWe want to continue to be a world leader – and we know that our future growth is closely linked to the recruitment of well- educated and innovative people. The Group has a five-year partnership with the student organization AIESEC and more than 70 talented people have worked for the Group since the start. Currently, there are 10 AIE-SEC interns working in Canada, China, Germany and Sweden.
The Global Trainee Program was launched in 2013. During 2014, an additional six trainees joined the Group to explore their opportunities during the two-year program that includes four six-month rotations.
à End-customers The Group is committed to offering products and services with a high regard for quality and safety. In 2014, the Committee on Product Safety convened 19 times, treating 17 cases related to product safety and liability. Five of these resulted in preventative rework and two in product recalls.
Annual Report 2014 Husqvarna Group 35

SUSTAINABILITY PERFORMANCE
Summary
GRI indicator1 Economic, SEKm 2014 2013 2012 2011 2010
EC1 Group net sales 32,838 30,307 30,834 30,357 32,240
EC1 Operating costs (materials and services) 24,607 22,916 22,830 22,498 23,226
EC1 Employee salaries 4,157 3,758 4,016 3,904 4,080
EC1 Social security costs and pension plans 957 917 968 1,029 1,108
EC1 Payments to state and municipality (taxes) 231 394 431 413 503
EC1 Credit institutions (interest) 325 428 500 404 394
EC1 Shareholders (dividends) 859 859 859 859 574
EC1 Total economic value 8,231 7,391 8,004 7,859 9,014
EC1 Economic value retained 1,702 1,035 1,230 1,250 2,355
GRI indicator1 Environmental 2014 2013 2012 2011 2010
Production facilities with installed environmental management systems ISO 14001, % 2
92 92 89 88 81
Serious environmental incidents, absolute number 2 3 2 1 1
EN1 Raw material3, steel, tonnes 104,613 101,081 108,100 103,139 104,561
EN1 Raw material3, plastic, tonnes 18,284 16,1334 15,3374 15,833 15,506
EN1 Raw material3, aluminum, tonnes 773 5704 6094 692 651
EN1 Raw material3, magnesium, tonnes 1,146 842 1,220 1,160 832
EN3 Direct energy use5, MWh 122,271 122,3784 124,586 145,992 128,645
EN4 Indirect energy use, MWh 246,277 259,1654 254,7054 271,889 260,808
EN3+EN4 Energy use, MWh 368,548 381,5434 379,2914 417,882 389,453
EN8 Water consumed, m3 1,318,148 1,262,0184 1,346,433 1,384,789 1,498,576
EN16 CO2 emissions, tonnes (total energy) 166,592 168,6174 170,2954 180,459 168,995
– direct energy, tonnes 40,825 38,1624 44,141 43,033 40,411
– indirect energy, tonnes 125,767 130,4554 126,1544 137,426 128,584
EN17 CO2 emissions (personal air transport), thousand tonnes 7.8 6.84 5.84 1.626 5.85
EN22 Waste, tonnes 30,131 26,9314 30,042 29,258 35,289
GRI indicator1 Social 2014 2013 2012 2011 2010
LA1 Workforce (average number of employees) 14,337 14,156 15,429 15,698 14,954
LA7 Accidents per million hours worked 3.8 4.5 5.1 11.27 –
LA7 Fatalities at production facilities, absolute number 0 0 0 0 0
LA12 Performance reviews, % 69 64 67 66 –
– white collar, % 87 85 84 82 –
– blue collar, % 54 47 53 52 –
LA13 Proportion of women, % of employees 36 36 37 35 35
LA13 Proportion of women in management positions, tier 1–3, % managers 12 15 13 11 12
LA13 Proportion of women on the Board of Directors8, % 33 389 33 33 33
1) According to GRI guidelines, www.globalreporting.org.2) Production facilities with more than 100 employees.3) Raw material used in own production.4) Adjusted due to better tracking.5) Consists almost entirely of natural gas.6) In 2011, personal air transport was not completely covered due to a change of travel agency. 7) Enhanced reporting procedures in 2012 revealed that this figure for 2011 is overstated.8) Employee representatives excluded. With employee representatives included, the figure for 2014 reaches 54%.9) As of July 2013.
1 tonnes equals to 1,000 kg. Also referred to as metric ton.
Sustainable and Responsible Business Annual Report 2014 Husqvarna Group 36

38 Report by the Board of Directors
46 Risk Management
50 Corporate Governance Report
58 Internal Control over Financial Reporting
60 Board of Directors and Auditors
62 Group Management
64 Annual General Meeting 2015
65 Financial Statements – Group
65 Income Statement
66 Comprehensive Income Statement
67 Balance Sheet
68 Cash Flow Statement
69 Statement of Changes in Equity
70 Group Notes
70 1. Accounting principles
73 2. Important accounting estimates and assessments
74 3. Segment information
76 4. Employees and employee benefits
80 5. Expenses by nature
80 6. Other operating income and operating expenses
80 7. Fees to auditors
80 8. Exchange rate gains and losses in operating income
80 9. Leasing
81 10. Financial income and expense
81 11. Tax
82 12. Earnings per share
83 13. Property, plant and equipment
84 14. Intangible assets
85 15. Other financial assets
85 16. Inventories
85 17. Other current assets
85 18. Share capital, number of shares and other reserves
86 19. Financial risk management and financial instruments
90 20. Provisions for pensions
92 21. Other provisions
92 22. Other liabilities
93 23. Pledged assets and contingent liabilities
93 24. Related party transactions
94 Financial Statements – Parent Company
94 Income Statement
94 Comprehensive Income Statement
95 Balance Sheet
96 Cash Flow Statement
97 Statement of Changes in Equity
98 Parent Company’s Notes
98 1. Accounting principles
98 2. Financial risk management
98 3. Net sales distribution
98 4. Employees and employee benefits
99 5. Expenses by nature
99 6. Other operating income and operating expenses
99 7. Fees to auditors
99 8. Exchange rate gains and losses in operating income
99 9. Income from participation in Group companies
99 10. Financial income and expense
99 11. Appropriations and untaxed reserves
100 12. Tax
101 13. Intangible assets
101 14. Property, plant and equipment
102 15. Shares in subsidiaries
102 16. Other financial assets
102 17. Inventories
103 18. Financial assets and liabilities
104 19. Other current assets
104 20. Other liabilities
104 21. Provisions for pensions
104 22. Other provisions
105 23. Pledged assets and contingent liabilities
106 The Board of Directors’ and the President and CEO’s declaration
107 Auditor’s Report
108 Five-Year Review
110 Quarterly Data
112 Restatement of business area reporting 2014
113 Definitions
114 The Share
116 Contact and Website
Content Financial Information
Content Financial Information
Annual Report 2014 Husqvarna Group 37

Report by the Board of Directors• Net sales increased to SEK 32,838m (30,307). Adjusted for changes in
exchange rates, net sales increased 6%.• Operating income for the Group, excluding impairment of goodwill,
increased by 47% to SEK 2,358m (1,608)• Operating income was charged with impairment of goodwill amounting
to SEK -767m, related to the introduction of the new organization. The impairment is disclosed as an item affecting comparability.
• Sales and operating income improved for all business areas.• The higher operating income for the Group, excluding impairment
of goodwill, was to a large extent driven by the Accelerated Improve-ment Program– Material cost reductions– Productivity improvements– More favorable product mix.
• Operating margin rose by 1.9 percentage point to 7.2 percent (5.3), excluding the impairment of goodwill.
• Income for the period increased to SEK 1,598m (916) excluding the impair-ment of goodwill, and SEK 831m including the impairment of goodwill.
• Earnings per share amounted to SEK 1.44 per share (1.60).• Earnings per share, excluding impairment of goodwill, increased 74%
to SEK 2.78 per share (1.60).• Operating cash flow amounted to SEK 868m (1,813).• The net debt/equity ratio amounted to 0.59 (0.58).• A new brand-driven organization was fully implemented by
January 1, 2015.• The Board of Directors proposes a dividend of SEK 1.65 per share
(1.50) for 2014, divided into two payments, SEK 0.55 in April, 2015 and SEK 1.10 to be paid in October, 2015.
Key figures
SEKm 2014 2013 20121 2011 2010
Net sales 32,838 30,307 30,834 30,357 32,240
Gross margin, % 28.5 26.5 26.9 27.7 28.5
EBITDA 3,325 2,586 2,737 2,671 3,666
EBITDA margin, % 10.1 8.5 8.9 8.8 11.4
Operating income 1,591 1,608 1,675 1,551 2,445
Operating income, excl. items affecting comparability2 2,358 1,608 1,931 1,615 2,652
Operating margin, % 4.8 5.3 5.4 5.1 7.6
Operating margin, excl. items affecting comparability, %2 7.2 5.3 6.3 5.3 8.2
Income after financial items 1,266 1,180 1,175 1,147 2,051
Income for the period 831 916 1,027 997 1,749
Earnings per share after dilution, SEK 1.44 1.60 1.78 1.73 3.03
Dividend per share, SEK3 1.65 1.50 1.50 1.50 1.50
Return on capital employed, % 7.6 7.7 7.4 7.4 11.0
Return on equity, % 6.7 8.1 8.8 8.0 13.9
Net debt/equity ratio 0.59 0.58 0.75 0.56 0.46
Operating cash flow 868 1,813 1,144 –472 962
Average number of employees 14,337 14,156 15,429 15,698 14,954
1) 2012 has been restated due to the amendment of IAS 19. 2010–2011 are not restated.2) Items affecting comparability are provided on page 39.3) 2014 as proposed by the Board of Directors.
14
12
10
8
6
4
2
0
%SEKm
Net sales and operating margin
0
5,000
10,000
15,000
20,000
25,000
30,000
35,000
40,000
0
2
4
6
8
10
12
14
130906 07 14100805 11 12
n Net sales, SEKm Operating margin, excluding items affecting comparability, %
Report by the Board of Directors
Annual Report 2014 Husqvarna Group 38

Report by the Board of Directors
Net sales and incomeNet salesNet sales for 2014 increased 8% to SEK 32,838m (30,307). Adjusted for exchange rate effects, net sales for the Group increased 6%, by 5% for Europe & Asia/Pacific, by 7% for Americas and by 8% for Construction.
Operating incomeOperating income for 2014 amounted to SEK 1,591m (1,608). Excluding impairment of goodwill amounting to SEK –767m, operating income rose by 47% to SEK 2,358m (1,608) and the corresponding operating margin increased to 7.2% (5.3). Operating income and margin was higher for all business areas.
Changes in exchange rates had a total negative impact on operating income of SEK –142m compared to 2013.
Excluding the impairment of goodwill and impact from changes in exchange rates, the increased operating income was mainly a result of higher sales volume, reduced material costs, improved productivity and favorable price/mix.
Financial items netFinancial items net amounted to SEK –325m (–428), of which net interest amounted to SEK –340m (–379).
Income after financial itemsIncome after financial items amounted to SEK 1,266m (1,180) cor-responding to a margin of 3.9% (3.9). Income after financial items, ex-cluding the impairment of goodwill, increased to SEK 2,033m (1,180).
TaxesTax amounted to SEK –435m (–264), corresponding to a tax rate of 34% (22) of income after financial items. The higher tax rate is mainly explained by the goodwill impairment charge which is not tax deductible.
Earnings per shareIncome for the period, excluding non-controlling interests, amounted to SEK 827m (914), corresponding to SEK 1.44 (1.60) per share. Excluding the impairment of goodwill, income for the period increased to SEK 1,598m (916) and earnings per share increased to SEK 2.78 (1.60).
Net sales by country
2014 Share of Group net sales, %
U.S. 39.0
Germany 9.5
France 5.3
Canada 4.4
Sweden 3.7
U.K. 3.3
Russia 2.8
Australia 2.3
Austria 2.3
Japan 2.1
Items affecting comparability
SEKm 2014 2013 2012
Impairment of goodwill –767 – –
Costs for personnel cut-backs – – –256
Total –767 – –256
0
3,000
6,000
9,000
12,000
SEKm
Net sales by quarter
Q1 Q2 Q3 Q4
n 2012 n 2013 n 2014
-500
0
500
1,000
1,500
SEKm
Operating income by quarter1
Q1 Q2 Q3 Q4
n 2012 n 2013 n 2014
1) Excluding items affecting comparability.
1) Excluding items affecting comparability.
Return on equity, %
0
1
2
3
4
0
4
8
12
16
0
1
2
4
3
Earnings per share and return on equity1
10 11 12 13 14
16
12
8
4
0
%SEK
n Earnings per share, SEK
Annual Report 2014 Husqvarna Group 39

Impairment of goodwillThe values of intangible assets with indefinite lifetime are tested for impairment annually, or more frequently if necessary. An impairment loss is recognized with the amount by which the assets net carrying amount exceeds its recoverable amount. The recoverable amount of a cash generating unit is determined based on estimates of value in use. Value in use is measured as expected future discounted cash flows before tax.
As previously announced, Husqvarna Group established a new brand-driven organization for its forest and garden operations, which was fully effective as of January 1, 2015. The cash generating units from this date are the new divisions; Husqvarna, Gardena, Consumer Brands and Construction, which is why the impairment test has been performed on this basis.
In previous years, the impairment test has been performed on the former geographical segments (Europe & Asia/Pacific and Americas) and Construction, with the conclusion that the recoverable amount exceeded the carrying amount of the net assets.
The impairment test shows that the Gardena Division cannot defend the carrying amount of its net assets. The impairment of goodwill amount to SEK –767m which has been charged to the Group’s result for the fourth quarter 2014. The impairment of good-will has been disclosed as an item affecting comparability.
For more information concerning intangible assets, see Note 14.
Cash flowOperating cash flow amounted to SEK 868m (1,813). Cash flow from operations, excluding changes in operating assets and liabilities, increased due to the higher result. Cash flow from changes in oper-ating assets and liabilities decreased, mainly as a result of substan-tial inventory reductions in the previous year. The increase in capital expenditure was mainly related to the new manufacturing facility for chainsaw chains in Huskvarna, Sweden.
SEKm 2014 2013
Cash flow from operations, excluding changes in operating assets and liabilities 2,061 1,776
Changes in operating assets and liabilities 193 1,116
Cash flow from operations 2,254 2,892
Cash flow from investments, excluding acquisitions and divestments –1,386 –1,079
Operating cash flow 868 1,813
Capital expenditure and Research & DevelopmentCapital expenditure in 2014 increased to SEK 1,386m (1,078), corresponding to 4.2% (3.6) of net sales. Investments in property, plant and equipment amounted to SEK 1,131m (796) and investments in intangible assets amounted to SEK 255m (282), of which SEK 168m (190) referred to R&D and SEK 86m (90) referred to IT and software.
Approximately 33% of capital expenditure in 2014 referred to new products, approximately 26% to rationalization and replacement of production equipment, approximately 8% to expansion of capacity, and approximately 7% to IT-systems.
R&D costs amounted to SEK 1,090m (955), of which SEK 198m (194) was amortization of capitalized product development (intangible assets). The total R&D costs thus corresponded to 3.3% (3.2) of net sales.
Financial positionOperating working capitalOperating working capital at year-end amounted to SEK 7,698m (7,065). Inventories increased to SEK 7,954m (7,087), trade receivables amounted to SEK 2,898m (2,816) and trade payables were SEK 3,154m (2,838).
SEKm
Operating working capital, December 31, 2013 7,065
Changes in exchange rates 757
Changes in working capital –124
Operating working capital, December 31, 2014 7,698
EquityGroup equity as of December 31, 2014, excluding non-controlling interests, amounted to SEK 12,150m (11,372), corresponding to SEK 21.2 (19.9) per share. Equity was impacted by SEK –767m due to the impairment of goodwill.
Net debtNet debt increased to SEK 7,234m (6,659) as of December 31, 2014, of which liquid funds amounted to SEK 2,105m (1,884) and interest-bearing debt amounted to SEK 7,504m (7,290), excluding pensions. The major currencies used for debt financing are SEK and USD. Net debt (excluding provisions for pensions) decreased by SEK 45m during the year as a result of changes in exchange rates.
Report by the Board of Directors
Operating cash flow/net sales, %
–1,000
0
1,000
2,000
3,000
-3
0
3
6
9
Operating cash flow
10 11 12 13 14
9
6
3
0
–3
%SEKm
n Operating cash flow, SEKm
0
300
600
900
1,200
1,500
0
2
4
6
8
10
Capital expenditure/net sales, %
Capital expenditure
10 11 12 13 14
10
8
6
4
2
0
%SEKm
n Capital expenditure, SEKm
Annual Report 2014 Husqvarna Group 40

The net debt/equity ratio amounted to 0.59 (0.58) and equity/assets ratio was 41.5% (42.6).
On December 31, 2014, non-current borrowings including financial leases amounted to SEK 5,598m (6,408) and current borrowings including financial leases to SEK 1,154m (643). Non-current borrowings consist of SEK 3,493m (4,943) in issued bonds, and bank loans and financial leases of SEK 2,105m (1,465). The major part of the bonds and bank loans mature in 2016–2018. Defined benefit obligations in key markets have increased as a consequence of falling interest rates.
The Group also has an unutilized SEK 5bn syndicated revolving credit facility, with maturity in 2019, with an option for an additional 1+1 year.
SEKm 2014 2013
Interest-bearing liabilities 7,504 7,290
Provisions for pensions and other post-employment benefits 1,835 1,253
Less: Liquid funds –2,105 –1,884
Net debt 7,234 6,659
Net debt/equity ratio 0,59 0.58
Equity/assets ratio, % 41.5 42.6
For more information about the Group’s funding, see Note 19.
Seasonality and weather impactThe majority of Group sales consists of park and garden products, which show a distinct seasonality in terms of sales and income. The first half of the year normally accounts for around two thirds of annual Group sales, with the second quarter usually being the strongest. Forestry products normally show stronger demand and higher sales during the second half of the year, while products for the construction industry normally show a more even distribution of sales throughout the year.
Demand for the Group’s products is dependent on weather conditions. Dry weather tends to reduce demand for lawn mowers and tractors, but to increase demand for watering products. Demand for chainsaws normally increases after storms.
Performance by business areaNew organization and segment reporting as of Q1 2015As announced on June 13, 2014, Husqvarna Group implemented a new brand-driven organization, fully effective as of January 1, 2015. The organization includes three global brand divisions for the forest and garden operations; Husqvarna, Gardena and Consumer Brands, and the Construction division which is not affected by the reorganization. As a consequence, the Group’s external business area reporting will be changed accordingly. As of the first quarter 2015, the segment reporting will comprise the above mentioned four divisions. 2014 restated into the new segment reporting is provided on page 112.
Europe & Asia/PacificChange, %
SEKm 2014 2013As
reported Adjusted1
Net sales 15,824 14,736 7 5
Operating income 1,904 1,488 28 26
Operating margin, % 12.0 10.1 – –
1) Adjusted for currency translation effects and items affecting comparability. Sales and operating income for 2013 have been restated between Europe & Asia/Pacific and Americas. See Note 3.
Net sales in 2014 for Europe & Asia/Pacific increased 7%. Adjusted for exchange rate effects, the increase was 5%.
Market demand in the first half of the year was positively impacted by a strong start to the season as a result of a warm and early spring in Europe. Electric products, including robotic lawn mowers, accessories and watering products had the best development during the year. In terms of channels, sales to the dealer channel had the highest growth.
Operating income increased by 28% to SEK 1,904m (1,488). Increased sales volume, favorable product price/mix driven by good growth of Husqvarna branded products, including robotic lawn mowers, in the dealer channel, and reduced direct material costs contributed to the strong development. The operating margin increased to 12.0% (10.1).
Changes in exchange rates had a negative year-on-year impact on operating income of SEK –37m compared with 2013.
Report by the Board of Directors
Equity/assets ratio, %
Net debt/equity and equity/assets ratios
10 11 12 13 14
50
40
30
20
10
0
%Times
n Net debt/equity ratio, times
0
0.25
0.5
0.75
1.0
0
10
20
30
40
50
Maturity profile of loans
15 16 17 18 19 20–
SEKm
n Bank and other loans, SEKmn Bond loans, SEKm
0
500
1,000
1,500
2,000
2,500
0
3
6
9
12
Annual Report 2014 Husqvarna Group 41

Report by the Board of Directors
AmericasChange, %
SEKm 2014 2013As
reported Adjusted1
Net sales 13,675 12,571 9 7
Operating income 340 30 n/a n/a
Operating margin, % 2.5 0.2 – –
1) Adjusted for currency translation effects and items affecting comparability. Sales and operating income for 2013 have been restated between Europe & Asia/Pacific and Americas. See Note 3.
Net sales in 2014 for Americas increased 9%. Adjusted for exchange rate effects net sales increased 7%.
Market demand is estimated to have increased compared with the previous year. Sales increased in the U.S. and Latin America, while sales in Canada declined despite a recovery towards the end of the year. Growth was good in both of the main categories hand-held products and wheeled products. By channel, dealer channel sales had the best improvement, growing at double digit pace.
Operating income recovered significantly and increased to SEK 340m (30), and the corresponding margin rose to 2.5% (0.2), mainly attributable to reduced direct material costs, the higher sales volume and improved productivity.
Changes in exchange rates had a negative year-on-year impact on operating income of SEK –86m compared with 2013.
ConstructionChange, %
SEKm 2014 2013As
reported Adjusted1
Net sales 3,339 3,000 11 8
Operating income 356 277 28 24
Operating margin, % 10.7 9.2 – –
1) Adjusted for items affecting comparability and changes in exchange rates.
Net sales in 2014 for Construction increased 11%. Adjusted for exchange rate effects net sales increased 8%.
Sales growth in North America continued to be strong as a result of market share gains and favorable market demand. Sales in Europe were also higher, despite a downturn in France. Sales in the rest of the world developed positively, in particular driven by good development in Brazil and Australia.
Operating income rose to SEK 356m (277) and the corresponding margin improved to 10.7% (9.2), primarily as a result of the higher sales volume and favorable mix.
Changes in exchange rates had a negative year-on-year effect of SEK –20m compared with 2013.
Organizational changesNew organizationA new organization for the Group’s forest and garden operations was announced in June and was fully implemented as of January 1, 2015. The Construction Division is not affected by the reorganiza-tion. The forest and garden operations will be organized in three global brand divisions representing three different business models; • Husqvarna (including Zenoah), which are dealer channel centric
brands that enjoy strong recognition across many different forest and garden product segments, primarily for professionals and prosumers. Net sales for the Division in 2014 represented 47% of Group net sales.
• Gardena, which is a highly appreciated retail centric brand with strong recognition in the consumer watering segment. Net sales for the Division in 2014 represented 13% of Group net sales.
• Consumer Brands. The Division includes brands such as McCulloch, Poulan Pro and Flymo. Net sales for the Division in 2014 represented 30% of Group net sales.
The divisions will have global profit & loss, cash flow and balance sheet responsibility. Most operational activities will primarily be organized within the divisions. To secure synergies and strategic alignment, the strategic functions Group Operations, Technology Office, Brand & Marketing, Business Development and the Program Office – Accelerated Improvement Program have also been established.
AMERICAS
Net sales
n Net sales, SEKm
10 1011 1112 1213 1314 14
Operating income and margin
n Operating income1, SEKm--- Operating margin1, %1) Excluding items affecting comparability.
0
5,000
10,000
15,000
20,000
-800
-400
0
400
800
-8
-4
0
4
8
SEKm SEKm
EUROPE & ASIA/PACIFIC
Net sales
n Net sales, SEKm
10 1011 1112 1213 1314 14
Operating income and margin
n Operating income1, SEKm--- Operating margin1, %1) Excluding items affecting comparability.
0
5,000
10,000
15,000
20,000
0
500
1,000
1,500
2,000
2,500
3,000
0
20
15
10
5
SEKm SEKm % %
Annual Report 2014 Husqvarna Group 42

Report by the Board of Directors
New reporting structureIn the Group’s external financial reporting, the segment reporting will comprise four divisions; the three forest and garden divisions Husqvarna, Gardena and Consumer Brands, and the Construction Division, as of January 1, 2015.
Historical restated financial figures for 2014 according to the new structure are provided on page 112.
Changes in Group ManagementFollowing the introduction of the new organization as of January 1, 2015, Group Management will comprise:
Kai Wärn, President and CEO; Ulf Liljedahl, CFO, Head of Group Staff Finance, IT and Investor
Relations (until February, 2015);Pavel Hajman, President of Husqvarna Division (joined the Group
June 1, 2014); Sascha Menges, President of Gardena Division (previously Head
of Manufacturing & Logistics);Alan Shaw, President of Consumer Brands Division (previously
Head of Americas);Anders Ströby, President of Construction Division;Per Ericson, Head of Group Staff People & Organization and
Communications;Olle Wallén, Head of Group Staff Legal Affairs;Pär Åström, Head of Business Development (previously not
included in Group Management);Valentin Dahlhaus, Head of Group Operations (previously VP
Demand and Supply Chain Management and not included in Group Management);
Henric Andersson, Head of Technology Office (previously Head of Product Management & Development);
Sofia Axelsson, Head of Brand & Marketing (previously not included in Group Management);
Francesco Franzé, Head of Program Office – Accelerated Improvement Program (previously not included in Group Management).
Frida Norrbom Sams, Head of EMEA, was included in Group Management until she left the company in November 2014.
In January 2015, Jan Ytterberg, currently Chief Financial Officer of Scania Group, was appointed Chief Financial Officer of Husqvarna Group. Jan replaces Ulf Liljedahl who left the Group for an external position as of the end of February, 2015. Jan will assume his new position April 1, 2015.
The Husqvarna shareAt year-end the share capital in Husqvarna AB amounted to SEK 1,153m (1,153), comprising 122,425,469 A-shares (126,593,868) and 453,918,309 B-shares (449,749,910).
For information on the change in number of shares during the year see Note 18.
Each A-share carries one vote, and each B-share 1/10 of a vote. All shares enjoy equal rights in terms of the company’s assets and earnings.
There are no restrictions on the transfer of shares, voting rights or the right to participate in the Annual General Meeting (“AGM”). Nor is the company party to any significant agreements which might be affected, changed or terminated if control of the company were to change as a result of a public bid for acquisition of shares in the company.
The company is not aware of any agreements between shareholders which might limit the right to transfer shares. In addition, there are no stipulations in the Articles of Association regarding appointment or dismissal of Board members or agreements between the company and Board members or employees which require remuneration if such persons leave their posts, or if employment is terminated as a result of a public bid to acquire shares in the company.
As of December 31, 2014 the largest shareholders were Investor AB, with 31.3% (30.6) of the votes, and L E Lundbergföretagen, with 23.8% (22.4) of the votes.
Market capitalization increased 49% and amounted to SEK 33bn (22) at the end of the year.
For more information on major shareholders, see page 115.
Repurchase of own sharesThe AGM 2014 authorized the Board to acquire B-shares totaling up to 3% of the total number of shares, and to pay for the shares in cash.
The shares may be purchased on Nasdaq Stockholm in order to hedge the company’s obligations pursuant to the long-term incentive programs.
The company has the right to adjust on an ongoing basis the number of shares that it holds as a hedge of the company’s obligations pursuant to the implemented incentive programs. The participants in the incentive programs shall be entitled to receive a maximum number of shares in accordance with the conditions of the programs, and transfers of shares under the pro-grams will be made without consideration.
No B-shares were repurchased during 2014. As of year-end 2014, Husqvarna owned 3,448,534 repurchased B-shares (3,657,503) corresponding to 0.60% (0.63) of the total number of outstanding shares.
Legal mattersCompanies within Husqvarna Group are involved in commercial, product liability and other disputes in the ordinary course of business. Such disputes involve claims for compensatory damages, property damage or personal injury compensation and occasionally
Net sales
n Net sales, SEKm
10 11 12 13 14
Operating income and margin
n Operating income1, SEKm--- Operating margin1, %1) Excluding items affecting comparability.
CONSTRUCTION
0
1,000
2,000
3,000
4,000
0
100
200
300
400
4
8
12
16
0
SEKm SEKm
10 11 12 13 14
%
Annual Report 2014 Husqvarna Group 43

Report by the Board of Directors
also punitive damages. Although the company is self-insured to a certain extent, it is also externally insured against excessive liability losses. The Group continuously monitors and evaluates pending claims and disputes, and takes action when deemed necessary. The company believes that these activities help to minimize the risks. It is difficult to predict the outcome of each dispute, but based on its present knowledge, Husqvarna estimates that none of the disputes, in which it is currently involved, will have a material adverse effect on the consolidated financial position or result.
Environmental activitiesIn 2014, Husqvarna Group operated 22 major production facilities, of which ten were located in Europe, six in the U.S., one in Brazil, four in China and one in Japan. All facilities have the environmental permits required for current operations.
Husqvarna Group included in CSR indexesHusqvarna Group was reconfirmed as a member of the FTSE4Good Index Series and appointed new member of the STOXX Global ESG Leaders index during 2014. The indices are designed to facilitate investments in companies that meet globally recognized corporate responsibility standards in environmental care, social care and corporate governance.
EmployeesThe average number of employees in 2014 was 14,337 (14,156), of which 1,649 (1,736) were employed in Sweden. At year-end, the total number of employees was 14,554 (15,076).
Of the total average number of employees in 2014, 9,195 (9,122) were men and 5,142 (5,034) were women.
Salaries and remuneration in 2014 amounted to SEK 4,157m (3,758), of which SEK 911m (838) refers to Sweden.
For more information on employees, see Note 4.
Annual General Meeting 2015The Annual General Meeting (“AGM”) of Husqvarna AB (publ) will be held on April 21, 2015, at the Culture Centre Spira, Kulturgatan 3 in Jönköping, Sweden.
Notification and proposals to the AGMThe notification to the AGM 2015 will be available on the Group’s website www.husqvarnagroup.com/agm as of March 18, 2015. The full proposal to the AGM will be published on the Group’s website no later than March 31, 2015.
Tom Johnstone proposed as new Chairman of the BoardHusqvarna AB’s Chairman of the Board, Lars Westerberg, has declined re-election to the Board of Husqvarna AB. The Nomination Committee has proposed Tom Johnstone as new Chairman of the Board. Tom Johnstone has served on the Board of Husqvarna AB since 2006 and was the President and CEO of SKF AB until December 31, 2014. He is also board member of Investor AB.
Proposed distribution of earningsThe Board of Directors proposes a dividend for 2014 of SEK 1.65 per share (1.50), corresponding to a total dividend payment of SEK 945m (859) based on the number of outstanding shares as per March 6, 2015.
It is also proposed that the dividend is to be paid in two payments in order to better match the Group’s cash flow profile, one payment of SEK 0.55 per share in April and the remaining SEK 1.10 per share in October.
The proposed record dates are April 23, 2015 for the first pay-ment of SEK 315m and October 23, 2015 for the second payment of SEK 630m.
SEKt
Retained earnings 16,726,380
Income for the period 779,489Total 17,505,869
The Board of Directors has proposed that the AGM 2015 resolves that the above sum be disposed of as follows:
SEKt
Dividend to the shareholders of SEK 1.65 per share.1) 945,399
To be carried forward 16,560,470Total 17,505,869
1) Calculated on the number of outstanding shares as per March 6, 2015.
The Board is of the opinion that the dividend proposed above is justifiable on both the Company and the Group level with regard to the demands on the Company and Group equity imposed by the type, scope and risks of the business and with regard to the Company’s and the Group’s financial strength, liquidity and overall position. The Company’s equity would have been SEK 6,476 thousand lower if the assets and liabilities had not been valued at fair value in accordance with the Swedish Annual Accounts Act (SFS 1995:1554), 4:14a.
Remuneration principles to the Board and senior executivesFor the CEO and other members of the Group Management, the principles for remuneration, approved by the Annual General Meeting (“AGM”) 2014, applies. The Board of Directors proposes that the corresponding principles should be approved by the AGM 2015 for the period up to and including the AGM 2016.
These principles set forth in this item shall apply to remuneration and other employment conditions of the Group Management. The principles shall apply to contracts of employment entered into after the AGM 2015 and also to amendments made thereafter to contracts of employment which are in force. Remuneration to the Group Management is determined by the Board of Directors based on proposals from the Board of Directors’ Remuneration Committee.
PrinciplesThe overall principles for remuneration to Group Management shall be based on the position held, individual performance, Group performance and remuneration shall be on a competitive basis in the country of employment. The overall remuneration package for Group Management comprises fixed salary, variable salary in the form of short-term incentives based on annual performance targets, long-term incentives, pension and other benefits. In addition, there are conditions on notice of termination and severance pay.
The Group shall aim to offer a competitive total remuneration level with a primary focus on “pay for performance”.
Annual Report 2014 Husqvarna Group 44

Report by the Board of Directors
Fixed salaryFixed salary shall comprise the basis for total remuneration. The salary shall be related to the relevant market and shall reflect the degree of responsibility involved in the position. The salary levels shall be reviewed annually in order to ensure continued competitiveness and in order to correctly reward performance.
Variable salary (Short-Term Incentive “STI”)Members of Group Management shall be entitled to STI in addition to the fixed salary. The STI shall be based on the financial result for the Group and/or for the business unit for which the member of Group Management is responsible. In addition, performance indicators can be used in order to focus on improvement areas of special interest to the company.
Clearly defined objectives for “target” and “stretch” levels of performance shall be stated in the beginning of the year and reflect the plans approved by the Board.
STI shall be dependent on the position and may amount to a maximum of 50 percent of the salary on attainment of the “target” level and a maximum of 100 percent of the salary on attainment of “stretch” level, which also is the maximum STI.
In the U.S., the STI component is normally higher and may in some cases amount to a maximum of 100 percent on attainment of the “target” level and a maximum of 150 percent of the salary on attainment of the “stretch” level.
The Board of Directors decides whether the maximum levels 50/100/150 percent shall be utilized or if a lower level shall be used.
Long-Term Incentive (”LTI”)The Board of Directors will annually evaluate if a long-term incen-tive program (e.g. share-based or share-price based) should be proposed to the AGM. At the AGM 2014, a long-term incentive program, LTI 2014, was adopted.
For more information concerning the long-term incentive program, see Note 4.
Pensions and insurancePension and disability benefits shall be designed to reflect r egula-tions and practice in the country of employment and the value of the benefits shall match normally accepted levels in the country. If possible, pension plans shall be defined-contribution plans in accordance with the Group Pension Policy.
Other benefitsOther benefits can be provided in accordance with normal practice in the country where the member of Group Management is employed. However, these benefits shall not constitute a significant part of the total remuneration.
Notice of termination and severance pay Members of Group Management shall be offered notice periods and levels of severance pay which are in line with accepted practice in the country where the member is employed. Members of Group Management shall be obliged not to compete with the company during the notice period. Based on the circumstances in each case, a non-compete obligation with continued payment may be applied also after the end of the notice period. Such non-compete obligation shall not apply for more than 24 months from the end of the notice period.
Previously determined remuneration which has not become payable The main conditions for remuneration to Group Management in the current employment agreements should be clear from Note 4.
Authority for the Board to deviate from the principlesUnder special circumstances, the Board of Directors may deviate from these guidelines. In case of such deviation, the next AGM shall be informed of the reasons.
Remuneration to the Board 2014Remuneration to AGM-elected Board members is resolved by the AGM based on proposals from the Nomination Committee. The 2014 AGM resolved on fees of SEK 5,595,000.
No consulting fees were paid to Board members. No board fees are paid to Board members who are also employed by the Group.
For more information concerning remuneration, see Note 4.
Annual Report 2014 Husqvarna Group 45

Risk ManagementAll business operations involve risk. Creating awareness of such risks enables them to be limited, controlled and managed, while integrating risk management with business opportunities.
Husqvarna Group faces operational and financial risks related to its business operations in many countries as well as financing
thereof in different currencies. The Group also has other external risks such as changes in legislation and regulations in different markets.
The President and CEO is responsible for ensuring proper risk management in accordance with the Board of Directors’ guidelines and instructions. The Presidents of the divisions (previously Heads of Business Areas) and the Group staff functions are responsible for risk management implementation. Group Staff Legal Affairs includes a global risk management function that assesses risks that are subject to insurance, and oversees the Group’s Enterprise Risk Management efforts. Management of financial risks is essentially centralized to Group Treasury.
The Internal Audit function gives assurance on the risk manage-ment process, including the Group’s Enterprise Risk Management program.
The Risk Management function is responsible for facilitating risk management practices, and periodically assesses the Group’s risks. Identification and evaluation of risks provide support for manage-ment’s strategic decision-making and associated risk mitigation. The assessment also aims at generating enhanced awareness of risks throughout the organization, including everyone from operational decision-makers to the Board of Directors.
Operational risksHusqvarna Group’s long-term profitability depends, among other things, on the ability to successfully develop, launch and market new products. Other vital factors for profitability include flexible, cost-efficient manufacturing of products while achieving the desired level of quality, and rational management of fluctuations in the prices of raw materials and components.
Product life-cycles are becoming shorter, requiring product development to become more efficient. Many of the Group’s products require long development lead times, making it essential to understand the end-customers’ need to ensure that the product will be in demand. To maintain competitiveness, the Group’s new products must satisfy or preferably surpass the expectations of its customers, both consumers and professional users. The Group must also be a leader in terms of more efficient and environmentally adapted products, in order to differentiate the Group’s offering from those of its competitors.
Weather conditionsDemand for the Group’s products is also dependent on the weather. Unexpected or unusual weather conditions in specific areas or regions can affect sales either adversely or positively. Dry weather can reduce demand for products such as lawn mowers and tractors, but can stimulate demand for watering products. Demand for chain-saws normally increases after storms and during cold winters.
Markets and competitionHusqvarna Group operates in competitive markets, most of which are relatively mature, which means that underlying demand is relatively stable under normal economic conditions. Price competition is intense, particularly for entry price point consumer products for the retail market. The Group’s strategy is based on product innovation, utilization of the Group’s strong brands, global distribution and scale efficiency to create differentiated product and solutions offerings for the different end-customer segments.
SeasonalitySeasonal variations and weather conditions can lead to short-term fluctuations in demand and price competition, as supply may be greater or lesser than demand. If supply is greater than demand, competition may lead to lower prices. In order to minimize the risk of over-production, Husqvarna Group has established a flexible production structure with relatively low fixed costs, which can be adjusted at short notice to meet actual demand.
CustomersConsumer products are sold mainly through large retail chains. This market is highly consolidated in North America, while in Europe the market consolidation is still on going. This implies that the Group’s retail customers are becoming larger and fewer in numbers, which gives them greater bargaining power. However, this situation also provides Husqvarna Group with an opportunity to generate higher growth by displaying the Group’s products in a large number of retail outlets in a wider geographical market. Consolidation has involved a greater degree of dependence on individual customers, which has resulted in higher levels of trade receivables and credit risks related to these customers.
Professional products are sold mainly through local dealers or in some cases directly to end-customers, which means that these customers purchase much smaller volumes and generally are not individually significant for the Group. Unit costs for sales to dealers are higher than for example retail chains but the level of risk related to receivables and credit is lower and the margins are higher.
Report by the Board of Directors
Risk Management
Annual Report 2014 Husqvarna Group 46

Report by the Board of Directors
ProductionHusqvarna Group’s production consists mainly of assembly of purchased components, and is normally sufficiently flexible to meet fluctuations in demand resulting from economical, seasonal and weather variations, but subject to the availability of components. Handheld products such as chainsaws and clearing saws, for which the Group also manufactures engines, as well as watering products, feature a higher proportion of specialized components that are produced in-house.
The Group is currently investing substantial resources in building a production facility for manufacturing of saw chains which is a key component for chainsaws. The Group has limited experience of producing saw chains, hence it involves adding and building new technological competence. Such investments always involve risks, including but not limited to, unsatisfactory ramp up of the produc-tion capacity, or fine tuning of the manufacturing equipment pa-rameters which could take longer than planned to achieve desired quality of the finished products.
Husqvarna Group’s operations and operations at its suppliers’ facilities are subject to disruption for a variety of reasons, including, but not limited to, work stoppages, fire, earthquake, flooding, or other natural disasters. Such disruption could interrupt Husqvarna Group’s ability to manufacture certain products. Any significant disruption could negatively impact the Group’s sales and earnings. In light of the seasonal variations in the Group’s operations, the number of temporary employees increases rapidly in preparation for the peak production season, and decreases rapidly at the end of the production season. The production season for most products is during the first and second quarters, whereas chainsaws and other handheld products have its production peak in the third quarter. Husqvarna Group relies to a great extent on temporary labor for the seasonal production, which poses risks in terms of training and availability of such temporary labor.
Risks related to prices for raw materials, other materials and components The Group’s operations and its performance are affected by fluctua-tions in the prices of raw materials and components. The most important raw materials are steel, aluminum and various types of plastics. These prices can fluctuate considerably in the course of a year, as a result of changes in world prices for raw materials or the ability of suppliers to deliver them. The total consumption is linked to production volume and production mix.
In 2014, Husqvarna Group purchased materials and components for approximately SEK 16,277m (16,229). The total raw materials spend was SEK 3,772m (3,505). Direct spending on raw materials was SEK 1,931m (1,799), and indirect spending (i.e. raw material value in components) was SEK 1,841m (1,706). Direct spending on steel totaled SEK 715m (684) and indirect spending on steel was SEK 860m (781). Direct spending on aluminum totaled SEK 12m (9), and indirect spending was SEK 432m (401). Direct spending on plas-tics totaled SEK 360m (310) and indirect spending was SEK 549m (524). Direct spending on other raw materials was SEK 844m (796).
The Group does not use financial instruments to hedge prices of raw materials, but manage the risk through bilateral agreements.
In some cases, Husqvarna Group’s material requirements are met by single suppliers who individually cover the Group’s short-term needs. The effects of interrupted deliveries vary, depending on the specific materials and components. A shortfall in deliveries or other quality-related issues from a supplier could have negative conse-quences for production and for deliveries of finished products.
The Group’s purchasing organizations works closely with suppliers in order to manage deliveries, and monitors the suppliers’ financial stability, quality-assurance systems and flexibility of production.
Raw material spending, Group 2014SEKm
Steel 1,575
Plastics 909Aluminum 444Other raw materials 844Total 3,772
Cost structure, Group 2014% of net sales SEKm
Cost of goods sold:
Components 38.1 12,505
Raw materials 11.5 3,772
Factory OH, R&D, tools 14.2 4,670
Direct wages 4.3 1,410
Other 3.4 1,122
Total cost of goods sold 71.5 23,478
Gross operating income 28.5 9,360
Selling expense 17.1 5,626
Administrative expense 4.2 1,392
Impairment of goodwill 2.3 767
Other 0.1 –16
Operating margin/income 4.8 1,591
AcquisitionsHusqvarna Group may undertake acquisitions from time to time, and integration of acquired businesses always involves risks. Sales may be adversely affected, the costs of integration may be higher than anticipated, and synergy effects may be lower than expected.
Risks related to restructuring and organizational changeThe Group has in recent years undertaken a number of structural changes to its manufacturing footprint. In 2012, the Group announced measures to improve its cost structure including a reduction in force in 2013.
In 2014, the Group announced a new organization that was fully implemented as of January 1, 2015. Restructuring and organiza-tional changes always involve the risk of creating higher costs than anticipated and losing key personnel, or that estimated savings deviate, both up and down, from announced targets.
Changes in legislationHusqvarna Group products are subject to national and international regulations regarding their environmental impact and other issues arising from the use and recycling of products, such as exhaust emissions, noise and safety. Husqvarna Group has adapted its products steadily in this respect. The Group is the market leader in terms of the development of two-stroke engines, for example, and allocates resources for product development to enable compliance with stricter criteria in the future. The criteria which will be introduced over the next few years are for the most part known, and if these criteria do not undergo significant change it is estimated that they can be met by the Group’s existing products, as well as those currently under development.
Risk Management
Annual Report 2014 Husqvarna Group 47

Report by the Board of Directors
Risk Management
Product liabilityIn many countries, legislation may require Husqvarna Group to recall products in specific circumstances. New and stricter regulations in this respect may be introduced in the future.
The Group is also exposed to product liability in the event that products are alleged to have caused damage to persons or property. The Group is insured against such claims, partly through insurance in its own captive subsidiaries, and partly through external insurers. However, there is no guarantee that such insurance cover is valid or sufficient in a specific case, or that claims regarding product liability may not have an adverse effect on earnings and financial position. External insurance is subject to availability and pricing, which may vary over time.
The Committee on Product Safety, led by the Group´s Quality Manager, includes representatives from operational units, as well as Group Staff Legal Affairs. The tasks of the Committee include ensuring that product safety is integrated into the design, production and distribution of all Group products.
Financial risksThe Group’s financial risks are managed on the basis of the Group’s financial and credit policies, which are annually updated and approved by the Board of Directors. Management of financial risks is based largely on the use of financial instruments and is mainly centralized to Group Treasury, which operates in accordance with specified risk mandates and limits.
For more information on risk management, risk exposure and accounting principles, see Notes 1 and 19.
Currency exposureThe goal of currency management is to minimize the short-term adverse effects of currency exchange rate fluctuations on the Group’s earnings and financial position. As Husqvarna Group sells its products in more than 100 countries, the Group is exposed to
such exchange rate fluctuations. The fluctuations affect the Group’s earnings in terms of translation of income statements in foreign subsidiaries, i.e. translation exposure, as well as the sale of products on the export market and purchases of materials in foreign curren-cies, i.e. transaction exposure, and also in terms of translation of balance sheet items such as trade receivables and payables.
Translation exposure is related primarily to USD, JPY, EUR, CNY and GBP while transaction exposure is related primarily to EUR, USD, CAD and CNY. The Group’s globally widespread production and sales enable the various exchange-rate effects to offset each other to some extent.
Changes in exchange rates also affect Group equity. The difference between the assets and liabilities of foreign subsidiaries in foreign currencies is affected by such changes, which generate translation differences that impact equity. At year-end 2014, most foreign net assets were in USD and EUR.
For more information on risks related to currency exposure, see Note 19.
Transaction exposure by currency, forecasted commercial flows 2015
SEKmForecasted
net flowHedge
amountTransaction
exposure net
EUR 2,963 –2,511 452
CAD 907 –552 355
AUD 490 –323 167
CHF 421 –340 81
NOK 336 –244 92
DKK 302 –230 72
Other 1,165 –334 831
CNY –565 493 –72
USD –2,716 1,792 –924
SEK –3,303 2,249 –1,054
±10% ±10% ±1%Sensitivity analysis
Currency Raw Material Interest Rate
– SEK | USD + – SEK | EUR + – SEK | ALL + STEEL ALUMINIUM PLASTICS INTEREST
SEKm SEKm SEKm
–2201 +3202 +4903
Effect on operating income
SEKm SEKm SEKm
±160 ±45 ±90 SEKm
±23
1) Excluding hedge effects. SEK –270m would refer to effect of transactions and SEK 50m to translation differentials.2) Excluding hedge effects. SEK 295m would refer to effect of transactions and SEK 25m to translation effects.3) Excluding hedge effects. SEK 330m would refer to effect of transactions and SEK 160m to translation differentials. All other refers to the other currencies including USD and EUR.
Effect on income for the periodEffect on operating income
Annual Report 2014 Husqvarna Group 48

Report by the Board of Directors
Risk Management
Net sales and exchange ratesNet sales, SEKm Average exchange rate, SEK Year-end exchange rate, SEK
SEKm 2014 2014 2013 2014 2013
USD 13,420 6.89 6.52 7.80 6.47
EUR 8,794 9.11 8.67 9.49 8.91
CAD 1,109 6.23 6.32 6.71 6.04
GBP 1,098 11.31 10.23 12.12 10.66
JPY 829 0.06 0.07 0.07 0.06
Hedging of currency exposureHusqvarna Group uses currency derivatives to hedge forecasted transaction exposure over a horizon of 0–12 months. Normally, 75–100% of the invoiced and forecasted currency flow for the first 6 months is hedged, and 50–75% for the next 7–12 months. At year-end 2014 the market value of the Group’s hedges referring to transaction exposure amounted to SEK 165m (–10).
In order to limit negative effects on Group equity resulting from translation differences, part of the Group’s net investments in foreign operations is hedged with foreign exchange derivatives. Foreign currency exchange gains or losses on net investment hedges are reported in the hedge reserve, whereas interest income and expense related to these hedges are reported in the Group’s net financial items. During the year a net interest income of SEK 10m has been reported.
Interest rate riskAt year-end 2014, the average interest rate on external borrowings was 3.5% (4.0) and the average fixed interest-term was 1.6 years (1.5). On the basis of the volume of borrowings and the fixed interest-term at year-end, a one percentage point shift of the interest rates would impact Group income for the amount of +/– SEK 23m (27).
For more information on interest rate risk, see Note 19.
Financing risksFinancing risks refer to possible delays, increased costs or cancel-lations related to financing of the Group’s capital requirements and refinancing of outstanding loans.
Financing risks can be reduced by maintaining an evenly distrib-uted maturity profile of loans, and by ensuring that short-term bor-rowings do not exceed current liquidity. The Group’s financial policy stipulates that net debt should be long-term, without reference to seasonal variations. The Group’s goal is for the average maturity period of long-term loans to be not less than two years and to show an evenly distributed maturity profile. A maximum of SEK 3,000m of non-seasonal loans can normally have a maturity period of less than 12 months.
Evaluation of financial risks involves the adjustment of the matu-rity profile for available, but unutilized committed revolving credit facilities.
In addition, seasonal variations in cash flow comprise an important component for the evaluation of financing risks. Future seasonal variations are therefore continuously taken into account in liquidity planning. The average maturity period for the Group’s loans was 4.0 years (3.3) at year-end 2014.
During the year the Group has entered into a bilateral loan amounting to SEK 425m with final maturity 2019. A bond loan amounting to SEK 500m and originally maturing 2015 has been amortized during 2014. Furthermore a bilateral loan originally amounting to USD 140m has been amortized by USD 30m during the year.
The Group has an unutilized committed revolving credit facility that during the year has been decreased from SEK 6,000m with maturity 2016 to SEK 5,000m with final maturity 2019.
For more information on financing risks, see Note 19.
Credit risksThe Group’s credit risks are managed on the basis of standardized credit ratings, active monitoring of credits and routines for follow-up of trade receivables. The need for reserves for doubtful trade receivables is monitored continuously. Major credits are approved annually by the Board of Directors.
To some extent, the Group utilizes credit insurance to reduce credit risk in trade receivables in Europe and in the U.S.
The Group’s financial assets are used primarily for the repayment of loans. Liquid funds are placed in highly liquid interest-bearing instruments issued by institutions with a credit rating of at least A-, according to Standard & Poor’s or similar agencies.
For more information on credit risks, see Note 19.
Tax riskHusqvarna Group operates in many countries and undertakes a great number of international transactions. The operations are sub-ject to complex national and international tax rules, which change over time.
From 2013, new restrictions on tax deductibility of interest expenses on intra-group loans apply in Sweden. Interests are only deductible provided one of two exceptions is satisfied: i) the loan is mainly motivated by business reasons, or ii) the interest beneficiary is taxed at income tax rate of at least 10% and the loan is not merely tax driven. It is unclear how these exceptions shall apply. There-fore, Husqvarna Group has made provisions to mitigate potential exposure related to these new restrictions.
Pension commitmentsHusqvarna Group’s commitment for pensions and other post --employment benefits amounted to SEK 1,835m (1,253) at year-end 2014. The Group manages pension funds amounting to SEK 2,408m (1,927). At year-end 2014, 42% (45) of these funds were placed in shares, 57% (54) in bonds and 1% (1) in liquid assets or other investments.
Changes in value of the assets and liabilities depend primarily on trends for share prices and interest rates. Factors affecting the pension obligation include changes in the assumptions, such as discount rate, life expectancy and expected salary increases. The income statement for 2014 includes the costs for pensions and post-employment benefits as referred to above, amounting to SEK 119m (98). During 2014, SEK 62m (57) was paid into the Group’s pension funds. In the interest of effective control and cost-efficient manage-ment of the Group’s pension assets, management is centralized in Group Treasury and conducted in accordance with the pension fund policy adopted by the Board of Directors.
For more information on pension commitments, see Note 20.
Annual Report 2014 Husqvarna Group 49

Governance structure
Husqvarna AB (“Husqvarna” or “the Company”) is a public company listed on Nasdaq Stockholm and its governance is subject to a number of laws and regulations. The most important of these are the Swedish Companies Act, the Swedish Annual Accounts Act, Nasdaq Stockholm Rulebook for Issuers and the Swedish Code of Corporate Governance (“the Code”). Husqvarna’s corporate governance complies with the Code in all aspects.
Corporate Governance Report
This Corporate Governance Report has been prepared in accordance with the Annual Accounts Act and The Swedish
Code of Corporate Governance. Husqvarna’s auditors have reviewed the report and their opinion has been included in the Auditor’s Report. In addition to the above external regulations, Husqvarna operates under internal regulations, which include the Company’s Articles of Association, policies, governance documents, guidelines and instructions.
Husqvarna strives to operate its activities in a sustainable manner while at the same time creating value for customers, shareholders, employees, suppliers, local communities and other stakehold-ers. The Company’s new strategy (for details, see pages 9–15), combined with its financial goals (see page 8) supports this direc-tion. The Company’s sustainability ambitions are described briefly on pages 32–36, and in more detail in the Sustainability Report.
The highest corporate decision making body in the Company is the Shareholders’ General Meeting, which is normally held once per year in the form of the Annual General Meeting (“AGM”), but can also be in the form of an Extraordinary General Meeting (“EGM”) under certain circumstances. The latest EGM took place in 2009 when a rights issue was adopted.
The Company prepares the AGM, however with influence from the share-holders, who have the right to propose matters for the AGM agenda.
ShareholdersHusqvarna AB’s shares have been traded on Nasdaq Stockholm since June 2006. At year-end 2014, the share capital amounted to SEK 1,153m, represented by 122,425,469 A-shares and 453,918,309 B-shares, each with a par value of SEK 2.
A-shares carry one vote and B-shares carry one tenth of a vote. As per the Articles of Association, holders of A-shares are entitled to request conversion of A-shares to B-shares.
In 2014, 4,168,399 A-shares were converted to an equivalent number of B-shares.
On December 31, 2014, the number of shareholders was 55,234. Of the total number of shares, foreign shareholders accounted for approximately 35 percent (27). 90 percent (88) of the total number of shares were owned by legal entities and 10 percent (12) by private individuals representing 91 percent (90) and 9 percent (10) of the total number of votes respectively. Investor AB is the single largest shareholder with a holding of about 17 percent of the share capital and approximately 31 percent of the votes as of December 31,
Husqvarna AB and Husqvarna Group from the shareholders’ and the Board of Directors’ perspective.
Appoints
Controls
Reports
Proposes
Report by the Board of Directors
Corporate Governance Report
Annual General Meeting
Board Committees
External Auditors
Board of Directors
Group Management
Company’s internal control organs
Group companies
Shareholders (after AGM instruction)
Nomination Committee
Annual Report 2014 Husqvarna Group 50

2014. Measured by the number of votes, L E Lundbergföretagen is the second largest owner, with a holding of about 8 percent of the capital and approximately 24 percent of the votes on December 31, 2014.
For further information on the Husqvarna shares and share-holders, see page 114.
Nomination CommitteeSix months prior to the AGM, the Company’s Nomination Committee is convened. The rules for the composition of the Nomination Committee are adopted by the AGM. At the AGM in 2013, it was decided that, until the AGM resolves otherwise, the Company shall have a Nomination Committee consisting of five members. The members shall comprise of one representative of each of the four largest shareholders in the Company in terms of the number of known voting rights held as of the last banking day of August who have expressed a wish to participate in the work of the Nomination Committee, together with the Chairman of the Board of Directors. The Company’s Board secretary serves as secretary of the Nomination Committee. In the case of major changes in shareholdings after the Nomination Committee is constituted, the composition of the Nomination Committee may be altered accordingly.
Each year a survey is conducted among the Board members concerning the Board’s work, composition, qualifications, experience and efficiency. This survey forms the basis for the Nomination Committee’s evaluation of whether the Board should be strengthened with additional expertise or if there are any other reasons to make changes to the composition of the Board. The Nomination Committee has also evaluated the goal to achieve an even gender balance in the Board of Directors. Normally, the Nomination Committee also meets separately with the Company’s President and CEO, and occasionally with individual Board members. Any propsed new Board members are interviewed by the Nomination Committee.
The Nomination Committee evaluates the Company’s Board composition from an independency perspective and takes into account any proposals made to the Nomination Committee about the composition of the Board, which may have been suggested by other shareholders.
The names of the Nomination Committee representatives and the shareholders that they represent shall be announced publicly at least six months prior to the AGM. The members of the Nomination Committee for the AGM in 2015 announced on October 8, 2014, are:• Petra Hedengran (Chairman), Investor AB• Claes Boustedt, L E Lundbergföretagen AB• Ramsay Brufer, Alecta• Ricard Wennerklint, If Skadeförsäkring AB• Lars Westerberg, Chairman of the Board of Directors
The selection of the four shareholders to be represented on the Nomination Committee was based on known holdings of voting rights as of August 29, 2014. The Nomination Committee’s tasks include preparing a proposal for the AGM regarding the following:• Proposal for election of Chairman of the AGM;• Proposal for election of Board members;• Proposal for election of Chairman of the Board;• Proposal on remuneration to the Board members, including the
Chairman, and Board members’ work on the Board committees;• Proposal on remuneration to the external auditors; and• Composition of the Nomination Committee and its tasks for the
next following year (if applicable).
The Nomination Committee should also submit proposals for the election of external Auditors when such are to be appointed by the AGM. The Nomination Committee is then assisted by the Audit Committee, which among other things informs the Nomination Committee of the results of the evaluation of the Auditors’ work. The Nomination Committee shall present to the AGM its motivated opinion for its proposals.
Shareholders who wish to submit proposals to the Nomination Committee may do so by sending an email to [email protected]. The Nomination Committee’s proposals are announced publicly in connection with or prior to the notice of the AGM.
Nomination Committee members do not receive compensation from the Company for their work on the Nomination Committee.
Annual General Meeting agendaThe agenda for the AGM consists of matters that are statutory (as per the Swedish Companies Act), regulatory (as per the Swedish Code of Corporate Governance) or internal (as per the Company’s Articles of Association). Shareholders may also, prior to the publication of the notice to attend the AGM, propose matters to be put on the AGM agenda.
In preparation for the AGM, the Board reviews matters to be proposed for decision by the AGM, including: • Adoption of statutory financial documentation;• Discharge of liability for the Board members and President and CEO;• Disposition of the Company’s profit;• Principles of remuneration for Group Management;• Adoption of long-term incentive programs (if applicable);• Repurchase and transfer of the Company’s own shares (if applicable);• Authorization to resolve on the issuance of new shares (if applicable); and• Other matters to be decided by the AGM.
The AGM also decides on matters proposed by the Nomination Committee as follows:• Election of Chairman of the AGM;• Number of Board members;• Remuneration to Board members and external auditors;• Election of Board members and Chairman of the Board; and• Election of external auditor (every fourth year according to the
Articles of Association). The AGM shall be convened not later than six months after the close of the preceding financial year, and it is normally held in March/April each year. The notice of the AGM shall be made public at least four weeks and not more than six weeks prior to the AGM. In Husqvarna’s case, it is published in the Swedish daily newspaper Svenska Dagbladet and the Swedish Official Gazette (Post- och Inrikes Tidningar). It is published by press release and on the Company’s website www.husqvarnagroup.com/agm.
Shareholders who are listed in the share registry on the record day and wish to be represented at the AGM must register to do so with the Company in due time. Shareholders who are not able to attend in person may appoint a proxy. Shareholders who are represented by proxy, including all corporate shareholders, must submit a valid power of attorney as well as other required documentation in due time before the AGM. This allows the Company to compile a book of shareholders from the Swedish central securities depository, Euroclear Sweden (VPC). Following this compilation, voting certificates are sent to all shareholders attending the meeting or their designated representatives. Voting certificates are proof of voting rights and also
Report by the Board of Directors
Corporate Governance Report
Annual Report 2014 Husqvarna Group 51

serve as an entrance card to the AGM. The Company´s Articles of Association does not limit the number of votes cast by a shareholder at the AGM.
Annual General MeetingThe AGM is the highest decision-making body of the Company and shall decide on the above-mentioned matters proposed by the Board of Directors and the Nomination Committee, as well as changes to the Articles of Association, etc.
The AGM of the Company shall be held in Jönköping, Sweden or in Stockholm, Sweden.
At the AGM, the Chairman of the Board presents a report on the Board’s work during the preceding year; the President and CEO gives an overview of the Company’s business and current priorities; and the auditors present their report and their review of the Company’s finances. If required, the Chairman of the Remuneration Committee reports on remuneration to Group Management and, if it is to be decided by the AGM, the Company’s long-term incentive programs. Shareholders may also direct questions to the Chairman of the Board, the President and CEO, the Chairman of the Nomination Committee, the Chairman of the Remuneration Committee, the external auditors or any other Board member.
Written documentation is presented at the AGM, normally both in English and Swedish. This documentation may be downloaded from the Company’s website and is also sent to shareholders upon request.
Such documentation includes:• The agenda for the AGM;• Proposals from the Board of Directors and the Nomination
Committee;• The Remuneration Committee’s evaluation of programs of
variable remuneration for Group Management, the application of the principles of remuneration for Group Management and applicable remuneration structures and levels in the Company;
• The Nomination Committee’s motivated opinion regarding the proposal for appointment of Board members; and
• The Board’s report in relation to the proposed dividend and the proposal on the acquisition of own shares (if applicable).
The AGM is conducted in Swedish, but simultaneous translation into English is available. The minutes recorded at the AGM are normally published within a few days of the AGM. A press release containing the decisions made by the AGM is published immediately after the AGM.
Annual General Meeting 2014The AGM 2014 was held on April 10 in Jönköping with 713 share-holders attending, personally or by proxy, representing 56 percent of the total number of shares and 75 percent of the total number of votes. Also attending were the Board of Directors, the external auditors and members of Group Management. The following resolutions were passed:• Adoption of the Income Statements and Balance Sheets for 2013,
together with the Board of Directors’ dividend proposal, which was set at SEK 1.50 per share.
• The Board of Directors and the President and CEO were discharged from liability for the financial year 2013.
• The Nomination Committee’s proposal for the number of Board members and the election of Lars Westerberg, Magdalena Gerger, Tom Johnstone, Ulla Litzén, Katarina Martinson, Daniel Nodhäll, David Lumley, Lars Pettersson and Kai Wärn as Directors of the Board. Lars Westerberg was appointed Chairman of the Board.
• The Nomination Committee’s proposed remuneration to the Board of SEK 5,595,000 in total, whereof SEK 1,675,000 to the
Chairman of the Board and SEK 485,000 to each of the Board members elected by the AGM and not employed by the Company, was adopted. Furthermore, according to the Nomina-tion Committee’s proposal, remuneration of SEK 175,000 to the Chairman of the Audit Committee and SEK 75,000 to each of the other two members of the Audit Committee was resolved, as well as SEK 100,000 to the Chairman of the Remuneration Committee and SEK 50,000 to each of the other two members.
• The Nomination Committee’s proposal to elect Ernst & Young AB as Auditor for the period from the AGM 2014 up until the end of the AGM 2018.
• The Auditor’s fee shall be paid on the basis of approved invoices.• The Board of Directors’ proposal for principles of remuneration to
Husqvarna Group Management.• The Board’s proposal for a performance-based long-term
incentive program for 2014, LTI 2014.• The Board of Directors was authorized to, on one or more occa-
sions during the period up until the next AGM, approve purchase of own B-shares, on the condition that the Company’s holding does not at any time exceed 3 percent of the total number of shares in the Company. Shares shall be purchased on Nasdaq Stockholm at a price within the share price interval registered at the time.
• The Board of Directors was authorized to, on one or more occasions during the period up to the next AGM, approve the transfer of the Company’s own B-shares on Nasdaq Stockholm. Shares may be transferred on Nasdaq Stockholm only at a price within the share price interval registered at that time.
• Not more than 1,800,000 B-shares may be transferred to employees in accordance with LTI 2014.
• The Board was authorized to approve the issue of not more than 57.6 million new B-shares against consideration in kind on one or more occasions during the period up to the AGM in 2015.
Annual General Meeting 2015The Annual General Meeting 2015 of Husqvarna AB will be held at 4 p.m. on Tuesday, April 21, 2015 at the Culture Center Spira, Kulturgatan 3, in Jönköping, Sweden.
For more information regarding the AGM 2015, see page 64.
The Board of DirectorsAccording to Husqvarna AB’s Articles of Association, the Board of Directors shall comprise of no less than five and no more than ten Board members. There are currently nine Board members elected by the AGM (see table on page 53). In addition to the Board members elected by the AGM, the Swedish trade unions have the statutory right to appoint two ordinary Board members with voting rights and two deputies.
The Board of Directors is responsible for organizing the Company and management of the Company’s operations. The Board shall also issue guidelines and instructions to the President and CEO. In addition, the Board shall ensure that the Company’s organization in respect of accounting, management of funds and the Company’s financial position are satisfactory controlled.
The Board has adopted Rules of Procedure for its internal activi-ties, which includes rules regarding the number of Board meetings, matters to be handled at regular Board meetings and the duties of the Chairman of the Board. The Chairman shall also ensure that the Board evaluates the President and CEO on a regular basis, at least once every year.
The Board has also issued written instructions specifying when and how information required to enable the Board to evaluate the Company and the Group’s financial position shall be reported to the Board, as well as the distribution of duties between the Board
Report by the Board of Directors
Corporate Governance Report
Annual Report 2014 Husqvarna Group 52

and the President and CEO. The Rules of Procedure also include an investment and capital expenditures policy, a financial policy, a credit policy and an internal control policy.
The duties of the Board are partly exercised through its Audit Committee and Remuneration Committee, and the Board has also adopted charters for such Board committees.
The topics for Board meetings follow an agenda plan that details the matters that should be dealt with by the Board during the Board’s tenure as well as when such should be dealt with, whilst leaving room for the Board members’ own initiatives for topics to be addressed at the Board meetings.
The Rules of Procedure are updated at least once annually and are adopted by the Board of Directors at its statutory meeting, which normally immediately follows the AGM.
The Chairman of the Board ensures that the Board’s work and pro-cedures are evaluated and discussed with the Board members annu-ally, and are brought to the attention of the Nomination Committee.
Evaluation of the Chairman of the Board shall also be carried out annually. This work shall be led by the Chairman of the Remunera-tion Committee.
The Board members elected by the AGM fulfill the independence criteria set by the Code.
Fees to Board membersFees to Board members, including fees for committee work, is set by the shareholders at the AGM. For information on fees to the Board of Directors in 2014, see Note 4.
Board meetings According to the Board’s Rules of Procedure, the Board shall hold at least four ordinary meetings and one statutory meeting per calendar year. In 2014, the Board held eleven meetings, of which four were by telephone, one per capsulam, two in Huskvarna, Sweden, one in Ulm, Germany, one in Charlotte, the U.S. and two in Stockholm, Sweden.
Agendas for ordinary Board meetings, together with supporting documentation as required under the Rules of Procedure or which are otherwise necessary for the Board to take adequate action, shall be sent to the Board members approximately one week before each Board meeting. The documentation is distributed electronically over a secure network. In addition to the documentation prepared for each Board meeting, the Board members are sent additional information regarding the Company, its markets and competitors on a regular basis.
The Chairman of the Board, the President and CEO, and the Secretary of the Board discuss and agree upon the topics for each Board meeting prior to the meeting.
At Board meetings, the Company’s President and CEO, the Company’s CFO and the Company’s General Counsel are present. The General Counsel serves as the Board’s secretary and records the minutes of the Board meetings. Other members of Group Management or other senior managers of the Company may also report or make presentations on significant matters.
Once a year, the Company’s internal auditor meets with the Board and presents its findings and plans.
In addition, the Company’s external auditors meet with the Board once a year, in general without participation of the members of Group Management.
All Board meetings follow the adopted agenda plan, which includes the following matters:• Opening of meeting, appointment of person to verify the
minutes, agenda approval;• Approval of the previous meeting minutes;• Business and financial update;• Market and competitor update;• Report from the Audit Committee;• Report from the Remuneration Committee;• Decision-related matters; and• Information-related matters.
Attendance 2014
Name NationalityIndepend-
ence¹Board
meetingsAudit
CommitteeRemuneration
Committee
Authorized fees, total
in SEK²
Holdings, number of A-shares³
Holdings, number of B-shares³
Lars Westerberg Board Chairman Committee member SE Yes/Yes 11/11 3/3 1,725,000 – 270,000
Magdalena Gerger SE Yes/No 11/11 485,000 3,100 –Tom Johnstone Committee Chairman UK Yes/No 11/11 3/3 585,000 990 4,800
Ulla Litzén4Committee member Committee Chairman SE Yes/Yes 11/11
2/2 7/7 660,000 – 10,000
David Lumley5 US Yes/Yes 8/8 485,000 – 6,252Ulf Lundahl6,7 Committee Chairman SE Yes/No 3/3 2/2 – n/a n/aKatarina Martinson Committee member SE Yes/No 11/11 7/7 560,000 113,478 378,737Anders Moberg6 Committee member SE Yes/Yes 2/3 1/1 – n/a n/aDaniel Nodhäll Committee member SE Yes/No 11/11 9/9 560,000 – 5,000Lars Pettersson5 Committee member SE Yes/No 7/8 2/2 535,000 – –Kai Wärn5 SE No/Yes 8/8 – – 130,570Soili Johansson Employee representative SE – 10/11 – 225 750Annika Ögren Employee representative SE – 10/11 – – –Carita Spångberg8 Employee representative SE – 9/10 – – –Lotta Widehäll8 Employee representative SE – 10/10 – – –Total 11 9 3 5,595,000 117,793 806,109
1) Refers to independence in relation to the company and management, and independence in relation to major shareholders.
2) Board members are expected to engage themselves financially in Husqvarna shares within a period of five years, corresponding to one year´s Board fee.
3) Refers to December 31, 2014 and includes related parties.4) Committee Chairman as of the 2014 AGM.
5) Elected at the 2014 AGM.6) Resigned at the 2014 AGM, remuneration presented during 2013.7) Committee Chairman until the 2014 AGM.8) Deputy.
Board of Directors
Report by the Board of Directors
Corporate Governance Report
Annual Report 2014 Husqvarna Group 53

When relevant and at least quarterly, the Group Management presents forecasts and key performance indicators, providing the Board with an overview of the financial development and expecta-tions of the Company, including a set of key performance indicators measuring the Company’s Accelerated Improvement Program. The Company’s budget is reviewed and approved once a year, generally in the fall. The Board also reviews the Company’s significant litigations quarterly and follows up on the Company’s compliance work annually.
The minutes of Board meetings, including all supporting materials, are sent electronically over a secure network to all Board members.
The Board’s committeesThe Board has two Board committees: the Audit Committee and the Remuneration Committee.
Audit CommitteeThe Audit Committee monitors the Company’s financial reporting, ensures that the principles adopted for financial reporting, internal control, internal audit and risk assessment are observed, and reviews and supervises the Company’s external auditors’ impartiality and independence.
It reports on its findings and provides recommendations at each Board meeting held in person, and if relevant, also at Board meetings by telephone.
The Audit Committee may exercise any other powers and carry out any other responsibilities delegated to it by the Board from time to time.
The Board determines the composition of the Audit Committee, which shall have at least three members. The Board appoints the Committee members annually at the statutory Board meeting or when a Committee member needs to be replaced. The Committee members appointed in April 2014 were Ulla Litzén (Chairman), Daniel Nodhäll and Katarina Martinson.
The Committee members must satisfy applicable financial literacy and independence requirements, as well as other legal and regulatory requirements, including those of the Company’s Articles of Association and the Code.
In 2014, the Audit Committee held nine meetings, which fulfills its own charter rule that it shall meet at least four times per year.All Audit Committee meetings follow the adopted agenda plan, which comprises the following matters:• Opening of the meeting, agenda approval, appointment of
minute approvers• Approval of previous meeting minutes • Review of open issues• Treasury and tax update • Internal audit update
The Audit Committee also reviews the Company’s Interim Reports and Annual Report before they are submitted to the Board. It meets frequently with the Company’s external auditors and solicits reports on the audit work and the closing of the books. At least once a year, the Committee meets separately with the Company’s internal auditor.
When relevant and at least quarterly, the Committee reviews the Company’s treasury operations and tax position. It also reviews the Company’s compliance work quarterly.
Meeting materials are prepared by the Company and distributed electronically over a secure network to Committee members approximately one week prior to each meeting.
Audit Committee meetings are also attended by the Company’s internal auditor who keeps the minutes of the meetings, the Company’s CFO and the General Counsel. Other members of Group Management are present to report on matters as relevant.
The minutes of Audit Committee meetings, including all support-ing materials, are distributed electronically over a secure network and made available to all Board members, not only to the members of the Committee.
February, meeting by telephone• Approval of the press release for the
Year-end Report 2013 • Proposal for the dividend (to be
decided by the AGM)
March, in Ulm, Germany• Report from the Company’s auditors • Report from the Nomination Committee• Strategy process update• Approval of notice to attend the AGM• Approval of investments
April, meeting in Huskvarna, Sweden in conjunction with the AGM• Report on a new strategy direction
April (statutory meeting), meeting in Huskvarna after the AGM• Adoption of the Board’s Rules of
Procedure • Election of Chairman and members of
the Board’s committees • Decision on Board meetings in 2015
April, meeting by telephone• Approval of the press release for the
first quarter 2014
May, meeting in Charlotte, the U.S., in conjunction with a visit to the Com-pany’s business in North America• Adoption of a new strategy and focus
areas, including – A revised brand architecture– A revised organization• Approval of a revised MTN prospectus
July, meeting by telephone• Approval of the press release for the
second quarter 2014, including the auditors’ review of the first six-month period ending on June 30, 2014
• Approval of terms for revised external financing
August, meeting per capsulam• Approval to acquire a business
September, meeting in Stockholm, Sweden• Update on the new organization• Capital Markets Day• Approval to acquire a business• Approval to divest shares
October, meeting by telephone• Approval of the press release for the
third quarter of 2014• Report on the Board evaluation
December, meeting in Stockholm, Sweden• Approval of the 2015 budget • Approval of new financial reporting
structure• Approval of short-term incentive
program for 2015 and salary review for Group Management
• Approval of revised credit limits for major customers
• Approval of revised Rules of Procedure due to the revised organization
• Annual follow-up of the Company’s major investments
Board meetings in 2014In addition to the above mentioned list of recurring agenda items, the Board dealt with the following specific matters during 2014. Board meetings were held in person unless otherwise specified:
Report by the Board of Directors
Corporate Governance Report
Annual Report 2014 Husqvarna Group 54

February• Year-end Report and external auditors’
comments on the 2013 closing• Impairment test and valuation of
defined-benefit pension plans • Review of Audit Committee meetings
during 2014• Internal Audit Annual Plan 2014
February• Review of Annual Report for 2013
April• Review of the Company’s report for
the first quarter 2014• Approval of the external audit plan for
2014• Review of internal audits report
May• Review of the proposed MTN prospec-
tus for 2014• Review of the Company’s plans to
renew its external financing
July• Review of the second quarter report • Review of the external auditors’ report
on the second quarter 2014
September• Review of internal audit reports• Review of final terms of revised exter-
nal financing
October • Review of the third quarter report 2014
November • Review of the auditors’ report on the
hard close• Review of a proposal for revised
dividend distribution
Committee meetings in 2014In addition to the above mentioned list of matters dealt with at Committee meetings, the following specific matters were dealt with by the Committees in 2014. All meetings were held in person unless otherwise specified:
Remuneration CommitteeThe Remuneration Committee is assigned to prepare the Board’s decisions on principles for remuneration and other terms of employ-ment for the President and CEO and other Group Management members, to monitor and evaluate programs for variable remuneration – both ongoing and those that have ended during the year – for Group Management, and to monitor and evaluate the application guidelines for remuneration that the AGM is legally obliged to establish, as well as the current remuneration structures and levels in the Company.
It reports on its findings and recommendations at each Board meeting held in person, and if relevant, also at Board meetings by telephone.
The Remuneration Committee may exercise any other powers and carry out any other responsibilities delegated to it by the Board from time to time.
The Board determines the composition of the Remuneration Committee, which shall have at least three members. The Board appoints the Committee members annually at the statutory Board meeting, or when a Committee member needs to be replaced. The Committee members appointed in April 2014 were Tom Johnstone (Chairman), Lars Pettersson and Lars Westerberg.
The Committee members must satisfy applicable independence requirements and other legal and regulatory requirements, includ-ing those of the Company’s Articles of Association and the Code.
In 2014, the Remuneration Committee held three meetings, which fulfills the charter criteria that it shall meet at least twice a year.
All Committee meetings follow the adopted agenda plan, which comprises the following matters:• Opening of the meeting, agenda approval, appointment of
minute approvers• Approval of previous meeting minutes • Review of open issues
The Committee also reviews the Company’s long-term (“LTI”) and short-term incentive (“STI”) programs and ensures that these programs follow legal and internal policies, decisions from the AGM and other relevant rules and instructions. If needed, the Committee solicits advice and external benchmarks to ensure that the Company’s remuneration principles are up to date.
The Remuneration Committee also ensures that the performance of Group Management members and the President and CEO is evaluated once a year.
Meeting materials are prepared by the Company and distributed electronically over a secure network to Committee members approximately one week prior to each meeting.
All meetings are also attended by the Company’s SVP People & Organization and Communications, who keeps the minutes of the meetings. Other participants are invited, if relevant.
The minutes from Committee meetings are distributed elec-tronically over a secure network and made available to all Board members, not only to the members of the Committee. For more information on remuneration to Group Management, see Note 4.
AuditorsAt the 2014 AGM, following the Nomination Committee’s proposal, Ernst & Young AB was elected as auditor for the period from the AGM 2014 up until the end of the AGM 2018. The auditor-in-charge is Hamish Mabon, supported by Helene Siberg Wendin.
As per the AGM’s decision, the auditor’s fee until the 2015 AGM shall be paid on the basis of approved invoices. For more informa-tion see, Note 7.
Organization and Group Management in 2014Following the reorganization approved by the Board of Directors in May 2014, changes were in parallel gradually implemented in the organization during 2014, see “Organization and Executive Management in 2015” below. This section describes the organization of the Company during 2014.
February• Results of short-term incentive (STI)
program, STI 2013• Results of long-term incentive (LTI)
program, LTI 2011• Design and targets for LTI 2014 and
feedback and comments from major shareholders were discussed
• The Board’s proposal and information to the 2014 AGM
• Separation terms for a member of Group Management
• Remuneration for 2014 to the former President and CEO
September • Status update on STI 2014, LTI 2013
and LTI 2014• Proposed structure for STI and LTI
2015• Confirmation of approved compensa-
tion reviews for Group Management due to new organization, as well as compensation to the former President and CEO
November• Group Management remuneration for
2015• Status update on STI 2014, LTI 2013
and LTI 2014• STI 2015 targets for Group Manage-
ment• Structure for LTI 2015, (preparation for
AGM 2015)
Audit Committee Remuneration Committee
Report by the Board of Directors
Corporate Governance Report
Annual Report 2014 Husqvarna Group 55

The organization encompassed business units and Group staff functions. In addition, the heads of Brand & Marketing, Program Office – Accelerated Improvement Program and Business Develop-ment were direct reporting functions to the President and CEO.
Group Management comprised the President and CEO, the heads of the business units and the heads of the Group staff functions.
The President and CEO is appointed by the Board and is responsible for the ongoing management of the Company in accordance with the Board’s guidelines and instructions. These instructions include responsibility for financial reporting, preparation of information for decisions, and ensuring that commitments, agreements and other legal documents do not conflict with Swedish or foreign legislation or ordinances, including competition regulations. The President and CEO shall also ensure compliance with the Company’s goals, policies and strategic plans, as well as updating these when necessary. The President and CEO appoints all members of Group Management.
The heads of the business units were responsible for the revenues, costs and use of capital in their respective operations. Overall management of the business units was exercised through the quarterly meetings convened to review operations. In addition to the President and CEO, who directs these meetings, the CFO and the heads of the business units participate, along with relevant representatives from each unit.
Group staff functions were responsible for the coordination of general issues of importance to the Group, development of policies and guidelines, and support for the business units that apply them. The tasks of staff functions include consolidation and reporting of financial results, financing, treasury, tax, internal audit, internal control, IT, IR, legal matters, risk management and insurance, health and safety, environmental and sustainability issues, compliance, personnel issues, internal communication as well as external com-munication with media and the capital markets, brand & marketing, quality and business development.
Group Management held monthly meetings to review the previ-ous month’s results, update forecasts and plans, and discuss strate-gic issues. In addition, weekly meetings were held by telephone.
Organization and executive management in 2015Due to the revised strategy, which was approved by the Board of Directors in May 2014, the Company gradually introduced a revised organization for its operations during 2014, which is fully effective from January 1, 2015.
The new brand-driven organization necessitates a revised report-ing structure for its four divisions: Husqvarna, Gardena, Consumer Brands and Construction. These new divisions became effective on January 1, 2015. For further information on the new reporting structure, please see pages 41-43. During 2014, the Company con-tinued to report in accordance with its previously existing reporting structure based on the three business areas Europe/Asia Pacific, Americas and Construction, see pages 41-43.
In the new organization, Husqvarna’s executive management consists of the Executive Team and Group Management.
The Executive Team is comprised of the President and CEO, Group CFO, the four division Presidents, the SVP of People & Organization and Communications and the General Counsel (Head of Legal Affairs).
Group Management consists of the Executive Team members as well as the SVP of Business Development, the SVP of Group Opera-tions, the SVP of Technology Office, the SVP of Brand & Marketing and the VP of Program Office for the Accelerated Improvement Program.
Executive TeamThe Executive Team makes decisions on (i) enhancing Group synergies, (ii) internal financial and business follow-up, (iii) external financial reporting for Board approval, (iv) Group governance, (v) Group staffing plans, and (vi) issue resolution. Executive Team meetings are chaired by the President and CEO who has a casting vote. The Executive Team meets monthly by video and/or telephone and quarterly in person.
Group ManagementGroup Management is the management team for the Company and makes decisions on matters related to (i) the Group’s strategic and business development, (ii) budgets, (iii) external affairs, (iiii) board reporting, and (v) risk handling and mitigation as well as (vi) Group policies and guidelines. Group Management meetings are chaired by the President and CEO who has a casting vote. The Group Management meets monthly by video and/or telephone and quarterly in person.
President and CEOThe President and CEO is appointed by the Board and is respon-sible for the ongoing management of the company in accordance with the Board’s guidelines and instructions. These instructions include responsibility for financial reporting, preparation of informa-tion for decisions, and ensuring that commitments, agreements and other legal documents do not conflict with Swedish or foreign legislation or ordinances, including competition regulations. The President and CEO shall also ensure compliance with goals, policies and strategic plans, as well as updating these when necessary. The President and CEO appoints all members of Group Management.
The Staff functionsThe Group Staff functions comprise the functions headed by the Group CFO, the General Counsel and the Group’s SVP People & Organization and Communications.
Finance, IT & IRThe Finance, IT & IR function is headed by the Group CFO and is responsible for the Group’s financial reporting. The function is also responsible for Group IT and Investor Relations (IR), (including certain external communication). The Finance, IT & IR function sets and deploys the policies and rules for the Group’s financial, treasury, tax, internal audit and internal control activities. The function is also responsible for defining budget parameters for divisions and approving such budgets.
Legal AffairsThe Legal Affairs function is headed by the Group’s General Counsel and is responsible for the Group’s legal affairs. The function sets and deploys policies and rules for the Group’s legal compliance and activities. The Legal Affairs function is also, among other things, responsible for board meeting preparation, shareholders’ general meeting preparation and execution, corporate legal reporting, legal and ethical compliance reporting and investigations, Group sustain-ability strategies and processes and Group real estate strategy.
People & Organization and CommunicationsThe People & Organization and Communications function is headed by SVP People & Organization and Communications and is responsible for the Group’s human capital resources as well as corporate communications. This includes, among other things, people and organization management, monitoring and aligning
Report by the Board of Directors
Corporate Governance Report
Annual Report 2014 Husqvarna Group 56

compensation and benefit programs Group wide, Group talent management and Group communications (internal and external corporate communications).
The Group strategic functionsGroup strategic functions comprise Group Operations, the Technology Office, the Brand & Marketing function, Business Development function and the Program Office – Accelerated Improvement Program.
Group strategic functions are responsible for designing the strategic framework under which each part of the value chain operates in order for it to be optimal within the Group. The strategic framework includes the long-term vision within each function and Group instructions or guidelines. Group strategic functions are also responsible for ensuring that the divisions execute their business in line with such a framework. Group strategic functions are critical in driving innovation and creating a strong market position, as well as in ensuring synergies, consistency and best practice sharing.
Group OperationsThe Group Operations function is responsible for ensuring that the Group can capture operational synergies across the different divisions, while not contravening the Group’s overall strategic goals. In relation to the divisions, the SVP Group Operations shall provide the backbone of Group operational strategies, policies and rules, including deployment, as well as set the framework within which the divisions can maneuver.
Technology OfficeThe Group Technology Office leads the Group’s technology and innovation management. In addition, it develops the product commonality and compliance strategy for the Group, and is responsible for ensuring that the Group can capture product and technology synergies within and between the different divisions.
In relation to the divisions, it performs a role of providing the back-bone of Group product and technology investments, policies and rules, including deployment. The Technology Office shall ensure strategic alignment and cooperation within its area of responsibility to capture synergies to ensure long-term strategic goals.
Brand & MarketingThe Group Brand & Marketing function is responsible for managing the Group’s brand portfolio, brand positioning, brand- and customer insight, and business intelligence. This includes, among other things, being responsible for market analysis and customer insights, brand tracking, global end customer segmentation, research guidelines as well as research projects related to customer behavior and defining Group tools and methods to execute brand positioning. Group Brand & Marketing function is also responsible for capturing group marketing synergies as well as defining the Group’s licensing framework and approving licensing arrangements. It also governs the Group´s strategic sales agenda. The Group Brand & Marketing function also has responsibilities to develop strategic pricing practices in the Group by establishing pricing principles and guidelines and focusing on pricing overlap between divisions.
Business DevelopmentThe Business Development function is responsible for the Group strategy, acquisitions and divestments. This includes Group strategy development and periodical assessment of alignment between strategy, organization, initiatives and resources. The Group Business Development function shall also support the implementation of strategic initiatives, including supporting in Group wide communi-cation and supporting the divisions in their strategy development.
Program Office – Accelerated Improvement ProgramThe Program Office – Accelerated Improvement Program (“PO-AIP”) is responsible for following up on the Accelerated Improvement
Husqvarna DivisionPavel Hajman
Gardena DivisionSascha Menges
Consumer Brands DivisionAlan Shaw
Construction DivisionAnders Ströby
Group Operations
Valentin Dahlhaus
Kai Wärn, President and CEO
Finance, IT & IR
Ulf Liljedahl1
Legal Affairs
Olle Wallén
People & Organization and Communications
Per Ericson
Business Development
Pär Åström
Technology Office
Henric Andersson
Brand & Marketing
Sofia Axelsson
Program Office – AIP
Francesco Franzé
Group Management Structure
n = External reporting
n = To capture Group synergies
n = Executive Team
Report by the Board of Directors
Corporate Governance Report
1 Ulf Liljedahl left the Group in February, 2015 and is replaced by Jan Ytterberg on April 1, 2015.
Annual Report 2014 Husqvarna Group 57

Program (see pages 10-11) during years 2014-15. This includes implementing common metrics and providing a Group perspective on each division’s progress. The PO-AIP shall also coordinate cross-divisional processes and ensure compliance with the Group Accelerated Improvement Program.
DivisionsThe divisions consist of Husqvarna, Gardena, Consumer Brands and Construction. Each division President is responsible for the income statement and balance sheet for its division as well as any decisions affecting the division. All decisions made by a division shall be subject to the Group’s overall strategic goals, Group policies, processes, instructions and guidelines. For more information about the divisions please see pages 16-31.
Managing divisions, Group strategic functions and staff functions Each of the Group divisions, strategic functions and Group staff functions shall have management meetings on a monthly basis chaired by the division President/function head that cover both internal governance and governance by external requirements.
Roles and responsibilitiesClear roles and responsibilities apply for each of the Group strategic and staff functions and the functions within the divisions. These roles and responsibilities are in writing and changes can only be made by the decision of the Executive Team.
Husqvarna Group’s decision making structureIn the new organization, a Group governance structure has been implemented to ensure that decisions are made as close to operations as possible. Clear guidance has been provided to identify the level on which different types of decisions should be made. Changes to the governance structure can only be made by the decision of the Executive Team.
External informationHusqvarna’s Board has adopted an Information Policy that complies with the requirements for such a policy in the Nasdaq Stockholm Rule Book for Issuers. The policy applies to the Board and Group Management, and covers both written and oral information.
Financial information is regularly issued in the form of:• Interim Reports, published as press releases;• Annual Report;• Press releases concerning news and important issues;• Presentations and telephone conferences for financial analysts,
investors and media on the day of publication of the interim and year-end reports, and in connection with the publication of other important information;
• Presentations for financial analysts and investors in connection with Capital Market Days and Road Shows, etc.
All reports, presentations and press releases are published at the Group’s website, www.husqvarnagroup.com
Report by the Board of Directors
Corporate Governance Report
Description and evaluation of the Group’s internal control activities is based on the COSO framework (the Committee of Sponsoring Organizations of the Treadway Commission). The framework comprises five components; control environment, risk assessment, control activities, information and communication, and monitoring activities.
Control environment Internal control over financial reporting is based on the overall control environment. This involves clear definitions of organizational structure, decision-making paths and authority, which are communicated in the form of internal control documents such as policies, instructions and guidelines. The control environment also includes laws and other external regulations.
The Board of Directors is ultimately responsible for internal control over financial reporting. Efficient performance by the Board is thus the basis for satisfactory internal control. The Board has established rules of procedure and clear instructions for its work, which also include the activities of the Audit and Remuneration Committees.
The overall duty of the Audit Committee is to support the Board’s supervision of the auditing and reporting processes, and to ensure the quality of such reports and processes. The activities of the Audit Committee during the year are described in greater detail on page 55.
Responsibility for maintaining an effective control environment as well as the ongoing work on risk management and internal control over financial reporting is delegated to the President and CEO. This responsibility is in turn delegated to managers within their specific areas at various levels in the Company.
Responsibility and authority are defined in instructions to the President and CEO, regarding the right to sign for the Company, manuals, various policies, routines and codes. The Board approves certain Group policies and the Code of Conduct.
Group Management approves other policies and instructions, and divisions and Group staff functions issue guidelines and monitor implementation of all policies and instructions.
Group rules for accounting and reporting are stipulated in the accounting manual available to all personnel in finance and accounting.
Internal control documents are reviewed and updated regularly with reference to e.g. changes in legislation, accounting standards, procedures and listing requirements.
Risk assessment Risks of material misstatements in financial reporting may exist in relation to recognition and measurement of assets, liabilities, revenue and cost or insufficient disclosure and documentation. Items in the balance sheet and the income statement based on
Husqvarna Group’s process for internal control is designed to manage and minimize the risk of inaccuracy in financial reporting.
INTERNAL CONTROL OVER FINANCIAL REPORTING
Annual Report 2014 Husqvarna Group 58
Report by the Board of Directors
Corporate Governance Report
calls are logged and a summary of the calls and the actions taken is periodically disclosed to the Audit Committee and made available to the Board.
Monitoring activitiesHusqvarna Group maintains a comprehensive financial reporting system for the monitoring of operations, which enables identification of possible deviations in financial reporting.
Husqvarna Group applies IFRS. This is defined in the Accounting Manual, which includes rules for accounting and evaluation principles that are mandatory for all companies within the Group, as well as instructions for reporting. The manual is reviewed and updated quarterly.
Financial data is reported every month by approximately 120 reporting units, in accordance with the standardized routines for reporting that are stipulated in the Group’s accounting manual. These reports are the basis for the Group’s consolidated financial reporting. Consolidation is performed from both legal and operational perspectives, which generates quarterly legal reports, i.e. complete balance sheets and income statements for each company as well as consolidated, and monthly, operative reports. All consolidation is centralized. All financial reports are stored in a central database from which data is retrieved for analysis and monitoring at Group, business area and business unit level. Interim reports are posted on the website, www.husqvarnagroup.com
The Group Internal Audit function supports the development and improvement of internal control over financial reporting. Group Internal Audit establishes an annual audit plan that is approved by the Audit Committee. Internal Audit performs independent and objective audit engagements in order to evaluate and enhance the efficiency of internal controls, including internal control over financial reporting. The result of the audit engagements are presented to the Group’s CFO, the Group’s President and CEO, and the Audit Committee.
estimates, or generated by complex processes, are relatively more exposed to risk of error than other items. Major items, in this respect, include goodwill and other intangible assets, as well as provisions in captive insurance companies and pension provisions.
Each year the Group’s finance function performs a risk assessment regarding the Group’s balance sheet and income statement taking into consideration both qualitative and quantitative risks. The purpose of the risk assessment is to ensure that the internal control is satisfactory regarding financial reporting.
Control activities Control activities are designed to prevent, identify and correct errors and deviations in the financial reporting. Husqvarna Group has defined internal control standards, i.e. specifications of the control activities that shall be included in each business processes in order to ensure and maintain a uniform level of internal control over financial reporting within the Group. Control activities are integrated in processes for accounting and financial reporting, and include, among others, routines for authorization and signing for the Company, reconciliation of bank balances and accounts, analysis of results, segregation of duties, automatic controls integrated in IT-systems, and control of the basic IT environment. The Group maintains several control processes for financial reporting.
Husqvarna Group has in 2014 established a function for Internal Control. The objective of the Group Internal Control function is to provide support to the Group Management and the Manage-ment of the Divisions, enabling them to continuously provide solid and improved internal controls relating to financial reporting. The tasks performed by the Internal Control function aim to ensure compliance with policies, instructions and guidelines, and to create efficient conditions for specific control activities in key processes related to financial reporting. The Audit Committee is informed of the results of the work performed by the Internal Control function.
Each operative unit has a controller whose responsibilities include ensuring that the unit’s internal controls comply with Group standards, as well as compliance with Group guidelines and principles as stated in Husqvarna’s Accounting Manual. The controller is also responsible for ensuring that financial information is correct and complete and is delivered on time. Country Officers are appointed by Husqvarna Group in each country where the Group operates subsidiaries. The Officers’ duties include safeguarding the interests of the shareholders as well as identifying and reporting risks linked to fiscal regulations and other legislation.
Group Management performs monthly reviews of the results for the Group and for the operative units, as well as updated forecasts, plans and strategic issues.
Information and Communication Husqvarna Group maintains information and communication systems to facilitate correct and complete financial reporting. The accounting manual and other instructions for reporting are updated when necessary and are reviewed quarterly. In addition, other policies relevant to internal control over financial reporting can be accessed on the Group’s intranet by all relevant personnel. Changes in accounting routines are communicated and explained in quarterly newsletters from the Group accounting function.
The Group has a global whistle blower system. It enables em-ployees to contact an independent third party and report actions or events that involve violations, or suspected violations, of e.g. external laws and regulations or internal policies and guidelines. All
Annual Report 2014 Husqvarna Group 59

BOARD OF DIRECTORS AND AUDITORS
Annika ÖgrenEmployee representative
Born 1965. Representative of the Swedish Confederation of Trade Unions.
Holdings in Husqvarna: 0 shares.
Carita SpångbergDeputy employee representative
Born 1968. Representative of the Swedish Confederation of Trade Unions.
Holdings in Husqvarna: 0 shares.
Lotta WidehällDeputy employee representative
Born 1976, Representative of the Federation of Salaried Employees in Industry and Services.
Holdings in Husqvarna: 0 shares.
Ernst & Young AB is appointed auditors for a four-year period until the Annual General Meeting 2018.
Hamish MabonErnst & Young AB
Born 1965. Authorized Public Accountant.
Auditor in charge.
Other audit assignments include:
Vattenfall AB, AB Tetra Pak, Dustin Group AB and Apotek Hjärtat AB
Holdings in Husqvarna: 0 shares.
Helene Siberg WendinErnst & Young AB
Born 1965. Authorized public accountant.
Other audit assignments include:
Scania AB, Boliden AB, Lant-männen, IKEA Industry AB, Papyrus AB, Ovako AB
Holdings in Husqvarna: 0 shares.
Auditors
Lars WesterbergChairman
Born 1948. M. Sc. Eng., Royal Institute of Technology, Stockholm, Sweden, BBA, Stockholm University, Sweden. Elected 2006. Member of the Remuneration Committee.
Other major assignments: Board member of AB Volvo, Meda AB, Sandvik AB, SSAB and Stena AB.
Previous positions: President and CEO and Board Member of Autoliv Inc. 1999–2011. President and CEO of Gränges AB 1994–1999. President and CEO of Esab AB 1991–1994.
Holdings in Husqvarna: 270,000 B-shares.
Kai WärnBoard member
Born 1959. M.Sc. in Mechanical Engineering, the Royal Institute of Technology, Stockholm, Sweden. Elected 2014. President and CEO of Husqvarna AB.
Previous positions: Operations part-ner at IK Investment Partners Norden AB 2011–2013. President and CEO of Seco Tools AB 2004–2010. Various positions at ABB 1985–2004.
Holdings in Husqvarna: 30,570 B-shares (Own), 100,000 B-shares (Legal person).
Magdalena Gerger Board member
Born 1964. M. Econ., and MBA, Stock-holm School of Economics, Sweden. Elected 2010. President of System-bolaget AB.
Other major assignments: Board member of Investor AB and IFN (the Research Institute of Industrial Econo-mics). Member of IVA (Royal Academy of Engineering Sciences) and the Swedish Trade Federation.
Previous positions: Senior Vice President and responsible for Marke-ting & Innovation in the Nordic region, Arla Foods 2005–2009. Management consultant, Futoria AB 2004. Category Director (U.K. and Ireland) Nestlé U.K. Ltd 2000–2003, ICI Paints 1998–2000 and in Procter & Gamble 1996–1997.
Holdings in Husqvarna: 3,100 A-shares.
Tom JohnstoneBoard member
Born 1955. M.A., University of Glasgow, Scotland, Hon. Doc. in B.A., University of South Carolina, U.S. Hon. Doc. In Science, Cranfield University, U.K. Elected 2006. Chairman of the Remuneration Committee.
Other major assignments: Board member of Investor AB and AB SKF.
Previous positions: President and CEO of AB SKF 2003-2014. Executive Vice President of AB SKF 1999–2003. Presi-dent Automotive Division 1995–2003. Senior management positions within AB SKF since 1987.
Holdings in Husqvarna: 990 A-shares, 4,800 B-shares.
Ulla LitzénBoard member
Born 1956. M. Sc., Stockholm School of Economics, Sweden and MBA, Massachusetts Institute of Technology, U.S. Elected 2010. Chairman of the Audit Committee.
Other major assignments: Board mem-ber of Atlas Copco AB, AB SKF, Boliden AB, Alfa Laval AB and NCC AB.
Previous positions: President of W Capital Management AB 2001–2005. Senior management positions and member of the Management Group, Investor AB 1996–2001. Managing Director, responsible for Core Holdings 1999–2000. President of Investor Scan-dinavia AB 1996–1998.
Holdings in Husqvarna: 10,000 B-shares.
David LumleyBoard member
Born 1954. B.A in Communications/Marketing, Western Illinois University, Macomb, Illinois, U.S.; MSJ Journalism, Northwestern University Medill School of Journalism, Evanston, Illinois, U.S. and an MBA, Northwestern Univer-sity Kellogg School of Management, Evanston, Illinois, U.S. Elected 2014. President and CEO of Spectrum Brands, Middleton, Wisconsin, U.S.
Other major assignments: Board member of Spectrum Brands.
Previous positions: President Rubbermaid Home Products, Newell-Rubbermaid Inc., Atlanta, Georgia, U.S. President and CEO, EAS Inc., Golden, Colorado, U.S. President Brunswick Bicycles, Brunswick Corp., Lake Forest, Illinois, U.S. President OMC International and Senior Vice President Marine Power Group, Outboard Marine Corp., Waukegan, Illinois, U.S. General Manager Wilson Sporting Goods Co., Chicago, Illinois, U.S.
Holdings in Husqvarna: 6,252 B-shares.
Katarina MartinsonBoard member
Born 1981. M. Sc., Stockholm School of Economics, Sweden. Elected 2012. Member of the Audit Committee. Port-folio management for the Lundberg Family.
Other major assignments: Board member of L E Lundbergföretagen AB, Fastighets AB L E Lundberg, Karlsson & Wingesjö AB, Lundbergs Kapitalför-valtning, Fidelio Capital AB, AniCura AB, Bellbox/Lyko AB and Picadeli AB .
Previous positions: Analyst at Han-delsbanken Capital Markets 2008, Vice President at Strategas Research Part-ners LLC, New York, U.S. 2006–2008, investment research at ISI, Internatio-nal Strategy & Investment Group, New York 2005–2006.
Holdings in Husqvarna: 113,478 A-shares, 378,737 B-shares.
Daniel NodhällBoard member
Born 1978. M.Sc., Stockholm School of Economics, Sweden. Elected 2013. Member of the Audit Committee. Investment Manager and Head of Capital Goods at Investor AB.
Previous positions: Analyst focused on the engineering sector at Investor AB since 2002.
Holdings in Husqvarna: 5,000 B-shares.
Lars PetterssonBoard member
Born 1954. M. Sc. in Applied Physics, Materials Technology, Uppsala University, Sweden. Elected 2014. Member of the Remuneration Committee
Other major assignments: Board Chairman of KP-Komponenter A/S. Board member of Indutrade AB, LKAB, L E Lundbergföretagen AB, Uppsala University, PMC Group AB and the Swedish Corporate Governance Board.
Previous positions: President and CEO of AB Sandvik 2002–2011 and various positions within AB Sandvik 1978–2002.
Holdings in Husqvarna: 0 shares.
All holdings in Husqvarna AB shares are as of December 31, 2014.
Report by the Board of Directors
Corporate Governance Report
Soili JohanssonEmployee representative
Born 1962. Representative of the Federation of Salaried Employees in Industry and Services.
Holdings in Husqvarna: 225 A-shares,
750 B-shares.
Annual Report 2014 Husqvarna Group 60

Lars Westerberg
David Lumley
Magdalena Gerger
Katarina MartinsonTom Johnstone
Daniel Nodhäll
Ulla Litzén
Lars Pettersson
Kai Wärn
Soili Johansson Carita SpångbergAnnika Ögren Lotta Widehäll
Employee representatives
Board of Directors
Report by the Board of Directors
Corporate Governance Report
Annual Report 2014 Husqvarna Group 61

GROUP MANAGEMENT 1
Kai WärnPresident and CEO
Born 1959. M.Sc. in Mechanical Engineering, the Royal Institute of Technology, Stockholm, Sweden. Employed and member of Group Management since 2013.
Previous positions: Operations partner at IK Investment Partners Norden AB 2011–2013. President and CEO of Seco Tools AB 2004–2010. Various positions at ABB 1985–2004.
Holdings in Husqvarna: 30,570 B-shares (Own), 100,000 B-shares (Legal person).
Henric AnderssonSenior Vice President, Technology Office
Born 1973. M. Sc. in Industrial Engi-neering & Management, Linköping Institute of Technology, Sweden. Employed 1997 and member of Group Management since 2012.
Previous positions: Executive Vice President, Head of Product Manage-ment & Develpment, 2011–2014. Vice President Construction Equipment, Husqvarna 2008–2011. Vice President Commercial Lawn & Garden and Presi-dent Husqvarna Turf Care 2004–2008. Vice President Riders & Robotic Mowers 2002–2004. Several leadership positions in product & business mana-gement, Husqvarna 1997–2001
Holdings in Husqvarna: 11,116 B-shares.
Sofia AxelssonSenior Vice President, Brand & Marketing
Born 1973. M.Sc. in Public finance and accounting/Business administra-tion, Gothenburg University, Sweden. Employed 2011 and member of Group Management from 2015.
Previous positions: Vice President Brand Management and Global Marketing 2011–2014. CEO Diplomat-dörrar and Snickarper /Inwido Group 2007–2011. Global Marketing Director Husqvarna, Pfaff, Singer 2006–2007. Various positions within Brand & Marketing in Husqvarna/Pfaff Sewing machines 1998–2005.
Holdings in Husqvarna: 5,098 B-shares.
Valentin DahlhausSenior Vice President, Group Operations
Born 1973. MBA, Freie Universität, Berlin, Germany. Employed 2010 and member of Group Management from 2015.
Previous positions: VP Demand and Supply Chain Management, Husqvarna Group, 2013-2014. Supply Chain development/PO, Husqvarna Group, 2011–2013. Demand and Supply Chain development, Husqvarna Group, 2010–2011. Arcan-dor AG (Primondo GmbH), Nürnberg/Fürth, 2007–2010. Continental AG, Hannover, 2004–2007.
Holdings in Husqvarna: 0 shares.
Per EricsonSenior Vice President, Group Staff People & Organization and Communications
Born 1963. Forest Engineer, U.S. Forestry Studies. Studies in Change Management in Organization and Social Systems. Employed and member of Group Management since 2011.
Previous positions: Executive Vice President Human Resources, Haldex 2006–2011. Various executive posi-tions, most recently as Executive Vice President Human Resources, Stora Enso 1987–2006.
Holdings in Husqvarna: 14,804 B-shares.
Francesco FranzéVice President, Program Office – Accelerated Improvement Program and Quality
Born 1964. M.Sc. in Mechanical Engineering, the Royal Institute of Technology, Stockholm, Sweden. Employed 1989 and member of Group Management from 2015.
Previous positions: VC and Manage-ment consultancy, own enterprise, 2009-2013. Head of Electric Category, Husqvarna Group, 2004–2008. Senior VP Industrial Operations Dishwashers, Electrolux 1998–2003. Various posi-tions within Operations in Electrolux Professional, 1989–1999.
Holdings in Husqvarna: 15,643 B-shares.
Pavel HajmanPresident, Husqvarna Division
Born 1965. M.Sc. in Industrial Engine-ering and Management, Linköping Institute of Technology, Sweden. Employed 2014 and member of Group Management since 2014.
Previous positions: Executive Vice President, Head of Asia/Pacific, 2014. President Assa Abloy AHG Greater China 2013–2014. Numerous senior management positions in Seco Tools 1990–2013, President Asia Pacific, Senior Vice President Group Business Development, Regional Director CEE.
Holdings in Husqvarna: 4,182 B-shares.
Ulf Liljedahl2
Senior Vice President, CFO, Group Staff Finance, IT & IR
Born 1965. B.Sc. in Business Administration and Economics, Lund University, Sweden. University of Pennsylvania – The Wharton School (Advanced Management Program), U.S. Employed and member of Group Management since 2011.
Previous positions: Executive Vice President and CFO, Cardo Group 2007–2011. Various positions within Finance at Alfa Laval 1992–2007.
Holdings in Husqvarna: 21,495 B-shares.
Sascha MengesPresident, Gardena Division
Born 1971. M.Sc. in Ind. Engineering & Management, Swiss Federal Institute of Technology, Zurich, Switzerland. MBA, INSEAD, France. Employed 2004 and member of Group Management since 2011.
Previous positions: Executive Vice President, Head of Manufacturing & Logistics 2011–2014. Various leadership positions in Supply Chain Management and Operations, Husqvarna 2007–2011. Vice President Supply Chain Management, Gardena AG 2004–2007. Associate Principal Management Consulting, McKinsey & Company, Inc 1996–2004.
Holdings in Husqvarna: 39,025 B-shares.
Alan ShawPresident, Consumer Brands Division
Born 1963. MBA, Indiana Univer-sity and BS, University of Idaho, U.S. Employed and member of Group Management since 2013.
Previous positions: Exectice Vice President, Head of Americas, 2013–2014. President and CEO, Char-Broil LLC, US 2005–2013. Presi-dent and CEO, Murray Group, U.S., 2003–2005. Various positions within Whirlpool Corporation 1987–2003.
Holdings in Husqvarna: 15,763 B-shares.
Anders StröbyPresident, Construction Division
Born 1953. M. Sc. Eng., Royal Institute of Technology, Stockholm, Sweden. Employed 1980 and member of Group Management since 2006.
Previous positions: Executive Vice President, Head of Construction, 2002–2014. Head of Garden Equip-ment and Construction Products, Electrolux 1996–2002.
Holdings in Husqvarna: 9,198 A-shares, 101,940 B-shares.
Olle WallénSenior Vice President, Group Staff Legal Affairs, Husqvarna Board Sectretary
Born 1953. M. of Law, Stockholm University, Sweden. Employed 1993 and member of Group Management since 2006.
Other major assignments: Advisory Board Member, FM Global Europe
Previous positions: General Counsel, Electrolux Europe 2002–2005. General Counsel, Electrolux North America 2000–2001.
Holdings in Husqvarna: 4,842 A-shares, 35,364 B-shares.
Pär ÅströmSenior Vice President, Business Development
Born 1972. M. Sc. in Industrial Engine-ering & Management, Royal Institute of Technology, Stockholm, Sweden. Employed 2013 and member of Group Management from 2015.
Previous positions: Vice President Business Development, Husqvarna Group, 2013–2014. Principal, A.T. Kearney Management Consultants, 2007–2013. Management Consulting 1998–2009.
Holdings in Husqvarna: 10,241 B-shares.
1) During 2014 the Group Management also included the following members; Martin Austermann and Frida Norrbom Sams.2) Ulf Liljedahl left the Group as of end of February, 2015. He is replaced by Jan Ytterberg who will start April 1, 2015.
All holdings in Husqvarna AB shares are as of December 31, 2014.
Report by the Board of Directors
Corporate Governance Report
Annual Report 2014 Husqvarna Group 62

Group Management as of January 1, 2015
Kai Wärn
Anders Ströby
Henric Andersson
Sascha Menges Alan Shaw
Sofia Axelsson
Olle Wallén
Francesco Franzé
Ulf Liljedahl
Valentin Dahlhaus
Pär Åström
Per Ericson Pavel Hajman
Report by the Board of Directors
Corporate Governance Report
Annual Report 2014 Husqvarna Group 63

The Annual General Meeting of Husqvarna AB (publ) will be held at 4 pm on Tuesday April 21, 2015, at the Culture Center Spira, the Concert Hall, Kulturgatan 3, Jönköping, Sweden.
ParticipationShareholders who intend to participate in the AGM must:• Be registered in the share register kept by Euroclear Sweden AB
on Wednesday April 15, 2015.• Give notice of intent to participate, thereby stating the number of
assistants attending, to Husqvarna no later than Wednesday April 15, 2015.
Notice of participationNotice of intent to participate can be given:• By mail to Husqvarna AB, c/o Euroclear Sweden AB, P.O. Box 191,
SE-101 23 Stockholm, Sweden.• By telephone at +46 36 14 70 10 between 9 am and 4 pm
weekdays.• At www.husqvarnagroup.com/agm
Notice should include the shareholder’s name, personal or company registration number, if any, address and telephone number. Information provided together with the notice will be made subject to data processing and will be used solely for the AGM 2015. Shareholders may vote by proxy, in which case a power of attorney should be submitted to Husqvarna prior to the AGM.
Shares registered by nomineesShareholders, whose shares are registered in the names of nominees, must have their shares temporarily registered in their own name on Wednesday April 15, 2015, in order to participate in the AGM. To ensure that such registration is made prior to Wednesday April 15, 2015 shareholders must inform the nominee well in advance of that date.
DividendThe Board of Directors has proposed a dividend for the financial year 2014 in the aggregate amount of SEK 1.65 per share, to be paid in two parts consisting of a dividend payment of SEK 0.55 per share for which Thursday, April 23, 2015 shall be the record day, and a dividend payment of SEK 1.10 per share for which Friday, October 23, 2015 shall be the record day. If the Annual General Meeting resolves in accordance with the Board of Directors’ proposal, the estimated date for payment of the dividend from Euroclear Sweden AB is Tuesday April 28, 2015 for the first part of the dividend and Wednesday, October 28, 2015 for the second part of the dividend.
The last day for trading in Husqvarna shares with right to the first part of the dividend is Tuesday, April 21, 2015 and with right to the second part of the dividend, Wednesday, October 21, 2015.
ANNUAL GENERAL MEETING 2015
Financial information 2015
April 21 Annual General Meeting
April 21 Interim report Jan–March
July 17 Interim report Jan–June
October 21 Interim report Jan–Sep
Report by the Board of Directors
Corporate Governance Report
Annual Report 2014 Husqvarna Group 64

Financial Statements – Group
Group Income Statement
Financial Statements – Group
SEKm Note 2014 2013
Net sales 3 32,838 30,307
Cost of goods sold 5 –23,478 –22,288
Gross income 9,360 8,019
Selling expenses 5 –5,626 –5,148
Administrative expenses 5 –1,392 –1,260
Other operating income 6 18 2
Other operating expenses 5, 6 -2 –5
Impairment of goodwill 5, 14 –767 –
Operating income 4, 7, 8, 9 1,591 1,608
Financial income 10 76 25
Financial expenses 10 –401 –453
Financial items, net –325 –428
Income after financial items 1,266 1,180
Income tax 11 –435 –264
Income for the period 831 916
Income for the period attributable to:
Equity holders of the Parent Company 827 914
Non-controlling interests 4 2
831 916
Earnings per share
Before dilution, SEK 12 1.44 1.60
After dilution, SEK 12 1.44 1.60
Average number of shares outstanding
Before dilution, million 12 572.8 572.6
After dilution, million 12 573.1 572.8
Annual Report 2014 Husqvarna Group 65

Financial Statements – Group
Group Comprehensive Income Statement
SEKm Note 2014 2013
Income for the period 831 916
Other comprehensive income
Items that will not be reclassified to the income statementRemeasurements on defined benefit pension plans, net of tax –377 148
Total items that will not be reclassified to the income statement, net of tax –377 148
Items that may be reclassified to income statementExchange rate differences on translating foreign operations
Currency translation difference 18 1,762 163
Net investment hedge, net of tax 18 –721 –
Cash flow hedges
Result arising during the period, net of tax 18 98 –14
Reclassification adjustments to the income statement, net of tax 18 34 18
Total items that may be reclassified to income statement, net of tax 1,173 167
Other comprehensive income, net of tax 796 315
Total comprehensive income for the period 1,627 1,231
Total comprehensive income attributable to:
Equity holders of the Parent Company 1,621 1,231
Non-controlling interests 6 0
1,627 1,231
Annual Report 2014 Husqvarna Group 66

Financial Statements – Group
Group Balance Sheet
SEKm Note Dec 31, 2014 Dec 31, 2013
Assets
Non-current assetsProperty, plant and equipment 9, 13 4,463 3,609
Goodwill 14 5,520 5,713
Other intangible assets 14 4,001 3,839
Derivatives 19 0 –
Other financial assets 15 102 84
Deferred tax assets 11 1,585 1,122
Total non-current assets 15,671 14,367
Current assetsInventories 16 7,954 7,087
Trade receivables 19 2,898 2,816
Derivatives 19 526 273
Tax receivables 51 69
Other current assets 17 665 539
Other short-term investments 19 0 17
Cash and cash equivalents 19 1,579 1,594
Total current assets 13,673 12,395
Total assets 29,344 26,762
Equity and liabilities
Equity attributable to equity holders of the Parent CompanyShare capital 18 1,153 1,153
Other paid-in capital 2,605 2,605
Other reserves 18 –63 –1,234
Retained earnings 8,455 8,848
Total equity attributable to equity holders of the Parent Company 12,150 11,372Non-controlling interests 20 18
Total equity 12,170 11,390
Non-current liabilitiesBorrowings 19 5,598 6,408
Deferred tax liabilities 11 1,492 1,203
Provisions for pensions and other post-employment benefits 20 1,835 1,253
Derivatives 19 30 13
Other provisions 21 848 796
Total non-current liabilities 9,803 9,673
Current liabilitiesTrade payables 19 3,154 2,838
Tax liabilities 136 96
Other liabilities 22 1,995 1,633
Borrowings 19 1,154 643
Derivatives 19 722 226
Other provisions 21 210 263
Total current liabilities 7,371 5,699
Total equity and liabilities 29,344 26,762
Annual Report 2014 Husqvarna Group 67

Financial Statements – Group
Group Cash Flow Statement
SEKm Note 2014 2013
Cash flow from operations
Operating income 1,591 1,608
Non cash itemsDepreciation/amortization and impairment 1,734 978
Capital gains and losses –4 3
Other non cash items –113 135
Cash itemsPaid restructuring expenses –96 –134
Net financial items, received/paid –820 –420
Taxes paid –231 –394
Cash flow from operations, excluding change in operating assets and liabilities 2,061 1,776
Change in operating assets and liabilities
Change in inventories –70 820
Change in trade receivables 137 73
Change in trade payables –10 168
Change in other operating assets/liabilities 136 55
Cash flow from operating assets and liabilities 193 1,116
Cash flow from operations 2,254 2,892
Investments
Acquisition of assets/subsidiaries –26 –
Divestment of shares in subsidiaries – 8
Investments in property, plant and equipment 13 –1,131 –796
Investments in intangible assets 14 –255 –282
Sale of property, plant and equipment and intangible assets 0 0
Other 0 –1
Cash flow from investments –1,412 –1,071
Cash flow from operations and investments 842 1,821
Financing
Change in short-term investments 16 370
Change in current borrowings 514 –516
Amortizations of non-current borrowings –1,135 –950
New non-current borrowings 425 850
Transfer of treasury shares 5 –
Dividend paid to shareholders –859 –859
Dividend paid to non-controlling interests –4 –3
Cash flow from financing –1,038 –1,108
Total cash flow –196 713Cash and cash equivalents at beginning of year 1,594 920
Exchange rate differences referring to cash and cash equivalents 181 –39
Cash and cash equivalents at year-end 1,579 1,594
Effective January 1, 2014, Husqvarna has changed the format of the Group’s cash flow statement. The adjustment has not affected the cash flow from operations, only changes to the layout within this subtotal. The comparative period has been adjusted.
Annual Report 2014 Husqvarna Group 68

Financial Statements – Group
Attributable to equity holders of the Parent Company
SEKm Share capital
Otherpaid-in capital
Otherreserves
(Note 18)Retained earnings Total
Non-controlling
interestsTotal
equity
Opening balance Jan 1, 2013 1,153 2,605 –1,403 8,632 10,987 21 11,008Income for the period – – – 914 914 2 916
Other comprehensive income – – 169 148 317 –2 315
Total comprehensive income – – 169 1,062 1,231 0 1,231Transactions with owners
Share-based payment – – – 13 13 – 13
Dividend to non-controlling interests – – – – – –3 –3
Dividend SEK 1.50 per share – – – –859 –859 – –859
Closing balance Dec 31, 2013 1,153 2,605 –1,234 8,848 11,372 18 11,390Income for the period – – – 827 827 4 831
Other comprehensive income – – 1,171 –377 794 2 796
Total comprehensive income – – 1,171 450 1,621 6 1,627Transactions with owners
Share-based payment – – – 11 11 – 11
Transfer of treasury shares1 – – – 5 5 – 5
Dividend to non-controlling interests – – – – – –4 –4
Dividend SEK 1.50 per share – – – –859 –859 – –859
Closing balance Dec 31, 2014 1,153 2,605 –63 8,455 12,150 20 12,170
1 Options exercised related to 2009 LTI-program
Group Statement of Changes in Equity
Annual Report 2014 Husqvarna Group 69

Financial Statements – Group
Notes
NOTE 1 Accounting principles
BASIS OF PREPARATIONThe consolidated financial statements of Husqvarna AB (publ) have been prepared in accordance with International Financial Reporting Standards (IFRS) and IFRIC interpretations as adopted by the European Union. Entities within Husqvarna apply uniform accounting principles as defined in the Husqvarna Accounting Manual. The policies set out below have been consistently applied to all years presented, unless otherwise stated. In addition, Swedish Annual Accounts Act and RFR 1, Supplementary Rules for Groups, have been applied. The consolidated financial statements have been prepared under the historical cost convention except for financial assets and liabilities at fair value through profit or loss (derivative instruments).
The preparation of financial statements in conformity with IFRS requires the use of certain critical accounting estimates. It also requires manage-ment to exercise its judgement in the process of applying the Group’s accounting policies. The areas involving a higher degree of judgement or complexity, or areas where assumptions and estimates are significant to the consolidated financial statements are disclosed in note 2.
CHANGES IN ACCOUNTING PRINCIPLES AND DISCLOSURESNew and amended standards adopted by Husqvarna Group 2014Husqvarna Group has adopted the following new and amended standards as of January 1, 2014.
IFRS 10, “Consolidated financial statements” builds on existing principles by identifying the concept of control as the determining factor in whether an entity shall be included within the consolidated financial reports of the Parent Company. The Group’s assessment is that this standard did not have an impact on the consolidated financial statement.
IFRS 12, “Disclosures of interests in other entities” includes the disclosure requirements for all forms of interest in other entities. The Group’s assessment is that this standard did not have an impact on the consolidated financial statement.
IFRIC 21, “Levies”, sets out the accounting for an obligation to pay a levy that is not income tax. The interpretation addresses what the obligating event is that gives rise to pay a levy and when a liability should be recognized. The Group is not currently subjected to significant levies so the impact on the Group is not material.
New standards and amendments from 2015 and forwardA number of new standards and amendments to standards and interpretations are effective for annual periods beginning after December 31, 2014, and have not been applied in preparing these consolidated financial statements.
IFRS 9 “Financial instruments” addresses the classification, measure-ment and recognition of financial assets and financial liabilities. IFRS 9 will replace the guidance in IAS 39 that relates to the classification and measurement of financial instruments. IFRS 9 requires financial assets to be classified into three primary measurement categories: amortized cost, fair value through other comprehensive income and fair value through profit or loss. The determination is made at initial recognition. For financial liabilities, the standard retains most of the IAS 39 requirements. IFRS 9 relaxes the requirements for hedge effectiveness by replacing the hedge effectiveness test. It requires an economic relationship between the hedged item and hedging instrument and for the hedged ratio to be the same as the one management actually use for risk management purposes. Contemporaneous documentation is still required but is different to that currently prepared under IAS 39. The standard is effective for accounting periods beginning on or after January 1, 2018, provided EU approval. The Group is yet to assess IFRS 9’s full impact.
IFRS 15 “Revenue from contracts with customers” deals with revenue recognition and establishes principles for reporting useful information to users of financial statements about the nature, amount, timing and uncertainty of revenue and cash flows arising from an entity’s contracts with customers. Revenue is recognized when a customer obtains control of a good or service and thus has the ability to direct and use and obtain the benefits from the good or service. The standard replaces IAS 18 “Revenue” and IAS 11 “Construction contracts” and related interpretations. The standard is effective for annual periods beginning on or after January 1, 2017, provided EU approval. The Group is assessing the impact of IFRS 15.
There are no other IFRS or IFRIC interpretations that are not yet effective that are expected to have a material impact on the Group.
ACCOUNTING AND VALUATION PRINCIPLESPrinciples applied for consolidationSubsidiariesThe financial statements include Husqvarna AB and all companies (subsidiaries) which the Parent Company controls. Husqvarna controls an entity when the Group is exposed to, or has rights to variable returns from its involvement with the entity and has the ability to affect those returns through the power over the entity. Husqvarna generally controls a company by a shareholding of more than 50 percent of the voting rights referring to all shares and participations. Subsidiaries are fully consolidated from the date on which control is transferred to the Group. They are deconsolidated from the date control ceases.
Husqvarna applies the acquisition method to account for business combinations, whereby the assets, liabilities and contingent liabilities in a subsidiary on the date of acquisition are valued at fair value to determine the acquisition value to the Group. The valuation includes evaluation of any contingent consideration which is recognized at fair value at the acquisition date. All subsequent changes in the contingent consideration are r ecog-nized in the income statement. Transaction costs related to the business combination are expensed as they are incurred. If the consideration paid for the business combination exceeds the fair value of the identifiable assets, liabilities and contingent liabilities, the difference is recognized as goodwill. If the fair value of the acquired net assets exceeds the consid-eration paid for the business combination, as in a bargain purchase, the difference is recognized directly in the income statement. The consolidated income statement for the Group includes the income statements for the Parent Company and its directly and indirectly owned subsidiaries after:• elimination of intercompany transactions, balances and unrealized
intercompany profits in stock, and • depreciation and amortization of acquired surplus values.
At year-end 2014, the Group comprised 121 operating units, and 89 legal entities.
Transactions with non-controlling interests Transactions with non-controlling interests that do not result in loss of control are accounted for as equity transactions, that is , as transactions with the equity holders. Acquisitions from non-controlling interests result in an adjustment to equity, corresponding to the difference between the consideration paid and the carrying value of the non-controlling interest. Gains or losses on disposals to non-controlling interests are reported in equity. Disposals to non-controlling interests which result in loss of control are recorded as gains and losses in the income statement.
Associated companies Associates are companies over which Husqvarna has significant influence but not control, generally accompanied by a shareholding of between 20 percent and 50 percent of the voting rights. Investments in associated companies have been reported according to the equity method. Husqvarna’s share of income after tax in an associated company is reported in the income statement. Husqvarna’s investments in associates are of operational nature and the result is reported as part of operating income.
Foreign currency translations Foreign currency transactions are translated into the functional currency using the exchange rates prevailing at the dates of the transactions. The financial statements are presented in Swedish kronor, SEK, which is the Parent Company’s functional currency and the presentation currency of Husqvarna Group.
Exchange rate gains or -losses that occur from transactions in foreign currency and in translation of monetary assets or liabilities to the exchange rate at balance sheet date are reported in the income statement. An exception to this accounting treatment is if the transaction qualifies as cash flow hedges or hedge of net investments of which the exchange gains or -losses are recognized in other comprehensive income.
Exchange rate gains and losses that relate to borrowing costs or liquid assets are accounted for in the income statement within the finance net. Other foreign exchange rate differences are accounted for in the operating income.
Income statement and all balance sheet items of foreign subsidiaries have been translated into SEK at year-end rates except for the net result which is translated at average rate for each month respectively. Income statements have been translated at average rates for each month respectively. All exchange rate differences that occur from the transla-
Annual Report 2014 Husqvarna Group 70

Financial Statements – Group
Notes
tion are accounted for in other comprehensive income. When a foreign operation is divested, exchange differences that were recorded in equity are recognized in the income statement as part of the gain or loss on sale.
Goodwill and fair value adjustments arising on the acquisition of a foreign entity are treated as assets and liabilities of the foreign entity and translated at the closing rate.
Segment reporting Husqvarna’s operating segments are reported in a manner consistent with the internal reporting provided to the President and CEO (Husqvarna’s Chief operating decision maker) as a basis for evaluating the performance and for decision on how to allocate resources to the segments. Husqvarna comprises three segments (business areas): Europe & Asia/Pacific, Americas and Construction.
For a more detailed description of the segments, see note 3.
Property, plant and equipmentProperty, plant and equipment are reported at historical cost less accumulated depreciation, adjusted for any impairment charges. Historical cost includes expenditure that is directly attributable to the acquisition of the assets. Subsequent costs are included in the asset’s carrying amount only when it is probable that future economic benefits associated with the item will flow to the Group and the cost of the item can be measured reliably. The carrying amount of the replaced part is derecognized. All other repairs and maintenance costs are charged to the income statement during the period in which they are incurred. Land is not depreciated as it is considered to have an unlimited useful life. Depreciation is based on the following estimated useful lives: Buildings and land improvements 10–40 yearsPlant and machinery 3–15 yearsOther equipment 3–10 years
The Group assesses the estimated useful lives as well as whether there is any indication that any of the company’s fixed assets are impaired at the end of each reporting period.
Borrowing costs Borrowing costs directly attributable to the acquisition, construction or production of qualifying assets are added to the costs of those assets. Qualifying assets are assets that take a substantial period of time to get ready for their intended use or sale. All other borrowing costs are recognized as an expense in the period in which they are incurred.
Intangible assetsGoodwillGoodwill arises from the acquisition of subsidiaries and represents the excess between the purchase price and the net fair value of the identifiable assets, liabilities and contingent liabilities of the acquiree. Goodwill is reported as an intangible asset with indefinite useful life and measured at cost less accumulated impairment losses.
For the purpose of impairment testing, goodwill acquired in a business combination is allocated to each of the cash generating units that is expected to benefit from the synergies of the combination.
The value of goodwill is continuously monitored, and is tested annually for impairment or more regularly if there is an indication that the asset might be impaired. Any impairment is recognized immediately as an expense and is not subsequently reversed.
BrandsBrands that have been acquired separately are shown at historical cost. Brands that have been acquired through business combination are recognized at fair value at the acquisition date. All brands with finite useful lives are amortized on a straight-line basis during the useful life, estimated at 10 years. Brands are carried at cost less accumulated amortization and accumulated impairment. The brand Gardena is reported as an intangible asset with indefinite useful life. No other brands are identified as having indefinite useful lives.
Product development expensesHusqvarna capitalizes certain development expenses for new products provided that the level of certainty as to their future economic benefits and useful lives are high. An intangible asset is only recognized to the degree that the product is sellable on existing markets and that resources exist to complete the development. Only expenditure, which is directly attributable to the new product’s development, is recognized. Capitalized
development costs are amortized over their useful lives, ranging between 3 to 5 years. The assets are tested for impairment annually or when there is an indication that the intangible asset may be impaired.
Other intangible assetsOther intangible assets include computer software, patents, licenses and customer relations.
Computer software, patents and licenses are recognized at acquisition cost and are amortized on a straight-line basis over their estimated useful lives. Computer software has an estimated useful life of 3–6 years and patents and licenses have a useful life of 10–13 years.
Customer relations are capitalized at fair value in connection with business combinations. The values of these customer relationships are amortized over their useful lives of 5–12 years.
Impairment of non-financial assetsAssets that have an indefinite useful life (goodwill and the brand Gardena) or intangible assets not ready for use are not subject to amortization but tested annually for impairment, or more often if there is an indication of impairment. Assets that are subject to amortisation are reviewed for impairment whenever events or changes in circumstances indicate that the carrying amount may not be recoverable. If there is an indication of impairment the Group estimates the recoverable amount of the asset. The recoverable amount is the higher of an asset’s fair value less cost to sell and value in use. An impairment loss is recognized by the amount by which the net book value of an asset exceeds its recoverable amount. For the purposes of assessing impairment, assets are grouped in cash generating units, which are the smallest identifiable group of assets generating cash inflows that are substantially independent of the cash inflows from other assets or group of assets. The Group’s cash generating units are Europe & Asia/Pacific, Americas and Construction during 2014 but will be Husqvarna, Gardena, Consumer brands and Construction from January 1, 2015. Refer to note 2 and note 14 regarding impairment of intangible assets with indefinite useful life.
Financial instrumentsClassification of financial instrumentsHusqvarna classifies its financial instruments in the following categories: • Financial assets or liabilities at fair value through profit or loss• Loans and receivables• Other financial liabilities
The classification is determined at initial recognition and is thereafter reviewed at each reporting date.
Financial assets or liabilities at fair value through profit or loss Financial assets at fair value through profit or loss are financial assets held for trading. Derivatives are categorized as held for trading unless they are designated as hedges. Assets/liabilities in this category are classified as current assets/liabilities if expected to be settled within 12 months, otherwise they are classified as non-current.
Loans and receivables Loans and receivables are non-derivative financial assets with fixed or determinable payments that are not quoted in an active market. They are included in current assets with the exception of maturities greater than 12 months after the end of the reporting period. These are classified as non-current assets. This category includes financial non-current assets, accounts receivables, other receivables, short-term investments and cash and cash equivalents.
Other financial liabilitiesOther financial liabilities refer to all financial liabilities that are not included in the category financial liabilities at fair value through profit or loss or has been identified as items hedged. This category includes borrowings, financial lease liabilities, trade payables and other liabilities. Loans and trade payables due within 12 months are classified as short-term liabilities, while those due after 12 months are classified as long-term liabilities.
Recognition and measurement of financial instrumentsRegular purchases and sales of financial assets are recognized on trade-date, the date on which the Group commits to purchase or sell the asset. Investments are initially recognized at fair value plus transaction costs for all financial assets not carried at fair value through profit or loss. Financial assets and liabilities carried at fair value through profit or loss are initially
Annual Report 2014 Husqvarna Group 71

Financial Statements – Group
Notes
recognized at fair value, and transaction costs reported in the income statement. Financial assets are derecognized when the right to receive cash flows from the investments has expired or has been transferred and when the Group has transferred substantially all of the risks and rewards of ownership. Financial liabilities are derecognized when the obligation is satisfied, cancelled or has expired.
Financial assets and liabilities at fair value through profit or loss are carried to fair value. All changes to fair value are reported in the income statement when they arise and are reported within operating income. Refer to note 19 regarding disclosures of measurement at fair value.
Loans and receivables and other financial liabilities are carried at amortized cost using the effective interest method less provision for impairment.
At each balance sheet date the Group assesses whether there is objec-tive evidence that a financial asset or a group of financial assets is impaired.
Offsetting financial instrumentsFinancial assets and liabilities are offset and the net amount reported in the balance sheet when there is a legally enforceable right to offset the recognized amounts and there is an intention to settle on a net basis or realize the asset and settle the liability simultaneously. Husqvarna has entered into master netting arrangements for certain financial derivatives. When the criteria for offsetting are fulfilled the derivatives are netted in the balance sheet.
Accounting of derivative financial instruments and hedging activities Derivatives are initially recognized at fair value on the date on which the derivative contract is entered into and are subsequently re-measured at their fair value. The method of recognizing the resulting gain or loss depends on whether the derivative is designated as a hedging instrument, and if so, the nature of the item being hedged. The Group designates certain derivatives as either hedges of highly probable forecast transactions (cash flow hedges) or hedges of net investments in a foreign operation (net investment hedge).
The Group documents at the inception of the transaction the relation-ship between the hedging instruments and hedged items, as well as risk-management objectives and strategy for undertaking various hedging transactions. The Group also documents its assessment, both at the hedging inception and on an ongoing basis, of whether the derivatives that are used in hedging transactions are highly effective in offsetting changes in fair values or cash flows of hedged items.
Disclosures regarding fair value for the Group’s derivatives are shown in note 19. Changes in the cash flow hedge reserve are shown in note 18. The full fair value of a hedging derivative is classified as non-current asset or liability when the remaining hedged item is more than 12 months and as current asset or liability if the maturity is shorter than 12 months.
Cash flow hedge The effective portion of change in the fair value of derivatives that are designated and qualify as cash flow hedges is recognized in other comprehensive income. The gain or loss relating to the ineffective portion is recognized immediately in the income statement as operating income.
Amounts accumulated in equity are reclassified to the income statement in the periods when the hedged item will affect profit or loss (for instance when the forecast sale which is hedged takes place). However, when the forecast transaction that is hedged results in the recognition of a non-financial item (for example, inventory), the gains and losses previously deferred in equity are transferred from equity and included in the initial measurement of the cost of the asset or liability. The deferred amounts are ultimately recognized in cost of goods sold in the case of inventory. The gain or loss relating to the effective portion of interest rate swaps hedging variable rate borrowings is recognised in other comprehensive income. The gain or loss relating to the ineffective portion is recognized in the income statement within financial items.
When a hedging instrument expires or is sold, or when a hedge no longer meets the criteria for hedge accounting, any cumulative gain or loss existing in equity at the time remains in equity and is recognized when the forecast transaction is ultimately recognized in the income statement. When a forecast transaction is no longer expected to occur, the cumulative gain or loss that was reported in equity is immediately transferred to the income statement.
Net investment hedgeHedges of net investments in foreign operations are accounted for similarly to cash flow hedges. Any gain or loss on the hedging instrument relating to the effective portion of the hedge is recognized in other comprehensive
income. The gain or loss relating to the ineffective portion is recognized in the income statement. Gains and losses accumulated in equity are included in the income statement when the foreign operation is partially disposed of or sold.
Liquid assets Liquid assets consist of cash on hand, bank deposits, other short-term highly liquid investments with maturities of three months or less and fair value derivative assets.
InventoriesInventories and work in progress are valued at the lower of cost and net realizable value. The value of inventories is determined by using the weighted average cost formula. Net realizable value is defined as the estimated selling price in the ordinary course of business less the estimated costs of completion and the estimated costs necessary to execute the sale at market value. Gains and losses previously deferred in equity on hedged forecast transactions are also included in the initial measurement cost of the inventory. The cost of finished goods and work in progress comprises raw material, direct labour, other direct cost and other related production overheads, based on normal capacity. Borrowing costs are not included in inventory. Internal profit in inventory is eliminated on consolidated level. Appropriate provisions have been made for obsolescence.
Current and deferred taxThe tax expense for the period consists of both current and deferred tax. Tax is recognized in the income statement, except to the extent that it relates to items recognized in other comprehensive income or directly in equity. In this case tax is reported in other comprehensive income and equity respectively.
Current tax is calculated based on the taxable result for the year. This can differ to the income before tax reported in the income statement due to adjustment for non-taxable and non-deductible income and expenses and temporary differences. The current income tax is calculated on the basis on the tax laws in the country of the Parent Company or the subsidiaries.
Management periodically review the positions taken in tax returns with respect to situations in which applicable tax regulations are subject to interpretations and establish provisions where appropriate on the basis of amounts expected to be paid to the tax authorities. Current tax also includes adjustments to income tax related to prior years.
Deferred tax is accounted for in accordance with the liability method. This means that a deferred tax asset or liability is reported on all temporary differences arising between the tax basis for assets and liabilities and their net book value. Deferred tax is calculated based on the tax rates in the respective country.
Taxes incurred by Husqvarna are affected by appropriations and other taxable (or tax-related) transactions in the individual Group companies. They are also affected by the utilization of tax losses carried forward referring to previous years or to acquired companies. Deferred tax assets on tax losses and temporary differences are recognized to the extent it is probable that they will be utilized in future periods.
Deferred tax is provided on temporary differences arising on invest-ments in subsidiaries except for deferred income tax liabilities where the timing of the reversal of the temporary difference is controlled by the Group and it is probable that the temporary difference will not be reversed in the foreseeable future.
Deferred tax assets and deferred tax liabilities are shown net when a company or a group of companies, has a legally enforceable right to set off tax assets against tax liabilities, they refer to the same taxation authority and the intention is to settle the assets/liabilities with a net payment.
Pensions and other post-employment benefitsPension obligationsPensions and other post-employment benefit plans are classified as either defined contribution plans or defined benefit plans.
Under a defined contribution plan, the Group pays fixed contributions into a separate entity and will have no legal obligation to pay further contributions if the fund does not hold sufficient assets to pay all employee benefits. Contributions are expensed when they are due. Prepaid contributions are recognized as an asset to the extent that a cash refund or a reduction in the future payments is available.
All other pensions and other post-employment benefit plans are defined benefit plans. Defined benefit plans define an amount of pension benefit that an employee will receive on retirement, depending on factors such as age, years of service and compensation. The liability recognized in the balance sheet in respect of defined benefit pension plans is the
Annual Report 2014 Husqvarna Group 72

Financial Statements – Group
Notes
present value of the defined benefit obligation at the end of the reporting period less than the fair value of plan assets. The defined benefit obligation is calculated annually by independent actuaries using the projected unit credit method. The present value of the defined benefit obligation is determined by discounting the estimated future cash outflows using interest rates of high quality corporate bonds denominated in the currency in which the benefits will be paid, in most countries AA-rated corporate bond indexes matching the duration of the pension obligation and in Sweden mortgage bonds. In countries without a deep market in such bonds, the market rate on government bonds is used.
Past-service costs are recognized immediately in the operating income. Interest on the Group’s net pension plans are reported net within the Group’s finance items, and is calculated applying the discount rate as when calculating the net defined liability. Actuarial gains and losses arising from experience adjustments and changes in actuarial assumptions are charged or credited to equity in other comprehensive income in the period in which they arise.
Termination benefitsTermination benefits are payable when the employment is terminated by the Group before the normal retirement date, or whenever they accept voluntary redundancy in exchange for these benefits. Termination benefits are recognized at the earlier of a) when the Group can no longer withdraw the offer of those benefits and b) when the entity recognizes costs for a restructuring and involves the payment of termination benefits.
Share-based compensationHusqvarna Group has share-based, equity settled, compensation programs granted during the years 2013 and 2014, where the Group receives services from employees as consideration for equity instruments (shares and options). The cost of the granted instruments’ fair value at grant date is recognized during the vesting period. The fair value of the instruments is the market value at grant date, adjusted for the discounted value of future dividends which employees will not receive. At the end of each reporting period, the Group revises the estimates of the number of instruments that are expected to vest. Husqvarna recognizes the impact of the revision to original estimates, if any, in the income statement, with a corresponding adjustment to equity.
In addition, the Group provides for employer contributions expected to be paid in connection with the share-based compensation programs. The costs are charged to the income statement over the vesting period. The provision is periodically revalued on the basis of the fair value of the instruments at each closing date.
ProvisionsProvisions are recognized when the Group has a present legal or constructive obligation as a result of a past event, it is probable that an outflow of resources will be required to settle the obligation, and a reliable estimate can be made of the amount of the obligation. The amount recognized as a provision is the best estimate of the expenditure required to settle the present obligation at the end of each reporting period. Provisions are measured at present value, when material.
Provisions for warranties are recognized at the date of sale of the products covered by the warranty and are calculated on the basis of historical data for similar products.
Restructuring provisions are recognized when the Group has adopted a detailed formal plan for the restructuring and has either started the implementation of the plan or communicated its main features to those affected by the restructuring.
Revenue recognition Revenue is measured at the fair value of the consideration received or receivable and represents amounts receivable for goods supplied, stated net of trade discounts, returns, value added taxes and specific sales taxes. The Group recognizes revenue when the amount of revenue can be reliably measured and when it is probable that future economic benefits will flow to the entity. Husqvarna mainly generates revenue from sales of finished products, but also some from accessories, services, and extended warranty, refer below:
Sales of finished products and accessoriesHusqvarna manufactures and sells finished products and accessories mainly to dealers and retailers but also directly to consumers. The revenue is recognized when the significant risks and rewards associated with owner-ship of the goods have been transferred to the buyer in accordance with the sales and delivery terms, and the Group retains neither a continuing
right to dispose of the goods, nor effective control of those goods and when the amount of revenue can be measured reliably.
ServicesRevenues from services are recorded when the service, such as product repairs, has been performed.
Extended warrantyRevenue from extended warranty is recorded over the contract period.
Interest incomeInterest income is recognized on a time-proportion basis using the effective interest method.
DividendDividends are recognized when it is determined that payments will be received.
Government grants Government grants relate to financial grants from governments, public authorities and similar local, national, or international bodies. These are recognized when there is a reasonable assurance that Husqvarna will comply with the conditions attached to them and that the grants will be received. Government grants relating to assets are included in the balance sheet as prepaid income and recognized as income over the useful life of the assets. Government grants relating to expenses are recognized in the income statement as a deduction of such related expenses.
Leasing Leases in which a significant portion of the risks and rewards of ownership are retained by the lessor are classified as operating leases. Payments made under operating leases are charged on a straight-line basis during the lease period. Leasing agreements where the Group has substantially all the risks and rewards of ownership are classified as finance leases. Finance leases are capitalized at the leases commencement date at the lower of the fair value of the leased asset and the present value of the minimum lease payments. Assets acquired under finance leases are depreciated over the shorter of the useful life of the asset and the lease term. Each lease payment is divided between amortization of the lease liability and interest. Corresponding interest obligation, net of finance charges, are reported in the balance sheet as non-current or current borrowings.
Husqvarna Group leases a number of production facilities, warehouses and office premises as well as certain office equipment. Main part of the Group’s leasing agreements are classified as operating leases.
Dividend distributionDividend distribution to the Parent Company’s shareholders is recognized as a liability in the Group’s financial statements in the period in which the dividends are approved by the Parent Company’s shareholders.
Cash flowThe cash flow statement has been prepared according to the indirect method.
NOTE 2 Important accounting estimates and assessments
In order to prepare these financial statements management needs to make estimates and assessments and therefore use certain assumptions concerning the future. Management makes estimates and assessments based on past experience and assumptions that are believed to be reasonable and realistic under the circumstances. The use of such estimates and assessments has an impact on the income statement as well as the balance sheet and on the disclosures presented, such as contingent liabilities. Actual results could differ from these estimates under different assumptions or circumstances. Summarized below are those accounting policies that require more subjective judgement from management in making assumptions or estimates regarding the effects of matters that are inherently uncertain.
Impairment test of intangible assets with indefinite useful lifeIntangible assets that have an indefinite useful life (goodwill and the brand Gardena) are tested annually for impairment, or more often if there is an indication of impairment. If there is an indication of impairment the
Annual Report 2014 Husqvarna Group 73

Financial Statements – Group
Notes
Group estimates the recoverable amount of the asset. An impairment loss is recognized by the amount by which the net book value of an asset exceeds its recoverable amount. The recoverable amount is determined on the basis of value in use estimated by using the discounted cash flow method based on expected future results. Key assumptions for forecasting are expected growth, margin and discount rates. For further information regarding the Group’s impairment test, refer to note 14.
InventoryHusqvarna’s inventory is accounted for to the lowest of the acquisition value in accordance with the weighted average cost formula, and the net realizable value. The net value is adjusted for the estimated depreciation for older articles, physically damaged goods, excess inventory and sales costs. Husqvarna’s large seasonality in stockpiling and sales together with weather-dependent products increase the difficulty to estimate the value of inventory. To minimize these difficulties, Husqvarna is constantly working with streamlining the production chain, keeping the inventory levels on a reasonably low level and focus on the inventory valuation to ensure that it is accurate in accordance with the circumstances on the balance sheet date. The total provision for obsolescence amounts as per December 31, 2014 to SEK 424m (373) and the inventory net of provisions amounts to SEK 7,954m (7,087).
Deferred taxIn the preparation of the financial statements, Husqvarna estimates income tax for each of the taxing jurisdictions in which Husqvarna operates as well as any deferred taxes based on temporary differences. Deferred tax assets, which primarily relate to tax loss carry-forwards and temporary differences, are recognized if future taxable income is expected to allow for the recovery of those tax assets. Changes in assumptions in the projection of future taxable income as well as changes in tax rates may result in significant differences in the valuation of deferred taxes. For further information regarding deferred tax refer to note 11.
Pensions and other post-employment benefitsThe present value of the Group’s net pension obligations depends on a number of factors that are determined on an actuarial basis using a number of assumptions. Assumptions used calculating the net pension liability comprise of for example; discount rate, inflation, mortality, future salary increases etc. Any changes in these assumptions will impact the carrying amount of the net pension liability. Sensitivity analyses of the effect from a change in the main assumptions and potential risks affecting the liabilities are included in note 20.
Share-based compensationHusqvarna Group has share-based, equity settled, compensation pro-grams where the Group receives services from employees as consideration for equity instruments. The share-based compensation includes matching shares awards and performance based share awards. In order to receive the share match and the performance based shares, the employee is required to stay employed three years after the grant date and to maintain the original investment. The number of performance based share awards that vest further depend on the fulfilment of certain levels of increase of the Company´s value creation as determined by the Board of Directors. These levels are “Entry”, “Target” and “Stretch”. Entry constitutes a minimum level which must be exceeded in order for the performance based share awards to vest and give right to Class B-shares. At the end of each reporting period, the Group revises the estimates of the number of instruments that are expected to vest. The number of performance based shares that are expected to vest is based on management´s best estimate. For further information refer to note 4.
Warranty provisionProvision for warranty comprises all potential expenses for repairing or replacing products sold. Provisions are made when the products are sold and are normally limited to two years. The provision is estimated for each group of products and based on historical information. For further information refer to note 21.
Provision for restructuringProvision for restructuring represents the expected payments to be incurred in the coming years as a consequence of Husqvarna’s decision to close some factories, rationalize production and reduce personnel. The amounts are based on the Husqvarna management’s best estimates and
are adjusted when changes to these estimates are known. Provision for reduction of personnel is calculated on individual basis except for most Blue Collar workers where negotiations are made collectively and are based on management’s best estimate of the amount expected to be paid out. For further information refer to note 21.
Claims reservesHusqvarna maintains third-party insurance coverage and is insured through wholly-owned insurance subsidiaries (captives) as regards a variety of exposures and risks, such as property damage, business interruption and product liability claims. Claims reserves in the captives, mainly for product liability claims, are calculated on the basis of a combination of case reserves and reserves for claims incurred but not reported. Actuarial calculations are undertaken to assess the adequacy of the reserves based on historical loss development experience, benchmark reporting and payment patterns. These actuarial calculations are based on several assumptions and changes in these assumptions may result in significant differences in the valuation of the reserves. For further information refer to note 21.
Contingent liabilitiesThe Group is involved in various disputes arising from time to time in its ordinary course of business. Husqvarna estimates that none of the disputes in which Husqvarna is presently involved in or that have been settled recently have had, or may have, a material effect on Husqvarna’s financial position or profitability. However, the outcome of complicated disputes is also difficult to foresee, and it cannot be ruled out that the disadvantageous outcome of a dispute may result in a significantly adverse impact on the Group’s results of operations and financial position. For further information refer to note 23.
NOTE 3 Segment information
Husqvarna has during 2014 and 2013 comprised of three segments (business areas); Europe & Asia/Pacific, Americas and Construction. This forms the basis for the Group’s internal reporting reviewed by the Group’s President and CEO (Husqvarna’s chief operating decision maker) in order to assess performance and take decision on allocating resources to the segments. The business areas are responsible for the operating income (excluding items affecting comparability) and the net assets used in their operations which also are the financial measure used when the Group’s President and CEO makes in his assessment of the performance of the segment. The net financial income/expense and taxes as well as net debt and equity are not allocated and reported per business area.
The business areas consist of separate legal units as well as divisions in multi-segment legal units meaning that a certain amount of allocation of costs and net assets is distributed among the business areas. Operating costs not included in the business areas are shown under Group common costs, which mainly include costs for Husqvarna’s corporate functions.
Segment consolidation is based on the same accounting principles as for the Group as a whole. Transactions between business areas are carried out on strictly commercial terms, applying arm’s length principles. Management of the operational assets is carried out on a business area basis and the performance of their respective business area is measured according to the same criteria, while the financing of the operations is managed by Husqvarna Group Treasury at Group and country level. Consequently, liquid funds, interest-bearing receivables and liabilities and equity are not allocated to the business areas.
The operative organization comprises six business units; Manufacturing & Logistics, Product Management & Development, EMEA, Asia/Pacific, Americas and Constructions. The two business units Manufacturing & Logistics and Product Management & Development are support functions to the business areas Europe & Asia/Pacific and Americas. The business areas Europe & Asia/Pacific and Americas include selling of forest, park and garden products to retailers and dealers in the Europe and Asia/Pacific region together with North and Latin America. Forest and garden products comprise five product categories; Wheeled products, Electric products, Handheld products, Watering and hand tools and finally Accessories. For details about the products included in each categories see page 3. The business area Construction includes production, development, logistics, marketing and selling of machines and diamond tools for the construction and stone industries.
Annual Report 2014 Husqvarna Group 74

Financial Statements – Group
Notes
2014
SEKmEurope &
Asia/Pacific Americas ConstructionGroup
common1
Undistributed items5 /
Eliminations Group
Net sales 15,824 13,675 3,339 – – 32,838
Operating income 1,904 340 356 –1,009 – 1,591
Where of items affecting comparabilities3 – – – –767 – –767
Financial income – – – – 76 76
Financial expenses – – – – –401 –401
Income after financial items 1,904 340 356 –1,009 –325 1,266
Total assets 15,474 6,849 3,279 1,637 2,105 29,344
Liabilities 3,435 2,052 559 1,789 9,339 17,174
Total equity – – – – 12,170 12,170
Total equity and liabilities 3,435 2,052 559 1,789 21,509 29,344
Cash flow from operations2 1,841 472 344 –1,009 – 1,648
Depreciation/amortization/impairment3 558 266 141 769 – 1,734
Investments in property, plant and equipment –755 –300 –76 – – –1,131
Investments in intangible assets –179 –47 –29 – – –255
1,465 391 380 –240 – 1,996
Change in other operating assets/liabilities4 – – – – –77 –77
Acquisitions /divestments – – – – –26 –26
Financial items – – – – –820 –820
Taxes paid – – – – –231 –231
Cash flow from operations and investments 1,465 391 380 –240 –1,154 842
2013
SEKmEurope &
Asia/Pacific6 Americas6 ConstructionGroup
common1
Undistributed items5/
Eliminations Group
Net sales 14,736 12,571 3,000 – – 30,307
Operating income 1,488 30 277 –187 – 1,608
Financial income – – – – 25 25
Financial expenses – – – – –453 –453
Income after financial items 1,488 30 277 –187 –428 1,180
Total assets 14,818 5,942 2,933 1,185 1,884 26,762
Liabilities 3,112 1,710 504 1,503 8,543 15,372
Total equity – – – – 11,390 11,390
Total equity and liabilities 3,112 1,710 504 1,503 19,933 26,762
Cash flow from operations2 2,188 420 248 –187 – 2,669
Depreciation/amortization/impairment 3 552 302 124 0 – 978
Investments in property, plant and equipment –536 –188 –72 0 – –796
Investments in intangible assets –160 –77 –44 –1 – –282
2,044 457 256 –188 – 2,569
Change in other operating assets/liabilities4 – – – – 58 58
Acquisitions / divestments – – – – 8 8
Net financial items – – – – –420 –420
Taxes paid – – – – –394 –394
Cash flow from operations and investments 2,044 457 256 –188 –748 1,821
1 Group common includes central staff functions. Assets, liabilities and cash flow includes deferred tax.2 Cash flow from operations per business area is calculated excluding depreciation/amortization and impairment, capital gains and losses, other non-cash items, paid
restructuring expenses, net financial items, taxes paid and change in other operating assets/liabilities.3 Impairment in the Group amounted to SEK 780m (3) whereof SEK 13m (0) referred to Europe & Asia/Pacific, SEK 0m (0) to Americas and SEK 0m (3) to Construction. Husqvarna
assess the performance of the segment based on operating income excluding items affecting comparability, the goodwill impairment of SEK 767m (0) has therefore been charged to Group common.
4 Change in other operating assets/liabilities also include other non cash items, paid restructuring expenses, and other investments.5 Undistributed items consist of cash and equivalents SEK 2,105m (1,884), undistributed liabilities consist of interest-bearing liabilities amounted to SEK 9,339m (8,543).6 As from January 1, 2014, the responsibility for sales from Sweden to certain American distributors has been transferred from Europe & Asia/Pacific to Americas. To reflect this
change in the Group’s segments reporting, the corresponding sales and operating income has as of the same date been transferred from Europe & Asia/Pacific to Americas. Sales and operating income from 2013 has been restated accordingly between the two business areas.
Annual Report 2014 Husqvarna Group 75

Financial Statements – Group
Notes
Restatement of business areas 2013, SEKm
Europe & Asia/Pacific Americas
2013 restated 2013
2013 restated 2013
Net sales 14,736 14,952 12,571 12,355
Operating income 1,488 1,514 30 4
Operating margin, % 10.1 10.1 0.2 0.0 Geographic informationThe table below shows sales per geographical market, regardless of where the goods are produced. Assets are reported where the asset is located.
SEKm
External sales Non-current assets1
2014 2013 2014 2013
Sweden 1,220 1,227 2,350 2,016
France 1,745 1,602 8 8
Germany 3,132 2,756 5,889 6,149
Rest of Europe 8,619 8,116 780 754
Asia/Pacific 2,421 2,394 982 942
Canada 1,429 1,459 140 126
U.S. 12,797 11,383 3,807 3,146
Latin America 1,190 1,118 24 17
Rest of the World 285 252 4 3
Total 32,838 30,307 13,984 13,161
1 Non-current assets other than financial instruments, deferred tax assets and pension assets.
Net sales per product category
SEKm 2014 2013
Forest and garden products 29,499 27,307
Construction products 3,339 3,000
Total 32,838 30,307
Information about major customersHusqvarna Group has no single customer to which net sales exceeds 10 percent of the Group’s total net sales.
NOTE 4 Employees and employee benefits
Average number of employees
2014 2013
Number of men
Number of women Total
Number of men
Number of women Total
Sweden 1,276 373 1,649 1,339 397 1,736
Germany 945 513 1,458 940 512 1,452
Czech republic 403 428 831 400 408 808
U.K. 221 67 288 243 72 315
Poland 216 150 366 173 143 316
Rest of Europe 1,053 352 1,405 1,075 361 1,436
Total Europe 4,114 1,883 5,997 4,170 1,893 6,063
China 1,137 527 1,664 1,106 562 1,668
Japan 338 64 402 357 67 424
Rest of Asia/Pacific 130 73 203 123 65 188
Total Asia/Pacific 1,605 664 2,269 1,586 694 2,280
U.S. 3,201 2,474 5,675 3,072 2,319 5,391
Canada 93 47 140 88 47 135
Total North America 3,294 2,521 5,815 3,160 2,366 5,526
Brazil 116 35 151 105 31 136
Rest of Latin America 33 12 45 36 13 49
Total Latin America 149 47 196 141 44 185
Other markets 33 27 60 65 37 102
Total 9,195 5,142 14,337 9,122 5,034 14,156
Whereof:
Board members 27 6 33 31 10 41
Presidents and other senior managers 41 4 45 42 4 46
A detailed specification of the average number of employees by country and gender has been submitted to the Swedish Companies Registration Office and is available on request from Husqvarna AB, Investor Relations.
Annual Report 2014 Husqvarna Group 76

Financial Statements – Group
Notes
Salary cost
SEKm 2014 2013
Sweden 911 838Germany 715 631U.K. 96 91Czech republic 93 81Poland 46 38Rest of Europe 519 506Total Europe 2,380 2,185
China 92 105Japan 126 132Rest of Asia/Pacific 98 96Total Asia/Pacific 316 333
U.S. 1,320 1,120Canada 52 54Total North America 1,372 1,174
Brazil 65 40Rest of Latin America 10 9Total Latin America 75 49
Other markets 14 17Total 4,157 3,758
Social costs 755 729Pension costs – defined benefit obligations 119 98Pension costs – defined contribution plans 83 90Total 957 917
Where of remuneration to Board, Presidents and other senior managers¹:Salary cost 105 92(whereof variable salary cost) (33) (19)Social costs 26 21Pension costs 14 17
1 Refers to salary costs for all board members, presidents and other senior executives in the Parent Company and subsidiaries.
Remuneration to Group Management
SEKt
2014
Fixedsalary
Variablesalary
Pension cost
Long-term incentive
Otherbenefits2
Severancepay etc. Total
President and CEO 7,763 7,272 3,105 1,138 305 – 19,583
Former President and CEO1 – 1,100 – – – – 1,100
Other members of Group Management3 30,067 24,858 8,650 2,290 1,450 5,488 72,803
Total 37,830 33,230 11,755 3,428 1,755 5,488 93,486
1 Former CEO and President, Hans Linnarson left his position as per July 1, 2013 and the employment was terminated March 31, 2014 as he then attained the retirement age 62. The cost for his remuneration in 2014 has been charged 2013, with the exception of variable salary as shown above which was paid in March 2014.
2 Refers to housing, travel and car benefits.3 Other members of Group Management comprise nine individuals. There is one new member, one has left and one has been part of Group Management as acting member
during part of the year. The remuneration shown above refers to the remuneration part of the year during which the individual in question was a member of Group Management. The cost for salary and pension during notice period as well as severance pay has affected the result in 2014 and is shown above in the column Severance pay etc.
SEKt
2013
Fixedsalary
Variablesalary
Pension cost
Long-term incentive
Otherbenefits3
Severancepay etc. Total
President and CEO 1 3,750 1,875 1,500 553 4 – 7,682
Former President and CEO2 8,159 3,210 4,586 282 246 – 16,483
Other members of Group Management 4 24,741 9,254 8,126 4,069 1,675 1,026 48,891
Total 36,650 14,339 14,212 4,904 1,925 1,026 73,056
1 President and CEO Kai Wärn was employed as per July 1, 2013. Variable salary refers to fixed bonus valid for 2013 to be paid in January 2014. 2 Former CEO and President, Hans Linnarson left his position as per July 1, 2013 and the employment was terminated March 31, 2014 as he then attained the retirement age 62.
The cost for his remuneration in 2014 has been charged 2013. 3 Refers to housing, travel and car benefits.4 Other members of Group Management comprise ten individuals. There are four new members and two persons have left Group Management during the year.
The remuneration shown above refers to the remuneration part of the year during which the individual in question was a member of Group Management.
Annual Report 2014 Husqvarna Group 77

Financial Statements – Group
Notes
Remuneration CommitteeThe task of the Remuneration Committee is to provide the Board of Directors with proposals for remuneration to members of Group Management regarding targets and criteria for variable remuneration, the relationship between fixed and variable salary, changes in fixed or variable salary, long-term incentives, pension terms and other benefits. The Committee consists of three board members: Tom Johnstone (Chairman), Lars Pettersson and Lars Westerberg.
Principles for remuneration to Group ManagementThe overall principles for remuneration to Group Management are that remuneration should be based on the position held, on individual and Group performance and on a competitive basis in the country of employment. The overall remuneration package for Group Management comprises fixed salary, variable salary in the form of short-term incentives based on annual performance targets, long-term incentives and benefits such as pension and insurance benefits. Husqvarna aims to offer competitive and performance based remuneration. Variable remuneration may constitute a significant proportion of total remuneration, but could also be zero if the lowest target level “entry” is not achieved or capped if the maximum level “stretch” is attained. Variable salary to the President and Group Management is based on the Group’s operating income, cash flow, quality targets, accelerated improvement program and targets on days payable outstanding.
Terms of employment for the PresidentThe remuneration to the President and CEO comprises fixed salary, variable salary based on annual targets, long term incentive programs and pension benefits. The remuneration is reviewed annually per January 1. The annual fixed salary to the President amounts to SEK 7,763,000, effective January 1, 2014. The variable salary is based on operating income, cash flow and quality targets for the Group and amounts to 50 percent of the fixed salary at target level and is capped at 100 percent at stretch level. The President participates in the Group’s long-term incentive programs for 2013 and 2014 (LTI 2013 and 2014). For information on these programs, see below Husqvarna Long Term Incentive programs.
The notice period for termination is 12 months on the part of the Company and 6 months on the part of the President. The President is entitled to severance pay, corresponding to 12 monthly salaries with deduction for any other income, in the event of notice of termination from the employer. The President is entitled to housing allowance and compen-sation for cost for travel between home and the office in Stockholm.
Pension terms for the PresidentThe retirement age for the President is 62. The President is covered by the collectively agreed ITP plan, the alternative rule of the plan, and the Husqvarna Executive Pension Plan. The Husqvarna Executive Pension Plan is a defined contribution plan. The employer contribution to the plan for the President is equivalent to 40 percent of the fixed salary which also includes the contributions for the benefits of the ITP-plan, alternative ITP and any supplementary disability and survivor’s pension.
Terms of employment for other members of Group Management As with the President, other members of Group Management receive a remuneration package comprised of fixed salary, variable salary based on annual targets, long term incentive programs and pension and insurance benefits. Remuneration is revised annually per January 1. The variable salary is based on operating income, cash flow, quality targets, accelerated improvement program and targets on days payable outstanding for the Group and/or for the relevant business unit. The variable salary is 40–75 percent of the fixed salary at target level and is capped at 80–150 percent at stretch level. Members of Group Management participate in the Group’s long- term incentive programs which consist of the programs for 2009, 2013 and 2014 (LTI 2009, LTI 2013 and LTI 2014). For information on these programs, see below Husqvarna long term Incentive programmes. The notice period for termination is 12 months on behalf of the Company and 6 months on the part of the employee and in the event of notice of termination from the employer, the member of Group Management is entitled to severance pay corresponding to 12 monthly salaries with deduction for any other income. Those conditions for termination refer to the members of Group Management employed in Sweden. Shorter period of notice applies for those employed outside Sweden.
Pension terms for other members of Group ManagementThe members of Group Management employed in Sweden (six out of nine) are covered by the collectively agreed ITP plan and the alternative rule of the plan. These individuals are also covered by the Husqvarna Executive Pension Plan, which is a defined contribution plan. The employer contribution to the plan is equivalent to 35 percent of the pensionable salary which also includes contributions for the ITP plan, alternative ITP and any supplementary disability and survivor’s pension. The pensionable salary is calculated on the basis of current fixed salary. Also last year’s variable salary paid is pensionable for those who were covered by the plan before 2013. The pension age is 65 (age 62 applies for two individuals) for the members of Group Management who are employed in Sweden. In addition to the pension terms described above there is a commitment to pay a single premium, for pension benefits at retirement age to those two individuals with retirement age 62, corresponding to 22.68 monthly salaries in the event that the member of Group Management remains in service until the retirement age. The members of Group Management that are not employed in Sweden are covered by the Group’s company retirement plans in the respective country of employment (Germany and the U.S.). Pension age is 65 or higher.
Terms of employment for the former President The former President and CEO, Hans Linnarson, resigned from his position on 1 July 2013 and the employment ceased 31 March 2014 when he attained the retirement age 62. The cost for his remuneration in 2014 was charged in 2013 with the exception of variable salary SEK 1,100,000 that was paid in March 2014.
Fees to the Board of Directors The Annual General Meeting 2014 authorized fees to the Board of Directors amounting to SEK 5,595,000 in total, whereof SEK 1,675,000 to the Chairman and SEK 485,000 to each of the other Board members, not employed by the company, including additional total of SEK 525,000 as fees for Board Committee work.
Fees to the Board of Directors authorized by the Annual General Meeting 2014
SEKt
2014
FeeFee for Board
committe work Total fee
Lars Westerberg 1,675 50 1,725
Magdalena Gerger 485 – 485
Tom Johnstone 485 100 585
Ulla Litzén 485 175 660
David Lumley1 485 – 485
Katarina Martinson 485 75 560
Daniel Nodhäll 485 75 560
Lars Pettersson1 485 50 535
Kai Wärn1 – – –
Soili Johansson – – –
Annika Ögren – – –
Carita Spångberg2 – – –
Lotta Widehäll2 – – –
Total 5,070 525 5,595
1 Elected at the 2014 AGM.2 Deputy.
In 2009 and 2010 the Board remuneration was partly emitted in the form of synthetic shares, with a right to receive an amount in cash after five years, i.e. in 2014 and 2015 respectively. This remuneration has not been renewed. However, board members are expected to engage themselves financially in Husqvarna by acquiring Husqvarna shares within a period of five years, corresponding to approximately one year’s board fee. There are no agreements in place governing severance pay to board member not employed by the Company.
Long Term Incentive programmes (LTI)The purpose of the long term incentive programmes is to create conditions to attract and retain competent managers, provide competitive remuneration and to align the interests of the shareholders with the senior
Annual Report 2014 Husqvarna Group 78

Financial Statements – Group
Notes
executives. There are two on-going long term incentive programmes not yet vested; LTI 2013 and LTI 2014. In addition, there is a LTI program, LTI 2009, where the participants received stock options in 2012 which could be exercised until June 1, 2017.
LTI 2013 and LTI 2014The Annual General Meetings 2013 and 2014 authorized the implementation of the incentive programmes LTI 2013 and in 2014 LTI 2014, which comprise less than 50 (LTI 2013) / 70 (LTI 2014) senior managers. The programmes comprise of share match awards and performance based share awards and have a three year vesting period. In order to participate in the program, the employees must buy Class B-shares in Husqvarna to a value corresponding to minimum 5 percent and maximum 10 percent of his/her annual fixed salary in 2013 (LTI 2013) / 2014 (LTI 2014). With regard to LTI 2013, the employee had the possibility to participate with Husqvarna shares, to a value corresponding to minimum 5 percent and maximum 10 percent of the fixed salary for 2013, purchased some time ago. For each share which the employee participates with within the framework of LTI 2013 and LTI 2014, the Company will grant one matching share award.
In addition, the Company grants a number of performance based share awards. The grant of performance based share awards is linked to the participant’s annual target salary (fixed salary plus variable salary at target level) in 2013 (LTI 2013) / in 2014 (LTI 2014). In order to receive the share match and the performance based shares, the employees are required to stay employed three years after grant date and to maintain the original investment.
The number of performance based share awards that vest and give right to Class B-shares further depend on the fulfilment of certain levels of increase of the Company’s value creation during the calendar years 2013–2015 (LTI 2013) / 2014–2016 (LTI 2014), as determined by the Board of Directors. These levels are “Entry”, “Target” and “Stretch”, with a linear progression between each level. Entry constitutes a minimum level which must be exceeded in order for the performance based share awards to vest and give right to Class B-shares. The levels correspond to the following number of right to Class B-shares:
Performance level
Entry 0 shares
Target 25% of target salary / 39.241 for LTI 2013 and 41.242 for LTI 2014
Stretch 40% of target salary / 39.241 for LTI 2013 and 41.242 for LTI 2014
1 39,24 corresponds to the average closing price for Husqvarna B-shares on Nasdaq Stockholm during the period 14–27 February 2013.
2 41.24 corresponds to the average closing price for Husqvarna B-shares on Nasdaq Stockholm during the period 10–21 February 2014.
If the price for the Class B-share would increase more than 100 percent during the three year vesting period, the number of performance based share awards that vest and give right to Class B-shares will be reduced, whereby the maximum value to be received by each participant will be limited to the value of the maximum allocation at Stretch level at a share price increase of 100 percent during the vesting period.
The participants have in total invested in 144,479 Husqvarna shares in LTI 2013, and 166,245 Husqvarna shares in LTI 2014. The programmes comprise maximum 1,007,241, in LTI 2013, and 1,491,389, in LTI 2014, matching shares and performance shares. The value of the programmes is calculated based on the fair value of the share on grant date, as was SEK 30.10 for LTI 2013 and SEK 40,00 for LTI 2014, adjusted for expected dividend and the assumption of an employee turn-over of 5 percent per year. Total number of outstand-ing share match and performance based share rights, based on that the performance level Target will be achieved, amount to the following:
Share awardsThe table below outlines the number of granted share rights forfeited and exercised during current and previous year.
Share awards
2014 2013
LTI 2014 LTI 2013 LTI 2011 LTI 2013 LTI 2011 LTI 2010
At Jan 1, 2014 – 1,085,409 98,224 – 111,842 106,526
Granted 1,580,498 – – 1,085,409 – –
Forfeited –89,109 –78,168 –1,729 – –13,618 –
Exercised – – –96,495 – – –106,526
At Dec 31, 2014 1,491,389 1,007,241 – 1,085,409 98,224 –
The long term incentive programmes are expensed during the three years vesting period and during 2014, SEK 15m (15) has been charged to the income statement, whereof SEK 4m (2) refers to cost for employer social contributions.
LTI 2009The performance period for LTI 2009 ended December 31, 2011 and matching shares and options were awarded the participants on vesting date June 1, 2012. The awarded options give the participants the right to buy one Husqvarna class-B share for each option, to an exercise price of SEK 48 per share. The weighted average share price of the options exercised during the period was SEK 54.88. The options could be exercised until June 1, 2017. The table below shows the number of outstanding options.
Participants
LTI 2009
Number of options
to exercise
President and CEO –
Former President and CEO 18,824
Other members of Group Management 94,783
Other participants 252,997
Total 366,604
Participants
LTI 2014 LTI 2013
Matching shares
Performance shares
Estimated cost, SEKt
Matching shares
Performance shares
Estimated cost, SEKt
President and CEO 14,705 70,590 3,412 15,865 59,729 2,275
Other members of Group Management 28,960 137,101 6,642 38,012 141,152 5,393
Other participants 122,580 620,530 29,724 90,602 338,340 12,911
Total 166,245 828,221 39,779 144,479 539,221 20,579
Annual Report 2014 Husqvarna Group 79

Financial Statements – Group
Notes
NOTE 5 Expenses by nature
SEKm 2014 2013
Costs for supplies and raw materials 16,277 16,229
Employee benefit expenses 5,114 4,675
Amortization/depreciation and impairment 967 978
Impairment of goodwill 767 –
Other 8,140 6,819
Total 31,265 28,701
Research and development amount to SEK 1,090m (955) and is included in the expenses above.
Amortization/depreciation and impairment for the year is included in the following lines in the income statement
SEKm
Intangible assetsProperty, plant and equipment
2014 2013 2014 2013
Cost of goods sold 264 258 589 616
Selling expenses - – 28 25
Administrative expenses 64 54 22 25
Impairment of goodwill 767 – – –
Total 1,095 312 639 666
Impairment for property, plant and equipment was recorded within Cost of goods sold previous year by SEK 3m (no impairment recorded 2014).
Impairment for intangible assets is recorded within Cost of goods sold by SEK 6m (–) and within Administrative expenses by SEK 7m (–).
NOTE 6 Other operating income and operating expenses
SEKm 2014 2013
Other operating incomeGain on acqusition of assets 12 –
Gain on sale of
– Property, plant and equipment 6 2
Total 18 2
Other operating expensesLoss on sale of
– Property, plant and equipment –2 –5
Total –2 –5
NOTE 7 Fees to auditors
SEKm 2014 2013
EYAudit fees for the annual audit engagement 19 –
Audit fees not included in the annual audit engagement 1 –
Tax advices 9 –
Other services 15 –
Total fees to EY1 44 –
PwCAudit fees for the annual audit engagement 0 19
Audit fees not included in the annual audit engagement 0 0
Tax advices 0 1
Other services 0 0
Total fees to PwC 0 20
Audit fees to other auditors 0 2
Total fees to auditors 44 22
1 Of the total fee to EY, SEK 14m is related to non-audit fees for work finalized before, or projects initiated before, EY was elected as auditor.
PwC was appointed auditors for the period until the 2014 Annual General Meeting. EY was elected as auditor at the Annual General Meeting.
NOTE 8 Exchange rate gains and losses in operating income
SEKm 2014 2013
Exchange rate gains and losses in operating income –105 –6
Total –105 –6
Operating income includes SEK 16m (9) of foreign exchange hedging result previously reported in other comprehensive income.
Information related to the accounting of cash flow hedges is presented in note 1.
NOTE 9 Leasing
Operating leasesThere are no material contingent expenses or restrictions among Husqvarna’s operating leases. Expenses for rental payments for facilities, machinery etc. (minimum leasing fees) amounted to SEK 433m (363) in 2014.
Future minimum lease payments are allocated as follows:
SEKm 2014 2013
Within 1 year 413 345
1–5 years 929 793
> 5 year 193 109
Total 1,535 1,247
Financial leasesWithin Husqvarna no financial non-cancellable contracts are subcontracted. Neither are there any contingent expenses in the period’s results, nor any significant restrictions in the contracts related to the leasing of facilities. The minimum lease fee comprises a capital portion and an interest portion. The interest portion is variable and follows the market interest rates applicable in each country.
Annual Report 2014 Husqvarna Group 80

Financial Statements – Group
Notes
Future minimum lease payments are allocated as follows:
SEKm 2014 2013
Within 1 year 40 38
1–5 years 150 135
> 5 year 244 205
Total 434 378
Future financial charges –253 –201
Present value of future minimum lease payments 181 177
Maturity profile for financial leasing liabilities are included in note 19.
Husqvarna’s financial leases, recognized as non-current assets, consisted of:
SEKm 2014 2013
Acquisition valueBuildings and land 455 357
Machinery and other equipment 35 27
Closing balance, Dec 31 490 384
Accumulated depreciationBuildings and land 343 290
Machinery and other equipment 22 19
Closing balance, Dec 31 365 309
Net book value, Dec 31 125 75
NOTE 10 Financial income and expense
SEKm 2014 2013
Financial incomeInterest income on deposits 14 20
Exchange rate differences– on loans –74 –356
– on derivatives held for trading 133 369
– on other – –13
Other financial income 3 5
Total financial income 76 25
Financial expenses
Interest expenses– on loans –216 –252
– on cashflow hedges, interest derivatives –29 –35
– on derivatives held for trading –67 –63
– net on pension assets/liabilities –42 –49
Other financial expenses –47 –54
Total financial expenses –401 –453
Financial income and expenses, net –325 –428
NOTE 11 Tax
SEKm 2014 2013
Current tax on income for the period –278 –321
Deferred tax income/expense –157 57
Total –435 –264
Theoretical and actual tax rates
2014 2013
Tax, % Result Tax, % Result
Profit before tax – 1,266 – 1,180
Theoretical tax rate –30.6 –387 –35.8 –422
Tax losses for which no deferred income tax was recognized 0.0 0 –0.5 –6
Non-taxable/non-deductible income statement items, net 17.3 219 14.2 168
Impairment of goodwill, non-deductible –18.8 –238 – –
Change in valuation of deferred tax –7.4 –94 2.4 28
Utilization of previously unrecognized tax losses 1.8 23 1.5 18
Effect of tax rate change –0.7 –9 –2.3 –27
Withholding tax –0.8 –10 –1.2 –14
Other 4.8 61 –0.7 –9
Actual tax rate –34.4 –435 –22.4 –264
The theoretical tax rate for the Group was previously calculated on the basis of the weighted total Group’s net sales per country, but is from 2014 calculated on earnings before tax per country, multiplied by the local statutory tax rate. 2013 has been recalculated according to the new method.
Tax loss carry-forwards and other tax credits As of December 31, 2014, the Group has tax loss carry-forwards, other deductible temporary differences and tax credits of SEK 3,453m (2,519), whereof SEK 420m (748) has not been included in computation of deferred tax assets. The tax loss carry-forwards will expire as follows:
SEKm 2014 2013
Within a year 0 1
1–5 year 1 0
> 5 year 1,273 1,233
Without time limit 1,875 1,071
Total 3,149 2,305
Changes in deferred taxes
SEKmBalance,
Jan 1, 2014
Recognized in income
statement
Recognized in comprehensive
income statement
Exchange rate differences
Balance, Dec 31, 2014
Non-current assets –1,061 –3 – –100 –1,164
Inventories –27 39 – –14 –2
Current receivables 24 44 – 0 68
Provision for pensions and similar commitments 210 6 144 21 381
Other provisions 155 –15 – 18 158
Financial and operating liabilities 132 –280 167 17 36
Other items –78 –175 – 1 –252
Tax losses carried forward 564 227 – 77 868
Deferred tax assets and liabilities, net –81 –157 311 20 93
Annual Report 2014 Husqvarna Group 81

Financial Statements – Group
Notes
SEKmBalance,
Jan 1, 2013
Recognized in income
statement
Recognized in comprehensive
income statement
Exchange rate differences
Balance, Dec 31, 2013
Non-current assets –998 –38 – –25 –1,061
Inventories 39 –63 – –3 –27
Current receivables –38 68 – –6 24
Provision for pensions and similar commitments 327 –58 –56 –3 210
Other provisions 64 93 – –2 155
Financial and operating liabilities 134 6 –5 –3 132
Other items 21 –98 – –1 –78
Tax losses carried forward 422 147 – –5 564
Deferred tax assets and liabilities, net –29 57 –61 –48 –81
Deferred tax assets and liabilities
SEKm
Assets Liabilities Net
2014 2013 2014 2013 2014 2013
Non-current assets 159 199 1,323 1,260 –1,164 –1,061
Inventories 157 113 159 140 –2 –27
Current receivables 113 36 45 12 68 24
Provisions for pensions and similar commitments 381 210 – – 381 210
Other provisions 159 158 1 3 158 155
Financial and operating liabilities 141 149 105 17 36 132
Other items 1 0 253 78 –252 –78
Tax losses carried forward 868 564 – – 868 564
Deferred tax assets and liabilities 1,979 1,429 1,886 1,510 93 –81
Set-off of tax –394 –307 –394 –307 – –
Deferred tax assets and liabilities, net1 1,585 1,122 1,492 1,203 93 –81
1 Deferred tax assets amounted to SEK 1,585m, whereof SEK 205m will be utilized within 12 months. Deferred tax liabilities amounted to SEK 1,492m, whereof SEK 24m are due within 12 months.
NOTE 12 Earnings per share
BasicBasic earnings per share is calculated by dividing the profit attributable to equity holders of the company by the weighted average number of ordinary shares in issue during the year excluding ordinary shares purchased by the company and held as treasury shares.
2014 2013
Profit attributable to equity holders of the company (SEKm) 827 914
Weighted average numbers of ordinary shares in issue (million) 572.8 572.6
Earnings per share before dilution (SEK) 1.44 1.60
DilutedDiluted earnings per share is calculated by adjusting the weighted average numbers of ordinary shares outstanding to assume conversion of all dilutive potential ordinary shares. The Company’s long term incentive plan contains share options and share savings program which have had a dilutive potential in prior years.
2014 2013
Profit attributable to equity holders of the company (SEKm) 827 914
Weighted average numbers of ordinary shares in issue (million) 572.8 572.6
Adjusted for:
– share savings program (SEKm) 0.3 0.2
Weighted average numbers of ordinary shares in issue (million) 573.1 572.8
Earnings per share after dilution (SEK) 1.44 1.60
Annual Report 2014 Husqvarna Group 82

Financial Statements – Group
Notes
NOTE 13 Property, plant and equipment
SEKmLand and land improvements Buildings
Machinery and technical
installationsOther
equipment
Construction in progress
and advances Total
2014Opening accumulated acquisition value 279 2,707 8,867 917 558 13,328
Acquired during the year 2 54 309 63 703 1,131
Sold, scrapped – –3 –142 –54 – –199
Reclassification 3 28 261 12 –304 –
Exchange differences 30 309 1,184 69 46 1,638
Closing accumulated acquisition value 314 3,095 10,479 1,007 1,003 15,898
Opening accumulated depreciation and impairment 71 1,615 7,271 762 – 9,719
Depreciation for the year 7 97 455 80 – 639
Sold, scrapped – –4 –131 –50 – –185
Reclassification – – 8 –8 – -
Exchange differences 8 192 1,008 54 – 1,262
Closing accumulated depreciation and impairment 86 1,900 8,611 838 – 11,435
Closing balance, Dec 31, 2014 228 1,195 1,868 169 1,003 4,463
2013Opening accumulated acquisition value 275 2,674 8,752 936 277 12,914
Acquired during the year 2 36 166 54 538 796
Transfers – 18 228 12 –258 0
Sold, scrapped –1 –29 –279 –73 0 –382
Reclassification – –2 –4 0 2 –4
Exchange differences 3 10 4 –12 –1 4
Closing accumulated acquisition value 279 2,707 8,867 917 558 13,328
Opening accumulated depreciation and impairment 66 1,534 7,034 765 – 9,399
Depreciation for the year 6 94 491 72 – 663
Impairment – 0 3 – – 3
Restored impairment – – 0 0 – 0
Sold, scrapped 0 –17 –266 –70 – –353
Reclassification – – –2 2 – 0
Exchange differences –1 4 11 –7 – 7
Closing accumulated depreciation and impairment 71 1,615 7,271 762 – 9,719
Closing balance, Dec 31, 2013 208 1,092 1,596 155 558 3,609
For information of where in the income statement the depreciations are reported, see note 5.
Annual Report 2014 Husqvarna Group 83

Financial Statements – Group
Notes
NOTE 14 Intangible assets
SEKm Goodwill BrandsProduct
development Other Total
2014Opening accumulated acquisition value 5,713 3,179 1,996 995 11,883
Acquired during the year – – 168 87 255
Sold, scrapped – – –122 –14 –136
Reclassification – – – – –
Exchange differences 574 208 125 66 973
Closing accumulated acquisition value 6,287 3,387 2,167 1,134 12,975
Opening accumulated amortization – 254 1,444 633 2,331
Amortization for the year – 16 198 101 315
Sold, scrapped – – –122 –14 –136
Impairment 767 – – 13 780
Reclassification – 1 – –1 –
Exchange differences – 19 97 48 164
Closing accumulated amortizations and impairment 767 290 1,617 780 3,454
Closing balance, Dec 31, 2014 5,520 3,097 550 354 9,521
2013Opening accumulated acquisition value 5,733 3,073 1,812 935 11,553
Acquired during the year 2 – 190 90 282
Sold, scrapped – – – –3 –3
Reclassification 0 – 2 2 4
Exchange differences –22 106 –8 –29 47
Closing accumulated acquisition value 5,713 3,179 1,996 995 11,883
Opening accumulated amortization – 233 1,252 549 2,034
Amortization for the year – 16 194 102 312
Sold, scrapped – – – –3 –3
Exchange differences – 5 –2 –15 –12
Closing accumulated amortizations – 254 1,444 633 2,331
Closing balance, Dec 31, 2013 5,713 2,925 552 362 9,552
For information of where in the income statement the amortization is reported, see note 5.
The values of intangible assets with indefinite life are tested for impairment annually, or more frequently if necessary. An impairment loss is recognized with the amount by which the assets net carrying amount exceeds its recoverable amount. The recoverable amount of a cash generating unit is determined based on estimates of value in use. Value in use is measured as expected future discounted cash flows before tax.
As previously announced, Husqvarna Group established a new brand driven organization for its forest and garden operations, which was fully effective as of January 1, 2015. The cash generating units from this date are the new divisions (Husqvarna, Gardena, Consumer Brands and Construction) which is why the impairment test has been performed on this basis. The intangible assets have been allocated to the cash generating unit it belongs to due to the new organization. In previous years, the impairment test has been performed on the former geographical segments (Europe & Asia/Pacific and Americas) and Construction, with the conclusion that the recoverable amount exceeded the carrying amount of the net assets.
Future discounted cash flows are based on by Group Management, approved five-year forecasts for each cash generating unit. Key assump-tions for forecasting are the expected growth, margins and discount rates. Cash flows beyond the five year forecast have been extrapolated using an estimated growth rate of 2 percent (2) for all cash generating units.
Forecasted margin is partly based on previous results and partly on the expected market development. The pre-tax discount rate is based on the risk-free interest, market premium, beta value, capital structure and tax rate. External sources have been used as much as possible when determining these parameters, but the discount rate is still largely depend-ent on management’s own assumptions. A common discount rate is used for all cash generating units since Group Treasury is centrally responsible
for the handling of financing and capital structure. A pre-tax discount rate of 11 percent (10) has been used for 2014.
The impairment test shows that the Gardena division could not defend the carrying amount of its net assets. The total impairment of goodwill amounts to SEK 767m which has been charged to the Group’s result for the fourth quarter 2014.
Intangible assets with indefinite useful lives per future cash generating units (divisions):
SEKm 2014
Husqvarna 2,529
Gardena1 4,349
Consumer brands 704
Construction 993
Total Group 8,575
1 Whereof SEK 3,055m (2,868) relates to the net book value of the Gardena brand, which Husqvarna has assigned indefinite useful life. This is because the brand has a strong position among consumers and Husqvarna intends to maintain and further develop the brand.
The following three sensitivity analyses have been made of the estimated value in use:- 10 percent higher discount rate - 10 percent decreased cash flow- 1 percent reduced sales growth together with a 0.5 percent reduced
operating margin
Annual Report 2014 Husqvarna Group 84

Financial Statements – Group
Notes
None of these adjusted assumptions would result in an impairment loss (after the impairment recorded in 2014) of intangible assets with indefinite useful lives, in any of the cash generating units.
After the impairment made above, under the current business environment, management do not believe that any reasonably possible change in discount rate or in any of the other key assumptions on which the cash generating units’ recoverable amounts are based upon would result in the net book value amount exceeding the recoverable amount.
NOTE 15 Other financial assets
SEKm 2014 2013
Long-term holdings in securities 2 2
Pension assets 74 61
Other long-term receivables 26 21
Total 102 84
Pension assets refer to endowment insurance for pension.
NOTE 16 Inventories
SEKm 2014 2013
Supplies including raw materials 1,987 1,675
Products in progress 181 175
Finished products 5,787 5,241
Advances to suppliers 2 3
Advances from customers –3 –7
Total 7,954 7,087
The cost of inventories recognized as expense and included in cost of goods sold amounted to SEK 22,476m (21,244).
Provisions for obsolescence are included in the value of the inventory. Write-down totaled SEK 44m (28) and previous write-down has been reversed by a total of SEK 25m (35).
Inventories valued to net realizable value amounted to SEK 53m (36) referring to raw material and SEK 500m (390) referring to finished products.
NOTE 17 Other current assets
SEKm 2014 2013
Value added tax 273 197
Miscellaneous short-term receivables 129 107
Provision for doubtful accounts –17 –16
Prepaid rents and leases 13 12
Prepaid insurance premiums 26 17
Other prepaid expenses 241 222
Total 665 539
NOTE 18 Share capital, number of shares and other reserves
Share capital
SEKm
On 31 December 2014, the share capital comprised:
122,425,469 Class A-shares, par value SEK 2 245
453,918,309 Class B-shares, par value SEK 2 908
Total 1,153
The share capital in Husqvarna AB consists of class A-shares and class B-shares. A class A-share entitles the holder to one vote and a class B-share to one-tenth of a vote. All shares entitle the holder to the same proportion of assets and earnings, and carry equal rights in terms of dividends.
Number of sharesOwned by Husqvarna
Owned by other share-
holders Total
Shares, 31 Dec, 2013Class A-shares – 126,593,868 126,593,868
Class B-shares 3,657,503 446,092,407 449,749,910
Performance share program 2011Class A-shares – – –
Class B-shares –96,495 96,495 –
Exercised options LTI 2009Class A-shares – – –
Class B-shares –112,474 112,474 –
Conversion of sharesClass A-shares – –4,168,399 –4,168,399
Class B-shares – 4,168,399 4,168,399
Shares, 31 Dec, 2014Class A-shares – 122,425,469 122,425,469
Class B-shares 3,448,534 450,469,775 453,918,309
Annual Report 2014 Husqvarna Group 85

Financial Statements – Group
Notes
Other reserves
SEKmCash flow
hedge reserveCurrency trans-
lation reserveTotal other
reserves
Opening balance, Jan 1, 2013 –48 –1,355 –1,403Cash flow hedgesResult arising during the year –18 – –18Tax on result arising during the year 4 – 4Reclassification adjustments to the income statement 27 – 27Tax on reclassification adjustments to the income statement –9 – –9Exchange rate differences on translation on foregin operationsCurrency translation difference – 165 165Closing balance, Dec 31, 2013 –44 –1,190 –1,234
Cash flow hedgesResult arising during the year 126 – 126Tax on result arising during the year –28 – –28Reclassification adjustments to the income statement 43 – 43Tax on reclassification adjustments to the income statement –9 – –9Exchange differences on translation on foregin operationsCurrency translation difference – 1,760 1,760Net investment hedge Result arising during the year – –925 –925 Tax on result arising during the year – 204 204Closing balance, Dec 31, 2014 88 –151 –63
long-term borrowings include an average time to maturity of at least two years, and an even distribution of maturities. A maximum of SEK 3,000m in borrowings, originally long-term, is normally allowed to mature in the next 12-month period. When Husqvarna assesses its refinancing risk, the matu-rity profile is adjusted for available unutilized committed credit facilities.
In addition, seasonality in the cash flow is an important factor in the assessment of the financing risk. Consequently, Husqvarna always takes into account the fact that financial planning must include future seasonal fluctuations.
The average adjusted time to maturity for the Group’s financing was 4.0 years (3.3) at the end of 2014.
Capital structure Husqvarna’s target is to have a capital structure corresponding to a long-term creditworthiness of at least BBB rating or equivalent, according to the principles for credit assessment of Standard & Poor’s or a similar agency’s. This implies that seasonally adjusted net debt in proportion to earnings before interest, tax, depreciations and amortizations (EBITDA) is not to exceed 2.5 in the long-term. This target for financial indebtedness may be adjusted in the event of changes to the macroeconomic situation, or allowed to deviate for a shorter period of time due to acquisitions. Seasonality adjusted net debt, when assessing the capital structure target, is defined as a 4 quarter rolling net debt adjusted for IAS 19 revaluation impact on pension liabilities.
Capital structure
SEKm 2014 2013
Interest-bearing liabilities 7,504 7,290
Less: liquid funds –2,105 –1,884
Net debt, excluding net pension liabilities 5,399 5,406
Total equity 12,170 11,390
Total assets 29,344 26,762
Net pension liabilities 1,835 1,253
Net debt1 7,234 6,659
EBITDA (12m) 3,325 2,586
Net debt/EBITDA 2.18 2.58
Equity/assets ratio 41.5% 42.6%
1 As reported
Liquid fundsLiquid funds consist of cash and cash equivalent and other short-term deposits including derivative assets at fair market value. Husqvarna’s goal is that the level of liquid funds, including unutilized committed credit facil-
NOTE 19 Financial risk management and financial instruments
FINANCIAL RISK MANAGEMENTFinancial risk management for Husqvarna entities is undertaken in accordance with the Group Financial Policy. Described below are the prin-ciples of financial risk management applicable to Husqvarna. Husqvarna is exposed to a number of risks relating to financial instruments including, for example, liquid funds, trade receivables and other receivables, trade payables and other liabilities, borrowings, and derivative instruments. The primary risks associated with these instruments are:• Financing risks in relation to the Group’s capital requirements.• Interest rate risks on liquid funds and borrowings.• Foreign exchange risks on export and import flows plus earnings and
net investments in foreign operations.• Commodity price risks affecting expenditure on raw materials and
components for goods produced. • Credit risks relating to financial and commercial activities.
The Board of Directors of Husqvarna has adopted a Group Financial Policy, as well as a Group Credit Policy to regulate the management and control of these risks. These risks are to be managed according to the limitations stated in the Financial Policy. The Financial Policy also describes the manage ment of risks relating to pension fund assets. The purpose of the policy is to have enough funding available to minimize the Group’s cost of capital and to achieve an effective management of the Group’s financial risks.
The management of financial risks has largely been centralized to Husqvarna Group Treasury, where measurement and control of financial risks are performed on a daily basis by a separate risk control function. Furthermore, Husqvarna Group’s policies include guidelines for manag-ing operating risk relating to financial instruments, e.g. through the clear assignment of responsibilities and the allocation of powers of attorney.
Proprietary trading in currencies and interest-bearing instruments is permitted with tight limits set within the framework of the Financial Policy. The primary purpose of such trading is to maintain a flow of high quality information and market knowledge, as well as to contribute to the proactive management of the Group’s financial risks.
FINANCING RISKFinancing risk refers to the risk that the financing of the Group’s capital requirements and the refinancing of existing loans could become more dif-ficult or more costly. This risk can be decreased by ensuring that maturities are evenly distributed over time, and that total short-term borrowings do not exceed available liquidity. Disregarding seasonal variations, net debt shall be long-term, according to the Financial Policy. The Group’s goals for
Annual Report 2014 Husqvarna Group 86

Financial Statements – Group
Notes
ities, shall equal at least 2.5 percent of rolling 12-month sales. At year-end, this ratio was 21.6 percent (26.0). In addition, the Group shall have sufficient liquid resources to finance the expected seasonal build-up in working capital during the next 12 months.
BorrowingsThe financing of Husqvarna is managed centrally by Group Treasury in order to ensure efficiency and risk control. Debt is primarily raised at Parent Company level and transferred to subsidiaries as internal loans or capital injections. In this process, various derivatives are used to convert the funds to the required currency. Financing is also undertaken locally, mostly in countries in which there are legal restrictions preventing financing through Group companies. The major part of the Group’s financing is currently conducted through bilateral loan agreements, bonds through a Swedish Medium Term Note (MTN) program and other bond financing. In addition, the Group has an unutilized committed revolving credit facility which during the year has been amended by reducing the amount from SEK 6bn to SEK 5bn and by extending the maturity from 2016 to 2019, with an option
for an additional 1+1 year. Due to the nature of its business, the Group has major seasonal variations in its funding needs. These variations have during 2014 been managed mainly by utilizing the Group’s commercial paper (CP) program and short-term bank loans.
At year-end 2014, the Group’s total interest-bearing liabilities amounted to SEK 7,504m (7,290), of which SEK 5,598m (6,408) referred to long-term loans.
During the year the group has entered into a bilateral loan amounting to SEK 425m with final maturity 2019. A bond loan amounting to SEK 500m and originally maturing 2015 has been amortized during 2014. Furthermore a bilateral loan originally amounting to USD 140m has been amortized by USD 30m during the year.
Husqvarna has, as mentioned, substantial seasonal variation in its borrowings. The seasonal peak of the indebtedness normally implies additional borrowings of SEK 2,500–3,500m in excess of year-end borrowings, taking dividend into account.
Husqvarna has not breached any conditions in external loan agreements during the year.
Future undiscounted cashflows of loans and other financial instruments as of December 31, 20141
SEKm 2015 2016 2017 2018 2019 >2019 Total
Financial leases –40 –39 –37 –37 –37 –244 –434
Bonds –1,095 –645 –1,579 –1,385 – –78 –4,782
Bank and other loans –149 –779 –39 –895 –428 – –2,290
Derivative liabilities, interest rate2 –20 –16 3 4 – – –29
Derivative liabilities, foreign exchange2 –724 –11 – – – – –735
Trade payables –3,154 – – – – – –3,154
Total financial liabilities –5,182 –1,490 –1,652 –2,313 –465 –322 –11,424
Unutilized committed revolving credit facilities covering short-term financing 5,000 – – – –5,000 – –
Adjusted maturity profile –182 –1,490 –1,652 –2,313 –5,465 –322 –11,424
Liquid funds excl. derivative assets 1,579 – – – – – 1,579
Derivative assets2 494 – – – – – 494
Trade receivables 2,898 – – – – – 2,898
Total financial assets 4,971 – – – – – 4,971
Net financial instruments 4,789 –1,490 –1,652 –2,313 –5,465 –322 –6,453
1 Please note that the table includes the forecast future nominal interest payment and, thus, does not correspond to the net book value in the balance sheet. 2 For more detailed information on derivative contracts, see table under “Credit risk in financial activities” in this note.
Borrowings
SEKm
2014 2013
Total borrowings
Facility amount
Total borrowings
Facility amount
Medium Term Note Program 2,565 5,000 3,029 5,000
Other bond loans 1,928 – 1,915 –
Committed revolving credit facility – 5,000 – 6,000
Long-term bank loans1 1,939 – 1,497 –
Financial leases 181 – 177 –
Commercial papers – 7,000 – 7,000
Other short-term loans 139 – 433 –
Derivative liabilities 752 – 239 –
Total 7,504 17,000 7,290 18,000
1 Originally long-term
Issued – Maturity ProgramNominal amount Currency Coupon
2008–2016 MTN 60 EUR EURIBOR +0.82%
2010–2015 Other 1,000 SEK STIBOR +1.40%
2011–2018 Other 500 SEK STIBOR +1.40%
2012–2017 MTN 1,300 SEK STIBOR + 2.30%
2012–2017 MTN 200 SEK 3.88%
2013–2018 Other 350 SEK STIBOR + 1.77%
2013–2018 MTN 500 SEK 3.60%
Market programsHusqvarna has a MTN program, denominated in SEK, to issue long-term debt in the domestic capital market. The total amount of the program is SEK 5,000m. In addition, Husqvarna has a Swedish CP program. The total amount of the program is SEK 7,000m. The table Borrowings shows outstanding amounts under these two programs.
The currency composition of Husqvarna’s borrowings is dependent upon the currency distribution of the Group’s assets. Currency derivatives are used to obtain the preferred currency distribution.
Net debt – currency composition, excluding net pension liabilities
SEKm
2014 2013
Net debt excl. currency swaps
Net debt incl. currency swaps
Net debt excl. currency swaps
Net debt incl. currency swaps
USD 556 6,975 449 842
SEK 4,216 –2,993 4,532 8,320
EUR 1,144 674 1,031 –4,594
AUD –35 376 –30 410
PLN –12 –166 –12 –101
BRL 31 164 17 120
CZK –19 163 –22 154
HKD –1 153 – 125
CNY –425 –115 –263 –4
Other –56 168 –296 134
Total 5,399 5,399 5,406 5,406
Annual Report 2014 Husqvarna Group 87

Financial Statements – Group
Notes
INTEREST RATE RISKInterest rate risk refers to the adverse effects of changes in market interest rates on the Group’s net income. The main factor determining this risk is the interest-fixing period.
Interest rate risk in liquid fundsGroup Treasury manages the interest rate risk of the investments in relation to a benchmark position defined as a one-day holding period. Any deviation from the benchmark is limited by a risk mandate. The holding periods of investments are mainly short-term. The majority of investments are undertaken with maturities of between 0 and 3 months. The fixed interest term for these current investments was 35 days (14) at the end of 2014. A downward shift in the yield curve of one percentage point would reduce the Group’s interest income by approximately SEK 16m (16) and the Group’s equity by SEK 12m (12).
Interest rate risk in borrowingsThe Financial Policy states that the benchmark for the long-term loan portfolio is an average fixed interest term of 6 months. Group Treasury can choose to deviate from this benchmark on the basis of a risk mandate established by the Board of Directors. However, the maximum average fixed interest term is 3 years. Derivatives, such as interest rate swap agreements, are used to manage the interest rate risk by changing the interest from fixed to floating or vice versa. The average fixed interest term for the non-seasonal debt was 1.6 (1.5) years at year-end. On the basis of volumes and interest fixings at the end of 2014, a one-percentage point shift in interest rates would impact the Group’s interest expenses by approximately SEK +/– 23m (27) before tax. Interest rates with different maturities and different currencies may not change uniformly. This calculation is based on a parallel shift of all yield curves simultaneously by one percentage point. The Group has seasonal debt for which the interest risk is not calculated due to its short-term nature. As per December 31, 2014, the average interest rate in the total loan portfolio was 3.5 percent (4.0). At year-end, Husqvarna had outstanding interest rate derivatives with a nominal amount of SEK 1,358m (1,906) hedging the interest rate risk.
Hedge accounting of interest rate riskHusqvarna applies hedge accounting for the hedging of interest rate risk.The total market value for hedges of interest rate risk amounted to SEK –30m as of December 31, 2014, of which SEK –27m is reported in the hedge reserve. Assuming an unchanged market interest rate, the effects on income after financial items for 2015 would be SEK –3m for Q1, SEK –5m for Q2, SEK –5m for Q3 and SEK –4m for Q4. During the year no ineffective-ness has occurred in the hedging of interest rate risk.
The table “Future undiscounted cashflows of loans and other financial instruments” shows the future cashflows of the interest rate hedges. The cashflows of 2015, assuming an unchanged market interest rate, would be SEK –6m for Q1, SEK –5m for Q2, SEK –5m for Q3 and SEK –4m for Q4.
FOREIGN EXCHANGE RISKForeign exchange risk refers to the adverse effects of changes in foreign currency exchange rates on Husqvarna’s income and equity. In order to manage such effects, the Group covers these risks within the framework of the Financial Policy. The Group’s overall currency exposure is managed centrally. The major currencies to which Husqvarna is exposed are EUR, USD, CAD and CNY.
Transaction exposure from commercial flowsThe Financial Policy stipulates hedging of forecasted sales and purchases in foreign currencies, taken into consideration the price fixing periods and the competitive environment. Normally, 75–100 percent of the invoiced and forecasted flows are hedged up to and including 6 months, while fore-casted flows for 7–12 months are hedged between 50–75 percent. Group subsidiaries primarily cover their risks in commercial currency flows through Group Treasury. Group Treasury assumes the currency risks and covers such risks externally by utilizing currency derivatives, for which hedge accounting is applied.
The table below shows the forecasted transaction flows (imports and exports) for 2015, hedges at year-end 2014 and comparative amounts for the previous year.
Commercial flows
Currency SEKm
2014 2013
2015 Fore casted flow
Total hedge amount
2014 Forecasted flow
Total hedge amount
EUR 2,963 –2,511 1,738 –1,426
CAD 907 –552 729 –522
AUD 490 –323 414 –283
CHF 421 –340 345 –269
NOK 336 –244 384 –274
DKK 302 –230 –283 –200
Other 1,165 –334 2,263 –1,085
CNY –565 493 –667 557
USD –2,716 1,792 –1,578 1,193
SEK –3,303 2,249 –3,345 2,309
The hedging effect on operating income amounted to SEK –54m (–3) during 2014. At year-end, the unrealized exchange rate result on forward contracts, all maturing in 2015, amounted to SEK 155m (–10).
Translation exposure on consolidation of entities outside SwedenChanges in exchange rates also affect the Group’s income when translating income statements of foreign subsidiaries into SEK. Husqvarna does not hedge such exposures. The translation exposure arising from income statements of foreign subsidiaries is included in the sensitivity analysis below.
Exposure from net investments in foreign operationsThe net assets and liabilities in foreign subsidiaries constitute a net investment in foreign operations, which generates a translation difference in connection with consolidation. In order to limit negative effects on Group equity resulting from translation differences, part of the Group’s net investments in foreign operations is hedged with foreign exchange derivatives. This means that a decline in value of a net investment is offset by exchange gains on foreign exchange derivative contracts.
Foreign exchange sensitivity from transaction and translation exposureHusqvarna is particularly exposed to changes in the exchange rates of EUR and USD. Furthermore, the Group has significant exposures against CAD, CNY, AUD and a number of other currencies. Using a static calculation and disregarding any effects from hedges, a 10 percent increase or decrease in the value of all currencies against SEK would affect the Group’s result before financial items and tax by approximately SEK +/–490m (475) for one year. A 10 percent increase of USD would affect the Group’s result with SEK –220 (–135) and a corresponding decrease of EUR with SEK –320m (–205). This assumes the same distribution of earnings and costs as in 2014 and does not include any dynamic effects, such as changes in competitive-ness or consumer behaviour arising from such changes in exchange rates. It is also worth noting that, due to the seasonality in Husqvarna’s sales, these flows and results are not distributed evenly throughout the calendar year.
For more information on risks related to currency exposure, see Risk Management on page 46.
Hedge accounting of currency riskHusqvarna applies hedge accounting for the hedging of commercial flows and when applicable for hedging of net investments in foreign operations. The total market value for hedges of commercial flows amounted to SEK 165m as of December 31, 2014 of which SEK 140m is reported in the hedge reserve. Assuming an unchanged exchange rate, the effects on income after financial items for 2015 would be SEK 59m for Q1, SEK 66m for Q2, SEK 15m for Q3 and SEK 0m for Q4. As of December 31, 2014, EUR 482m and USD 800m of net investments in foreign operations were hedged. The total market value of the net investment hedges amounted to SEK -370m of which SEK -368m is reported in the hedge reserve. During the year no ineffectiveness has occurred in the hedging of currency risk.
COMMODITY PRICE RISKCommodity price risk is the risk of increase in the cost of direct and indirect materials should underlying commodity prices rise on the global markets. Husqvarna is exposed to fluctuations in commodity prices through agreements with suppliers, whereby the price is linked to the raw material price on the world market. This exposure can be divided into direct
Annual Report 2014 Husqvarna Group 88

Financial Statements – Group
Notes
commodity exposure, which refers to pure commodity exposure, and indirect commodity exposure, which is defined as exposure arising from only a portion of a component. Commodity price risk is managed through contracts with the suppliers rather than through the use of derivatives. A ten percent rise or fall in the price of steel used in Husqvarna’s products will affect the Group’s results before financial items and tax by approximately SEK +/–160m (150), everything else being equal. The same effect on the price of aluminium would impact the results by SEK +/–45m (45) and a 10 percent change in the price of plastics would give an effect on results of SEK +/–90m (85).
CREDIT RISKCredit risk in trade receivablesHusqvarna sells to a substantial number of customers including large retailers, buying groups, independent stores and professional users. Sales are made on the basis of normal delivery and payment terms. Customer financing solutions are normally arranged by third parties. The Credit Policy of the Group ensures that the management process for customer credits includes customer rating, credit limits, decision levels and management of bad debts. The Board of Directors decides on customer credit limits exceeding SEK 100m. Husqvarna uses an internal classification of the credit worthiness of its customers. The classification has different levels, from low risk to high risk. In the table below, trade receivables have been divided into three different intervals.
SEKm 2014 2013
Total 2,898 2,816
Low to Moderate Risk 1,808 1,540
Medium Risk to Elevated 986 1,117
High Risk 104 159
As of December 31, 2014 net trade receivables, after provisions for doubtful accounts, amounted to SEK 2,898m (2,816), which consequently equals the maximum exposure to losses in trade receivables. Hence, the book value equals the fair market value of the receivables. The size of the credit portfolio is, however, directly dependent upon the seasonal pattern of Husqvarna’s sales. This means that credit exposure is significantly higher during the first six months of each calendar year. A provision for impairment of trade receivables is established when there is objective evidence that Husqvarna will not be able to collect all amounts due according to the original terms of the receivables. The amount of the provision is the difference between the asset’s carrying amount and the present value of estimated future cash flows, discounted at the effective interest rate. Provisions for doubtful trade receivables at the end of the financial year amounted to SEK 128m (106), of which SEK 128m refer to invoices due.
Trade receivables past dueTrade receivables that were past due, but not yet written down amounted to SEK 524m (484) as of December 31, 2014.
Ageing analyses for past due trade receivables
Past due but not written down, SEKm 2014 2013
Up to 1 month 196 171
1 to 3 months 101 99
>3 months 227 214
524 484
Provisions for overdue accounts receivables
SEKm 2014 2013
Opening balance, Jan 1 106 113
New provisions 40 50
Reversed unused provisions –7 –19
Write-off accounts receivables –17 –35
Currency exchange rate differences 6 –3
Closing balance, Dec 31 128 106
The situation regarding past due receivables has not changed significantly since previous year-end, taking the total volume of outstanding trade receivables into account. The fair value of collateral held for trade receivables due for payment was SEK 22m (27).
A plan for repayment is normally designed for customers with past due receivables at the same time as the account is placed under special surveillance. At a later stage, unpaid products may be repossessed or other securities be enforced.
Concentration of credit risk in trade receivables
Concentration of credit risk
2014 2013
Number of customers
Percent of total
portfolioNumber of customers
Percent of total
portfolio
Exposure <SEK 15m u/a 87% u/a 81%
Exposure SEK 15–100m 9 9% 12 14%
Exposure >SEK 100m 1 4% 1 5%
Husqvarna has substantial exposure towards a limited number of large customers, primarily in the U.S.
Credit risk in financial activitiesExposure to credit risk arises from the investment of liquid funds and through counterparty risks related to derivatives. In order to limit exposure to credit risk, a counterparty list has been created specifying the maximum approved exposure for each counterparty. Investments in liquid funds are mainly made in interest-bearing instruments with high liquidity and involve issuers with a long-term credit rating of at least A-, as defined by Standard & Poor’s or similar institutions. The average time to maturity for the liquid funds was 35 days (14) at the end of 2014. A substantial part of the exposure arises from derivatives transactions.
The table below shows the gross volume of outstanding derivative transactions.
Maturity
2014 2013
2015 2016- 2014 2015-
Amount sold –30,313 –105 –17,970 –
Amount purchased 30,081 94 18,013 –
Net settled derivatives (NDF) 1 0 0 –
Net –231 –11 43 –
FAIR VALUE ESTIMATIONBelow is a description of financial instruments carried at fair value, based on the classification in the fair value hierarchy. The different levels have been defined as follows:
• Quoted prices (unadjusted) in active markets for identical assets or liabilities (Level 1),
• Inputs other than quoted prices included within Level 1 that are observable, either directly (i.e. as prices) or indirectly (i.e. derived from prices) (Level 2); and
• Inputs that are not based on observable market data (Level 3).
The Group´s financial instruments carried at fair value are derivatives. Derivatives belong to Level 2 as future cash flows have been discounted using current quoted market interest rates and exchange rates for similar instruments.
To determine the fair value of the Group’s borrowings, the prevailing market rates for the respective periods have been used and the Group’s credit risk has been taken into account. Changes in credit spreads have been disregarded when determining fair value of financial leases. For short-term financial instruments such as trade receivables and other receivables, other short-term investments, cash and cash equivalents, trade payables and other liabilities, and short term borrowings the fair value equals their carrying amount as the impact of discounting is not significant. Fair value of long-term borrowings are based on discounted cash flows using a rate based on the borrowing rate, and are within level 2 in the fair value hierarchy.
Annual Report 2014 Husqvarna Group 89

Financial Statements – Group
Notes
SEKm
2014 2013
Carrying amount Fair value
Carrying amount Fair value
Financial assetsFinancial assets at fair value through profit or loss
– of which derivatives where hedge accounting is not applied 285 285 220 220
– of which currency derivatives where hedge accounting for cash flow hedges is applied 241 241 53 53
Loans and receivables
Trade receivables 2,898 2,898 2,816 2,816
Other receivables 385 385 288 288
Other short-term investments 0 0 17 17
Cash and cash equivalents 1,579 1,579 1,594 1,594
Total financial assets 5,388 5,388 4,988 4,988
Financial liabilitiesFinancial liabilities at fair value through profit or loss
– of which derivatives where hedge accounting is not applied 256 256 131 131
– of which currency derivatives where hedge accounting for cash flow hedges is applied 101 101 69 69
– of which interest derivatives where hedge accounting for cash flow hedges is applied 27 27 39 39
– of which currency derivatives related to net investments in foreign operations where hedge accounting is applied 368 368 – –
Other financial liabilities
Trade payables 3,154 3,154 2,838 2,838
Other liabilities 238 238 192 192
Financial leases 181 201 177 185
Borrowings 6,571 6,740 6,874 7,012
Total financial liabilities 10,896 11,085 10,320 10,466
NOTE 20 Provisions for pensions
In many of the countries in which Husqvarna has operations the employees are covered by pension plans in addition to statutory social security insurance. Such pension plans are classified as either defined contribution plans or defined benefit plans. The Group’s most extensive defined benefit pension plans are in the U.K., Germany, Sweden, the U.S. and Japan. The pension plans in these countries are funded except for the plan in Germany which is unfunded. Funded plans imply that there are assets in legal entities that exist solely to finance benefits to employees and former employees.
The pension plan for the Group’s employees in Germany is an unfunded cash balance plan. White collar employees in Sweden, born 1978 or earlier, are covered by a final salary collectively bargained defined benefit plan (ITP2). The old-age pension benefit of the plan is financed through a pension fund.
SEKm
2014
U.K. Sweden U.S. Japan Germany Other Total
Present value of obligation 1,344 922 490 169 1,114 204 4,243
Fair value of plan assets –1,316 –512 –310 –105 – –165 –2,408
Deficit 28 410 180 64 1,114 39 1,835
Total funding level (%) 98 56 63 62 – 80 57
Duration 20 21 15 11 12 14 17
Actuarial assumptions (%)Discount rate 3.6 2.6 3.6 / 3.9 0.9 1.8 2.1 2.7
Inflation 3.1 1.5 – – – 2.0 2.3
Sensitivity analysisDiscount rate (–0.50%) 10.1% 11.1% 7.2% 5.7% 5.9% 6.4% 8.3%
Discount rate (+0.50%) –8.7% –9.5% –6.4% –5.4% –5.4% –5.7% –7.7%
Inflation (+0.50%) 3.5% 7.7% – – – 2.1% 3.1%
The Group’s defined benefit pension plans in the U.K. and in the U.S. were closed, some time ago, for future pension accrual. In Japan the Group has two pension plans that cover all employees. One of the plans is a funded cash balance plan and the other is an unfunded plan based on career- average salary.
The pension plans in Japan, U.K., Sweden and the U.S. are so called funded plans where the pension obligations are financed through pension funds whose operations are regulated by the legislation in the relevant country. The pension funds are separate legal entities with their own Board of Directors/Trustees etc., which might consist of representatives from both the company and the employees, which are responsible for the management of the pension fund asset.
Annual Report 2014 Husqvarna Group 90

Financial Statements – Group
Notes
SEKm
2013
U.K. Sweden U.S. Japan Germany Other Total
Present value of obligation 1,013 674 335 136 807 215 3,180
Fair value of plan assets –1,007 –459 –237 –83 – –141 –1,927
Deficit 6 215 98 53 807 74 1,253
Total funding level (%) 99 68 71 61 – 66 61
Duration 18 21 13 12 11 14 16
Actuarial assumptions (%)Discount rate 4.5 4 4.7 1.5 3.5 3.5 3.9
Inflation 3.4 – – – – 1.5 2.6
Sensitivity analysisDiscount rate (–0.50%) 9.6% 11.4% 6.8% 6.2% 5.6% 4.3% 8.2%
Discount rate (+0.50%) –8.5% –10.0% –6.1% –5.9% –5.0% –3.9% –7.3%
Inflation (+0.50%) 3.3% – – – – 1.2% 1.1%
Specification of net provisions for pensions and other post employment benefits recognized in the balance sheet
SEKm 2014 2013
Present value of obligations for unfunded plans 1,288 1,025
Present value of obligations for funded plans 2,955 2,155
Fair value of plan assets –2,408 –1,933
Impact of minimum funding requirement/asset ceiling – 6
Net provisions for defined benefit plans 1,835 1,253
Set forth below are schedules showing the obligations of the plans in Husqvarna, the assumptions used to determine these obligations and the
assets relating to the benefit plans, as well as the amounts recognized in the income statement, other comprehensive income and balance sheet. Further information regarding pension cost is available in note 4.
The schedules include reconciliations of the opening and closing balances of the present value of the defined benefit obligation, as well as opening and closing balances of the fair value of plan assets and of the changes in net provisions during the year. In a few countries, Husqvarna provides mandatory lump sum payments, in accordance with law or collective agreements, in conjunction with retirement. These obligations are included in the present value of the defined benefit obligation and amounts at year-end to SEK 40m (31). Husqvarna has no post-employment medical plans.
The movement in the present value of the net defined benefit obligation
SEKm
2014 2013
Present value of obligation
Fair value of plan assets Total
Present value of obligation
Fair value of plan assets Total
Opening balance 3,180 –1,927 1,253 3,369 –1,891 1,478Current service cost 62 6 68 64 6 70
Past service costs and gains/losses on settlements 9 – 9 –21 – –21
Interest expense 126 –84 42 118 –69 49
3,377 –2,005 1,372 3,530 –1,954 1,576
Remeasurements:Return on plan assets – –171 –171 – –107 –107
Actuarial gains and losses due to changes in demographic assumptions 45 – 45 8 – 8
Experience assumptions 8 – 8 12 – 12
Actuarial gains and losses due to changes in financial assumptions 646 – 646 –123 – –123
Changes in asset ceiling – –7 –7 – 6 6
699 –178 521 –103 –101 –204
Exchange rate differences on foreign plans 288 –208 80 9 5 14
Divestments and transfers – – – –27 27 –
Contributions:– Employers –76 –62 –138 –76 –57 –133
– Plan participants 3 –3 – 3 –3 –
Payments from plans:– Benefit payments –48 48 – –57 57 –
– Settlements – – – –99 99 –
Closing balance 4,243 –2,408 1,835 3,180 –1,927 1,253
Annual Report 2014 Husqvarna Group 91

Financial Statements – Group
Notes
Plan assets comprise of the following1:
2014 2013
SEKm % SEKm %
Equity instruments– Equities 1,014 42.2 873 45.3
Debt securities– Government bonds 179 7.5 220 11.4
– Corporate bonds 319 13.2 335 17.4
– Index-linked bonds 299 12.4 214 11.1
– Interest rate funds 456 18.9 178 9.2
Properties 14 0.6 10 0.5
Liquid assets 20 0.8 15 0.8
Assets held by insurance company 107 4.4 82 4.3
Total 2,408 100.0 1,927 100.0
1 Approximately 99 percent of total plan assets refers to listed assets.
None of the assets above refers to shares in the Parent Company or real estates occupied by the group.
For the funded defined benefit pension plans (Sweden, U.K. and U.S. represents around 90 percent of the value) the Group’s strategy is a com-bination of matching the assets with the liabilities and trying to achieve as high return as possible within the investment guidelines. This is partly done by investing in longer duration bonds designed to match the development of the debt and also by investing in corporate bonds, index-linked bonds and shares with the purpose of achieving a high return in various market conditions long term.
As the maturity of the pension commitments decreases and/or the value of the assets reaches a satisfactory level in relation to the debt, the Group will gradually reduce the investment risk by shifting into assets with lower volatility.
Husqvarna is through its defined benefit obligations exposed to a number of risks, of which the following has the greatest impact on the Group’s net pension liability.
Discount rateThe discount rate reflects the estimated timing of benefit payments and is used for measuring the present value of the obligation. A fluctuation in the discount rate will have a material effect on the pension obligation but will also impact the interest income and expense reported in the finance net. To determine the discount rate, AA-rated corporate bonds indexes matching the duration of the pension obligations are applied in most countries. When valuing Swedish pension liabilities Husqvarna uses mortgage bonds when determining discount rate.
Inflation riskMost of the obligations are linked to inflation and an increase in inflation leads to higher debt. The return of the majority of the plan assets has a low correlation with inflation, while the holdings of index-linked bonds are protected against a rise in inflation and thus compensates for the increase in the deficit that would occur otherwise.
Longevity riskSince most of the pension obligations means that those covered by the plan will receive benefits for life, higher life expectancy assumptions have a significant impact on the pension liabilities.
The company expects to make contributions of approximately SEK 143m to the plans during 2015.
The weighted average duration of the defined benefit obligation is 16.8 years. Expected maturity analysis of undiscounted pension liabilities as per December 31, 2014 are outlined below:
Maturity analysis
SEKm < 1 year 1–2 year 2–5 year 5–10 years
Defined benefit obligations 168 141 465 872
Total 168 141 465 872
NOTE 21 Other provisions
SEKm
Provisions for restruc-
turing
Warranty commit-
ments Claims Other Total
Opening balance, Jan 1, 2014 167 338 366 188 1,059Provisions made – 373 – 181 554
Provisions used –121 –340 –78 –122 –661
Unused amounts reversed – –1 – –2 –3
Exchange rate differences 11 34 62 2 109
Closing balance, Dec 31, 2014 57 404 350 247 1,058
Current provisions 42 120 0 48 210
Non-current provisions 15 284 350 199 848
Provisions for restructuringProvisions for restructuring refer to the expected payments to be incurred in the coming years as a consequence of Husqvarna’s decision to close some factories, rationalize production and reduce personnel. The amounts are based on the Husqvarna management’s best estimates and are adjusted when changes to these estimates are known.
Warranty commitmentsProvisions for warranty comprise all potential expenses for repairing or replacing products sold. Provisions are made when the products are sold and are normally limited to 24 months.
ClaimsProvisions for claims refer to claim reserves in Husqvarna’s insurance companies mainly due to product liabilities but also property damage and business interuptions. The provisions are estimated based on acturarial calculations.
OtherOther provisions are in all material aspects referring to payroll related provisions.
NOTE 22 Other liabilities
SEKm
Group
2014 2013
Accrued holiday pay 200 187
Other accrued payroll expenses 622 425
Other accrued expenses 884 809
Value added tax 90 75
Personnel taxes and other taxes 58 51
Other operating liabilities 141 86
Total 1,995 1,633
Annual Report 2014 Husqvarna Group 92

Financial Statements – Group
Notes
NOTE 23 Pledged assets and contingent liabilities
Pledged assets
SEKm 2014 2013
Pension obligations1 74 61
Real estate mortgages 30 26
Total 104 87
1 Refers to endowment that is pledged in favor of the recipient.
Contingent liabilities
SEKm 2014 2013
On behalf of external counterpartiesGuarantees and other commitments 102 89
Total 102 89
In addition to the above contingent liabilities, guarantees for fulfillment of contractual undertakings are provided as part of Husqvarna’s normal course of business. There was no indication at year-end that any payment will be required in connection with any contractual guarantees. Furthermore, there is an obligation, in the event of dealer’s bankruptcy, to buy back repossessed Husqvarna products from certain North American dealers financing their floor planning with an external finance company. During 2014 goods amounting to a value of SEK 5m (4) were bought back in connection with floor planning activities.
Husqvarna is involved in commercial, product liability and other dis-putes in the ordinary course of business. Such disputes involve claims for compensatory damages, property damage or personal injury compen-sation and occasionally also punitive damages. Although the company is self-insured to a certain extent, it is also insured against excessive liability losses. Husqvarna continuously monitors and evaluates pending claims and disputes, and take action when deemed necessary. The company believes that these activities help to minimize the risks. It is difficult to predict the outcome of each dispute, but based on its present knowledge, Husqvarna estimates that none of these disputes may have a material adverse effect on the consolidated financial position or result.
Gas explosion in BelgiumThe case regarding a gas explosion on Husqvarna’s property in Ghislenghien, Belgium, in 2004, which was reported in previous annual reports, was closed in 2014. No further costs are deemed to arise for Husqvarna.
NOTE 24 Related party transactions
Sales to related parties are carried out on market-based terms. See the Parent Company’s directly owned subsidiaries in the Parent Company’s note 15, Shares in subsidiaries. Information about the Board of Directors and Group Management and compensation to those are reported in note 4, Employees and employee benefits. No unusual transactions have occurred between Husqvarna Group and the Board of Directors or Group Management. The value of those business transactions are insignificant.
Annual Report 2014 Husqvarna Group 93

Financial Statements – Parent Company
Financial Statements – Parent Company
Parent Company Income Statement
SEKm Note 2014 2013
Net sales 3 11,453 10,442
Cost of goods sold 5 –8,762 –8,530
Gross income 2,691 1,912
Selling expenses 5 –1,300 –1,208
Administrative expenses 5 –693 –608
Other operating income 6 – 1
Other operating expenses 6 – 0
Operating income 4, 5, 7, 8 698 97
Income from financial items
Income from participation in Group companies 9 1,474 1,330
Financial income 10 52 72
Financial expenses 10 –1,239 –387
Income after financial items 985 1,112
Appropriations 11 –406 –317
Income before taxes 579 795
Tax on profit for the year 12 200 116
Income for the period 779 911
Parent Company Comprehensive Income Statement
SEKm 2014 2013
Income for the period 779 911
Other comprehensive income
Items that may be reclassified to the income statement:Cash flow hedges
Result arising during the period 105 –14
Tax on result arising during the period –23 3
Reclassification adjustments for gains/losses included in the income statement 40 42
Tax on reclassification adjustments for gain/losses included in the income statement –9 –13
Other comprehensive income, net of tax 113 18
Total comprehensive income for the period 892 929
Annual Report 2014 Husqvarna Group 94

Financial Statements – Parent Company
Parent Company Balance Sheet
SEKm Note Dec 31, 2014 Dec 31, 2013AssetsNon-current assetsIntangible assets 13 1,472 1,540Property, plant and equiment 14 1,118 824Financial assets Shares in subsidiaries 15 29,133 28,330 Other financial assets 16 75 73Deferred tax assets 12 354 185Total non-current assets 32,152 30,952
Current assetsInventories 17 1,449 1,317Receivables Trade receivables 18 332 336 Receivables from Group companies 18 2,451 3,717 Derivatives 18 729 306 Other receivables 18, 19 94 83 Prepaid expenses and accrued income 19 109 113Cash and cash equivalents 18 166 89Total current assets 5,330 5,961Total assets 37,482 36,913
Equity and liabilitiesRestricted equityShare capital 1,153 1,153Revaluation reserve 4 4Statutory reserves 18 18
Non-restricted equityShare-premium reserve 2,605 2,605Fair value reserve 72 –41Profit or loss brought forward 14,050 13,986Income for the period 779 911Total equity 18,681 18,636
Untaxed reserves 11 25 27
Provisions Provisions for pensions and other post employment benefits 21 2 20Other provisions 22 73 109Total provisions 75 129
Non-current liabilities Borrowings 18 5,262 6,119Liabilities to Group companies 18 8,471 8,575Derivatives 18 30 13Total non-current liabilities 13,763 14,707
Current liabilitiesBorrowings 18 1,013 509Liabilities to Group companies 18 1,761 1,431Trade payables 18 703 637Tax liabilities 4 4Derivatives 18 877 349Other liabilities 20 580 484Total current liabilities 4,938 3,414Total equity and liabilities 37,482 36,913
Pledged assets 23 74 61Contingent liabilities 23 554 485
Annual Report 2014 Husqvarna Group 95

Financial Statements – Parent Company
SEKm Note 2014 2013
Cash flow from operations
Income after financial items 985 1,112
Non cash items Depreciation, amortization and impairment 423 472
Capital gains – –1
Other non-cash items 158 23
Taxes paid – 136
Cash flow from operations, excluding change in operating assets and liabilities 1,566 1,742
Change in operating assets and liabilities
Change in inventories –132 492
Change in trade receivables 4 –56
Change in inter-company receivables/liabilities 1,472 477
Change in other current assets –430 82
Change in current liabilities and provisions 623 –90
Cash flow from operating assets and liabilities 1,537 905
Cash flow from operations 3,103 2,647
Investments
Paid shareholder's contribution -1 767 -31
Repaid shareholder's contribution 65 –
Redemption of preferred stock 899 –
Investments in intangible assets 13 –236 –230
Investments in property, plant and equipment 14 –422 –352
Sale of property, plant and equipment and intangible assets 2 4
Cash flow from investments –1,459 –609
Cash flow from operations and investments 1,644 2,038
Financing
Change in current borrowings 505 –790
New non-current borrowings 425 850
Amortization of non-current borrowings –1,266 –950
Dividend paid to shareholders –859 –859
Group contribution paid –377 –291
Transfer of treasury shares 5 –
Cash flow from financing –1,567 –2,040
Total cash flow 77 –2Cash and cash equivalents at beginning of year 89 91
Cash and cash equivalents at year-end 166 89
Parent Company Cash Flow Statement
Annual Report 2014 Husqvarna Group 96

Financial Statements – Parent Company
SEKm Share capitalRestricted
reservesFair value
reserve
Share- premium
reserve
Profit or loss brought forward Total
Opening balance, Jan 1, 2013 1,153 22 –59 2,605 14,838 18,559Total comprehensive income – – 18 – 911 929
Share-based payments – – – – 7 7
Dividend SEK 1.50 per share – – – – –859 –859
Closing balance, Dec 31, 2013 1,153 22 –41 2,605 14,897 18,636
Total comprehensive income – – 113 – 779 892
Share-based payments – – – – 7 7
Transfer of treasury shares1 – – – – 5 5
Dividend SEK 1.50 per share – – – – –859 –859
Closing balance, Dec 31, 2014 1,153 22 72 2,605 14,829 18,681 1 Options exercised related to 2009 LTI-program
Information regarding Parent Company’s shares and share capital is available in the Group’s note 19.
Parent Company Statement of Changes in Equity
Annual Report 2014 Husqvarna Group 97

Financial Statements – Parent Company
NOTE 1 Parent Company’s accounting and valuation principles
Husqvarna AB’s (publ) Annual Report has been prepared in accordance with the Swedish Annual Accounts Act and the Swedish Financial Reporting Board’s standard RFR 2. The Parent Company follows the International Financial Reporting Standards (IFRS) adopted by EU, to the extent possible within the framework for the Swedish Annual Accounts Act and Tryggandelagen, and considering the relationship between accounting and taxation. The Parent Company is following the same principles as described in the Group note 1, with the below exceptions.
SegmentsInformation is reported in accordance with the Swedish Annual Accounts Act and contains disclosures of net sales divided by geography.
Property, plant and equipmentThe Parent Company accounts for tax depreciation in accordance with the Swedish tax law as appropriations in the Income statement. These depreciations are accounted for in addition to the depreciation described in the section “Property, plant and equipment” in the Group’s note 1 and are reported as untaxed reserves in the Balance sheet.
Shares in subsidiariesShares in subsidiaries are reported at cost deducted for impairment. Expenses and potential additional purchase price, related to an acquisition are included in the acquisition value of the investment. Investments are tested annually for impairment or if there is an indication of that the book value of the investment is higher than the recoverable amount. Dividends are reported as income.
PensionsHusqvarna Group applies IAS 19 for pension assets and liabilities. The Parent Company applies the Swedish Safe-guarding of Pension Commitments Act (Tryggandelagen).
Notes
Group contributions Husqvarna AB applies the alternative rule in RFR 2, and accounts for both group contribution received and paid as appropriations.
Contingent liabilitiesThe Parent Company has signed guarantees in favor of subsidiaries which in accordance with IFRS are classified as a financial guarantee. However, the Parent Company applies RFR 2 and recognizes these guarantees as contingent liabilities.
NOTE 2 Financial risk management
Husqvarna Group applies common risk management for all units. Group Treasury is part of the Parent Company and the description of financial risk management available in the Group’s note 19 is in all material aspects applicable also for the Parent Company.
NOTE 3 Net sales distribution
Net sales are distributed on the following geographic markets:
Net sales
SEKm 2014 2013
Europe 8,642 7,786
North America 1,127 1,104
Rest of the World 1,684 1,552
Total 11,453 10,442
NOTE 4 Employees and employee benefits
Average number of employees
2014 2013
Numberof men
Numberof women Total
Numberof men
Numberof women Total
Board, President and CEO and Group Management 14 6 20 11 6 17
Sweden 1,276 373 1,649 1,328 391 1,719
Total Parent Company 1,290 379 1,669 1,339 397 1,736
Salary cost
SEKm
2014 2013
Salaries and remunerations
(whereof bonuses)
Social expenses
Pension expenses
Salaries and remunerations
(whereof bonuses)
Social expenses
Pension expenses
Board, President and CEO and Group Management 63 (25) 19 11 47 (12) 15 14
Other employees 855 265 51 791 241 48
Total Parent Company 918 284 62 838 256 62
For further information regarding remunerations to the Board of Directors, President and CEO and the Group Management, and the Group’s long term incentive program see the Group’s note 4.
Annual Report 2014 Husqvarna Group 98

Financial Statements – Parent Company
Notes
NOTE 5 Expenses by nature
SEKm 2014 2013
Costs for raw materials, components 6,390 6,218
Remuneration to employees 1,264 1,156
Amortization, depreciation and impairment 423 472
Cost for restructuring and staff reduction program 17 0
Other 2,661 2,500
Total 10,755 10,346
NOTE 6 Other operating income and operating expenses
SEKm 2014 2013
Other operating income
Gain on sale of
– Property, plant and equipment – 1
– Operations and shares – 0
Total – 1
Other operating expensesLoss on sale of
– Property, plant and equipment – 0
Total – 0
NOTE 7 Fees to auditors
SEKm 2014 2013
EYAudit fees for the annual audit engagement 5 –
Audit fees not included in the annual audit engagement 0 –
Tax advices 2 –
Other services 14 –
Total fees to EY1 21 –
PwCAudit fees for the annual audit engagement 0 5
Audit fees not included in the annual audit engagement 0 0
Tax advices 0 1
Other services 0 0
Total fees to PwC 0 6
Audit fees to other auditors 0 0
Total fees to auditors 21 6
1 Of the total fee to EY, SEK 9m is related to non-audit fees for work finalized before, or projects initiated before, EY was elected as auditor.
PwC was appointed auditors for the period until the 2014 Annual General Meeting. EY was elected as auditor at the Annual General Meeting.
NOTE 8 Exchange rate gains and losses in operating income
SEKm 2014 2013
Exchange rate gains and losses in operating income –69 11
Total –69 11
Operating income includes SEK –13m (–6) of foreign exchange hedging result previously reported in other comprehensive income. Information related to the accounting of fair value in financial instruments is presented in the Group’s note 1.
NOTE 9 Income from participation in Group companies
SEKm 2014 2013
Dividends 1,474 1,330
Total 1,474 1,330
NOTE 10 Financial income and expense
SEKm 2014 2013
Financial income
Interest income– from subsidiaries 49 46
– from others 3 6
whereof Interest income
– on deposits 37 38
– on derivatives held for trading 15 14
Exchange rate differences– on loans – –33
– on derivatives held for trading – 53
Total financial income 52 72
Financial expenses
Interest expense– to subsidiaries –32 –43
– to others –258 –305
whereof Interest expense
– on loans –210 –254
– on cashflow hedges, interest derivatives –29 –35
– on derivatives held for trading1 –51 –59
Exchange rate differences– on loans –431 –
– on derivatives held for trading2 –486 –
Other financial expenses –32 –39
Total financial expenses –1,239 –387
Financial income and expenses, net –1,187 –315
1 Interest expense on derivatives held for trading includes interest income on derivatives for hedging net investments SEK 10m (–).
2 Currency exchange rate difference on derivatives held for trading includes currency exhange rate differences on derivatives for hedging net investments SEK –925m (–).
NOTE 11 Appropriations and untaxed reserves
SEKm
Appropriations Untaxed Reserves
2014 2013 2014 2013
Group contribution, received 2 10 – –
Group contribution, paid –410 –387 – –
Accumulated depreciation in excess of plan on
Machinery and equipment – 58 – –
Buildings 2 2 25 27
Totalt –406 –317 25 27
Annual Report 2014 Husqvarna Group 99

Financial Statements – Parent Company
Notes
NOTE 12 Tax
SEKm 2014 2013
Current tax on income for the period –1 –1
Deferred tax income 201 117
Total 200 116
Theoretical and actual tax rate
2014 2013
Tax, % SEKm Tax, % SEKm
Theoretical tax rate –22.0 –127 –22.0 –175
Non-taxable/non-deductible income statement items, net 56.6 328 36.7 291
Change in valuation of deferred tax –0.1 –1 –0.1 0
Actual tax rate1 34.5 200 14.6 116
1 Actual tax rate in the Parent Company is explained by a non-taxable dividend from subsidiaries of SEK 1,474 m (1,330).
Deferred tax assets and liabilities
SEKm
Assets Liabilities Net
2014 2013 2014 2013 2014 2013
Non-current assets – – 2 2 –2 –2
Provisions for pensions and similar commitments 24 18 – – 24 18
Other provisions 9 14 – – 9 14
Financial and operating liabilities – 12 20 – –20 12
Tax losses carried forward 343 143 – – 343 143
Deferred tax assets and liabilities, net 376 187 22 2 354 185
Changes in deferred taxes
SEKmBalance,
Jan 1, 2014
Recognized in income
statement
Recognized in comprehensive
income statement
Balance, Dec 31, 2014
Balance, Jan 1, 2013
Recognized in income
statement
Recognized in comprehensive
income statement
Balance, Dec 31, 2013
Non-current assets –2 – – –2 0 –2 – –2
Provision for pensions and similar commitments 18 6 – 24 17 1 – 18
Other provisions 14 –5 – 9 21 –7 – 14
Financial and operating liabilities 12 – –32 –20 22 – –10 12
Tax losses carried forward 143 200 – 343 18 125 – 143
Deferred tax assets and liabilities, net 185 201 –32 354 78 117 –10 185
Annual Report 2014 Husqvarna Group 100
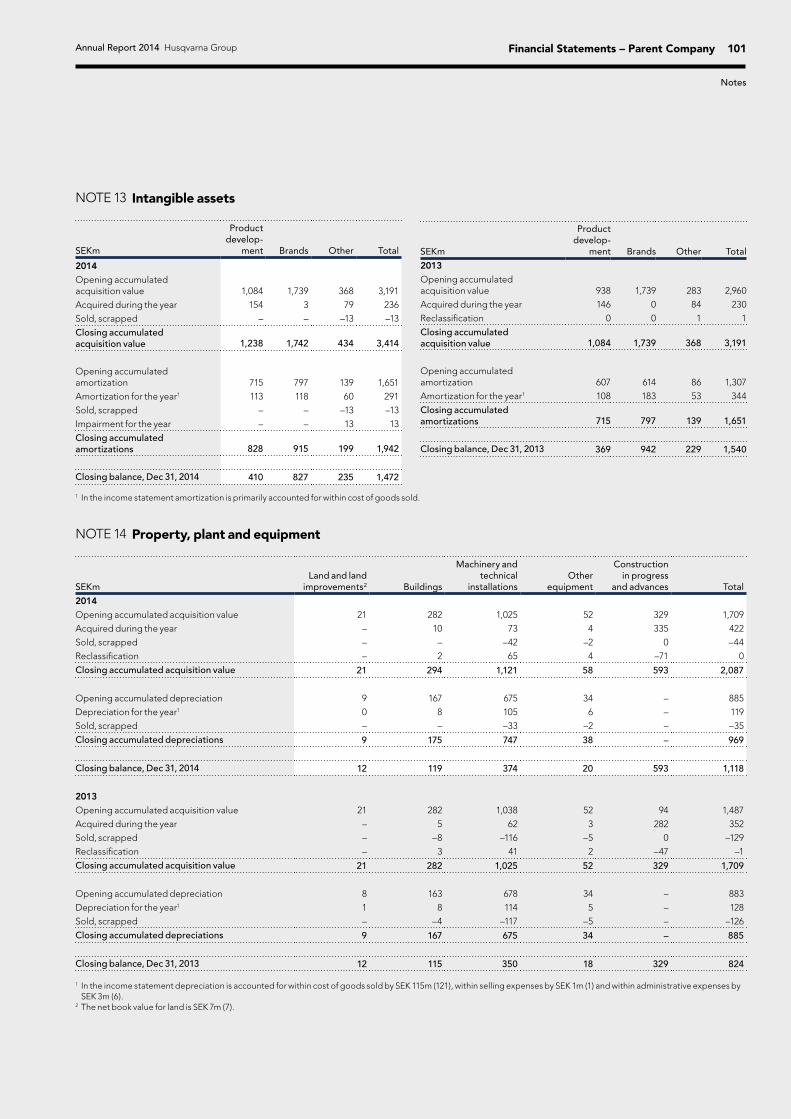
Financial Statements – Parent Company
Notes
NOTE 13 Intangible assets
SEKm
Product develop-
ment Brands Other Total
2014Opening accumulated acquisition value 1,084 1,739 368 3,191
Acquired during the year 154 3 79 236
Sold, scrapped – – –13 –13
Closing accumulated acquisition value 1,238 1,742 434 3,414
Opening accumulated amortization 715 797 139 1,651
Amortization for the year1 113 118 60 291
Sold, scrapped – – –13 –13
Impairment for the year – – 13 13
Closing accumulated amortizations 828 915 199 1,942
Closing balance, Dec 31, 2014 410 827 235 1,472
SEKm
Product develop-
ment Brands Other Total
2013Opening accumulated acquisition value 938 1,739 283 2,960
Acquired during the year 146 0 84 230
Reclassification 0 0 1 1
Closing accumulated acquisition value 1,084 1,739 368 3,191
Opening accumulated amortization 607 614 86 1,307
Amortization for the year1 108 183 53 344
Closing accumulated amortizations 715 797 139 1,651
Closing balance, Dec 31, 2013 369 942 229 1,540
1 In the income statement amortization is primarily accounted for within cost of goods sold.
NOTE 14 Property, plant and equipment
SEKmLand and land
improvements2 Buildings
Machinery and technical
installationsOther
equipment
Construction in progress
and advances Total
2014Opening accumulated acquisition value 21 282 1,025 52 329 1,709
Acquired during the year – 10 73 4 335 422
Sold, scrapped – – –42 –2 0 –44
Reclassification – 2 65 4 –71 0
Closing accumulated acquisition value 21 294 1,121 58 593 2,087
Opening accumulated depreciation 9 167 675 34 – 885
Depreciation for the year1 0 8 105 6 – 119
Sold, scrapped – – –33 –2 – –35
Closing accumulated depreciations 9 175 747 38 – 969
Closing balance, Dec 31, 2014 12 119 374 20 593 1,118
2013Opening accumulated acquisition value 21 282 1,038 52 94 1,487
Acquired during the year – 5 62 3 282 352
Sold, scrapped – –8 –116 –5 0 –129
Reclassification – 3 41 2 –47 –1
Closing accumulated acquisition value 21 282 1,025 52 329 1,709
Opening accumulated depreciation 8 163 678 34 – 883
Depreciation for the year1 1 8 114 5 – 128
Sold, scrapped – –4 –117 –5 – –126
Closing accumulated depreciations 9 167 675 34 – 885
Closing balance, Dec 31, 2013 12 115 350 18 329 824
1 In the income statement depreciation is accounted for within cost of goods sold by SEK 115m (121), within selling expenses by SEK 1m (1) and within administrative expenses by SEK 3m (6).
2 The net book value for land is SEK 7m (7).
Annual Report 2014 Husqvarna Group 101

Financial Statements – Parent Company
Notes
NOTE 15 Shares in subsidiaries
Country SubsidiariesRegistration
number Holding, %
Net book value,
SEKm 2014
Net book value,
SEKm 2013
Australia Husqvarna Australia Pty. Limited 115475619 100 – 215
Belgium Husqvarna Finance Belgium SA 0899.846.135 100 9,322 9,322
Belgium Husqvarna Belgium SA 0400.604.654 100 1,172 1,172
Belgium Husqvarna Finance North America SA 0807.963.478 100 – 5,609
Canada Husqvarna Canada Corp. 82354277RT0001 100 271 337
Colombia Husqvarna Colombia S.A. 900.047.189-0 100 1 1
Denmark Husqvarna Danmark A/S 26205328 100 16 16
Estonia Husqvarna Eesti Osaühing 11159436 100 0 0
Latvia SIA Husqvarna Latvija 40003760065 100 3 3
Slovakia Husqvarna Slovensko s.r.o. 36437115 100 5 5
South Africa Husqvarna South Africa (Proprietary) Limited 2005.025971.07 100 19 19
Sweden Husqvarna Försäkrings AB 516406-0393 100 273 273
Sweden Husqvarna Intellectual Property Holding AB 556745-5893 100 0 0
Sweden Husqvarna Holding Aktiebolag 556037-1964 100 12,499 4,907
U.S. Millhouse Insurance Company 20-4233540 100 79 79
U.S. Husqvarna U.S. Holding, Inc. 34-1946153 100 5,473 6,372
Venezuela Husqvarna Venezuela, C.A. J J-31418196-3 100 0 0
Total 29,133 28,330
There is also a number of subsidiaries to the subsidiaries, a detailed specification of Group companies is available on request from Husqvarna AB, Investor Relations.
NOTE 16 Other financial assets
SEKm 2014 2013
Pension assets 74 61
Receivables Group 0 12
Other long-term receivables 1 0
Total 75 73
NOTE 17 Inventories
SEKm 2014 2013
Supplies including raw materials 329 292
Products in progress 3 3
Finished products 1,117 1,022
Advances to suppliers 0 0
Total 1,449 1,317
Provisions for obsolescence are included in the value of the inventory. Write-downs amounted to SEK 67m (60) and previous write-downs have been reversed by a total of SEK 27m (28).
Annual Report 2014 Husqvarna Group 102

Financial Statements – Parent Company
Notes
NOTE 18 Financial assets and liabilities
Financial assets and liabilities per category
SEKmFinancial assets
valued at fair value
Financial assets for which hedge
accounting is applied
Other financial assets Total
2014
AssetsDerivatives 376 353 – 729
Receivables Group companies1 – – 2,451 2,451
Trade receivables – – 332 332
Other receivables – – 9 9
Cash and cash equivalents – – 166 166
Total 376 353 2,958 3,687
2013
AssetsDerivatives 222 84 – 306
Receivables Group companies – – 3,729 3,729
Trade receivables – – 336 336
Other receivables – – 8 8
Cash and cash equivalents – – 89 89
Total 222 84 4,162 4,468
1 For long-term receivables to Group companies, see note 16.
SEKmFinancial liabilities valued at fair value
Financial liabilities for which hedge
accounting is applied
Other financial liabilites Total
2014
LiabilitiesBorrowings – – 6,275 6,275
Liabilities to Group companies – – 10,232 10,232
Trade payables – – 703 703
Derivatives 646 261 – 907
Total 646 261 17,210 18,117
2013
LiabilitiesBorrowings – – 6,628 6,628
Liabilities to Group companies – – 10,006 10,006
Trade payables – – 637 637
Derivatives 226 136 – 362
Total 226 136 17,271 17,633
DerivativesThe main part of the Group’s derivatives is held by the Parent Company. Disclosures regarding the derivatives are available in the Group’s note 19.
Trade receivablesHusqvarna AB’s trade receivables amount to SEK 332m (336) as per Dec 31, 2014. Trade receivables past due but not impaired amount to SEK 16m (25) as of Dec 31, 2014.
Ageing analysis for past due, but not impaired trade receivables
SEKm 2014 2013
<3 month 9 13
>3 month 7 12
Total past due but not impaired 16 25
Annual Report 2014 Husqvarna Group 103

Financial Statements – Parent Company
Notes
Provision for overdue accounts receivables
SEKm 2014 2013
Opening balance 9 10
New provisions 2 2
Reversed unused provisions 0 –2
Write off accounts receivables –1 –1
Closing balance 10 9
The credit risk in financial assets is described in the Group’s note 19.
BorrowingsThe main part of the borrowings in Husqvarna Group is reported within the Parent Company. For disclosures regarding fair value, maturity profile and interest exposure, see the Group’s note 19.
NOTE 19 Other current assets
SEKm 2014 2013
Value added tax 85 75
Miscellaneous short-term receivables 9 7
Prepaid rents and leases 4 4
Prepaid insurance premiums 2 3
Other prepaid expenses 103 107
Total 203 196
NOTE 20 Other liabilities
SEKm 2014 2013
Accrued holiday pay 107 102
Other accrued payroll expenses 199 137
Other accrued expenses 251 223
Personnel taxes and other taxes 22 21
Other operating liabilities 1 1
Total 580 484
NOTE 21 Provisions for pensions
Specification of the net provision for pensions recognized in the balance sheet
SEKm 2014 2013
Present value of the funded pension obligations 515 451
Fair value of plan assets –513 –459
Surplus/deficit of the pension fund 2 –8
Present value of unfunded pension obligations 0 20
Surplus of the pension fund, not recognized 0 8
Net provision recognized in the balance sheet 2 20 Specification of the change in the net provision for pensions recognized in the balance sheet
SEKm 2014 2013
Opening balance, 1 Jan 20 40Costs for pensions recognized in the income statement 2 4
Benefits paid –20 –24
Closing balance, 31 Dec 2 20
Of total net provisions, SEK 2m (20) is within the scope of the Swedish Safe-guarding of Pension Commitments Act.
Pension costs recognized in the Income statement
SEKm 2014 2013
Own pensionsCurrent service costs –18 –10
Benefits paid 20 24
Pension costs 2 14
Insured pensionsInsurance premiums 60 48
Total net expenses for pensions 62 62
Of total net expenses of SEK 62m (62), SEK 0m (0) is recognized in net financial items, SEK 29m in cost of goods sold, SEK 15m in selling expenses and SEK 18m in administration expenses. The expected payments 2015 for own pensions amounts to SEK 17m.
Principal actuarial assumptions at balance sheet date
% 2014 2013
Discount rate 2.6 2.0
The major categories of plan assets as a percentage of total plan assets and the return on these categories
% 2014 Return 2013 Return
Equity instruments 42 12 42 33
Debt instruments 58 0 58 0
Total 100 12 100 33
NOTE 22 Other provisions
SEKmProvisions for restructuring
Warranty commitments Other Total
Opening balance Jan 1, 2014 59 42 8 109Provisions made 15 42 5 62
Provisions used –37 –41 –6 –84
Unused amounts reversed –10 –4 0 –14
Closing balance, Dec 31, 2014 27 39 7 73
Current provisions 19 24 0 43
Non-current provisions 8 15 7 30
Provisions for restructuringSee the Group’s note 21 for further information regarding Husqvarnas restructuring programmes.
Warranty commitments Provisions for warranty comprises all potential expenses for repairing or replacing products sold and are normally limited to 24 months.
Annual Report 2014 Husqvarna Group 104

Notes
Parent Company’s Notes
NOTE 23 Pledged assets and contingent liabilities
Pledged assets
SEKm 2014 2013
Pension obligation1 74 61
Total 74 61
1 Refers to endowment that is pledged in favor of the recipient.
Contingent liabilities
SEKm 2014 2013
On behalf of Group companiesPension obligation 460 405
On behalf of external counterpartiesBank guarantee 84 71
Pension obligation 10 9
Total 554 485
Annual Report 2014 Husqvarna Group 105

The Board of Directors’ and the President and CEO’s declaration
The Board of Directors and the President and CEO declare that the consol-idated financial statements have been prepared in accordance with IFRS as adopted by the EU, and give a true and fair view of the Group’s financial position and results of operations. The financial statements of the Parent Company have been prepared in accordance with generally accepted accounting principles in Sweden and give a true and fair view of the Parent Company’s financial position and results of operations.
Hamish MabonAuthorized Public Accountant
Auditor in charge
Helene Siberg WendinAuthorized Public Accountant
Our audit report was issued on March 17, 2015Ernst & Young AB
Stockholm, March 17, 2015
Soili JohanssonBoard member and
employee representative
Annika ÖgrenBoard member and
employee representative
Magdalena GergerBoard member
Tom JohnstoneBoard member
Ulla LitzénBoard member
David LumleyBoard member
Kai WärnPresident and CEO and Board member
Katarina MartinsonBoard member
Daniel NodhällBoard member
Lars PetterssonBoard member
Lars WesterbergChairman of the Board
The statutory Administration Report of the Group and the Parent Company provides a fair review of the development of the Group’s and the Parent Company’s operations, financial position and results of operations and describes material risks and uncertainties facing the Parent Company and the companies included in the Group.
Annual Report 2014 Husqvarna Group 106

Auditor’s ReportTranslation from the swedish original
To the annual meeting of the shareholders of Husqvarna AB (publ), corporate identity number 556000-5331
Report on the annual accounts and consolidated accountsWe have audited the annual accounts and consolidated accounts of Husqvarna AB (publ) for the year 2014. The annual accounts and consolidated accounts of the company are included in the printed version of this document on pages 38–106.
Responsibilities of the Board of Directors and the President and CEO for the annual accounts and consolidated accountsThe Board of Directors and the President and CEO are responsible for the preparation and fair presentation of these annual accounts in accordance with the Annual Accounts Act and of the consolidated accounts in accordance with International Financial Reporting Standards, as adopted by the EU, and the Annual Accounts Act, and for such internal control as the Board of Directors and the President and CEO determine is necessary to enable the preparation of annual accounts and consolidated accounts that are free from material misstatement, whether due to fraud or error.
Auditor’s responsibilityOur responsibility is to express an opinion on these annual accounts and consolidated accounts based on our audit. We conducted our audit in accordance with International Standards on Auditing and generally accepted auditing standards in Sweden. Those standards require that we comply with ethical requirements and plan and perform the audit to obtain reasonable assurance about whether the annual accounts and consolidated accounts are free from material misstatement.
An audit involves performing procedures to obtain audit evidence about the amounts and disclosures in the annual accounts and consolidated accounts. The procedures selected depend on the auditor’s judgement, including the assessment of the risks of material misstatement of the annual accounts and consolidated accounts, whether due to fraud or error. In making those risk assessments, the auditor considers internal control relevant to the company’s preparation and fair presentation of the annual accounts and consolidated accounts in order to design audit procedures that are appropriate in the circumstances, but not for the purpose of expressing an opinion on the effectiveness of the company’s internal control. An audit also includes evaluating the appropriateness of accounting policies used and the reasonableness of accounting estimates made by the Board of Directors and the President and CEO, as well as evaluating the overall presentation of the annual accounts and consolidated accounts.
We believe that the audit evidence we have obtained is sufficient and appropriate to provide a basis for our audit opinions.
OpinionsIn our opinion, the annual accounts have been prepared in accordance with the Annual Accounts Act and present fairly, in all material respects, the financial position of the parent company as of 31 December 2014 and of its financial performance and its cash flows for the year then ended in accordance with the Annual Accounts Act. The consolidated accounts have been prepared in accordance with the Annual Accounts Act and present fairly, in all material respects, the financial position of the group as of 31 December 2014 and of their financial performance and cash flows for the year then ended in accordance with International Financial Reporting Standards, as adopted by the EU, and the Annual Accounts Act. A c orporate governance statement has been prepared. The statutory administration report and the corporate governance statement are consistent with the other parts of the annual accounts and consolidated accounts.
We therefore recommend that the annual meeting of shareholders adopt the income statement and balance sheet for the parent company and the group.
Other mattersThe audit of the annual accounts for 2013 was performed by another auditor who submitted an auditor’s report dated 6th March 2014, with unmodified opinions in the Report on the annual accounts and the consolidated accounts.
Report on other legal and regulatory requirementsIn addition to our audit of the annual accounts and consolidated accounts, we have also audited the proposed appropriations of the company’s profit or loss and the administration of the Board of Directors and the President and CEO of Husqvarna AB (publ) for the year 2014.
Responsibilities of the Board of Directors and the President and CEOThe Board of Directors is responsible for the proposal for appropriations of the company’s profit or loss, and the Board of Directors and the President and CEO are responsible for administration under the Companies Act.
Auditor’s responsibilityOur responsibility is to express an opinion with reasonable assurance on the proposed appropriations of the company’s profit or loss and on the administration based on our audit. We conducted the audit in accordance with generally accepted auditing standards in Sweden.
As a basis for our opinion on the Board of Directors’ proposed appro priations of the company’s profit or loss, we examined the Board of Directors’ reasoned statement and a selection of supporting evidence in order to be able to assess whether the proposal is in accordance with the Companies Act.
As a basis for our opinion concerning discharge from liability, in addition to our audit of the annual accounts and consolidated accounts, we examined significant decisions, actions taken and circumstances of the company in order to determine whether any member of the Board of Directors or the President and CEO is liable to the company. We also examined whether any member of the Board of Directors or the President and CEO has, in any other way, acted in contravention of the Companies Act, the Annual Accounts Act or the Articles of Association.
We believe that the audit evidence we have obtained is sufficient and appropriate to provide a basis for our opinions.
OpinionsWe recommend to the annual meeting of shareholders that the profit be appropriated in accordance with the proposal in the statutory administration report and that the members of the Board of Directors and the President and CEO be discharged from liability for the financial year.
Stockholm March 17, 2015
Ernst & Young AB
Hamish Mabon Helene Siberg WendinAuthorized Public Accountant Authorized Public AccountantAuditor in charge
Annual Report 2014 Husqvarna Group 107

Five-Year Review
Income, SEKm 2014 20133 20121 2011 2010
Net sales 32,838 30,307 30,834 30,357 32,240
Europe & Asia/Pacific 15,824 14,736 15,351 16,365 16,621
Americas 13,675 12,571 12,531 11,193 12,944
Construction 3,339 3,000 2,952 2,799 2,675
Cost of goods sold –23,478 –22,288 –22,543 –21,948 –23,037
Gross income 9,360 8,019 8,291 8,409 9,203
Selling and administrative costs, other and impairment –7 769 –6 411 –6,616 –6,858 –6,758
Operating income 1,591 1,608 1,675 1,551 2,445
Operating income excl. items affecting comparability 2,358 1,608 1,931 1,615 2,652
Europe & Asia/Pacific 1,904 1,488 1,760 2,277 2,383
Europe & Asia/Pacific excl. items affecting comparability 1,904 1,488 1,947 2,277 2,383
Americas 340 30 –160 –654 152
Americas excl. items affecting comparability 340 30 –124 –654 312
Construction 356 277 233 130 82
Construction excl. items affecting comparability 356 277 258 194 129
Financial items, net –325 –428 –500 –404 –394
Income after financial items 1,266 1,180 1,175 1,147 2,051
Income tax –435 –264 –148 –150 –302
Income for the period 831 916 1,027 997 1,749
Of which depreciation, amortization and impairment –1,734 –978 –1,062 –1,120 –1,221
Financial position, SEKm 2014 20133 20121 2011 2010
Total assets 29,344 26,762 27,906 29,103 28,402
Net assets 19,404 18,049 19,279 19,309 17,803
Europe & Asia/Pacific 12,039 11,706 12,315 12,382 11,550
Americas 4,797 4,232 4,934 5,675 5,217
Construction 2,720 2,429 2,440 2,576 2,596
Inventories 7,954 7,087 8,058 8,078 7,000
Trade receivables 2,898 2,816 3,032 3,660 3,575
Trade payables 3,154 2,838 2,716 2,797 2,810
Working capital 5,225 4,885 6,194 5,699 4,478
Total equity 12,170 11,390 11,008 12,388 12,203
Interest-bearing liabilities 9,339 8,543 9,844 8,261 7,667
Long-term borrowings 5,598 6,408 6,611 6,941 6,985
Short-term borrowings 1,154 643 1,470 968 309
Net debt 7,234 6,659 8,271 6,921 5,600
Cash flow, SEKm 20142 20132 20121 2011 2010
Cash flow from operations, excluding change in operating assets and liabilities 2,061 1,776 1,957 1,792 2,888
Cash flow from operating assets and liabilities 193 1,116 –66 –1,295 –613
Cash flow from operations 2,254 2,892 1,891 497 2,275
Cash flow from investments, excluding acquisitions and divestments –1,386 –1,079 –747 –969 –1,313
Operating cash flow 868 1,813 1,144 –472 962
Acquisitions/divestments of operations –26 8 – – –
Cash flow from operations and investments 842 1,821 1,144 –472 962
1 2012 has been restated due to the amended IAS 19. 2010–2011 are not affected by the amendment.2 Effective January 1,2014, Husqvarna Group has changed the format of the Group´s cash flow statement. The adjustment has not affected the cash flow from operations, only
changes to the layout within this subtotal. The comparative period 2013 has been adjusted.3 As from January 1, 2014, the responsibility for sales from Sweden to certain American distributors has been transferred from Europe & Asia/Pacific to Americas. To reflect this
change in the Group’s segments reporting, the corresponding sales and operating income has as of the same date been transferred from Europe & Asia/Pacific to Americas. Sales and operating income from 2013 has been restated accordingly between the two business areas.
Annual Report 2014 Husqvarna Group 108

Key ratios, SEKm 2014 20134 20121 2011 2010
Net sales 32,838 30,307 30,834 30,357 32,240
Net sales growth, % 8 –2 2 –6 –5
Gross margin, % 28.5 26.5 26.9 27.7 28.5
EBITDA 3,325 2,586 2,737 2,671 3,666
EBITDA margin, % 10.1 8.5 8.9 8.8 11.4
Operating income 1,591 1,608 1,675 1,551 2,445
Operating income excl. items affecting comparability 2,358 1,608 1,931 1,615 2,652
Operating margin, % 4.8 5.3 5.4 5.1 7.6
Operating margin excl. items affecting comparability, % 7.2 5.3 6.3 5.3 8.2
Europe & Asia/Pacific 12.0 10.1 11.5 13.9 14.3
Europe & Asia/Pacific excl. items affecting comparability 12.0 10.1 12.7 13.9 14.3
Americas 2.5 0.2 –1.3 –5.8 1.2
Americas excl. items affecting comparability 2.5 0.2 –1.0 –5.8 2.4
Construction 10.7 9.2 7.9 4.7 3.1
Construction excl. items affecting comparability 10.7 9.2 8.7 6.9 4.8
Income after financial items 1,266 1,180 1,175 1,147 2,051
Income for the period 831 916 1,027 997 1,749
Capital expenditure 1,386 1,078 776 994 1,302
Europe & Asia/Pacific 934 696 441 600 788
Americas 347 265 221 287 411
Construction 105 116 113 107 103
Operating cash flow 868 1,813 1,144 –472 962
Cash flow per share, SEK 1.51 3.17 2.00 –0.82 1.68
Earnings per share, diluted, SEK 1.44 1.60 1.78 1.73 3.03
Equity per share, SEK 21.2 19.9 19.2 21.5 21.2
Average number of shares, millions 573.1 572.8 572.6 572.6 573.4
Dividend per share, SEK2 1.65 1.50 1.50 1.50 1.50
Dividend pay-out ratio, %3 114 94 84 87 49
Capital employed 21,509 19,933 20,852 20,648 19,870
Return on capital employed, % 7.6 7.7 7.4 7.4 11.0
Return on equity, % 6.7 8.1 8.8 8.0 13.9
Capital turn-over rate, times 1.7 1.6 1.5 1.6 1.7
Net debt/equity ratio 0.59 0.58 0.75 0.56 0.46
Interest coverage ratio, times 4.2 3.6 3.5 3.7 6.7
Equity/assets ratio, % 41.5 42.6 39.4 42.6 42.8
Salaries and remunerations 4,157 3,758 4,016 3,904 4,080
Average number of employees 14,337 14,156 15,429 15,698 14,954
Europe & Asia/Pacific 6,029 6,219 7,148 7,037 7,278
Americas 6,077 5,907 6,307 6,664 5,582
Construction 2,155 1,962 1,973 1,997 2,094
1 2012 has been restated due to the amended IAS 19. 2010–2011 are not affected by the amendment.2 As proposed by the Board of Directors.3 Dividend pay out ratio is defined as total dividend in relation to the income for the period excluding non-controlling interest.4 As from January 1, 2014, the responsibility for sales from Sweden to certain American distributors has been transferred from Europe & Asia/Pacific to Americas. To reflect this
change in the Group’s segments reporting, the corresponding sales and operating income has as of the same date been transferred from Europe & Asia/Pacific to Americas. Sales and operating income from 2013 has been restated accordingly between the two business areas.
Five-Year ReviewAnnual Report 2014 Husqvarna Group 109

Quarterly Data
Income, SEKm Year1 Q1 Q2 Q3 Q4 Full-year
Net sales 2014 9,685 11,045 6,785 5,323 32,838
2013 9,024 10,227 6,349 4,707 30,307
2012 9,811 10,706 5,841 4,476 30,834
EBITDA 2014 1,134 1,621 539 30 3,325
2013 935 1,265 454 –68 2,586
2012 1,203 1,426 453 –345 2,737
EBITDA margin, % 2014 11,7 14,7 7,9 0,6 10,1
2013 10.4 12.4 7.2 –1.4 8.5
2012 12.3 13.3 7.8 –7.7 8.9
Operating income 2014 903 1,384 301 –997 1,591
2013 688 1,022 206 –308 1,608
2012 930 1,152 197 –604 1,675
Operating income excl. items affecting comparability 2014 903 1,384 301 –230 2,358
2013 688 1,022 206 –308 1,608
2012 930 1,152 197 –348 1,931
Operating margin, % 2014 9.3 12.5 4.4 –18.7 4.8
2013 7.6 10.0 3.2 –6.5 5.3
2012 9.5 10.8 3.4 –13.5 5.4
Operating margin excl. items affecting comparability, % 2014 9.3 12.5 4.4 –4.3 7.2
2013 7.6 10.0 3.2 –6.5 5.3
2012 9.5 10.8 3.4 –7.8 6.3
Income after financial items 2014 807 1,274 231 –1,046 1,266
2013 602 916 95 –433 1,180
2012 796 1,031 104 –756 1,175
Margin, % 2014 8.3 11.5 3.4 –19.6 3.9
2013 6.7 9.0 1.5 –9.2 3.9
2012 8.1 9.6 1.8 –16.9 3.8
Income for the period 2014 616 975 176 –936 831
2013 467 661 92 –304 916
2012 633 786 106 –498 1,027
Earnings per share, SEK 2014 1.07 1.70 0.31 –1.63 1.44
2013 0.81 1.15 0.16 –0.53 1.60
2012 1.10 1.36 0.19 –0.87 1.78
Financial position, SEKm Year1 Q1 Q2 Q3 Q4 Full-year
Inventories 2014 7,507 6,945 6,787 7,954 7,954
2013 8,306 6,678 5,863 7,087 7,087
2012 8,526 7,469 6,789 8,058 8,058
Equity 2014 11,994 12,576 12,872 12,170 12,170
2013 11,116 11,614 11,382 11,390 11,390
2012 11,309 12,195 11,448 11,008 11,008
Interest-bearing liabilities 2014 10,453 9,933 8,766 9,339 9,339
2013 11,465 10,673 8,099 8,543 8,543
2012 12,167 10,977 9,096 9,844 9,844
Net debt 2014 8,698 7,603 6,450 7,234 7,234
2013 10,053 8,733 6,511 6,659 6,659
2012 10,733 9,319 7,811 8,271 8,271
Working capital 2014 7,353 6,431 5,275 5,225 5,225
2013 8,349 7,179 5,108 4,885 4,885
2012 8,824 8,120 6,530 6,194 6,194
1 2012 has been restated due to the amended IAS 19.
Annual Report 2014 Husqvarna Group 110

Net sales by business area, SEKm Year1, 2 Q1 Q2 Q3 Q4 Full-year
Europe & Asia/Pacific 2014 4,334 5,767 3,305 2,418 15,824
2013 4,085 5,148 3,209 2,294 14,736
2012 4,653 5,345 3,096 2,257 15,351
Americas 2014 4,569 4,393 2,614 2,099 13,675
2013 4,233 4,264 2,357 1,717 12,571
2012 4,420 4,553 1,986 1,572 12,531
Construction 2014 782 885 866 806 3,339
2013 706 815 783 696 3,000
2012 738 808 759 647 2,952
Operating income by business area, SEKm Year1, 2 Q1 Q2 Q3 Q4 Full-year
Europe & Asia/Pacific 2014 669 1,101 309 –175 1,904
2013 550 800 285 –147 1,488
2012 846 1,018 238 –342 1,760
Europe & Asia/Pacific excl. items affecting comparability 2014 669 1,101 309 –175 1,904
2013 550 800 285 –147 1,488
2012 846 1,018 238 –155 1,947
Americas 2014 218 220 –55 –43 340
2013 142 156 –122 –146 30
2012 83 87 –97 –233 –160
Americas excl. items affecting comparability 2014 218 220 –55 –43 340
2013 142 156 –122 –146 30
2012 83 87 –97 –197 –124
Construction 2014 77 121 109 49 356
2013 46 100 86 45 277
2012 39 85 89 20 233
Construction excl. items affecting comparability 2014 77 121 109 49 356
2013 46 100 86 45 277
2012 39 85 89 45 258
Group common costs etc. 2014 –61 –58 –62 –828 –1,009
2013 –50 –34 –43 –60 –187
2012 –38 –38 –33 –49 –158
Group common costs excl. items affecting comparability 2014 –61 –58 –62 –61 –242
2013 –50 –34 –43 –60 –187
2012 –38 –38 –33 –41 –150
Operating margin by business area, % Year1, 2 Q1 Q2 Q3 Q4 Full-year
Europe & Asia/Pacific 2014 15.4 19.1 9.4 –7.2 12.0
2013 13.5 15.5 8.9 –6.4 10.1
2012 18.2 19.0 7.7 –15.1 11.5
Europe & Asia/Pacific excl. items affecting comparability 2014 15.4 19.1 9.4 –7.2 12.0
2013 13.5 15.5 8.9 –6.4 10.1
2012 18.2 19.0 7.7 –6.8 12.7
Americas 2014 4.8 5.0 –2.1 –2.1 2.5
2013 3.3 3.7 –5.2 –8.5 0.2
2012 1.9 1.9 –4.9 –14.8 –1.3
Americas excl. items affecting comparability 2014 4.8 5.0 –2.1 –2.1 2.5
2013 3.3 3.7 –5.2 –8.5 0.2
2012 1.9 1.9 –4.9 –12.5 –1.0
Construction 2014 9.8 13.7 12.6 6.0 10.7
2013 6.5 12.3 10.9 6.5 9.2
2012 5.3 10.5 11.7 3.1 7.9
Construction excl. items affecting comparability 2014 9.8 13.7 12.6 6.0 10.7
2013 6.5 12.3 10.9 6.5 9.2
2012 5.3 10.5 11.7 6.9 8.7
1 2012 has been restated due to the amended IAS 19.2 As from January 1, 2014, the responsibility for sales from Sweden to certain American distributors has been transferred from Europe & Asia/Pacific to Americas. To reflect
this change in the Group´s business area reporting, the corresponding sales and operating income has as of the same date been transferred from Europe & Asia/Pacific to Americas. Sales and operating income from 2013 has been restated accordingly between the two business areas.
Quarterly DataAnnual Report 2014 Husqvarna Group 111
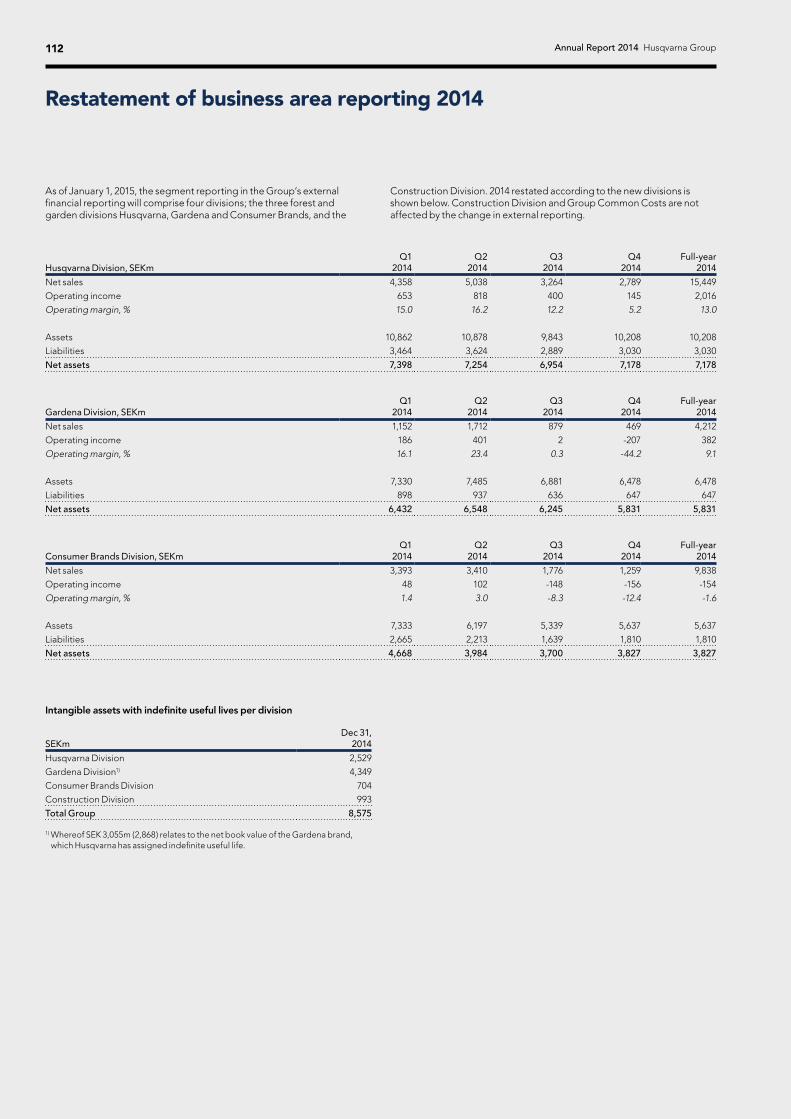
Restatement of business area reporting 2014
As of January 1, 2015, the segment reporting in the Group’s external financial reporting will comprise four divisions; the three forest and garden divisions Husqvarna, Gardena and Consumer Brands, and the
Intangible assets with indefinite useful lives per division
Construction Division. 2014 restated according to the new divisions is shown below. Construction Division and Group Common Costs are not affected by the change in external reporting.
Husqvarna Division, SEKmQ1
2014Q2
2014Q3
2014Q4
2014Full-year
2014
Net sales 4,358 5,038 3,264 2,789 15,449
Operating income 653 818 400 145 2,016
Operating margin, % 15.0 16.2 12.2 5.2 13.0
Assets 10,862 10,878 9,843 10,208 10,208
Liabilities 3,464 3,624 2,889 3,030 3,030
Net assets 7,398 7,254 6,954 7,178 7,178
Gardena Division, SEKmQ1
2014Q2
2014Q3
2014Q4
2014Full-year
2014
Net sales 1,152 1,712 879 469 4,212
Operating income 186 401 2 -207 382
Operating margin, % 16.1 23.4 0.3 -44.2 9.1
Assets 7,330 7,485 6,881 6,478 6,478
Liabilities 898 937 636 647 647
Net assets 6,432 6,548 6,245 5,831 5,831
Consumer Brands Division, SEKmQ1
2014Q2
2014Q3
2014Q4
2014Full-year
2014
Net sales 3,393 3,410 1,776 1,259 9,838
Operating income 48 102 -148 -156 -154
Operating margin, % 1.4 3.0 -8.3 -12.4 -1.6
Assets 7,333 6,197 5,339 5,637 5,637
Liabilities 2,665 2,213 1,639 1,810 1,810
Net assets 4,668 3,984 3,700 3,827 3,827
SEKmDec 31,
2014
Husqvarna Division 2,529
Gardena Division1) 4,349
Consumer Brands Division 704
Construction Division 993
Total Group 8,575
1) Whereof SEK 3,055m (2,868) relates to the net book value of the Gardena brand, which Husqvarna has assigned indefinite useful life.
Annual Report 2014 Husqvarna Group 112

Definitions
Capital indicators
Net assetsTotal assets exclusive of liquid funds and interest-bearing financial receivables less operating liabilities, non-interest-bearing provisions and deferred tax liabilities.
Operating working capitalInventories and trade receivables less trade payables.
Working capitalCurrent assets exclusive of liquid funds and interest-bearing financial receivables less operating liabilities and non-interest- bearing provisions.
Net debtTotal interest-bearing liabilities, less liquid funds.
Interest bearing liabilitiesLong-term and short-term borrowings, net pension liability and fair value derivative liabilities.
Liquid fundsCash and cash equivalents, short term investments and fair value derivative assets.
Net debt/equity ratioNet debt in relation to total adjusted equity.
Equity/assets ratioEquity as a percentage of total assets.
Capital employedTotal liabilities and equity less non- interest-bearing debt including deferred tax liabilities.
AdjustedAs reported adjusted for items affecting comparability, changes in exchange rates and acquisitions/divestments.
Average number of sharesWeighted number of outstanding shares during the period, after repurchase of own shares.
Earnings per shareIncome for the period divided by the average number of shares.
Net sales growthNet sales as a percentage of net sales the preceding period.
Gross marginGross income as a percentage of net sales.
Operating marginOperating income as a percentage of net sales.
Return on equityIncome for the period as a percentage of average equity.
Return on capital employedOperating income plus financial income as a percentage of average capital employed.
Operating cash flowTotal cash flow from operations and investments, excluding acquisitions and divestment of operations.
Capital expenditureCapitalization of property, plant and equipment and product development and software.
EBITDAEarnings before interests, taxes, depreciation, impairment and amortization.
Value creationOperating income less the weighted average cost of capital (WACC) on average net assets: (Net sales – operating costs – operating income) – (WACC x average net assets).
Interest coverage ratioIncome after financial items plus financial costs divided with financial costs.
Other definitions
Annual Report 2014 Husqvarna Group 113

Annual Report 2014 Husqvarna Group 114
The Share
Listing and trading volumeThe Husqvarna shares have been listed on Nasdaq Stockholm since June 2006.
A total of 432 million shares (402) were traded in 2014, with a total value of SEK 21.1 billion (15.7), corresponding to an average daily trading volume of 1.7 million shares (1.6) or SEK 85m (63).
The turnover velocity for the Husqvarna B-share was 92 percent in 2014. During 2014, the price of the A-share and the B-share increased 49 percent to SEK 58.
According to the EU Markets in Financial Instruments Directive (MiFID), a share can also be traded on a “Multilateral Trading Facility” (MTF), i.e. on markets other than the stock exchange where it is listed. The Husqvarna share is traded on several MTFs including BATS Chi-X and Turquoise. However, the Nasdaq Stockholm exchange accounts for the majority of trading.
Dividend and dividend policyThe Board of Directors has proposed a dividend of SEK 1.65 per share (1.50) for the financial year 2014, divided into two payments, SEK 0.55 in April, 2015 and SEK 1.10 to be paid in October, 2015. The dividend represents 114 percent (94) of income for the year. Excluding impairment of goodwill the payout ratio corresponds to 59 percent of income for the year. The policy is that the dividend shall normally exceed 40 percent of income for the year.
Repurchase of sharesThe AGM 2014 authorized the Board of Directors to repurchase a maximum of three percent of the total number of outstanding B-shares to ensure the Group’s commitments in terms of existing long-term incentive programs. No B-shares were repurchased during the year. At year-end, the total number of repurchased shares amounted to 3,448,534 B-shares (3,657,503) corresponding to 0.60 percent (0.63) of the total number of outstanding shares.
Conversion of sharesAt Husqvarna AB´s AGM in 2010, it was resolved to amend the articles of association, whereby shareholders who hold A-shares shall be entitled to request conversion of their A-shares into B-shares. In 2014, 4,168,399 A-shares were converted to B-shares.
KEY FACTS Husqvarna shares
Listing: Nasdaq Stockholm
Number of shares: 576,343,778
Market capitalization at year-end 2014: SEK 33bn
Ticker codes: Bloomberg: HUSQA SS, HUSQB SS Thomson Reuters: HUSQa.ST, HUSQb.ST Nasdaq Stockholm: HUSQ A, HUSQ B
ISIN codes: A-share SE0001662222 B-share SE0001662230
Husqvarna ADR
Ticker code: HSQVY
ISIN code: US4481031015
Ratio: Two ordinary B-shares equal one ADR
Husqvarna B, price development
2014
20,000
30,000
40,000
50,000
60,000
70,000
80,000
90,000
100,000
Turnover no. of shares per month, thousands
201420132012201120102009200820072006
20
30
40
50
60
70
80
90
100
OMX Stockholm_PI
SX3000 OMX Stockholm Consumer Goods_PIHusqvarna B
SEK Turnover
©
0
5,000
10,000
15,000
20,000
25,000
30,000
Turnover no. of shares per week, thousands
30
35
40
45
50
55
60
OMX Stockholm_PI
SX3000 OMX Stockholm Consumer Goods_PIHusqvarna B
DecNovOctSepAugJulJunMayAprMarFebJan
©
SEK Turnover
Analyst coverageThere are currently more than 10 analysts who analyze and follow Husqvarna Group and give recommendations on the share.
ADRHusqvarna Group sponsors a Level 1 American Depositary Receipt (ADR) program in the U.S. The ADRs, which each represent two ordinary B-shares, are publicly traded in the U.S. on the OTC Market, under symbol HSQVY. The ADR is a USD denominated security, and the associated dividends are paid to investors in USD. Citibank is ADR depositary bank.
More information on www.citi.com/dr

Annual Report 2014 Husqvarna Group 115
Share data
2014 2013 20121
Earnings per share, SEK 1.44 1.60 1.78
Earnings per share after dilution, SEK 1.44 1.60 1.78
Cash flow per share, operating, SEK 1.51 3.17 2.00
Cash flow per share, operating, after dilution, SEK 1.51 3.17 2.00
Equity per share, SEK 21.2 19.9 19.2
Dividend per share, SEK2 1.65 1.50 1.50
Yield, %3 3.4 3.9 3.8
Dividend payout ratio, % 114 94 84
Year-end price, A-share, SEK 58 39 39
Highest price, A-share, SEK 60 45 42
Lowest price, A-share, SEK 37 34 29
Year-end price, B-share, SEK 58 39 39
Highest price, B-share, SEK 60 44 42
Lowest price, B-share, SEK 37 34 29
Number of shareholders 55,234 57,912 62,061
Market capitalization, SEKm 33,265 22,300 22,593
Share capital and number of shares
Share capital, SEK
Quotient value, SEK
Number of A-shares
Number of B-shares
Total number of shares
Husqvarna before listing 2006 495,000,000 100 4,950,000
2006: stock-split and bonus issue 592,518,306 2 9,502,275 286,756,878 296,259,153
2007: bonus issue 770,273,790 2 98,380,020 286,756,875 385,136,895
2008: no transactions 770,273,790 2 98,380,020 286,756,875 385,136,895
2009: rights issue 1,152,687,556 2 147,570,030 428,773,748 576,343,778
2010: conversion from A-shares to B-shares 1,152,687,556 2 134,755,087 441,588,691 576,343,778
2011: conversion from A-shares to B-shares 1,152,687,556 2 129,460,339 446,883,439 576,343,778
2012: conversion from A-shares to B-shares 1,152,687,556 2 127,699,058 448,644,720 576,343,778
2013: conversion from A-shares to B-shares 1,152,687,556 2 126,593,868 449,749,910 576,343,778
2014: conversion from A-shares to B-shares 1,152,687,556 2 122,425,469 453,918,309 576,343,778
Further information concerning the shareThe following information, and more, is available on www.husqvarnagroup.com/en/ir.
• Share price development• Shareholder ownership structure• Conversion of A-shares• Analyst coverage• Repurchase of shares• Share capital• Insider trading
Largest shareholders in Husqvarna AB
Capital, % Votes, % Capital, % Votes, %
Investor AB 16.8 31.3 0.0 0.7
Lundbergs AB 7.5 23.8 0.7 1.4
Didner & Gerge Funds 4.2 2.4 0.3 0.1
Nordea Funds 3.5 1.5 –1.5 –0.9
Swedbank Robur Funds 2.6 0.9 –1.1 –0.3
AFA Insurance 2.3 0.8 2.3 0.8
Norges Bank Investment Management 2.1 1.5 0.7 0.3
SHB Funds 1.8 0.7 0.1 0.1
Alecta 1.6 3.5 –2.7 –0.9
If P&C Insurance AB 1.4 3.6 0.0 0.1
Total for the 10 largest shareholders 43.8 70.0 –6.7 3.0
Shareholding, by size in Husqvarna AB
Size of holding Votes, % No. of shareholders % of shareholders
1–1,000 2.2 42,866 77.6
1,001–10,000 4.6 11,010 19.9
10,001–100,000 3.1 1,044 1.9
100,001–1,000,000 5.8 222 0.4
1,000,001– 84.3 92 0.2
Total 100.0 55,234 100.0
Source: SIS Ägarservice as of December 30, 2014.
1) 2012 has been restated due to the amended IAS 19.2) Dividend 2014 as proposed by the Board.3) Dividend/year-end share price.
n Sweden 64.4% (72.2)
n U.S. 16.3% (9.0)
n U.K. 9.6% (11.3)
n Norway 2.3% (1.8)
n Other countries 7.4% (5.7)
Distribution of shareholders by country
Change during the year
The Share

Annual Report 2014 Husqvarna Group 116
Contact and Website
Contact
Tobias NorrbyInvestor [email protected]+46 8 738 93 35
Media [email protected]+46 8 738 90 80
Market data, statistics and market shares are estimates made by Husqvarna Group.
Factors affecting forward- looking statements
This report contains forward-looking statements in the sense referred to in the American Private Securities Litigation Reform Act of 1995. Such statements comprice, among other things, financial goals, goals of future business and financial plans. These statements are based on present expectations and are subject to risks and uncertainties that may give rise to major deviations of the result due to several aspects. These aspects include, among other things: consumer demand and market conditions in the geographical areas and lines of business in which Husqvarna Group operates, the effects of currency fluctuations, downward pressure on prices due to competition, a material reduction of sales by important distributors, any success in developing new products and in marketing, outcome of any product responsibility litigation, progress when it comes to reach the goals set for productivity and efficient use of capital, successful identification of growth opportunities and acquistion objects, and to integrate these into the existing business and successful achievement of goals to make the supply chain more efficient.
The website
Husqvarna Group’s website – www.husqvarnagroup.com – contains detailed and updated financial information for investors as well as information about the Group’s objectives and strategies, corporate governance, sustainability, career opportunities, Group-related news, and more. The website also has a subscription service for receiving press releases and reports by email.
About Husqvarna GroupThe Group strategy, business, organization and history.
Corporate GovernanceGeneral Meetings, Board of Directors and Group Manage-ment.
General meetingsNotices, proposals and minutes from AGM etc.
SustainabilityOur sustainability approach, highlights and reports.
The shareLargest shareholders, share pricedevelopment, share facts etc.
Financial reportsAnnual and interim reports etc.
Financial dataAnnual and quarterly financial statistics.
Share price development
Latest press releases
Upcoming events
1
2
8
9
10
3
4
5
6
7
56
7
1
2 3 4
8
9
10

Production: Husqvarna AB (publ) and Narva. Print: GöteborgsTryckeriet, 2015. Photo: Mats Lundquist, page 5, 61, 63. Tomas Magnusson page 64.Copyright © 2015 Husqvarna AB (publ). All rights reserved. Husqvarna, Jonsered, Klippo, Zenoah, Diamant Boart, Gardena, Flymo, McCulloch, Polan Pro, Weed Eater, Soff-Cut, Husqvarna Automower® and other product and feature marks are trademarks of Husqvarna Group.

NARVA
Head office Husqvarna AB (publ) | Mailing address: Box 7454, SE-103 92 Stockholm, SwedenVisiting address: Regeringsgatan 28 | Telephone: +46 8 738 90 00 | www.husqvarnagroup.comRegistered office Husqvarna AB (publ) Jönköping | Mailing address: SE-561 82 Huskvarna, SwedenVisiting address: Drottninggatan 2 | Telephone: +46 36 14 65 00