hybrid production system: perspectives in supply chain
TRANSCRIPT
Hybrid production system:perspectives in supply chain
risk managementDiego Aparecido Wolfshorndl
PPGA, Universidade Metodista de Piracicaba, Piracicaba, BrazilMauro Vivaldini
Pós-Graduação em Administração, Universidade Paulista, São Paulo, Brazil, andJoão Batista de Camargo Junior
PPGA, Universidade Metodista de Piracicaba, Piracicaba, Brazil
AbstractPurpose – From the perspective of the supply chain risk management (SCRM), this paper addresses theeffects of a hybrid production system (make-to-stock and make-to-order) in order to know which risks canimpact the production planning process at a large automaker in Brazil. Through the correlation of thesethemes, the purpose of this paper is to understand the relevant risks to the supply chain (SC).Design/methodology/approach – Before the field research, a theoretical approach was made on twothemes. After theoretical analysis of a case study on the automaker and data collection, the work used thePearson’s product moment correlation (r) and χ2 and Kolmogorov–Smirnov tests to assess the risk factorsraised by the interviewed professionals, thus characterizing a mixed methodological approach (i.e. qualitativeand quantitative).Findings – It was evidenced that many risks are the result of functional failures, such as input of incorrectinformation in the system, and many are inherent to managerial decisions when procedures and differentpaths of production are adopted. Additionally, it has been proven that the adoption of a hybrid productionplanning approach does not increase the risks to the SC and that the identified risks do not necessarily areincluded within the scope of SCRM.Originality/value – This study is characterized by an approach which combines SCRM and hybridproduction system.Keywords Supply chain, Risks, Hybrid production system, MTS–MTOPaper type Case study
1. IntroductionThe management of supplier companies as part of the same customer’s business,coordinated and aligned to make products more competitive, to improve the serviceprovided and to increase the customer’s loyalty, is a consolidated concept as competitionno longer occurs only between competing companies, but between supply chains (SC).On the other hand, the magnitude generated by such management makes operationsmore vulnerable to the external environment, thus exposing the organization to a greaternumber of risks (Lambert & Cooper, 2000; Christopher & Peck, 2004; Wolfs, Takakura,Rezende, Vivaldini, & Antoniolli, 2015).
The SC risk can be categorized as rupture and operational ones, with the former beingrelated to circumstances such as natural calamities, terrorist attacks and labor strikes and
Revista de GestãoVol. 26 No. 3, 2019
pp. 313-334Emerald Publishing Limited
2177-8736DOI 10.1108/REGE-01-2019-0005
Received 12 January 2019Revised 25 February 2019
25 March 20197 May 2019
Accepted 14 May 2019
The current issue and full text archive of this journal is available on Emerald Insight at:www.emeraldinsight.com/2177-8736.htm
© Diego Aparecido Wolfshorndl, Mauro Vivaldini and João Batista de Camargo Junior. Published inRevista de Gestão. Published by Emerald Publishing Limited. This article is published under theCreative Commons Attribution (CC BY 4.0) licence. Anyone may reproduce, distribute, translate andcreate derivative works of this article ( for both commercial and non-commercial purposes), subject tofull attribution to the original publication and authors. The full terms of this licence may be seen athttp://creativecommons.org/licences/by/4.0/legalcode
313
Hybridproduction
system

the latter caused by high uncertainty and lack of coordination between supply and demand(Sreedevi & Saranga, 2017).
The possibility of operational risks can be manifested in the so-called hybrid productionsystems, in which production is focused to meet confirmed orders and stock formation, thatis, make-to-order (MTO) and make-to-stock (MTS) (Yousefnejad & Esmaeili, 2018).According to Beemsterboer, Land, and Teunter (2016), a key point in the planning of hybridproduction systems is to define what should be met for stock and what is intended for theorders. These same authors state that this type of planning is a challenge because thedecisions being made regarding MTO and MTS systems are different. Furthermore, thesedecisions may affect suppliers, customers and other supplier chain members.
SCs operate within an integrated scenario with groups of interdependent companies andentities, even within a single organization. Therefore, the risks are not isolated. Riskidentification should involve different stakeholders, including the sought of interdependentinteractions between the risks occurring in the entire SC. Therefore, the main objective of thesupply chain risk management (SCRM) is to manage the risks by considering theinterdependence of its agents. Performance measurements in the SC help narrow the scope ofsignificant risks by disregarding the non-significant ones. Therefore, the company can achieverelevant strategies for mitigating and correlating the risks when adopting a managementsystem that focuses on its network of risks (Qazi, Dickson, Quigley, & Gaudenzi, 2018).
In this context, this paper aims to identify which risks can impact the productiveplanning in the MTS–MTO hybrid production system in order to understand, consideringthe scope of SCRM, this correlation and its relevance. For doing so, a mixed methodologicalapproach (qualitative and quantitative) was applied through a case study of a largeBrazilian automaker.
The relevance of this work is due to the fact that it was carried out in a large automobilemanufacturer, considering its importance in the adoption of innovative practices, andparticularly, regarding the SC (Pires & Castilho, 2015). This study is characterized forcombining SCRM and hybrid production systems, which are not always present inorganizations. Studies on risks in SCs and hybrid production systems are aimed atassessing these themes individually, as the works by Chang, Ellinger, and Blackhurst (2015)regarding the risk mitigation in SC and Soman, Van donk, and Gaalman (2004, 2006, 2007)regarding the MTS–MTO hybrid production systems. Studies emphasizing the importanceof SCRM (Blos, Quaddus, Wee, & Watanabe, 2009; Blome & Schoenherr, 2011; Zhang, Kim,Springer, Cai, & Yu, 2013; Wolfs et al. 2015), including in the automotive industry (Thun &Hoenig, 2011), can be also found in the literature. However, some authors state that there area few studies on hybrid MTS–MTO production systems, especially regarding the SC(Soman et al., 2004; Zhang et al., 2013). Therefore, the present study seeks to fulfill thistheoretical gap by establishing a relationship between the SC risks resulting from theadoption of hybrid production systems.
This paper was structured in eight sections, with the first being the introduction.Sections 2 and 3 provide a literature review on SC risks and hybrid MTS–MTO productivesystems, whereas Section 4 addresses the theory and presents hypotheses and propositions.Section 5 discusses the methodology and organization of the study and Section 6 presentsthe automaker with focus on production planning and SC risks. Section 7 assesses the dataand presents considerations about them, and finally, Section 8 presents conclusions andsuggestions for future research.
2. Risk management in supply chainUncertain environments lead to a high risk in SC, and the more complex the chain, thehigher the risk. Constant changes in product supply and manufacturing requirements,frequent introduction of new items and low standardization of products and services are the
314
REGE26,3
main drivers of SC complexity. The argument is that the SC’s susceptibility to risk isincreased by supplier dependence, supplier concentration, global supply, focus on cost andlack of coordination among partners. However, studies still try to identify mechanisms todeal with these vulnerabilities and to mitigate the SC risk. The SC flexibility is usuallyconsidered as a key solution to the growing uncertainty and competitiveness in the market.The studies conducted by Ponte, Costas, Puche, Pino, and La Fuente (2018), Monostoria(2018) and Rezapour, Srinivasan, Tew, Janet, and Mistree (2018) demonstrated how SCflexibility has contributed to improve the business performance in the face of uncertainenvironments, stating that this behavior provides greater robustness to SC. This argumentis supported by Sreedevi and Saranga (2017), for whom SC flexibility and manufacturingprocess help reduce the risks for supply and production, respectively.
The production process management involves the organization’s ability to perform andcoordinate various tasks related to operational activities (e.g. logistics and operationplanning) linked directly to the organizational knowledge (the so-called skills routines) andused to respond to unpredictable events affecting the SC. Another important aspect directlylinked to these activities is the chain’s ability to withstand turbulence, interruptions andunforeseen events. This approach, corroborated by Brusset and Teller (2017), reinforces theidea that an SC capable of providing and delivering products and services under suchcircumstances is characterized as resilient. Resilience has broader implications than controlof SC risks. However, the current inter-organizational information systems facilitate to shareinformation in real-time and allow organizations to be coordinated more effectively acrossthe network. An example of this kind of system is the advanced planning system oradvanced planning and scheduling (APS).
Rezapour et al. (2018) broaden this discussion on resilience by stating that SC performanceis affected by two types of risk: risk of disruptions, which distort and affect the supplynetwork by inactivating certain production facilities or transport routes, and risk of variationsin the performance of an installation, which reduces the efficiency of the supply network flowaimed to meet the demands. But the mitigations of strategic and operational risks to neutralizethe impacts of ruptures and variations, respectively, are correlated. Within this context,organizational robustness and resilience are aimed to mitigate disruptions at a strategic level,whereas reliability is aimed to mitigate the variations at an operational level.
Reflecting the previously mentioned concepts, SCRM can be understood as being theidentification and management of SC risks through a coordinated action among chainmembers to reduce vulnerability. Several risk management structures were proposed byusing different terminologies. However, there is a consensus that SCRM involves fivesequential stages, namely: risk identification, evaluation, analysis, treatment andmonitoring (Qazi et al., 2018).
Sreedevi and Saranga (2017) point out that timely mitigation of the adverse effects ofuncertainty is crucial for an effective SC operation. For these authors, companies shouldconsider investing in the SC agility and responsiveness in order to quickly respond tomarket fluctuations and manage the risk of disruption. They also report the importance ofcombining supply resources with a company’s operating environment in order to keep upwith the changing business requirements. In this context, they include chain flexibility asone of the main levers to reduce such risks, especially in the industry. In themanufacturing process, one of the most important components of SC flexibility isthe company’s ability to control production resources and to manage uncertainty in orderto meet the customer’s needs.
The SC and manufacturing risks are not independent in a strategic approach, although theexisting literature on risk management tends to ignore this relationship and assess separatelythe impact of these risks. According to Rezapour et al. (2018), the risk mitigation in theseareas includes redundancy or flexibility to ensure that the SC is robust, resilient and reliable.
315
Hybridproduction
system

It is important to note that chains are exposed to the demand and supply risks, with theformer resulting in ruptures of the downstream SC operations. These ruptures manifestthemselves in the physical distribution of products to the customer and create a mismatchbetween actual and forecast demands, making the coordination of SC inadequate. Thebullwhip effect (i.e. the amplification of demand volatility in the upstream side of the SC) is acharacteristic of this phenomenon. The possible negative consequences of the demand risksare costly shortages, obsolescence and inefficient capacity utilization. Supply-side risksinclude supplier business risks, capacity problems, technological changes, changes in productdesign, poor supply quality and poor logistics performance (i.e. late delivery). Catastrophicrisks involving natural situations (e.g. tsunamis, earthquakes, hurricanes, droughts andfloods), political and social instabilities, civil uprisings, economic crises and terrorist attacksare also included. Because the SC operations span throughout the globe, local problems canaffect the entire chain’s performance (Monostoria, 2018).
In this context, the rise of global markets has forced SC to change their risk managementstrategies due to the resulting competition. Riskmitigation is becoming a primary reason behindall contractual agreements and is believed to be beneficial. Flexibility in accommodatingdemand fluctuation and ability to respond to price volatility are two requirements for thepractice of supply chain management (SCM). The SC need to develop robust contractualmechanisms to manage the demand and price uncertainties, especially regarding highlyconfigured products in the automotive, aerospace, electronics and other heavy industries. Ingeneral, build-to-order or MTO products are characterized by uncertain demand, long lead timesand floating purchase costs (Ghadge, Dani, Chester, & Kalawsky, 2013).
3. Hybrid production systems (MTS–MTO)Several strategies have been proposed to solve the problems that permeate hybrid systems,such as focused, spackling and layered-spackling strategies (Cattani, Dahan, & Schmidt,2010; Zhang et al., 2013). For Zhang et al. (2013), the focused strategy uses two dedicatedproduction plants, one for stock-oriented production (MTS) and another for order-orientedproduction (MTO). For Cattani et al. (2010), in the spackling strategy the company maintainsonly a flexible production plant, both for stock- and order-oriented productions. Finally, thelayered spackling strategy is characterized by the existence of a flexible production plantand a dedicated plant, with the latter being oriented to stock only (MTS).
The hybrid system is classified as a productive system, which corresponds to thejunction between MTS and MTO systems (Soman et al., 2004; Ghalehkhondabi & Suer, 2018).For Pires (2016), both MTS and MTO have specific advantages and disadvantages:
• For the producer, the MTS system’s main advantage is the greater potential forstandardization and rationalization of production programs and productionprocesses, with a further reduction of costs and production cycles. However, inthis system there is no certainty about the actual demand in terms of mix andvolume, including higher costs to maintain raw material and finished product stocks,which demands much more working capital.
• For the customer, the MTS system’s advantage is linked to the availability ofdelivery, lower price and standardization of the product. It should be noted that thislatter advantage can also be interpreted as a disadvantage since the customer needsto adapt to the standardized product.
• In the MTO system, the producer is assured about the demand and will producebased on incoming orders, thus leading to a greater rationalization of working capitalthrough advance payments of products. However, in this system the producer facesdifficulties to standardize and rationalize programs and production, thus increasing
316
REGE26,3

the costs of the products in the process inventory and making it difficult to reduceproduction costs and cycles. The MTO system’s main advantage is the possibility ofpersonalizing the product being requested, which brings disadvantages such aslonger waiting time and higher prices.
For Ghalehkhondabi and Suer (2018) and Pires (2016), when a company adopts a hybridsystem, the problems become more evident and complex. In this case, it becomes difficult todecide what to produce, much more because of the order than the product itself (MTS vsMTO).The situation is similar to the order competition, when it is necessary to carry out two tasks atthe same time as objectively as possible and maintaining the quality level.
Other challenges are related to the inventory management, since in the hybrid systemthere is a constant need to avoid creating items for MTS. This, consequently, satisfies theMTO demand within a competitive period by keeping the overall efficiency of theproduction as a whole. Also, semi-finished products could be stocked for later use via MTO(Zhang et al., 2013; Ghalehkhondabi & Suer, 2018).
The stock production system (MTS) consists of performing the production planning basedon sales forecasting. Therefore, an item is initially produced and then sold depending on thestock of finished products. In this situation, a series of processes involving sales forecasting,production planning, production execution and sales and delivery is followed. Some importantfeatures of MTS are the higher occurrence of standardized products and generally lower price.With regard to the order production system (MTO), the production is carried out based onconfirmed orders, that is, sales made. The natural sequence of processes in this system is tosell, plan, produce and deliver. In this case, the products are usually not repetitive, which maylead to greater complexity in the management process and further interaction with the finalconsumer (Silva, Cordeiro, Silva, & Assumpção, 2016; Pires, 2016).
Planning and production control (PPC) system is defined as a set of processes, includingcapacity planning, material requirements planning, production control and creation andcontrol of production requests (i.e. work orders). The PPC system seeks to align thecompany’s supply with the customers’ demand by maximizing the organizationalperformance and competitiveness in terms of quality, cost and delivery deadline(Guerra, Silva, & Tondolo, 2014; Sousa, Camparotti, Guerrini, Silva, & Azzolini, 2014).
By acting as a complement to the company’s enterprise resource planning (ERP)(Azanha & Camargo, 2015) to assist this set of processes, an APS system can create plansconsidering a certain perspective. However, human knowledge together with theexperience and ability of those who plan is still needed to fill the gap between model andreality. Planning systems remain as a support system for making decisions, regardless oftheir advancement level. Production scheduling solutions based on APS systems providea sequencing of production with finite capacity and generate realistic and highly reliableinformation. In addition, productive resources, operational constraints and companyvariables regarding demand and service are considered. When executing the productionorder (PO), the APS systems simultaneously consider work shifts, productivity ofmachines and operators, need for tooling, setup times, promised priorities and agreeddelivery dates. These systems, developed to address planning problems andmanufacturing scheduling based on hierarchical principles, are considered as of highperformance in processing and generating accurate schedules (Fleischmann, Meyr, &Wagner, 2005; Vidoni & Vecchietti, 2015).
According to Azanha and Camargo (2015), the systems are modularized so that eachmodule deals with certain activities to avoid APS underutilization, since they do not supportall the idealized planning tasks. Therefore, inherent to the PPC practice and consideringboth inbound (e.g. unreliable vendors, machine failures) and outbound (e.g. unknowndemand from customers) uncertainties, the systems use buffers in some of these modules toprevent these problems either in the form of security stocks or safe times.
317
Hybridproduction
system
4. Theoretical analysisSreedevi and Saranga (2017) and Rezapour et al. (2018) argue that one of the most importantcomponents of SC flexibility is the company’s ability to control production resources andmanage uncertainty to meet the customers’ needs. By analogy, it is concluded that controlcapacity depends on the human action for managing efficiency and risks in SC, whereasmanufacturing is not independent. Therefore, there is a mutual impact from this interactionand risk mitigation in these areas includes redundancy or flexibility to ensure SC is robust,resilient and reliable. By discussing the complementarity between SC and production,Ghalehkhondabi and Suer (2018) highlight the conflict on which requests should be met inhybrid systems (MTS–MTO). If MTO is priority, the impact on the chain is immediateregarding both what should be done to meet it and what should be left for MTS. Thisconflict impacts not only stock and costs (Ghadge et al., 2013), but also the competitivenessas general production efficiency should be maintained (Zhang et al., 2013). Following thesame rationale, Pires (2016), Soman et al. (2004, 2006, 2007) and Rezapour et al. (2018) pointout that an SC faces difficulty in standardizing and rationalizing programs and productionas a whole, which can generate potential risks and uncertainties to be addressed by SCRM.This argument supports the key proposition (Kp) of this paper, namely:
• Kp¼ risks perceived in SC by the adoption of a hybrid system for PPC are relevant tothe company’s SCRM.
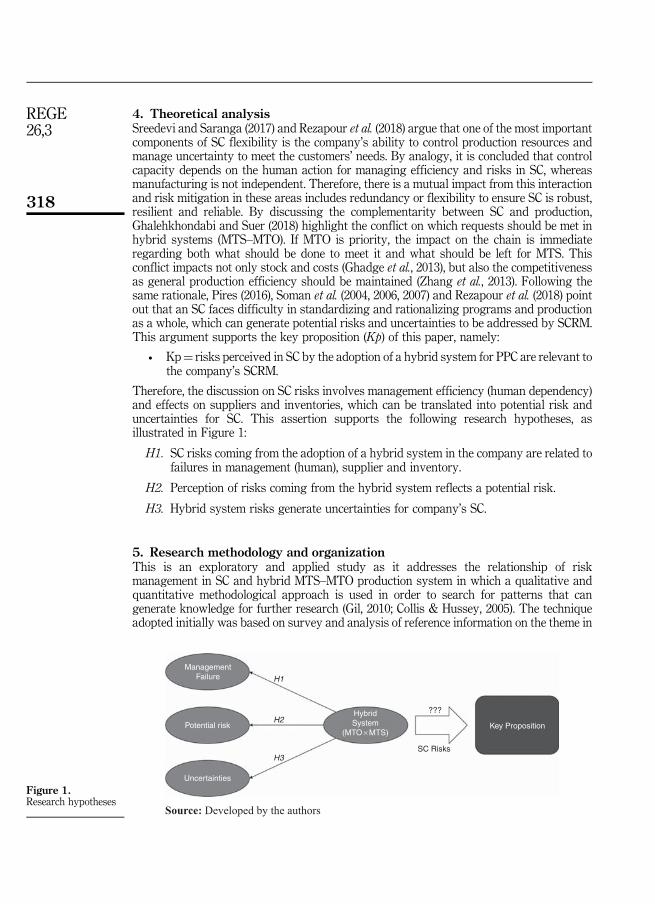
Therefore, the discussion on SC risks involves management efficiency (human dependency)and effects on suppliers and inventories, which can be translated into potential risk anduncertainties for SC. This assertion supports the following research hypotheses, asillustrated in Figure 1:
H1. SC risks coming from the adoption of a hybrid system in the company are related tofailures in management (human), supplier and inventory.
H2. Perception of risks coming from the hybrid system reflects a potential risk.
H3. Hybrid system risks generate uncertainties for company’s SC.
5. Research methodology and organizationThis is an exploratory and applied study as it addresses the relationship of riskmanagement in SC and hybrid MTS–MTO production system in which a qualitative andquantitative methodological approach is used in order to search for patterns that cangenerate knowledge for further research (Gil, 2010; Collis & Hussey, 2005). The techniqueadopted initially was based on survey and analysis of reference information on the theme in
ManagementFailure
Potential risk
???
SC Risks
Key Proposition
HybridSystem
(MTO × MTS)
Uncertainties
Source: Developed by the authors
H1
H2
H3
Figure 1.Research hypotheses
318
REGE26,3
which the search database consisted of the main academic journals in the field. Next,according to Ketokivi and Choi (2014), a large automaker in Brazil was investigated as acase study as our intention was to generate, test and elaborate theories. This company waschosen not only because it adopts hybrid system in its production, but also for convenience,since the authors were allowed to have access to facilities and conduct interviews, includingexplanations on processes, systems and production scheduling.
The theoretical research was focused on SCRM and hybrid MTO–MTS productionsystem with the intention of establishing a vision on these themes and generatingpropositions and hypotheses. Field research was conducted through qualitative interviewswith a production planning analyst, a production planning coordinator, a demand planninganalyst and an information technology (IT) consultant, all representative professionalsdeeply involved with the planning and supply areas of the company and providing supportto its ERP system, more specifically the production planning module. Therefore, this sampleis intentional and based on the quality of the data obtained. It should be also emphasizedthat the interviews took place through the interaction between authors and interviewees, notbeing guided by a formal questionnaire. The reason for this was that the study’s focus wason raising the SC risks resulting from the adoption of a hybrid production system, whichwas easily understood by the interviewees.
The interviews and information obtained were not recorded because it was notpermitted, but the authors could make annotations. In addition, observations regarding thearea responsible for the company’s production planning were made in order to understandSC risks related to the adoption of a hybrid production system. In the first stage, the risksperceived by the authors and those reported by the interviewees were addressed. Then, byusing a strategy called “focus groups” (Collis & Hussey, 2005), the researchers worked withthe group to find a consensual view. With this, it was possible to determine the perceivedrisks as well as evaluate and classify them.
Content analysis was used to assess the information obtained (i.e. interviews,observations and focus group) by means of thematic analysis, which consists ofsummarizing the idea on which the discourse of the subject develops (Mozzato &Grzybovski, 2011). In the pre-analysis phase, the information obtained was organized andin the second phase the aim was to understand and classify the risks perceived asa result of the hybrid system. Finally, in the third phase, the results were interpreted byusing statistical operations, data synthesis and selection, inferences and interpretations(Bardin, 2008).
The resulting data were statistically analyzed by using χ2 test, Kolmogorov–Smirnov’stest and Pearson’s product-moment correlation (r), which are understood as being adequatefor assessment while correlating different subjects, as in the case of this study (Malhotra,2001; Collis & Hussey, 2005). The intention to use these three tests was to evaluate trends orinconsistencies and to strengthen the conclusions drawn from the results, but alwaysconsidering that data were generated by a unique group of interviewees. This analysis wasperformed by weighting five risk factors with 12 classified risks.
From the results obtained in the final analysis, it became possible to assess theconsistency of the key research proposition and of the hypotheses based on theory, thenfinishing the study with considerations and conclusions. Figure 2 shows the researchorganization and the correlation between the steps described.
It is important to highlight that a tabulation system was used in the focus group stage toguide the presentation and analysis of data, which consisted in organizing the risks basedon their identification, classification and categorization. Then, a weight was assigned toeach risk in terms of probability and impact, as shown in Figure 3. This system supports theconstruction of the risk matrix (Figure 4 is in Chapter 6.2), which was proposed byThun and Hoenig (2011) in a study on the German automotive industry to verify which
319
Hybridproduction
system

risks need more attention, such as those considered critical for the continuity of operations.The choice of framework and matrix is justified only as a practical method for applying,organizing and understanding data.
6. The automakerThe focus company for this study is a vehicle automaker which adopts a hybridMTS–MTO production system for production planning. This form of production issupported by an APS system developed by the company’s own IT area. The company islocated in the State of São Paulo and has a network of local and international suppliers,with an estimated annual production of 160,000 vehicles for the Brazilian market andsome countries of South America.
All sales made from dealers and final consumers are informed to the automaker so thatthese data can be used for the demand planning. When a dealer does not have a given modelof vehicle in its stock, then a request is sent to the company’s sales portal to generate a salesorder. If there is no stock available, a product order is entered in the production planning
Hybrid Productive System × Risks In The Supply Chain
SCRMTheory
Hybrid Production System (MTS – MTO)Search In Area Journals
Generating Hypotheses
Individual Interviews
Focus Group – Risk Classification
Final Analysis
Observations And Understanding Of The Risks
Factor Of Risk In SC × Hybrid System
Research Proposition
Interviews And Information Gathering
�2 Test
KS Test
Pearson’s (r) Test
Considerations And Conclusions
Theory Analysis
Field Research
Content Analysis (Information And Testing)
Source: Developed by the authors
Figure 2.Research organization
Source: Developed by the authors
R (n)= Risk IdentificationP = Probability
Risks
I = Impact
R1 Risk Identification
P Probability (Very Low, Low, Medium, High, Very High)
I Impact (Very Low, Low, Medium, High, Very High)
Classification Internal or External
Category Defined based on processes and business sectors
R2 ...
P
I
Classification
Category
...
...
...
...Figure 3.Risk classification
320
REGE26,3

and sequenced for production. This order has production priority regarding vehiclesdestined to fulfill the stock, which is based on the demand planning. The same is true forconfirmed export orders.
6.1 Production planning at the automaker plantAs explained above, production planning is based on demand and confirmed orders.Demand planning originates from the executive areas responsible for this task, such assales, marketing and production. This team deals with quantities in a productive sequencedesigned for up to five months. The sequencing can be changed at any time from the secondweek. Week 1 is frozen as only the production sequence of the day can be changed, that is,the manufacturing position (i.e. moment) of some vehicles is modified, but the vehiclescannot be removed or included on the same day. Functionally, the system generates aproduction sequencing from the information entered in the APS system in order to performthe production planning.
The export process, whose priority influences the scheduling time, defines that everyrequest made after approval and payment confirmation must have the quantity entered inthe APS system according to the delivery deadline. Consequently, this affects the entiresequencing defined in the SC and production line.
Source: Developed by the authors using the model by Thun and Hoenig (2011)
Very HighR4R11
R1R2R3R5
R10
High R6
Medium R8 R7 R9
Low R12
Very Low
Very Low Low Medium High Very High
Risk MatrixImpact × Probability
Probability
Impact
Figure 4.Risk matrix –
impact×probability
321
Hybridproduction
system

APS system is divided basically into two modules: the first is intended to gatherinformation on the demand and the second is dedicated to execute the demand planningprocess. The first module provides support to gather information, which is manuallyperformed by a sales planning professional. Next, the input data and information generatedare evaluated by the responsible analyst, who considers the current month and the followingfour months, thus totaling the five months of planning. The data are then transferred to theproduction planning module and transformed into PO, which are organized by the PPCanalyst according to criteria such as capacity and restrictions of production.
The PPC analyst is the one who inserts prior information to the APS system. The firsttask is to insert data on production schedule and production capacity, whereas the secondtask is to enter information on constraints, which is represented by times when requiredinputs are not available for production.
Another step of the work by the PPC analyst is to understand POs that have beengenerated from demand so that the schedule can fulfill the confirmed orders, since these arenot entered into the demand planning input. In addition, the PPC analyst also checks forproduct optional features that can influence the programming.
Once the analysis and adjustments of the productive orders had been completed, theywere made available to the sequencing system, as well as information on constraints,production capacity and production schedule. For the production sequencing, the systemuses the software called Order Sequencing and Slotting that is provided to the company’shead offices by a third-party company for use under license. This software uses aproprietary algorithm in which a timeline containing all orders allocated with theirrespective quantities, including production capacity, constraints, production schedule andplanning period, are generated. The result of this process helps the analyst evaluateconstraints and productive capacity for certain days, thus generating more appropriatesequences to optimize the productive planning. Upon completion of the sequencing step,data are returned to the APS system to create daily sequencing.
The information system used by the company to manage the hybrid production processcan provide daily sequencing on a batch basis. That means that it is possible to createbatches of white vehicles with different engine and transmission capacities and thenorganize them into different types within the same color batch. As an example, in a batch of100 white cars in a day, it is possible to provide a configuration so that they can be producedstarting from 25 vehicles with 1.0 engines, 25 vehicles with 1.6 engines and 50 vehicles with2.0 engines. Of these 50 white vehicles with 2.0 engines, it is still possible to further definethat 25 cars will have automatic transmission and 25 ones manual transmission, allowingthem to be produced interspersedly (e.g. two cars with automatic transmission and two carswith manual ones, and so on).
After setting which cars will be produced on the day and in which sequence, the PPCanalyst transfers all the day’s POs to another information system called ERP, which in turnsends updated information on the demand forecasting and weeks of confirmed orders. TheERP system receives these data and separates them in a daily sequence for weekly planning(corresponding to order confirmation period in the APS system) and receives the forecastdata (corresponding to the period from the second to the fifth month). From there on, otherprocesses such as material planning and purchase orders are triggered. The productionplanning information contained in the ERP system is also shared among all the supplierswho are part of the company’s SC.
6.2 Scoring and classification of risksConsidering the steps of the present study, specifically the researchers’ observations on thecompany, the information gathered from employees and managers and the focus groupcarried out with those directly involved in the production and SC planning and
322
REGE26,3
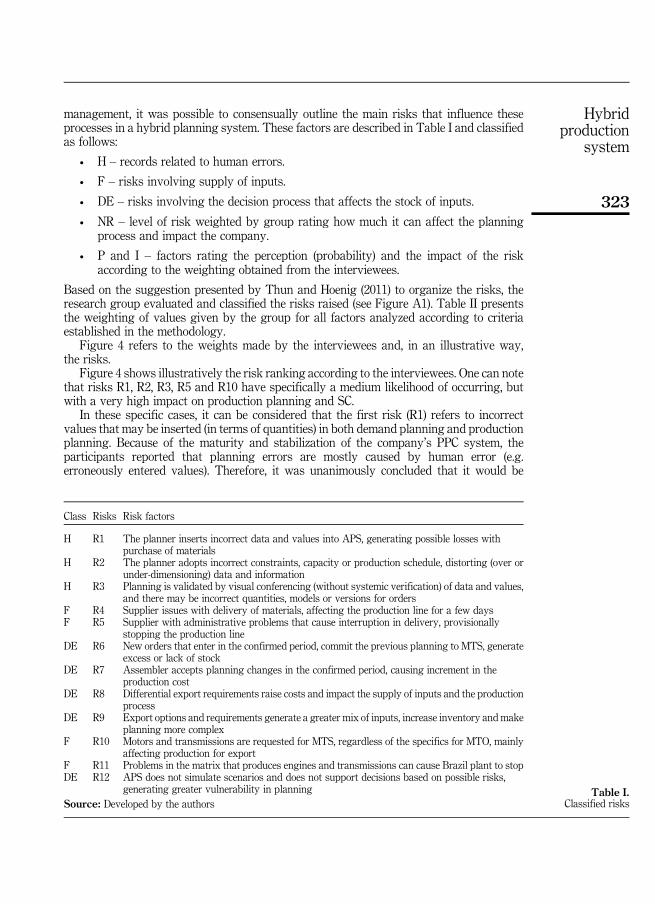
management, it was possible to consensually outline the main risks that influence theseprocesses in a hybrid planning system. These factors are described in Table I and classifiedas follows:
• H – records related to human errors.
• F – risks involving supply of inputs.
• DE – risks involving the decision process that affects the stock of inputs.
• NR – level of risk weighted by group rating how much it can affect the planningprocess and impact the company.
• P and I – factors rating the perception (probability) and the impact of the riskaccording to the weighting obtained from the interviewees.
Based on the suggestion presented by Thun and Hoenig (2011) to organize the risks, theresearch group evaluated and classified the risks raised (see Figure A1). Table II presentsthe weighting of values given by the group for all factors analyzed according to criteriaestablished in the methodology.
Figure 4 refers to the weights made by the interviewees and, in an illustrative way,the risks.
Figure 4 shows illustratively the risk ranking according to the interviewees. One can notethat risks R1, R2, R3, R5 and R10 have specifically a medium likelihood of occurring, butwith a very high impact on production planning and SC.
In these specific cases, it can be considered that the first risk (R1) refers to incorrectvalues that may be inserted (in terms of quantities) in both demand planning and productionplanning. Because of the maturity and stabilization of the company’s PPC system, theparticipants reported that planning errors are mostly caused by human error (e.g.erroneously entered values). Therefore, it was unanimously concluded that it would be
Class Risks Risk factors
H R1 The planner inserts incorrect data and values into APS, generating possible losses withpurchase of materials
H R2 The planner adopts incorrect constraints, capacity or production schedule, distorting (over orunder-dimensioning) data and information
H R3 Planning is validated by visual conferencing (without systemic verification) of data and values,and there may be incorrect quantities, models or versions for orders
F R4 Supplier issues with delivery of materials, affecting the production line for a few daysF R5 Supplier with administrative problems that cause interruption in delivery, provisionally
stopping the production lineDE R6 New orders that enter in the confirmed period, commit the previous planning to MTS, generate
excess or lack of stockDE R7 Assembler accepts planning changes in the confirmed period, causing increment in the
production costDE R8 Differential export requirements raise costs and impact the supply of inputs and the production
processDE R9 Export options and requirements generate a greater mix of inputs, increase inventory and make
planning more complexF R10 Motors and transmissions are requested for MTS, regardless of the specifics for MTO, mainly
affecting production for exportF R11 Problems in the matrix that produces engines and transmissions can cause Brazil plant to stopDE R12 APS does not simulate scenarios and does not support decisions based on possible risks,
generating greater vulnerability in planningSource: Developed by the authors
Table I.Classified risks
323
Hybridproduction
system

important to have reviewers for checking both demand planning and production planning,which would reduce such an occurrence, but not the impact of the risk.
The second risk (R2) refers to process constraints, day’s production capacity andincorrect production schedule, topics that require attention by the planner. It is understoodthat a planner can parameterize the system by considering a working day that should not becount (e.g. a holiday) or by not including a restriction in the system (e.g. the tire suppliercannot provide the desired quantity). It was also understood that this is a human error andthe best way to mitigate this risk is to have reviewers, as suggested in the first risk, whichwould reduce the occurrence of a given error, but not its impact.
The third risk (R3) is related to the APS system used by the company, for example, whenthere is no validation and consistency between models and versions of vehicles. This meansthat if one enters a template that is no longer being produced, the system will accept thevalue. Therefore, the demand for materials is triggered in the SC, which representsquantities for models or even incorrect versions compared to the correct order. Although theproblem can be linked to the software used, the risk involves human and planning mistakesbecause it was understood that the professional planner is the one who should beresponsible for data entry. To prevent this from happening, it was suggested that values,models and versions should be systematically validated to reduce the occurrence of sucherrors, although the impact cannot be changed.
Since risk R5 is an external risk, it has a limited control range. In this case the supplier maypresent some problem that will impact the delivery of materials and cause the production lineto stop. To avoid this risk, it was suggested that supply insurance should be held, althoughnone of the participants know any company using it. The idea is that the risk could betransferred. Nevertheless, it was identified that the company currently works with more thanone supplier for each production line, thus being very unlikely that two suppliers would fail infulfilling the delivery. The interviewees did not consider third- or fourth-tier providers and theidea that such a transfer could reduce the probability of risks. For example, a given contractconsidering fines could create incentives that would make the supplier to keep its supply ofraw materials, manufacturing process and logistics instead of stopping them.
R10 is the fifth most relevant risk, which is a bit more complex from a planning point ofview. Since the company’s requests for engines and transmissions consider only the stock-oriented production (i.e. MTS), there is an additional amount to create a safety stock.But this additional stock ends up being used to meet confirmed orders (MTO), such as theexport ones. The time between requesting the engines and transmissions and receivingthem is approximately one month, which means that the company will be receiving the
Risks NR P I H F DE
R1 4 2 3 4 2.5 2R2 4 2 4 4 3 3R3 4 1 3 4 2 2R4 3.5 2 5 1.5 3.5 5R5 4 3 3 1 4 3.5R6 3.5 2 3 1 2.5 3.5R7 3 2 3 2.5 1 3R8 2.5 2 3 1 2.5 2.5R9 3.5 2 3 1 3 3.5R10 4 3 4 2.5 4 3.5R11 3.5 1 4 1.5 3.5 2.5R12 3 3 3 3 3.5 3Source: Developed by the authors
Table II.Weighting of riskfactor classification
324
REGE26,3

materials only after one month from the initial request. In the event that confirmed ordersneed to be fulfilled within less than one month, there may be a shortage of materials, whichends up compromising the order delivery deadlines. The proposed solution was to minimizethe impact from very high to high based on the premise that when a new confirmed request(MTO) is received, it is included in the next month’s planning, which is defined as apredetermined delivery period. For the professionals of the company under study, itbecomes clear that all identified risks should be analyzed for possibility of mitigation,transfer or even nullification, if possible. Risks identified as critical in the risk matrix can bebetter addressed by reducing their likelihood of occurrence or even their impact.
7. Analysis and considerationsBased on the risk matrix (Figure 3), the interviewees classified some risks (R1, R2, R3, R5 andR10) as having amoderate likelihood of occurrence, but with a high impact on SCM. At this point,it is important to remember that our analysis was aimed to see the reflections on the SC ratherthan on the company. Moreover, this view is restricted to the experience of the interviewees.
Some of these risks are essentially related to human failure, that is, the mistake made by aprofessional can compromise the planning with reflection on the SC. Other risks are related tothe product supply when the supplier is a subsidiary of the company. Some other risks are inthe middle range of the matrix and are related to suppliers’ failures and SC stock. Although itis possible to show risks in this matrix, it is important to remember that the final intention ofthis study was to understand the management of risks for the hybrid production system andtheir relevance to SCRM by means of correlations between the risks identified.
Nevertheless, when risk factors are correlated with the weights made by managersaccording to risk level, occurrence, impact and nature (i.e. human failure, supplier, decisionand stock), it was not possible to identify evidence that these risks are relevant to the SC.
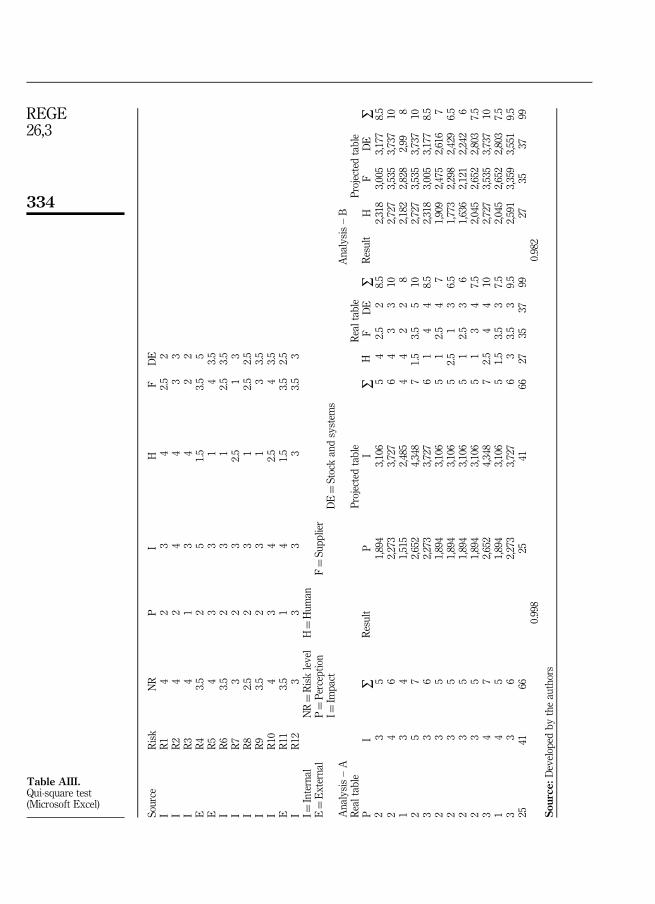
This conclusion is based on the weighting made by using χ2 test, which allows determinewhether there is a systematic association (Malhotra, 2001) to evidence any correlationbetween perceived risks (P), impact (I), human influence (H), supplier (F) and decision andstock (DE) factors.
As shown in Table III, analysis of the perception (P) of risks and their impact (I)was performed by using χ2 test (A¼ 0.998), revealing that there is no correlation between
Analysis – A Analysis – BReal table Projected table Real table Projected tableP I ∑ P I ∑ H F DE ∑ H F DE ∑
2 3 5 Result 1,894 3,106 5 4 2.5 2 8.5 Result 2,318 3,005 3,177 8.52 4 6 2,273 3,727 6 4 3 3 10 2,727 3,535 3,737 101 3 4 1,515 2,485 4 4 2 2 8 2,182 2,828 2,99 82 5 7 2,652 4,348 7 1.5 3.5 5 10 2,727 3,535 3,737 103 3 6 2,273 3,727 6 1 4 4 8.5 2,318 3,005 3,177 8.52 3 5 1,894 3,106 5 1 2.5 4 7 1,909 2,475 2,616 72 3 5 1,894 3,106 5 2.5 1 3 6.5 1,773 2,298 2,429 6.52 3 5 1,894 3,106 5 1 2.5 3 6 1,636 2,121 2,242 62 3 5 1,894 3,106 5 1 3 4 7.5 2,045 2,652 2,803 7.53 4 7 2,652 4,348 7 2.5 4 4 10 2,727 3,535 3,737 101 4 5 1,894 3,106 5 1.5 3.5 3 7.5 2,045 2,652 2,803 7.53 3 6 2,273 3,727 6 3 3.5 3 9.5 2,591 3,359 3,551 9.525 41 66 25 41 66 27 35 37 99 27 35 37 99
0.998 0.982Source: Developed by the authors
Table III.χ2 test
325
Hybridproduction
system
the two factors. The influence of factors H, F and DE was analyzed by using χ2 test,indicating no evidence of correlation between these factors.
This result invalidates H1, because based on the risk weightings given by theinterviewees, one cannot conclude that risks arising from adopting a hybrid system arerelated to management (human) failures, suppliers and inventory within the company asthere was no reflection on the SC.
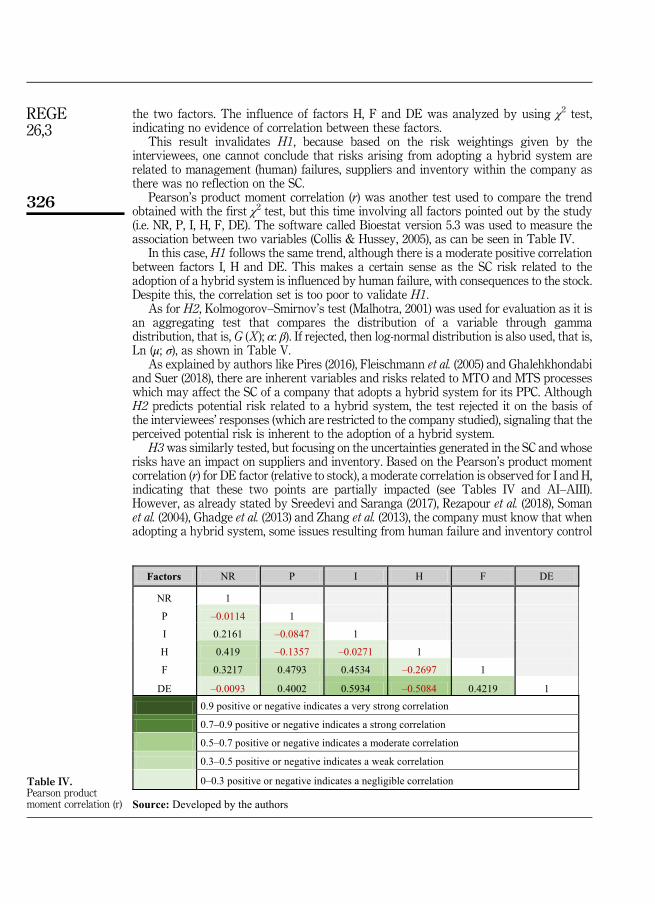
Pearson’s product moment correlation (r) was another test used to compare the trendobtained with the first χ2 test, but this time involving all factors pointed out by the study(i.e. NR, P, I, H, F, DE). The software called Bioestat version 5.3 was used to measure theassociation between two variables (Collis & Hussey, 2005), as can be seen in Table IV.
In this case, H1 follows the same trend, although there is a moderate positive correlationbetween factors I, H and DE. This makes a certain sense as the SC risk related to theadoption of a hybrid system is influenced by human failure, with consequences to the stock.Despite this, the correlation set is too poor to validate H1.
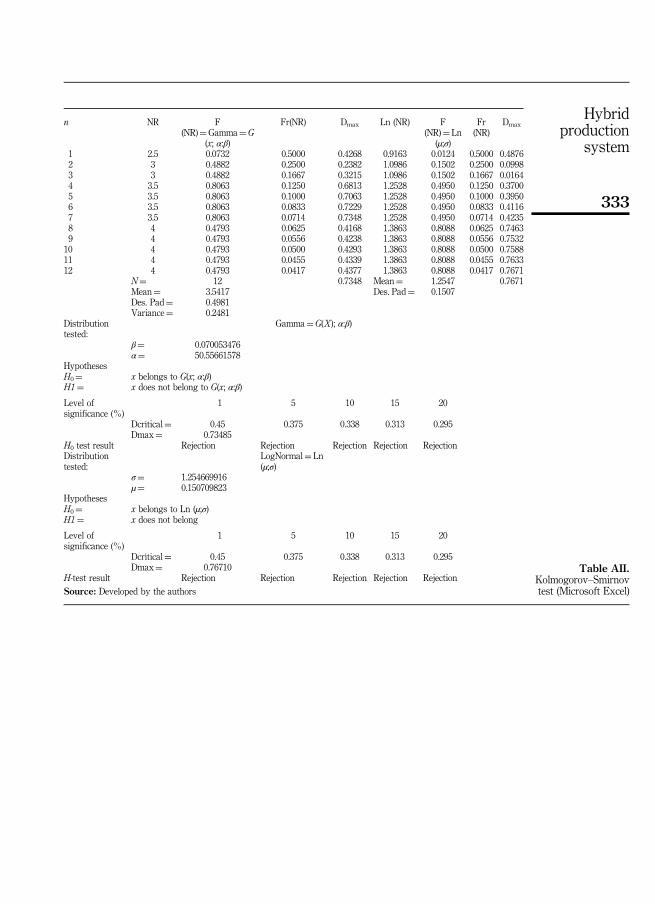
As for H2, Kolmogorov–Smirnov’s test (Malhotra, 2001) was used for evaluation as it isan aggregating test that compares the distribution of a variable through gammadistribution, that is, G (X ); α: β). If rejected, then log-normal distribution is also used, that is,Ln (μ; σ), as shown in Table V.
As explained by authors like Pires (2016), Fleischmann et al. (2005) and Ghalehkhondabiand Suer (2018), there are inherent variables and risks related to MTO and MTS processeswhich may affect the SC of a company that adopts a hybrid system for its PPC. AlthoughH2 predicts potential risk related to a hybrid system, the test rejected it on the basis ofthe interviewees’ responses (which are restricted to the company studied), signaling that theperceived potential risk is inherent to the adoption of a hybrid system.
H3was similarly tested, but focusing on the uncertainties generated in the SC and whoserisks have an impact on suppliers and inventory. Based on the Pearson’s product momentcorrelation (r) for DE factor (relative to stock), a moderate correlation is observed for I and H,indicating that these two points are partially impacted (see Tables IV and AI–AIII).However, as already stated by Sreedevi and Saranga (2017), Rezapour et al. (2018), Somanet al. (2004), Ghadge et al. (2013) and Zhang et al. (2013), the company must know that whenadopting a hybrid system, some issues resulting from human failure and inventory control
Factors NR P I H F DE
NR 1
P –0.0114 1
I 0.2161 –0.0847 1
H 0.419 –0.1357 –0.0271 1
F 0.3217 0.4793 0.4534 –0.2697 1
DE –0.0093 0.4002 0.5934 –0.5084 0.4219 10.9 positive or negative indicates a very strong correlation
0.7–0.9 positive or negative indicates a strong correlation
0.5–0.7 positive or negative indicates a moderate correlation
0.3–0.5 positive or negative indicates a weak correlation
0–0.3 positive or negative indicates a negligible correlation
Source: Developed by the authors
Table IV.Pearson productmoment correlation (r)
326
REGE26,3

may have to be managed. Based on the other correlations, it is thought that the validation ofH3 would be very poor and thus the hypothesis was rejected, meaning that the risks do notnecessarily create uncertainties in the company’s SC.
Therefore, whenH1–H3 are analyzed as a means to understand the effects on the study’scentral proposition, it is possible to refute the position established by Brusset and Teller(2017), Qazi et al. (2018) and Rezapour et al. (2018) that a hybrid MTO–MTS productionsystem generates SC risks that must be managed. It should be noted that our study haslimitations, in this particular case involving a large vehicle automaker operating in Brazil.So, the key proposition that perceived SC risks are relevant to the company’s SCRMfollowing the adoption of a hybrid system for PPC is not true.
8. ConclusionThis field research has found, based on the interviewees’ responses, that the most relevantSC risks with greater impact on the company are those that may cause some type ofinterruption in the production line. The use of the impact and probability matrix, adaptedfrom Thun and Hoenig (2011), contributed to this analysis on the possible risks to the SC asa result of adopting a hybrid system. The risks identified are related to human failure andsupply and decision process factors. In this sense, the study emphasizes the interviewees’concern that the production cannot be interrupted so that no effects are generated in the SC.
Because of the lack of studies on hybrid MTS–MTO systems, especially regarding the SC,the proposal of this paper was to study SCRM and hybrid systems (MTO–MTS) and providean example on how these two management concepts are related and fill a gap identified byZhang et al. (2013). The conclusions obtained in the present study, despite its constraints,indicate that not every risk generated in the SC necessarily has to be managed or mitigated.It is evident that several risks result from functional failures (e.g. incorrect data entry) andare inherent to management decisions when different procedures and production paths areadopted. However, as in the present case, such risks were managed internally. This finding isbased on the rejection of the study’s main proposition and is also supported by authors likeBrusset and Teller (2017), Qazi et al. (2018) and Rezapour et al. (2018), who state that perceive
Distribution tested: LogNormal¼Ln (µ;σ)β¼ 0.070053476α¼ 50.55661578
HypothesesH0¼ x belongs to G(x; α:β)H1¼ x does not belong to G(x; α:β)
Level of significance (%) 1 5 10 15 20Dcrítical¼ 0.45 0.375 0.338 0.313 0.295Dmax¼ 0.73485
H0 test result Rejection Rejection Rejection Rejection RejectionDistribution tested: LogNormal¼Ln (µ;σ)
σ¼ 1.254669916µ¼ 0.150709823
HypothesesH0¼ x belongs to Ln (µ;σ)H1¼ x does not belong
Level of significance (%) 1 5 10 15 20Dcrítical¼ 0.45 0.375 0.338 0.313 0.295Dmax¼ 0.76710
H0 test result Rejection Rejection Rejection Rejection RejectionSource: Developed by the authors
Table V.Kolmogorov–Smirnov
test
327
Hybridproduction
system

SC risks resulting from the adoption of a hybrid system are relevant to SCRM. Therefore, onecan conclude that the adoption of a hybrid MTS–MTO production system does notnecessarily increase the SC risks.
Therefore, it is possible to highlight the contributions of the present study regarding thefollowing aspects:
• In the theoretical dimension, it was possible to determine the ratio of risks in the SCas a result of the adoption of hybrid production systems, but obviously consideringthe limitations inherent to a single case study. The contribution of the present studyis related not only to the risk management in SC, but also to the production planningtheory on the adoption of mixed systems, since there are a few studies addressingthis theme. In the SCRM context, an issue raised by the present study is what shouldin fact be interpreted as a threat to the SC, since the relevance of the risk is related tothe functional characteristics of the area.
• In the practical dimension, the present study has shown that SC risks arising from theadoption of a hybrid production system are inherent to the decisions made bymanagersin the daily planning, that is, the risks are implicit to the operationalization itself. Also,the study contributes to decision-making process regarding the adoption of mixedproduction systems, since it presents a list of possible risks and possible impacts.
It should be brought to attention that the use of case study method is one of the limitations ofour work. The other limitation is related to the data obtained as they were restricted to a singlearea of the company and to a small group. Despite the care taken by the authors, there was arisk of possible biases or trends. Moreover, although the data obtained are reasonable forstatistical analysis as they provide correlations according to the method adopted, they arelimited. However, the present study provides insights for future research on this theme. Forinstance, the study might be expanded to other companies that adopt or even may adopt ahybrid production system. This would provide a more complete picture and better point outthe trends by means of further analysis. Studies might also explore functional risks arisingfrom the management itself, or risks restricted to SCRM, including their relevance. Thesuggestion is that open studies investigating the organization as a whole or even functionalareas on a restrictive basis should be conducted, as in the present case study. Finally, the wayhow organizations strive to control risks unnecessarily might also be studied.
References
Azanha, A., & Camargo, J. B. Jr (2015). Características de sistemas APS: um estudo de caso em umagrande empresa do setor industrial de equipamentos pesados utilizando sistema SAP-APO.Revista Gestão & Tecnologia, 15(1), 127–153.
Bardin, L. (2008). Análise de conteúdo. Edições 70, Editora 70, Lda, Lisboa.
Beemsterboer, B., Land, M., & Teunter, R. (2016). Hybrid MTO-MTS production planning: Anexplorative study. European Journal of Operational Research, 248(2), 453–461.
Blome, C., & Schoenherr, T. (2011). Supply chain risk management in financial crises – Amultiple case-study approach. International Journal of Production Economics, 134(1), 43–57.
Blos, M. F., Quaddus, M., Wee, H. M., &Watanabe, K. (2009). Supply chain risk management (SCRM): Acase study on the automotive and electronic industries in Brazil. Supply Chain Management: AnInternational Journal, 14(4), 247–252.
Brusset, X., & Teller, C. (2017). Supply chain capabilities, risks, and resilience. International Journal ofProduction Economics, 184(February), 59–68.
Cattani, K. D., Dahan, E., & Schmidt, G. M. (2010). Lowest cost may not lower total cost: Using‘Spackling’ to smooth mass-customized production. Production and Operations Management,19(5), 531–545.
328
REGE26,3

Chang, W., Ellinger, A. E., & Blackhurst, J. A. (2015). Contextual approach to supply chain riskmitigation. The International Journal of Logistics Management, 26(3), 642–656.
Christopher, M., & Peck, H. (2004). Building the resilient supply chain. The International Journal ofLogistics Management, 15(2), 1–14.
Collis, J., & Hussey, R. (2005), Pesquisa em Administracao: um guia pra tico para alunos de graduacao epos-graduacao (2nd ed.). Porto Alegre: Bookman.
Fleischmann, B., Meyr, H., & Wagner, M. (2005), Supply chain management and advanced planning:concepts, models, software and case studies (3rd ed.). Heidelberg: Springer.
Ghadge, A., Dani, S., Chester, M., & Kalawsky, R. (2013). A systems approach for modelling supplychain risks. Supply Chain Management: An International Journal, 18(5), 523–538.
Ghalehkhondabi, I., & Suer, G. (2018). Production line performance analysis within a MTS/MTOmanufacturing framework: A queuing theory approach. Production, 28( July), 1–17.
Gil, A.C. (2010), Como elaborar projetos de pesquisa (5th ed.). São Paulo: Atlas.
Guerra, R. M. A., Silva, M. S., & Tondolo, V. A. G. (2014). Planejamento das necessidades de materiais:ferramenta para a melhoria do planejamento e controle da produção. Gepros: Gestão daProdução, Operações e Sistemas, 9(3), 43–60.
Ketokivi, M., & Choi, T. (2014). Renaissance of case research as a scientific method. Journal ofOperations Management, 32(5), 232–240.
Lambert, D. M., & Cooper, M. C. (2000). Issues in supply chain management. Industrial MarketingManagement, 29(1), 65–83.
Malhotra, N. (2001), Pesquisa de Marketing – Uma orientação aplicada, Porto Alegre: Bookman.
Monostoria, J. (2018). Supply chains’ robustness: Challenges and opportunities. Proceedingsof the 11th CIRP Conference on Intelligent Computation in Manufacturing Engineering, Gulfof Naples, July.
Mozzato, A. R., & Grzybovski, D. (2011). Análise de Conteúdo como Técnica de Análise de DadosQualitativos no Campo da Administração: Potencial e Desafios. Revista de AdministraçãoContemporânea, 15(4), 731–747.
Pires, S. R. I. (2016), Gestão da Cadeia de Suprimentos (Supply Chain Management): Conceitos,Estratégias, Práticas e Casos (3rd ed.). São Paulo: Atlas.
Pires, S. R. I., & Castilho, P. (2015). Supply chain risk management in the automotive industry: A studyin a tier 1 supplier. Proceedings of the EUROMA, Neuchâtel, July.
Ponte, B., Costas, J., Puche, J., Pino, R., & La Fuente, D. (2018). The value of lead time reduction andestabilization: A comparison between traditional and collaborative supply chains.Transportation Research Part E, 111(March), 165–185.
Qazi, A., Dickson, A., Quigley, J., & Gaudenzi, B. (2018). Supply chain risk network management: ABayesian belief network and expected utility based approach for managing supply chain risks.International Journal of Production Economics (in Press), 196, 24–42.
Rezapour, S., Srinivasan, R., Tew, J., Janet, A., & Mistree, F. (2018). Correlation between strategic andoperational risk mitigation strategies in supply networks. International Journal of ProductionEconomics, 201, ( July), 225–248.
Silva, S. M., Cordeiro, J. C. A., Silva, F. N. M., & Assumpção, M. R. (2016). Aderência de ERP a sistemashíbridos de produção. Exacta - Engenharia de Produção, 14(1), 149–161.
Soman, C. A., Van donk, D. P., & Gaalman, G. (2004). Combined make-to-order and make-to-stockin a food production system. International Journal of Production Economics, 90(2),223–235.
Soman, C. A., Van donk, D. P., & Gaalman, G. (2006). Comparison of dynamic scheduling policies forhybrid make-to-order and make-to-stock production systems with stochastic demand.International Journal of Production Economics, 104(2), 441–453.
329
Hybridproduction
system

Soman, C. A., Van donk, D. P., & Gaalman, G. (2007). Capacitated planning and scheduling forcombined make-to-order and make-to-stock production in the food industry: An illustrative casestudy. International Journal of Production Economics, 108(1), 191–199.
Sousa, T. B., Camparotti, C. E. S., Guerrini, F. M., Silva, A. L., & Azzolini, W. (2014). An overview of theadvanced planning and scheduling systems. Independent Journal of Management & Production,5(4), 1032–1049.
Sreedevi, R., & Saranga, H. (2017). Uncertainty and supply chain risk: The moderating role of supplychain flexibility in risk mitigation. International Journal of Production Economics, 193(November), 332–342.
Thun, J. H., & Hoenig, D. (2011). An empirical analysis of supply chain risk management in the Germanautomotive industry. International Journal of Production Economics, 131(1), 242–249.
Vidoni, M. C., & Vecchietti, A. R. (2015). A systemic approach to define and characterize advancedplanning systems (APS). Computers & Industrial Engineering, 90(December), 326–338.
Wolfs, D. A., Takakura, F., Rezende, M., Vivaldini, M., & Antoniolli, P. D. (2015). Risk management insupply chain management: Case study of a Brazilian automotive distribution process. Journal ofManagement Research, 7(5), 109–126.
Yousefnejad, H., & Esmaeili, M. (2018). Tactical production planning in a hybrid MTS/MTO systemusing Stackelberg game. Operational Research International Journal (February), 1–19,Available at: https://doi.org/10.1007/s12351-018-0385-2
Zhang, Z. G., Kim, I., Springer, M., Cai, G. G., & Yu, Y. (2013). Dynamic pooling of make-to-stockand make-to-order operations. International Journal of Production Economics, 144(1), 44–56.
Corresponding authorMauro Vivaldini can be contacted at: [email protected]
Associate Editor: Felipe Lara
330
REGE26,3

Appendix 1. Risks-classification, category and weighting
Source: Developed by the authors
R1The planner inserts incorrect data and values into the APS,generating possible losses with purchase of materials R7
The automaker undertakes planning changes in theconfirmed period, causing the cost of production toincrease
P Medium P Medium
I Very high I Medium
Classification Internal Classification Internal
Category Human influence Category Decision and Stock
R2The planner adopts incorrect constraints, capacity or production schedule, distorting (over or under-dimensioning) data and information
R8Differential export requirements raise costs and impact the supply of inputs and the production process
P Medium P Low
I Very high I Medium
Classification Internal Classification External
Category Human influence Category Decision and Stock
R3Planning is validated by visual conferencing (withoutsystematic verification) of data and values, and there may beincorrect quantities, models or versions for orders
R9Export options and requirements generate a greater mix ofinputs, increase inventory and make planning morecomplex
P Medium P High
I Very high I Medium
Classification Internal Classification Internal
Category Human influence Category Decision and Stock
R4Supplier issues with delivery of materials, affecting theproduction line for a few days
R10Motors and transmissions are requested for MTS,regardless of the specifics for MTO, mainly affectingproduction for export
P Low P Medium
I Very high I Very high
Classification External Classification Internal
Category Supply Category Supply
R5Supplier with administrative problems that causeinterruption in delivery, provisionally stopping theproduction line
R11Problems in the matrix that produces engines andtransmissions can cause plant to stop in Brazil
P Medium P Low
I Very high I Very high
Classification External Classification External
Category Local Category Supply
R6New orders that enter the confirmed period, commit theprevious planning to MTS, generate excess or lack ofstock
R12APS does not simulate scenarios, does not supportdecisions based on possible risks, generating greatervulnerability in planning
P Medium P High
I High I Low
Classification Internal Classification Internal
Category Decision and Stock Category Decision and Stock
Evaluated Risks
Figure A1.Evaluation and
classification of risks
331
Hybridproduction
system

Appendix 2. Calculation matrices
NR × P NR × I NR × H NR × F NR × DE P × I P × H P × F P × DE I × H I × F I × DE H × F H × DE F × DE
n (pairs) = 12 12 12 12 12 12 12 12 12 12 12 12 12 12 12r (Pearson) = –0.0114 0.2161 0.419 0.3217 –0.0093 –0.0847 –0.1357 0.4793 0.4002 –0.0271 0.4534 0.5934 –0.2697 –0.5084 0.4219
IC 95% =–0.58 a
0.57–0.41 a
0.70–0.20 a
0.80–0.31 a
0.76–0.58 a
0.57–0.63 a
0.51–0.66 a
0.48–0.13 a
0.83–0.23 a
0.79–0.59 a
0.56–0.16 a
0.820.03 a 0.87
–0.73 a 0.36
–0.84 a 0.09
–0.20 a 0.80
IC 99% =–0.70 a
0.69–0.57 a
0.79–0.39 a
0.86–0.48 a
0.83–0.70 a
0.69–0.74 a
0.65–0.76 a
0.62–0.33 a
0.88–0.41 a
0.86–0.71 a
0.68–0.35 a
0.87–0.18 a
0.91–0.81 a
0.53–0.89 a
0.29–0.39 a
0.86R2 = 0.0001 0.0467 0.1756 0.1035 0.0001 0.0072 0.0184 0.2297 0.1602 0.0007 0.2056 0.3521 0.0728 0.2584 0.178t= –0.036 0.7 1.4593 1.0743 –0.0293 –0.269 –0.4332 1.727 1.381 –0.0859 1.6086 2.3313 –0.8858 –1.8668 1.4715GL = 10 10 10 10 10 10 10 10 10 10 10 10 10 10 10(p) = 0.972 0.4999 0.1751 0.3079 0.9772 0.7934 0.674 0.1148 0.1973 0.9333 0.1387 0.0419 0.3965 0.0914 0.1718Power 0.05 = 0.0426 0.1611 0.38 0.2595 0.0417 0.0773 0.1057 0.4686 0.3544 0.0496 0.4293 0.6568 0.2071 0.5146 0.384
Power 0.01 = 0.0755 0.0344 0.1611 0.0887 0.0772 0.0274 0.0018 0.2234 0.1447 0.0636 0.1947 0.3908 0.06 0.2595 0.1637
Correlation Matrix
Factors NR P I H F DE
NR 1P –0.0114 1I 0.2161 –0.0847 1H 0.419 –0.1357 –0.0271 1F 0.3217 0.4793 0.4534 –0.2697 1
DE –0.0093 0.4002 0.5934 –0.5084 0.4219 10.9 positive or negative indicates a very strong correlation0.7–0.9 positive or negative indicates a strong correlation0.5–0.7 positive or negative indicates a moderate correlation0.3–0.5 positive or negative indicates a weak correlation0–0.3 positive or negative indicates a negligible correlation
Source: Developed by the authors
Table AI.Pearson productmoment correlation (r)(BioEstat 5.3)
332
REGE26,3
n NR F(NR)¼Gamma¼G
(x; α:β)
Fr(NR) Dmax Ln (NR) F(NR)¼Ln
(µ;σ)
Fr(NR)
Dmax
1 2.5 0.0732 0.5000 0.4268 0.9163 0.0124 0.5000 0.48762 3 0.4882 0.2500 0.2382 1.0986 0.1502 0.2500 0.09983 3 0.4882 0.1667 0.3215 1.0986 0.1502 0.1667 0.01644 3.5 0.8063 0.1250 0.6813 1.2528 0.4950 0.1250 0.37005 3.5 0.8063 0.1000 0.7063 1.2528 0.4950 0.1000 0.39506 3.5 0.8063 0.0833 0.7229 1.2528 0.4950 0.0833 0.41167 3.5 0.8063 0.0714 0.7348 1.2528 0.4950 0.0714 0.42358 4 0.4793 0.0625 0.4168 1.3863 0.8088 0.0625 0.74639 4 0.4793 0.0556 0.4238 1.3863 0.8088 0.0556 0.753210 4 0.4793 0.0500 0.4293 1.3863 0.8088 0.0500 0.758811 4 0.4793 0.0455 0.4339 1.3863 0.8088 0.0455 0.763312 4 0.4793 0.0417 0.4377 1.3863 0.8088 0.0417 0.7671
N¼ 12 0.7348 Mean¼ 1.2547 0.7671Mean¼ 3.5417 Des. Pad¼ 0.1507Des. Pad¼ 0.4981Variance¼ 0.2481
Distributiontested:
Gamma¼G(X ); α:β)
β¼ 0.070053476α¼ 50.55661578
HypothesesH0¼ x belongs to G(x; α:β)H1¼ x does not belong to G(x; α:β)
Level ofsignificance (%)
1 5 10 15 20
Dcrítical¼ 0.45 0.375 0.338 0.313 0.295Dmax¼ 0.73485
H0 test result Rejection Rejection Rejection Rejection RejectionDistributiontested:
LogNormal¼Ln(µ;σ)
σ¼ 1.254669916µ¼ 0.150709823
HypothesesH0¼ x belongs to Ln (µ;σ)H1¼ x does not belong
Level ofsignificance (%)
1 5 10 15 20
Dcrítical¼ 0.45 0.375 0.338 0.313 0.295Dmax¼ 0.76710
H-test result Rejection Rejection Rejection Rejection RejectionSource: Developed by the authors
Table AII.Kolmogorov–Smirnovtest (Microsoft Excel)
333
Hybridproduction
system
Source
Risk
NR
PI
HF
DE
IR1
42
34
2.5
2I
R2
42
44
33
IR3
41
34
22
ER4
3.5
25
1.5
3.5
5E
R5
43
31
43.5
IR6
3.5
23
12.5
3.5
IR7
32
32.5
13
IR8
2.5
23
12.5
2.5
IR9
3.5
23
13
3.5
IR10
43
42.5
43.5
ER11
3.5
14
1.5
3.5
2.5
IR12
33
33
3.5
3I¼
Internal
NR¼Risklevel
H¼Hum
anE¼External
P¼Perceptio
nF¼Su
pplier
I¼Im
pact
DE¼Stockandsystem
sAnalysis–A
Analysis–B
Realtable
Projectedtable
Realtable
Projectedtable
PI
∑Result
PI
∑H
FDE
∑Result
HF
DE
∑2
35
1,894
3,106
54
2.5
28.5
2,318
3,005
3,177
8.5
24
62,273
3,727
64
33
102,727
3,535
3,737
101
34
1,515
2,485
44
22
82,182
2,828
2,99
82
57
2,652
4,348
71.5
3.5
510
2,727
3,535
3,737
103
36
2,273
3,727
61
44
8.5
2,318
3,005
3,177
8.5
23
51,894
3,106
51
2.5
47
1,909
2,475
2,616
72
35
1,894
3,106
52.5
13
6.5
1,773
2,298
2,429
6.5
23
51,894
3,106
51
2.5
36
1,636
2,121
2,242
62
35
1,894
3,106
51
34
7.5
2,045
2,652
2,803
7.5
34
72,652
4,348
72.5
44
102,727
3,535
3,737
101
45
1,894
3,106
51.5
3.5
37.5
2,045
2,652
2,803
7.5
33
62,273
3,727
63
3.5
39.5
2,591
3,359
3,551
9.5
2541
6625
4166
2735
3799
2735
3799
0.998
0.982
Sou
rce:
Developed
bytheauthors
Table AIII.Qui-square test(Microsoft Excel)
334
REGE26,3