hyde park capital - technology m&a report (q2 '14)€¦ · 05/06/14 convertro, inc. aol,...
TRANSCRIPT

TechnologyM&AReport
Q22014
HYDEPARKCAPITAL
MemberFINRA/SIPC
InvestmentBanking|Mergers&Acquisitions| CapitalRaising
HydeParkCapitalAdvisors,LLC701N.FranklinStreetTampa,FL33602Tel:813‐383‐0202
www.hydeparkcapital.com
[email protected](813)383‐0205
[email protected](813)383‐0206
[email protected](813)383‐0208
[email protected](813)383‐0203
[email protected](813)597‐2649
[email protected](813)383‐0207
HYDEPARKCAPITALInvestmentBanking|Mergers&Acquisitions| CapitalRaising
OfferDate Issuer IndustrySectorTransaction
TypeTransaction
Value
05/21/14 ActivisionBlizzard,Inc. EnterpriseSoftware Secondary $852
04/16/14 SabreCorp. Informatics&DataServices IPO $627
06/05/14 CoStarGroup,Inc. Internet Secondary $480
05/08/14 DSTSystems,Inc. Informatics&DataServices Secondary $450
05/22/14 CDWCorp. TechnologyHardware Secondary $425
05/28/14 BoozAllenHamiltonHoldingCorp. ITServices Secondary $231
06/05/14 AristaNetworks,Inc. TechnologyHardware IPO $226
04/03/14 GrubHub,Inc. Internet IPO $193
04/03/14 OPOWER,Inc. Internet IPO $116
05/14/14 Zendesk,Inc. Software‐as‐a‐Service IPO $100
IndustrySector 3Months 12months Revenue EBITDAEnterpriseSoftware (2.5%) 26.1% 3.7x 12.5x
Software‐as‐a‐Service(SaaS) (3.8%) 32.4% 3.6x 17.2x
InfrastructureSoftware (4.1%) 12.6% 2.9x 12.3x
Informatics&DataServices 1.5% 14.6% 3.3x 12.4x
Internet 0.5% 38.5% 2.8x 16.5x
ITServices 0.0% 26.9% 2.1x 11.7x
TechnologyHardware 8.0% 28.7% 0.9x 8.6x
MedianChangeinStockPrice EnterpriseValue/LTM
90%
100%
110%
120%
130%
140%
Jun‐13 Sep‐13 Dec‐13 Mar‐14 Jun‐14
S&PGlobalInformationTechnologyIndex Nasdaq S&P500
($inmillions)
PublicMarketPerformance(LTM)
SelectTechnologyPublicOfferings(Q22014)
MarketPerformancebySector
Source:S&PCapitalIQ
2
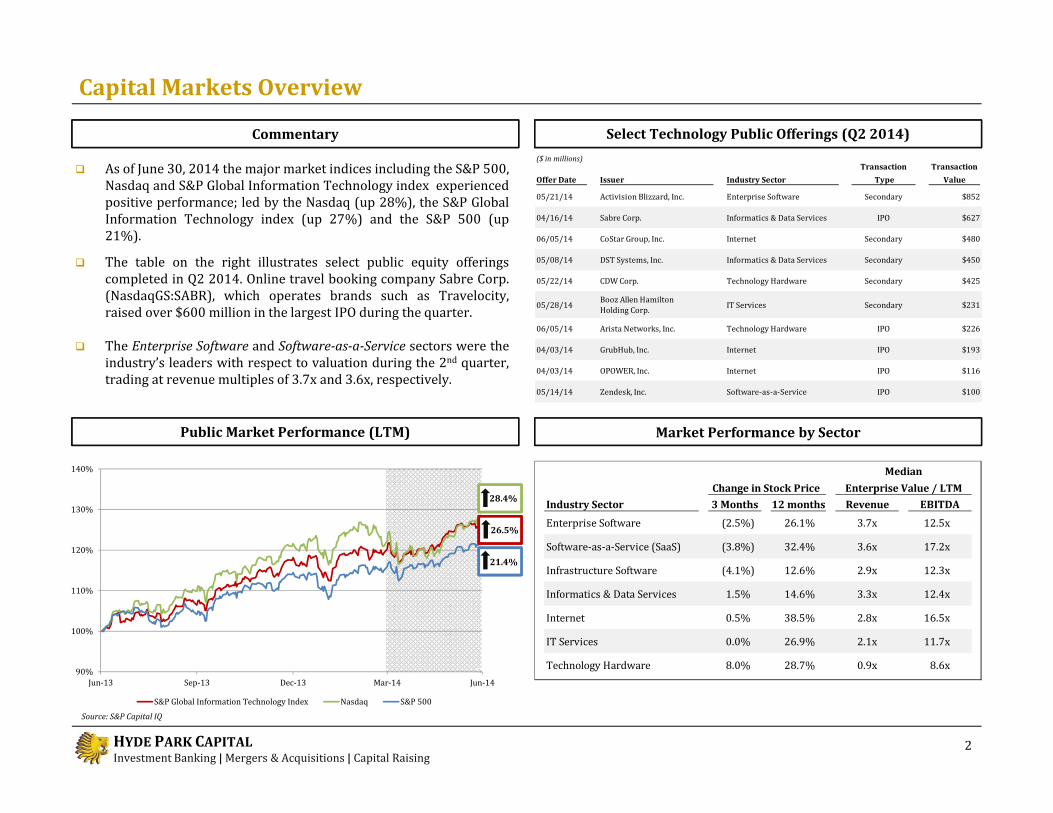
Capital MarketsOverview
As of June 30, 2014 the major market indices including the S&P 500,Nasdaq and S&P Global Information Technology index experiencedpositive performance; led by the Nasdaq (up 28%), the S&P GlobalInformation Technology index (up 27%) and the S&P 500 (up21%).
The table on the right illustrates select public equity offeringscompleted in Q2 2014. Online travel booking company Sabre Corp.(NasdaqGS:SABR), which operates brands such as Travelocity,raised over $600 million in the largest IPO during the quarter.
The Enterprise Software and Software‐as‐a‐Service sectors were theindustry’s leaders with respect to valuation during the 2nd quarter,trading at revenue multiples of 3.7x and 3.6x, respectively.
Commentary
21.4%
26.5%
28.4%

HYDEPARKCAPITALInvestmentBanking|Mergers&Acquisitions| CapitalRaising
MiddleMarketM&ATransactionsbyDealSize– Technology
U.S.MiddleMarketM&AActivity– AnnualTrends:VOLUME U.S.MiddleMarketM&AActivity– AnnualTrends:VALUE
AnnualMiddleMarketM&AActivity– Technology
3
As detailed in the table on the right, Middle Market M&A activityincreased across all segments of the Technology industry during 1H2014 compared to 1H 2013.
Overall U.S. Middle Market Technology deal volume increased 44%during 1H 2014 to 145 closed transactions, up from 101 dealsduring the prior year period.
The total value of completed Middle Market M&A transactions inthe Technology sector rose 87% to $20.0 billion. Transactionsvalued between $100 million and $499 million saw the largestincrease, accounting for 54% of the total deal value during theperiod, up from 44% during 1H 2013.
Commentary
Source:S&PCapitalIQ(middlemarketincludesallcloseddealswithdiscloseddealvaluebetween$10millionand$1billion)Lessthan$100M $100‐$499M $500‐$1,000MLessthan$100M $100‐$499M $500‐$1,000M
TotalTransactionVolume
TotalTransactionValue($inbillions)
($inbillions)
DealSize Volume Value Volume Value Volume ValueLessthan$100M 71 $2.0 92 $3.4 30% 74%$100‐$499M 25 $4.7 45 $10.8 80% 129%$500‐$1,000M 5 $4.0 8 $5.8 60% 43%TotalMiddleMarket 101 $10.7 145 $20.0 44% 87%
%ofTotalMarketLessthan$100M 70% 18% 63% 17%$100‐$499M 25% 44% 31% 54%$500‐$1,000M 5% 38% 6% 29%TotalMiddleMarket 100% 100% 100% 100%
1H2013 1H2014 %Change

HYDEPARKCAPITALInvestmentBanking|Mergers&Acquisitions| CapitalRaising
DealSize Volume Value Volume Value Volume ValueLessthan$100M 35 $1.0 45 $1.7 29% 74%$100‐$499M 13 $2.7 19 $5.1 46% 87%$500‐$1,000M 1 $1.0 3 $2.4 200% 148%TotalMiddleMarket 49 $4.7 67 $9.2 37% 97%
%ofTotalMarketLessthan$100M 71% 21% 67% 19%$100‐$499M 27% 58% 28% 55%$500‐$1,000M 2% 21% 5% 26%TotalMiddleMarket 100% 100% 100% 100%
Q22013 Q22014 %Change
QuarterlyMiddleMarketM&AActivity – Technology
U.S.MiddleMarketM&AActivity– QuarterlyTrends:VALUEU.S.MiddleMarketM&AActivity– QuarterlyTrends:VOLUME
MiddleMarketM&ATransactionsbyDealSize– Technology
($inbillions)
4
Commentary
The total volume of completed Middle Market Technology dealsincreased 37% during Q2 2014 to 67 transactions, up from 49during Q2 2013.
The total value of completed Middle Market Technologytransactions increased 97% during the quarter to $9.2 billion.
Although Middle Market Technology M&A activity increasedsignificantly compared with Q2 2013, deal volume and valueremain below historical levels seen during 2011 and 2012.
Source:S&PCapitalIQ(middlemarketincludesallcloseddealswithdiscloseddealvaluebetween$10millionand$1billion)
TotalTransactionVolume
TotalTransactionValue($inbillions)
Lessthan$100M $100‐$499M $500‐$1,000MLessthan$100M $100‐$499M $500‐$1,000M

HYDEPARKCAPITALInvestmentBanking|Mergers&Acquisitions| CapitalRaising
AnnouncedDate Target Buyer IndustryEnterpriseValue($mm)
EV/Revenue
EV/EBITDA
06/23/14 PLXTechnology,Inc. AvagoTechnologiesWireless(U.S.A.)Manufacturing,Inc. TechnologyHardware $293.6 2.8x 29.6x
06/23/14 MICROSSystems,Inc. OracleCorp. EnterpriseSoftware $4,604.1 3.4x 17.5x
06/20/14 Dropcam,Inc. NestLabs,Inc. Internet $555.0 NA NA
06/19/14 GeneralElectricCo.(SignallingBusiness) AlstomSA TechnologyHardware $825.0 1.7x NA
06/18/14 MeasurementSpecialties,Inc. TEConnectivityLtd. TechnologyHardware $1,449.1 3.5x 20.2x
06/17/14 Silevo,Inc. SolarCityCorp. TechnologyHardware $350.0 NA NA
06/17/14 InitialKoncepts,Inc. CleanTechInnovations,Inc. ITServices $213.4 23.2x NM
06/16/14 TWTelecom,Inc. Level3Communications,Inc. ITServices $7,369.9 4.6x 14.2x
06/16/14 Fusion‐io,Inc. SanDiskCorp. TechnologyHardware $1,050.4 2.7x NM
06/13/14 OpenTable,Inc. ThePricelineGroup,Inc. Internet $2,495.5 12.6x 41.5x
06/13/14 LimelightNetworks,Inc. TuitionBuild,Inc. Internet $548.1 3.2x NM
06/10/14 KonteraTechnologies,Inc. Amobee,Inc. Internet $150.0 NA NA
06/09/14 HittiteMicrowaveCorp. AnalogDevices,Inc. TechnologyHardware $1,954.7 7.1x 16.7x
06/09/14 AptinaImagingCorp. ONSemiconductorBeneluxB.V. TechnologyHardware $400.0 0.8x NA
06/09/14 SkyboxImaging,Inc. Google,Inc. TechnologyHardware $500.0 NA NA
06/02/14 RohrbackCosascoSystems,Inc. Halmaplc TechnologyHardware $108.0 2.4x NA
06/02/14 GeniaCorp. RocheMolecularSystems,Inc. TechnologyHardware $350.0 NA NA
06/02/14 iParadigms,LLC InsightVenturePartners SaaS $752.0 NA NA
05/29/14 LSICorp.(AcceleratedSolutions&FlashComponentsDivisions) SeagateTechnology TechnologyHardware $450.0 NA NA
05/27/14 Check,Inc. Intuit,Inc. EnterpriseSoftware $360.0 NA NA
RecentM&AActivity– Technology
SelectAnnouncedM&ATransactions(Q22014)
5
Source:S&PCapitalIQ.

HYDEPARKCAPITALInvestmentBanking|Mergers&Acquisitions| CapitalRaising
AnnouncedDate Target Buyer IndustryEnterpriseValue($mm)
EV/Revenue
EV/EBITDA
05/21/14 AMX,LLC HarmanProGroup TechnologyHardware $365.0 NA NA
05/20/14 AeroflexHoldingCorp. Cobhamplc TechnologyHardware $1,459.9 2.3x 11.9x
05/14/14 LiveRamp,Inc. AcxiomCorp. Internet $310.0 NA NA
05/13/14 Aicent,Inc. SyniverseTechnologies,LLC ITServices $290.0 NA NA
05/12/14 Peak10HoldingCorp. GIPartners Internet $730.0 NA NA
05/12/14 MercuryPaymentSystems,LLC NPCGroup,Inc. EnterpriseSoftware $1,650.0 7.0x 17.7x
05/06/14 ISGHoldings,Inc. XeroxCorp. EnterpriseSoftware $225.0 NA NA
05/06/14 Convertro,Inc. AOL,Inc. Internet $101.0 NA NA
05/02/14 Fullscreen,Inc. RelativityMedia,LLC Internet $1,000.0 NA NA
04/30/14 InktankStorage,Inc. RedHat,Inc. ITServices $175.0 NA NA
04/28/14 JaspersoftCorp. TIBCOSoftware,Inc. Internet $185.0 NA NA
04/27/14 IntegratedMemoryLogicLtd. ExarCorp. TechnologyHardware $93.4 1.5x 6.7x
04/22/14 Viewpoint,Inc. BainCapitalPrivateEquity EnterpriseSoftware $230.0* NA NA
04/21/14 Cbeyond,Inc. BirchCommunications,Inc. ITServices $324.4 0.7x 4.9x
04/21/14 JasperDesignAutomation,Inc. CadenceDesignSystems,Inc. InfrastructureSoftware $170.0 NA NA
04/15/14 MotorolaSolutions,Inc.(EnterpriseBusiness) ZebraTechnologiesCorp. TechnologyHardware $3,450.0 NA 10.9x
04/11/14 ZygoCorp. Ametek,Inc. TechnologyHardware $288.8 1.7x 10.7x
04/07/14 Vocus,Inc. GTCR,LLC SaaS $441.7 2.4x NM
04/02/14 SolidConcepts,Inc. StratasysLtd. TechnologyHardware $295.0 4.5x NA
RecentM&AActivity– Technology
SelectAnnouncedM&ATransactions(Q22014)
6
Source:S&PCapitalIQ.

HYDEPARKCAPITALInvestmentBanking|Mergers&Acquisitions| CapitalRaising
($inmillions) PercentSought 100.00%LTM
IncomeStatement 5/2/14 PurchasePrice(Equity) $2,479.0
Revenue $198.3 TotalRights/Warrants/Options $134.2
EBITDA $60.2 NetAssumedLiabilities ($117.6)
NetIncome $22.6 ImpliedEnterpriseValue $2,495.5
AsofBalanceSheet 5/2/14 ImpliedPurchaseMultiples
Cash $117.6 Revenue 12.6x
Debt $0.0 EBITDA 41.5x
NetDebt ($117.6) NetIncome 109.7x
FinancialProfile TransactionAnalysis
($inmillions) PercentSought 100.00%LTM
IncomeStatement 5/1/14 PurchasePrice(Equity) $5,080.8
Revenue $1,337.9 TotalRights/Warrants/Options $181.7
EBITDA $262.4 NetAssumedLiabilities ($658.4)
NetIncome $168.0 ImpliedEnterpriseValue $4,604.1
AsofBalanceSheet 5/1/14 ImpliedPurchaseMultiples
Cash $658.4 Revenue 3.4x
Debt $0.0 EBITDA 17.5x
NetDebt ($658.4) NetIncome 30.2x
FinancialProfile TransactionAnalysis MICROS Systems, Inc. (NasdaqGS:MCRS) designs, manufactures,markets, and services enterprise applications solutions for the foodand beverage, hotel, and retail industries.
On June 22, 2014 MICROS announced that it had signed a definitiveagreement to be acquired by Oracle Corp. (NYSE:ORCL) in atransaction valued at approximately $5 billion.
Under the terms of the agreement, Oracle will pay $68.00 in cashfor all the outstanding shares of MICROS, a 29% premium overMICROS’ closing share price one month prior to the announcement.
Oracle has said it plans to combine MICROS’ industry specificapplications with its own business applications, technologies andcloud portfolio.
RecentM&ATransactionsProfiled– Technology
TransactionDetailsOpenTable,Inc.(NasdaqGS:OPEN)
TransactionDetails
7
MICROSSystems,Inc.(NasdaqGS:MCRS)
OpenTable, Inc. (NasdaqGS:OPEN) provides restaurant reservationsolutions in the United States, Canada, Germany, Japan, Mexico, andthe United Kingdom.
On June 12, 2014 OpenTable announced that it had signed adefinitive agreement to be acquired by The Priceline Group, Inc.(NasdaqGS:PCLN) in a transaction valued at nearly $2.5 billion.
Under the terms of the agreement, Priceline will pay $103.00 incash for all the outstanding shares of OpenTable. The purchaseprice represents a 46% premium over OpenTable’s closing shareprice one day prior to the announcement.
Priceline operates as an online travel company and provides onlinehotel reservation services for more than 400,000 properties.

HYDEPARKCAPITALInvestmentBanking|Mergers&Acquisitions| CapitalRaising
17
7
23
20
20
2
13
14
0 5 10 15 20 25
TechnologyHardware
ITServices
Internet
Software*
$2.4
$0.6
$2.4
$3.8
$3.1
$0.3
$0.5
$0.8
$0.0 $0.5 $1.0 $1.5 $2.0 $2.5 $3.0 $3.5 $4.0
TechnologyHardware
ITServices
Internet
Software*
Q22013 Q22014
M&AActivitybyTechnologySector
%Change
%Change
U.S.MiddleMarketM&AActivitybyTechnologySector:VALUE
8
Source:S&PCapitalIQ(includesallcloseddealswithdiscloseddealvaluebetween$10millionand$1billion).*IncludesEnterpriseSoftwareandInfrastructureSoftwareindustrysectors.
U.S.MiddleMarketM&AActivitybyTechnologySector:VOLUME
364%
364%
21%
($inmillions)
43%
77%
15%
250%
123%
Q22013 Q22014

HYDEPARKCAPITALInvestmentBanking|Mergers&Acquisitions| CapitalRaising
0
3
6
9
12
15
Informatics&DataServices
EnterpriseSoftware
Internet ITServices TechnologyHardware
SaaS
AnnouncedDate Target Buyer Industry
EnterpriseValue
06/14/14 ClaritySolutionGroup,Inc. Riordan,Lewis&Haden ITServices NA
06/10/14 CequelDataCenters,LLCTheStephensGroup/TheJordanCo./ThompsonStreetCapitalPartners
TechnologyHardware NA
06/09/14 AutotaskCorp. VistaEquityPartners SaaS NA
06/02/14 iParadigms,LLC InsightVenturePartners/GICSpecialInvestmentsLtd. SaaS $752
06/02/14 InternetBrands,Inc. KohlbergKravisRoberts&Co. Internet NA
05/14/14 ConvergeOne,LLC ClearlakeCapitalGroup,LLC ITServices NA
05/12/14 Peak10HoldingCorp. GIPartners ITServices $730
05/09/14 DealerSocket,Inc. VistaEquityPartners SaaS NA
05/02/14 iSystems,LLC SilverOakServicesPartners,LLC EnterpriseSoftware NA
05/02/14 AdvancedEstimatingSystems,Inc.
NancyCreekCapital/KTCapital EnterpriseSoftware NA
04/24/14 PayScale,Inc. WarburgPincus,LLC Internet $100
04/22/14 Viewpoint,Inc. BainCapitalPrivateEquity EnterpriseSoftware $230
04/14/14 IpreoHoldings,LLCGoldmanSachsGroup,MerchantBankingDivision/TheBlackstoneGroupL.P.
EnterpriseSoftware NA
04/07/14 Vocus,Inc. GTCR,LLC SaaS $442
04/02/14 LogiStarSolutions,LLC Ernst&Young,LLP(InvestmentArm) ITServices NA
04/01/14 AutoAlert,Inc. HGGC,LLC EnterpriseSoftware NA
SelectPrivateEquityTransactions(Q22014)
FinancialSponsorsIndustryTransactions
Private EquityActivity– TechnologyNum
berofTransactions
9
($inmillions)
As detailed in the chart to the right, financial sponsors announceda number of transactions in the Technology industry during Q22014.
Several notable private equity backed transactions wereannounced during Q2 2014, including: Insight Venture Partnersannounced acquisition of iParadigms, LLC for $750 million; GIPartners’ purchase of Peak 10 Holdings Corp. for $730 million; andGTCR, LLC’s acquisition of Vocus, Inc. for nearly $450 million.
During Q2 2014, financial sponsors were very active in theEnterprise Software and Internet sectors, announcing 11 and 9transactions, respectively.
Commentary
Source:S&PCapitalIQ.

HYDEPARKCAPITALInvestmentBanking|Mergers&Acquisitions| CapitalRaising
90%
100%
110%
120%
130%
140%
Jun‐13 Sep‐13 Dec‐13 Mar‐14 Jun‐14
EnterpriseSoftware S&P500
90%
100%
110%
120%
130%
140%
150%
160%
Jun‐13 Sep‐13 Dec‐13 Mar‐14 Jun‐14
Software‐as‐a‐Service(SaaS) S&P500
90%
100%
110%
120%
130%
140%
Jun‐13 Sep‐13 Dec‐13 Mar‐14 Jun‐14
InfrastructureSoftware S&P500
IndustrySectorOverview– RecentStockPricePerformance
Software‐as‐a‐Service(SaaS)
Commentary
10
EnterpriseSoftware
InfrastructureSoftware
Source:S&PCapitalIQ
The charts included on the following pages detail the recent stockprice performance by sector for the leading public companieswithin the Technology industry for the 12‐month period endedJune 30, 2014. The shaded section represents Q2 2014.
During the 12‐month period ending June 30, 2014, all of the sectorindices of the Technology industry increased led by the Internetand Software‐as‐a‐Service sectors, which increased 39% and 32%,respectively.
During the 2nd quarter of 2014, only four of the seven industrysectors delivered positive returns, led by the Technology Hardware(up 8%) and Informatics & Data Services (up 2%) sectors.
21.4%
32.4% 21.4%
12.6%
21.4%
26.1%

HYDEPARKCAPITALInvestmentBanking|Mergers&Acquisitions| CapitalRaising
90%
100%
110%
120%
130%
140%
Jun‐13 Sep‐13 Dec‐13 Mar‐14 Jun‐14
Informatics&DataServices S&P500
90%
100%
110%
120%
130%
140%
150%
160%
Jun‐13 Sep‐13 Dec‐13 Mar‐14 Jun‐14
Internet S&P500
90%
100%
110%
120%
130%
140%
Jun‐13 Sep‐13 Dec‐13 Mar‐14 Jun‐14
ITServices S&P500
90%
100%
110%
120%
130%
140%
Jun‐13 Sep‐13 Dec‐13 Mar‐14 Jun‐14
TechnologyHardware S&P500
IndustrySectorOverview– RecentStockPricePerformance
ITServices
Informatics&DataServices
11
Internet
TechnologyHardware
Source:S&PCapitalIQ
14.6%
21.4%
26.9%
21.4% 21.4%
28.7%
21.4%
38.5%

HYDEPARKCAPITALInvestmentBanking|Mergers&Acquisitions| CapitalRaising
ClosingPrice %of52 Equity EnterpriseCompany Ticker 6/30/14 WeekHigh Value Value Revenue GrossProfit EBITDA GrossProfit EBITDA Revenue EBITDAOracleCorp. ORCL $40.53 93.8% $186,600 $172,517 $38,275 $31,039 $16,717 81.1% 43.7% 4.5x 10.3xSAPAG DB:SAP $77.55 89.9% $92,756 $94,264 $23,275 $16,847 $8,032 72.4% 34.5% 4.1x 11.7xSalesforce.com CRM $58.08 86.7% $35,060 $36,474 $4,405 $3,353 ($33) 76.1% (0.7%) 8.3x* NMAmdocs,Ltd. DOX $46.33 94.6% $7,519 $6,344 $3,509 $1,237 $643 35.3% 18.3% 1.8x 9.9xNetSuite,Inc. N $86.88 71.9% $6,529 $6,320 $477 $324 ($39) 68.0% (8.1%) 13.3x* NMPegasystems,Inc. PEGA $21.12 82.0% $1,658 $1,441 $559 $384 $80 68.8% 14.4% 2.6x 17.9xCSGSystemsInternational,Inc. CSGS $26.11 81.3% $875 $946 $753 $365 $121 48.5% 16.0% 1.3x 7.8x
Average 85.7% $47,285 $45,472 $10,179 $7,650 $3,646 64.3% 16.9% 2.8x 11.5x
Median 86.7% $7,519 $6,344 $3,509 $1,237 $121 68.8% 16.0% 2.6x 10.3x
EnterpriseValue/LTM LTMMargins LTM
ClosingPrice %of52 Equity EnterpriseCompany Ticker 6/30/14 WeekHigh Value Value Revenue GrossProfit EBITDA GrossProfit EBITDA Revenue EBITDAManhattanAssociates,Inc. MANH $34.43 84.4% $2,649 $2,548 $451 $257 $124 57.0% 27.4% 5.6x 20.6xSPSCommerce,Inc. SPSC $63.19 79.0% $1,042 $906 $115 $79 $11 69.0% 9.7% 7.9x 80.9x*SciQuest,Inc. SQI $17.69 54.1% $434 $319 $99 $69 $3 69.9% 2.9% 3.2x 110.3x*
Average 72.5% $1,375 $1,257 $222 $135 $46 65.3% 13.4% 5.6x 20.6x
Median 79.0% $1,042 $906 $115 $79 $11 69.0% 9.7% 5.6x 20.6x
EnterpriseValue/LTM LTMMargins LTM
ClosingPrice %of52 Equity EnterpriseCompany Ticker 6/30/14 WeekHigh Value Value Revenue GrossProfit EBITDA GrossProfit EBITDA Revenue EBITDAOracleCorp. ORCL $40.53 93.8% $186,600 $172,517 $38,275 $31,039 $16,717 81.1% 43.7% 4.5x 10.3xSAPAG DB:SAP $77.55 89.9% $92,756 $94,264 $23,275 $16,847 $8,032 72.4% 34.5% 4.1x 11.7xSageGroupplc LSE:SGE $6.57 87.3% $7,531 $8,133 $2,208 $2,081 $651 94.3% 29.5% 3.7x 12.5xNetSuite,Inc. N $86.88 71.9% $6,529 $6,320 $477 $324 ($39) 68.0% (8.1%) 13.3x* NMExactHoldingNV ENXTAM:EXACT $35.59 91.3% $814 $743 $294 $109 $57 37.0% 19.4% 2.5x 13.0x
Average 86.9% $58,846 $56,395 $12,906 $10,080 $5,084 70.6% 23.8% 3.7x 11.9x
Median 89.9% $7,531 $8,133 $2,208 $2,081 $651 72.4% 29.5% 3.9x 12.1x
EnterpriseValue/LTM LTMMargins LTM
IndustrySectorOverview– PublicCompanyAnalysis
EnterpriseResourcePlanning
($inmillions,exceptpershare)
12
Source:S&PCapitalIQ*Excludedfromaverageandmediancalculation.
Supply/DemandChainManagement
CustomerRelationshipManagement
EnterpriseSoftware

HYDEPARKCAPITALInvestmentBanking|Mergers&Acquisitions| CapitalRaising
ClosingPrice %of52 Equity EnterpriseCompany Ticker 6/30/14 WeekHigh Value Value Revenue GrossProfit EBITDA GrossProfit EBITDA Revenue EBITDATeradataCorp. TDC $40.20 60.9% $6,545 $5,836 $2,739 $1,493 $635 54.5% 23.2% 2.1x 9.2xTIBCOSoftware,Inc. TIBX $20.17 74.3% $3,373 $3,341 $1,091 $775 $196 71.0% 18.0% 3.1x 17.0xInformaticaCorp. INFA $35.65 81.4% $3,979 $3,293 $1,005 $834 $184 83.0% 18.4% 3.3x 17.9xQlikTechnologies,Inc. QLIK $22.62 60.2% $2,013 $1,758 $509 $439 $8 86.3% 1.7% 3.5x 207.9x*MicroStrategy,Inc. MSTR $140.62 96.2% $1,589 $1,222 $588 $453 $30 77.1% 5.1% 2.1x 40.8x*
Average 74.6% $3,500 $3,090 $1,186 $799 $211 74.4% 13.3% 2.8x 14.7x
Median 74.3% $3,373 $3,293 $1,005 $775 $184 77.1% 18.0% 3.1x 17.0x
EnterpriseValue/LTM LTMMargins LTM
ClosingPrice %of52 Equity EnterpriseCompany Ticker 6/30/14 WeekHigh Value Value Revenue GrossProfit EBITDA GrossProfit EBITDA Revenue EBITDAAdobeSystems,Inc. ADBE $72.36 96.9% $37,035 $35,212 $4,105 $3,507 $748 85.4% 18.2% 8.6x* 47.1x*OpenTextCorp. OTEX $47.94 90.7% $5,780 $6,672 $1,625 $1,183 $518 72.8% 31.9% 4.1x 12.9xSynchronossTechnologies,Inc. SNCR $34.96 89.0% $1,425 $1,354 $389 $229 $100 58.9% 25.7% 3.5x 13.5xLogMeIn,Inc. LOGM $46.62 97.8% $1,145 $924 $192 $169 $18 88.0% 9.4% 4.8x 51.3x*
Average 93.6% $11,346 $11,040 $1,578 $1,272 $346 76.3% 21.3% 4.1x 13.2x
Median 93.8% $3,603 $4,013 $1,007 $706 $309 79.1% 22.0% 4.1x 13.2x
EnterpriseValue/LTM LTMMargins LTM
ClosingPrice %of52 Equity EnterpriseCompany Ticker 6/30/14 WeekHigh Value Value Revenue GrossProfit EBITDA GrossProfit EBITDA Revenue EBITDAConcurTechnologies,Inc. CNQR $93.34 71.6% $5,263 $5,121 $668 $417 $22 62.5% 3.3% 7.7x 230.9x*TheUltimateSoftwareGroup,Inc. ULTI $138.17 80.4% $4,041 $3,960 $458 $273 $66 59.6% 14.5% 8.6x 59.6x*CornerstoneOnDemand,Inc. CSOD $46.02 74.4% $2,411 $2,392 $222 $158 ($37) 71.2% (16.6%) 10.8x NM
Average 75.4% $3,905 $3,824 $449 $283 $17 64.4% 0.4% 9.0x NM
Median 74.4% $4,041 $3,960 $458 $273 $22 62.5% 3.3% 8.6x NM
EnterpriseValue/LTM LTMMargins LTM
IndustrySectorOverview– PublicCompanyAnalysis
HumanCapitalManagement
($inmillions,exceptpershare)
13
EnterpriseSoftware
ContentManagement
BusinessIntelligence/Analytics
Source:S&PCapitalIQ*Excludedfromaverageandmediancalculation.

HYDEPARKCAPITALInvestmentBanking|Mergers&Acquisitions| CapitalRaising
ClosingPrice %of52 Equity EnterpriseCompany Ticker 6/30/14 WeekHigh Value Value Revenue GrossProfit EBITDA GrossProfit EBITDA Revenue EBITDASalesforce.com CRM $58.08 86.7% $35,060 $36,474 $4,405 $3,353 ($33) 76.1% (0.7%) 8.3x NMNetSuite,Inc. N $86.88 71.9% $6,529 $6,320 $477 $324 ($39) 68.0% (8.1%) 13.3x* NMathenahealth,Inc. ATHN $125.13 60.5% $4,854 $4,962 $672 $399 $61 59.4% 9.1% 7.4x 80.9x*TheUltimateSoftwareGroup,Inc. ULTI $138.17 80.4% $4,041 $3,960 $458 $273 $66 59.6% 14.5% 8.6x 59.6x*CornerstoneOnDemand,Inc. CSOD $46.02 74.4% $2,411 $2,392 $222 $158 ($37) 71.2% (16.6%) 10.8x* NMDemandware,Inc. DWRE $69.37 84.4% $2,291 $2,035 $128 $94 ($18) 73.6% (13.7%) 15.9x* NMCompuwareCorp. CPWR $9.99 85.2% $2,219 $1,959 $714 $484 $86 67.7% 12.0% 2.7x 22.9xBlackbaud,Inc. BLKB $35.74 84.6% $1,631 $1,779 $530 $279 $104 52.7% 19.6% 3.4x 17.2xSynchronossTechnologies,Inc. SNCR $34.96 89.0% $1,425 $1,354 $389 $229 $100 58.9% 25.7% 3.5x 13.5xExactTarget,Inc. ET $16.36 92.3% $1,219 $1,130 $297 $170 $79 57.2% 26.8% 3.8x 14.2xLogMeIn,Inc. LOGM $46.62 97.8% $1,145 $924 $192 $169 $18 88.0% 9.4% 4.8x 51.3x*SPSCommerce,Inc. SPSC $63.19 79.0% $1,042 $906 $115 $79 $11 69.0% 9.7% 7.9x 80.9x*ConstantContact,Inc. CTCT $32.11 97.6% $1,037 $897 $307 $222 $34 72.3% 11.0% 2.9x 26.5xBazaarvoice,Inc. BV $7.89 68.6% $596 $551 $168 $115 ($30) 68.5% (17.7%) 3.3x NMSciQuest,Inc. SQI $17.69 54.1% $434 $319 $99 $69 $3 69.9% 2.9% 3.2x 110.3x*
Average 80.4% $4,396 $4,397 $612 $428 $27 67.5% 5.6% 5.0x 18.9x
Median 84.4% $1,631 $1,779 $307 $222 $18 68.5% 9.4% 3.6x 17.2x
EnterpriseValue/LTM LTMMargins LTM
IndustrySectorOverview– PublicCompanyAnalysis
14
Software‐as‐a‐Service(SaaS)($inmillions,exceptpershare)
Source:S&PCapitalIQ*Excludedfromaverageandmediancalculation.

HYDEPARKCAPITALInvestmentBanking|Mergers&Acquisitions| CapitalRaising
ClosingPrice %of52 Equity EnterpriseCompany Ticker 6/30/14 WeekHigh Value Value Revenue GrossProfit EBITDA GrossProfit EBITDA Revenue EBITDAEMCCorp. EMC $26.34 93.2% $55,433 $54,813 $23,580 $14,667 $5,453 62.2% 23.1% 2.3x 10.1xIronMountain,Inc. IRM $35.45 98.5% $6,838 $11,056 $3,082 $1,768 $897 57.4% 29.1% 3.6x 12.3xNetApp,Inc. NTAP $36.52 79.5% $12,705 $8,698 $6,325 $3,919 $1,025 62.0% 16.2% 1.4x 8.5xTeradataCorp. TDC $40.20 60.9% $6,545 $5,836 $2,739 $1,493 $635 54.5% 23.2% 2.1x 9.2xCommVaultSystems,Inc. CVLT $49.17 54.6% $2,424 $2,025 $605 $527 $104 87.2% 17.1% 3.3x 19.5x
Average 77.3% $16,789 $16,485 $7,266 $4,475 $1,623 64.6% 21.8% 2.6x 11.9x
Median 79.5% $6,838 $8,698 $3,082 $1,768 $897 62.0% 23.1% 2.3x 10.1x
EnterpriseValue/LTM LTMMargins LTM
ClosingPrice %of52 Equity EnterpriseCompany Ticker 6/30/14 WeekHigh Value Value Revenue GrossProfit EBITDA GrossProfit EBITDA Revenue EBITDAVMware,Inc. VMW $96.81 85.8% $42,047 $36,910 $5,589 $4,795 $1,454 85.8% 26.0% 6.6x* 25.4xCitrixSystems,Inc. CTXS $62.55 81.1% $11,446 $11,903 $3,048 $2,605 $725 85.5% 23.8% 3.9x 16.4xCATechnologies CA $28.74 79.4% $12,804 $11,453 $4,489 $3,836 $1,425 85.5% 31.7% 2.6x 8.0xRedHat,Inc. RHT $55.27 89.9% $10,593 $9,790 $1,595 $1,354 $306 84.9% 19.2% 6.1x* 32.0x*TIBCOSoftware,Inc. TIBX $20.17 74.3% $3,373 $3,341 $1,091 $775 $196 71.0% 18.0% 3.1x 17.0xSolarWinds,Inc. SWI $38.66 82.3% $2,949 $2,787 $382 $345 $134 90.3% 35.2% 7.3x* 20.7xCompuwareCorp. CPWR $9.99 85.2% $2,219 $1,959 $714 $484 $86 67.7% 12.0% 2.7x 22.9xPegasystems,Inc. PEGA $21.12 82.0% $1,658 $1,441 $559 $384 $80 68.8% 14.4% 2.6x 17.9xProgressSoftwareCorp. PRGS $24.04 89.2% $1,267 $1,041 $324 $294 $95 90.8% 29.3% 3.2x 11.0x
Average 83.2% $9,817 $8,958 $1,977 $1,652 $500 81.1% 23.3% 3.0x 17.4x
Median 82.3% $3,373 $3,341 $1,091 $775 $196 85.5% 23.8% 2.9x 17.5x
EnterpriseValue/LTM LTMMargins LTM
IndustrySectorOverview– PublicCompanyAnalysis
EnterpriseITManagement
($inmillions,exceptpershare)
15
DataStorage
InfrastructureSoftware
Source:S&PCapitalIQ*Excludedfromaverageandmediancalculation.

HYDEPARKCAPITALInvestmentBanking|Mergers&Acquisitions| CapitalRaising
ClosingPrice %of52 Equity EnterpriseCompany Ticker 6/30/14 WeekHigh Value Value Revenue GrossProfit EBITDA GrossProfit EBITDA Revenue EBITDASymantecCorp. SYMC $22.90 84.5% $16,064 $14,110 $6,702 $5,596 $1,941 83.5% 29.0% 2.1x 7.3xCheckPointSoftwareTechnologies,Ltd. CHKP $67.03 95.9% $13,147 $11,914 $1,436 $1,270 $786 88.4% 54.7% 8.3x* 15.2xVeriSign,Inc. VRSN $48.81 77.5% $7,235 $7,058 $988 $801 $608 81.1% 61.5% 7.1x* 11.6xFortinet,Inc. FTNT $25.13 100.0% $4,226 $3,668 $685 $482 $87 70.3% 12.7% 5.4x 42.0x*TrendMicro,Inc. TSE:4704 $32.93 79.8% $4,444 $3,471 $1,069 $885 $371 82.8% 34.7% 3.2x 9.4x
Average 87.5% $9,023 $8,044 $2,176 $1,807 $759 81.2% 38.5% 3.6x 10.8x
Median 84.5% $7,235 $7,058 $1,069 $885 $608 82.8% 34.7% 3.2x 10.5x
EnterpriseValue/LTM LTMMargins LTM
IndustrySectorOverview– PublicCompanyAnalysis
Security
($inmillions,exceptpershare)
16
InfrastructureSoftware
Source:S&PCapitalIQ*Excludedfromaverageandmediancalculation.

HYDEPARKCAPITALInvestmentBanking|Mergers&Acquisitions| CapitalRaising
ClosingPrice %of52 Equity EnterpriseCompany Ticker 6/30/14 WeekHigh Value Value Revenue GrossProfit EBITDA GrossProfit EBITDA Revenue EBITDAThomsonReutersCorp. TSX:TRI $36.42 92.3% $30,010 $37,830 $12,653 $3,361 $2,538 26.6% 20.1% 3.0x 14.9xExperianplc LSE:EXPN $16.90 77.5% $16,781 $20,767 $4,840 $2,187 $1,677 45.2% 34.6% 4.3x 12.4xMoody'sCorp. MCO $87.66 98.4% $19,171 $19,668 $3,125 $2,263 $1,450 72.4% 46.4% 6.3x 13.6xWoltersKluwerNV ENXTAM:WKL $29.60 96.8% $8,865 $11,933 $4,845 $3,286 $1,195 67.8% 24.7% 2.5x 10.0xIHS,Inc. IHS $135.67 97.2% $9,295 $10,942 $2,132 $1,279 $463 60.0% 21.7% 5.1x 23.6x*Equifax,Inc. EFX $72.54 98.8% $9,009 $10,508 $2,349 $1,536 $837 65.4% 35.6% 4.5x 12.6xGartner,Inc. IT $70.52 93.3% $6,567 $6,629 $1,898 $1,152 $326 60.7% 17.2% 3.5x 20.3x*Informaplc LSE:INF $8.19 83.0% $4,937 $6,300 $1,946 $779 $589 40.0% 30.3% 3.2x 10.7xDun&BradstreetCorp. DNB $110.20 88.5% $4,182 $5,471 $1,663 $1,139 $495 68.5% 29.8% 3.3x 11.1xFactSetResearchSystems,Inc. FDS $120.28 99.9% $5,222 $5,088 $901 $561 $331 62.3% 36.7% 5.6x 15.4xCoreLogic,Inc. CLGX $30.36 83.9% $2,874 $4,196 $1,311 $617 $237 47.1% 18.0% 3.2x 17.7xUBMplc LSE:UBM $11.38 87.7% $2,814 $3,663 $1,305 $352 $328 27.0% 25.1% 2.8x 11.2xMorningstar,Inc. MORN $71.81 83.5% $3,277 $3,058 $725 $422 $218 58.3% 30.1% 4.2x 14.0xFairIsaacCorp. FICO $63.76 99.8% $2,270 $2,707 $758 $523 $197 69.0% 26.0% 3.6x 13.7xIpsosSA ENXTPA:IPS $37.52 78.9% $1,742 $2,508 $2,279 $1,467 $267 64.4% 11.7% 1.1x 9.4xNeuStar,Inc. NSR $26.02 45.4% $1,645 $2,193 $933 $700 $350 75.1% 37.6% 2.4x 6.3xAcxiomCorp. ACXM $21.69 55.2% $1,637 $1,555 $1,083 $257 $181 23.8% 16.7% 1.4x 8.6xForresterResearch,Inc. FORR $37.88 91.6% $757 $624 $303 $181 $30 59.7% 9.8% 2.1x 21.1x*
Average 86.2% $7,281 $8,647 $2,503 $1,226 $650 55.2% 26.2% 3.4x 12.1x
Median 90.0% $4,560 $5,279 $1,780 $959 $340 60.3% 25.6% 3.3x 12.4x
EnterpriseValue/LTM LTMMargins LTM
IndustrySectorOverview– PublicCompanyAnalysis
17
Informatics&DataServices($inmillions,exceptpershare)
Source:S&PCapitalIQ*Excludedfromaverageandmediancalculation.

HYDEPARKCAPITALInvestmentBanking|Mergers&Acquisitions| CapitalRaising
ClosingPrice %of52 Equity EnterpriseCompany Ticker 6/30/14 WeekHigh Value Value Revenue GrossProfit EBITDA GrossProfit EBITDA Revenue EBITDAAmazon.com,Inc. AMZN $324.78 79.6% $150,536 $145,669 $81,759 $23,135 $4,018 28.3% 4.9% 1.8x 36.3x*eBay,Inc. EBAY $50.06 83.9% $64,102 $62,054 $17,050 $11,634 $4,972 68.2% 29.2% 3.6x 12.5xpriceline.com,Inc. PCLN $1,203.00 87.2% $63,818 $58,460 $7,576 $6,626 $2,894 87.5% 38.2% 7.7x* 20.2xNetflix,Inc. NFLX $440.60 96.2% $27,041 $26,226 $4,892 $1,522 $416 31.1% 8.5% 5.4x* 63.0x*Expedia,Inc. EXPE $78.76 96.3% $10,931 $10,413 $5,249 $4,129 $734 78.7% 14.0% 2.0x 14.2xVistaprintN.V. VPRT $40.46 69.5% $1,385 $1,786 $1,270 $819 $158 64.5% 12.5% 1.4x 11.3xShutterfly,Inc. SFLY $43.06 71.9% $1,645 $1,616 $830 $434 $82 52.3% 9.9% 1.9x 19.7xBlueNile,Inc. NILE $28.00 57.0% $355 $317 $455 $85 $16 18.7% 3.6% 0.7x 19.4x
Average 80.2% $39,977 $38,318 $14,885 $6,048 $1,661 53.7% 15.1% 1.9x 16.2x
Median 81.7% $18,986 $18,320 $5,070 $2,825 $575 58.4% 11.2% 1.9x 16.8x
EnterpriseValue/LTM LTMMargins LTM
ClosingPrice %of52 Equity EnterpriseCompany Ticker 6/30/14 WeekHigh Value Value Revenue GrossProfit EBITDA GrossProfit EBITDA Revenue EBITDAAkamaiTechnologies,Inc. AKAM $61.06 96.7% $11,099 $10,937 $1,761 $1,206 $618 68.5% 35.1% 6.2x 17.7xRoviCorp. ROVI $23.96 94.6% $2,271 $2,987 $556 $455 $195 81.9% 35.1% 5.4x 15.3xDigitalRiver,Inc. DRIV $15.43 76.0% $476 $219 $374 $247 $34 66.0% 9.2% 0.6x 6.4x
Average 89.1% $4,615 $4,715 $897 $636 $282 72.2% 26.4% 4.1x 13.1x
Median 94.6% $2,271 $2,987 $556 $455 $195 68.5% 35.1% 5.4x 15.3x
EnterpriseValue/LTM LTMMargins LTM
ClosingPrice %of52 Equity EnterpriseCompany Ticker 6/30/14 WeekHigh Value Value Revenue GrossProfit EBITDA GrossProfit EBITDA Revenue EBITDAGoogle,Inc. GOOG $575.28 95.1% $392,928 $342,940 $65,142 $37,574 $19,424 57.7% 29.8% 5.3x 17.7xFacebook,Inc. FB $67.29 92.7% $173,070 $159,440 $10,013 $8,103 $5,425 80.9% 54.2% 15.9x* 29.4xYahoo!,Inc. YHOO $35.13 84.2% $36,242 $34,714 $4,622 $3,310 $773 71.6% 16.7% 7.5x 44.9x*Twitter,Inc. TWTR $40.97 54.8% $17,144 $15,249 $974 $613 ($711) 63.0% (73.1%) 15.7x* NMScrippsNetworksInteractive,Inc. SNI $81.14 93.7% $11,895 $13,455 $2,623 $1,885 $1,125 71.9% 42.9% 5.1x 12.0xIAC/InterActiveCorp. IACI $69.23 85.9% $6,040 $6,077 $2,978 $2,086 $511 70.1% 17.2% 2.0x 11.9xYelp,Inc. YELP $76.68 75.4% $5,314 $4,964 $297 $277 $6 93.2% 2.2% 16.7x* NMWebMDHealthCorp. WBMD $48.30 94.0% $2,253 $2,424 $551 $333 $99 60.4% 18.0% 4.4x 24.5x
Average 84.5% $80,611 $72,408 $10,900 $6,773 $3,331 71.1% 13.5% 4.9x 19.1x
Median 89.3% $14,520 $14,352 $2,801 $1,986 $642 70.8% 17.6% 5.1x 17.7x
EnterpriseValue/LTM LTMMargins LTM
IndustrySectorOverview– PublicCompanyAnalysis
OnlineContentandSearch
($inmillions,exceptpershare)
18
Software&Services
e‐Commerce
Internet
Source:S&PCapitalIQ*Excludedfromaverageandmediancalculation.

HYDEPARKCAPITALInvestmentBanking|Mergers&Acquisitions| CapitalRaising
ClosingPrice %of52 Equity EnterpriseCompany Ticker 6/30/14 WeekHigh Value Value Revenue GrossProfit EBITDA GrossProfit EBITDA Revenue EBITDAFidelityNationalInformationServices,Inc. FIS $54.74 96.6% $15,987 $20,299 $6,200 $2,031 $1,594 32.8% 25.7% 3.3x 12.7xFiserv,Inc. FISV $60.32 96.9% $15,647 $19,166 $4,951 $2,143 $1,453 43.3% 29.3% 3.9x 13.2xTotalSystemServices,Inc. TSS $31.41 93.9% $5,919 $7,159 $2,417 $747 $546 30.9% 22.6% 3.0x 13.1xGlobalPayments,Inc. GPN $72.85 98.7% $5,295 $6,683 $2,554 $1,602 $521 62.7% 20.4% 2.6x 12.8xBroadridgeFinancialSolutions,Inc. BR $41.64 98.4% $5,168 $5,344 $2,558 $797 $521 31.1% 20.4% 2.1x 10.3xJackHenry&Associates,Inc. JKHY $59.43 98.5% $5,108 $5,072 $1,197 $510 $408 42.6% 34.1% 4.2x 12.4xACIWorldwide,Inc. ACIW $18.61 84.7% $2,216 $2,921 $973 $553 $211 56.8% 21.7% 3.0x 13.8xHeartlandPaymentSystems,Inc. HPY $41.21 81.7% $1,550 $1,697 $2,194 $318 $162 14.5% 7.4% 0.8x 10.5x
Average 93.7% $7,111 $8,542 $2,881 $1,088 $677 39.3% 22.7% 2.9x 12.4x
Median 96.7% $5,231 $6,013 $2,485 $772 $521 37.7% 22.1% 3.0x 12.8x
EnterpriseValue/LTM LTMMargins LTM
ClosingPrice %of52 Equity EnterpriseCompany Ticker 6/30/14 WeekHigh Value Value Revenue GrossProfit EBITDA GrossProfit EBITDA Revenue EBITDAAccentureplc ACN $80.84 94.1% $56,310 $52,827 $29,312 $9,565 $4,529 32.6% 15.5% 1.8x 11.7xCognizantTechnologySolutionsCorp. CTSH $48.91 90.6% $29,890 $25,760 $9,601 $3,875 $2,021 40.4% 21.1% 2.7x 12.7xWipro,Ltd. WIPRO $9.09 89.4% $22,395 $19,790 $7,459 $2,418 $1,708 32.4% 22.9% 2.7x 11.6xCapGeminiS.A. ENXTPA:CAP $71.33 90.0% $12,529 $12,388 $13,913 $3,460 $1,359 24.9% 9.8% 0.9x 9.1xComputerSciencesCorp. CSC $63.20 97.7% $9,465 $9,904 $12,981 $3,487 $1,968 26.9% 15.2% 0.8x 5.0xCACIInternational,Inc. CACI $70.21 86.9% $1,763 $3,035 $3,572 $1,131 $328 31.7% 9.2% 0.8x 9.2xSyntel,Inc. SYNT $85.96 88.4% $3,605 $2,978 $881 $388 $293 44.1% 33.3% 3.4x 10.2xSapientCorp. SAPE $16.25 90.5% $2,327 $2,040 $1,356 $432 $175 31.8% 12.9% 1.5x 11.7xSAIC,Inc. SAI $4.82 97.1% $1,008 $1,196 $451 $162 $92 35.9% 20.4% 2.7x 13.0xManTechInternationalCorp. MANT $29.52 94.3% $1,097 $1,122 $1,974 $271 $141 13.7% 7.1% 0.6x 7.9xUnisysCorp. UIS $24.74 68.6% $1,155 $838 $3,356 $785 $224 23.4% 6.7% 0.2x 3.7xCIBER,Inc. CBR $4.94 97.1% $376 $363 $870 $223 $21 25.6% 2.4% 0.4x 17.6xComputerTaskGroup,Inc. CTG $16.46 63.0% $274 $242 $402 $86 $25 21.3% 6.2% 0.6x 9.7x
Average 88.3% $10,938 $10,191 $6,625 $2,022 $991 29.6% 14.0% 1.5x 10.2x
Median 90.5% $2,327 $2,978 $3,356 $785 $293 31.7% 12.9% 0.9x 10.2x
EnterpriseValue/LTM LTMMargins LTM
IndustrySectorOverview– PublicCompanyAnalysis
ITConsulting&OtherServices
($inmillions,exceptpershare)
19
Data&TransactionProcessing
ITServices
Source:S&PCapitalIQ.

HYDEPARKCAPITALInvestmentBanking|Mergers&Acquisitions| CapitalRaising
ClosingPrice %of52 Equity EnterpriseCompany Ticker 6/30/14 WeekHigh Value Value Revenue GrossProfit EBITDA GrossProfit EBITDA Revenue EBITDAFlextronicsInternational,Ltd. FLEX $11.07 96.6% $6,795 $7,902 $26,960 $1,534 $1,107 5.7% 4.1% 0.3x 7.1xJabilCircuit,Inc. JBL $20.90 85.9% $4,314 $4,756 $17,307 $1,225 $926 7.1% 5.4% 0.3x 5.1xSanmina‐SCICorp. SANM $22.78 97.9% $1,976 $2,125 $6,034 $472 $293 7.8% 4.9% 0.4x 7.3xCelestica,Inc. TSX:CLS $12.58 95.9% $2,313 $1,794 $5,713 $402 $212 7.0% 3.7% 0.3x 8.4xPlexusCorp. PLXS $43.29 95.1% $1,525 $1,462 $2,280 $217 $155 9.5% 6.8% 0.6x 9.4xBenchmarkElectronics,Inc. BHE $25.48 99.8% $1,389 $997 $2,713 $214 $146 7.9% 5.4% 0.4x 6.8xTTMTechnologies,Inc. TTMI $8.20 75.2% $680 $944 $1,294 $196 $154 15.1% 11.9% 0.7x 6.1x
Average 92.3% $2,713 $2,854 $8,900 $609 $428 8.6% 6.0% 0.4x 7.2x
Median 95.9% $1,976 $1,794 $5,713 $402 $212 7.8% 5.4% 0.4x 7.1x
EnterpriseValue/LTM LTMMargins LTM
ClosingPrice %of52 Equity EnterpriseCompany Ticker 6/30/14 WeekHigh Value Value Revenue GrossProfit EBITDA GrossProfit EBITDA Revenue EBITDAApple,Inc. AAPL $92.93 97.8% $578,082 $571,196 $178,144 $68,399 $59,128 38.4% 33.2% 3.2x 9.7xInternationalBusinessMachinesCorp. IBM $181.27 90.2% $191,496 $228,377 $98,267 $48,215 $25,160 49.1% 25.6% 2.3x 9.1xSamsungElectronicsCo.,Ltd. KOSE:A005930 $1,306.72 88.0% $171,071 $130,412 $216,006 $85,775 $49,769 39.7% 23.0% 0.6x 2.6xHewlett‐PackardCo. HPQ $33.68 95.7% $65,171 $73,166 $111,820 $26,280 $13,106 23.5% 11.7% 0.7x 5.6xXeroxCorp. XRX $12.44 95.6% $15,427 $22,596 $21,254 $6,539 $2,566 30.8% 12.1% 1.1x 8.8xLenovoGroup,Ltd. SEHK:992 $1.37 93.8% $14,335 $11,064 $38,707 $5,064 $1,252 13.1% 3.2% 0.3x 8.8xNCRCorp. NCR $35.09 84.3% $5,992 $9,469 $6,354 $1,841 $975 29.0% 15.3% 1.5x 9.7xPitneyBowes,Inc. PBI $27.62 97.8% $5,629 $8,136 $3,905 $2,179 $829 55.8% 21.2% 2.1x 9.8xDiebold,Inc. DBD $40.17 96.9% $2,576 $2,771 $2,939 $725 $238 24.7% 8.1% 0.9x 11.6xLexmarkInternational,Inc. LXK $48.16 99.9% $3,063 $2,732 $3,666 $1,475 $588 40.2% 16.0% 0.7x 4.6xScanSource,Inc. SCSC $38.08 87.2% $1,083 $905 $2,868 $303 $120 10.6% 4.2% 0.3x 7.6x
Average 93.4% $95,811 $96,439 $62,175 $22,436 $13,976 32.3% 15.8% 1.2x 8.0x
Median 95.6% $14,335 $11,064 $21,254 $5,064 $1,252 30.8% 15.3% 0.9x 8.8x
EnterpriseValue/LTM LTMMargins LTM
IndustrySectorOverview– PublicCompanyAnalysis
PCs,Servers&Components
($inmillions,exceptpershare)
20
ElectronicManufacturingServices
TechnologyHardware
Source:S&PCapitalIQ

HYDEPARKCAPITALInvestmentBanking|Mergers&Acquisitions| CapitalRaising
ClosingPrice %of52 Equity EnterpriseCompany Ticker 6/30/14 WeekHigh Value Value Revenue GrossProfit EBITDA GrossProfit EBITDA Revenue EBITDAQUALCOMM,Inc. QCOM $79.20 97.0% $136,422 $118,278 $26,276 $15,616 $8,902 59.4% 33.9% 4.5x* 13.3xCiscoSystems,Inc. CSCO $24.85 93.8% $132,761 $103,201 $47,202 $27,924 $12,871 59.2% 27.3% 2.2x 8.0xJuniperNetworks,Inc. JNPR $24.54 85.4% $12,239 $10,968 $4,859 $3,027 $837 62.3% 17.2% 2.3x 13.1xAlcatel‐Lucent,SA ENXTPA:ALU $3.57 75.7% $9,329 $10,535 $19,406 $6,475 $1,124 33.4% 5.8% 0.5x 9.4xHarrisCorp. HRS $75.75 95.5% $8,128 $9,202 $5,012 $1,702 $1,086 33.9% 21.7% 1.8x 8.5xPolycom,Inc. PLCM $12.53 89.1% $1,868 $1,564 $1,345 $779 $140 57.9% 10.4% 1.2x 11.2xADTRAN,Inc. ADTN $22.56 80.6% $1,294 $1,220 $660 $324 $73 49.1% 11.1% 1.8x 16.7xNetgear,Inc. NTGR $34.77 95.9% $1,319 $1,076 $1,406 $398 $139 28.3% 9.9% 0.8x 7.7x
Average 89.1% $37,920 $32,005 $13,271 $7,031 $3,147 47.9% 17.2% 1.5x 11.0x
Median 91.5% $8,728 $9,869 $4,935 $2,364 $962 53.5% 14.2% 1.8x 10.3x
EnterpriseValue/LTM LTMMargins LTM
ClosingPrice %of52 Equity EnterpriseCompany Ticker 6/30/14 WeekHigh Value Value Revenue GrossProfit EBITDA GrossProfit EBITDA Revenue EBITDASanDiskCorp. SNDK $104.43 99.7% $24,717 $24,063 $6,499 $3,239 $2,346 49.8% 36.1% 3.7x 10.3xWesternDigitalCorp. WDC $92.30 97.2% $22,337 $19,687 $15,130 $4,360 $3,182 28.8% 21.0% 1.3x 6.2xQLogicCorp. QLGC $10.09 77.2% $880 $629 $467 $306 $100 65.5% 21.4% 1.3x 6.3xEmulexCorp. ELX $5.70 63.4% $478 $466 $447 $294 $23 65.6% 5.2% 1.0x 19.9x
Average 84.4% $12,103 $11,211 $5,636 $2,050 $1,413 52.4% 20.9% 1.8x 10.7x
Median 87.2% $11,608 $10,158 $3,483 $1,773 $1,223 57.7% 21.2% 1.3x 8.3x
EnterpriseValue/LTM LTMMargins LTM
IndustrySectorOverview– PublicCompanyAnalysis
Storage&Networks
($inmillions,exceptpershare)
21
CommunicationsEquipment
TechnologyHardware
Source:S&PCapitalIQ*Excludedfromaverageandmediancalculation.

HYDEPARKCAPITALInvestmentBanking|Mergers&Acquisitions| CapitalRaising
MemberFINRA/SIPC
RecentTransactions
HYDEPARKCAPITALInvestmentBanking|Mergers&Acquisitions| CapitalRaisingIntegrity | Expertise| Results
HydeParkCapitalAdvisors,LLC701N.FranklinStreetTampa,FL33602Tel:813‐383‐0202
www.hydeparkcapital.com
[email protected](813)383‐0205
[email protected](813)383‐0206
[email protected](813)383‐0208
[email protected](813)383‐0203
[email protected](813)597‐2649
[email protected](813)383‐0207