hydraulics branch official file copy bureau of … · hydraulics branch official file copy...
TRANSCRIPT
HYDRAULICS BRANCH OFFICIAL FILE COPY
>-
UNITED STATES
DEPARTMENT OF THE INTERIOR
BUREAU OF RECLAMATION
BUREAU OF RECLAMATION HYDRAULIC Lf.BORATORY.
OfFiCE ru r copy ru.c. .,j
WHEN BORROWED RETURN PROMPTLY
FIELD TESTS TO STUDY THE PRESSURE
VARIATION INDUCED BY WAVE ACTI ON· ON THE
MITER GATE LEAVES OF THE BUCKET CAISSON
DRYDOCK AT GRAND COULEE DAM-
COLUMBIA BASIN PR OJECT
N CX) ('\J
Hydraulic Laboratory Report No. Hyd.-282
RESEARCH AND GEOLOGY DIVISION
BRANCH OF DESIGN AND CONSTRUCTION
DENVER, COLORADO
JULY 6, 1950
CONTENTS
Purpose • o • • • • • o • o • o e e o • • • o
Conclusions • • • • • • • • • • • • • • Recommendation. • • • • • • • • • • • • ., • • Introduction. • • • • • • • • • • • • •
o • • • • • o o • • o
. . . . . 0 • 0 0 0
• • • • o e e o • e o
• • � • • "• • • • o o
BackgrolUld Information • • • • • • • • • • Instrumentation for Pressure Tests . � • • • •
. . . • • •
. . . • • •
• • " .
The Investigation • • • • • • • e • • • • • • • • . . . • • 0 • • •
The Test Program • • • • • • • • • • • • • • • • • • • • • • • Analysis of Data • • • • • • • • • • • • • • • • • • • • • • .. The Accuracy and Ll.mitations of the Data • • • • • • • • • • • Interpretation of the Results. • • • • • '. • • • • • • • • • • Application of the Results to the Miter Gate Problems • • • • o
Pressure Measurements on Access Shaft No. 4 of the Caisson. • • • • $ • • • • • • • • •
APPENDIX
• • • Location of Drydock • • • • • ., • • • • • • • • • • Drydock Miter Gate • • • • • • • • • • • • • • • • Miter Gate Wedges and Pressure-cell Installation in
• • . .
Tipping Section . • • • • • • • • • • • • • • • • • • Pressure-cell Installation--Drydock and Ca isson .
Pressure-cell Installation--V.titer Gate. • • • • • • • Oscillograph Record from Test No. 10 • • • • • • Pressure-cell Calibration Curves--1 to 11 . • • Pressure-cell Calibration Curves--12 to 19. • • • • • Pressure Traces Transferred from Oscillograph Record--
• •
. .
Test I>l'o. 10 o .• • • e • • • • • • • • • • • • • • •
. . • 0
• • 0 •
• • 0 •
. .
1 1 2 2
2 .3
4
4, 6 7 8 8
9
1 2
3 4 5 6 7 8
9
UNITED STATES IlEPARTMl!:NT OF THE INTERIOR
BUREAU OF RECLAMATION
Bra..�ch of Design and Construction Research and Geology Division Denver, Colorado
Laboratory Report No. 282 Hydraulic Laboratory Written by: F. C. Lowe
July 6, 1950 J. c. Schuster Reviewed by: J. W. Ball
Subject: Field tests to study the pressure variation induced by wave action on the miter gate leaves of the bucket caisson drydock at Grand Coulee Dam-Columbia Basin Project
PURPOSE
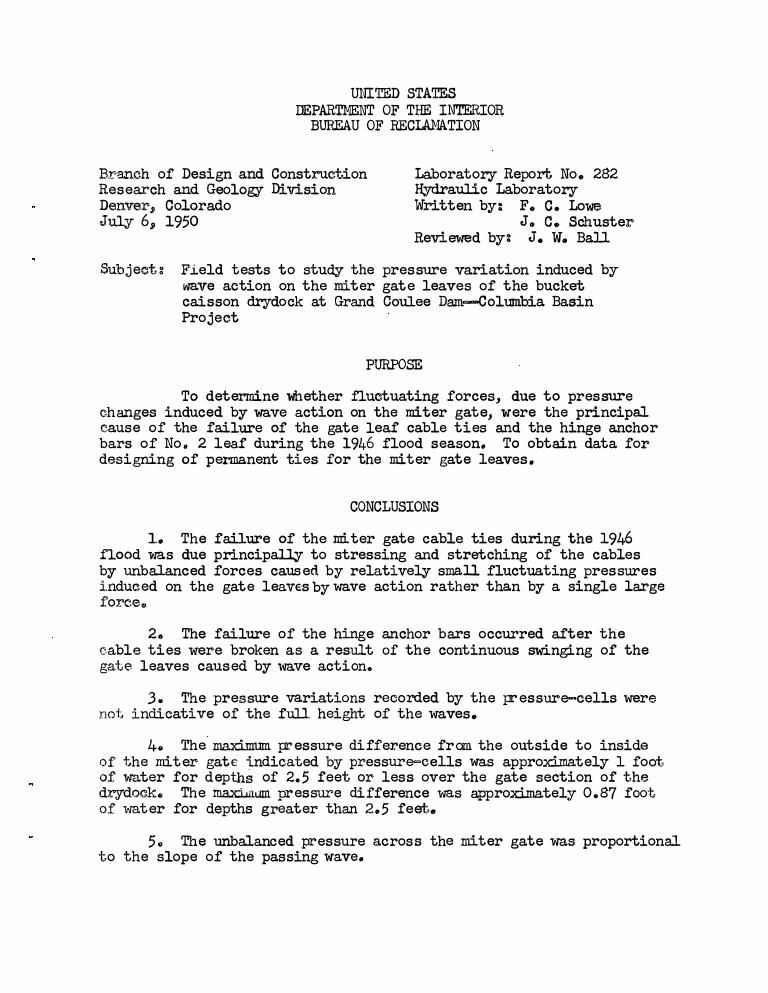
To determine whether fluctuating forces, due to pressure changes induced by wave action on the miter gate, were the principal cause of the failure of the gate leaf cable ties and the hinge anchor bars of No. 2 leaf during the 1946 flood season. To obtain data for designing of permanent ties for the miter gate leaves.
CONCLUSIONS
1. The failure of the mi.ter gate cable ties during the 1946 flood was due principally to stressing and stretching of the cables by unbalanced forces caused by relatively small fluctuating pressures induced on the gate leaves by wave action rather than by a single large force.
2. The failure of the hinge anchor bars occurred after the cable ties were broken as a result of the continuous swinging of the gate leaves caused by wave action.
J. The pressure variations recorded by the pressure-cells were not indicative of the full height of the waves.
4. The ma.xi.mum. pressure difference fran the outside to inside of the miter gate indicated by pressure=cells was approx:i.ma.tely 1 foot of water for depths of 2.5 feet or less over the gate section of the drydock. The ma.x:i..in.lllll pressure difference was approximately 0.87 foot of water for depths greater than 2.5 feet.
5. The unbalanced pressure across the miter gate was proportional to the slope of the passing wave.
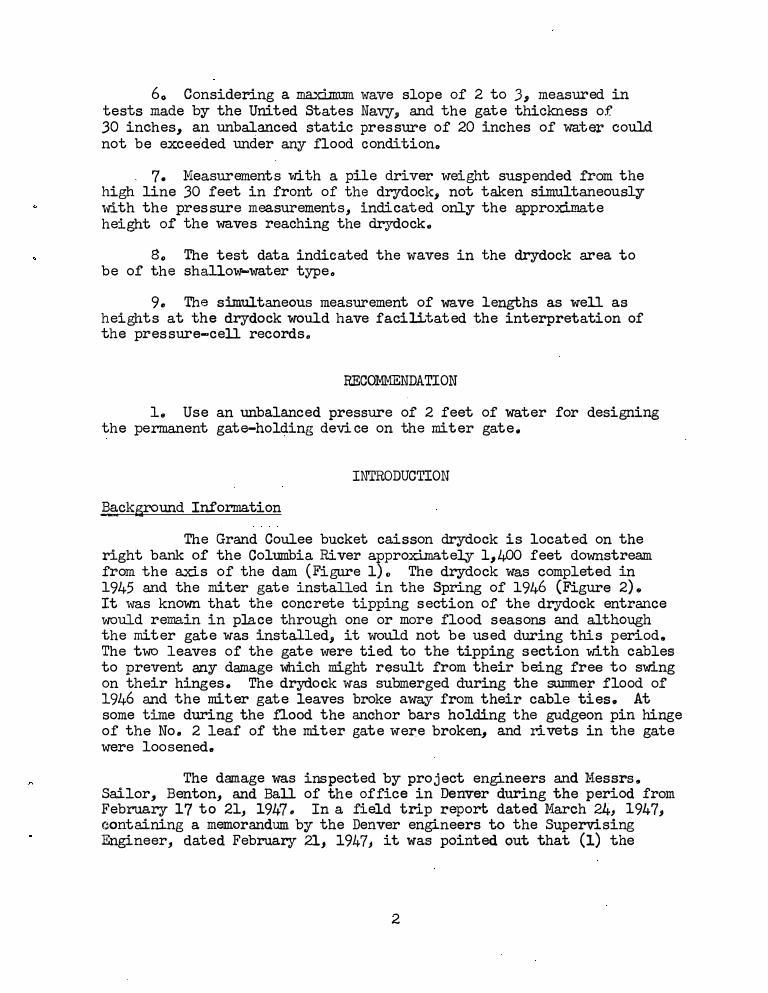
6. Considering a ma.:ximum wave slope of 2 to 3 ., measured in tests made by the United states Navy., and the gate thiclmess o.f 30 inches., an unbalanced static pressure of 20 inches of water could not be exceeded under any flood condition •
. 7. Measurements with a pile driver weight suspended from the high line 30 feet in front of the drydock., not taken simultaneously with the pressure measurements, indicated only the approximate height of the waves reaching the drydock.
8. The test data indicated the waves in the drydock area to be of the shallow-water type.
9. The simultaneous measurement of wave lengths as well as heights at the drydock would have facilitated the interpretation of the pressure-cell records.
RECOMMENDATION
1. Use an unbalanced pressure of 2 feet of water for designing the permanent gate-hol�ing device on the miter gate.
INTRODUCTION
]§.ckground Information
The Grand Coulee bucket caisson drydock is located on the right bank of the Columbia River approximately 11 400 feet downstream from the a.xi.s of the dam (Figure 1)" The drydock was completed in 1945 and the miter gate installed in the Spring of 1946 (Figure 2). It was known that the concrete tipping section of the drydock entrance would remain in place through one or more flood seasons and although the miter gate was installed ., it would not be used during this period. The two leaves of the gate were tied to the tipping section with cables to prevent any damage which might result from their being free to swing on their hinges. The drydock was submerged during the summer flood of 1946 and the miter gate leaves broke away from t heir cable ties. At some time during the flood the anchor bars holding the gudgeon pin hinge of the No. 2 leaf of the miter gate were broken., and rivets in the gate were loosened.
The damage was inspected by project engineers and Messrs. Sailor, Benton, and Ball of the office in Denver during the period from February 17 to 21, 1947. In a field trip report dated March 24, 1947, containing a memorandum by the Denver engineers to the Supervising Engineer, dated February 21, 1947, it was pointed out that (1) the
2
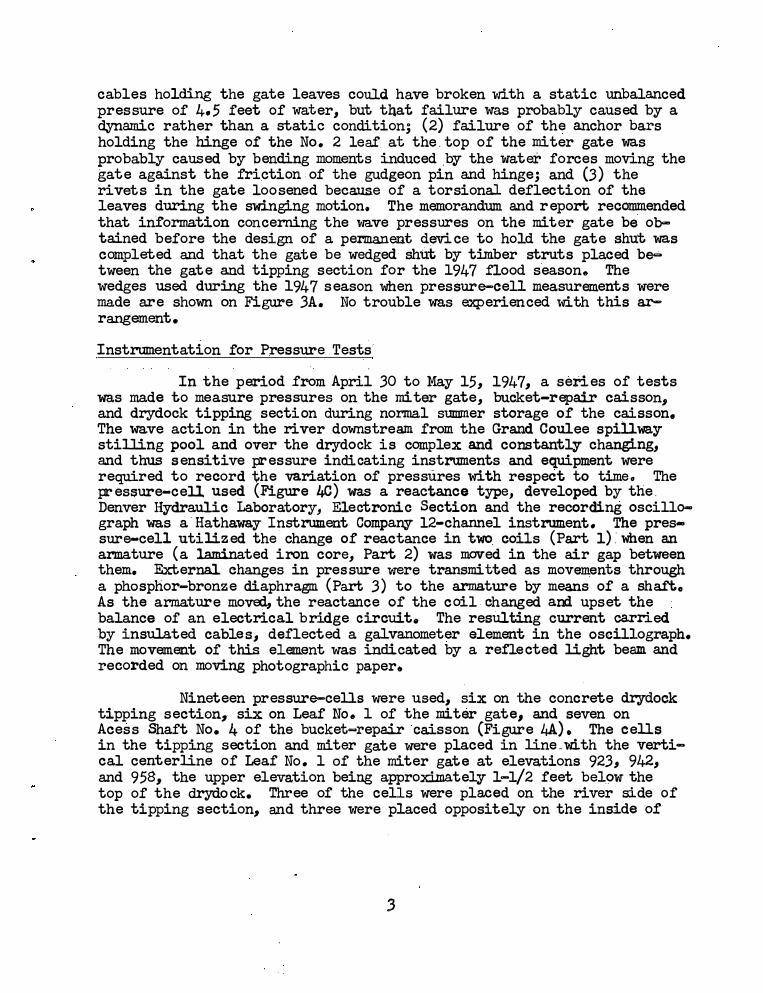
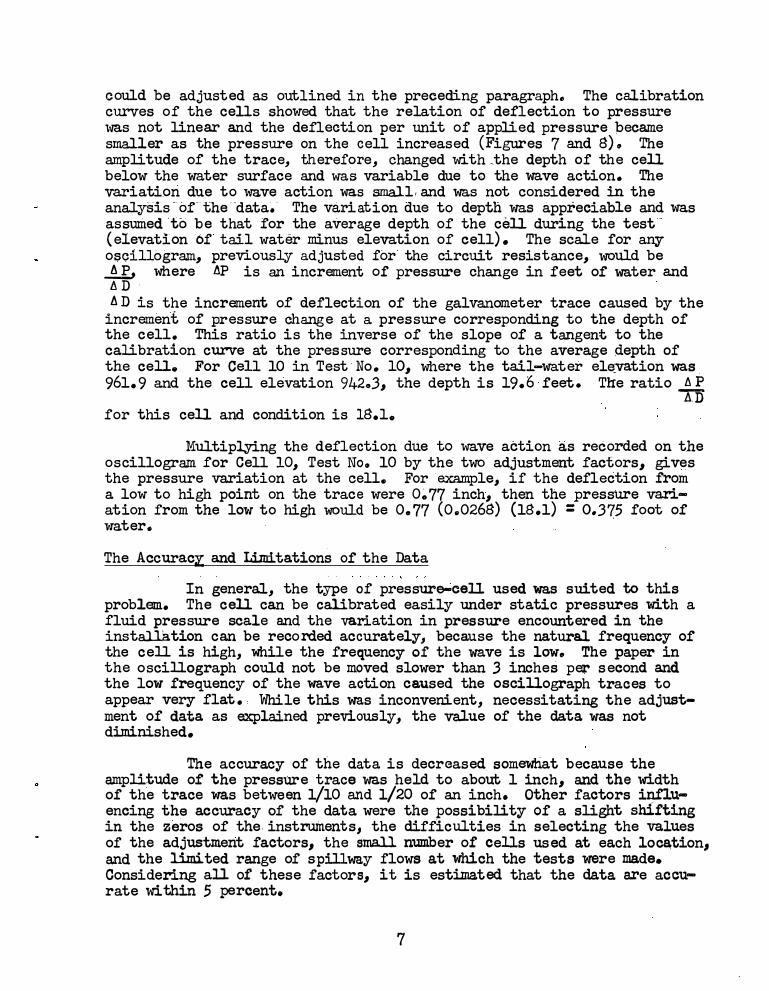
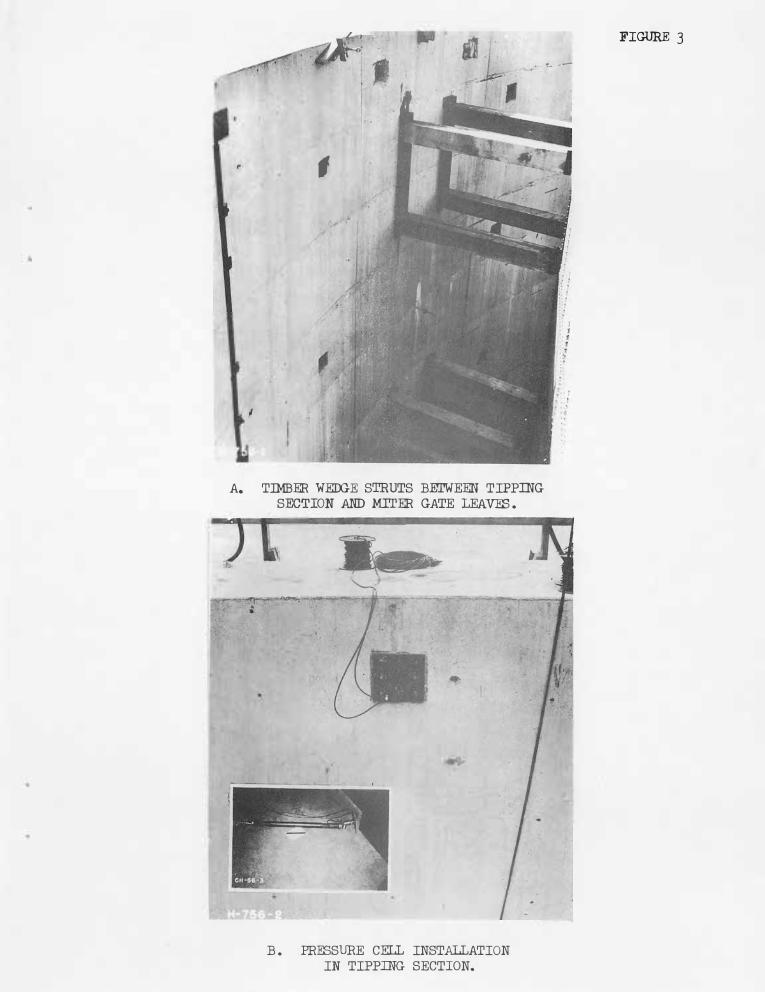
cables holding the gate leaves could have broken with a static unbalanced pressure of 4.5 feet of water., but tnat failure was probably caused by a dynamic rather than a static condition; (2) failure of the anchor bars holding the hinge of the No. 2 leaf at the.top of the miter gate was probably caused by bending moments induced .bY the water forces moving the gate against the friction of the gudgeon pin and hinge; and (3) the rivets in the gate loosened beca.us.e of a torsional deflection of the leaves during the swinging motion. The memorandum and report recommended that information concerning the wave pressures on the miter gate be obtained before the design of a permanent device to hold the gate shut was completed and that the gate be wedged shut by timber struts placed b&itween the gate and tipping section for the 1947 flood season. The wedges used during the 194 7 season when pressure-cell measurements were made are shown on Figure 3A. No trouble was experienced with this arrangement.
Instrumentation for Pressure Tests
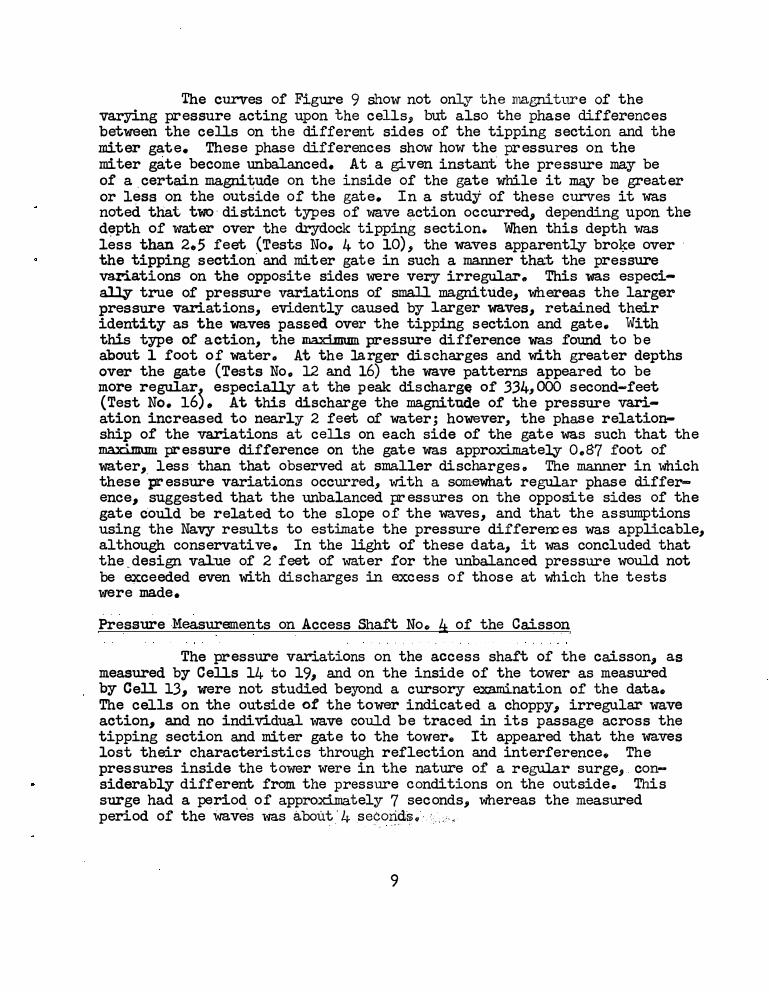
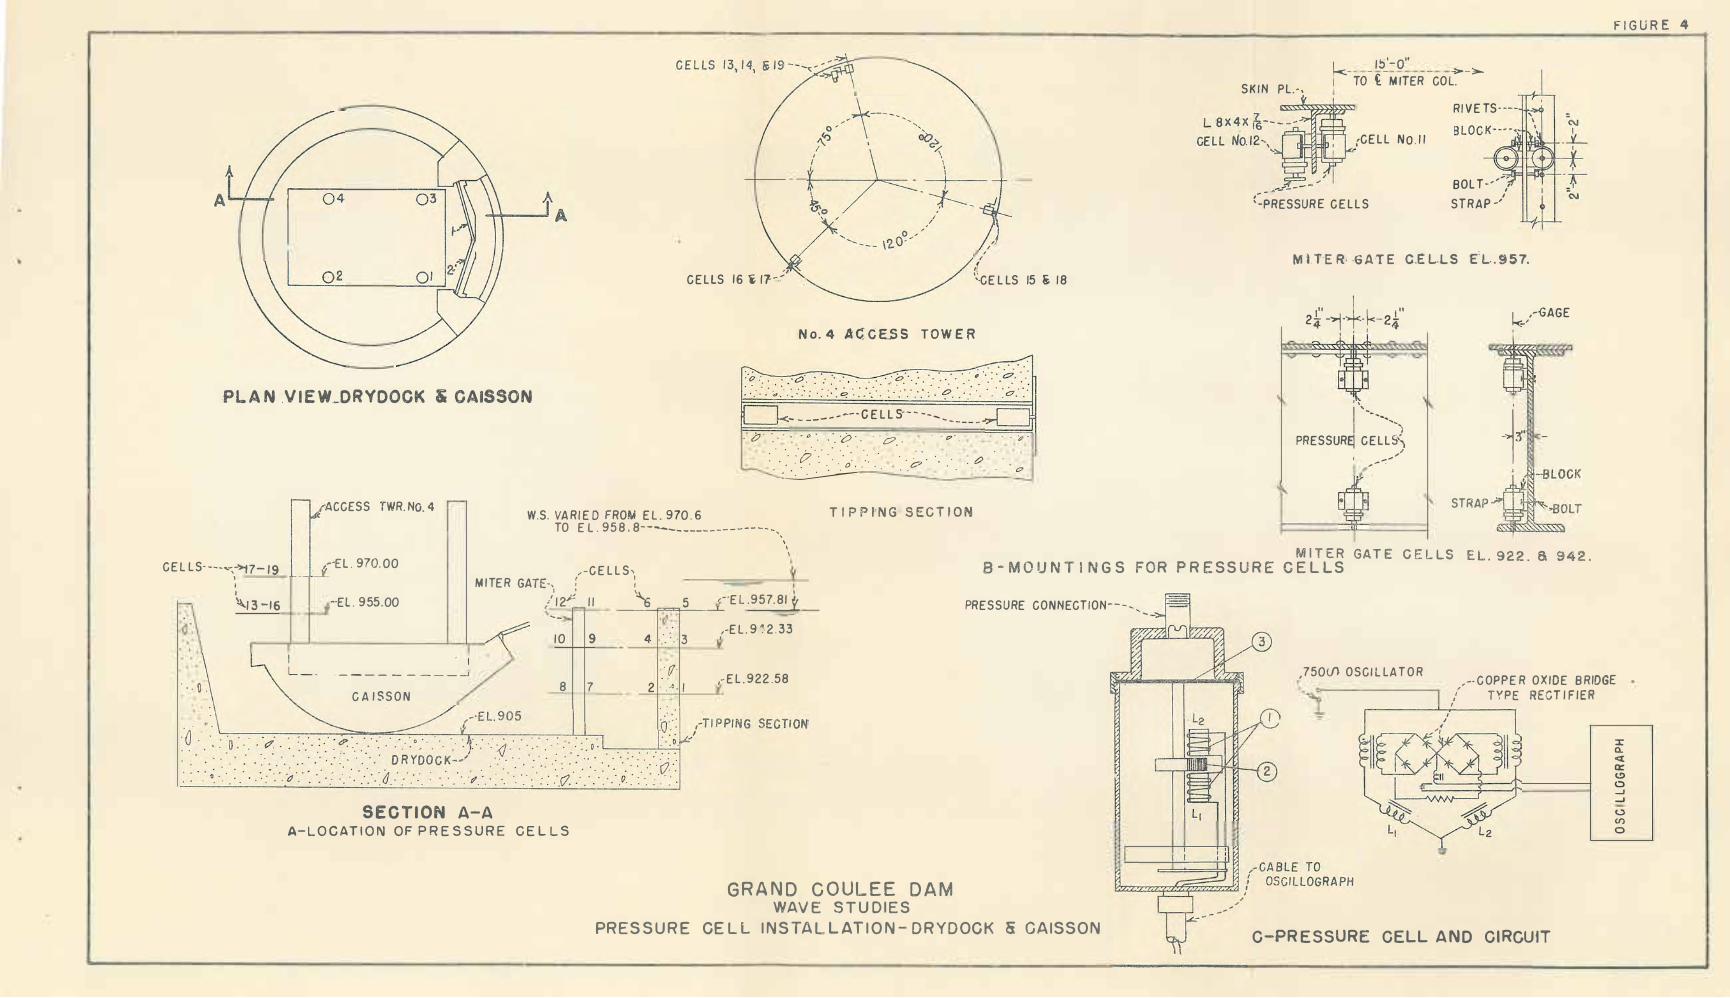
In the period from April 30 to May 15 ., 1947., a series of tests was made to measure pressures on the miter gate ., bucket-repair caisson, and drydock tipping section during normal summer storage of the caisson. The wave action in the river downstream from the Grand Coulee spillway stilling pool and over the drydock is complex and constantly changing, and thus sensitive pressure indicating instruments and equipment were required to record 1;,he variation of pressures with respect to timeo The pc-essure-cell used (Figure 4C) was a reactance type, developed by the. Denver Hydraulic Laboratory, Electronic Section and the recording oscillograph was a Hathaway Instrument Company 12-channel instrument. The pressure-cell utilized the change of reactance in two coils (Part 1):when an armature (a laminated iron core, Part 2) was moved in the air gap between them. External changes in pressure were transmitted as movements through a phosphor-bronze diaphragm (Part 3) to the armature by means of a shaft. As the armature moved., the reactance of the coil changed am upset the balance of an electrical bridge circuit. The resulting current carried by insulated cables., deflected a galvanometer element in the oscillogra.ph. The movement of this elem.ant was indicated by a reflected light beam and recorded on moving photographic paper.
Nineteen pressure-cells were used., six on the concrete drydock tipping section, six on Leaf No. 1 of the miter gate, and seven on Acess Shaft No. 4 of the bucket-repair caisson (Figure U). The cells in the tipping section and miter gate were placed in line_with the vertical centerline of Leaf No. 1 of the miter gate at eleva.tions 923., 942, and 958., the upper elevation being approximately 1-1/2 feet bel.owthe top of the drydock. Three of the cells were placed on the river side of the tipping section., and three were placed oppositely on the inside of
3
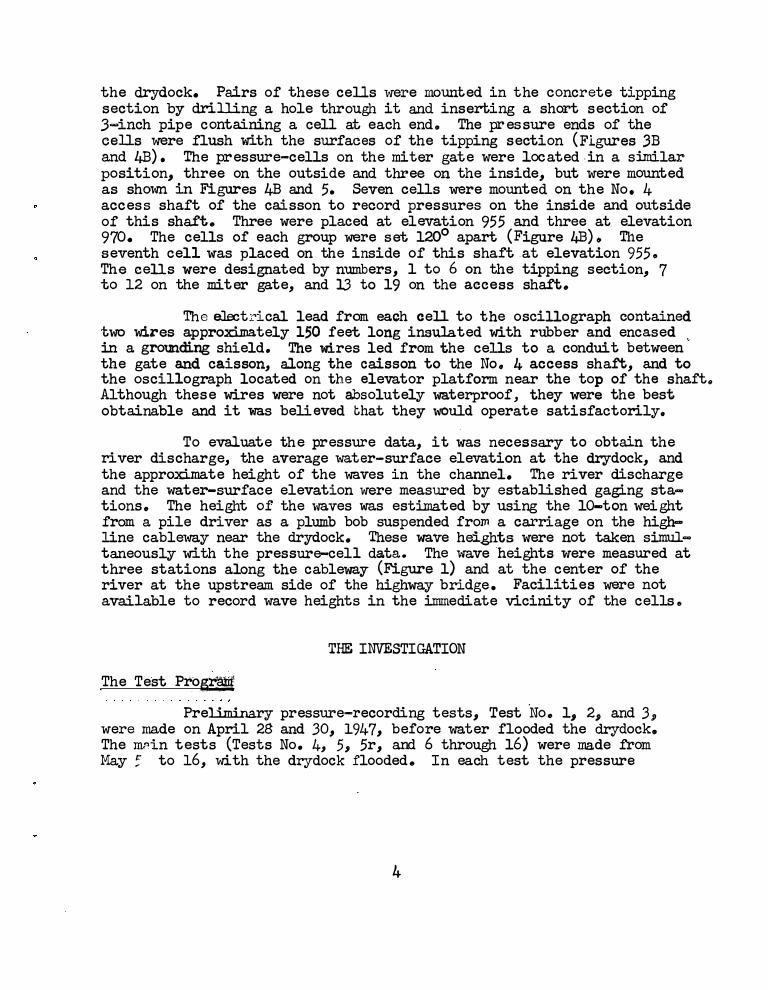
the drydock. Pairs of these cells were mounted in the concrete tipping section by driDing a hole through it and inserting a short section of .3-inch pipe containing a cell at each end. The pressure ends of the cells were flush with the surfaces of the tipping section (Figures 3B and 4B). The pressure-cells on the miter gate were located ,in a similar position, three on the outside and three on the inside, but were mounted as shown in Figures 4B and 5. Seven cells were mounted on the No. 4 access shaft of the caisson to record pressures on the inside and outside of this shaft. Three were placed at elevation 955 and three at elevation 970. The cells of each group were set 120° apart (Figure 4B)o The seventh cell was placed on the inside of this shaft .at elevation 955. The cells were designated by numbers, 1 to 6 on the tipping section, 7 to 12 on the miter gate, and 13 to 19 on the access shaft.
The eJsctrical lead from each cell to the oscillograph contained two wires a.pprox:tmately lSO .feet long insulated with rubber and encased ._ in a grounding shield. The wires led from the cells to a conduit between the gate and caisson, a1ong the caisson to the No. 4 access shaft, and to the oscillograph located on the elevator platform near the top o.f the shafte Although these wires were not absolutely waterproof, they were the best obtainable and it was believed �hat they would operate satisfactorily.
To evaluate the pressure data, it was necessary to obtain the river discharge, the average water-surface elevation at the drydock, and the approximate height of the waves in the channel. The river discharge and the water-surface elevation were measured by established gaging stations. The height of the waves was estimated by using the 10-ton weight from a pile driver as a plumb bob suspended from a carriage on the highline cableway near the drydock. These wa,re heights were not taken simultaneously with the pressure-cell data.. The wave heights were measured at three stations along the cableway (Figure 1) and at the center of the river at the upstream. side of the highway bridge. Facilities were not avail.able to record wave heights in the innnediate vicinity of the cells.
THE INVESTIGATION
The Test Pros�
Preliminary pressure-recording tests, Test No. 1, 2, and 3, were made on April 28 and 30, 1947, before water flooded the drydock. The JI1P.in tests (Tests No. 4, 5, 5r, and 6 through 16) were ma.de from May ; to 16, with the drydock flooded. In each test the pressure
4
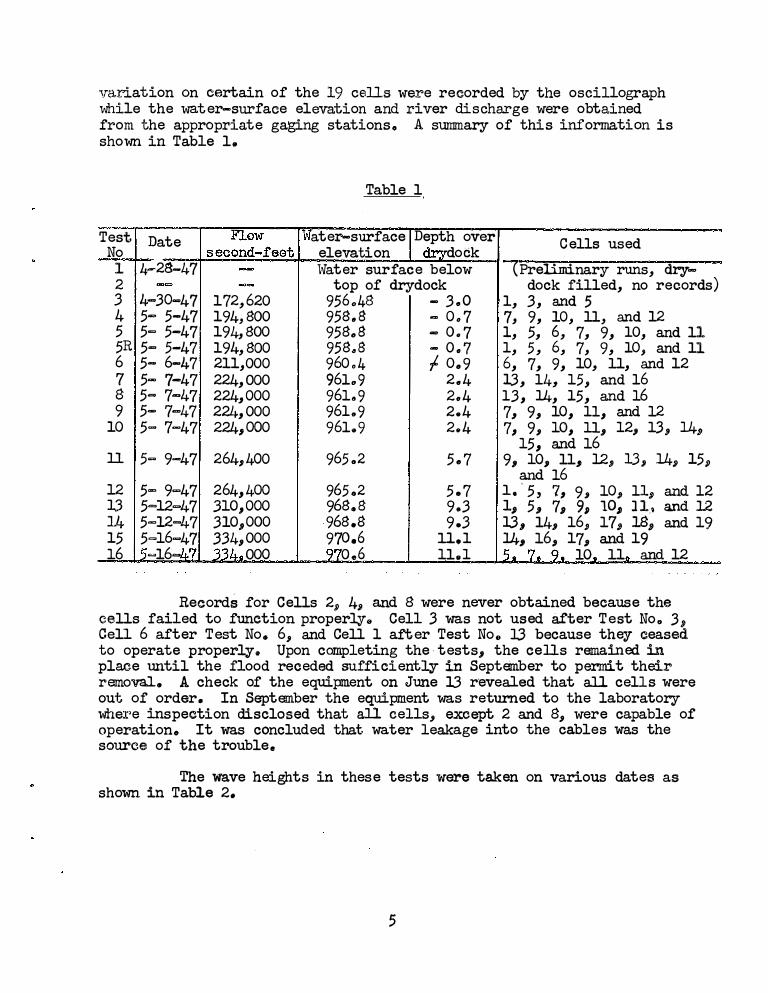
variation on certain of the 19 cells were recorded by the oscillograph while the water-surface elevation and river discharge were obtained from the appropriate gaging stations. A stumnary of this information is shown in Table 1.
Test Date No 1 4,-2S-47 2
3 4-30-47 172,620 4 5- 5-47 194,800 5 5- 5-47 194,800 5R 5- 5-47 194,800 6 5- 6-47 211,000 7 5- 7-47 224,000 8 5= 7-47 224,000 9 5- 7-47 224,000
10 5- 7-47 224,000
ll 5= 9-47 264,400
12 5- 9-47 l3 5=12-47 14 5-12-47 15 5=16-47 16 =16=
264,400 310,000 310 ., 000 334., 000
000
Table 1
ater-surface Depth over elevation dock Water surface below
top of drydock 956048 - 3.0 958.8 - 0.7 958.8 - 0.7 958.8 - 0.7 96004 f 0.9 961.9 2.4 961.9 2.4 961.9 2.4 961.9 2.4
965.2 5.7
965.2 5.7 968.8 9.3 -968.8 9.3 970.6 ll,1
o.6 11 .. 1
Cells used
( Preliminary runs, drydock filled, no records)
·l, 3, and 5 7, 9, 10, ll, and 12 1, 5, 6, 7, 9, 10, and 11 1, 5, 6, 7, 9, 10, and 11 6, 7, 9, 10, ll, and 12 l3, 14, 15, and 16 13, 14, 15, and 16 7, 9, 10, 11, and 12 7, 9, 10, 11, 12., 13., 14.,
15, and 16 9, 10, ll., 12., 13 ., 14, 15,
and 16 1. '5, 7, 9, 10, 11, and 12 1, 5., 7, 9, 10, 11_9 and 12 l3., 14, 16, 17, 18., and 19 14, 16, 17, and 19
10 ll and 12
Records for Cells 2., 4, and 8 were never obtained because the cells failed to function properlye Cell 3 was not used after Test No .. 3, Cell 6 after Test No. 6., and Cell l after Test No. l3 because they ceased to operate properly. Upon completing the-tests, the cells remained. in place until the fiood receded sufficiently in September to permit their removal.. A check of the equipment on June l3 r·evealed that al1 cells were out of order. In September the equipment was returned to the laboratory whez•e inspection disclosed that a.11 cells., except 2 and 8, were capable of operation. It was concluded that water leakage into the cables was the source of the trouble.
The nve heights in these tests were taken on various dates as shown in Table 2.
5
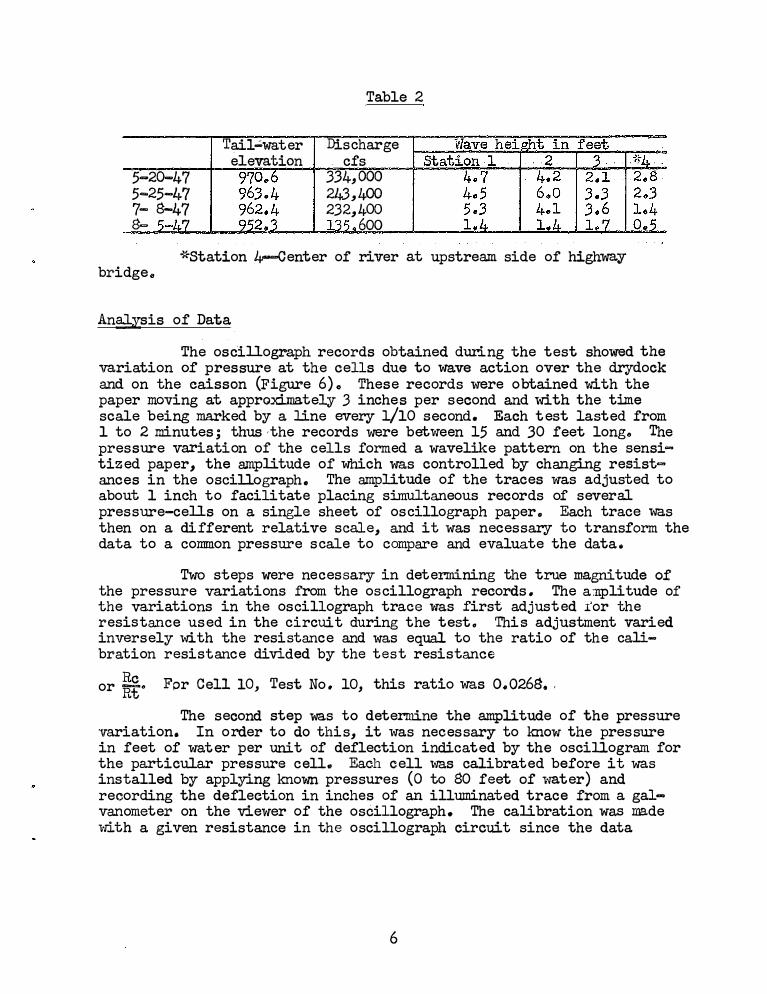
5-20...47 5-25-47 7- 8-47 8-
Tail.,;,water elevation
Table 2
Discharge cfs
334,000 243,400 232,400
600
*Station 4-Center of river a.t upstream. side of highway bridge.
Analysis of Data.
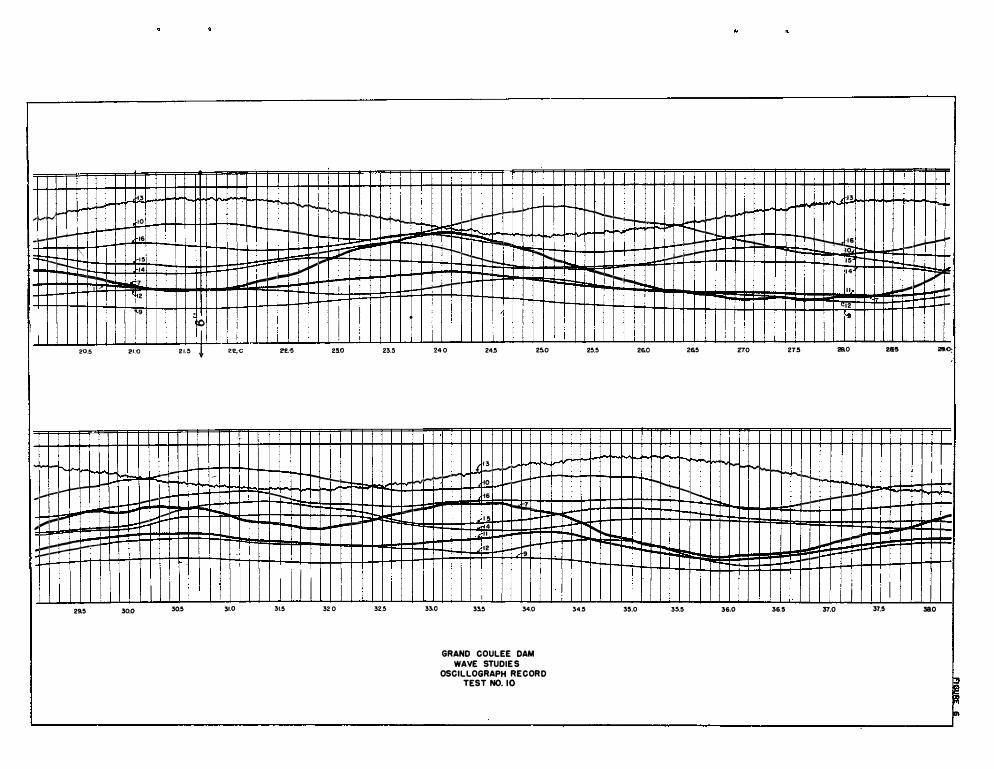
The oscillogra.ph records obtained dur.i.ng the test showed the variation of pressure at the cells due to wave action over the drydock and on the caisson (Figure 6). These records were obtained with the paper moving a.t appro.xi.mately 3 inches per second and with the time scale being marked by a line every 1/10 second. Each test lasted from 1 to 2 minutes; thus ,the records were between 15 and 30 feet long. The pressure variation of the cells formed a wavelike pattern on the sensitized paper, the amplitude of which was controlled by changing resist ... ances in the oscillograph. The amplitude of the traces was adjusted to about 1 inch to facilitate placing simultaneous records of several pressure-cells on a single sheet of oscillograph paper. Each trace was then on a different relative scale, and it was necessary to transform the data to a common pressure scale to compare and evaluate the data.
Two steps were necessary in determining the true magnitude of the pressure variations from the oscillograph records. The a�plitude of the variations in the oscillograph trace was first adjusted for the resistance used in the circuit during the testo This adjustment varied inversely with the resistance and was equal to the ratio of the calibration resistance divided by the test resistance
or lo Fpr Cell 10, Test No. 10, this ratio was 0.0268.,
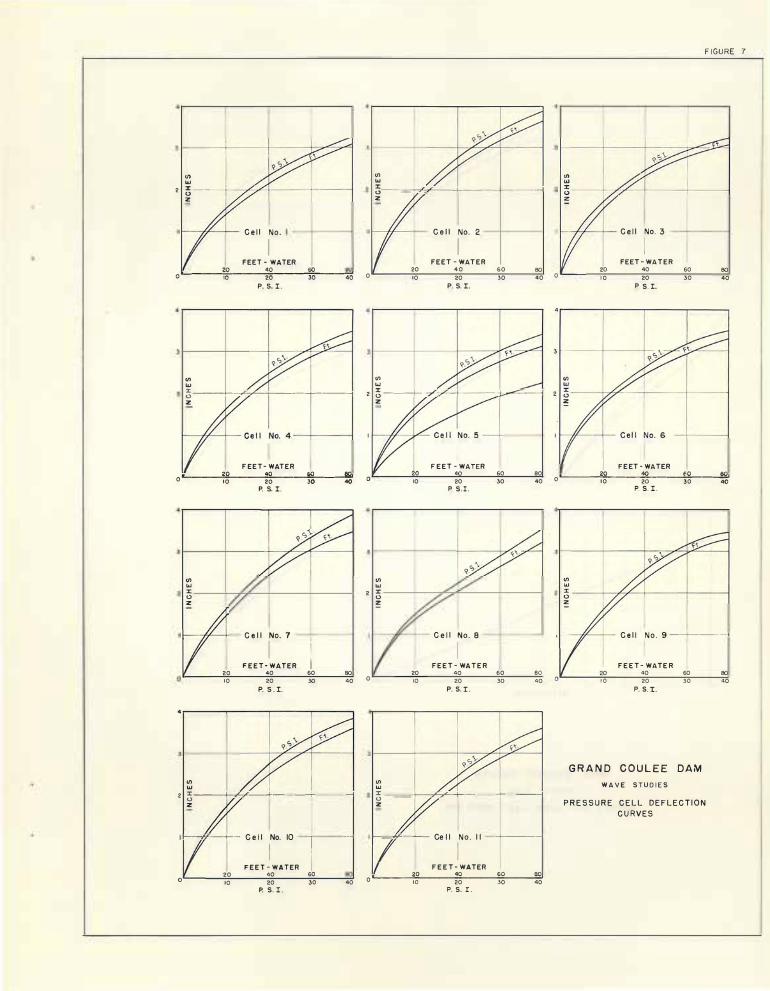
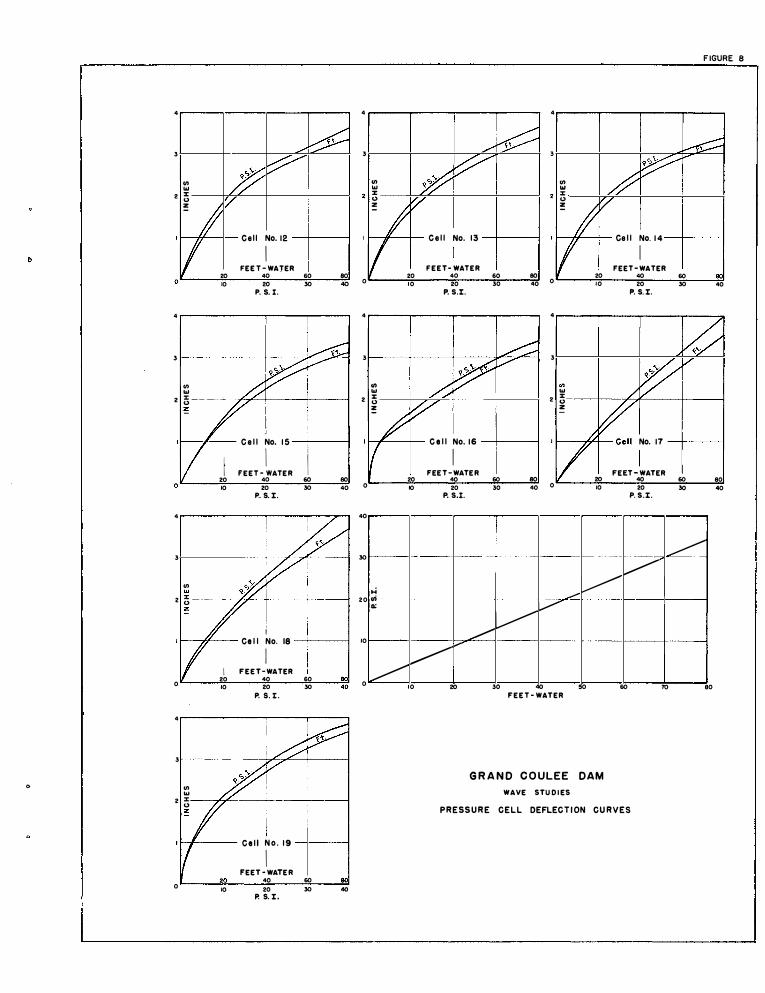
The second step was to determine the amplitude of the pressure variation. In order to do this, it was necessary to know the pressure in feet of water per unit of deflection indicated by the oscillogram for the particular pressure cell. Ea.eh cell was calibrated before it was installed by applying known pressures (0 to 80 feet of water) and recording the deflection in inches of an illuminated trace from a galvanometer on the viewer of the oscillograph. The calibration was ma.de with a given resistance in the oscillograph circuit since the data
6
could be adjusted as outlined in the preceding paragraph., The calibration curves of the cells showed that the relation of deflection to pressure was not linear and the deflection per unit of applied pressure became smaller as the pressure on the cell increased (Figures 7 and 8)., The amplitude of the trace, therefore, changed with -.the depth of the cell below the water surface and was variable due to the wave action. The variation due to wave action was small,and was not considered in the analysis - or the· -data.· The variation due to depth was appreciable and was assumed ·to be that for the average depth of the cell during the test· ( elevation 6f tail water minus elevation of cell). The scale for any oscillogram, previously adjusted for the circuit resistance, would be ..!.f, where t.P is an increment of pressure change in feet of water and t. D t.D is the increment of deflection of the galvanometer trace caused by the
increment of pressure change at a pressure corresponding to the depth of the cell. This ratio is the inverse of the slope of a tangent to the calibration curve at the pressure corresponding to the average depth of the cell. For Cell 10 in Test No. 10, where the tail-water ele_vation was 961.9 and the cell elevation 942.,3, the depth is 19.6 feet. The ratio E_
t..D
for this cell and condition is 18.1.
Multiplying the deflection due to wave action as recorded on the oscillogram for Cell 10, Test No., 10 by the two adjustment factors, gives the pressure variation at the cell. For example, if the deflection from a low to high point on the trace were 0�77 inch, then the pressure variation from the low to high would be 0.77 (0.0268) (18.1) = 0.375 foot of water.
The Accuracy and Limitations of the Data
In general, the type of pressure-cell used was suited to this problem.. The cell can be calibrated easily under static pressures with a fluid pressure scale and the variation in pressure encountered in the insta.lla.tion can be recorded accurately, because the natural frequency of the cell is high, while the frequency of the wave is low. The paper in the oscillograph could not be moved slower than 3 inches per second and the low frequency of the wave action caused the oscillograph traces to appear very flat. While this was inconvenient, necessitating the adjustment of data as explained previously, the value of the data was not diminished.
The accuracy of the data is decreased somewhat because the amplitude of the pressure trace was held to about 1 inch, and the width of the trace was between 1/10 and 1/20 of an inch. Other factors influencing the accuracy of the data were the possibility of a slight shifting in the zeros of the-instruments, the difficulties in selecting the values of the adjustment factors, the srna.11 number of cells used at each location, and the limited range of spillway flows at which the tests were made. Considering all 0£ these factors, it is estimated that the data are accurate within 5 percent.
7

friteryretation of the Results
The irregular variation of pressure with respect to time at the several cells (Figqre 9) was attributed to wave action since waves were described as being of a choppy irregular nature. It was noted. that the amplitude of the pressure variations for a single cell was about 1 foot of water at the smaller discharges and about 1-1/2 feet of water. at the larger discharges. The wave heights (from crest tq trough) for the corresponding discharges as indicated by the suspended pile driver weight, about 30 feet away from the drydock, were about 1. 7 feet for the smaller discharges and about 3 .3 feet for the larger discharges; thus, the pressure variations as sho'W!l by the cells do not indicate the . full height of the waves . A further study of pressure variation with respect to depth was · made by comparison of records from the cell groups 1 and 5; 7, 9, and 11; and 10 and 12; but no consistent variation with depth was found.
It would have been desirable to definitely establish the nature, magnitude, and celerity of the waves, but their complex pattern did not make this feasible. As far as could be determined from the available data., the waves were of a type called shallow water waves,. This is probably true, for the depth of the water in much of the area was less than the wave length .
Application of the Results to the Miter Gate Problems
Under the conditions of the tests which were performed with the tipping section in place, the results are not strictly applicable because the wave action with the tipping section and the miter gate in place will be different from that with the miter gate only. However, the difference in the results should not be sufficient to invalidate their use.
Prior to the tests, a force had been estimated by assuming an unbalanced pressure from one side of the gate to the other equal to the wave height. Using this assumption, the computed wave height to · break the cable tie was 4-1/2 feet . Actually, with ample submergence, the unbalanced pressures depend mainly upon the slope of the waves which pass over the gate . The maxim.um slope of ocean waves observed in tests made by the United States Navy was about 2 to 3 . Applying this information with a gate thickness of 30 inches, the maximum pressure differential -would be less than 2 feet of water. Although these assumptions are not strictly applicable, they give safe design values.
8 \
The curves o:f Figure 9 show not only the magniture of the varying pressure acting upon the cells., but also the phase differences between the cells on the different sides of' the tipping section and the miter gate. These phase differences show how the pr essures on the miter gate become unbalanced. At a given instant· the pressure may be of a _ certain magni�ude on the inside of the gate while it � be greater or less on the outside of the gate. In a study of these curves it was noted that two · di stinct types of' wave �ction occurred, depending upon the d�pth of water over the drydock tipping section. When this depth was less than 2. 5 feet (Tests No. 4 to 10) ., the waves apparently broke over · the tipping section and miter gate in such a manner that the pressure variations on the opposite sides were very irregular. This was especia.lly true of pressure variations of small magnitude, whereas the larger pressure variations, evidently caused by larger waves, retained their identity as the waves passed over the tipping section and gate. With this type of action, the :ma.:ximum pressure difference was :fo'lllld to b e about l foot o f water. At the la rger discharges and with greater depths over the gate (Tests No . 12 and 16) the wave patt·erns appeared to be more regular� especia.l.ly at the peak discharg� of 334, 000 second-feet {Test No. 16) . At this discharge the magnitude of' the pressure variation increased to nearly 2 feet of water ; however, the phase relationship of the variations at cells on each side of the gate was such that the maximum pr essure difference on the gate was approximately 0.87 :foot of water,. less than that observed at smaller discharges . The manner in which these pr essure variations occurred, with a somewhat regular phase difference, suggested that the unbalanced pr essures on the opposite sides of the gate could be related to the slope of the waves, and that the assumptions using the Navy results to estimate the pressure differem es was applicable, although conservative. In the light of these data, it -was concluded that the _ design value of 2 feet of water :for the unbalanced pressure would not be exceeded even with discharges in excess of thos e at which the tests were made •
. .
Pressure Measurements on Access Shaft No. 4 of the Caisson
The pressure variations on the access shaft of the caisson, as measured by Cells 14 to 19, and on the inside of the tower as measured by Cell 13, were not studied beyond a cursory examination of the data. The cells on the outside of the tower indicat ed a choppy, irregular wave action, and no individual wave could be traced in its passage across the tipping section and miter gate to the tower. It appeared that the waves lost their characteristics through reflection and interference. The pres sures inside the tower were in the nature of a regular surge., . considerably different from the pressure conditions on the outside. This surge had a period of approximately 7 seconds, whereas the measured period of the waves was a.bout _ ' 4 se�o��s, .. · . \ , ;, , ,
9

o. : REPORT 282
g ..,80. � ? �
�· I � 2 "" <( <(
�ODp=='l==========;;;=;=::e:;:;:,, :;:, __ :-,:,6,,""""===<(=,j====================t=====�===========l================l======�====d__-Dam ·roadway.-... ,.: . .. >-
B ICJ , ,.)O -
Ric;M ' Power plant--,::··�
\ \aeriec;:;n
{cllers· ' 1
I I
G RA N D C O U L E E D A M
4
I , WA VE MEA SURING STATIONS
-- - -�,
k.1-STAIION #2 C (/STATION
� (WAVE STA::O�� IN R����77 "".gf;_(�r line I·····
<>i , 'AT HIGHWA Y BRIDGE)'
.f\lormal water surface. El. 945.00--- ·,
Sheaves for ____ _ _______ _Jif!.!� 2 and 7 · ·:··- ---:::- .
:. . Left ��-.Power Plant
----
'
t
- - - C - - .PU..,,..,.,,& j
-.--. I
PULLER No. 7--' { \._ ---- - Gantry platform '· DULLER No. 2
I MANE.UVERING CAISSON AT ORYDOCK
· Cmsson is float111q in drydock (solid lines) and is first moved to timber fender (dotted lines).
Connect line ® to center of stern of caisson as shown
2. Open qate and connect line ® . 3. Pull caisson out of drydock by means of line ®
to position between fenders as shown thus------4. Fasten line ® and attach line @) to an chor ,a t
Sta. A28 •85 ; 84• 33 5. Pull caisson forward by means of line ® to.
position shown thus -- -- -6. Attach· Imes CD,® and © 1 Move caisson. forward approximately /00 fee f,
and then disconnect lines ® ancl @). 8. Cais!jOn is now reacly to be man.euvered · to
dam.
II. MANEUVERING CAISSON FROM DRYDOCK TO DAM.
Use Imes 0, 0. 0, © and ® to follow course determine/i by model.
1��! 11 lttls? I I 3Y°
SC� ' OP �_£'T
S ECTI ON A � A
F'IGUR� I
,-Floatinq ' caisson
DI MAN£UVE. RING CAISSON AT DAM
Caisson has been maneuvered to the clam opposjte sheave for line 3 (solid lines) and shall be moved. say 200 feet west, where · repairs are to be made ( doffed lines}
I. Lines CD, 0,@1,0 and ® are holdinq caisson. 2. Attach lines �
� ® and @) as shown.
3 . . O,sconnect lines I ancl @. 4. To move caisson enqthw1se in bucket, pay
out lines @,@,@· and ® and take in lines 0 Q) and @).
5. When caisson · is in approximate position, pull towards dam with line @, pay out line © and slack off line (i) but leave conuecfed for safety
6. AciJ.!!st latera//osition of caisson with lines (g)_(z) ® an ®, pull caisson up with line @), lower and connect 'A' frame to anchor on dam. .
7. Disconnect lines @ @ @ and ®· Line ® remains for safety
8. Caisson ready for sinkinq operations.
Hors:- Line @) opercrred from barqe.
UHITl!Q STATE S 0£PARTMENT OF TH« INTERIOR
BUREAU OF. Rl!CL.AAMTION COI.UllfJIA MSIH PftOJECT- WASH.
. GRANO COULEE DAMI .. AINT/ff#Al#CIE Of' SPILLWAY BUCKET
FLOATING CAISSON DY Of' MANEUVERING OPERATIONS

/. -- - -Cover over oil pipes Anchor castinqs .. __
Drydock wall --- - - - -· .6--�-� --- ------------- -----32 ' O " - --- ---- ------ - -
6�.,o ,. _ _____ _ - - --- --32 ' O" - - - -- - ------ --- - -
-
---
-
_
.--i "Brass pipe for "=>-�l"'"'l--,V..___ / pinfle lubrication 1
--· --<f Dr-ydock
··Hydraulic pperatinq A mechanism
A L-
U·bolts for lashinq leaves when operatinq mechanism is remove�,;--.,
C ;
P L A N
�,_9 , , 1 1 T 1 , 1 r 1P
SCALE. OF FE.E.'T
/.- -Hydraulic o·peratinq mechanism
Quoin castinqs- --- -------
Quoin con fact blocks - - --- -- -- - - -
Pint/e castinq----- - _ _ _
E. r · . : - : _ : . ·. ·. ·
· · -: o:·. -: :_:_ · -. . . . "·
I I I
i
I I , I
: I I
I I I
' ' I
:
; (_:/
. ---· - Leaf 2 -- - - - -··
_.,- b
,--f'
--- -Miter contact blocks I I I Miter msfinqs -- ------ - -: : ! , ,, . . ,,. . ... .. i Brass pipe for
1
lubrication of pinfle
, El. 902. 50 -..
. . 'v
ELEVATION
,-- · · Rubber seal
r, .
A - A
_J
t
- · . , : · . ·.',-< ---Quoin bearinq column - QC! ' Quoin bearinq column - QCJR _ _ _ _ _ ___ ____ �- · ·; ........
Quo,-n wsfinq·------ ----- --:_
Miter contact blocks-.
F IGURE 2
_ o
-�-- -- -Anchor CC1sfinq frames -AF!
: P¾------·.::.:>· �--- -- - - -orydock wall
I
Quoin contact block __.-\ '-· ·Quoin contact block
I I i
, I -<_ •• (:,
�
Anchor bolts -Bl
_jA
···Hydraulic operafinq mechanism.
i I G t . ·t · : �----- - a e m open pos, JOn L .J
P.
·.;
. -, b . ·. '( .
. . ,:,
·,
f Brass pipe for . _./ pm fie lubrrcafJOn -
Mder cash1qs -- --·
:,._Skin plates
_.-- - - -- ·Seal plafe - SP/ L
EJ 902.50 - -c:-- --
- ·Miter casfinqs
S£. CTION D - D
Seal plafe - SP! " - - - - - ---- __ _
El. 905.00 -- -;:-.,--.. ..,..
Pin tie cas tinq-- ---------.::
Wood block--- --------�
, ··seal anq/e-SAJ" ··-. Rubber seal
·· .. . __ Seal anq/e -SA2
SECTION E. - E.
_.-·Anchoraqe bar
n=F=i::;;::::::::;;;::=:::n:=;;=::::::;:;:=n=:::::;;=::;;::J�����::r-
-:::----;----c.;.--c1---· £/ 959.50 . . 0 • . • . . � .
0 ' ·'· ··Pipes for mechanism
RE.FERENCE DRAWINGS
DRYDOCK ________ _ _ _ __ _ __ 222-D · 9314 TO 93 1 7 INCL.
MIT£R GAT£ _ _ __ _ _ _ _ ___ 222 ·D· 9423 ro 9427 INCL.
MITER GATE. OPERATING MECHANISM .. 222-D -9�82 TO 9486 INCL.
o f I -- - ;-- Quoin castinqs
' -
· ----- Quoin confacf blocks
Boffom of drydock El. 905.00 ---- ._
UNITED STAT£S DEPARTMENT OF THE INTERIOR
BUREAU OF RECLAMATION
COLUMBIA BASIN PROJECT- WASHI NGTON
, £ . y
·_v · .
\ £/. 905. 00 -··:.:.·-::,.__8�,t;;;;;;;;;;;;;;;;;;:;U;;;;;;;;;;;;;;;;;;;;;;;;;;J.l;;;;;;;;;;;;;���, casfinq
.-�-/���-- - -- - Rubber seal : • · -.;,
Seal anqle : · ;; · · ·� - Wood block--:-· ·. "-'··::. -Pin fie shoe
S E. CT/ ON B · B £.LE.VAT/ON C - C
GRA N D COU L EE D A M M A I N T E N A N CE OF SPILLWAY S U C K ET
DRYDOCK M I TER GATE
GENERA L I N S TA LL A TI O N ASSEMBLY
CHECKED
• !- .. -
,,. ,
I
A. TJMBER WEDJ.E STRUTS BEI'WEEN TIPPING
SECTION AND MITER GATE LEAVES .
-
, · .
B . PRESSURE CELL INSTALLATION
IN TIPPING SECTION.
FIGURE 3
P L A N ViEYLDRYDOCK i; CAISSON
, , (
, ,
CELLS 16 i J]--c./ '{ 1'·CE L LS 15 i 1 8
N o. 4 A � C E . .S S T OW E R
- ----c E L L s·- - ---- - --- - ---- - -. l:J . · . . · ·. • D • . • •• ·i> · . · . C". . . . 17 · . . . p .
: _· -� _-_._ _ . _ ·_ ._; . · . . · _ . o ·_ · · o
ACCESS TWR. N0. 4 W.S. VA RI E D FROM E l . 970 . 6 T ! P P l0N G S EC T I O N TO E L . 95 8 . 8------------------- - ,, '
I I
SK IN PL . - ,
15 '-o" r-ro -f-M ,TER -COL�->-
:CEL L No . I I
(PRESSURE C E L L S
RI VE TS· ---
BOL T--,-: I I
STRAP _,
M l T·E R· -6 AT E C.E L.L S E' L . . 9 S 7.
11 1 I I 1 1 1 2- -�-+- rc-2 -
4 . I I 4 ' '
·
1
·-
--
-......
'-, PRESSUR� CELLS:,
,/ I , ,,,,. --_ "'
k_,,--GAGE '
'
+ -STRAP
F I G U R E 4
CE l LS· ---,-,-�17- 19 ,-·EL . 970. 00
-·El . 955.00
,-C E L L S, M I T E R GAT E C E L LS E L . 9 2 2 . a 9 4 2 .
B - M O U N T I N G S FOR P R E S S U R E C E L L S
. . . u .
I I I
\\.1 3 - 16
I . I L _ _ · - - - - - - _ _ _ _J
C A I SS O N
M ITER GATE·, : : I I
�-I
/ 1 2� 1 1 __ b.::.....p�5=---_i_'-·E L . 957. 81 y --
1 0 9
8 7
. . . 4 . .-. : _ . 3
· · (!-- . 2 · . ·• . I
,-E l . 9 �- 2 . 33 I
,- E L . 922 .58
S E C TI ON A-A
A- L O C AT I O N OF P R E S S U R E C E L L S
GRA N D COULEE DAM WAV E S T U D I E S
PRESSURE CONNECTION-- - - ,
PRES S U R E CE L L I N S TA L L AT I O N - D R YDOCK a CAISSON
I I I
,750l/1 OSCI L LATOR ,-· C OPPE R OXIDE B R IDGE / TYPE REGT I F IER
I
C-PR ESSURE CELL AND CIRCUfT
:r 0.. .q 0:: (!) 0 "...J ...J
0 VJ
0

-----.----
A. PRESSURE CELL INSTALLATION-MITER GATE EL. 957 . 81
FIGURE 5
B . PRESSURE CELL INSTALLATION-MITER GATE EL . 942 . 33 & 922 . 58
H3 -.... � .. ,.,.. ""' 10
------ 16
I\ - - 1 5
--- 14
r-i-, "'"- 1 '--, _
12
r .
' � I
I I I
20.5 21.0 2 1.5 ,l. 2�,c
· ' ·
��-- - -- -
----
---- -----
,, .... --- -
---
--------
I I 29.5 30.0 30.5 31.0
,_...., �I'-, -... -f-.. f- -
--
c-- :.-� ... ...... __ ....
I
I !
tt.� 23.0
---� --
--
I 1 1 I
-i-.. ---
23.5
- -
l.-
..., ....
--
i,.-i.-L--i.--
--L---
----�- -i-..i,... -� ..__
-i---
24 0 24.5 25.0
''.:.. _.,,.., ---,o ---16
.... .z._ 1 5 4
I I
,2 --9
I
31.5 32 0 32.5 33.0 33.5 34.0
GRAND COULEE DAM
WAVE STUDIES
OSCILLOGRAPH RECORD
TEST N0. 10
I
J3 --i-.. .. ---..... __ _,... ... -
--..... -,.. -.... ; ....... -..... - ---- c-i..--.... -_i-- 1 5 - -
i-,, .., 1 4 ......
.... i... .... ... I I --.... _.,. -
012 -
25.5 26.0 265 270 27.5 211.0 2&!5 29:0:
I
I I
..... I
--... �-,... ..... ----.... --
......... -------
-....... - - :.-----
--
;
i I i 34.� 35.0 35.5 36.0 36.5 37.0 37.5 ;,ao
II,
(/) .., 2 :,: __
0 z
C e l l No.
I FEET s WATER
o '----=c----�-----;;.;,---=--20 40 60 10 20 30 40
(/) ..,
P. S. I .
�----+-�-�-+---- -+-- -- --< z
F EET- WATER
oL----2""1g'----=;"-�----'�"'o---:"=o
P. S. I.
(/) "' :,: 0 z
V> "'
20 10
C e l l No. 7
I F E E T - WATER
40 20
P. S . I.
I I
60 BO 30 40
2 �---�A---+- - --+ -- -� z
I--,¥--�- C e l l No. 10 - -+1- -- ---<
F E E T J WATER i 20 10
40 60 20 30
P. S. I . 40
0
V> "' �--- -,4'---+--- -+-- -----j z
V> "'
20 10
C e l l No. 2
I FEET - WAT ER
4 0 60 BO 20 30 40
P. S. I.
2 � ---��7�r--- �-�--1 z
10
V> "'
F E ET - WATER 40 20
P. S.I.
60 80 30 40
2 :,:
0
0 �
C e l l No. 8
I F E E T - WATE R
20 40 60 BO 10 20 30 40
P. S. I .
(/) "' � -- -t--,,C....,,��-- --+ - ---1 z
>- - -H- - �- Ce 1 1 No . 1 1 - -+-----<
I F E E T - WATER
0 '----2"'1i'-----'-:�=-----'�'-"�---'!=�
P. S. I .
F IGURE 7
C e l l No. 3
I FEET - WATER
20 40 60 BO 0 1 0 20 30 40
P. S. I.
I F E ET - WATER o'----
2"'1g'------":'----"�"-�-----':"""o
P. S. I .
V> "' :,: 0 �
C e l l No . 9 --+----<
F E E T - WATE R 40 60
1 0 20 30 P. S. I.
G R A N D COULEE DAM
W A V E S T U D I E S
P R E S S U R E C E L L D E F L E C T I O N C U RVES
80 40
I
4 4
3 3
1/) .., 2 :,:
<)
!
Ce l l No. 12
I FEE T - WATER
20 40 60 80
10 20 30 40 0
P. S. I .
4 4
3 3
<II "' 2 % __ __ .....,_ <) 2
C e l l No. 1 5
f I I FEET - WATE R 20 40 60 80 10 20 30 40 0
P. S. I.
4 40
3 30
<II
2 ; - -- + - 2 0
I
Ce l l No. 18 10
I I F E E T - WATER
0 20 40 60
10 20 30 0
P. s. :c .
4
3
.. <II "' 2 :,:
<)
Ce l l N o . 1 9
I FEET • WATE R
2 40 60 0 10 20 30 40
P. S. I .
4
3
1/) 1/) .., "' :,: :,: <) <)
! !
C e l l No. 1 3 Ce l l No. 1 4
I F E E T - WATER FEET - WATER
20 40 60 80 20 40 1 0 20 30 40
0 1 0 20 P. S.I. P. S. I.
4
3
<II "' "' :,: 2 � <)
! z
C e l l No. 1 6 No. 17
I FEE T - WATE R FEET - WATER
20 40 60 80 20 40
., 20 30 40 0 10 20
P. S.I. P. S .I .
-- - - - --· - - -
� �
..; _.,. ell ---
II: /" �
__.,.,,,,-
� �
---
1 0 20 30 40
F E E T • WATER 50
G R A N D C O U L E E D A M
WAVE STU D I ES
60
PRESSURE CELL DEFLECT I ON CU RVES
10
F IGURE 8
60
30 40
60 80
30 40
�
80

FIGURE 9
d
..
DEFLECTION IN INCIDS

i I
..
. .
,,. . . ' '
I
' . '
··it
.-
\
• '
' '
I'