hydro-mechanical behaviour of bentonite pellet mixtures
TRANSCRIPT
www.elsevier.com/locate/pce
Physics and Chemistry of the Earth 32 (2007) 832–849
Hydro-mechanical behaviour of bentonite pellet mixtures
C. Hoffmann, E.E. Alonso *, E. Romero
Dept. of Geotechnical Engineering and Geosciences, Universitat Politecnica de Catalunya, c/ Jordi Girona 1-3, 08034 Barcelona, Spain
Received 25 April 2005; received in revised form 11 April 2006; accepted 26 April 2006Available online 23 October 2006
Abstract
Granular mixtures made of high-density pellets of bentonite are being evaluated as an alternative buffer material for waste isolation.Ease of handling is an often-mentioned advantage. The paper described the experimental program performed to characterize the hydro-mechanical behaviour of compacted pellet’s mixtures used in the engineered barrier (EB) experiment.
The material tested in the laboratory was based in the pellet’s mixtures actually used for the emplacement of the EB in situ experiment.Grain size distribution was adjusted to a maximum pellet size compatible with the specimen’s dimensions. Dry densities of statically com-pacted specimens varied in most of the cases in the range: 1.3–1.5 Mg/m3. Pellets had a very high dry density, close to 2 Mg/m3.
The outstanding characteristic of these mixtures is its discontinuous porosity. Pore sizes of the compacted pellets vary around 10 nm.However the inter-pellet size of the pores is four to five orders of magnitude higher. This double porosity and the highly expansive natureof the pellets controlled all the hydraulic and mechanical properties of the mixture.
Tests performed include infiltration tests using different water injection rates and mechanisms of water transfer (in liquid and vapourphases), suction controlled oedometer tests and swelling pressure tests. The interpretation of some of the tests performed required back-analysis procedures using a hydro-mechanical (HM) computer code.
Material response was studied within the framework of the elastoplastic constitutive model proposed by Alonso et al. [Alonso, E.E.,Gens, A., Josa, A., 1990. A constitutive model for partially saturated soils. Geotechnique 40 (3), 405–430] (Barcelona Basic Model,BBM). Parameters for the model were identified and also a set of hydraulic laws necessary to perform coupled HM analysis.� 2006 Elsevier Ltd. All rights reserved.
Keywords: Bentonite; Laboratory tests; Laboratory equipment; Partial saturation; Suction; Granular mixture
1. Introduction
Within the framework of the engineered barrier (EB)project (AITEMIN, 2001), a bentonite based pelletizedmaterial has been considered as an alternative buffer mate-rial for the isolation of high-level radioactive waste. Theaim of using bentonite-crushed pellets as filler material inthe construction of engineering barriers, is to improve someaspects of the barrier emplacement operations and avoidsome of the difficulties experienced in alternative conceptspreviously tested. As the bentonite pellet mixtures can beemplaced using pneumatic projection techniques, the back-
1474-7065/$ - see front matter � 2006 Elsevier Ltd. All rights reserved.
doi:10.1016/j.pce.2006.04.037
* Corresponding author. Fax: +34 934017251.E-mail address: [email protected] (E.E. Alonso).
filling operation becomes an easier and potentially robot-ized procedure. Using this granular material as filler, thegap between the host rock and the buffer usually foundwhen working with full bentonite block barriers it alsominimized (ENRESA, 2000).
The ‘‘EB’’ project integrates two main groups of exper-imental activities, a real scale test performed at the under-ground laboratory of Mont Terri (Switzerland), and acomprehensive laboratory experimental programme. Thefield experiment has also been simulated as reported byAlonso and Hoffmann (2005). Fig. 1 shows a cross sectionof the proposed disposal concept and a scheme of the dif-ferent activities performed within the project.
The aim of this paper is to present the main results of theexperimental programme performed to characterize thehydro-mechanical response of compacted pellet’s mixtures.

Fig. 1. EB Project. Scheme representing the different activities involved in the project. Cross section of the disposal tunnel, simulated tunnel and buffer.
C. Hoffmann et al. / Physics and Chemistry of the Earth 32 (2007) 832–849 833
A number of experimental issues for barrier performancewere considered when the experimental program wasdefined: the expected saturation time of the barrier, theevolution of permeability, the water retention propertiesof the mixture, the effect of suction on mixture compress-ibility and the development of swelling pressure. Giventhe wide range of suctions involved from the initial drystate to the fully saturated situation, several suction controltechniques have been handled. A good proportion of thetests reported were performed in special cells designed spe-cially for the envisaged tests.
Due to the small amount of free water available in thehost clay shale formation (Opalinus clay), an artificialhydration system was needed in order to saturate the bufferwithin reasonable testing times. The saturation process was
Fig. 2. Scheme of the artifi
forced by injecting liquid water into the buffer material bymeans of a system of interconnected tubes, Fig. 2. Tubesare connected in such a way that the water goes into thematerial from the front to the back of the small emplace-ment tunnel and from the floor to the roof.
The paper starts with a description of the pellet fabrica-tion process, sample preparation procedures and the fabriccharacteristics of the bentonite pellet mixtures. Results onswelling pressure and saturated permeability are thengiven. The hydro-mechanical response of the material dur-ing the hydration process, is discussed on the basis of infil-tration and suction controlled tests performed in specialoedometer cells. Results are interpreted within the frame-work of a constitutive elastoplastic law, which seems tobe well suited to describe the pellet’s mixtures.
cial hydration system.
Grain size distribution of tested material
max min max
min max1
D D D Dp
D D
−=
−
0.2
0.4
0.6
0.8
1
Fra
ctio
n pa
ssin
g, p
Dmax.= 4 mmDmax.= 10 mmD = 15 mm
4 mm10 mmDmáx. = 15 mm
834 C. Hoffmann et al. / Physics and Chemistry of the Earth 32 (2007) 832–849
2. Tested material
2.1. FEBEX bentonite and pellet fabrication procedure
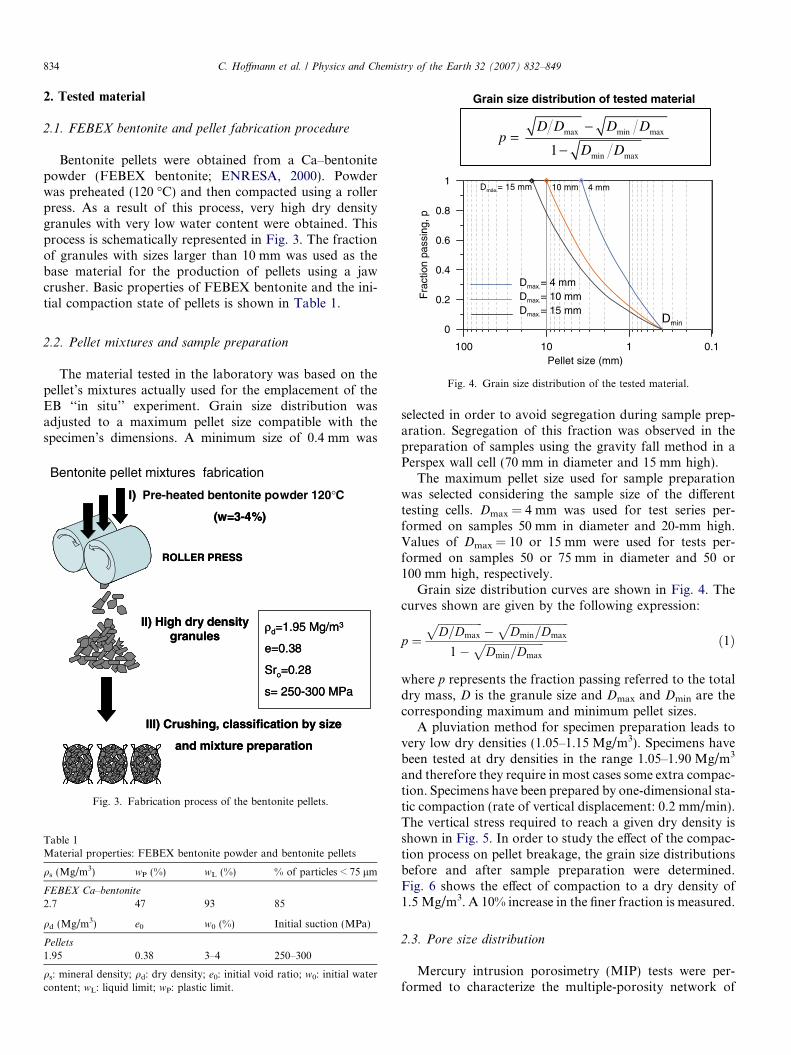
Bentonite pellets were obtained from a Ca–bentonitepowder (FEBEX bentonite; ENRESA, 2000). Powderwas preheated (120 �C) and then compacted using a rollerpress. As a result of this process, very high dry densitygranules with very low water content were obtained. Thisprocess is schematically represented in Fig. 3. The fractionof granules with sizes larger than 10 mm was used as thebase material for the production of pellets using a jawcrusher. Basic properties of FEBEX bentonite and the ini-tial compaction state of pellets is shown in Table 1.
100 10 1 0.1Pellet size (mm)
0
max. Dmin
Fig. 4. Grain size distribution of the tested material.
2.2. Pellet mixtures and sample preparation
The material tested in the laboratory was based on thepellet’s mixtures actually used for the emplacement of theEB ‘‘in situ’’ experiment. Grain size distribution wasadjusted to a maximum pellet size compatible with thespecimen’s dimensions. A minimum size of 0.4 mm was
I) Pre-heated bentonite powder 120°C
(w=3-4%)
II) High dry density granules
ROLLER PRESS
III) Crushing, classification by size
and mixture preparation
ρd=1.95 Mg/m3
e=0.38
Sro=0.28
s= 250-300 MPa
I)
(w=3-4%)
II) High dry density granules
ROLLER PRESS
III) Crushing, classification by size
and mixture preparation
ρd=1.95 Mg/m3
e=0.38
Sro=0.28
s= 250-300 MPa
Bentonite pellet mixtures fabrication
Fig. 3. Fabrication process of the bentonite pellets.
Table 1Material properties: FEBEX bentonite powder and bentonite pellets
qs (Mg/m3) wP (%) wL (%) % of particles < 75 lm
FEBEX Ca–bentonite
2.7 47 93 85
qd (Mg/m3) e0 w0 (%) Initial suction (MPa)
Pellets
1.95 0.38 3–4 250–300
qs: mineral density; qd: dry density; e0: initial void ratio; w0: initial watercontent; wL: liquid limit; wP: plastic limit.
selected in order to avoid segregation during sample prep-aration. Segregation of this fraction was observed in thepreparation of samples using the gravity fall method in aPerspex wall cell (70 mm in diameter and 15 mm high).
The maximum pellet size used for sample preparationwas selected considering the sample size of the differenttesting cells. Dmax = 4 mm was used for test series per-formed on samples 50 mm in diameter and 20-mm high.Values of Dmax = 10 or 15 mm were used for tests per-formed on samples 50 or 75 mm in diameter and 50 or100 mm high, respectively.
Grain size distribution curves are shown in Fig. 4. Thecurves shown are given by the following expression:
p ¼ffiffiffiffiffiffiffiffiffiffiffiffiffiffiffiffiD=Dmax
p�
ffiffiffiffiffiffiffiffiffiffiffiffiffiffiffiffiffiffiffiffiffiDmin=Dmax
p1�
ffiffiffiffiffiffiffiffiffiffiffiffiffiffiffiffiffiffiffiffiffiDmin=Dmax
p ð1Þ
where p represents the fraction passing referred to the totaldry mass, D is the granule size and Dmax and Dmin are thecorresponding maximum and minimum pellet sizes.
A pluviation method for specimen preparation leads tovery low dry densities (1.05–1.15 Mg/m3). Specimens havebeen tested at dry densities in the range 1.05–1.90 Mg/m3
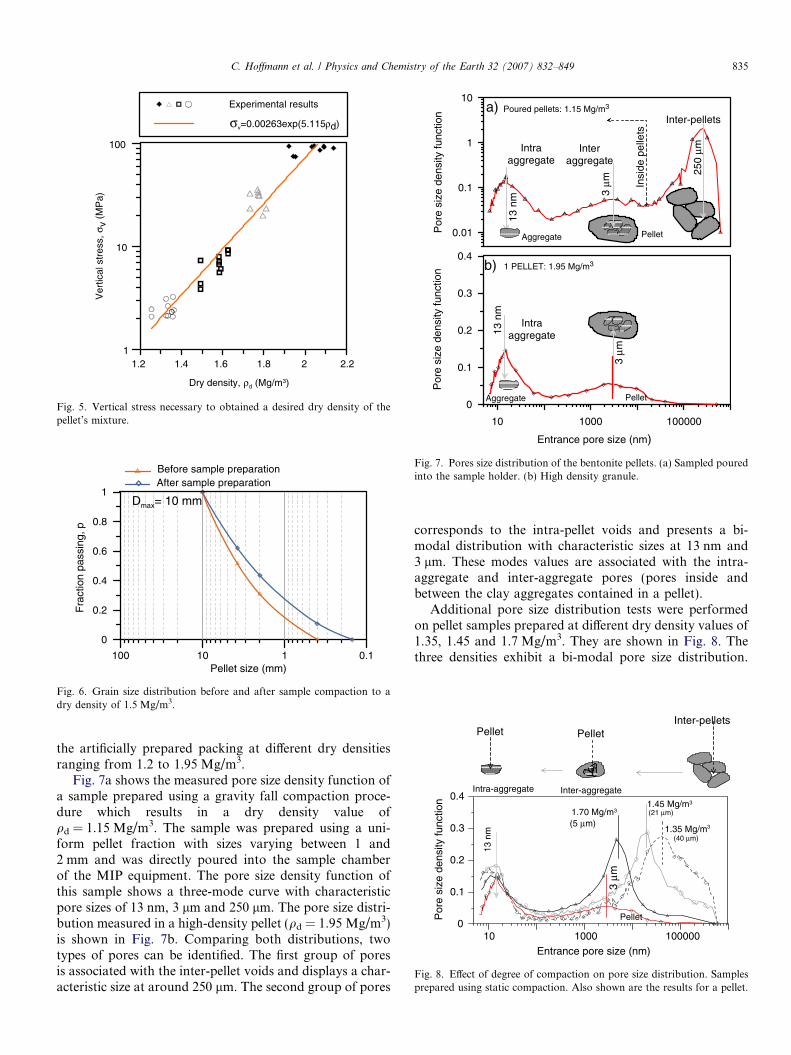
and therefore they require in most cases some extra compac-tion. Specimens have been prepared by one-dimensional sta-tic compaction (rate of vertical displacement: 0.2 mm/min).The vertical stress required to reach a given dry density isshown in Fig. 5. In order to study the effect of the compac-tion process on pellet breakage, the grain size distributionsbefore and after sample preparation were determined.Fig. 6 shows the effect of compaction to a dry density of1.5 Mg/m3. A 10% increase in the finer fraction is measured.
2.3. Pore size distribution
Mercury intrusion porosimetry (MIP) tests were per-formed to characterize the multiple-porosity network of
1.2 1.4 1.6 1.8 2 2.2
Dry density, ρd (Mg/m3)
1
10
100
Ver
tical
str
ess,
σv
(MP
a)
σv=0.00263exp(5.115ρd)
Experimental results
Fig. 5. Vertical stress necessary to obtained a desired dry density of thepellet’s mixture.
100 10 1 0.1Pellet size (mm)
0
0.2
0.4
0.6
0.8
1
Fra
ctio
n pa
ssin
g, p
Before sample preparation
Dmax= 10 mm
After sample preparation
Fig. 6. Grain size distribution before and after sample compaction to adry density of 1.5 Mg/m3.
3μm
0.01
0.1
1
10
Por
e si
ze d
ensi
ty fu
nctio
n
Intraaggregate
13 n
m
Interaggregate
Pellet
250
μm
Inter-pellets
Aggregate
Insi
de p
elle
ts
a)
10 1000 100000
Entrance pore size (nm)
0
0.1
0.2
0.3
0.4
Por
e si
ze d
ensi
ty fu
nctio
n b)
Pellet
Intraaggregate13
nm
Aggregate
3μm
1 PELLET: 1.95 Mg/m3
Poured pellets: 1.15 Mg/m3
Fig. 7. Pores size distribution of the bentonite pellets. (a) Sampled pouredinto the sample holder. (b) High density granule.
10 1000 100000
Entrance pore size (nm)
0
0.1
0.2
0.3
0.4
Por
e si
ze d
ensi
ty fu
nctio
n
Inter-pellets
(40 μm)
(21 μm)
Pellet
(5 μm)
13 n
m
3μm
1.35 Mg/m3
1.70 Mg/m31.45 Mg/m3
Pellet
Intra-aggregate Inter-aggregate
Pellet
Fig. 8. Effect of degree of compaction on pore size distribution. Samplesprepared using static compaction. Also shown are the results for a pellet.
C. Hoffmann et al. / Physics and Chemistry of the Earth 32 (2007) 832–849 835
the artificially prepared packing at different dry densitiesranging from 1.2 to 1.95 Mg/m3.
Fig. 7a shows the measured pore size density function ofa sample prepared using a gravity fall compaction proce-dure which results in a dry density value ofqd = 1.15 Mg/m3. The sample was prepared using a uni-form pellet fraction with sizes varying between 1 and2 mm and was directly poured into the sample chamberof the MIP equipment. The pore size density function ofthis sample shows a three-mode curve with characteristicpore sizes of 13 nm, 3 lm and 250 lm. The pore size distri-bution measured in a high-density pellet (qd = 1.95 Mg/m3)is shown in Fig. 7b. Comparing both distributions, twotypes of pores can be identified. The first group of poresis associated with the inter-pellet voids and displays a char-acteristic size at around 250 lm. The second group of pores
corresponds to the intra-pellet voids and presents a bi-modal distribution with characteristic sizes at 13 nm and3 lm. These modes values are associated with the intra-aggregate and inter-aggregate pores (pores inside andbetween the clay aggregates contained in a pellet).
Additional pore size distribution tests were performedon pellet samples prepared at different dry density values of1.35, 1.45 and 1.7 Mg/m3. They are shown in Fig. 8. Thethree densities exhibit a bi-modal pore size distribution.
836 C. Hoffmann et al. / Physics and Chemistry of the Earth 32 (2007) 832–849
The group of small size pores is common to all dry densitiesand it corresponds to the pores inside the clay aggregates.The group of largest pores has a dominant size controlledby the level of specimen packing.
The set of results given indicates that the pore structureof a compacted specimen made of high-density pellets maybe described as a superposition of pore networks withwidely different sizes. The smaller group of pores (microp-ores) remains essentially constant as the compaction inten-sity changes. Changes in dry density result only in changesin the intra-pellet porosity (macropores).
The EB experiment does not involve heating of the buf-fer and therefore the effects of temperature on pellet aggre-gates are not covered in this paper. Pusch et al. (2003)reported that hot vapour with temperatures in excess of110 �C leads to a reduction of the swelling pressure ofhighly compacted pellets of MX-80 bentonite. They attrib-uted the reduction of swelling potential to the formation ofsilica cements between clay lamellae. Under room temper-atures, however, pellet mixtures and compacted blocks ofCalcium FEBEX bentonite having the same dry densityexhibited the same swelling pressure.
1 1.2 1.4 1.6 1.8 2
Dry density, ρd (Mg/m3)
1E-015
1E-014
1E-013
1E-012
1E-011
1E-010
1E-009
1E-008
Per
mea
bilit
y, k
w (
m/s
)
FEBEX bentonite
PELLETS
Experimental results
Fig. 9. Saturated permeability of bentonite pellet mixtures prepared atdifferent dry density values.
3. Experimental programme
In Performance Assessment exercises concerning thelong term behaviour of waste repositories it is a usualassumption to consider fully saturated buffer. Processunderstanding requires, however, information on the tran-sient wetting period. Some tests were designed to obtainbasic properties (permeability, swelling pressure) for thefully hydrated material and for different initial states ofthe mixture (dry densities). The majority of tests performedaddressed, however, the response during the wetting stagewith or without suction control.
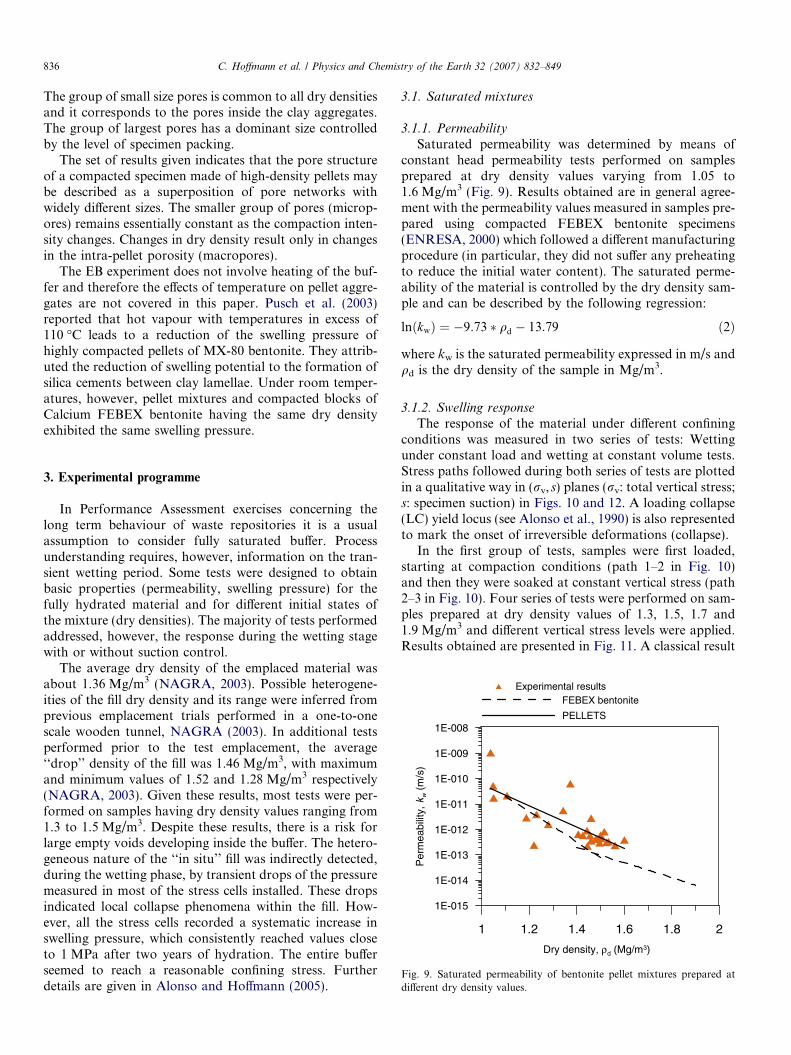
The average dry density of the emplaced material wasabout 1.36 Mg/m3 (NAGRA, 2003). Possible heterogene-ities of the fill dry density and its range were inferred fromprevious emplacement trials performed in a one-to-onescale wooden tunnel, NAGRA (2003). In additional testsperformed prior to the test emplacement, the average‘‘drop’’ density of the fill was 1.46 Mg/m3, with maximumand minimum values of 1.52 and 1.28 Mg/m3 respectively(NAGRA, 2003). Given these results, most tests were per-formed on samples having dry density values ranging from1.3 to 1.5 Mg/m3. Despite these results, there is a risk forlarge empty voids developing inside the buffer. The hetero-geneous nature of the ‘‘in situ’’ fill was indirectly detected,during the wetting phase, by transient drops of the pressuremeasured in most of the stress cells installed. These dropsindicated local collapse phenomena within the fill. How-ever, all the stress cells recorded a systematic increase inswelling pressure, which consistently reached values closeto 1 MPa after two years of hydration. The entire bufferseemed to reach a reasonable confining stress. Furtherdetails are given in Alonso and Hoffmann (2005).
3.1. Saturated mixtures
3.1.1. Permeability
Saturated permeability was determined by means ofconstant head permeability tests performed on samplesprepared at dry density values varying from 1.05 to1.6 Mg/m3 (Fig. 9). Results obtained are in general agree-ment with the permeability values measured in samples pre-pared using compacted FEBEX bentonite specimens(ENRESA, 2000) which followed a different manufacturingprocedure (in particular, they did not suffer any preheatingto reduce the initial water content). The saturated perme-ability of the material is controlled by the dry density sam-ple and can be described by the following regression:
lnðkwÞ ¼ �9:73 � qd � 13:79 ð2Þ
where kw is the saturated permeability expressed in m/s andqd is the dry density of the sample in Mg/m3.
3.1.2. Swelling response
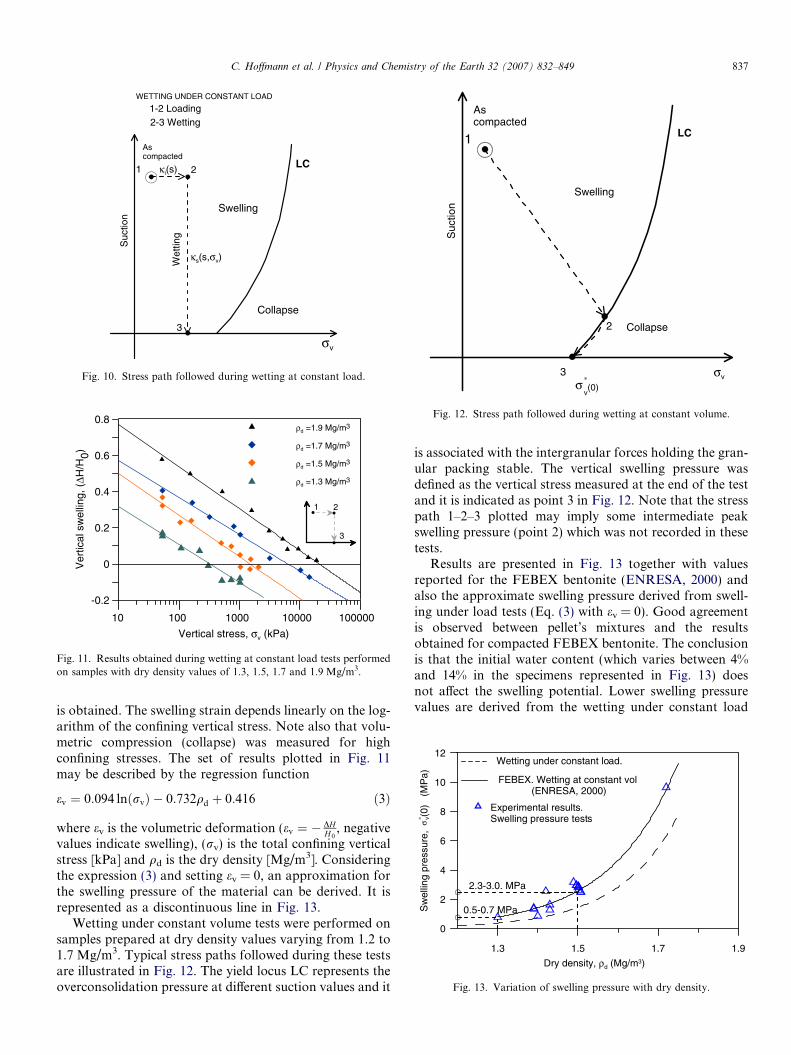
The response of the material under different confiningconditions was measured in two series of tests: Wettingunder constant load and wetting at constant volume tests.Stress paths followed during both series of tests are plottedin a qualitative way in (rv, s) planes (rv: total vertical stress;s: specimen suction) in Figs. 10 and 12. A loading collapse(LC) yield locus (see Alonso et al., 1990) is also representedto mark the onset of irreversible deformations (collapse).
In the first group of tests, samples were first loaded,starting at compaction conditions (path 1–2 in Fig. 10)and then they were soaked at constant vertical stress (path2–3 in Fig. 10). Four series of tests were performed on sam-ples prepared at dry density values of 1.3, 1.5, 1.7 and1.9 Mg/m3 and different vertical stress levels were applied.Results obtained are presented in Fig. 11. A classical result
Suc
tion
σv
Ascompacted
Swelling
Collapse
1 2
3
Wet
ting
1-2 Loading2-3 Wetting
LCκi(s)
κs(s,σv)
WETTING UNDER CONSTANT LOAD
Fig. 10. Stress path followed during wetting at constant load.
10 100 1000 10000 100000
Vertical stress, σv (kPa)
-0.2
0
0.2
0.4
0.6
0.8
Ver
tical
sw
ellin
g, (
ΔH/H
0)
ρd =1.9 Mg/m3
ρd =1.7 Mg/m3
ρd =1.5 Mg/m3
ρd =1.3 Mg/m3
1 2
3
Fig. 11. Results obtained during wetting at constant load tests performedon samples with dry density values of 1.3, 1.5, 1.7 and 1.9 Mg/m3.
Suc
tion
σv
Ascompacted
Swelling
Collapse
1
2
3
LC
σv
∗(0)
Fig. 12. Stress path followed during wetting at constant volume.
1.3 1.5 1.7 1.9
Dry density, ρd (Mg/m3)
0
2
4
6
8
10
12
Sw
ellin
g pr
essu
re,
σv* (0
) (
MP
a)
Wetting under constant load.
FEBEX. Wetting at constant vol (ENRESA, 2000)
Experimental results.Swelling pressure tests
0.5-0.7 MPa
2.3-3.0. MPa
Fig. 13. Variation of swelling pressure with dry density.
C. Hoffmann et al. / Physics and Chemistry of the Earth 32 (2007) 832–849 837
is obtained. The swelling strain depends linearly on the log-arithm of the confining vertical stress. Note also that volu-metric compression (collapse) was measured for highconfining stresses. The set of results plotted in Fig. 11may be described by the regression function
ev ¼ 0:094 lnðrvÞ � 0:732qd þ 0:416 ð3Þ
where ev is the volumetric deformation (ev ¼ � DHH0
, negativevalues indicate swelling), (rv) is the total confining verticalstress [kPa] and qd is the dry density [Mg/m3]. Consideringthe expression (3) and setting ev = 0, an approximation forthe swelling pressure of the material can be derived. It isrepresented as a discontinuous line in Fig. 13.
Wetting under constant volume tests were performed onsamples prepared at dry density values varying from 1.2 to1.7 Mg/m3. Typical stress paths followed during these testsare illustrated in Fig. 12. The yield locus LC represents theoverconsolidation pressure at different suction values and it
is associated with the intergranular forces holding the gran-ular packing stable. The vertical swelling pressure wasdefined as the vertical stress measured at the end of the testand it is indicated as point 3 in Fig. 12. Note that the stresspath 1–2–3 plotted may imply some intermediate peakswelling pressure (point 2) which was not recorded in thesetests.
Results are presented in Fig. 13 together with valuesreported for the FEBEX bentonite (ENRESA, 2000) andalso the approximate swelling pressure derived from swell-ing under load tests (Eq. (3) with ev = 0). Good agreementis observed between pellet’s mixtures and the resultsobtained for compacted FEBEX bentonite. The conclusionis that the initial water content (which varies between 4%and 14% in the specimens represented in Fig. 13) doesnot affect the swelling potential. Lower swelling pressurevalues are derived from the wetting under constant load

838 C. Hoffmann et al. / Physics and Chemistry of the Earth 32 (2007) 832–849
tests (refer to Fig. 11) and this indicates that the swellingpressure depends on the actual stress path followed bythe specimen. In other words, the swelling pressure is nota well defined material property as it has been oftenindicated.
3.2. Hydraulic response during wetting
The estimation of the total time required for the engi-neering barrier to reach an almost saturated state and thetotal amount of water incorporated during this processare relevant aspects of barrier design. An adequate answerto these questions requires the investigation of the hydro-mechanical response of the material during the hydrationprocess. In fact, the saturation process appears to be astrongly coupled hydro-mechanical phenomenon, con-trolled by the boundary conditions and characterized bystrong structural changes, which modify the granular pelletmaterial. During hydration, the pellet mixtures evolve froman almost granular structure having a high-interconnectedinterpellet porosity network, to a more homogenous mate-rial where the initial high-density expansive granules couldbe hardly distinguished. Fig. 14 shows different views of abentonite pellet samples at different degrees of saturation.The marked initial double porosity and the highly expan-sive nature of the pellets are of fundamental importanceto understand the hydraulic and mechanical properties ofthe mixture.
In order to gain insight into the hydro-mechanicalresponse of the material during wetting, different tests were
Fig. 14. Evolution of a specimen of
designed. Infiltration tests were performed in order toobtain information about the evolution of the water con-tent with suction and about the relationship between waterpermeability and the degree of saturation. The mechanicalresponse was investigated by means of suction controlledoedometer tests (loading at constant suction and wettingat constant load). Parameters have been derived for a mod-ified version of the constitutive law described in Alonsoet al. (1990) (BBM: Barcelona Basic Model).
3.2.1. Water retention curves
Water content-suction relationships were derived fromwetting at constant volume tests performed on samples pre-pared at dry density values of 1.3, 1.5 and 1.9 Mg/m3. Suc-tion was controlled in wetting paths starting at a suction of300 MPa. A vapour transfer technique was used to controlthe suction between 300 to 3 MPa. Then the axis transla-tion technique was used to reduce suction values from3 MPa to zero (saturation).
When vapour transfer is used, suction is imposed bymeans of a relative humidity control in a closed system.Water molecules migrate in vapour phase from a referencesystem of known potential to the set of soil pores, untilhydro-mechanical equilibrium is achieved. The relativehumidity of the reference system was controlled by varyingthe chemical potential of different types of aqueous solu-tions. Sulphuric acid solutions and saturated salt solutionswere used in the experimental programme. Further detailsof this technique are described in Romero (2001). Usingthis technique, the equilibrium is assumed when no mass
bentonite pellets during wetting.
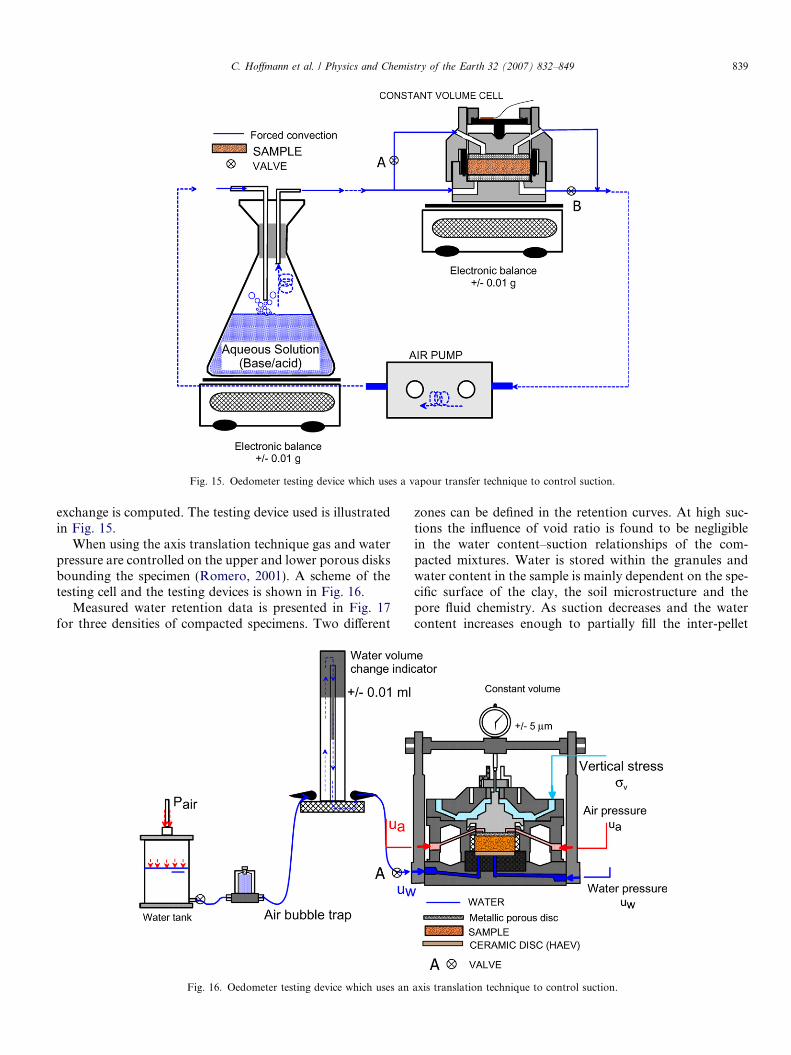
Fig. 15. Oedometer testing device which uses a vapour transfer technique to control suction.
C. Hoffmann et al. / Physics and Chemistry of the Earth 32 (2007) 832–849 839
exchange is computed. The testing device used is illustratedin Fig. 15.
When using the axis translation technique gas and waterpressure are controlled on the upper and lower porous disksbounding the specimen (Romero, 2001). A scheme of thetesting cell and the testing devices is shown in Fig. 16.
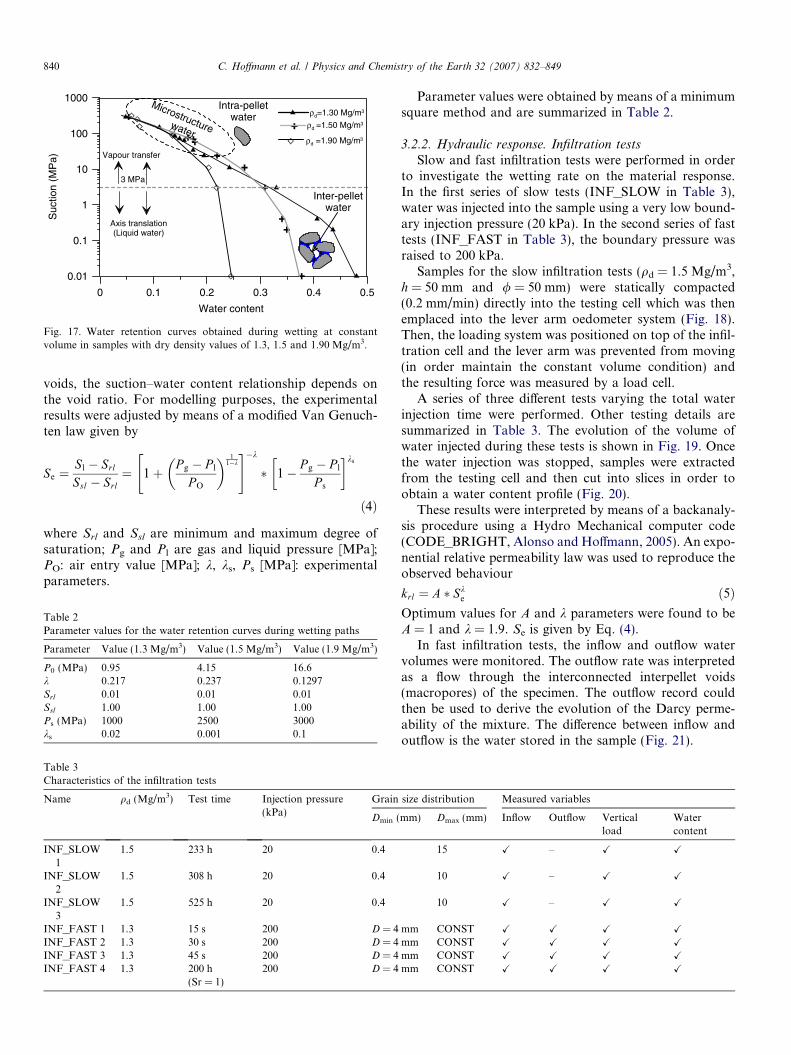
Measured water retention data is presented in Fig. 17for three densities of compacted specimens. Two different
Fig. 16. Oedometer testing device which uses an
zones can be defined in the retention curves. At high suc-tions the influence of void ratio is found to be negligiblein the water content–suction relationships of the com-pacted mixtures. Water is stored within the granules andwater content in the sample is mainly dependent on the spe-cific surface of the clay, the soil microstructure and thepore fluid chemistry. As suction decreases and the watercontent increases enough to partially fill the inter-pellet
axis translation technique to control suction.
0 0.1 0.2 0.3 0.4 0.5
Water content
0.01
0.1
1
10
100
1000
Suc
tion
(MP
a) Vapour transfer
Axis translation(Liquid water)
3 MPa
Microstructurewater
ρd=1.30 Mg/m3
ρd =1.50 Mg/m3
ρd =1.90 Mg/m3
Inter-pelletwater
Intra-pelletwater
Fig. 17. Water retention curves obtained during wetting at constantvolume in samples with dry density values of 1.3, 1.5 and 1.90 Mg/m3.
840 C. Hoffmann et al. / Physics and Chemistry of the Earth 32 (2007) 832–849
voids, the suction–water content relationship depends onthe void ratio. For modelling purposes, the experimentalresults were adjusted by means of a modified Van Genuch-ten law given by
Se ¼Sl � Srl
Ssl � Srl¼ 1þ P g � P l
P O
� � 11�k
" #�k
� 1� P g � P l
P s
� �ks
ð4Þ
where Srl and Ssl are minimum and maximum degree ofsaturation; Pg and Pl are gas and liquid pressure [MPa];PO: air entry value [MPa]; k, ks, Ps [MPa]: experimentalparameters.
Table 2Parameter values for the water retention curves during wetting paths
Parameter Value (1.3 Mg/m3) Value (1.5 Mg/m3) Value (1.9 Mg/m3)
P0 (MPa) 0.95 4.15 16.6k 0.217 0.237 0.1297Srl 0.01 0.01 0.01Ssl 1.00 1.00 1.00Ps (MPa) 1000 2500 3000ks 0.02 0.001 0.1
Table 3Characteristics of the infiltration tests
Name qd (Mg/m3) Test time Injection pressure(kPa)
Grain
Dmin (
INF_SLOW1
1.5 233 h 20 0.4
INF_SLOW2
1.5 308 h 20 0.4
INF_SLOW3
1.5 525 h 20 0.4
INF_FAST 1 1.3 15 s 200 D = 4INF_FAST 2 1.3 30 s 200 D = 4INF_FAST 3 1.3 45 s 200 D = 4INF_FAST 4 1.3 200 h
(Sr = 1)200 D = 4
Parameter values were obtained by means of a minimumsquare method and are summarized in Table 2.
3.2.2. Hydraulic response. Infiltration tests
Slow and fast infiltration tests were performed in orderto investigate the wetting rate on the material response.In the first series of slow tests (INF_SLOW in Table 3),water was injected into the sample using a very low bound-ary injection pressure (20 kPa). In the second series of fasttests (INF_FAST in Table 3), the boundary pressure wasraised to 200 kPa.
Samples for the slow infiltration tests (qd = 1.5 Mg/m3,h = 50 mm and / = 50 mm) were statically compacted(0.2 mm/min) directly into the testing cell which was thenemplaced into the lever arm oedometer system (Fig. 18).Then, the loading system was positioned on top of the infil-tration cell and the lever arm was prevented from moving(in order maintain the constant volume condition) andthe resulting force was measured by a load cell.
A series of three different tests varying the total waterinjection time were performed. Other testing details aresummarized in Table 3. The evolution of the volume ofwater injected during these tests is shown in Fig. 19. Oncethe water injection was stopped, samples were extractedfrom the testing cell and then cut into slices in order toobtain a water content profile (Fig. 20).
These results were interpreted by means of a backanaly-sis procedure using a Hydro Mechanical computer code(CODE_BRIGHT, Alonso and Hoffmann, 2005). An expo-nential relative permeability law was used to reproduce theobserved behaviour
krl ¼ A � Ske ð5Þ
Optimum values for A and k parameters were found to beA = 1 and k = 1.9. Se is given by Eq. (4).
In fast infiltration tests, the inflow and outflow watervolumes were monitored. The outflow rate was interpretedas a flow through the interconnected interpellet voids(macropores) of the specimen. The outflow record couldthen be used to derive the evolution of the Darcy perme-ability of the mixture. The difference between inflow andoutflow is the water stored in the sample (Fig. 21).
size distribution Measured variables
mm) Dmax (mm) Inflow Outflow Verticalload
Watercontent
15 X – X X
10 X – X X
10 X – X X
mm CONST X X X X
mm CONST X X X X
mm CONST X X X X
mm CONST X X X X

Fig. 18. Testing device used in slow infiltration tests.
0.01 0.1 1 10 100 1000Time (h)
0
0.2
0.4
0.6
0.8
1
De
gre
e o
f sa
tura
tion
525 h
233 h
INF_SLOW 1INF_SLOW 2INF_SLOW 3
308 h
Fig. 19. Evolution of the degree of saturation during slow infiltrationtests.
0.1 0.2 0.3 0. 4
Water content
0
0.2
0.4
0.6
0.8
1
Sam
ple
rela
tive
heig
ht, (
H/H
O)
525 h
308 h
Fig. 20. Water content profiles corresponding to slow infiltration tests.
C. Hoffmann et al. / Physics and Chemistry of the Earth 32 (2007) 832–849 841
Several tests were performed on identical samples(qd = 1.3 Mg/m3, h = 20 mm and / = 50 mm). Waterinjection was stopped at different times after the beginningof the test (Table 3). The evolution of the calculated equiv-alent permeability is shown in Fig. 22a. It can be observedthat after a short initial phase where very high permeabilityvalues are computed, the permeability decays rapidly andreaches asymptotically the saturated value at the end ofthe test. The observed behaviour can be explained in termsof the fabric evolution of the bentonite pellet mixtures. Atthe beginning of the test, the water flows through the initialopen interpellet porosity network. After this initial period,the bentonite pellets begin to swell filling the interpelletvoids and inducing a fast and strong reduction of the per-meability. The change in permeability has been plotted also
against the current degree of saturation in Fig. 22b. Theplot shows the fast destruction of the open pore networkwhen the degree of saturation increases from 0.6 to 0.7.
3.3. Mechanical response during hydration. Suction
controlled tests
3.3.1. Suction controlled oedometer cell
A special oedometer cell (Fig. 23) was designed in orderto perform suction controlled tests for a wide range of suc-tion values (Hoffmann et al., 2005). The characteristic fea-ture of this new equipment is the possibility of usingalternatively the vapour transfer or the axis translation

0.1 1 10 100 1000
Time, (s)
0
10
20
30
Cu
mm
ula
tive
wa
ter
vol.,
(m
l) WATER "IN"
WATER "OUT"
Stored water
q0
q1
q0>>q1
“in”
“out”
Fig. 21. Evolution of the cumulative inflow and outflow water volumesduring fast infiltration tests.
0 0.2 0.4 0.6 0.8 1Degree of saturation
1x10-13
1x10-11
1x10⁻⁹
1x10⁻⁷
Per
mea
bilit
y (m
/s)
1 100 10000 1000000
Time (s)
1x10-13
1x10-11
1x10⁻⁹
1x10⁻⁷
Per
mea
bilit
y (m
/s)
Ksat= 1x10-12
Sr=
0.65
Sr=
0.73
a
b
Fig. 22. (a) Evolution of the permeability during fast infiltration tests. (b)Calculated permeability in terms of the degree of saturation.
ig. 23. Testing cell and testing configuration used during suctionontrolled oedometer tests.
842 C. Hoffmann et al. / Physics and Chemistry of the Earth 32 (2007) 832–849
technique to impose a given suction. According to Romero(2001), Yahia-Aısa et al. (2001) and Cuisinier (2002), thevapour transfer technique is effective in controlling suctionin the range 300–2 MPa. The axis translation techniqueallows suction control in the range from 1.5 MPa tosaturation.
Fc
When using the vapour transfer technique, a forced con-vection system accelerates the water mass exchangebetween the soil and the saline solution reservoir. Whensuction control is changed to the axis translation modethe circuit for RH control is used to apply air pressure(Fig. 23). The design of this equipment is based on a previ-ous prototype described by Di Mariano et al. (2000) to per-

Suc
tion
Net vertical stress, ( σv- ua)
Ascompacted
1
LC
2
3
1: Loading at constant suction
2: Wetting at constant volume
3: Wetting at constant load
Fig. 24. Different stress paths applied during suction controlled tests.
10 100 1000 10000Net vertical stress, (σv-ua) (kPa)
0.01
0.1
1
10
100
1000
Suc
tion
(MP
a)1.6
1.8
2
2.2
Spe
cific
vol
ume,
v=
(1+
e)10 100 1000 10000
Net vertical stress, (σv-ua) (kPa)
1350 kPa
1610 kPaSaturated
60 MPa
λoed(sat)= 0.161
λoed(60)= 0.130
κoed(60)
0.027
κoed(60)= 0.035
κoed(sat)= 0.070
κoed(sat)= 0.064
Loading
As compacted
Wetting
Fig. 25. Effect of suction on material compressibility. Compressibilitycurves for samples prepared at a dry density of 1.5 Mg/m3.
C. Hoffmann et al. / Physics and Chemistry of the Earth 32 (2007) 832–849 843
form suction controlled tests on expansive clays. Threetypes of different suction controlled tests were performed:loading at constant suction, wetting at constant load andwetting at constant volume. Stress paths for these testsare sketched in Fig. 24.
10 100 1000 10000Net vertical stress, (σv-ua) (kPa)
0.01
0.1
1
10
100
1000
Suc
tion
(MP
a)
1.6
1.8
2
2.2
Spe
cific
vol
ume,
v=
(1+
e)
10 100 1000 10000Net vertical stress, (σv-ua) (kPa)
1260 kPa
As compacted
1610 kPa
ρd=1.3 Mg/m3
λoed(60)= 0.210
λoed(60) 0.130
κoed(60)= 0.027
κoed(60)= 0.035
κoed(60)= 0.05-0.065
Wetting Loading
ρd=1.5 Mg/m3
ρd=1.5 Mg/m3
ρd=1.3 Mg/m3
Fig. 26. Effect of initial dry density on material compressibility. Com-pressibility curves for samples prepared at dry density values of 1.3 and1.5 Mg/m3.
3.3.2. Loading at constant suction
Loading at constant suction tests were performed onsamples prepared at dry density values of 1.3, 1.5, 1.7and 1.9 Mg/m3 in order to examine the evolution of themixture compressibility with suction and with the initialdry density of the sample. Most tests were performed onsamples prepared at 1.3 and 1.5 Mg/m3 (the averageemplacement dry density was 1.36 Mg/m3, NAGRA,2003). Typical compressibility curves obtained during thesetests are shown in Figs. 25 and 26. Fig. 25 shows the effectof suction on the material compressibility whereas the effectof the initial dry density is highlighted in Fig. 26.
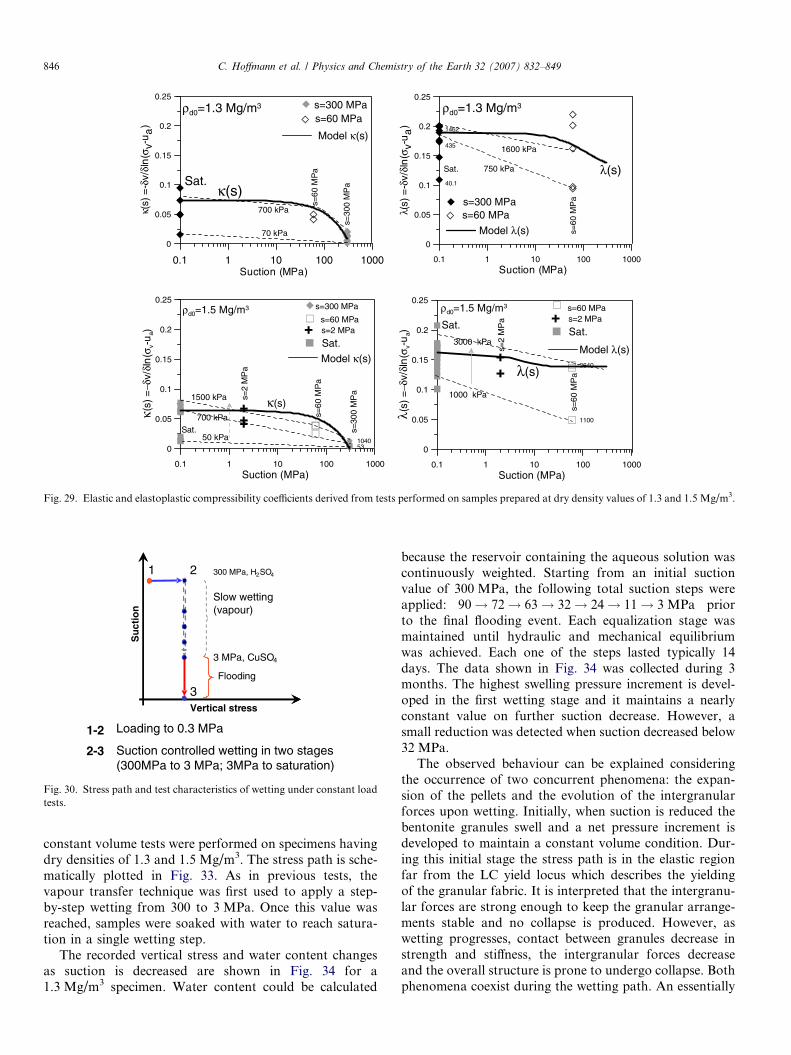
Based on these tests, the elastic and the elastoplasticcompressibility coefficients (joed and koed), and the appar-ent yield (overconsolidation) stress for different suctionswere derived. Compressibility coefficients and its evolutionwith suction are presented in Fig. 27. It can be observedthat material stiffness decreases as suction decreases. Theeffect of the confining stress is also apparent in the stiffnessparameters. The variation of the yield (overconsolidation)stress with suction is given in Fig. 28 for specimens com-pacted to qd = 1.3 Mg/m3 and qd = 1.5 Mg/m3. LoadingCollapse yield curves which fit the experimental data arealso plotted.
Material response was interpreted within the frameworkof the elastoplastic model proposed by Alonso et al. (1990).

10 100 1000 10000Net vertical stress (σv-ua), kPa
1
10
100
1000
−δln
(σv-
ua
)/δv
10 100 1000 10000Net vertical stress (σv-ua), kPa
1
10
100
1000
−δln
(σv-
ua
)/δv
s=60 MPa
Sat.
Sat.
s=300 MPa
s=60 MPa
1/λ(s) 1/κ(s) ρd0
=1.3 Mg/m3ρd0
=1.3 Mg/m3
10 100 1000 10000Net vertical stress, (σv-ua) (kPa)
1
10
100
1000
−δln
(σv-
u a)/
δv
ρd0
=1.5 Mg/m3
100 1000 10000Net vertical stress, (σv-ua) (kPa)
1
10
100
1000
−δln
(σv-
u a)/
δv
s=300 MPa
s=60 MPa
Sat.
s=60 MPa
Sat.
s=2 MPa
1/λ(s) 1/κ(s)
s=2 MPa
ρd0
=1.5 Mg/m3
Fig. 27. Evolution of the material stiffness with suction for samples prepared at dry density values of 1.3 and 1.5 Mg/m3.
0.01 0.1 1 102 3 5
Net vertical stress, (σv-ua) (MPa)
0.1
1
10
100
1000
Suc
tion
(MP
a)
AsCompacted
ρd0
=1.3 Mg/m3
Overconsolidation pressure
LC
60 MPa
0.01 0.1 1 102 3 5
Net vertical stress, (σv-ua) (MPa)
0.1
1
10
100
1000
Suc
tion
(MP
a)
Ascompacted
ρd0
=1.5 Mg/m3
LC
Overconsolidation pressure
2 MPa
Fig. 28. Evolution of the overconsolidation pressure with suction forsamples prepared at dry density values of 1.3 and 1.5 Mg/m3. Load-collapse (LC) yield surfaces are interpolated through test data.
844 C. Hoffmann et al. / Physics and Chemistry of the Earth 32 (2007) 832–849
A summary of the main features of the model is givenbelow:
3.3.3. Elastic behaviour
The volume change within the elastic domain is calcu-lated by the following incremental expression:
deelv ¼
dpKpþ ds
Ksð6Þ
where Kp and Ks are the coefficients of volume compress-ibility against changes in net means stress (p = (rm � ua);rm mean stress, ua: air pressure) and suction (s = (ua � uw);uw: water pressure), respectively. These coefficients are ex-pressed by
Kp ¼ð1þ eÞp
jið7Þ
Ks ¼ð1þ eÞðsþpatmÞ
jsð8Þ
where ji and js are parameters of the model, e the void ra-tio, and patm the atmospheric pressure. In practice, theseparameters depend on suction and stress level and the fol-lowing expressions are proposed:
jiðsÞ ¼ ji0 � ð1þ ai � sÞ ð9Þ
and
js ¼ js0 1þ asp lnp
pref
� �� �easss ð10Þ

Table 5Parameter values obtained for the yield surface fitted considering theoverconsolidation pressure values
qd (Mg/m3) r�v0 (MPa) rc (MPa)
LC yield surface r�vðsÞ ¼ rcr�
v0
rc
� � kð0Þ�jiokðsÞ�jiðsÞ
1.30 0.65 0.0751.50 1.9 0.09
C. Hoffmann et al. / Physics and Chemistry of the Earth 32 (2007) 832–849 845
3.3.4. Yield surfaces under isotropic stress conditions
The elastic behaviour is limited by means of two yieldsurfaces. The first one (LC) is associated with the irrecov-erable deformations developed during wetting and loadingpaths
p0ðs; p�0Þ ¼ pc p�0pc
� � ðkð0Þ�ji0ÞðkðsÞ�jiðsÞÞ
ð11Þ
where p�0 represents the saturated preconsolidation stressand k(s) is the slope of the virgin compression curve at suc-tion s. Parameters js0 and js0(s) are the elastic stiffnessparameters for changes in the net mean stress evaluatedat a saturated state and at suction s respectively. pc is a ref-erence stress. The model predicts an increase in the soilstiffness as the suction increases given by
kðsÞ ¼ kð0Þ � ½r þ ð1� rÞe�bs� ð12Þwhere parameters r and b control the rate of increase of soilstiffness with suction and k(0) is the slope of the virgin com-pression curve for saturated conditions.
The second yield surface provides the increase in the ten-sile strength with suction according to the expression
ps ¼ �ks ð13Þ
3.3.5. Hardening law
Irrecoverable deformations are computed through thefollowing hardening law:
deplv ¼ðkð0Þ � ji0Þð1þ eÞ
dp�0p�0
ð14Þ
The model is extended to a triaxial state (p,q) by means ofelliptical yield surfaces in the deviatoric plane (p,q). q is thedeviatoric stress.
q2 ¼ M2ðp þ psÞðp0 � pÞ ð15Þwhere M is the limiting critical state slope, which is as-sumed to be constant.
Derived model parameters are presented in Tables 4 and5. A comparison between experimental compressibilitycoefficients and the model functions adopted for compress-ibility coefficients j(s) and k(s) is shown in Fig. 29.
3.3.6. Wetting under constant load
Two wetting under constant load tests following identi-cal stress paths were performed on samples compacted to
Table 4Parameter values corresponding to the elastic and elastoplastic compress-ibility coefficients proposed in the BBM model (Alonso et al., 1990)
qd (Mg/m3) jio ai (MPa�1)
Elastic compressibility ji(s) = jio * (1 + ai * s)1.30 0.074 �0.002941.50 0.064 �0.0031qd (Mg/m3) k(0) r b (MPa�1)
Elastoplastic compressibility k(s) = k(0)[(1 � r)exp(�bs) + r]1.30 0.200 0.7 0.0081.50 0.165 0.855 0.150
1.3 and 1.5 Mg/m3. The stress path is indicated inFig. 30. After a first loading step to 300 kPa (indicated as1–2 in Fig. 30) at a constant suction of 300 MPa, a stepby step wetting path was applied using the vapour transfertechnique. Starting form an initial value of 300 MPa, suc-tion was decreased by means of different aqueous solutionsuntil a s = 3 MPa value was reached. Each suction step wasmaintained until neither volume change nor mass changewere registered in the sample. Once the minimum suctionvalue of 3 MPa was reached, liquid water was finallyinjected to achieve the saturated condition in a single wet-ting step. The evolution of volumetric deformations as thewetting progresses is represented in Figs. 31a and 32afor samples having a dry density of 1.5 and 1.3 Mg/m3
respectively.Net volumetric expansions are computed during the ini-
tial wetting steps of both tests because of the swelling of thebentonite pellets. As the suction decreases, differentresponses are observed for both densities. Volumetricexpansions are always recorded for the dry density sampleof 1.5 Mg/m3. However, the lighter specimen shows areversal in the swelling trend (Fig. 32a). It is interpretedthat during the initial wetting steps the capillary forcesholding together the granular structure are strong enoughto keep the structure stable and an overall expansion iscomputed because of pellet swelling. As the wettingadvances, the intergranular forces became reduced or evendestroyed because of suction decrease and a macrostruc-tural collapse may overcome the swelling strains associatedwith pellet hydration. This is the case of the lighter speci-men (1.3 Mg/m3) when suction reaches values below10 MPa.
This process can be interpreted in terms of the BBMmodel. In the case of the denser specimen (qd = 1.5 Mg/m3) the stress path followed is developed within the elasticdomain and net volumetric expansions are computed allalong the wetting path, Fig. 31b. In the second specimen(qd = 1.3 Mg/m3), the yield curve is closer to the imposedpath. After an initial elastic stretch where swelling defor-mations are computed, the stress path hits the yield surfaceand a collapse of the granular structure occurs, Fig. 32b.The volumetric deformation at the end of the test is, how-ever, a net expansion.
3.3.7. Wetting at constant volume tests (swelling pressure
tests)In order to gain additional insight into the swelling
properties of the mixture, controlled wetting under
0.1 1 10 100 1000Suction (MPa)
0
0.05
0.1
0.15
0.2
0.25
κ(s)
=-δ
v/δl
n(σ
v-u
a)
0.1 1 10 100 1000Suction (MPa)
0
0.05
0.1
0.15
0.2
0.25
λ(s)
=-δ
v/δl
n(σ
v-u
a)
40.1
435
1462
Sat.
s=30
0 M
Pa
s=60
MP
a Sat.
s=60
MP
a
Model κ(s)
s=60 MPas=300 MPa
λ(s)
ρd0=1.3 Mg/m3
κ(s)
70 kPa
700 kPa
750 kPa
1600 kPa
Model λ(s)
s=60 MPas=300 MPa
ρd0=1.3 Mg/m3
0.1 1 10 100 1000Suction (MPa)
0
0.05
0.1
0.15
0.2
0.25
λ(s)
=−δ
v/δl
n(σ
v-u
a)
1100
3640
0.1 1 10 100 1000Suction (MPa)
0
0.05
0.1
0.15
0.2
0.25
κ(s)
=−δ
v/δl
n(σ
v-u
a)
531040
s=30
0 M
Pa
s=60
MP
a
s=2
MP
a
Sat.
s=60
MP
a
Sat.
s=2
MP
a
50 kPa
1000 kPa
3000 kPa
ρd0=1.5 Mg/m3
1500 kPa
700 kPa
Sat.
s=60 MPas=2 MPa
Sat.
s=60 MPas=2 MPa
s=300 MPa
κ(s)
Model λ(s)
ρd0=1.5 Mg/m3
Model κ(s)λ(s)
Fig. 29. Elastic and elastoplastic compressibility coefficients derived from tests performed on samples prepared at dry density values of 1.3 and 1.5 Mg/m3.
1-2
2-3 Suction controlled wetting in two stages(300MPa to 3 MPa; 3MPa to saturation)
Vertical stress
1 2
3Flooding
Slow wetting(vapour)
300 MPa, H2SO4
3 MPa, CuSO4
Loading to 0.3 MPa
Su
ctio
n
Fig. 30. Stress path and test characteristics of wetting under constant loadtests.
846 C. Hoffmann et al. / Physics and Chemistry of the Earth 32 (2007) 832–849
constant volume tests were performed on specimens havingdry densities of 1.3 and 1.5 Mg/m3. The stress path is sche-matically plotted in Fig. 33. As in previous tests, thevapour transfer technique was first used to apply a step-by-step wetting from 300 to 3 MPa. Once this value wasreached, samples were soaked with water to reach satura-tion in a single wetting step.
The recorded vertical stress and water content changesas suction is decreased are shown in Fig. 34 for a1.3 Mg/m3 specimen. Water content could be calculated
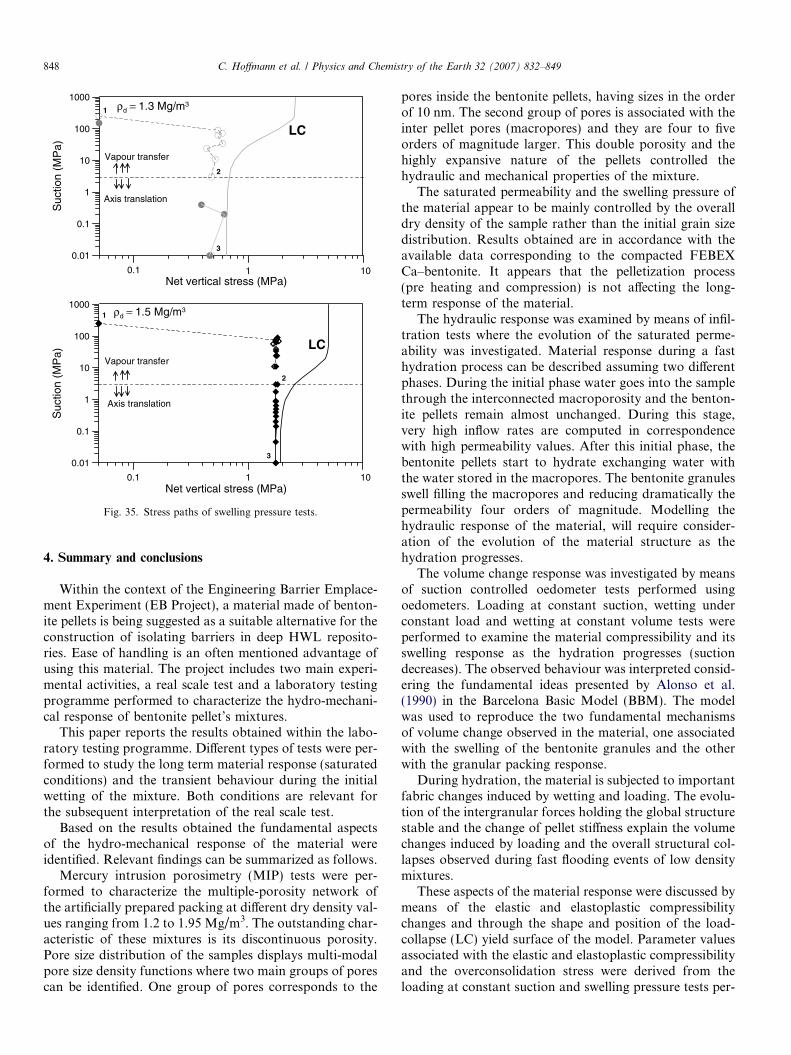
because the reservoir containing the aqueous solution wascontinuously weighted. Starting from an initial suctionvalue of 300 MPa, the following total suction steps wereapplied: 90! 72! 63! 32! 24! 11! 3 MPa priorto the final flooding event. Each equalization stage wasmaintained until hydraulic and mechanical equilibriumwas achieved. Each one of the steps lasted typically 14days. The data shown in Fig. 34 was collected during 3months. The highest swelling pressure increment is devel-oped in the first wetting stage and it maintains a nearlyconstant value on further suction decrease. However, asmall reduction was detected when suction decreased below32 MPa.
The observed behaviour can be explained consideringthe occurrence of two concurrent phenomena: the expan-sion of the pellets and the evolution of the intergranularforces upon wetting. Initially, when suction is reduced thebentonite granules swell and a net pressure increment isdeveloped to maintain a constant volume condition. Dur-ing this initial stage the stress path is in the elastic regionfar from the LC yield locus which describes the yieldingof the granular fabric. It is interpreted that the intergranu-lar forces are strong enough to keep the granular arrange-ments stable and no collapse is produced. However, aswetting progresses, contact between granules decrease instrength and stiffness, the intergranular forces decreaseand the overall structure is prone to undergo collapse. Bothphenomena coexist during the wetting path. An essentially

0 1000 2000 3000Net vertical stress (σv-ua) , (kPa)
0.01
0.1
1
10
100
1000
SU
CT
ION
(M
Pa)
Loading
SWELLING
WettingCOLLAPSE
OCR: (6.5-8.7)σ*
v(0)
LC
-0.05 0 0.05 0.1 0.15 0.2Vertical deformation, ΔH/H0
0.01
0.1
1
10
100
1000
SU
CT
ION
(M
Pa)
12
3
ρd0=1.50 Mg/m3
Vapour transfer
Liquid transfer
ρd0=1.50 Mg/m3a b
Fig. 31. (a) Vertical deformation during wetting under constant load for a sample having a dry density of 1.5 Mg/m3. (b) Stress path and assumed positionof the LC yield curve.
-0.05 0 0.05 0.1 0.15 0.2
Vertical deformation, ΔH/H0
0.01
0.1
1
10
100
1000
Suc
tion
(MP
a)
3 MPa
0 1000 2000 3000Net vertical stress (σv-ua) , (kPa)
0.01
0.1
1
10
100
1000
LC
SW
ELL
ING
CO
LLA
PS
E
Wetting
OCR: (1.1-2.1)
σ*v (0)
1
2
ρd0
=1.30 Mg/m3
3
Liquid transfer
Vapour transfer
ρd0
=1.30 Mg/m3Loadinga b
Suc
tion
(MP
a)
Fig. 32. (a) Vertical deformation during wetting under constant load for a sample having a dry density of 1.3 Mg/m3. (b) Stress path and position of theLC yield curve.
1-2
2-3 Fast flooding
1
2
3 Flooding
Vapour wetting(slow)
300 MPa, H2SO4
3 MPa, CuSO4
Multi-stage wetting.
Su
ctio
n
Vertical stress
As compacted
Fig. 33. Stress path and test characteristics of wetting at constant volumetests.
0.01 1 100
0.1
0.2
0.3
0.4
0.5
Wat
er
cont
ent
0.1
0.3
0.5
0.7
Ver
tical
str
ess
(MP
a)
0.01 1 1000.01 1 1000.01 1 1000.01 1 1000.01 1 100100000.01 1 10010000
90 72 63 32 24 11 3250
Suction (MPa)
Time (h)
Fig. 34. Recorded evolution of vertical swelling pressure and watercontent of specimen having qd = 1.3 Mg/m3 during wetting at constantvolume. Suction is indicated in the upper part of the figure.
C. Hoffmann et al. / Physics and Chemistry of the Earth 32 (2007) 832–849 847
constant swelling pressure represents a balance betweenthem. The stress path follows approximately the LC yieldcurve. Fig. 35 shows a plot of the swelling pressure evolu-
tion during wetting for the two different dry densitiestested.
0.1Net vertical stress (MPa)
0.01
0.1
1
10
100
1000
Suc
tion
(MP
a)
Vapour transfer
Axis translation
1
2
0.1 1 10
1 10
Net vertical stress (MPa)
0.01
0.1
1
10
100
1000
Suc
tion
(MP
a)
1
2
LC
LC
3
3
Vapour transfer
Axis translation
ρd = 1.3 Mg/m3
ρd = 1.5 Mg/m3
Fig. 35. Stress paths of swelling pressure tests.
848 C. Hoffmann et al. / Physics and Chemistry of the Earth 32 (2007) 832–849
4. Summary and conclusions
Within the context of the Engineering Barrier Emplace-ment Experiment (EB Project), a material made of benton-ite pellets is being suggested as a suitable alternative for theconstruction of isolating barriers in deep HWL reposito-ries. Ease of handling is an often mentioned advantage ofusing this material. The project includes two main experi-mental activities, a real scale test and a laboratory testingprogramme performed to characterize the hydro-mechani-cal response of bentonite pellet’s mixtures.
This paper reports the results obtained within the labo-ratory testing programme. Different types of tests were per-formed to study the long term material response (saturatedconditions) and the transient behaviour during the initialwetting of the mixture. Both conditions are relevant forthe subsequent interpretation of the real scale test.
Based on the results obtained the fundamental aspectsof the hydro-mechanical response of the material wereidentified. Relevant findings can be summarized as follows.
Mercury intrusion porosimetry (MIP) tests were per-formed to characterize the multiple-porosity network ofthe artificially prepared packing at different dry density val-ues ranging from 1.2 to 1.95 Mg/m3. The outstanding char-acteristic of these mixtures is its discontinuous porosity.Pore size distribution of the samples displays multi-modalpore size density functions where two main groups of porescan be identified. One group of pores corresponds to the
pores inside the bentonite pellets, having sizes in the orderof 10 nm. The second group of pores is associated with theinter pellet pores (macropores) and they are four to fiveorders of magnitude larger. This double porosity and thehighly expansive nature of the pellets controlled thehydraulic and mechanical properties of the mixture.
The saturated permeability and the swelling pressure ofthe material appear to be mainly controlled by the overalldry density of the sample rather than the initial grain sizedistribution. Results obtained are in accordance with theavailable data corresponding to the compacted FEBEXCa–bentonite. It appears that the pelletization process(pre heating and compression) is not affecting the long-term response of the material.
The hydraulic response was examined by means of infil-tration tests where the evolution of the saturated perme-ability was investigated. Material response during a fasthydration process can be described assuming two differentphases. During the initial phase water goes into the samplethrough the interconnected macroporosity and the benton-ite pellets remain almost unchanged. During this stage,very high inflow rates are computed in correspondencewith high permeability values. After this initial phase, thebentonite pellets start to hydrate exchanging water withthe water stored in the macropores. The bentonite granulesswell filling the macropores and reducing dramatically thepermeability four orders of magnitude. Modelling thehydraulic response of the material, will require consider-ation of the evolution of the material structure as thehydration progresses.
The volume change response was investigated by meansof suction controlled oedometer tests performed usingoedometers. Loading at constant suction, wetting underconstant load and wetting at constant volume tests wereperformed to examine the material compressibility and itsswelling response as the hydration progresses (suctiondecreases). The observed behaviour was interpreted consid-ering the fundamental ideas presented by Alonso et al.(1990) in the Barcelona Basic Model (BBM). The modelwas used to reproduce the two fundamental mechanismsof volume change observed in the material, one associatedwith the swelling of the bentonite granules and the otherwith the granular packing response.
During hydration, the material is subjected to importantfabric changes induced by wetting and loading. The evolu-tion of the intergranular forces holding the global structurestable and the change of pellet stiffness explain the volumechanges induced by loading and the overall structural col-lapses observed during fast flooding events of low densitymixtures.
These aspects of the material response were discussed bymeans of the elastic and elastoplastic compressibilitychanges and through the shape and position of the load-collapse (LC) yield surface of the model. Parameter valuesassociated with the elastic and elastoplastic compressibilityand the overconsolidation stress were derived from theloading at constant suction and swelling pressure tests per-
C. Hoffmann et al. / Physics and Chemistry of the Earth 32 (2007) 832–849 849
formed. It is concluded that the BBM offers a convenientconceptual framework to describe this pellet based materialcompacted at the dry density expected ‘‘in situ’’ in the EBtest.
Acknowledgements
The work described has been supported by ENRESAthrough the ‘Engineered barrier emplacement experimentin Opalinus clay (EB experiment)’ (2000–2003). Theauthors also acknowledge the financial support providedby the EC under the contract FIKW-CT-2000-00017.
References
AITEMIN, 2001. The EB experiment engineered barrier emplacement inOpalinus Clay. Test Plan, version 3.0. NAGRA, Switzerland.
Alonso, E.E., Hoffmann, C., 2005. Modelling the field behaviour of agranular expansive barrier. In: 2nd International Meeting on Claysand Natural and Engineered Barriers for Radioactive Waste Confine-ment, Tours, France.
Alonso, E.E., Gens, A., Josa, A., 1990. A constitutive model for partiallysaturated soils. Geotechnique 40 (3), 405–430.
Cuisinier, O., 2002. Comportement hydrome-chanique des sols gonflantscomactes. PhD Thesis. Institut National Polytechnique de Lorraine.
Di Mariano, A., Airo Farulla, C., Valore, C., 2000. Retention curves and1-D behaviour of a compacted tectonised unsaturated clay. In:Tarantino, A., Mancuso, C. (Eds.), Experimental Evidence andTheoretical Approaches in Unsaturated Soils, Proc. Int. Workshopon Unsaturated Soils, Trento, Italy. Balkema, Rotterdam, pp. 47–64.
ENRESA, 2000. FEBEX project. Full-scale engineered barriers experi-ment for a deep geological repository for high level radioactive wastein crystalline host rock. Final report. ENRESA, Madrid.
Hoffmann, C., Romero, E., Alonso, E.E., 2005. Combining differentcontrolled-suction techniques to study expansive clays. In: Tarantino,A., Romero, E., Cui, Y.J. (Eds.), Advanced Experimental UnsaturatedSoil Mechanics, Proc. Int. Symposium on Advanced ExperimentalUnsaturated Soil Mechanics, Trento, Italy, 27–29 June 2005. Taylor &Francis Group, London, pp. 61–67.
NAGRA, 2003. Engineer barrier emplacement experiment in OpalinusClay (EB). Granular Material Emplacement QA Report withEmplacement Description. Deliverable D12 of the EB Project.
Pusch, R., Bluemling, P., Johnson, L., 2003. Performance of stronglycompacted MX-80 pellets under repository-like conditions. AppliedClay Science 23, 239–244.
Romero, E., 2001 Controlled-suction techniques. 4� Simposio Brasileirode Solos Nao Saturados. In: Gehling, W.Y.Y., Schnaid, F. (Eds.),Porto Alegre, Brasil, pp. 535–542.
Yahia-Aısa, M., Delage, P., Cui, Y.J., 2001. Suction–water contentrelationship in swelling clays. In: Clay Science for Engineering:Proceedings of the International Symposium on Suction, Swelling,Permeability and Structure of Clays. Balkema, Rotterdam.