the swelling pressure of bentonite and sand mixtures
TRANSCRIPT
The swelling pressure of bentonite and sand mixtures
Sandra Sánchez González
Master Thesis in Chemical Engineering
Stockholm, Sweden 2013
The swelling pressure of bentonite and sand
mixtures
The swelling pressure of bentonite and sand mixtures
The swelling pressure of bentonite and sand
mixtures
Sandra Sánchez González
Master of Science Thesis
KTH Chemical Science and Engineering
STOCKHOLM
The swelling pressure of bentonite and sand mixtures
i
Acknowledgement
This degree project is carried out in the department of Chemical Engineering and
Technology, at Royal Institute of Technology (KTH) in Sweden.
I would like to thank my advisor, Assoc. Professor Longcheng Liu for his kindness
support and patience. I really appreciate his helpful suggestions during our discussion
which is beneficial for me to finish all the work.
I wish to express my sincere gratitude to my colleagues of the department of Chemical
Engineering and Technology for their friendship and support, especially to Zhao Yang
for his time spent in reviewing this thesis, valuable help and comments.
Special thanks for the patience and encouragement received from my friends.
Finally, I want to express my deep gratitude to my parents, Fernando and Ana, and to
my sister Paula, for their encouragement and love.
Stockholm, 2013
Sandra Sánchez González

The swelling pressure of bentonite and sand mixtures
ii
Abstract
The compacted bentonites are used as buffer and backfill materials for engineering
barriers for high-level nuclear waste repositories located underground. For this
purpose, it is very important to evaluate the swelling characteristics of this clay.
The swelling capacity is one of the most important properties of the bentonite clay. The
swelling behaviour is due two mechanisms, the crystalline swelling and the osmotic
swelling. These mechanisms produce an increase in the distance between the layers of
montmorillonite which is one component of bentonite.
The result of the swelling capacity is the swelling pressure. It has been studied in
several investigations. The results of experimental tests have been collected and
compared in this thesis, considering only the Na-dominant bentonite and sand and
distilled water as test solution.
The experimental tests show that there is only an unique relation between different
bentonites in the Na-dominant bentonite and sand mixture swollen depending on its
final dry density. Also, the relation between the swelling pressure and the clay void
ratio shows the mechanism of the swelling pressure.
On the other hand, a mechanistic model is used to predict the swelling pressure of fully
saturated bentonite and sand mixture in distilled water. Firstly, it has been compared
with the results of experimental tests and it should be pointed out that the model gives
good predictions.
In addition, the model has been used to make sensitivity analysis with different
parameters of bentonite. The most important conclusions in this section show that the
swelling pressure mainly depends on the distance among particles. Also, the sensitivity
analyses indicate which parameters should be fitted more carefully for future studies to
validate this model with different bentonites.
Keywords: Swelling pressure; bentonite and sand mixture; crystalline swelling; osmotic
swelling; mechanistic model; montmorillonite.
The swelling pressure of bentonite and sand mixtures
iii
Table of contents
Acknowledgement ........................................................................... i
Abstract .......................................................................................... ii
Table of contents ........................................................................... iii
List of figures ................................................................................. v
List of tables .................................................................................. vi
1. Introduction .............................................................................. 1
1.1. Background ................................................................................................................. 1
1.2. Problem description.................................................................................................... 2
1.3. Aims of the project ...................................................................................................... 2
1.4. Organization and content of the thesis .................................................................... 2
2. Review ....................................................................................... 4
2.1. Radioactive wastes .................................................................................................... 4
2.2. Final disposal .............................................................................................................. 4
2.3. Bentonite ...................................................................................................................... 5
3. Mechanism of the bentonite swelling ...................................... 8
3.1. Swelling process ......................................................................................................... 8
3.2. Swelling behaviour ..................................................................................................... 9
3.2.1. Crystalline swelling ............................................................................................. 9
3.2.2. Osmotic swelling ............................................................................................... 11
4. Experimental work from literature ....................................... 13
4.1. Materials ..................................................................................................................... 13
4.2. Test procedure .......................................................................................................... 14
4.2.1. Swelling pressure test ...................................................................................... 14
4.2.2. Swelling deformation test ................................................................................ 16
5. Model development ................................................................. 17
5.1. Basic concepts .......................................................................................................... 17
The swelling pressure of bentonite and sand mixtures
iv
5.2. Description of the model .......................................................................................... 19
6. Results and discussion ........................................................... 21
6.1. Results from experimental test ............................................................................... 21
6.2. Validation of the model ............................................................................................ 24
6.3. Sensitivity analysis ................................................................................................... 25
6.3.1. Varying the number of stacked unit layers ................................................... 26
6.3.2. Varying the montmorillonite content .............................................................. 27
6.3.3. Varying the amount of the exchangeable cations ....................................... 28
6.3.4. Varying the ratio of crystalline swelling region ............................................. 30
6.3.5. Varying the pre-exponential factor and the decay length ........................... 30
7. Conclusions ............................................................................. 33
References .................................................................................... 35
The swelling pressure of bentonite and sand mixtures
v
List of figures
Figure 1 Graphic summary about final disposal for high level waste from SKB [30] ....................... 5
Figure 2 Representation of montmorillonite structure [18] .................................................................. 6
Figure 3 Montmorillonite structure [3] ..................................................................................................... 6
Figure 4 Mechanism on the swelling pressure of compacted bentonite from Komine and Ogata
[12] ...................................................................................................................................................... 8
Figure 5 Process of water absorption from Madsen and Müller Vonmoos [20] ............................. 10
Figure 6 Arrangement of water on the clay layer from Yong [41] ..................................................... 10
Figure 7 Diffuse double layer from Madsen and Müller-Vonmoos [20] ........................................... 12
Figure 8 Schematic illustration of a constant-volume cell from Kiviranta and Kumpulainen [12] 15
Figure 9 Image of a constant-volume cell from Kiviranta and Kumpulainen [11] ........................... 15
Figure 10 Schematic illustration of a swelling deformation apparatus from Komine and Ogata
[12] .................................................................................................................................................... 16
Figure 11 Conceptualization of the composition of the mixture of bentonite and sand particles
from Liu [19] ..................................................................................................................................... 17
Figure 12 Comparison between the swelling pressure and the void ratio of montmorillonite ...... 22
Figure 13 Comparison between the swelling pressure and the clay void ratio .............................. 23
Figure 14 Comparison between the swelling pressure and the final dry density of bentonite ..... 24
Figure 15 Comparison of measured swelling pressure between model prediction and laboratory
test results. a) Marcial [22], b) Sun [33] ....................................................................................... 25
Figure 16 Representation of the montmorillonite particles [19] ........................................................ 26
Figure 17 Comparison of the predicted model of the swelling pressure as a function of the clay
void ratio varying the number of stacked unit layers ................................................................. 27
Figure 18 Comparison of the predicted model of the swelling pressure as a function of the clay
void ratio varying the content of montmorillonite ........................................................................ 28
Figure 19 Comparison of the predicted model of the swelling pressure as a function of the clay
void ratio varying the content of montmorillonite ........................................................................ 29
Figure 20 Comparison of the predicted model of the swelling pressure as a function of the clay
void ratio varying the ratio of crystalline swelling region ........................................................... 30
Figure 21 Comparison of the predicted model of the swelling pressure as a function of the clay
void ratio varying the pre-exponential factor ............................................................................... 31
Figure 22 Comparison of the predicted model of the swelling pressure as a function of the clay
void ratio varying the decay length ............................................................................................... 32
The swelling pressure of bentonite and sand mixtures
vi
List of tables
Table 1 Profile of the bentonite and the sand used ............................................................................ 14
Table 2 Legend from Fig. 12, Fig. 13 and Fig. 14 ............................................................................... 21
Table 3 Physical constants used in the predictions from Liu [19] ..................................................... 26
Table 4 Different amounts of the exchangeable cations from the experimental data of Studds
[32] .................................................................................................................................................... 29

The swelling pressure of bentonite and sand mixtures
1
1. Introduction
1.1. Background
1.2. Problem description
1.3. Aims of the project
1.4. Organization and content of the thesis
1.1. Background
Nowadays, preservation of the environment is one of the most important matters in our
society. One of the most challenging factors to deal with the industrial world is to find
better techniques for disposing radioactive wastes from nuclear power stations. The
main principle of these wastes management is the containment and isolation for the
radioactive wastes, knowing that the radiological hazard of the wastes is not
permanent. This hazard diminishes over time as a result of the radioactive decay but it
takes a long time to occur [4, 21].
Until the 80s, many countries threw wastes into the sea in order to remove them but in
1994, this practice was banned permanently [6]. Nowadays, this waste is stored in the
land. At present, the total disposal of high-level radioactive wastes has not been
reached yet but there are two considered options: a superficial or an underground
repository. The best proposed solution for the high-level activity wastes is storing the
radioactive wastes underground where isolation is ensured from a series of engineered
barriers as well as properties of the host rock.
Finland, France and Sweden are the most advanced countries in the line of high level
disposal waste [28]. Posiva Oy is the organization accountable for the final disposal in
Finland [25], Andra in France and SKB in Sweden [30]. They are not operating with this
kind of repositories yet, but in a few years they will.
The clay as engineered barrier is used in order to curb the uncontrolled movement of
the contaminants in the soil. In most cases, compacted bentonite-based materials are
chosen as a sealing/buffer materials.
The bentonite is a type of clay that is mixed with sand and it becomes an effective
component of artificial barriers. This type of clay is better than others because of its
The swelling pressure of bentonite and sand mixtures
2
properties. The swelling capacity of compacted bentonite and sand mixture is one of
the most important researched properties. This characteristic is very important for the
design and for the construction of the disposal facilities of nuclear wastes.
[10, 12, 13, 14, 15, 16, 23, 24, 32, 33, 38, 40]
1.2. Problem description
The crucial question is whether it can guarantee the security of the storage facilities for
thousands of years, doing it without producing cracks which are formed in the
protection barriers causing water seep.
To answer this question, there are many factors to keep in mind. We must know the
characteristics of every barrier protecting the underground waste [24]. The engineering
barriers must be researched and experimented to justify that there will not exist any risk
of escaping from high level wastes. In this thesis we will study one property of the
compacted bentonite, the behaviour of swelling.
1.3. Aims of the project
The present study is to observe from different studies the behaviour of the mixture of
bentonite-sand under vertical pressure changes. In order to know the behaviour of one
of their most important properties, many studies have been investigated to know about
the effect of the swelling pressure, using different methods. The studies are from
Karnland, [8]; Marcial, [22]; Mollins, [23]; Studds, [32]; Sun, [33]; Tripathy, [34]; and
Wang, [38].
There are two different ways that we can observe the behaviour of the mixture. On the
one hand, one of these ways is comparing different experimental data of different
researches. On the other hand, we can analyse the behaviour of the swelling pressure
when the values of the properties are changed, using a mechanistic model.
1.4. Organization and content of the thesis
The thesis is composed of 6 more chapters. In chapter 2, we will define the basic
concepts about the wastes and the protective barriers from the underground
repositories, focusing on the mixture of bentonite-sand. Also, this chapter presents a
The swelling pressure of bentonite and sand mixtures
3
detailed definition of bentonite and the basic properties of the most important
component of bentonite, montmorillonite.
Chapter 3 describes the mechanism of the bentonite swelling. It is divided into several
parts. Firstly, it carries out a description of the swelling process. Secondly, the
mechanisms on the swelling behaviour are defined, being the mechanisms the
crystalline and the osmotic swelling.
Chapter 4 shows the experimental work from different studies [8, 22, 23, 32, 33, 34,
38]. It shows the material used in the investigations aforementioned and the different
properties of the bentonite and sand. Furthermore, it describes the experimental
methods.
The mechanistic model will be described briefly in chapter 5.
To finish, in chapter 6 we will study and compare the results of the experiments about
the swelling pressure in the bentonite from the different researches aforementioned.
Also, using the mechanistic model we will do a sensitivity analysis by varying some
properties of bentonite. In the end, it presents some conclusions and future research in
chapter 7.
The swelling pressure of bentonite and sand mixtures
4
2. Review
2.1. Radioactive waste
2.2. Final disposal
2.3. Bentonite
2.1. Radioactive wastes
The radioactive waste can be defined as any material which contains or it is
contaminated with radionuclides in concentrations or activity levels higher than those
established by the laws [7]. There are many types of radioactive wastes depending on
their characteristics or management but generally, they can be classified into two
groups: the low- and intermediate-level wastes and the short life wastes, and the high-
level wastes [7]. Almost all the wastes that are produced belong to the first group.
However, the wastes from the second group are the most dangerous [21, 39].
The high-level waste (HLW) and the spent fuel (SF) contain fission products and
transuranic elements generated in the reactor core which are highly radioactive. They
are also very hot due to radioactive decay [4, 39].
2.2. Final disposal
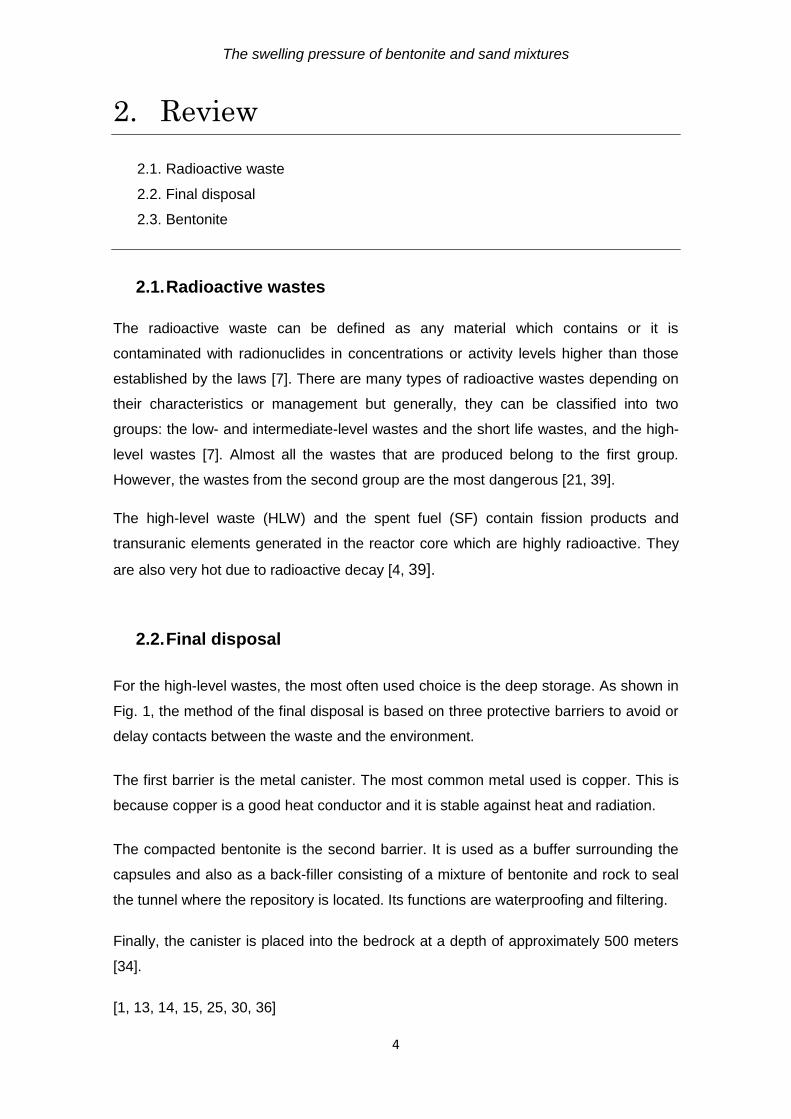
For the high-level wastes, the most often used choice is the deep storage. As shown in
Fig. 1, the method of the final disposal is based on three protective barriers to avoid or
delay contacts between the waste and the environment.
The first barrier is the metal canister. The most common metal used is copper. This is
because copper is a good heat conductor and it is stable against heat and radiation.
The compacted bentonite is the second barrier. It is used as a buffer surrounding the
capsules and also as a back-filler consisting of a mixture of bentonite and rock to seal
the tunnel where the repository is located. Its functions are waterproofing and filtering.
Finally, the canister is placed into the bedrock at a depth of approximately 500 meters
[34].
[1, 13, 14, 15, 25, 30, 36]
The swelling pressure of bentonite and sand mixtures
5
Figure 1 Graphic summary about final disposal for high level waste from SKB [30]
2.3. Bentonite
Natural bentonite is a type of clay that it is composed mainly of montmorillonite. This
component is a swelling clay mineral of the smectite group [18]. Bentonite also
contains nonswelling minerals such as quartz, feldspars, micas and carbonate, void
and sand. The properties of bentonite are affected depending on the type of cation
which is in the intermediate layer. The common interlayer cation is Na- and Ca-
bentonite [20].
The choice to use bentonite instead of other clays is due to its properties [1, 37]:
The low permeability ( ≈ 3.10-14 m/s) to minimize the arrival of water
The high thermal conductivity (0.6 to 1.4 W /mK) to dissipate heat generated
from waste and from gas of the corrosion of the containers
The high swelling capacity (7 MPa) to seal the cracks and fractures to prevent
the access to other barriers
The large specific surface (725 m2 /g) to retain radionuclide as to keep the
water chemistry conservation
The high plasticity (liquid limit 102%, plastic limit 53%) for mechanical protection
to ensure mechanical integrity of the capsule
The high suction capacity to sealing the repository
Depending on where the clay is, there are different kinds of bentonite and each type of
bentonite has got different properties. For example, from USA the bentonite is called
Wyoming bentonite, Kunigel clay from Japan, FEBEX from Spain or FoCa7 from
The swelling pressure of bentonite and sand mixtures
6
France [27, 37]. Although different types of bentonite exist the most important part of
those is the montmorillonite.
The montmorillonite participate in the most important properties of bentonite so it is
advisable to know more about this component.
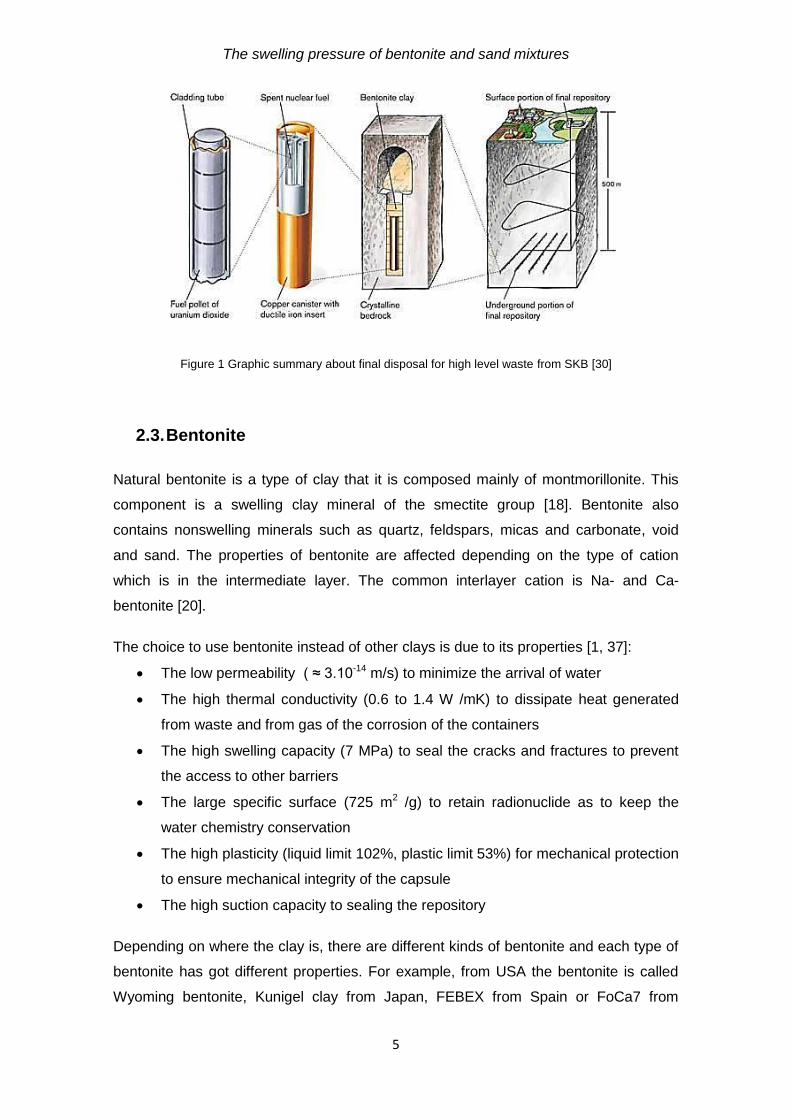
The structure of montmorillonite can be described in the Fig. 2 as a tetrahedral-
octahedral-tetrahedral (T-O-T) unit layer. It consists of an alumina octahedral sheet
sandwiched between two silica tetrahedral sheets [35]. The TOT layers have
dimensions on the ‘a’ and ‘b’ directions and stack together, one above the other, in the
‘c’ direction to form particles.
Figure 2 Representation of montmorillonite structure [18]
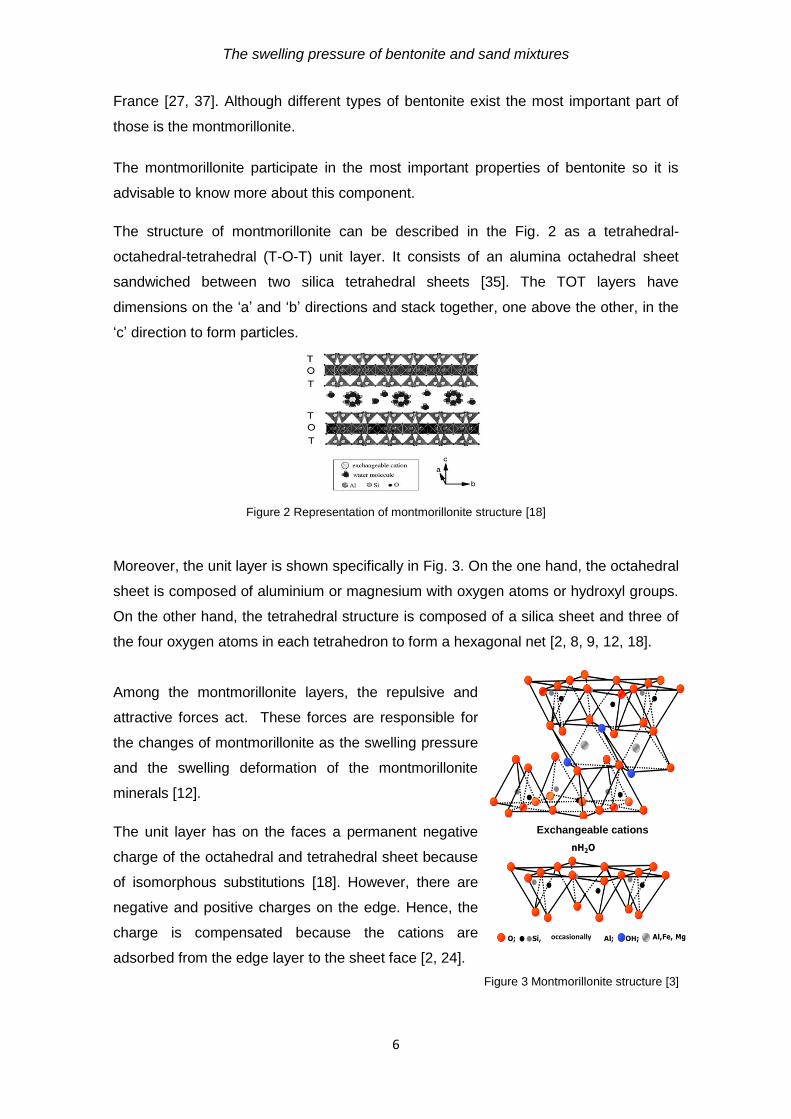
Moreover, the unit layer is shown specifically in Fig. 3. On the one hand, the octahedral
sheet is composed of aluminium or magnesium with oxygen atoms or hydroxyl groups.
On the other hand, the tetrahedral structure is composed of a silica sheet and three of
the four oxygen atoms in each tetrahedron to form a hexagonal net [2, 8, 9, 12, 18].
Among the montmorillonite layers, the repulsive and
attractive forces act. These forces are responsible for
the changes of montmorillonite as the swelling pressure
and the swelling deformation of the montmorillonite
minerals [12].
The unit layer has on the faces a permanent negative
charge of the octahedral and tetrahedral sheet because
of isomorphous substitutions [18]. However, there are
negative and positive charges on the edge. Hence, the
charge is compensated because the cations are
adsorbed from the edge layer to the sheet face [2, 24].
Figure 3 Montmorillonite structure [3]
Exchangeable cations
occasionally
The swelling pressure of bentonite and sand mixtures
7
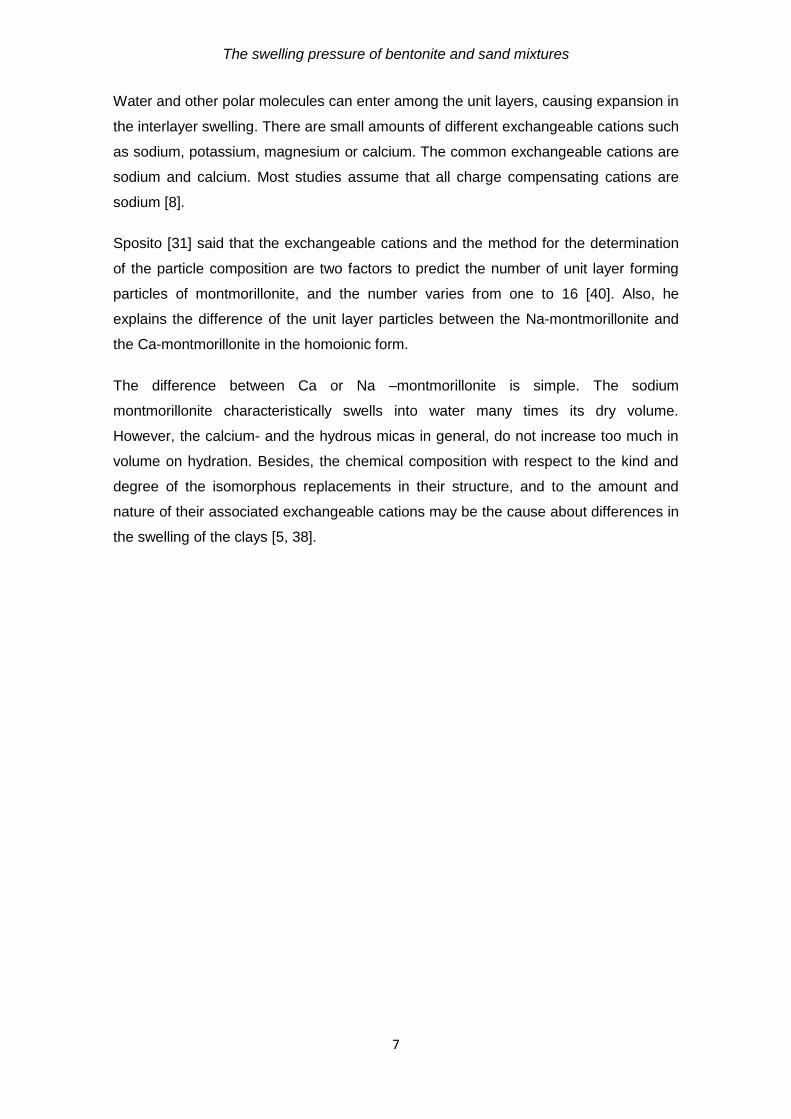
Water and other polar molecules can enter among the unit layers, causing expansion in
the interlayer swelling. There are small amounts of different exchangeable cations such
as sodium, potassium, magnesium or calcium. The common exchangeable cations are
sodium and calcium. Most studies assume that all charge compensating cations are
sodium [8].
Sposito [31] said that the exchangeable cations and the method for the determination
of the particle composition are two factors to predict the number of unit layer forming
particles of montmorillonite, and the number varies from one to 16 [40]. Also, he
explains the difference of the unit layer particles between the Na-montmorillonite and
the Ca-montmorillonite in the homoionic form.
The difference between Ca or Na –montmorillonite is simple. The sodium
montmorillonite characteristically swells into water many times its dry volume.
However, the calcium- and the hydrous micas in general, do not increase too much in
volume on hydration. Besides, the chemical composition with respect to the kind and
degree of the isomorphous replacements in their structure, and to the amount and
nature of their associated exchangeable cations may be the cause about differences in
the swelling of the clays [5, 38].
The swelling pressure of bentonite and sand mixtures
8
3. Mechanism of the bentonite swelling
3.1. Swelling process
3.2. Swelling behaviour
3.2.1. Crystalline swelling
3.2.2. Osmotic swelling
3.1. Swelling process
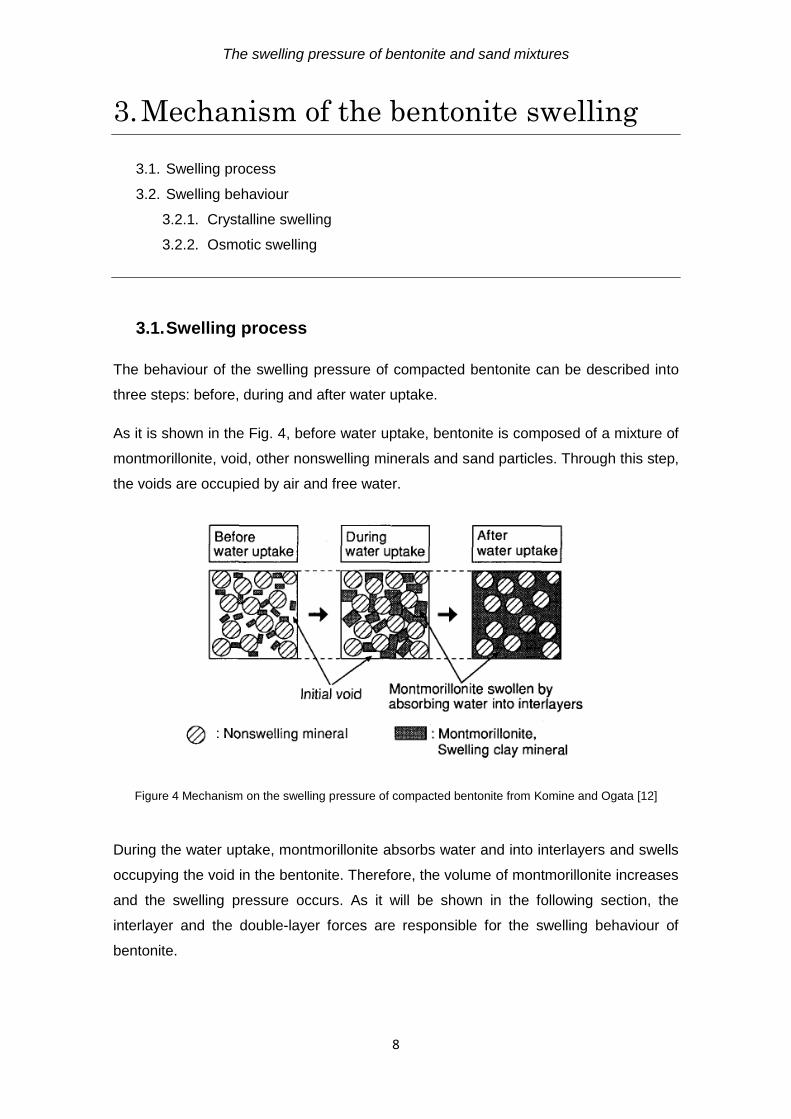
The behaviour of the swelling pressure of compacted bentonite can be described into
three steps: before, during and after water uptake.
As it is shown in the Fig. 4, before water uptake, bentonite is composed of a mixture of
montmorillonite, void, other nonswelling minerals and sand particles. Through this step,
the voids are occupied by air and free water.
Figure 4 Mechanism on the swelling pressure of compacted bentonite from Komine and Ogata [12]
During the water uptake, montmorillonite absorbs water and into interlayers and swells
occupying the void in the bentonite. Therefore, the volume of montmorillonite increases
and the swelling pressure occurs. As it will be shown in the following section, the
interlayer and the double-layer forces are responsible for the swelling behaviour of
bentonite.
The swelling pressure of bentonite and sand mixtures
9
Finally, after water uptake, there is not any void to absorb hence the volume of
montmorillonite cannot increase more. At this point, the swelling pressure of
compacted bentonite can be measured.
[12]
3.2. Swelling behaviour
The swelling behaviour of compacted bentonite and sand mixtures is produced due to
two mechanisms defined as crystalline swelling and osmotic swelling [20]. These
mechanisms depend on the degree of hydration and on the cation in the interlayers.
Besides, they act within the pore space of the clay. Both mechanisms are influenced by
the breakup of montmorillonite particles and by the demixing of cation [17, 19].
Yong [40] stated that the difference between the crystalline swelling and the swelling
due to osmotic activities of cations is because of the hydration structure of the water.
3.2.1. Crystalline swelling
The crystalline swelling is the first mechanism that appears when the montmorillonite
absorbs water. This mechanism produces an enlarged in the distance in steps between
the unit layers of montmorillonite. As a result, an increase of the volume of the
montmorillonite is obtained and consequently, the swelling pressure appears.
Several forces act when the water comes into contact with the clay and these forces
control the crystalline swelling. The dominant force is the hydration of the interlayer
cations and the clay surface. Also, there are other forces as the van der Waals
attraction or the Born repulsion. The hydration due to the interlayer swelling is assigned
to the attraction between water molecules and the polar surface groups and also to the
charge sites and exchangeable cations. It should be pointed out that the Van der
Waals interaction participates in the energy of attraction.
On the one hand, in the dry state, the montmorillonite layers are almost in contact. The
exchangeable cations located between the layers can be situated in two different
places, on the surface of the layers or in the hexagonal holes of the tetrahedral sheets
[20].
The swelling pressure of bentonite and sand mixtures
10
The interlayer cations and the van der Waals
attraction are responsible for the strongly union
among the negatively charged layers.
On the other hand, when the water is taken up
by the exchangeable cations, they order
themselves on a plane halfway between the
clay layers [20].
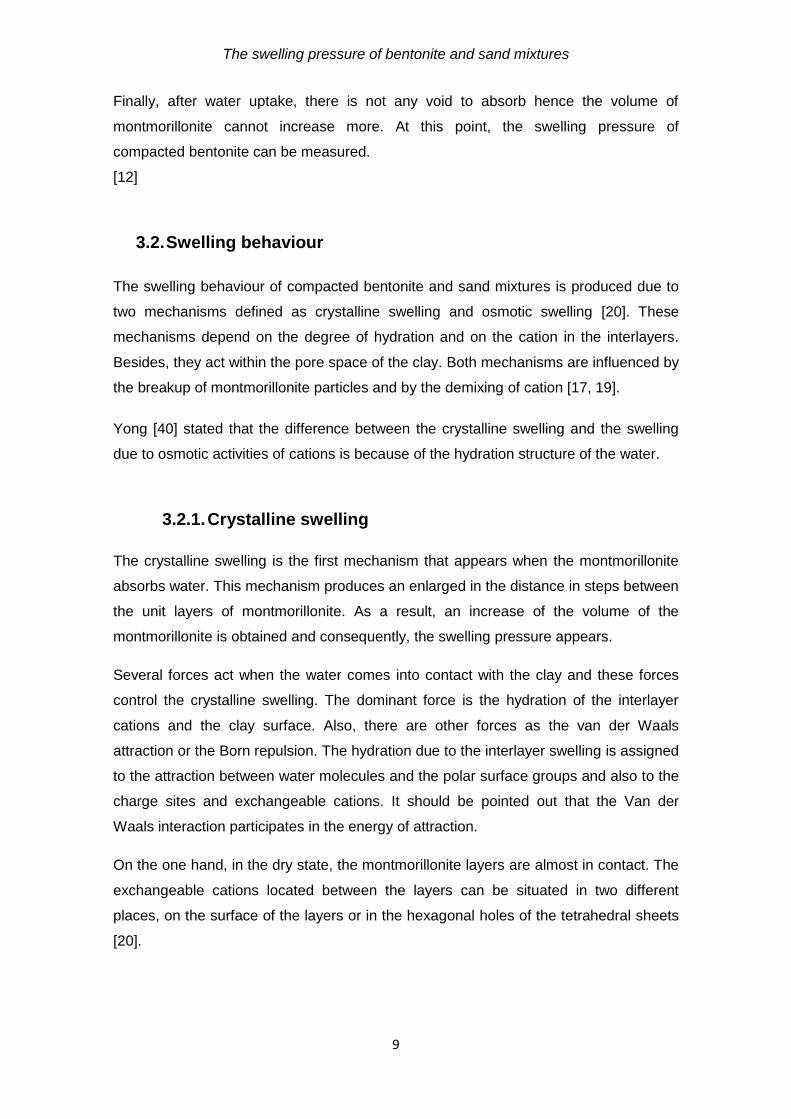
It is not proven but it is supposed that firstly,
the clay surface is covered fully by a layer of
water molecules. After that, the second
molecular layer will be distributed. To sum up,
the water molecules are distributed layer after
layer. In the case of the sodium
montmorillonite, the water molecules are
distributed from zero to four layers. It is a
discrete process because interlayers cannot
have a fractional number of layers of water
molecules [17].
Figure 5 Process of water absorption from Madsen and Müller-Vonmoos [20]
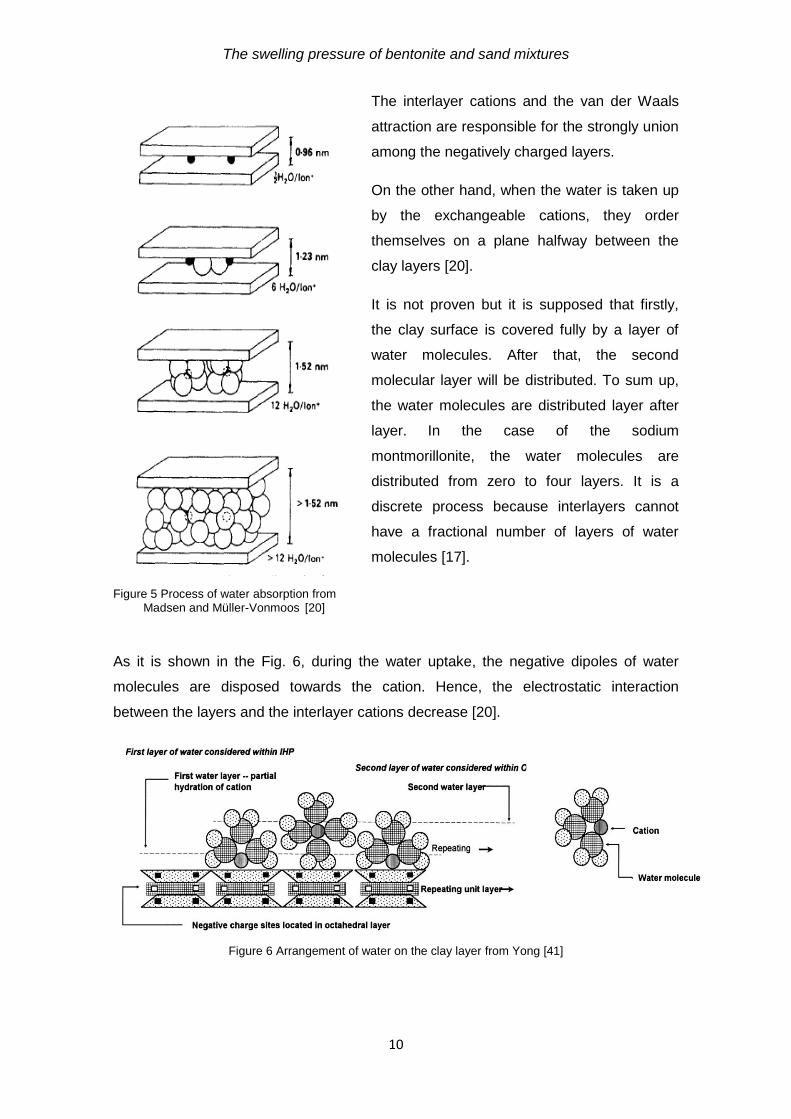
As it is shown in the Fig. 6, during the water uptake, the negative dipoles of water
molecules are disposed towards the cation. Hence, the electrostatic interaction
between the layers and the interlayer cations decrease [20].
Figure 6 Arrangement of water on the clay layer from Yong [41]
The swelling pressure of bentonite and sand mixtures
11
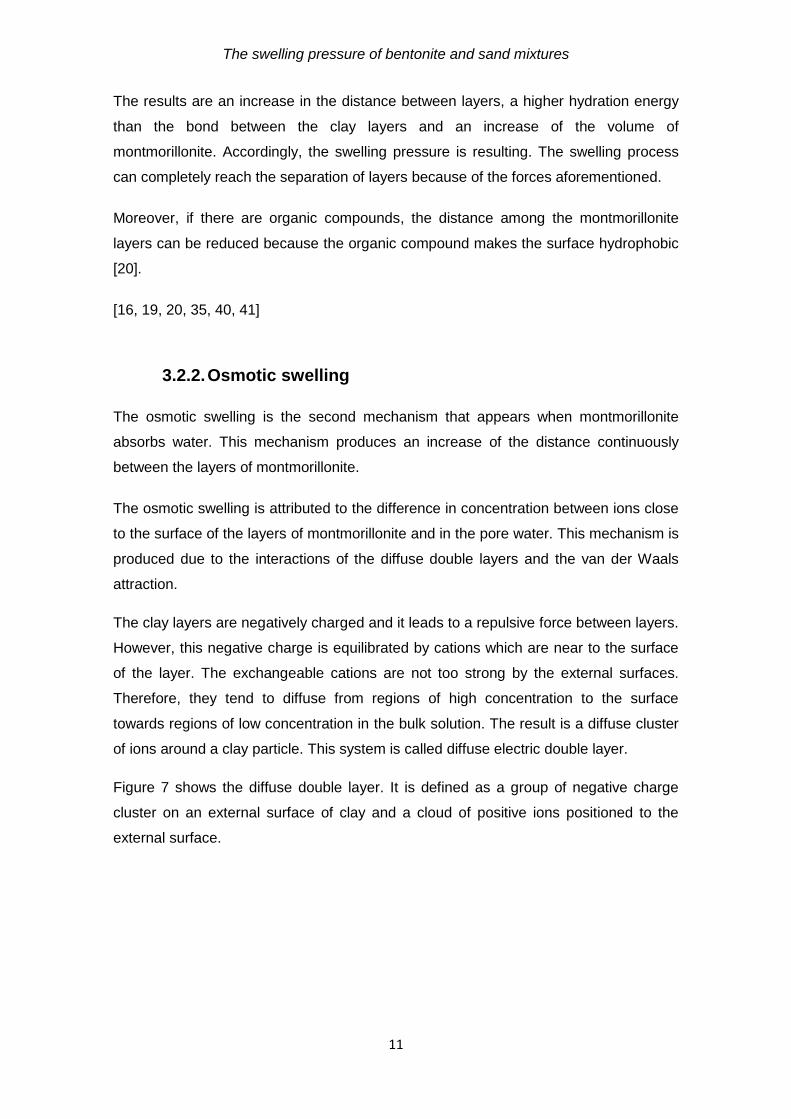
The results are an increase in the distance between layers, a higher hydration energy
than the bond between the clay layers and an increase of the volume of
montmorillonite. Accordingly, the swelling pressure is resulting. The swelling process
can completely reach the separation of layers because of the forces aforementioned.
Moreover, if there are organic compounds, the distance among the montmorillonite
layers can be reduced because the organic compound makes the surface hydrophobic
[20].
[16, 19, 20, 35, 40, 41]
3.2.2. Osmotic swelling
The osmotic swelling is the second mechanism that appears when montmorillonite
absorbs water. This mechanism produces an increase of the distance continuously
between the layers of montmorillonite.
The osmotic swelling is attributed to the difference in concentration between ions close
to the surface of the layers of montmorillonite and in the pore water. This mechanism is
produced due to the interactions of the diffuse double layers and the van der Waals
attraction.
The clay layers are negatively charged and it leads to a repulsive force between layers.
However, this negative charge is equilibrated by cations which are near to the surface
of the layer. The exchangeable cations are not too strong by the external surfaces.
Therefore, they tend to diffuse from regions of high concentration to the surface
towards regions of low concentration in the bulk solution. The result is a diffuse cluster
of ions around a clay particle. This system is called diffuse electric double layer.
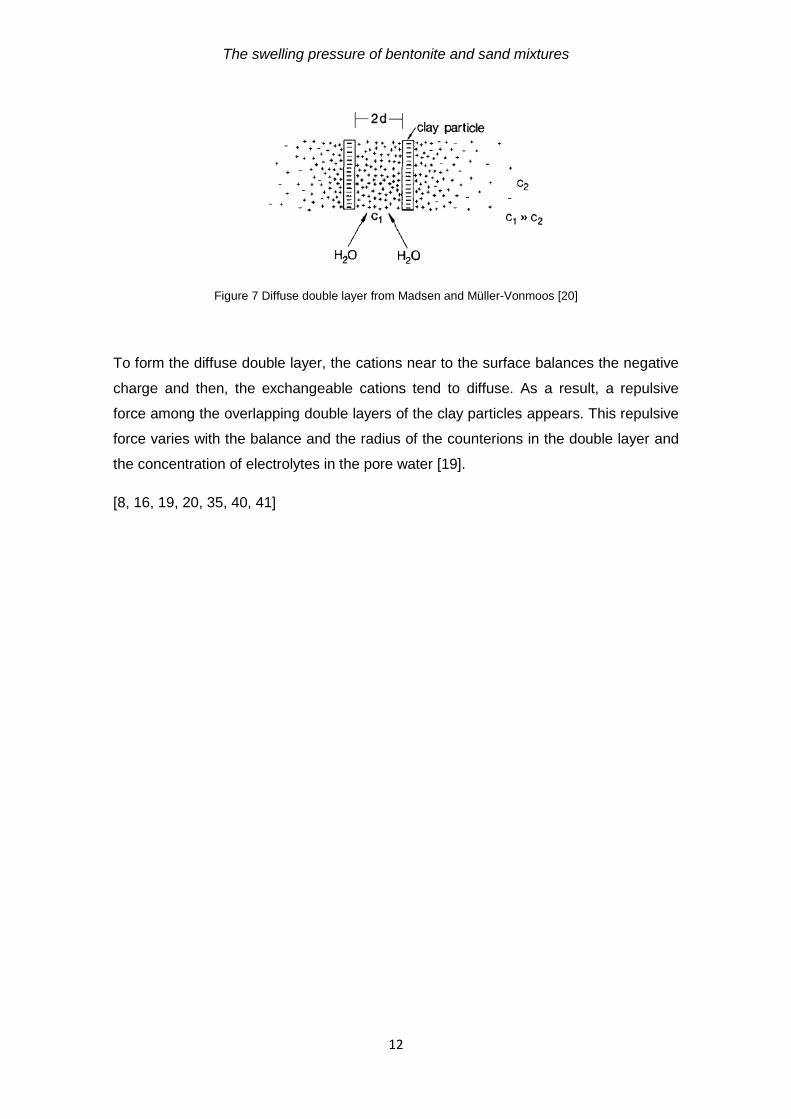
Figure 7 shows the diffuse double layer. It is defined as a group of negative charge
cluster on an external surface of clay and a cloud of positive ions positioned to the
external surface.
The swelling pressure of bentonite and sand mixtures
12
Figure 7 Diffuse double layer from Madsen and Müller-Vonmoos [20]
To form the diffuse double layer, the cations near to the surface balances the negative
charge and then, the exchangeable cations tend to diffuse. As a result, a repulsive
force among the overlapping double layers of the clay particles appears. This repulsive
force varies with the balance and the radius of the counterions in the double layer and
the concentration of electrolytes in the pore water [19].
[8, 16, 19, 20, 35, 40, 41]
The swelling pressure of bentonite and sand mixtures
13
4. Experimental work from literature
4.1. Swelling process
4.2. Swelling behaviour
4.2.1. Crystalline swelling
4.2.2. Osmotic swelling
Before starting to explain this chapter, it should be pointed out that the experimental
work is from the literature and any experimental test has not been done in this study.
Therefore, the results of the experimental test from different studies have been used to
compare their results with each other and also, they have been used to validate the
predictions of our model.
4.1. Materials
The material used in the studies is natural bentonite, which is composed of around 65-
75% montmorillonite, 10-14% quartz, 5-9% feldspar, 3-5% carbonate, 2-4% mica and
chlorite, as well as 1-3% heavy minerals [18, 26].
The test solution used in the tests can be distilled water or saline solutions as Na, K,
Cs, Mg, Ca and Al chloride solutions. The analytical grade reagents and the distilled
water are used for preparing saline solutions [32]. This study is focused only the tests
with distilled water.
The studies used to compare the results from experimental tests are from Karnland,
[8]; Marcial, [22]; Mollins, [23]; Studds, [32]; Sun, [33]; Tripathy, [34]; and Wang, [38].
For the sensitivity analysis that will be shown in the chapter 6, the properties of
bentonite and sand used in the different studies, are summarized in the next table. It
can observe that the bentonite in each study is different and also the studies use
different types of bentonites. Karnland, [8]; Marcial, [22]; Mollins, [23] and Studds, [32]
work with Wyoming bentonite while Sun [33] works with Kunigel bentonite. In addition,
pure bentonite is used in the study of Karnland [8]. Throughout all investigations
studied in this analysis, the Na- montmorillonite is predominant.
The swelling pressure of bentonite and sand mixtures
14
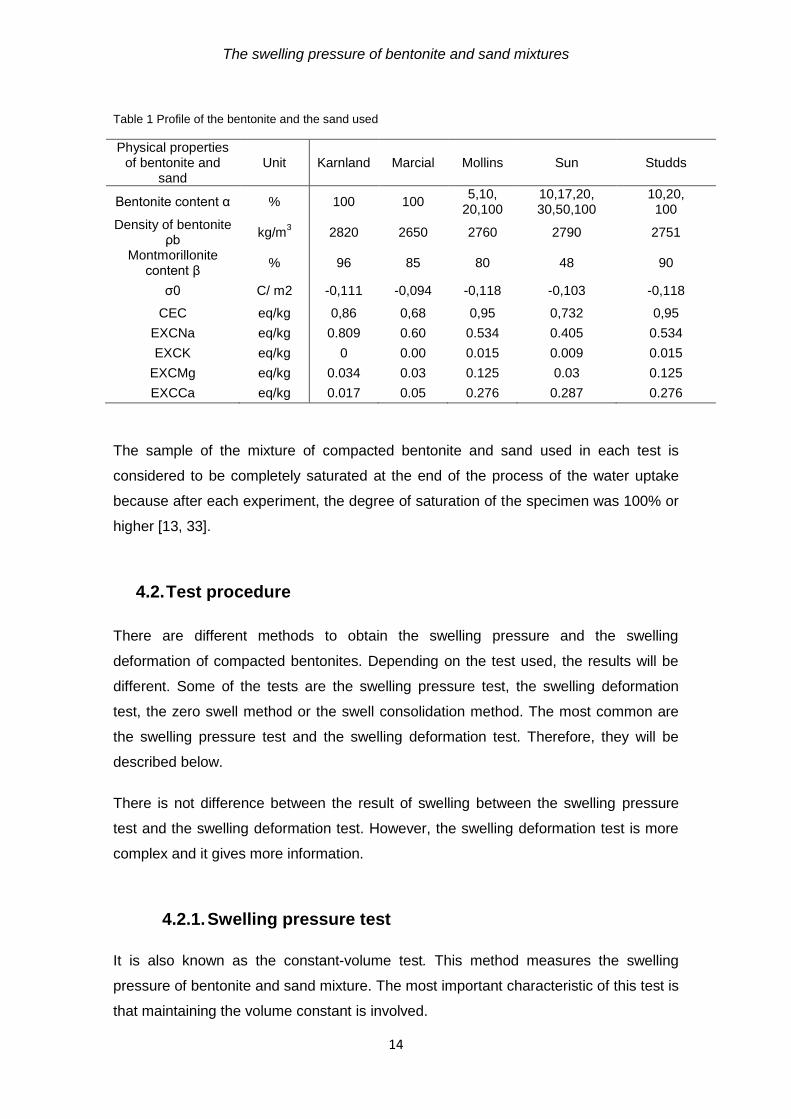
Table 1 Profile of the bentonite and the sand used
Physical properties of bentonite and
sand Unit Karnland Marcial Mollins Sun Studds
Bentonite content α % 100 100 5,10,
20,100 10,17,20, 30,50,100
10,20, 100
Density of bentonite ρb
kg/m3 2820 2650 2760 2790 2751
Montmorillonite content β
% 96 85 80 48 90
σ0 C/ m2 -0,111 -0,094 -0,118 -0,103 -0,118
CEC eq/kg 0,86 0,68 0,95 0,732 0,95
EXCNa eq/kg 0.809 0.60 0.534 0.405 0.534
EXCK eq/kg 0 0.00 0.015 0.009 0.015
EXCMg eq/kg 0.034 0.03 0.125 0.03 0.125
EXCCa eq/kg 0.017 0.05 0.276 0.287 0.276
The sample of the mixture of compacted bentonite and sand used in each test is
considered to be completely saturated at the end of the process of the water uptake
because after each experiment, the degree of saturation of the specimen was 100% or
higher [13, 33].
4.2. Test procedure
There are different methods to obtain the swelling pressure and the swelling
deformation of compacted bentonites. Depending on the test used, the results will be
different. Some of the tests are the swelling pressure test, the swelling deformation
test, the zero swell method or the swell consolidation method. The most common are
the swelling pressure test and the swelling deformation test. Therefore, they will be
described below.
There is not difference between the result of swelling between the swelling pressure
test and the swelling deformation test. However, the swelling deformation test is more
complex and it gives more information.
4.2.1. Swelling pressure test
It is also known as the constant-volume test. This method measures the swelling
pressure of bentonite and sand mixture. The most important characteristic of this test is
that maintaining the volume constant is involved.
The swelling pressure of bentonite and sand mixtures
15
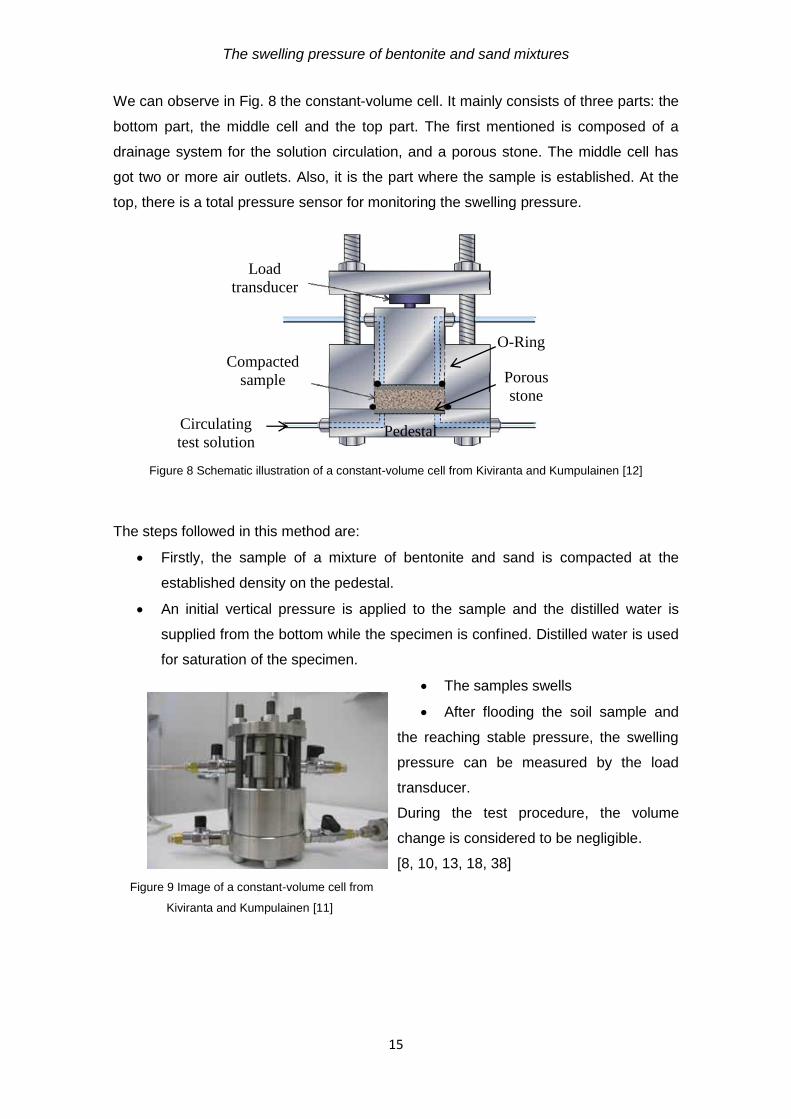
We can observe in Fig. 8 the constant-volume cell. It mainly consists of three parts: the
bottom part, the middle cell and the top part. The first mentioned is composed of a
drainage system for the solution circulation, and a porous stone. The middle cell has
got two or more air outlets. Also, it is the part where the sample is established. At the
top, there is a total pressure sensor for monitoring the swelling pressure.
Figure 8 Schematic illustration of a constant-volume cell from Kiviranta and Kumpulainen [12]
The steps followed in this method are:
Firstly, the sample of a mixture of bentonite and sand is compacted at the
established density on the pedestal.
An initial vertical pressure is applied to the sample and the distilled water is
supplied from the bottom while the specimen is confined. Distilled water is used
for saturation of the specimen.
The samples swells
After flooding the soil sample and
the reaching stable pressure, the swelling
pressure can be measured by the load
transducer.
During the test procedure, the volume
change is considered to be negligible.
[8, 10, 13, 18, 38]
Figure 9 Image of a constant-volume cell from
Kiviranta and Kumpulainen [11]
Compacted
sample
Load
transducer
Circulating
test solution
Porous
stone
Pedestal
O-Ring
The swelling pressure of bentonite and sand mixtures
16
4.2.2. Swelling deformation test
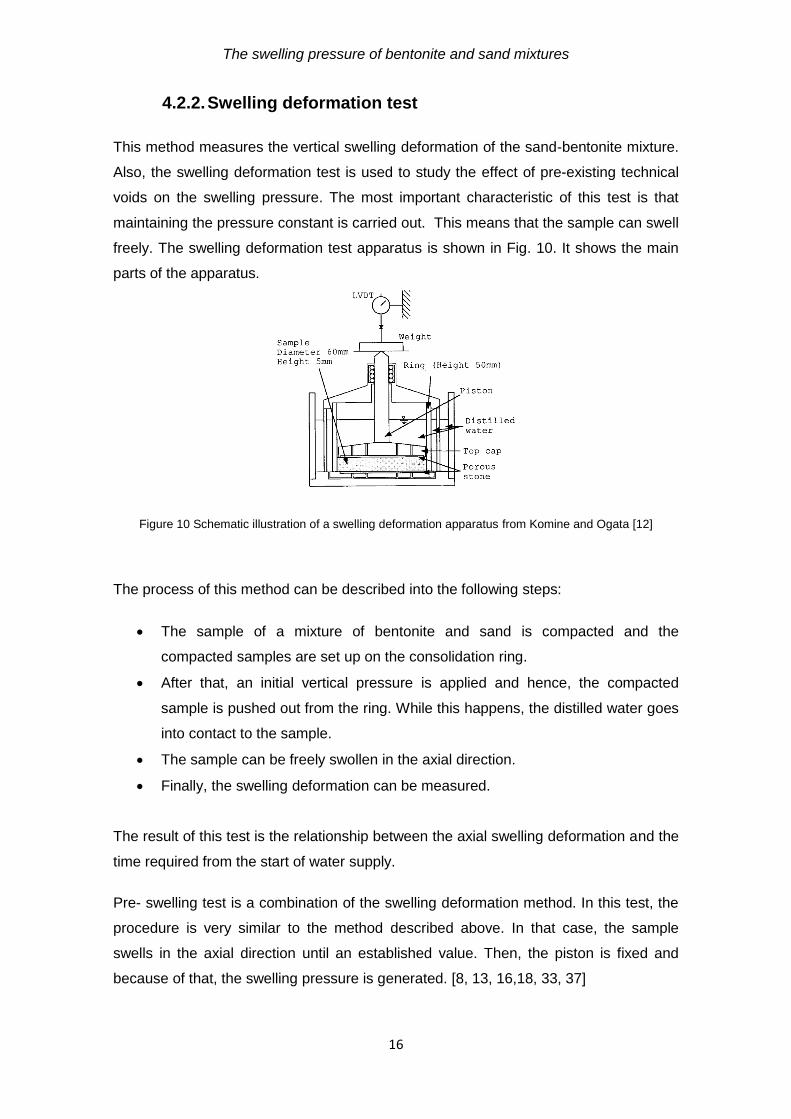
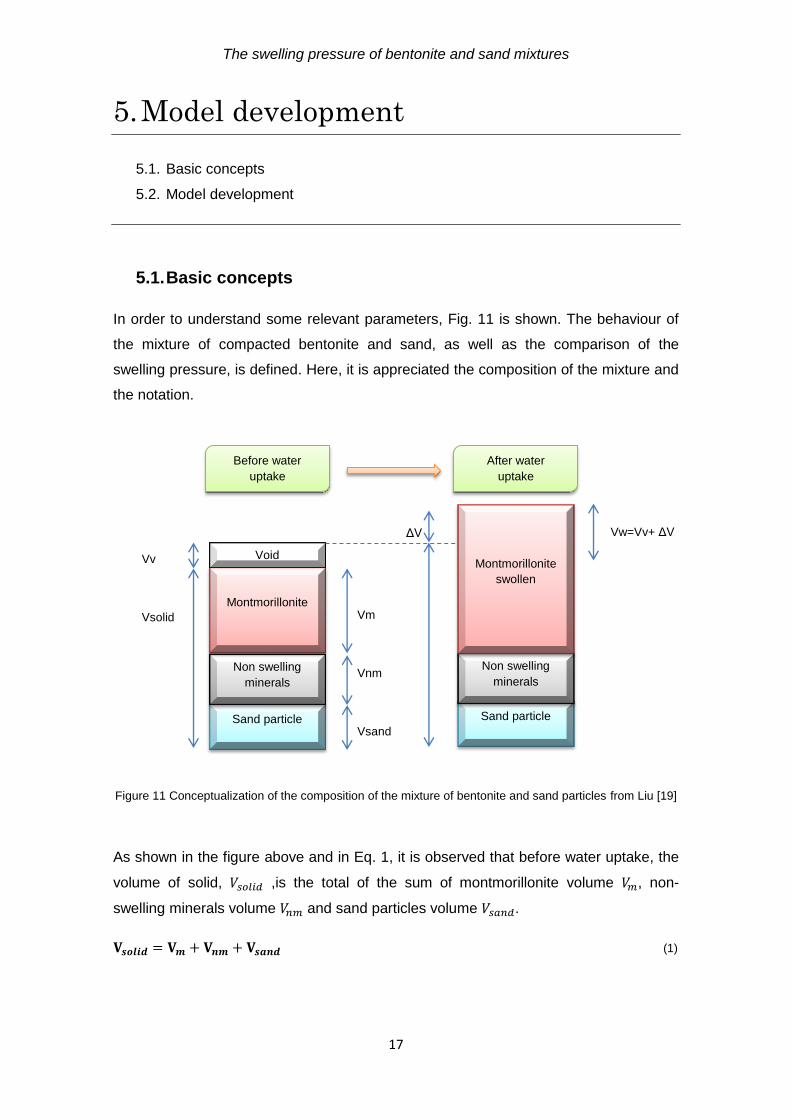
This method measures the vertical swelling deformation of the sand-bentonite mixture.
Also, the swelling deformation test is used to study the effect of pre-existing technical
voids on the swelling pressure. The most important characteristic of this test is that
maintaining the pressure constant is carried out. This means that the sample can swell
freely. The swelling deformation test apparatus is shown in Fig. 10. It shows the main
parts of the apparatus.
Figure 10 Schematic illustration of a swelling deformation apparatus from Komine and Ogata [12]
The process of this method can be described into the following steps:
The sample of a mixture of bentonite and sand is compacted and the
compacted samples are set up on the consolidation ring.
After that, an initial vertical pressure is applied and hence, the compacted
sample is pushed out from the ring. While this happens, the distilled water goes
into contact to the sample.
The sample can be freely swollen in the axial direction.
Finally, the swelling deformation can be measured.
The result of this test is the relationship between the axial swelling deformation and the
time required from the start of water supply.
Pre- swelling test is a combination of the swelling deformation method. In this test, the
procedure is very similar to the method described above. In that case, the sample
swells in the axial direction until an established value. Then, the piston is fixed and
because of that, the swelling pressure is generated. [8, 13, 16,18, 33, 37]
The swelling pressure of bentonite and sand mixtures
17
5. Model development
5.1. Basic concepts
5.2. Model development
5.1. Basic concepts
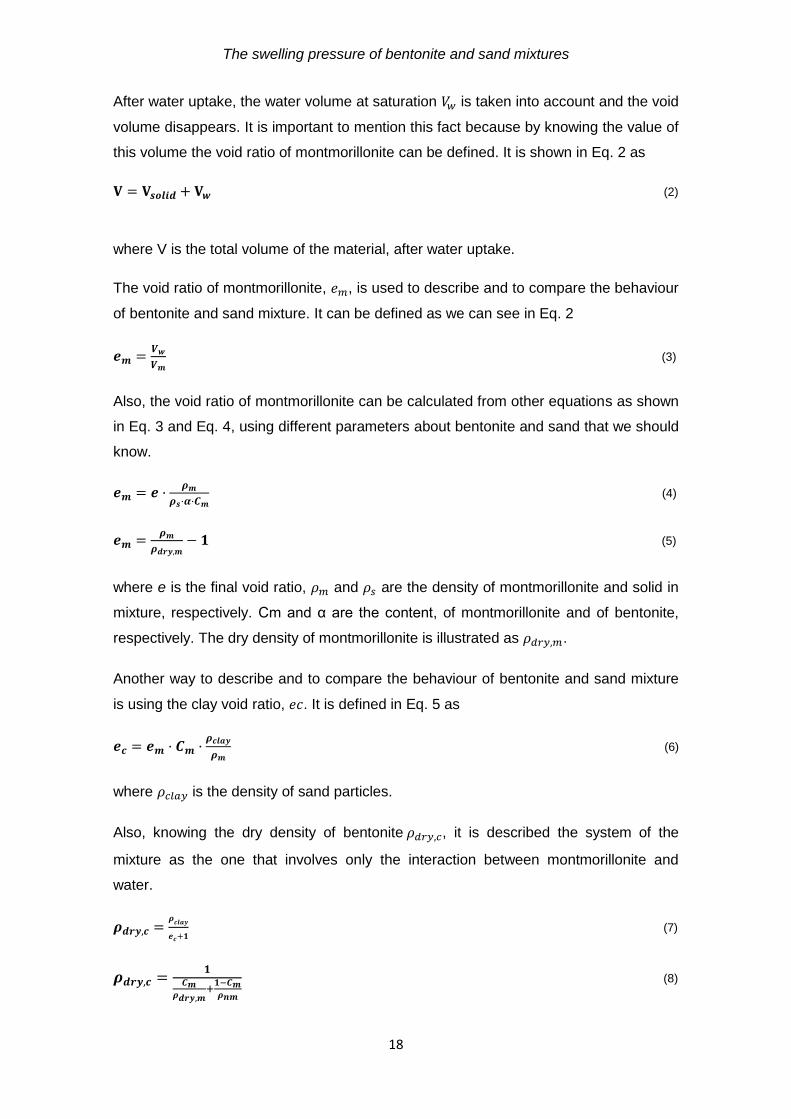
In order to understand some relevant parameters, Fig. 11 is shown. The behaviour of
the mixture of compacted bentonite and sand, as well as the comparison of the
swelling pressure, is defined. Here, it is appreciated the composition of the mixture and
the notation.
Figure 11 Conceptualization of the composition of the mixture of bentonite and sand particles from Liu [19]
As shown in the figure above and in Eq. 1, it is observed that before water uptake, the
volume of solid, ,is the total of the sum of montmorillonite volume , non-
swelling minerals volume and sand particles volume .
(1)
Sand particle
Non swelling
minerals
Montmorillonite
swollen
Sand particle
Non swelling
minerals
Montmorillonite
Void
Vm
Vnm
Vsand
Vv
Vsolid
ΔV
Vw=Vv+ ΔV
After water
uptake
Before water
uptake
The swelling pressure of bentonite and sand mixtures
18
After water uptake, the water volume at saturation is taken into account and the void
volume disappears. It is important to mention this fact because by knowing the value of
this volume the void ratio of montmorillonite can be defined. It is shown in Eq. 2 as
(2)
where V is the total volume of the material, after water uptake.
The void ratio of montmorillonite, , is used to describe and to compare the behaviour
of bentonite and sand mixture. It can be defined as we can see in Eq. 2
(3)
Also, the void ratio of montmorillonite can be calculated from other equations as shown
in Eq. 3 and Eq. 4, using different parameters about bentonite and sand that we should
know.
(4)
(5)
where e is the final void ratio, and are the density of montmorillonite and solid in
mixture, respectively. Cm and α are the content, of montmorillonite and of bentonite,
respectively. The dry density of montmorillonite is illustrated as .
Another way to describe and to compare the behaviour of bentonite and sand mixture
is using the clay void ratio, . It is defined in Eq. 5 as
(6)
where is the density of sand particles.
Also, knowing the dry density of bentonite , it is described the system of the
mixture as the one that involves only the interaction between montmorillonite and
water.
(7)
(8)
The swelling pressure of bentonite and sand mixtures
19
The non-swelling density is known as
These equations have been used in this thesis, but in other cases it could not be
known all the parameters required. Therefore, there are other equations using other
parameters and it shows in Liu, [18, 19].
5.2. Description of the model
In this section, I briefly present the model that was initially developed by Liu [19] to
predict the swelling pressures of different types of bentonite in dilute solutions [19].
Based on the thermodynamic relation and on the DLVO theory [16, 17,19, 24, 29, 34],
by also assuming that the montmorillonite particles are uniformly distributed throughout
the bentonite aggregate water system, the swelling pressure can generally be given as
(9)
In Eq. 8, is referred to the swelling pressure exerted in crystalline swelling
mechanism and it is based on the thermodynamic relation. In this case, the swelling
pressure depends only on the separation distance between the particles, h, referred to
the water uptake. This is because, as it is said before in chapter 3, crystalline swelling
is due mainly to hydration of the interlayer cations and the clay surface. Other forces
are slightly manifested.
Particularly, the swelling pressure can be defined as
⁄ (10)
where k and l are two constants, the pre-exponential factor and the decay length,
respectively.
On the other hand, and are, respectively, referred to the osmotic swelling
pressure due to the diffuse double layer and the van der Waals attraction respectively.
They are based on the DLVO theory.
The diffuse double layer swelling pressure depends on the separation distance
between particles h, on the ionic concentration of the pore solution c and on the
valence v of exchangeable cations.
(11)
The swelling pressure of bentonite and sand mixtures
20
In Eq. 10, R is the gas constant; T is the absolute temperature and is the scaled
potential at the mid-point among the plate-like montmorillonite particles.
Moreover, the van der Waals attraction depends only on the separation distance
between particles, h.
{
} (12)
where is the constant of Hamaker and is the thickness of montmorillonite
particles.
Having said that, we can proceed to demonstrate and discuss in the following chapter
for the predicted swelling pressure of different types of bentonites and bentonite-
aggregate mixtures in distilled water based on the model presented above.
The swelling pressure of bentonite and sand mixtures
21
6. Results and discussion
6.1. Results from experimental test
6.2. Validation of the model
6.3. Sensitivity analysis
6.3.1. Varying the stacked unit layers
6.3.2. Varying the montmorillonite content
6.3.3. Varying the amount of the exchangeable cations
6.3.4. Varying the ratio of crystalline swelling region
6.3.5. Varying the pre-exponential factor
6.3.6. Varying the decay length
6.1. Results from experimental test
In this work, for the purpose of comparisons, experimental results from literatures [8,
22, 31, 32, 33, 37] are used. The swelling pressures are presented with respect to the
dry density, the void ratio of the bentonite or void ratio of the montmorillonite from
different experimental studies. Those swelling pressure of different bentonite are also
compared with each other since, as it shown previously in the table 1, the bentonite
has got different properties from different studies.
The meaning of the names from the legend in Fig. 12-14 is described below in the table
2:
Table 2 Legend from Fig. 12, Fig. 13 and Fig. 14
Name from legend Study Bentonite content (%) Reference
W70 Wang 70 [38]
M5, M10, M20, M100 Mollins 5, 10, 20, 100 [23]
S10, S20, S100 Studds 10, 20, 100 [32]
T100 Tripathy 100 [34]
D10, D17, D20, D30, D50, D100 Sun 10, 17, 20 ,30 50, 100 [33]
[K(1), K(2), K(3), K(4)]100 Karland 100 [8]
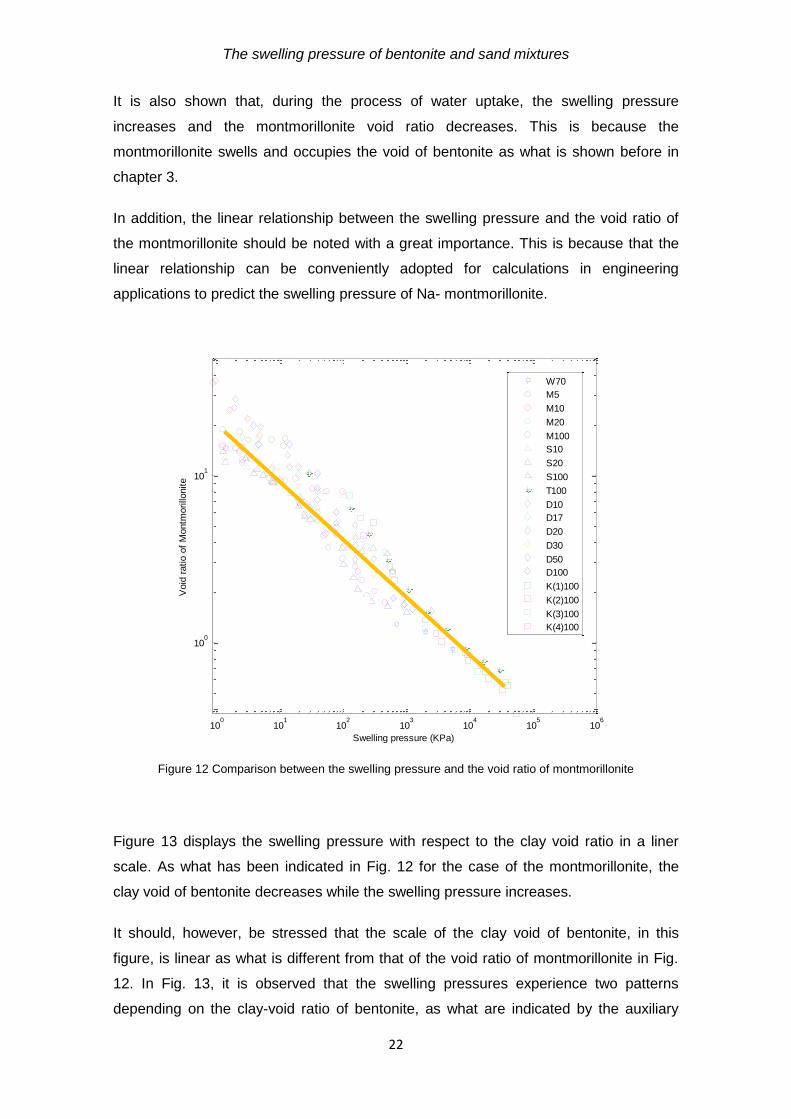
In the following figure, i.e., Fig. 12, it can be observed that there is a linear relationship
between the void ratio of the montmorillonite and the swelling pressure for each type of
bentonite.
The swelling pressure of bentonite and sand mixtures
22
It is also shown that, during the process of water uptake, the swelling pressure
increases and the montmorillonite void ratio decreases. This is because the
montmorillonite swells and occupies the void of bentonite as what is shown before in
chapter 3.
In addition, the linear relationship between the swelling pressure and the void ratio of
the montmorillonite should be noted with a great importance. This is because that the
linear relationship can be conveniently adopted for calculations in engineering
applications to predict the swelling pressure of Na- montmorillonite.
Figure 12 Comparison between the swelling pressure and the void ratio of montmorillonite
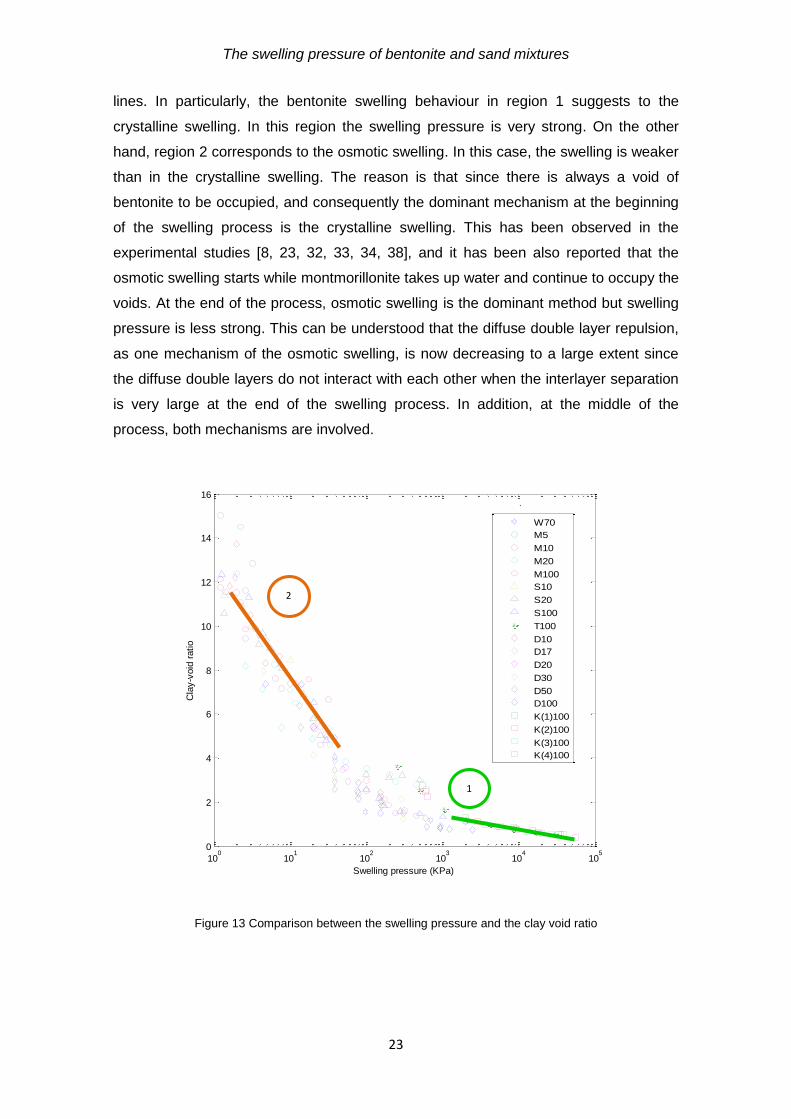
Figure 13 displays the swelling pressure with respect to the clay void ratio in a liner
scale. As what has been indicated in Fig. 12 for the case of the montmorillonite, the
clay void of bentonite decreases while the swelling pressure increases.
It should, however, be stressed that the scale of the clay void of bentonite, in this
figure, is linear as what is different from that of the void ratio of montmorillonite in Fig.
12. In Fig. 13, it is observed that the swelling pressures experience two patterns
depending on the clay-void ratio of bentonite, as what are indicated by the auxiliary
100
101
102
103
104
105
106
100
101
Swelling pressure (KPa)
Void
ratio o
f M
ontm
orillo
nite
W70
M5
M10
M20
M100
S10
S20
S100
T100
D10
D17
D20
D30
D50
D100
K(1)100
K(2)100
K(3)100
K(4)100
The swelling pressure of bentonite and sand mixtures
23
lines. In particularly, the bentonite swelling behaviour in region 1 suggests to the
crystalline swelling. In this region the swelling pressure is very strong. On the other
hand, region 2 corresponds to the osmotic swelling. In this case, the swelling is weaker
than in the crystalline swelling. The reason is that since there is always a void of
bentonite to be occupied, and consequently the dominant mechanism at the beginning
of the swelling process is the crystalline swelling. This has been observed in the
experimental studies [8, 23, 32, 33, 34, 38], and it has been also reported that the
osmotic swelling starts while montmorillonite takes up water and continue to occupy the
voids. At the end of the process, osmotic swelling is the dominant method but swelling
pressure is less strong. This can be understood that the diffuse double layer repulsion,
as one mechanism of the osmotic swelling, is now decreasing to a large extent since
the diffuse double layers do not interact with each other when the interlayer separation
is very large at the end of the swelling process. In addition, at the middle of the
process, both mechanisms are involved.
Figure 13 Comparison between the swelling pressure and the clay void ratio
100
101
102
103
104
105
0
2
4
6
8
10
12
14
16
Swelling pressure (KPa)
Cla
y-v
oid
ratio
100
101
102
103
104
105
106
100
101
Swelling pressure (KPa)
Void
ratio o
f M
ontm
orillo
nite
W70
M5
M10
M20
M100
S10
S20
S100
T100
D10
D17
D20
D30
D50
D100
K(1)100
K(2)100
K(3)100
K(4)100
1
2
The swelling pressure of bentonite and sand mixtures
24
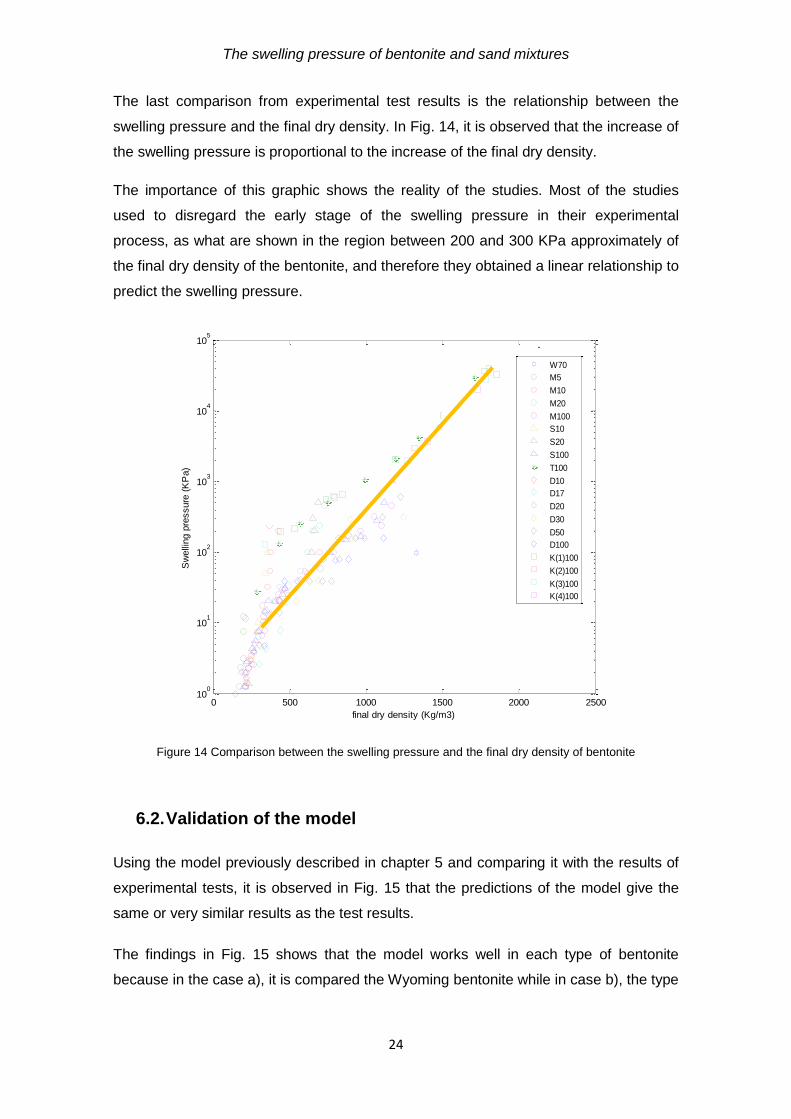
The last comparison from experimental test results is the relationship between the
swelling pressure and the final dry density. In Fig. 14, it is observed that the increase of
the swelling pressure is proportional to the increase of the final dry density.
The importance of this graphic shows the reality of the studies. Most of the studies
used to disregard the early stage of the swelling pressure in their experimental
process, as what are shown in the region between 200 and 300 KPa approximately of
the final dry density of the bentonite, and therefore they obtained a linear relationship to
predict the swelling pressure.
Figure 14 Comparison between the swelling pressure and the final dry density of bentonite
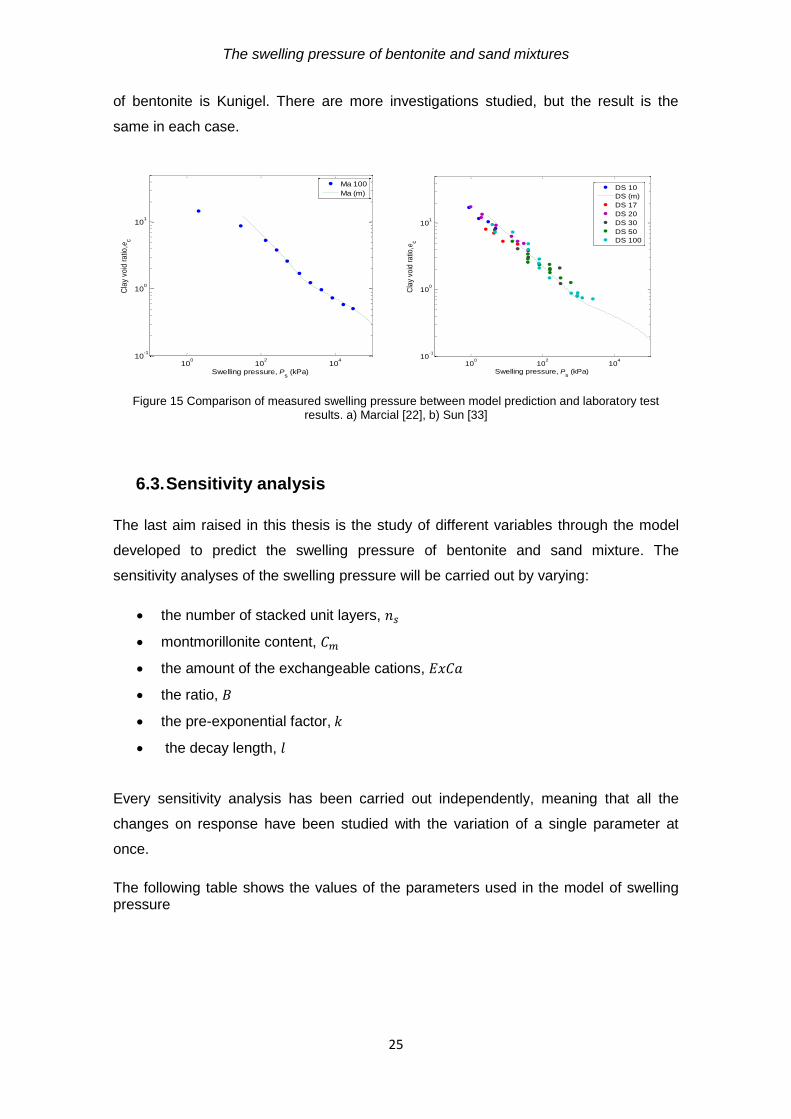
6.2. Validation of the model
Using the model previously described in chapter 5 and comparing it with the results of
experimental tests, it is observed in Fig. 15 that the predictions of the model give the
same or very similar results as the test results.
The findings in Fig. 15 shows that the model works well in each type of bentonite
because in the case a), it is compared the Wyoming bentonite while in case b), the type
0 500 1000 1500 2000 250010
0
101
102
103
104
105
final dry density (Kg/m3)
Sw
elli
ng p
ressure
(K
Pa)
100
101
102
103
104
105
106
100
101
Swelling pressure (KPa)
Void
ratio o
f M
ontm
orillonite
W70
M5
M10
M20
M100
S10
S20
S100
T100
D10
D17
D20
D30
D50
D100
K(1)100
K(2)100
K(3)100
K(4)100
The swelling pressure of bentonite and sand mixtures
25
of bentonite is Kunigel. There are more investigations studied, but the result is the
same in each case.
Figure 15 Comparison of measured swelling pressure between model prediction and laboratory test results. a) Marcial [22], b) Sun [33]
6.3. Sensitivity analysis
The last aim raised in this thesis is the study of different variables through the model
developed to predict the swelling pressure of bentonite and sand mixture. The
sensitivity analyses of the swelling pressure will be carried out by varying:
the number of stacked unit layers,
montmorillonite content,
the amount of the exchangeable cations,
the ratio,
the pre-exponential factor,
the decay length,
Every sensitivity analysis has been carried out independently, meaning that all the
changes on response have been studied with the variation of a single parameter at
once.
The following table shows the values of the parameters used in the model of swelling pressure
100
102
104
10-1
100
101
Swelling pressure, Ps (kPa)
Cla
y vo
id r
atio
, ec
Ma 100
Ma (m)
100
102
104
10-1
100
101
Swelling pressure, Ps (kPa)
Cla
y vo
id r
atio
, ec
DS 10
DS (m)
DS 17
DS 20
DS 30
DS 50
DS 100
The swelling pressure of bentonite and sand mixtures
26
Table 3 Physical constants used in the predictions from Liu [19]
Parameters Unit Value
Faraday constant (F) ⁄ 9.64853x
Gas constant (R) ⁄ 8.31446
Temperature (T) K 298
Permittivity of vacuum ⁄ 8.8542x
Relative dielectric constant of water - 78.54
Density of water ⁄ 1000
Density of montmorillonite ⁄ 2770
Thickness of the unit layers nm 0.96
Fixed separation between the Na-m unit layers nm 1.2
Hamaker constant J 2.2x
Reference pressure Pa 1000
6.3.1. Varying the number of stacked unit layers
The first sensitivity analyses studies the swelling pressure respect to the void ratio of
bentonite with the number of stacked unit layers from one to ten.
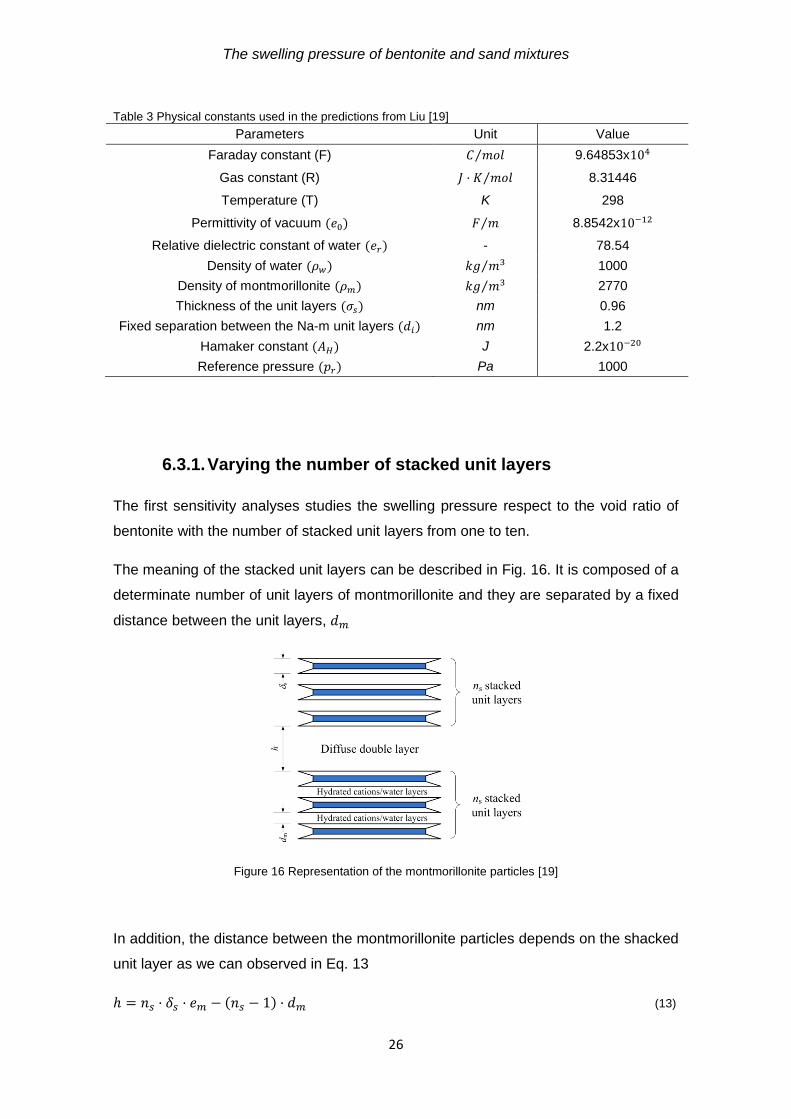
The meaning of the stacked unit layers can be described in Fig. 16. It is composed of a
determinate number of unit layers of montmorillonite and they are separated by a fixed
distance between the unit layers,
Figure 16 Representation of the montmorillonite particles [19]
In addition, the distance between the montmorillonite particles depends on the shacked
unit layer as we can observed in Eq. 13
(13)
The swelling pressure of bentonite and sand mixtures
27
where is the thickness of the unit layers of montmorillonite.
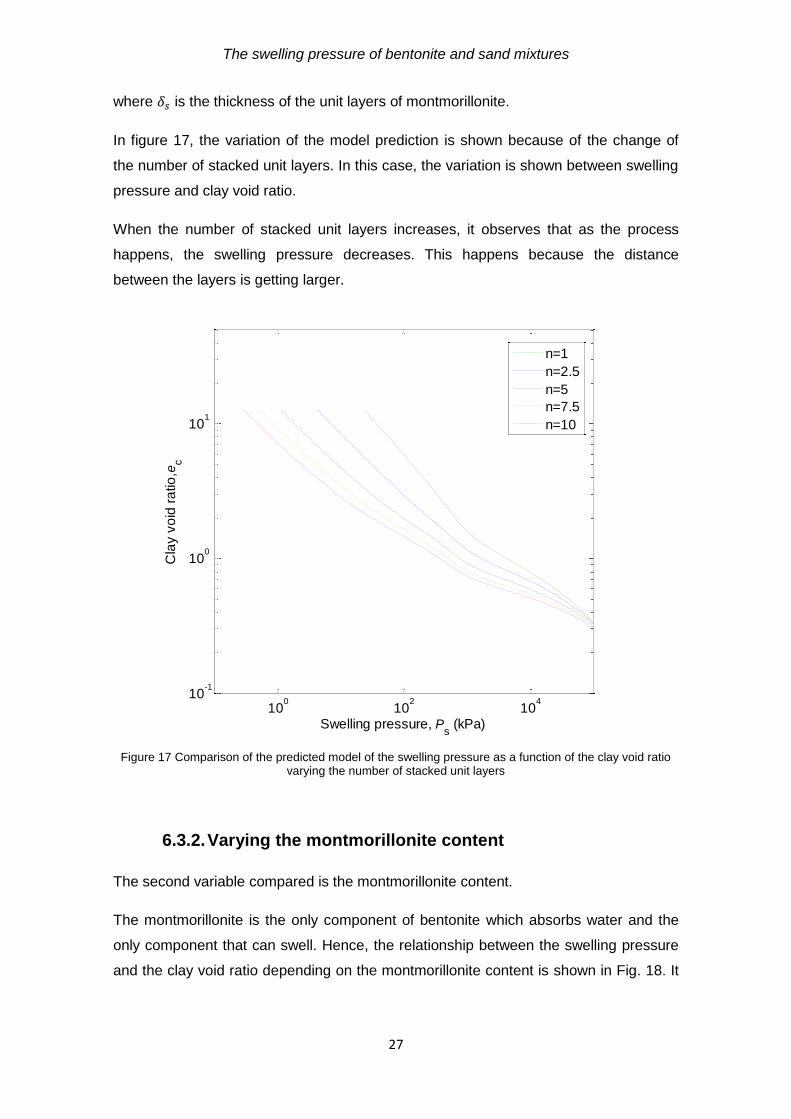
In figure 17, the variation of the model prediction is shown because of the change of
the number of stacked unit layers. In this case, the variation is shown between swelling
pressure and clay void ratio.
When the number of stacked unit layers increases, it observes that as the process
happens, the swelling pressure decreases. This happens because the distance
between the layers is getting larger.
Figure 17 Comparison of the predicted model of the swelling pressure as a function of the clay void ratio varying the number of stacked unit layers
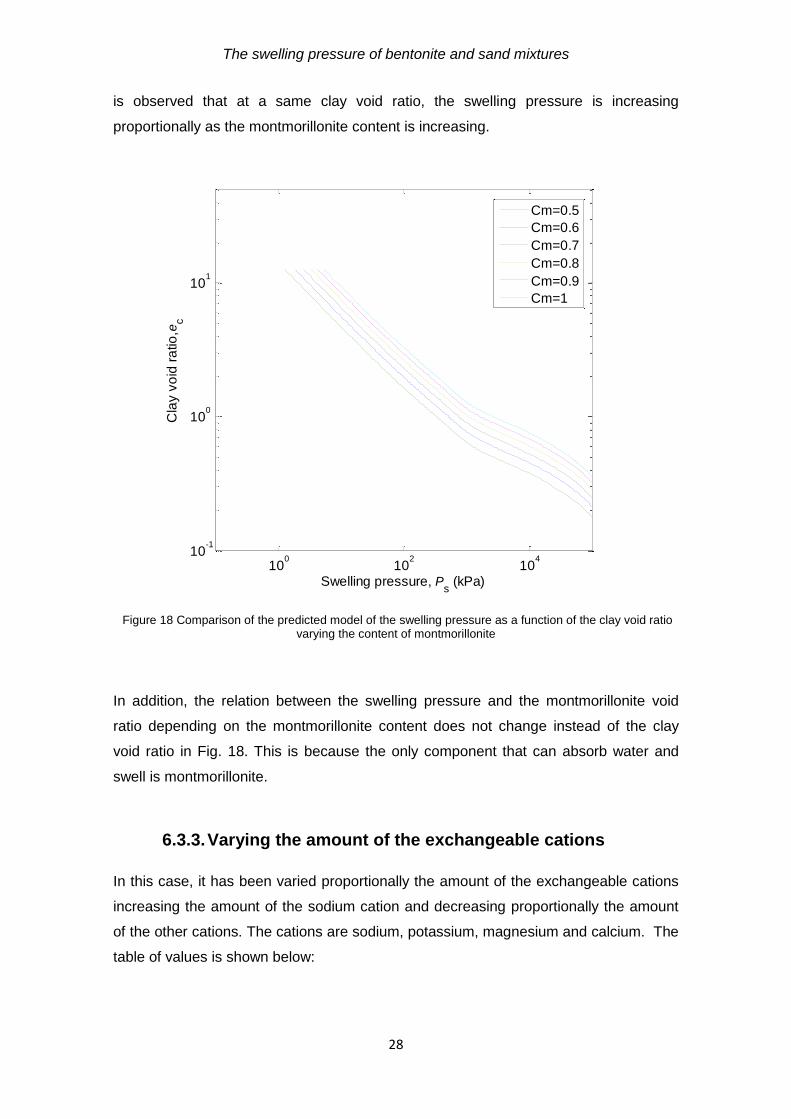
6.3.2. Varying the montmorillonite content
The second variable compared is the montmorillonite content.
The montmorillonite is the only component of bentonite which absorbs water and the
only component that can swell. Hence, the relationship between the swelling pressure
and the clay void ratio depending on the montmorillonite content is shown in Fig. 18. It
100
102
104
10-1
100
101
Swelling pressure, Ps (kPa)
Cla
y v
oid
ra
tio
, ec
n=1
n=2.5
n=5
n=7.5
n=10
The swelling pressure of bentonite and sand mixtures
28
is observed that at a same clay void ratio, the swelling pressure is increasing
proportionally as the montmorillonite content is increasing.
Figure 18 Comparison of the predicted model of the swelling pressure as a function of the clay void ratio varying the content of montmorillonite
In addition, the relation between the swelling pressure and the montmorillonite void
ratio depending on the montmorillonite content does not change instead of the clay
void ratio in Fig. 18. This is because the only component that can absorb water and
swell is montmorillonite.
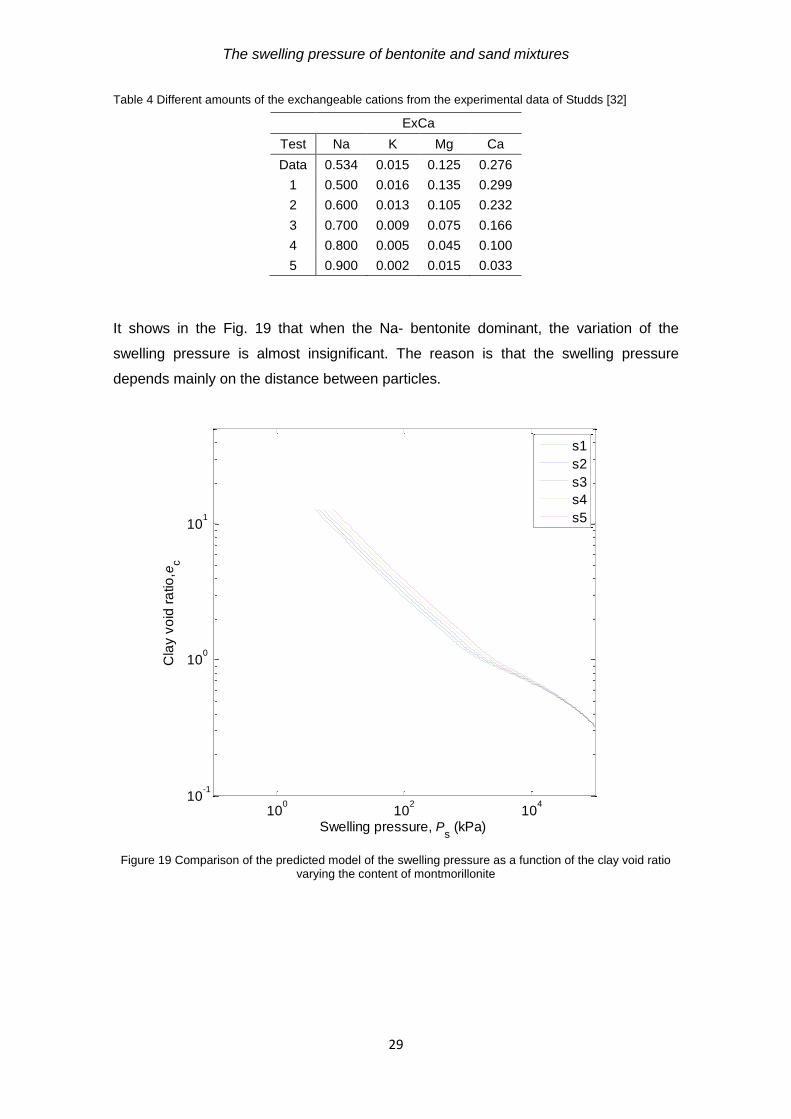
6.3.3. Varying the amount of the exchangeable cations
In this case, it has been varied proportionally the amount of the exchangeable cations
increasing the amount of the sodium cation and decreasing proportionally the amount
of the other cations. The cations are sodium, potassium, magnesium and calcium. The
table of values is shown below:
100
102
104
10-1
100
101
Swelling pressure, Ps (kPa)
Cla
y v
oid
ra
tio
, ec
Cm=0.5
Cm=0.6
Cm=0.7
Cm=0.8
Cm=0.9
Cm=1
The swelling pressure of bentonite and sand mixtures
29
Table 4 Different amounts of the exchangeable cations from the experimental data of Studds [32]
It shows in the Fig. 19 that when the Na- bentonite dominant, the variation of the
swelling pressure is almost insignificant. The reason is that the swelling pressure
depends mainly on the distance between particles.
Figure 19 Comparison of the predicted model of the swelling pressure as a function of the clay void ratio varying the content of montmorillonite
100
102
104
10-1
100
101
Swelling pressure, Ps (kPa)
Cla
y v
oid
ra
tio
, ec
s1
s2
s3
s4
s5
ExCa
Test Na K Mg Ca
Data 0.534 0.015 0.125 0.276
1 0.500 0.016 0.135 0.299
2 0.600 0.013 0.105 0.232
3 0.700 0.009 0.075 0.166
4 0.800 0.005 0.045 0.100
5 0.900 0.002 0.015 0.033
The swelling pressure of bentonite and sand mixtures
30
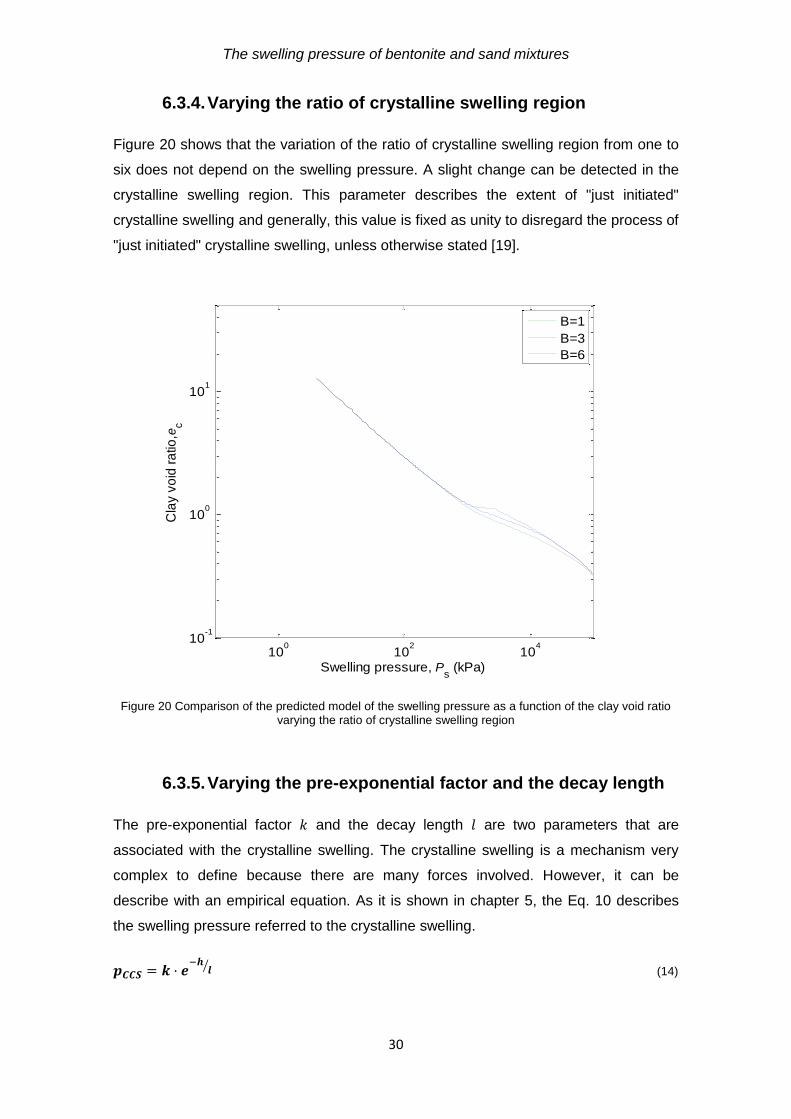
6.3.4. Varying the ratio of crystalline swelling region
Figure 20 shows that the variation of the ratio of crystalline swelling region from one to
six does not depend on the swelling pressure. A slight change can be detected in the
crystalline swelling region. This parameter describes the extent of "just initiated"
crystalline swelling and generally, this value is fixed as unity to disregard the process of
"just initiated" crystalline swelling, unless otherwise stated [19].
Figure 20 Comparison of the predicted model of the swelling pressure as a function of the clay void ratio varying the ratio of crystalline swelling region
6.3.5. Varying the pre-exponential factor and the decay length
The pre-exponential factor and the decay length are two parameters that are
associated with the crystalline swelling. The crystalline swelling is a mechanism very
complex to define because there are many forces involved. However, it can be
describe with an empirical equation. As it is shown in chapter 5, the Eq. 10 describes
the swelling pressure referred to the crystalline swelling.
⁄ (14)
100
102
104
10-1
100
101
Swelling pressure, Ps (kPa)
Cla
y v
oid
ra
tio, e
c
B=1
B=3
B=6
The swelling pressure of bentonite and sand mixtures
31
On the one hand, if the distance between particles is equal to zero, the crystalline
swelling pressure is equal to . Therefore, the crystalline swelling pressure reaches its
maximum value. On the other hand, if is equal to the decay length , the crystalline
swelling pressure decreases.
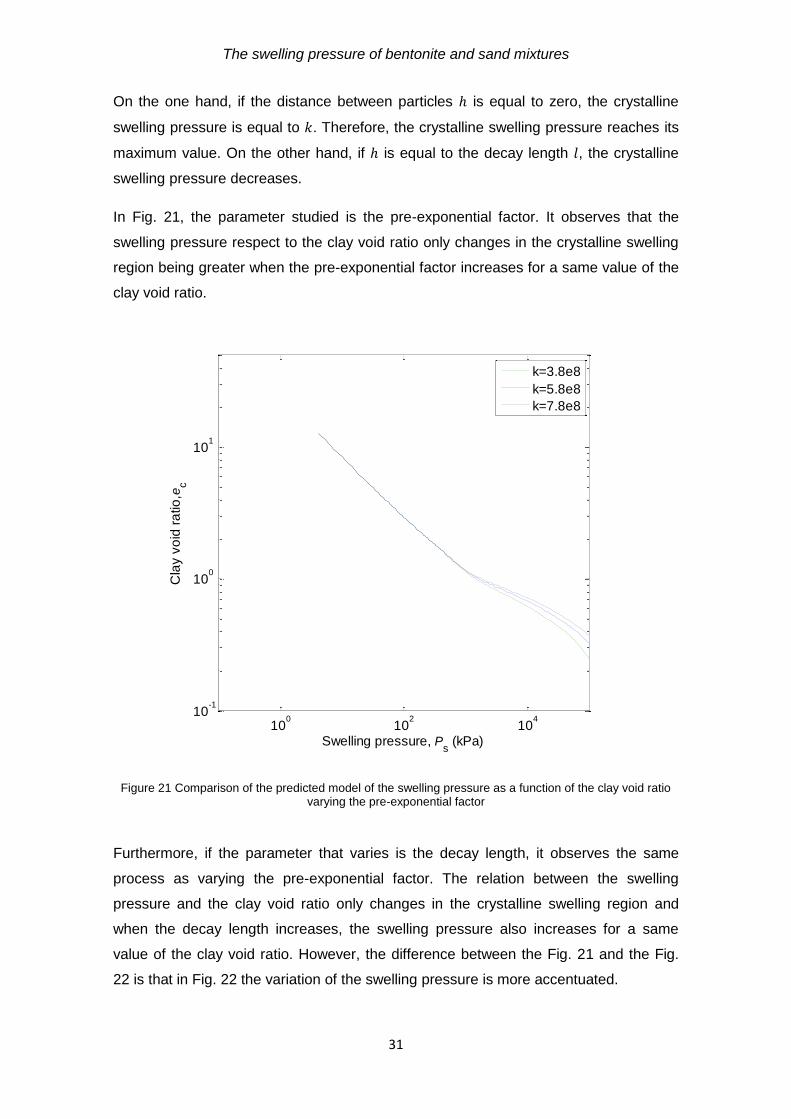
In Fig. 21, the parameter studied is the pre-exponential factor. It observes that the
swelling pressure respect to the clay void ratio only changes in the crystalline swelling
region being greater when the pre-exponential factor increases for a same value of the
clay void ratio.
Figure 21 Comparison of the predicted model of the swelling pressure as a function of the clay void ratio varying the pre-exponential factor
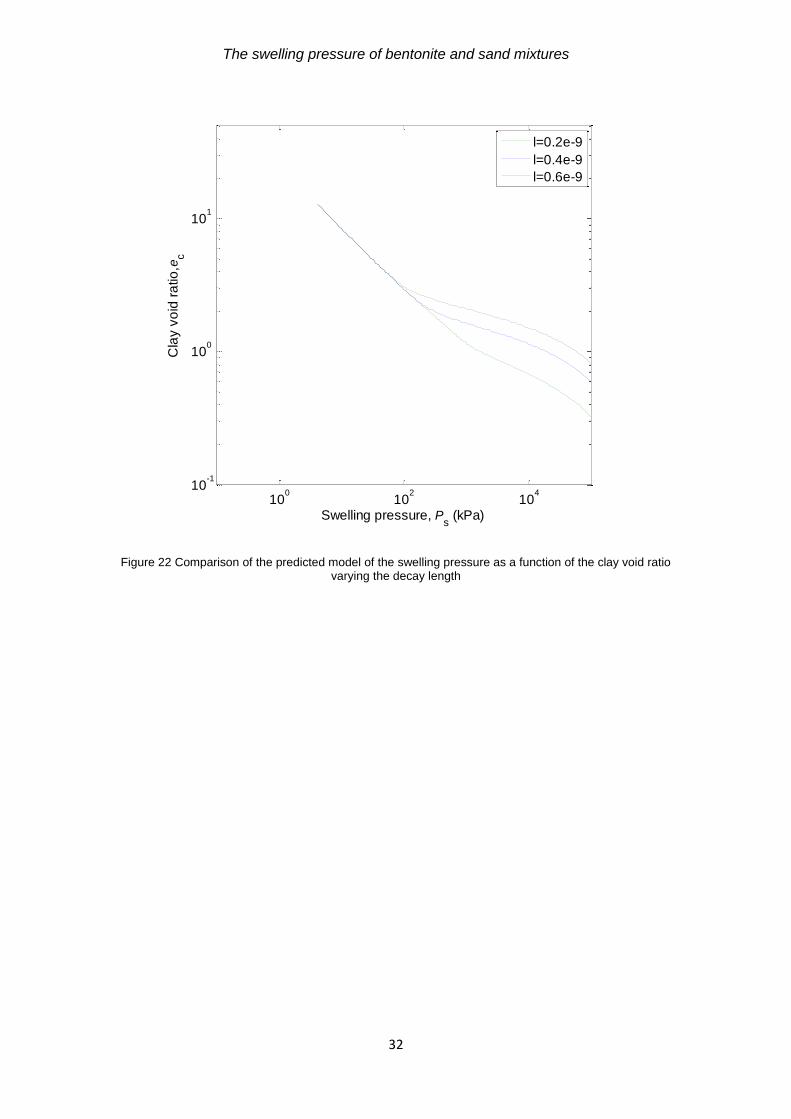
Furthermore, if the parameter that varies is the decay length, it observes the same
process as varying the pre-exponential factor. The relation between the swelling
pressure and the clay void ratio only changes in the crystalline swelling region and
when the decay length increases, the swelling pressure also increases for a same
value of the clay void ratio. However, the difference between the Fig. 21 and the Fig.
22 is that in Fig. 22 the variation of the swelling pressure is more accentuated.
100
102
104
10-1
100
101
Swelling pressure, Ps (kPa)
Cla
y v
oid
ra
tio
, ec
k=3.8e8
k=5.8e8
k=7.8e8
The swelling pressure of bentonite and sand mixtures
32
Figure 22 Comparison of the predicted model of the swelling pressure as a function of the clay void ratio varying the decay length
100
102
104
10-1
100
101
Swelling pressure, Ps (kPa)
Cla
y v
oid
ra
tio
, ec
l=0.2e-9
l=0.4e-9
l=0.6e-9
The swelling pressure of bentonite and sand mixtures
33
7. Conclusions
By summing up the results of this study on the behavior of the swelling pressure, this
chapter summarizes the conclusions obtained from those results.
The conclusions have been divided into two different sections. Firstly, it will describe
the conclusions from the results of the experimental test and then, the conclusions from
the results taken from the model of the swelling pressures.
From the results of the different investigations aforementioned, the results of the
swelling pressure of different kind of bentonites respect to the clay void ratio, the void
ratio of montmorillonite and to the final dry density are compared. The sample used in
each test is considered to be completely saturated and the Na- montmorillonite is
predominant. Also the test solution is distilled water.
The first conclusion is that in the Na-montmorillonite there is only a unique relation
among different bentonites. It is also observed that the compacted bentonite and sand
mixture swollen depend on their final dry density. These two conclusions are very
useful in engineering applications. The unique relation and the linear relation are
important for calculations in engineering applications to predict the swelling pressure of
Na- montmorillonite.
The other conclusion from the results of experimental tests is that the relation between
the swelling pressure and the clay void ratio show the mechanism on the swelling
pressure, crystalline swelling and osmotic swelling.
On the other hand, a mechanistic model has been developed and validated. The model
is used to predict the swelling pressure of bentonite and sand mixture in distilled water,
considering the Na-dominant bentonite and sand mixture.
Comparing to the predictions of the model and the results of experimental tests it can
be concluded that the model in each kind of bentonite works well because both
processes describe a same relation.
The model is also tested with a sensitivity analysis to obtain the different behaviours of
the swelling pressure by varying several parameters. The crystalline swelling depends
on the pre-exponential factor and on the decay length and the ratio of the crystalline
swelling region describes the extent of "just initiated" crystalline swelling. It has been
noted that the swelling pressure depends mainly on the distance between particles.
The swelling pressure of bentonite and sand mixtures
34
Also, it has been observed that the swelling pressure increases when the number of
stacked unit layers decreases. Moreover, the only component of bentonite that can
absorb water and swell is montmorillonite.
The sensitivity analyses indicate that the number of stacked unit layers and the decay
length are parameters which should be fitted more carefully for future studies to
validate this model with different bentonites.
To conclude this thesis, an idea of the future research should be focused on trying to
find an empirical expression on the relationship between swelling pressure and final dry
density. Also, this model can be used for engineering applications.
The swelling pressure of bentonite and sand mixtures
35
References
1. Astudillo, J.P., The deep geological storage. General Principles, National
Radioactive Waste Company, Enresa, 2001.
2. Clem, A.G. and Doehler W.R., Industrial Applications of bentonite, American
Colloid Company, Skokie, Illinois.
3. Delage P. Microstructure features in the behavior of engineered barriers for
nuclear waste disposal. In: Schanz T ed. Proc Int. Conf. on Mechanics of
Unsaturated Soils. Weimar, Germany: Springer, 11-32, 2007.
4. European Commission, Seventh situation report radioactive waste and spent
fuel management in the European Union, Brussels 2011.
5. Foster, M.D., The relation between composition and swelling in clays, U.S.
Geological Survey, v. 3; no. 1; p. 205-220, 1954.
6. International maritime organization, Convention on the Prevention of Marine
Pollution by Dumping of Wastes and Other Matter, 1972.
7. International nuclear societies council, Radioactive Waste, Action Plan 1997-
98. http://www.ne.jp/asahi/mh/u/INSCAP/Radwaste.html, Consulted: October
2012.
8. Karnland, O., Muurinen, A., and Karlsson, F., Bentonite swelling pressure in
NaCl solutions – Experimentally determined data and model calculations, In:
Alonso, E., Ledesma, A. (eds), Advances in Understanding Engineered Clay
Barriers, Taylor & Francis Group, London, 241–256, 2005.
9. Karnland, O., Olsson, S., and Nilsson, U., Mineralogy and sealing properties of
various bentonites and smectite-rich clay materials, SKB Technical Report TR-
06-30, Swedish Nuclear Fuel and Waste Management Co., Stockholm,
Sweden, 2006.
10. Karnland, O., Nilsson, U., Weber, H., and Wersin, P., Sealing ability of
Wyoming bentonite pellets foreseen as buffer material-Laboratory results, Phys.
Chem. Earth, Parts A/B/C, 33, S472–S475, 2008.
The swelling pressure of bentonite and sand mixtures
36
11. Kiviranta, L. and Kumpulainen, S., Quality control and characterization of
bentonite materials, Working report 2011-84, Posiva Oy, 2011.
12. Komine, H., and Ogata, N., Prediction for swelling characteristics of compacted
bentonite, Can. Geotech. J., 33, 11–22, 1996.
13. Komine, H., and Ogata, N., Experimental study on swelling characteristics of
sand-bentonite mixture for nuclear waste disposal, Soils Found., 39, 83–97,
1999.
14. Komine, H., Simplified for swelling characteristics of bentonites, Engineering
Geology 71, 265–279, 2004.
15. Komine, H., Evaluation of swelling behavior of buffer materials containing
bentonite for repositories of high-level nuclear waste, Central Research Institute
of Electric Power Industry, Japan.
16. Laird, D.A., Influence of layer charge on swelling of smectites, Applied Clay
Science 34, 74-87, 2006.
17. Liu, L. and Neretnieks, I., Interaction between colloidal particles, SKB Technical
Report TR-10-26, Swedish Nuclear Fuel and Waste Management Co.,
Stockholm, Sweden, 2010.
18. Liu L.C., Hydraulic properties of unsaturated bentonite, Department of Chemical
Engineering and Technology, Royal Institute of Technology, 2012.
19. Liu L.C., Prediction of swelling pressures of different types of bentonite in dilute
solutions, submitted for publication, 2013.
20. Madsen, F.T., and Müller-Vonmoos, M., The swelling behavior of clay, Applied
Clay Science, 4, 143–156, 1989.
21. Mahmoud N.S, Abdellatif M. M., Classification of radioactive wastes and their
derived release limits from near surface repository: Proposed approach,
National Center for Nuclear Safety and Radiation Control, Atomic energy
Authority, International journal of environmental sciences, Volume 2, No 2,
2011.
22. Marcial, D., Delage, P., and Cui, Y.J., On the high stress compression of
bentonites, Can. Geotech. J., 39, 812–820, 2002.
The swelling pressure of bentonite and sand mixtures
37
23. Mollins, L.H., Stewart, D.I., and Cousens, T.W., Predicting the properties of
bentonite-sand mixtures, Clay Miner., 31, 243–252, 1996.
24. Philips, A., Tripathy, S., Swelling pressures of some initially saturated and
compacted saturated bentonites, International Journal of Advanced Technology
in Civil Engineering, 64-69.
25. Posiva Oy, Final disposal facility, Olkiluoto, FI-27160 Eurajoki, Finland
http://www.posiva.fi/en/final_disposal/final_disposal_facility, Consulted:
September, 2012.
26. Pusch , R., A. Muurinen, J. Lehikoinen, J. Bors, and T. Erikson, Microstructural
and chemical parameters of bentonite as determinants of waste isolation
efficiency, EUR 18950 EN, Luxemburg 1999.
27. Rautioaho, E. and Korkiala-Tanttu, L., Bentomap: Survey of bentonite tunnel
backfill knowledge, VTT Working Papers 133, 2009.
28. Rempe, N.T., Permanent underground repositories for radioactive waste,
Progress in nuclear energy 49, 365-374, 2007.
29. Schanz, T., and Tripathy, S., Swelling pressures of a divalent-rich bentonite:
diffuse double layer theory revisited, Water Resour. Res., 45, W00C12, doi:
10.1029/2007WR006495, 2009.
30. SKB, Our method of final disposal, Svensk Kärnbbränslehantering AB
http://www.skb.se/Templates/Standard____24109.aspx, Consulted: September,
2012.
31. Sposito, G., The Surface Chemistry of Soils. Oxford Press, New York, 1984.
32. Studds, P.G., Stewart, D.I., and Cousens, T.W., The effects of salt solutions on
the properties of bentonite-sand mixtures, Clay Miner., 33, 651–660, 1998.
33. Sun, D.A., Cui, H., and Sun, W., Swelling of compacted sand-bentonite
mixtures, Appl. Clay Sci., 43, 485–492, 2009.
34. Tripathy, S., and Schanz, T., Compressibility behavior of clays at large
pressures, Can. Geotech. J., 44, 355–362, 2007.
The swelling pressure of bentonite and sand mixtures
38
35. Van Olphen, H., An Introduction to Clay Colloid Chemistry: For Clay
Technologists, Geologists, and Soil Scientists, John Wiley and Sons, New York,
1977.
36. Villar, M.V., Thermo-hydro-mechanical characterization of a bentonite from
Cabo de Gata, University Complutense of Madrid, Department of Geodynamic,
Enresa, 2002.
37. Wang, J., et.al, Deep geological disposal of high-level radioactive wastes in
China, Chinese Journal of Rock Mechanics and Engineering, Vol. 25, Num. 4,
China, 2006.
38. Wang, Q., Tang, A.M., Cui, Y.J., Delage, P., and Gatmiri, B., Experimental
study on the swelling behavior of bentonite/claystone mixture, Eng. Geol., 124,
59–66, 2012.
39. WNA, Radioactive Waste Management, WNA World Nuclear Association. .
http://www.world-nuclear.org/info/inf04.html, Consulted: September, 2012.
40. Yong, R.N., Overview of modeling of clay microstructure and interactions for
prediction of waste isolation barrier performance, Engineering Geology, 54, 83–
91, 1999.
41. Yong, R.N., Soil suction and soil-water potentials in swelling clays in
engineered clay barriers, Engineering Geology, 54, 3–13, 1999.