hydrologic aspects of freshening upper …aquaticcommons.org/1207/1/mann_hyrologic.pdfhydrologic...
TRANSCRIPT
STATE OF FLORIDADEPARTMENT OF NATURAL RESOURCES
Randolph Hodges, Executive Director
DIVISION OF INTERIOR RESOURCESRobert O. Vernon, Director
BUREAU OF GEOLOGYCharles W. Hendry, Jr., Chief
Information Circular No. 76
HYDROLOGIC ASPECTS OF FRESHENINGUPPER OLD TAMPA BAY, FLORIDA
ByJ. A. Mann
Prepared by theUNITED STATES GEOLOGICAL SURVEY
in cooperation withSOUTHWEST FLORIDA WATER MANAGEMENT DISTRICT
and theBUREAU OF GEOLOGY
FLORIDA DEPARTMENT OF NATURAL RESOURCES
TALLAHASSEE1972
Completed manuscript receivedFebruary 1, 1972
Printed for the Florida Department of Natural ResourcesDivision of Interior Resources
Bureau of Geologyby Rose Printing Company
Tallahassee, Florida
Tallahassee1972
ii
CONTENTS
PageAbstract .................................. ....... 1Introduction ....................................... 2
Purpose and scope .............. ................... 4Methods of investigation .................... .......... 4Acknowledgments ........... . .... ............... . 6Previous investigations ............ ......... ......... . 6
Description of the surrounding area ........................... 7Topography and drainage ............................. 7Culture and development ............................. 9Climate ................... . .................. 11Geology ...................................... 11
Hydrology ................... . .................... 15Runoff to the proposed lake ............................ 15
Inflow during average and above average conditions . . . . . . . . . ... 16Inflow during a critically dry year ...................... 18
Chemical characteristics of surface water . . . . . . . . . . . . . . .. ... . 19Rate of freshening ................... .............. 22Ground water .... ............... . .............. 24
Shallow aquifer ...................... .......... 24Floridan aquifer ............................... 26
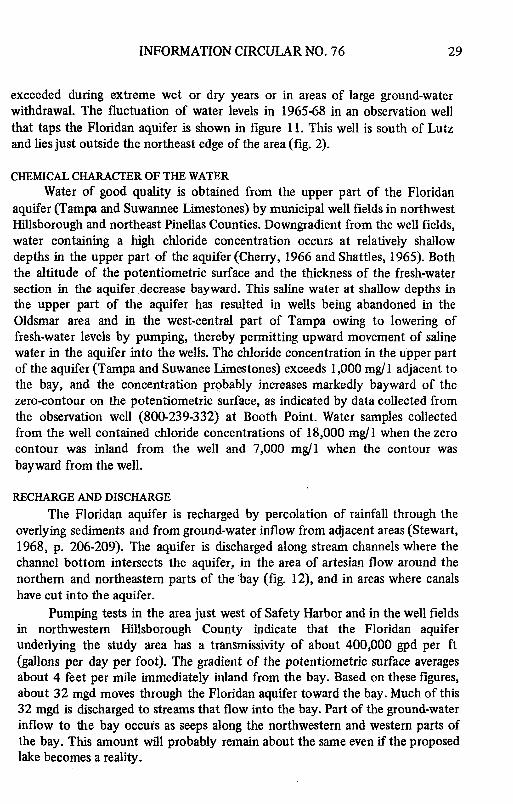
Fluctuations of the potentiometric surface . . . . . . . . . . ... 28Chemical character of the water . . . . . . . . . . . . . . .. .. . 29Recharge and discharge . . . . . . . . . . . . . . . . . . . . . ... 29
Hydraulic interconnection ............................. 30Effects of freshening on the aquifer system . . . . . . . . . . . . . . .. .. . 33
Summary and conclusions ................................ 35References ....................... . ......... ........ 38
ILLUSTRATIONS
Figure Page
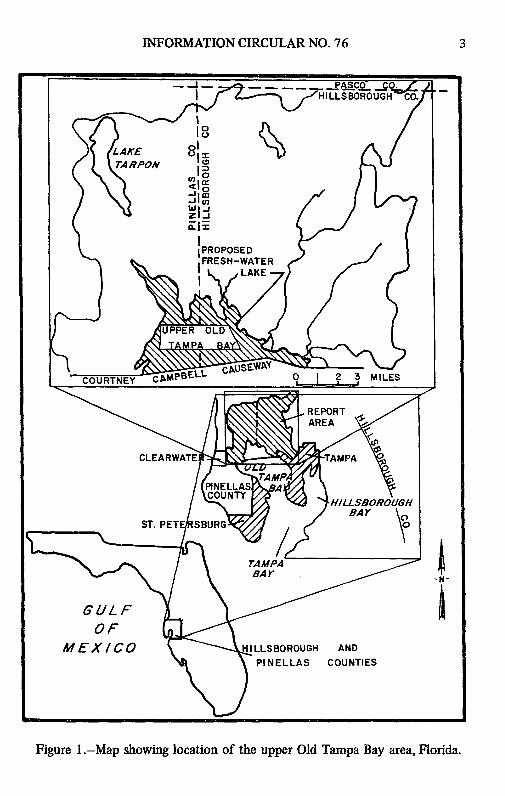
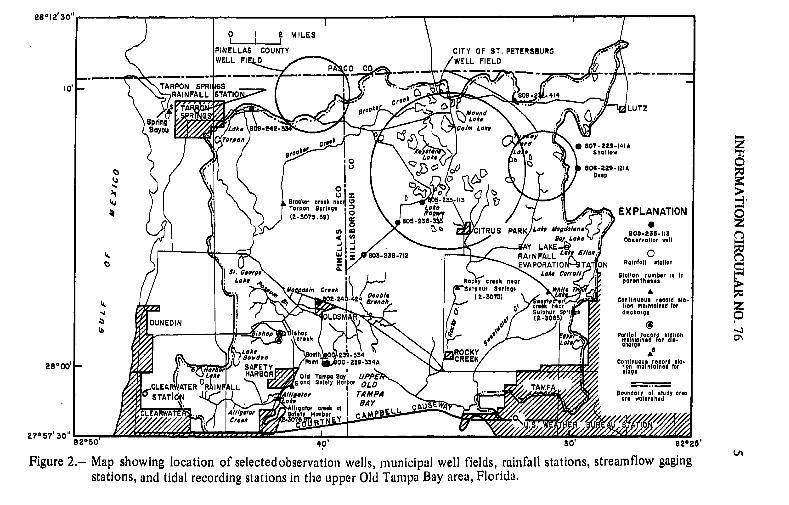
1 Map showing location of the upper Old Tampa Bay area, Florida. . . . . . . . . 32 Map showing location of selected observation wells, municipal well fields, rainfall
stations, stream-flow gaging stations, and tidal recording stations in the upper OldTampa Bay area, Florida. ................ . .............. 5
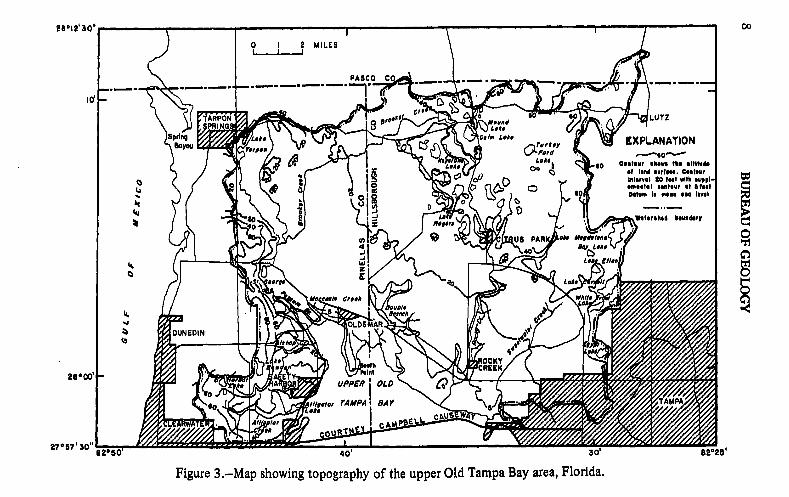
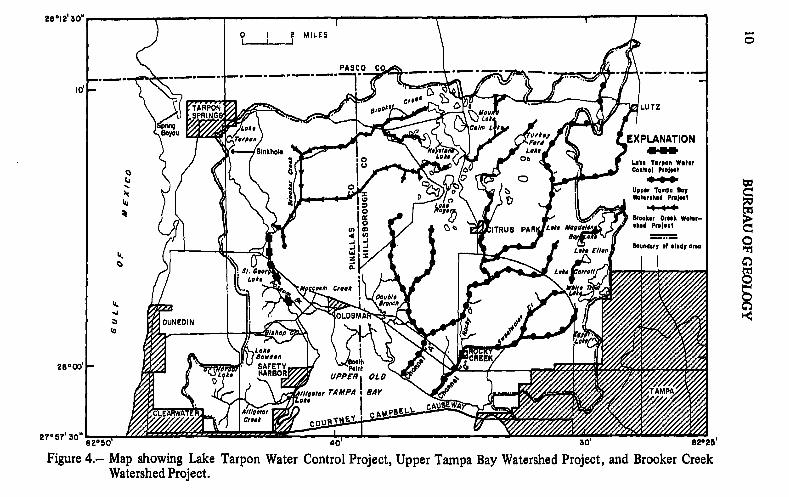
3 Map showing topography of the upper Old Tampa Bay area, Florida. . . . . . . 84 Map showing Lake Tarpon Water Control Project, Upper Tampa Bay Watershed
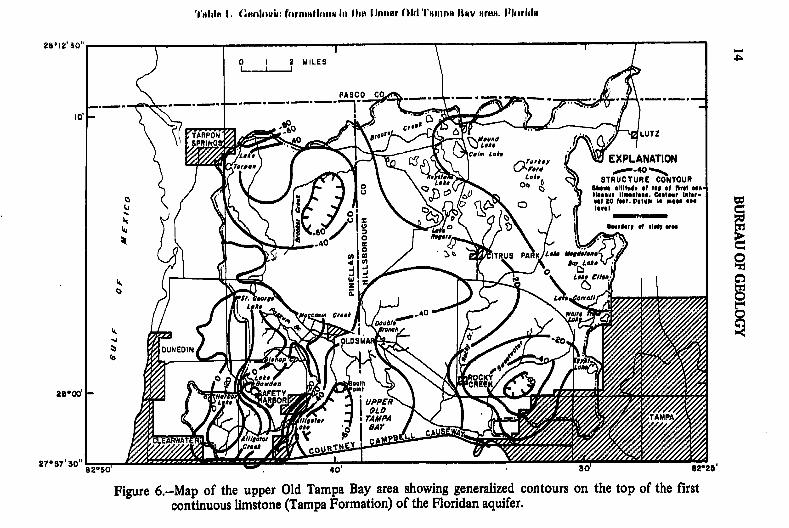
Project, and Brooker Creek Watershed Project. . . . . . . . . . . . . . . . .. . 105 Mean monthly rainfall, evaporation, and runoff, 1953-66. . . . . . . . . . ... 136 Map of the upper Old Tampa Bay area showing generalized contours on the top of
the first continuous limestone (Tampa Formation) of the Floridan aquifer. . . . 147 Cumulative total rainfall on, evaporation from, and inflow to proposed
fresh-water lake including Lake Tarpon-Brooker Creek watershed. . . . . . ... 178 Relation between specific conductance and discharge of Sweetwater Creek near
Sulphur Springs. ........... ..... .............. . . 20
iiia.o
ILLUSTRATIONS
Figure Page
9 Chloride concentrations at sites sampled in upper Old Tampa Bay and location ofauger holes. ................... ............... . 21
10 Calculated rate of freshening of proposed lake by dilution. (Includes inflow fromLake Tarpon-Brooker Creek watershed). . . . . . . . . . . . . . . .. ... . 23
11 Maximum and minimum monthly water levels in a shallow and a deep well nearthe northeast edge of the study area. . . . . . . . . . . . . . . . . . .. . . 25
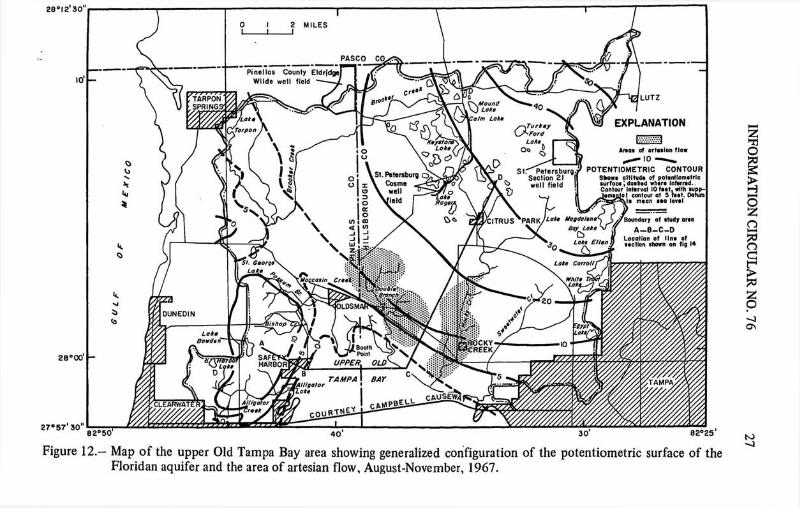
12 Map of the upper Old Tampa Bay area showing generalized configuration of thepotentiometric surface of the Floridan aquifer and the area of artesian flow,August-November, 1967 ................... .......... 27
13 Water-level fluctuations in a deep observation well on Booth Point that taps theupper part of the Floridan aquifer. ........................ 28
14 Generalized section showing geohydrology of upper Old Tampa Bay area ... . 3215 Estimated long-term rise in fresh-water level in upper part of Floridan aquifer as
result of conversion of upper Old Tampa Bay into a fresh-water lake. . . . . . . 36
TABLES
Table Page
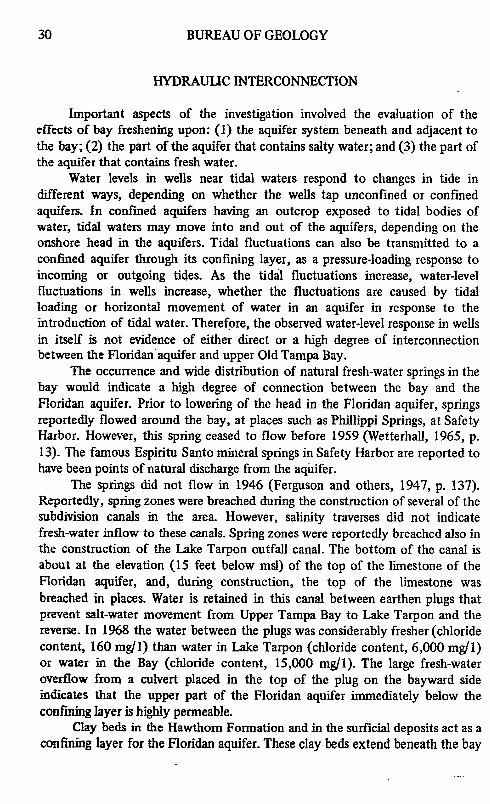
1 Geologic formations in the upper Old Tampa Bay area, Florida . . . . . . . . ... 122 Results of sieve analyses of split-spoon samples collected from test wells
augered in Bay bottom and along Courtney Campbell Causeway. . . . . . . . . ... 31
iv
HYDROLOGIC ASPECTS OF FRESHENINGUPPER OLD TAMPA BAY, FLORIDA
By J. A. Mann
ABSTRACT
Upper Old Tampa Bay, a 17-square mile area of Old Tampa Bay, Florida,has been proposed for conversion to a fresh-water lake. The amount of runoff tothe proposed lake and its chemical quality are both adequate to freshen andsustain a fresh-water lake in this part of the bay. During 1950-66 runoff to theproposed lake, including discharge from Lake Tarpon, would have averaged 134mgd (million gallons per day) and would have displaced the volume of theproposed lake at normal pool stage (2.5 feet above mean sea level) about 1.7times per year. Without discharge from Lake Tarpon, the volume of theproposed lake would have been displaced 1.2 times. If the lake level was initiallyat a normal pool stage during a critically dry year, such as 1956, the proposedlake would have declined 0.25 to 0.5 foot below the minimum design level, (1.5feet above mean sea level).
At points above tidewater, average mineral content of streamflowcontributing to the lake is less than 100 mg/1 (milligrams per liter), and averagechloride content is less than 20 mg/1. The average chloride concentration of thebay proper, based on water samples collected in June, October, and Novemberof 1967, ranged from 14,000 to 16,000 mg/1.
Lake freshening would take place through a combined process ofdisplacement and dilution of the saline water in the lake at time of closure.Freshening of the proposed lake to a chloride concentration of 250 mg/1 wouldrequire about 4 years. Annual fresh-water losses through operation of lockswould amount to the volume of water lost by a 0.1-foot decline in lake level, arelatively insignificant amount.
The study area is underlain by a shallow water-table aquifer. Thefine-grained beds at the base of this aquifer act as a confining layer for theunderlying artesian aquifer (the Floridan aquifer), which consists of limestonebeds of the Tampa Formation and older formations. At places the confininglayer has been breached, allowing an imperfect hydraulic interconnectionbetween the two aquifers.
Saline water occurs in both the shallow aquifer and the upper part of theFloridan aquifer near the bay. Except for the Oldsmar area, present hydrologicconditions preclude major fresh-water spring discharge from the Floridan aquiferthrough the bottom of the bay.
Damming Upper Old Tampa Bay and maintaining the proposed lake at anormal pool stage of 2.5 feet above mean sea level would cause a rise in
1
2 BUREAU OF GEOLOGY
fresh-water levels in both the water-table aquifer and the upper part of theFloridan aquifer (Tampa and Suwannee Limestones), thereby eventually flushingsaline water from both aquifers. Because of the imperfect connection betweenthe proposed lake and the Floridan aquifer, leakage from the lake to the aquiferwould initially average less than 1 mgd upon closure of the dam and wouldgradually decrease as the head difference diminishes.
Displacement of saline water from the Floridan aquifer and depression ofthe fresh-water salt-water interface to a stable hydrostatic position might take 10to 20 yeais. The long-term rise in water levels in the upper part of the Floridanaquifer would be 2 to 3 feet within 1 mile of the lake and less than 1 foot 3 to 4miles inland. This rise in water levels would not be sufficient to depress thefresh-water salt-water interface to the base of the permeable zone in the upperpart of the Floridan aquifer near the bay.
INTRODUCTION
The proposed conversion of part of Old Tampa Bay (fig. 1) to afresh-water lake has been considered for many years. The water-control worksproposed in the engineering studies consisted of (1) a continuous landfilladjacent to the north side of Courtney Campbell Causeway; (2) gated spillwaysto permit discharge and regulation; and (3) two locks for boat navigation. Thelarger of the two locks was for tugs and barges; the smaller for pleasure boats.Small-boat passage was also provided for by proposed use of either mechanicalboat hoists, marine railways, or davits. The lake level was to be regulatedbetween 1.5 and 2.5 feet above msl (mean sea level) with a maximumpermissible level of 3.0 feet above msl.
The Lake Tarpon Water Control Project, utilizing an outfall canal fromLake Tarpon to Old Tampa Bay and a cofferdam around a sinkhole in LakeTarpon, was not originally considered as part of the conversion project. Becausethe Lake Tarpon project is a reality, the combined effects of the two projects areconsidered in this report in evaluating the hydrologic aspects of freshening.
At the present time the project is inactive. This report summarizes for therecord the hydrologic effects of the proposed project and was prepared by theU.S. Geological Survey in cooperation with the Southwest Florida WaterManagement District and the Bureau of Geology, Florida Department of NaturalResources.
INFORMATION CIRCULAR NO. 76 3
- - _ -_ _ P A S. _s L c o C O. . _HILLSBOROUGH • O.
TA PON I n
I<
IPROPOSEDFRESH-WATER
LAKE
UPPER OLD
COURTNEY CAMPBE S 0 1 2 3 MILES
,REPORTAREA
CLEARWATE " EL v ^ ^ TAM PA
PINELLAS T
COUNT HILLSBOROUGHBArY
ST. PET SBURG ,
TAMPABAY _
GULF
OFMEXI/CO HILLSBOROUGH AND
PINELLAS COUNTIES
Figure l.-Map showing location of the upper Old Tampa Bay area, Florida.
4 BUREAU OF GEOLOGY
PURPOSE AND SCOPE
The purpose of the study was to evaluate (1) the hydrology of upper OldTampa Bay under the conditions existing in 1966-69; (2) the hydrologicfeasibility of freshening the bay; and (3) the possible hydrologic effects thatfreshening of the bay might have on the aquifer system, particularly with respectto changes in both the level and chemical quality of water in the aquifers. Thisreport summarizes the findings of the study. Its aim is to provide an evaluationof the surface- and ground-water resources of the area as related to the proposedfreshening; to describe the aspects of hydrology and geology that relate tofreshening of upper Old Tampa Bay; to evaluate possible hydrologic changes inthe bay and contiguous area caused by the freshening; and to define the effect offreshening on the aquifer system.
METHODS OF INVESTIGATION
Streamflow data were available from four long-term gaging stations (fig. 2)and two partial-record stations at inflow points to the bay. These data and thederived estimates of flow for ungaged areas were used to establish the amountand seasonal distribution of surface inflow.
Tidal fluctuations in the bay were recorded continuously at two locations.These data were used in conjunction with fluctuations of water levels inobservation wells to qualify judgments concerning the degree of interconnectionbetween the aquifer systems and the bay.
Observation wells tapping both the shallow and deep aquifers were used tomonitor the water-level fluctuations and to provide information on the hydraulicproperties of the aquifers. Physical characteristics of the aquifers weredetermined from a study of well cuttings, geophysical logs, and otherinformation obtained during well construction. Test wells were drilled in somelocations where additional data were needed. Paired shallow and deep test wellswere completed at sites adjacent to the bay to monitor the effects of tides onwater levels in the aquifers and to aid in evaluating the degree of interconnectionbetween the bay and the aquifers and causes of changes in water quality in theaquifers.
A hollow-stem auger was used to drill test holes in the bay bottom and thecontiguous area. The results of this test drilling were used in conjunction withother data to determine the areal extent of clay beds, the physical characteristicsof the sediments overlying the Floridan aquifer, and the degree of inter-connection between the bay and the Floridan aquifer.
Aquifer tests and laboratory analyses of samples of noninduratedsediments in adjacent areas, collected as part of other investigations, provided
28012'30"
0 I 2 MILES
PINELLAS COUNTY CITY OF ST. PETERSBURGWELL FI /WELL FIELO
PA CO
10 TARPON SPRIRAINFALL SATIO 09. -414
b S TAM roMket cCr. LUTZ
Bayou Lke M-"242
. ' Ca/m Lake
Sfr 0 s80-229-1241A
SlITRUS PARKV Lake Magdalene *owas.3-0 ILake Observation wll
Ss03 -23712 RAINFALL " -2.
0 - EVAPORATIO TA ON RaInfall station
a C e/ tton number e n
SBr okr crck nk near 2pa nth1eTarpoDn Sprlng I dischargeXP
(2-3073.59) \1pwy 0-)LNu,.d„
hap hopiy Parta roc r ort tier -®n
29Sa~deg0th 239.34O
0 - 1e ATITRUS PARKE cL
MO 803 -1
S- HARBOR /Od Toa ,o UPPE / /
W 82500-20- RAIN FLL L5akE 0
Figure 2.- Map showing location ofselectedobservation wells, municipal well fields, rainfall stations, streamflow gaging
stations, and tidal recording stations in the upper Old Tampa Bay area, Florida.
Lar Ro y crook near $tparenthees l>Me n CSurpohur $prlngl
near zSulphur discharge
280001 SAFETY tlnt •Ion melnto nod for
"~n d " TAMPA ..... . Boundary of s,•udyare
270 7' 40' 30' 82025,
Figure 2.- Map showing location of selectedobservation wells, municipal well fields, rainfall stations, streamfiow gagingstations, and tidal recording stations in the upper Old Tampa Bay area, Florida.
6 BUREAU OF GEOLOGY
useful data in evaluating the hydraulic characteristics of the aquifer and relatedconfining beds in the bay area.
Samples were collected from streams, wells, and the bay for chemicalanalysis. Traverses were made periodically in the bay under differing hydrologicconditions. During these traverses, water samples were collected in order todetect possible variations in salinity and areas of possible inflow from submarinesprings.
ACKNOWLEDGMENTS
Excellent cooperation was received from city and county officials,industry, and local residents during this investigation. Special acknowledgmentsare given the Florida Department of Transportation, and Hillsborough andPinellas Counties, for permission to drill and maintain test wells on public lands,and to the Florida Bureau of Geology and the Southwest Florida WaterManagement District for information provided the author. Appreciation is alsoexpressed to J. S. Rosenshein and Gilbert H. Hughes of the Geological Surveyfor their extensive revision, and technical and editorial review of the manuscript.Work on the investigation was performed under the direction of C. S. Conover,district chief for Florida, and under the immediate supervision of J. W. Stewartand J. S. Rosenshein.
PREVIOUS INVESTIGATIONS
A report by Matson and Sanford (1913) contains the earliest knownpublished information on the hydrology and geology of this part of Old TampaBay. Sellards and Gunter (1913) discussed artesian flow.
Reports by Collins and Howard (1928) and Black and Brown (1951)included some information on the quality of water. Stringfield (1933, p. 13-17)presented a generalized description of the hydrology and geology of Pinellas andnorthwestern Hillsborough Counties.
The geologic features of the Tampa Bay area are described by Cooke(1945). A report by Ferguson and others (1947, p. 137) describes one of thelarger springs in upper Old Tampa Bay. Heath and Smith (1954) described thehydrology and geology of the study area in Pinellas County. Reynolds, Smith,and Hills, Architects and Engineers, prepared a feasibility report in 1959 for theHillsborough-Pinellas County committee studying the proposed fresheningproject. A report by Menke, Meredith, and Wetterhall (1961) describes the
INFORMATION CIRCULAR NO. 76 7
hydrology of the Tampa Bay area in Hillsborough County. A report to theHillsborough-Pinellas County committee by Reynolds, Smith, and Hills, in 1963,considered the engineering feasibility of the freshening project. A 1965 reportby Black, Crow, and Eidsness, Consulting Engineers to the Board of CountyCommissioners, Pinellas County, reviewed the proposed freshening project.
DESCRIPTION OF THE SURROUNDING AREA
Tampa Bay is in about the middle of the west side of the Florida peninsula(fig. 1) and is open to the Gulf. It is surrounded on three sides by the Tampa-St.Petersburg metropolitan area. The bay is one of the largest along Florida's manymiles of coastline. Tampa Bay is divided into an eastern and western embaymentby the interbay peninsula on which part of the city of Tampa is located. Theeastern part is known as Hillsborough Bay and the western part as Old TampaBay. The northern part of Old Tampa Bay, north of Courtney CampbellCauseway, is known locally as upper Old Tampa Bay. This northern part hasbeen proposed for conversion to a fresh-water lake.
TOPOGRAPHY AND DRAINAGE
The Tampa Bay area is in the Coastal Lowlands topographic region ofFlorida as defined by Cooke (1945, p. 8). Altitudes range from sea level to about100 feet along the western drainage divide just northwest of Safety Harbor (fig.3). A hilly area extends northward from Safety Harbor to Lake Tarpon.Interspersed among these hills are numerous sinkholes, the most well known ofwhich is on the northwest shore of Lake Tarpon and has a subterraneanconnection with Spring Bayou at Tarpon Springs (Heath and Smith, 1954). Thehigh mineral content of Lake Tarpon (fig. 21, p. 44, Cherry, Stewart, and Mann,1970) is caused chiefly by movement of saline water into the lake from SpringBayou through this subterranean connection.
The area is dotted with lakes and ponds of various sizes. Lake Tarpon isthe largest with a water surface of about 4 sq mi (square miles). The larger lakesare clustered in three distinct groups: (1) those trending northward along thehills west and northwest of Safety Harbor including Lake Tarpon; (2) those inthe central part including Keystone Lake and Lake Rogers; (3) and thosetrending northward along the low sandy ridge of the eastern drainage divide,including Lakes Magdalene and Carroll.
0 o0t
101 '
UN PRING L
SCi M Las EXPLANATION
Late0s ofa urae. Coour
Figure 3.-Map showing topography of the upper Old Tampa Bay area, Florida.
%. 0 2
(ADSUS A
DUNEDIN,
eo00' PointA UPPER OLD
, ""atorAIIPA BAY TAMPA
62-50 40' 30' 82*5,
Figure 3.-Map showing topography of the upper Old Tampa Bay area, Florida.

INFORMATION CIRCULAR NO. 76 9
Drainage areas of streams range from 10 to 45 sq mi. Most of the land isrelatively flat-lying, and channel slopes are mild. Channels are poorly developed,and stream courses are well defined only for short reaches. The larger streams,except Alligator and Brooker Creeks, are open to the bay, and their flow isaffected by tidal fluctuation near their mouths.
CULTURE AND DEVELOPMENT
The study area is sparsely populated except adjacent to the bay andaround the larger lakes, where property is in demand for residential develop-ment. The many lakes and the bay provide fishing, boating, skiing, andswimming. Most of the land outside the residential areas is used for cattleranching, dairying and citrus farming.
Many current (1970) developments involving water resources in the bayarea will cause some alteration in the runoff pattern and possibly affect thehydrologic regimen of the bay. The Soil Conservation Service, in conjunctionwith local conservation districts, has two watershed projects (fig. 4) in planningstages or under construction: the Upper Tampa Bay Watershed Project and theBrooker Creek Watershed Project. Together, the project areas include most ofthe 190-sq-mi drainage area of the bay. The Rocky Creek bypass channel(channel G), which will carry floodwater around the community of RockyCreek, has been completed.
The outfall canal for Lake Tarpon has also been completed as a part of theFour River Basins Project of the Corps of Engineers. This canal and structures,along with a gated cofferdam around a sinkhole in Lake Tarpon, is designed tocontrol the level of the lake. If the gated cofferdam is effective over a longperiod of time, the movement of salt water from Spring Bayou through thesubterranean connection into Lake Tarpon will be stopped as well as theunregulated discharge of Lake Tarpon into the sinkhole. Under these conditions,Lake Tarpon will gradually freshen, thus augmenting the available supply ofwater for freshening the proposed bay lake by diversion of Lake Tarpon by wayof the outfall canal into upper Old Tampa Bay.
Land development is also changing the runoff pattern. New residentialsubdivisions, with homes fronting on canals, are continually being built aroundthe bay. The extensive dredging and filling associated with the building is notonly changing the runoff pattern but in some places is increasing the naturaldischarge from the shallow water table and the deeper limestone aquifers whereboth are breached by canals. This increased discharge also results in lower waterlevels in the aquifers adjacent to the canals.
20012' 30"
0 1 MILESI I I OPASCO C
STARPON oLUTZ
0 k 04 Lake Tarpoen WaterC(U 00 Control Projet
ccBrooker Creok Water- 0
:• DUNEDIN IMA
2800'- SAFETY, Pointl
oak
Watershed Project.Watershed Project.
INFORMATION CIRCULAR NO. 76 11
CLIMATE
The climate of this part of Florida is subtropical, and the prevailingwesterly winds moving across the Gulf have a cooling effect on the land areas inthe summer and a warming effect in winter.
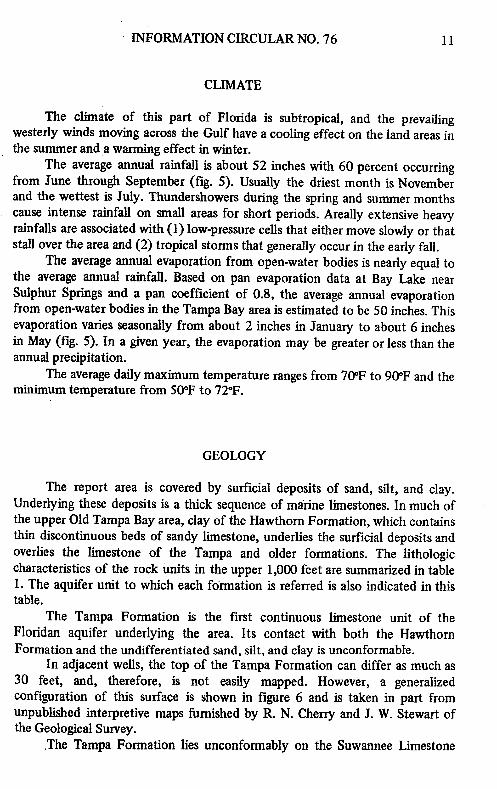
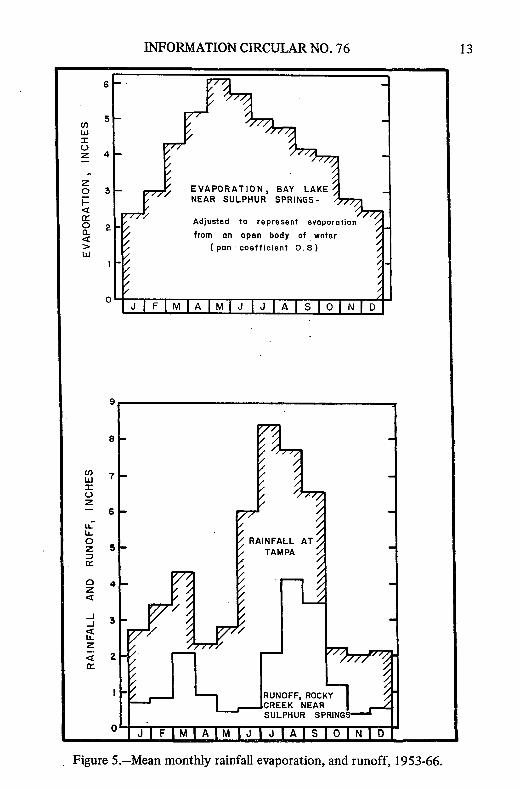
The average annual rainfall is about 52 inches with 60 percent occurringfrom June through September (fig. 5). Usually the driest month is Novemberand the wettest is July. Thundershowers during the spring and summer monthscause intense rainfall on small areas for short periods. Areally extensive heavyrainfalls are associated with (1) low-pressure cells that either move slowly or thatstall over the area and (2) tropical storms that generally occur in the early fall.
The average annual evaporation from open-water bodies is nearly equal tothe average annual rainfall. Based on pan evaporation data at Bay Lake nearSulphur Springs and a pan coefficient of 0.8, the average annual evaporationfrom open-water bodies in the Tampa Bay area is estimated to be 50 inches. Thisevaporation varies seasonally from about 2 inches in January to about 6 inchesin May (fig. 5). In a given year, the evaporation may be greater or less than theannual precipitation.
The average daily maximum temperature ranges from 70°F to 90OF and theminimum temperature from 50°F to 72°F.
GEOLOGY
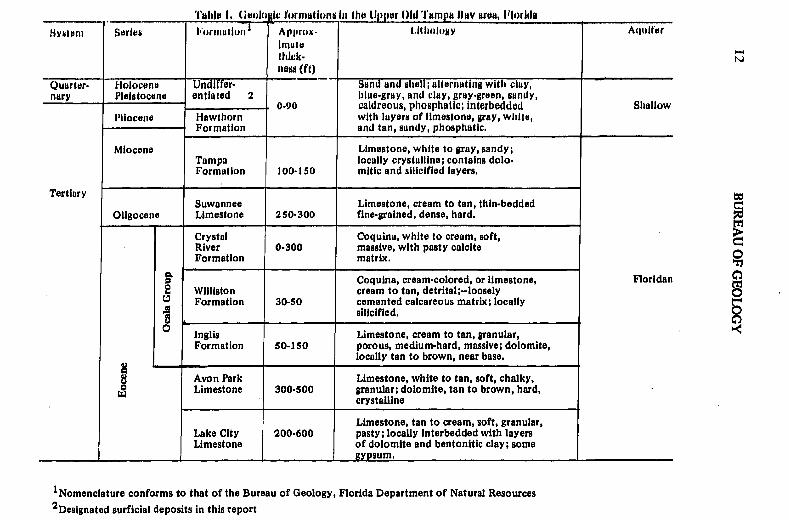
The report area is covered by surficial deposits of sand, silt, and clay.Underlying these deposits is a thick sequence of marine limestones. In much ofthe upper Old Tampa Bay area, clay of the Hawthorn Formation, which containsthin discontinuous beds of sandy limestone, underlies the surficial deposits andoverlies the limestone of the Tampa and older formations. The lithologiccharacteristics of the rock units in the upper 1,000 feet are summarized in table1. The aquifer unit to which each formation is referred is also indicated in thistable.
The Tampa Formation is the first continuous limestone unit of theFloridan aquifer underlying the area. Its contact with both the HawthornFormation and the undifferentiated sand, silt, and clay is unconformable.
In adjacent wells, the top of the Tampa Formation can differ as much as30 feet, and, therefore, is not easily mapped. However, a generalizedconfiguration of this surface is shown in figure 6 and is taken in part fromunpublished interpretive maps furnished by R. N. Cherry and J. W. Stewart ofthe Geological Survey.
The Tampa Formation lies unconformably on the Suwannee Limestone
'TALl__ I, Ge00(lo li formations in lth Upper Old 'Tampa lay area, Florida
ystemn Series l'orlmation1 Approx- Liihology Aquiferminuttthick- -"ness (ft)
Quarter- Holocene Undiffer- f f Sand and shell; alternating with clay,nary Pleistocene entiated 2 blue-gray, and clay, gray-green, sandy,
0.90 caldreous, phosphatic; interbedded ShallowPliocene Hawthorn with layers of limestone, gray, white,
Formation and tan, sandy, phosphatic.
Miocene Limestone, white to gray, sandy;Tampa locally crystalline; contains dolo-Formation 100-150 mitic and silicified layers.
Tertiary Suwannee Limestone, cream to tan, thin-beddedOligocene Limestone 250-300 fine-grained, dense, hard.
Crystal Coquina, white to cream, soft,River 0-300 massive, with pasty calciteFormation matrix.
Coquina, cream-colored, or limestone, FloridanS Williston cream to tan, detrital;-loosely
Formation 30-50 cemented calcareous matrix; locallysillcified.
S Inglis Limestone, cream to tan, granular,Formation 50-150 porous, medium-hard, massive; dolomite,
locally tan to brown, near base.
Avon Park Limestone, white to tan, soft, chalky,Limestone 300-500 granular; dolomite, tan to brown, hard,
crystalline
Limestone, tan to cream, soft, granular,Lake City 200-600 pasty; locally interbedded with layersLimestone of dolomite and bentonitic clay; some
__ _gypsum.
1Nomenclature conforms to that of the Bureau of Geology, Florida Department of Natural Resources2 Designated surficial deposits in this report
INFORMATION CIRCULAR NO.76 13
6
5
z 4
S 3 - EVAPORATION, BAY LAKENEAR SULPHUR SPRINGS-
O 2 Adjusted to represent evaporation
/from on open body of water> ( pan coefficient 0.8)
I
4.-z
5 URAINFALL ATSNz 5 TAMPA
0 4
S / /
I -RUNOFF, ROCKY
CREEK NEAR0 J F M A PR J S 0| NSi D
Figure 5.-Mean monthly rainfall evaporation, and runoff, 1953-66.
TI'hlo 1. (IoIlibuig krnitiabiN otii Oitt I linor Old Tallinn IIDHv ura. lhrldri
o*lI' a30"
0 I 2 MILES
PAS.0 CO
TARPON arson LUTZ
* c¢. I s \ EXPLANATIONom, w-40 t
t .Li STRUCTURE CONTOUR
00
Figure 6-Map of the upper Old Tampa Bay area showing generalized contours on the top of thep of first -
continuous limstone (Tampa Formation) of the Floridan aquifer.ter140 L~ ANOnderl of study area
, ion) IT US PA
t AAi. 0r 0 C)
3 b DUNEDIN
rdon oth CR2eo0' FETL *a OR RUPPER
OLDIvia? )rTAMPA I TAMPA
805' 3' 40' 30' 82025'
Figure 6.-Map of the upper Old Tampa Bay area showing generalized contours on the top of the firstcontinuous limstone (Tampa Formation) of the Floridan aquifer.
INFORMATION CIRCULAR NO. 76 15
(Cooke, 1945, p. 145). The Suwannee Limestone is a hard generally fossiliferouslimestone, whereas the Tampa Formation is a hard sandy limestone. TheSuwannee Limestone is highly permeable and a good source of water. Most wellsof large yield in the area tap both the Tampa Formation and SuwanneeLimestone. Although the rock units below these formations generally containhighly permeable zones-the Avon Park Limestone in particular-the water inthese deeper zones is highly mineralized. Therefore, these zones are not tappedfor potable water supplies.
HYDROLOGY
The hydrologic phase of the study of upper Old Tampa Bay is concernedchiefly with two principal aspects: (1) the rate and degree of freshening, which isa function of rainfall on the bay, evaporation from the bay, inflow to the bay,and discharge from the bay; and (2) the effects of freshening upon thefresh-water aquifer system, which are dependent on the degree of hydraulicinterconnection between the bay and the aquifers.
RUNOFF TO THE PROPOSED LAKE
The most important factor relative to the rate of freshening is adequacy ofinflow. Inflow to the proposed lake is derived chiefly from runoff from adrainage area of 190 sq mi. The major streams contributing inflow areSweetwater Creek, Rocky Creek, Double Branch, Alligator Creek, and BrookerCreek by way of the outfall canal from Lake Tarpon (fig. 4). Rocky Creek is theonly perennial stream within the drainage area of the proposed lake. Sweetwater,Brooker, and Alligator creeks ceased to flow for 3 to 4 months each year duringthe extreme drought of 1955-56.
Analyses of inflow to the upper bay were made, both including andexcluding runoff from the Lake Tarpon-Brooker Creek watershed. If thecofferdam does not effectively close Lake Tarpon's underground connectionwith Spring Bayou, a salt-water body, a control structure could be placed in theLake Tarpon outfall canal. This structure should prevent saline water in LakeTarpon from discharging into the proposed fresh-water lake. Therefore, runofffrom the Lake Tarpon-Brooker Creek watershed would not be available to theproposed lake. However, if closure is effective and Lake Tarpon becomespermanently fresh, this watershed would be a source of runoff for the proposedlake.
16 BUREAU OF GEOLOGY
A 17-year period, calendar years 1950-66, inclusive, was chosen forcomputing average runoff to the lake. This period included the most severe
drought of record, 1955-56, and the wettest 2 years of record, 1959-60. Averageannual rainfall during the 17-year period was 53 inches, 1 inch more than thelong-term average annual rainfall in the area. Thus runoff during the chosenperiod was probably not greatly different from average runoff for a longerperiod.
Runoff from the entire contributing area of 190 sq mi for the 17-yearperiod was estimated by averaging runoff at gages on Sweetwater, Rocky,
Alligator, and Brooker creeks and applying the average runoff per square mile tothe entire area. The average runoff from the gaged area of 80.4 sq mi for the17-year period was 56 mgd (million gallons per day) and the average runoff from
the 190 sq mi, 130 mgd. During this same period, the average annual rainfall (R)on the proposed lake and Lake Tarpon exceeded the estimated average rate of
evaporation (E) from both lake surfaces by 4 mgd (R - E= 4 mgd), therebymaking a total of 134 mgd available on the average for freshening the proposed
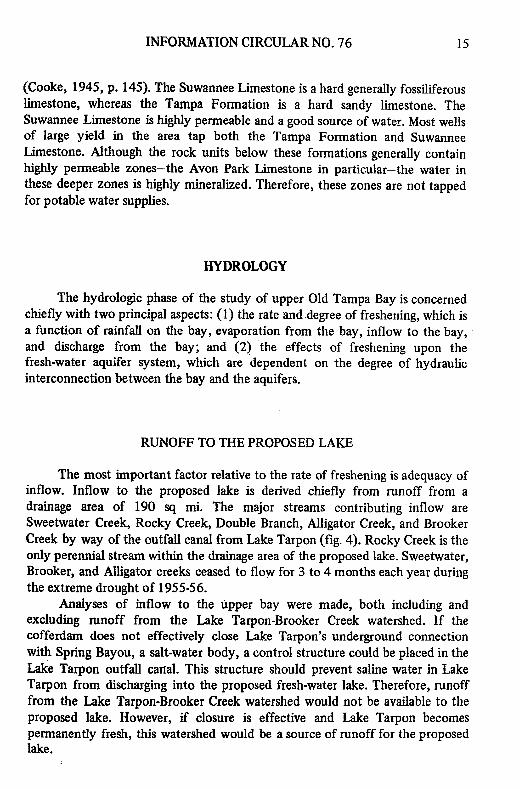
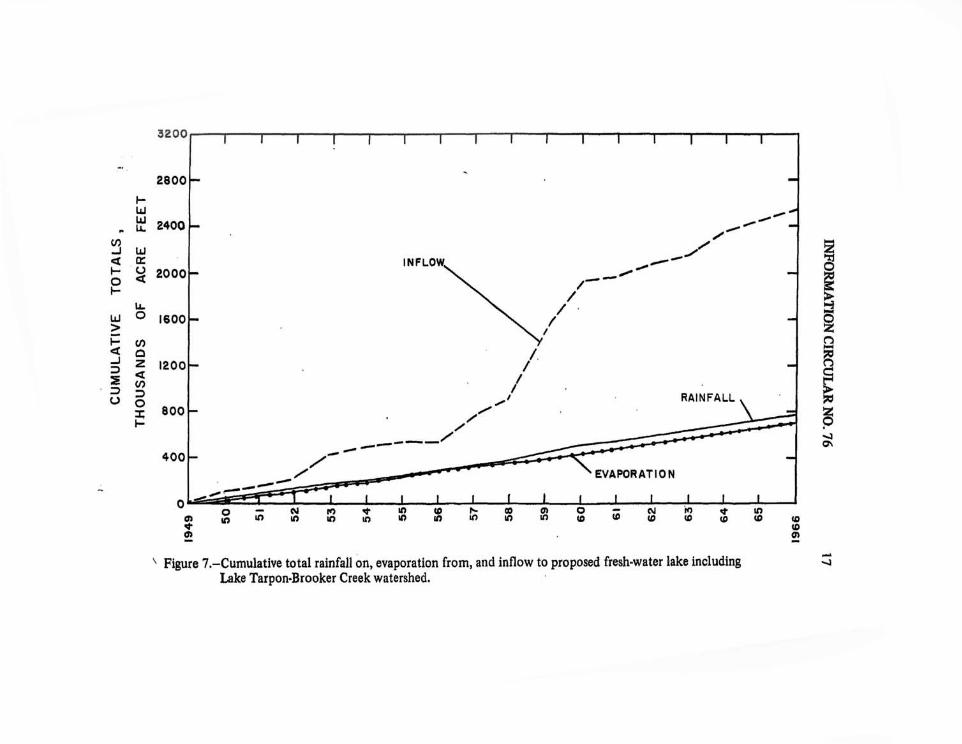
lake.Figure 7 provides a graphical comparison of the cumulative total rainfall
and evaporation for an open body of water in the bay area and the cumulativetotal inflow into the proposed lake for the 17-year period 1950-66. The inflow
shown includes runoff from Lake Tarpon and Brooker Creek.
INFLOW DURING AVERAGE AND ABOVE-AVERAGE CONDITIONS
Inflow, including runoff from Lake Tarpon and Brooker Creek:-At thenormal operating level of 2.5 feet above msl, the volume of the proposed lakewould be about 87,000 acre-feet and the average depth 8.5 feet. Therefore, anaverage inflow of 134 mgd (150,000 acre-feet per year) would be sufficient todisplace the volume of water in the lake 1.7 times each year.
The maximum annual runoff for the 17-year period was in 1959. Therunoff was estimated to average 476 mgd. With the gain from the rainfall minusevaporation (R - E) for 1959, average inflow would be 513 mgd (570,000acre-feet per year). This rate of inflow would be sufficient to displace thevolume of water in the proposed lake 6.5 times.
Inflow excluding runoff from Lake Tarpon and Brooker Creek:-Inflowfrom the Lake Tarpon-Brooker Creek watershed averaged 40 mgd during the17-year period and 114 mgd during the maximum year (1959). With this runoffexcluded, inflow (runoff plus rainfall minus evaporation) would be as follows:
Maximum year (1959) 362 mgdAverage year 94 mgd
An average annual inflow of 94 mgd (105,000 acre-feet per year) would be
3200 1 1 1 1 1-- ---
2800
I-
, 2400 - - "
M rr INFLOW- 2000- / . 0o Q /L.
S0 1600-
(00
- 'RAINFALL28000
o00 t .D i ) , D
400 - '"-
EVAPORATION
SFigure 7.-Cumulative total rainfall on, evaporation from, and inflow to proposed fresh-water lake including -
Lake Tarpon-Brooker Creek watershed.

18 BUREAU OF GEOLOGY
sufficient to displace the volume of water in the lake 1.2 times per year-4.5times during a maximum year.
INFLOW DURING A CRITICALLY DRY YEAR
The most critical year for inflow in the 17-year period was 1956, whenrunoff averaged only 14 mgd. In order to determine the minimum lake levellikely to be reached during such a critical year, monthly inflow (runoff + rainfall- evaporation) for 1956 was mathematically routed through the proposed lake.The lake was assumed to be initially at the normal operating level (2.5 feet abovemsl). Al inflow in excess of that required to hold the pool at this level wasassumed to be discharged.
With the inflow from Lake Tarpon-Brooker Creek watershed included inthe total inflow, the minimum level reached during the critical drought year was0.5 foot below the minimum design level (1.5 feet above msl). With inflow fromthis watershed excluded from the total inflow, the minimum lake level reachedwas 0.25 foot below the minimum design level. This difference in minimum lakelevels is caused by several factors. Inflow to Lake Tarpon from Brooker Creekceased during March through July 1956, while the proposed lake receivedappreciable inflow from Rocky Creek, which did not go dry. During thesemonths, Lake Tarpon and the proposed lake would have tended to stabilize atabout the same level. As a result, water supplied by Rocky Creek would bedistributed over the area of both lakes rather than the area of the proposed lakealone causing a lower minimum level to be reached when the total inflowincluded that from the Lake Tarpon-Brooker Creek watershed.
If a control structure were to be installed in the outfall canal that connectsthe proposed lake to Lake Tarpon, water from Rocky Creek could beconstricted during droughts to the area of the proposed lake. With such aprovision, inflow from Lake Tarpon-Brooker Creek watershed could be usedbeneficially to freshen the proposed lake without adverse effects during unusualdroughts.
The preceding analysis of minimum water-level elevations in the proposedlake does not take into account losses by operation of the locks. Somefresh-water losses occur as a result of lock operations. However, when theselosses are placed in hydrologic perspective, they are minor. Plans for existing andanticipated navigation requirements call for two locks (Reynolds, Smith, andHills, December 1963). The larger lock, 350 feet long, 56 feet wide, and 15 feetdeep, would pass tugs and oil barges supplying the power plant at Booth Point.To conserve fresh water, a smaller lock would be provided for pleasure craft.This lock would have a chamber 65 feet long, 15 feet wide, and 8 feet deep.
The capacity of the larger lock is 294,000 cu ft (cubic feet). One-tenth of
INFORMATION CIRCULAR NO. 76 19
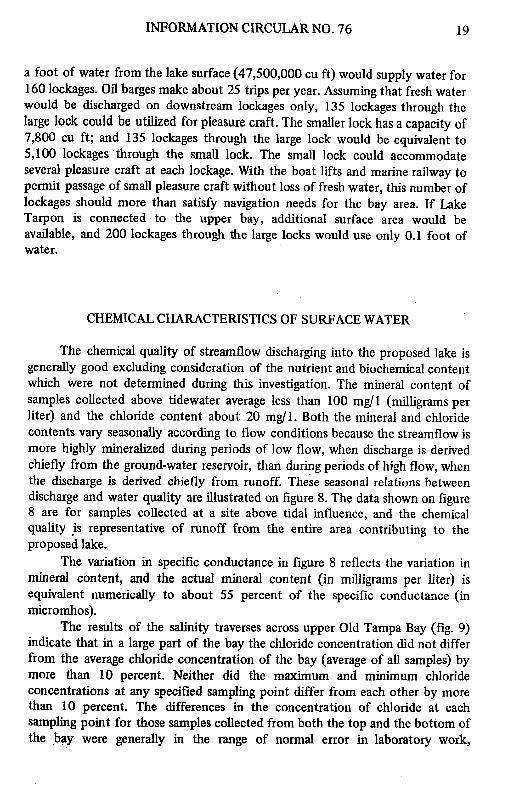
a foot of water from the lake surface (47,500,000 cu ft) would supply water for160 lockages. Oil barges make about 25 trips per year. Assuming that fresh waterwould be discharged on downstream lockages only, 135 lockages through thelarge lock could be utilized for pleasure craft. The smaller lock has a capacity of7,800 cu ft; and 135 lockages through the large lock would be equivalent to5,100 lockages through the small lock. The small lock could accommodateseveral pleasure craft at each lockage. With the boat lifts and marine railway topermit passage of small pleasure craft without loss of fresh water, this number oflockages should more than satisfy navigation needs for the bay area. If LakeTarpon is connected to the upper bay, additional surface area would beavailable, and 200 lockages through the large locks would use only 0.1 foot ofwater.
CHEMICAL CHARACTERISTICS OF SURFACE WATER
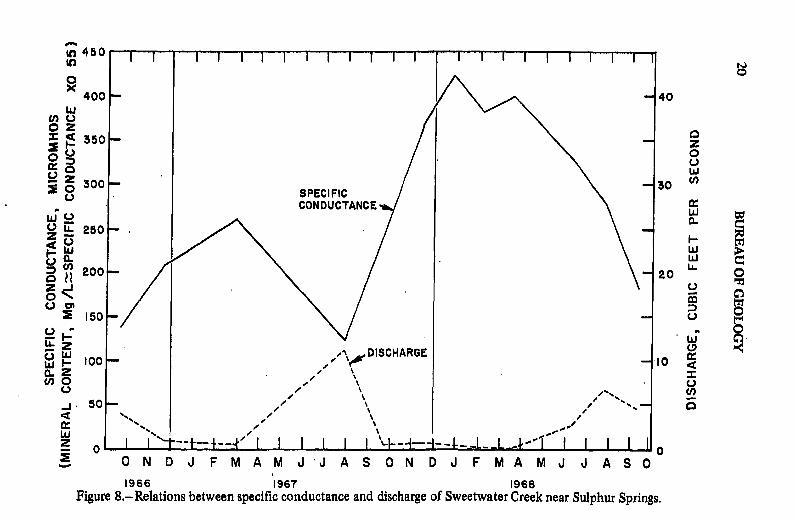
The chemical quality of streamflow discharging into the proposed lake isgenerally good excluding consideration of the nutrient and biochemical contentwhich were not determined during this investigation. The mineral content ofsamples collected above tidewater average less than 100 mg/1 (milligrams perliter) and the chloride content about 20 mg/1. Both the mineral and chloridecontents vary seasonally according to flow conditions because the streamflow ismore highly mineralized during periods of low flow, when discharge is derivedchiefly from the ground-water reservoir, than during periods of high flow, whenthe discharge is derived chiefly from runoff. These seasonal relations betweendischarge and water quality are illustrated on figure 8. The data shown on figure8 are for samples collected at a site above tidal influence, and the chemicalquality is representative of runoff from the entire area contributing to theproposed lake.
The variation in specific conductance in figure 8 reflects the variation inmineral content, and the actual mineral content (in milligrams per liter) isequivalent numerically to about 55 percent of the specific conductance (inmicromhos).
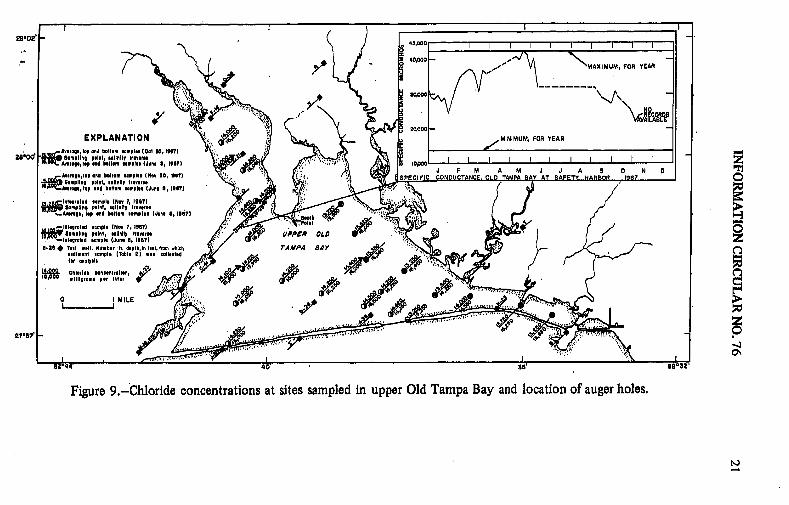
The results of the salinity traverses across upper Old Tampa Bay (fig. 9)indicate that in a large part of the bay the chloride concentration did not differfrom the average chloride concentration of the bay (average of all samples) bymore than 10 percent. Neither did the maximum and minimum chlorideconcentrations at any specified sampling point differ from each other by morethan 10 percent. The differences in the concentration of chloride at eachsampling point for those samples collected from both the top and the bottom ofthe bay were generally in the range of normal error in laboratory work,
o I -- I I I I I .. .i I I . I I .. . . l• I - I ! ' I450
S400 - -40W
0 z
S350 - -20O0 0l 3 00 - - 30
0 §SPECIFICCONDUCTANCE
. P250- - --
La ,: \ " \ I I
oZ 0.i 2 00 - 20
z\ 51966 1961507 968
L #- v
rj .0 DISCHARGE M
0 0
z 0 I It-f-4 I 1 1 1 1 I '----J..L-LL.J.I I I I I I0SO N D J F M A M J J A S O N D J F MA M J J A S O
1966 1967 1968Figure 8.-Relations between specific conductance and discharge of Sweetwater Creek near Sulphur Springs.
I I"" I l I I I
40000 AMAXIMUM, FOR YEAR
m ^I c 20000NEXPLANATION -MINIMUM, FOR YEAR
zs*od Sm olingn poilnl, lllnlly lI I I I I I I I I niUQAwtelgetop ond bollom amples (Juno I, 1ilT) dfrc on* i lO -
S, Sampllng point, salinity ll rovern ..1 -Alr, top and boltom samples (Junoe , 1967 )
0... ritllnteantd lampll (Nlo 7, 1967) - I5j1
Jgi S.mpllng polnl, eillnlip t,.dOms.Averaog,top and bottom samples (June 0, 196I) soth
* intlgrated sample (Nov 7, 1967)Sampling point, sllnity traverse UPPER
' -Integrated sample (June 8, 11967)B-0 Tilt well. Number is depthl n fet, rom which rAMPA BAY ml h
sedimen sample (Table i was o oltt ed
Figure 9.-Chloride concentrations at sites sampled in upper Old Tampa Bay and location of auger holes.
150 ~d,000 mittigoitlome penr Iliar e "0 I MILE J: ..
Figure 9.- Chloride concentrations at sites sampled in upper Old Tampa Bay and location of auger holes.
1%)
22 BUREAU OF GEOLOGY
regardless of whether the samples were collected from either the shallow part(less than 6 feet deep) or the deep part (6 to 12 feet) of the bay. This lack ofsignificant vertical differences in chloride concentration indicates that currentmovement and wind action is generally sufficient to keep the water in the baywell mixed except in the vicinity of the mouths of the larger creeks during shortperiods of high streamflow.
Samples of water were collected on July 12, 1965, from Mullet Creek nearSafety Harbor at both high and low tide. At that place the stream is affected bytidal fluctuation. The range in concentration of chloride in milligrams per liter isas follows:
7,000 (high-tide - top).13,000 (high-tide - bottom).
5,800 (low-tide - top).9,200 (low-tide - bottom).
The fresh-water discharge of Mullet Creek at the time of sampling in the streamwas about 10 cfs (cubic feet per second), estimated by comparison withdischarge of Alligator Creek near Safety Harbor. The difference in chlorideconcentrations in top and bottom samples indicated that near points ofrelatively large fresh-water inflow density separation does occur during the wetseason.
Chloride concentrations in the bay at Safety Harbor, where monitoringwas continuously carried out, ranged from 9,500 to 16,500 mg/1 during October1966-September 1968. The maximum concentration occurred at the time ofminimum fresh-water inflow, and the minimum concentration occurred at thetime of maximum fresh-water inflow.
RATE OF FRESHENING
Factors that determine the rate of freshening in the proposed lake are: (1)the rate and mineral concentration of inflow to the lake; (2) the degree ofmixing; (3) the original volume and mineral concentration of the water in theproposed lake at the time of its separation from -Tampa Bay; and (4) the rate andmineral concentration of discharge from the lake. To simplify the analysespresented below the following assumptions were made: (1) lake level would beat normal operating level (2.5 feet above msl) when closed; (2) at the time ofclosure the average chloride concentration of water in the lake would be 14,000mg/I; (3) the chloride concentration of the inflow water would be zero; (4) thelake would be completely mixed at all times; and (5) inflow of saline water fromboat locks would not significantly affect the rate of freshening. The averageinflow has been established as sufficient to flush the proposed lake 1.7 times peryear with inflow, including that from Lake Tarpon-Brooker Creek watershed.
INFORMATION CIRCULAR NO. 76 23
1 )
0 120
" 14 -
.0
SX io-f)
z
"J 250 mg/
z W
04-
WO
2 x250 mg/I
00 I 2 3 4 5
TIME , YEARS
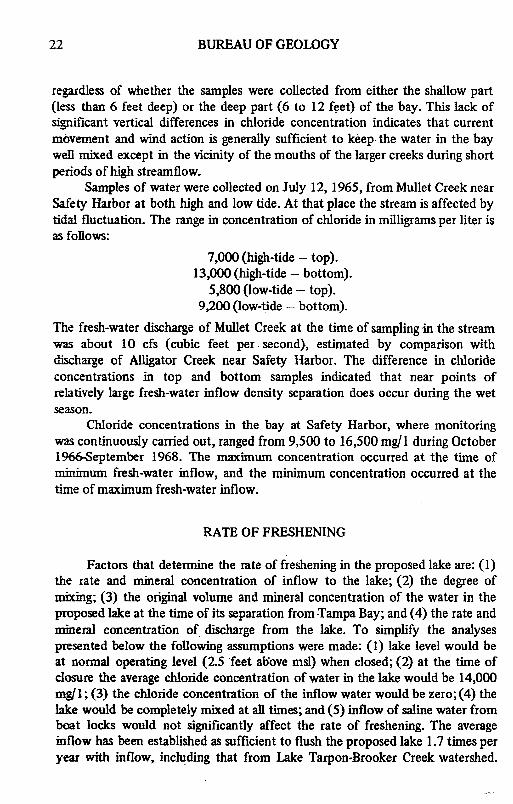
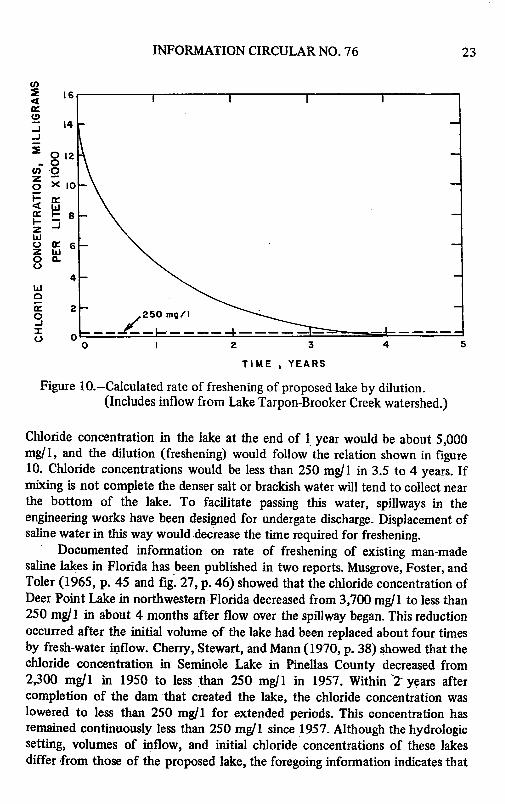
Figure 10.-Calculated rate of freshening of proposed lake by dilution.(Includes inflow from Lake Tarpon-Brooker Creek watershed.)
Chloride concentration in the lake at the end of 1 year would be about 5,000mg/1, and the dilution (freshening) would follow the relation shown in figure10. Chloride concentrations would be less than 250 mg/1 in 3.5 to 4 years. Ifmixing is not complete the denser salt or brackish water will tend to collect nearthe bottom of the lake. To facilitate passing this water, spillways in theengineering works have been designed for undergate discharge. Displacement ofsaline water in this way would decrease the time required for freshening.
Documented information on rate of freshening of existing man-madesaline lakes in Florida has been published in two reports. Musgrove, Foster, andToler (1965, p. 45 and fig. 27, p. 46) showed that the chloride concentration ofDeer Point Lake in northwestern Florida decreased from 3,700 mg/1 to less than250 mg/1 in about 4 months after flow over the spillway began. This reductionoccurred after the initial volume of the lake had been replaced about four timesby fresh-water inflow. Cherry, Stewart, and Mann (1970, p. 38) showed that thechloride concentration in Seminole Lake in Pinellas County decreased from2,300 mg/l in 1950 to less than 250 mg/1 in 1957. Within "2 years aftercompletion of the dam that created the lake, the chloride concentration waslowered to less than 250 mgl/ for extended periods. This concentration hasremained continuously less than 250 mg/1 since 1957. Although the hydrologicsetting, volumes of inflow, and initial chloride concentrations of these lakesdiffer from those of the proposed lake, the foregoing information indicates that
24 BUREAU OF GEOLOGY
the calculated rate of freshening of the proposed lake is reasonable. The
information, particularly with respect to Deer Point Lake, indicates that
freshening of the proposed lake would occur chiefly by dilution after initial
displacement of some saline water by undergate flow.The time required for freshening would be considerably shorter if the
suggested level of salinity for maintaining feeding areas for key water fowl weregenerally acceptable. The Florida Game and Fresh Water Fish Commission has
suggested that a chloride concentration of 1,000 mg/1 be maintained in a largepart of the proposed lake to sustain growth of widgeon grass. The Commissionindicates that this level of salinity could be tolerated by fresh-water fish.
Adoption of this suggestion would necessitate the mixing of saline water fromthe bay with the fresh-water inflow.
GROUND WATER
SHALLOW AQUIFER
A water-table aquifer overlies the Floridan aquifer in most of the area andincludes the surficial sands and the upper part of the Hawthorn Formationexcept where it has been removed by erosion. The thickness of the materialforming the shallow aquifer in the bay area can be estimated by comparingelevations on the map (fig. 6) showing the top of the first consistent limestoneand the topographic map (fig. 3). This thickness ranges from 20 to 40 feetsouthwest of Oldsmar to as much as 100 feet northwest of Oldsmar.
The depth to the water table averages less than 5 feet below land surfacethroughout most of the area. This depth increases in several areas (fig. 2) wherelarge quantities of ground water are withdrawn from the underlying Floridanaquifer for municipal supply. Near these well fields the water table lies as muchas 15 feet below the land surface.
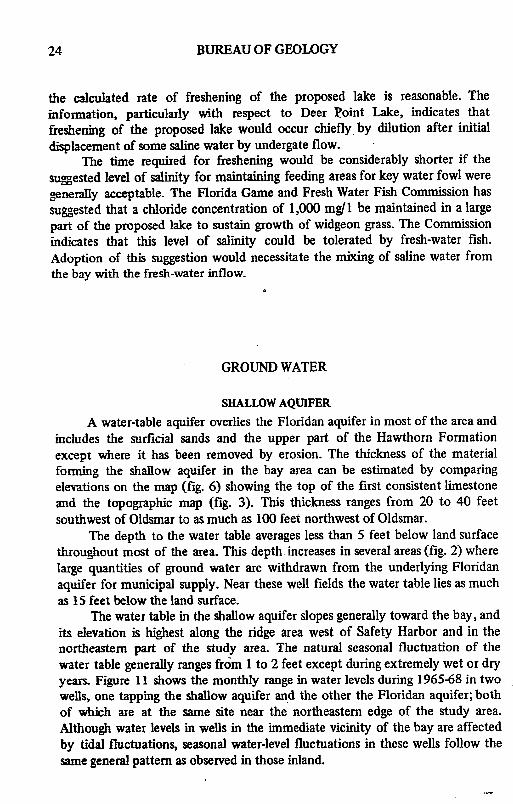
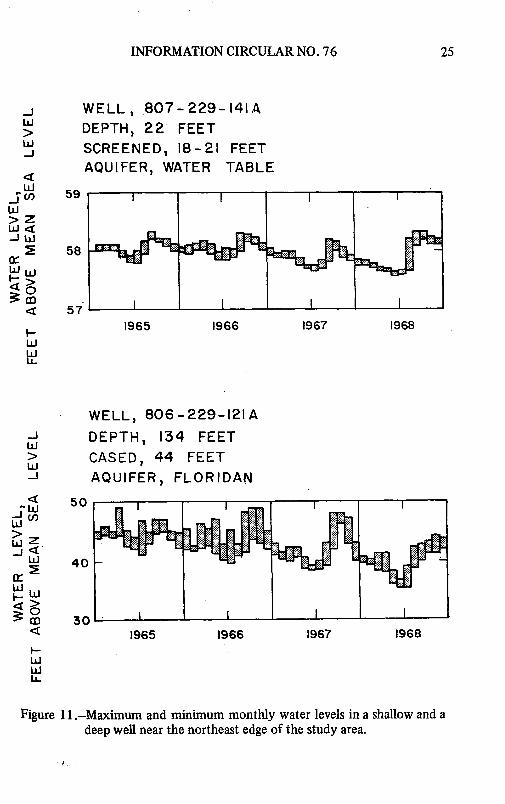
The water table in the shallow aquifer slopes generally toward the bay, andits elevation is highest along the ridge area west of Safety Harbor and in thenortheastern part of the study area. The natural seasonal fluctuation of thewater table generally ranges from 1 to 2 feet except during extremely wet or dryyears. Figure 11 shows the monthly range in water levels during 1965-68 in twowells, one tapping the shallow aquifer and the other the Floridan aquifer; bothof which are at the same site near the northeastern edge of the study area.Although water levels in wells in the immediate vicinity of the bay are affectedby tidal fluctuations, seasonal water-level fluctuations in these wells follow thesame general pattern as observed in those inland.
INFORMATION CIRCULAR NO. 76 25
WELL, 807-229-141AS DEPTH, 22 FEET
W SCREENED, 18-21 FEETAQUIFER, WATER TABLE
www,>z!U 59 ------- n -- -
> z
2 58W W
<I 57
1965 1966 1967 1968wU-
WELL, 806-229-121A
J DEPTH, 134 FEETw> CASED, 44 FEET-J AQUIFER, FLORIDAN
50W
m 30 I I I I< 1965 1966 1967 1968
I-LUJ
w
F_
U-
Figure 11.-Maximum and minimum monthly water levels in a shallow and adeep well near the northeast edge of the study area.
26 BUREAU OF GEOLOGY
Chemical character of water in the shallow aquifer.-In most of the areawater from the shallow aquifer is of suitable quality for domestic and municipalsupplies although high iron content is a local problem. Because of its lowpermeability, no public water suppliers derive their water from this aquifer. Inthe area immediately adjacent to the bay, water from the shallow aquifer isgenerally high in chloride, about 7,000 mg/1, and in dissolved solids. The waterin the aquifer is generally saline where (1) the land surface is subject to sometidal flooding and (2) the fresh-water head in the aquifer is generally less than 1foot above mean sea level.
FLORIDAN AQUIFER
The Floridan aquifer, the major aquifer underlying the bay and adjacentarea, is not everywhere under artesian or confined conditions. The overlying clayof the Hawthorn Formation together with clay beds in the surficial depositsform a relatively impermeable but leaky confining layer. In much of the areaadjacent to the bay, this clay is absent either as result of nondeposition orremoval by erosion or having been breached by sinkholes. In these areas theFloridan aquifer is under water-table conditions. These conditions may changefrom chiefly water table to chiefly artesian in areas a few miles apart, dependingon the presence or absence of the confining layer.
The potentiometric surface of the Floridan aquifer slopes generally towardthe bay in Hillsborough and Pinellas Counties, as shown in figure 12. Thealtitude of this surface is less than the altitude of the water table in the shallowaquifer in the northeastern part of the drainage area. In some areas adjacent tothe bay, the potentiometric surface is above land surface, and wells that tap theFloridan aquifer flow.
The trough in the potentiometric surface in the vicinity of Oldsmar iscaused by natural discharge of water by seepage from the Floridan aquifer to thebay. The location of the zero-potential contour is inferred. This contourdelineates the boundary of the area of natural fresh-water discharge from theaquifer. Bayward from the zero-potential contour, the aquifer contains salinewater.
The position of the zero contour on the potentiometric surface is not afixed one. The contour moves bayward during wet periods and landward duringdry periods. Fluctuation of the position of zero contour is indicated byfluctuation of water levels (fig. 13) in a deep observation well (800-239-334) onBooth Point that taps the Floridan aquifer. In September 1967, the averagewater level in the deep well was 1.5 feet above msl. In September 1968, itsaverage water level was about mean sea level. Thus, at this well the head in theFloridan aquifer fluctuated from 0.5 foot below msl to 2.5 feet above msl during
28012 30"
0 1 2 MILES
PASCO CO . __
Pinellas County Eldridge10 - Wilde well field) 0
TARPON ro r A . LUTZgoSPRINGsNt4 o 40 LUT
L /m Lake urkey EXPLANATIONTorpen Keys/o
O 0. 10 *0**f ...SSt Petersburg. POTENTIOMETRIC CONTOUR0 1 St. Petesburg D Section 21 Show oltitude of potenlometrtc
0 x Cosine b welt field surface; dhed where inhferred..i / * ) V ~ 5 \ well ^Contour Interval 10 fIet with supp-oeld om a a ol contour at 5 lost. Da-
0 RO , is mean seo level O-oz
SdITRUS PARK Lake Magd Bae undary of study areaIj L A-B-C-D -
c57n Creel: Wh
\LocatIon of ltEK of/shop Ele e 'Action shon en ig 1 4
Lake CarS
CLEARWATER llY or Cp
S3
25040' 30' 8225'
Figure 12.- Map of the upper Old Tampa Bay area showing generalized configuration of the potentiometric surface of theFloridan aquifer and the area of artesian flow, August-November, 1967.Floridan aquifer and the area of artesian flow, August-November, 1967.

28 BUREAU OF GEOLOGY
the investigation, indicating that the position of the zero-potential contour wasat times inland from the well.
FLUCTUATIONS OF THE POTENTIOMETRIC SURFACE
Water levels in the Floridan aquifer fluctuate seasonally less than 5 feet incoastal areas and 10 feet in inland areas. This general range in fluctuation may be
-.
L 1.0Well: 800-239-334D epth: 175 feet
S Cased: 152 feet
SAquifer: Floridon
2 0.5 -
SSEALEVEL
4 September 26, 1968 27
LU 800-239-334
-U
0I
a 1.52.-
> 5
September 9, 1967 10 II
Figure 13.-Water-level fluctuations in a deep observation well on BoothPoint that taps the upper part of the Floridan aquifer.
-4
I-
Figr 13-ae-ee lcutosi ade bevto elo otPon http heuprpr fte lrdnaufr
INFORMATION CIRCULAR NO. 76 29
exceeded during extreme wet or dry years or in areas of large ground-waterwithdrawal. The fluctuation of water levels in 1965-68 in an observation wellthat taps the Floridan aquifer is shown in figure 11. This well is south of Lutzand lies just outside the northeast edge of the area (fig. 2).
CHEMICAL CHARACTER OF THE WATERWater of good quality is obtained from the upper part of the Floridan
aquifer (Tampa and Suwannee Limestones) by municipal well fields in northwestHillsborough and northeast Pinellas Counties. Downgradient from the well fields,water containing a high chloride concentration occurs at relatively shallowdepths in the upper part of the aquifer (Cherry, 1966 and Shattles, 1965). Boththe altitude of the potentiometric surface and the thickness of the fresh-watersection in the aquifer decrease bayward. This saline water at shallow depths inthe upper part of the aquifer has resulted in wells being abandoned in theOldsmar area and in the west-central part of Tampa owing to lowering offresh-water levels by pumping, thereby permitting upward movement of salinewater in the aquifer into the wells. The chloride concentration in the upper partof the aquifer (Tampa and Suwanee Limestones) exceeds 1,000 mg/1 adjacent tothe bay, and the concentration probably increases markedly bayward of thezero-contour on the potentiometric surface, as indicated by data collected fromthe observation well (800-239-332) at Booth Point. Water samples collectedfrom the well contained chloride concentrations of 18,000 mg/1 when the zerocontour was inland from the well and 7,000 mg/1 when the contour wasbayward from the well.
RECHARGE AND DISCHARGE
The Floridan aquifer is recharged by percolation of rainfall through theoverlying sediments and from ground-water inflow from adjacent areas (Stewart,1968, p. 206-209). The aquifer is discharged along stream channels where thechannel bottom intersects the aquifer, in the area of artesian flow around thenorthern and northeastern parts of the bay (fig. 12), and in areas where canalshave cut into the aquifer.
Pumping tests in the area just west of Safety Harbor and in the well fieldsin northwestern Hillsborough County indicate that the Floridan aquiferunderlying the study area has a transmissivity of about 400,000 gpd per ft(gallons per day per foot). The gradient of the potentiometric surface averagesabout 4 feet per mile immediately inland from the bay. Based on these figures,about 32 mgd moves through the Floridan aquifer toward the bay. Much of this32 mgd is discharged to streams that flow into the bay. Part of the ground-waterinflow to the bay occurs as seeps along the northwestern and western parts ofthe bay. This amount will probably remain about the same even if the proposedlake becomes a reality.
30 BUREAU OF GEOLOGY
HYDRAULIC INTERCONNECTION
Important aspects of the investigation involved the evaluation of theeffects of bay freshening upon: (1) the aquifer system beneath and adjacent tothe bay; (2) the part of the aquifer that contains salty water; and (3) the part ofthe aquifer that contains fresh water.
Water levels in wells near tidal waters respond to changes in tide indifferent ways, depending on whether the wells tap unconfined or confinedaquifers. In confined aquifers having an outcrop exposed to tidal bodies ofwater, tidal waters may move into and out of the aquifers, depending on theonshore head in the aquifers. Tidal fluctuations can also be transmitted to aconfined aquifer through its confining layer, as a pressure-loading response toincoming or outgoing tides. As the tidal fluctuations increase, water-levelfluctuations in wells increase, whether the fluctuations are caused by tidalloading or horizontal movement of water in an aquifer in response to theintroduction of tidal water. Therefore, the observed water-level response in wellsin itself is not evidence of either direct or a high degree of interconnectionbetween the Floridan aquifer and upper Old Tampa Bay.
The occurrence and wide distribution of natural fresh-water springs in thebay would indicate a high degree of connection between the bay and theFloridan aquifer. Prior to lowering of the head in the Floridan aquifer, springsreportedly flowed around the bay, at places such as Phillippi Springs, at SafetyHarbor. However, this spring ceased to flow before 1959 (Wetterhall, 1965, p.13). The famous Espiritu Santo mineral springs in Safety Harbor are reported tohave been points of natural discharge from the aquifer.
The springs did not flow in 1946 (Ferguson and others, 1947, p. 137).Reportedly, spring zones were breached during the construction of several of thesubdivision canals in the area. However, salinity traverses did not indicatefresh-water inflow to these canals. Spring zones were reportedly breached also inthe construction of the Lake Tarpon outfall canal. The bottom of the canal isabout at the elevation (15 feet below msl) of the top of the limestone of theFloridan aquifer, and, during construction, the top of the limestone wasbreached in places. Water is retained in this canal between earthen plugs thatprevent salt-water movement from Upper Tampa Bay to Lake Tarpon and thereverse. In 1968 the water between the plugs was considerably fresher (chloridecontent, 160 mg/1) than water in Lake Tarpon (chloride content, 6,000 mg/1)or water in the Bay (chloride content, 15,000 mg/1). The large fresh-wateroverflow from a culvert placed in the top of the plug on the bayward sideindicates that the upper part of the Floridan aquifer immediately below theconfining layer is highly permeable.
Clay beds in the Hawthorn Formation and in the surficial deposits act as aconfining layer for the Floridan aquifer. These clay beds extend beneath the bay
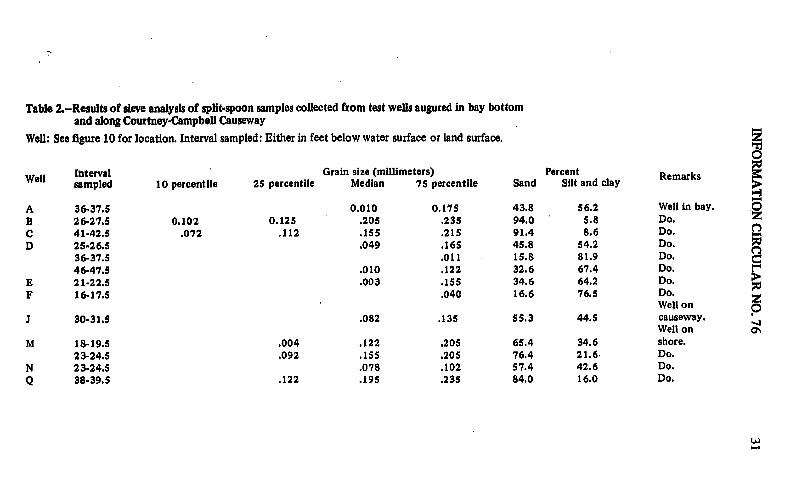
Table 2,-Results of sieve analysis of split-spoon samples collected from test wells augured in bay bottomand along Courtney-Campbell Causeway
Well: See figure 10 for location. Interval sampled: Either in feet below water surface or land surface.
0Well Interval Grain size (millimeters) Percent Remarks
sampled 10 percentile 25 percentile Median 75 percentile Sand Silt and clay
A 36-37.5 0.010 0.175 43.8 56.2 Well in bay. QB 26-27.5 0.102 0.125 .205 .235 94.0 5.8 Do.
C 41-42.5 .072 .112 .155 .215 91.4 8.6 Do.D 25-26.5 .049 .165 45.8 54.2 Do.
36-37.5 .011 15.8 81.9 Do.46-47.5 .010 .122 32.6 67.4 Do.
E 21-22.5 .003 .155 34.6 64.2 Do.F 16-17.5 .040 16.6 76.5 Do.
Well on OJ 30-31.5 .082 .135 55.3 44.5 causeway.
Well onM 18-19.5 .004 .122 .205 65.4 34.6 shore.
23-24.5 .092 .155 .205 76.4 21.6 Do.N 23-24.5 .078 .102 57.4 42.6 Do.
Q 38-39.5 .122 .195 .235 84.0 16.0 Do.
1-
32 BUREAU OF GEOLOGY
A B C D100 -
50'
OLD UPPER TAMPA BAY
UPPER PART OF FLORIDAN AQUIFR
SEA . _M ...............
50-
VERTICAL EXAGGERATION ABOUT X200For location of lines of section A-B-C-D
see figure 12
0 I 2 3 4 MILES
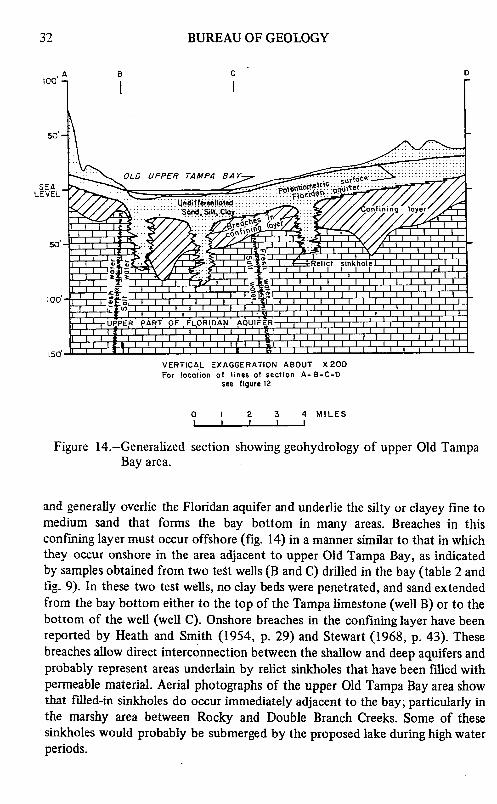
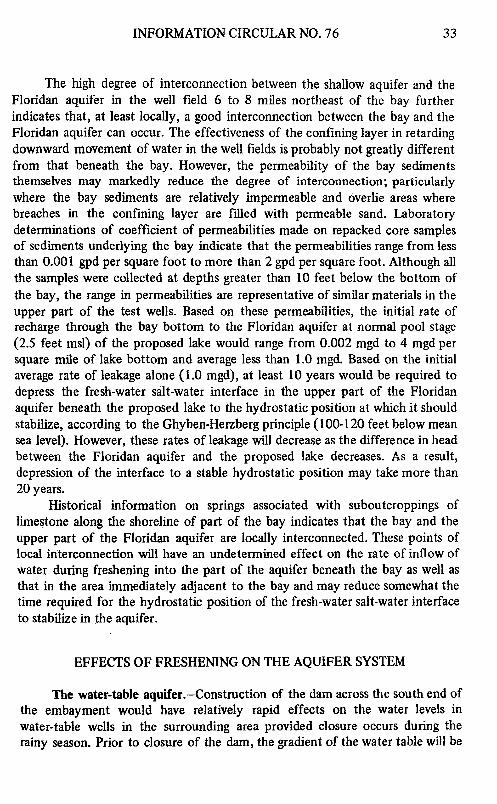
Figure 14.-Generalized section showing geohydrology of upper Old TampaBay area.
and generally overlie the Floridan aquifer and underlie the silty or clayey fine tomedium sand that forms the bay bottom in many areas. Breaches in thisconfining layer must occur offshore (fig. 14) in a manner similar to that in whichthey occur onshore in the area adjacent to upper Old Tampa Bay, as indicatedby samples obtained from two test wells (B and C) drilled in the bay (table 2 andfig. 9). In these two test wells, no clay beds were penetrated, and sand extendedfrom the bay bottom either to the top of the Tampa limestone (well B) or to thebottom of the well (well C). Onshore breaches in the confining layer have beenreported by Heath and Smith (1954, p. 29) and Stewart (1968, p. 43). Thesebreaches allow direct interconnection between the shallow and deep aquifers andprobably represent areas underlain by relict sinkholes that have been filled withpermeable material. Aerial photographs of the upper Old Tampa Bay area showthat filed-in sinkholes do occur immediately adjacent to the bay; particularly inthe marshy area between Rocky and Double Branch Creeks. Some of thesesinkholes would probably be submerged by the proposed lake during high waterperiods.
INFORMATION CIRCULAR NO. 76 33
The high degree of interconnection between the shallow aquifer and theFloridan aquifer in the well field 6 to 8 miles northeast of the bay furtherindicates that, at least locally, a good interconnection between the bay and theFloridan aquifer can occur. The effectiveness of the confining layer in retardingdownward movement of water in the well fields is probably not greatly differentfrom that beneath the bay. However, the permeability of the bay sedimentsthemselves may markedly reduce the degree of interconnection; particularlywhere the bay sediments are relatively impermeable and overlie areas wherebreaches in the confining layer are filled with permeable sand. Laboratorydeterminations of coefficient of permeabilities made on repacked core samplesof sediments underlying the bay indicate that the permeabilities range from lessthan 0.001 gpd per square foot to more than 2 gpd per square foot. Although allthe samples were collected at depths greater than 10 feet below the bottom ofthe bay, the range in permeabilities are representative of similar materials in theupper part of the test wells. Based on these permeabilities, the initial rate ofrecharge through the bay bottom to the Floridan aquifer at normal pool stage(2.5 feet msl) of the proposed lake would range from 0.002 mgd to 4 mgd persquare mile of lake bottom and average less than 1.0 mgd. Based on the initialaverage rate of leakage alone (1.0 mgd), at least 10 years would be required todepress the fresh-water salt-water interface in the upper part of the Floridanaquifer beneath the proposed lake to the hydrostatic position at which it shouldstabilize, according to the Ghyben-Herzberg principle (100-120 feet below meansea level). However, these rates of leakage will decrease as the difference in headbetween the Floridan aquifer and the proposed lake decreases. As a result,depression of the interface to a stable hydrostatic position may take more than20 years.
Historical information on springs associated with suboutcroppings oflimestone along the shoreline of part of the bay indicates that the bay and theupper part of the Floridan aquifer are locally interconnected. These points oflocal interconnection will have an undetermined effect on the rate of inflow ofwater during freshening into the part of the aquifer beneath the bay as well asthat in the area immediately adjacent to the bay and may reduce somewhat thetime required for the hydrostatic position of the fresh-water salt-water interfaceto stabilize in the aquifer.
EFFECTS OF FRESHENING ON THE AQUIFER SYSTEM
The water-table aquifer.-Construction of the dam across the south end ofthe embayment would have relatively rapid effects on the water levels inwater-table wells in the surrounding area provided closure occurs during therainy season. Prior to closure of the dam, the gradient of the water table will be
34 BUREAU OF GEOLOGY
toward the lake. Upon closure, the lake and the water-table aquifer will respondin a manner similar to that reported by Musgrove, Foster, and Toler (1965, p.
45) for Deer Point Lake in northwestern Florida. The level of the proposed lakewill rise in response to fresh-water inflow; the gradient from the aquifer to thelake will be temporarily reversed; and water will move for an undetermined time
from the lake to the water-table aquifer. Saline water from the lake will invadethe aquifer, and chloride concentrations in the aquifer will increase for at least
several hundred feet inland. Saline water will remain in the aquifer until suchtime that fresh-water levels in the water-table aquifer rise above the normal pool
stage of the lake. At this time, the water table will again slope toward the lake,and water in the shallow aquifer will again discharge to the lake. In time, thesaline water will be flushed from the aquifer. The net result on the water table inthe immediate vicinity of the lake will be a rise equal to the rise in lake level.
The Floridan aquifer.-Upon closure of the dam, the level of the proposedlake will rise in response to fresh-water inflow, and water will gradually movefrom the lake into the Floridan aquifer. Initially this water will be highly saline.After 2 to 3 years of fresh-water inflow, the water in the proposed lake willbecome progressively fresher (fig. 10) than that in the Floridan aquifer beneaththe bay.
Because of the imperfect interconnection between the lake and theaquifer, leakage to the aquifer will be greatest in those local areas where the lakeis underlain by breaches in the confining layer that are not covered by finergrained bay sediments and where bedrock crops out in the proposed lake. Theeffect of this leakage should first result in a gradual freshening of the water inthe upper part of the aquifer beneath the bay and immediately adjacent to the
bay. The gradual adjustment of the fresh-water salt-water interface in the aquifer
to the hydrostatic position at which it should stabilize (100-120 feet below msl)
may require more than 20 years.Fresh water will move inland as the fresh-water head in the aquifer at the
shoreline gradually stabilizes at about 2.5 feet above mean sea level. The effects
of this movement will not greatly alter the existing balance between rechargeand discharge in the aquifer or the current gradient toward the bay until afresh-water head above msl is established along the bayward edge of the zero-potential contour. At the time this occurs, the head in the aquifer will slowlyrise, resulting in a temporary imbalance in rates of discharge from and rechargeto the aquifer as water goes into storage. The fresh-water head in the aquifer willcontinue to increase until the water level in the aquifer stabilizes at a newgradient to the proposed lake, and a new local balance is established betweenrecharge and discharge. These readjustments will probably not markedly alterthe amount of discharge (p. 29) from the aquifer in the vicinity of the proposedlake.
The greatest long-term change in water level in the aquifer will be within 1
INFORMATION CIRCULAR NO. 76 35
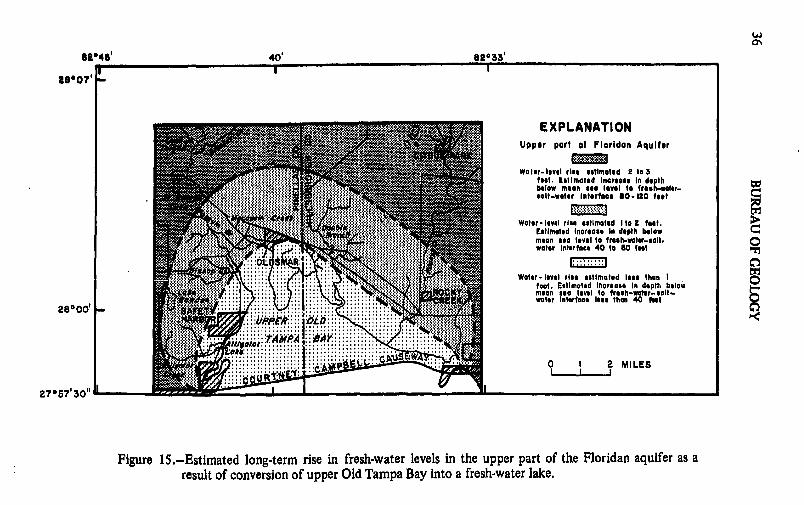
mile of the proposed lake (fig. 15). Where the zero potentiometric contourpresently occurs, the water level in the Floridan aquifer will rise 2 to 3 feetabove mean sea level, depending upon the inland position of the zero contour.Inland from the edge of the bay, most of the water-level rise will occur within 3to 4 miles of the shoreline. Farther inland the rise in water level in the aquiferwill be less than 1 foot.
The increase in the fresh-water head above mean sea level will cause thefresh-water salt-water interface in the areas where the potentiometric surface iscurrently at mean sea level to be depressed 100 to 120 feet below sea level. Oneto two miles inland, the current position of the fresh-water salt-water interfacewill generally be depressed less than 70 feet. Three to four miles inland thechange in the position of fresh-water salt-water interface will be less than 50feet.
The displacement of the fresh-water salt-water interface will increase thefresh-water supply that is available for development only in the immediatevicinity of the bay, where wells requiring relatively small quantities of watercontaining a low chloride concentration can tap the upper 60 to 80 feet of theFloridan aquifer. However, careful control of pumping levels will be required inthese areas to prevent upward movement (upconing) of saline water into thewells as a result of decline in fresh-water head owing to local pumping.Displacement of the interface will have minor effects with respect to controllingupconing of saline water as a result of pumping further inland because theinterface will not be depressed to the base of the permeable zone in the upperpart of the Floridan aquifer near the bay.
SUMMARY AND CONCLUSIONS
Adequate inflow of water of good quality is available to freshen theproposed lake in a reasonable period (about 4 years). During an average year, theinflow would be sufficient to displace the volume of the proposed lake 1.2 to 1.7times, depending upon whether discharge from Lake Tarpon contributes to lakeinflow. During a critically dry year, such as 1956, inflow would not be adequateto maintain lake levels at minimum design level, and the level of the proposedlake would decline 0.25 to 0.50 feet below this desired low level. Loss of waterthrough boat lockages would not be sufficient to affect these lake levelssignificantly during either average or critically dry periods.
An imperfect interconnection exists between upper Old Tampa Bay(proposed lake) and the upper part of the Floridan aquifer. Leakage of freshwater from the proposed lake to the Floridan aquifer will occur chiefly wherethe confining layer is breached and where bedrock crops out in the proposed
62416' 40' 8e2••'0 I I
seo0'
EXPLANATIONUpper part of Floridan Aquifer
Water. level rise estImated 2 to 3feet. Emstimated Increase in depthbelow mean sea level to fresh-water-salt-water Intertaae 80.120 feet
Water- level rise estimated I to 2 feet.Estimated Increase In depth belowmean sea level to fresh-water-salt.water interface 40 to 60 fet
Water- level rise estimated less than Ifoot. Eslmoated Increase In depth belowmean sea level to fresh-water-salt-water interface Iets than 40 feet
28000' .'
2......x::::::::::::: ...
0 I 2 MILESI - I I
27057' 30"
Figure 15.-Estimated long-term rise in fresh-water levels in the upper part of the Floridan aquifer as aresult of conversion of upper Old Tampa Bay into a fresh-water lake.
INFORMATION CIRCULAR NO. 76 37
lake. Upon closure of the dam this leakage should average initially less than 1mgd per square mile of lake bottom and gradually decrease as the headdifference decreases with time. As a result, the gradual adjustment of thefresh-water salt-water interface in the upper part of the Floridan aquifer to thehydrostatic position at which it should stabilize beneath the lake (100-120 feetbelow msl) may require more than 20 years.
The proposed lake will result in a rise in water levels in the shallow aquiferin the immediate vicinity of the lake. The rise will be equal to the rise in lakelevel. A comparable long-term rise will also occur in water levels in the upperpart of the Floridan aquifer. Within 1 mile of the proposed lake, water levels inthe Floridan aquifer should rise 2 to 3 feet above mean sea level. Three to fourmiles inland the rise in the water level in the aquifer should be less than 1 foot.The long-term rise in water levels in the Floridan aquifer will not be sufficient todepress the fresh-water salt-water interface to the base of the permeable zone inthe upper part of the Floridan aquifer near the bay. Therefore, the displacementof the interface will have minor effects with respect to controlling upwardmovement of saline water as a result of pumping farther inland.
38 BUREAU OF GEOLOGY
REFERENCES
Black, A. P.1951 (and Brown, Eugene) Chemical character of Florida's waters-1951:
Florida Board of Conserv., Water Survey and Research Paper 6.
1953 (and Brown, Eugene, Pearce, J. M.) Salt-water intrusion in Florida-1953: Florida Board of Conserv., Water Survey and Research Paper 9.
Black, Crow, and Eidsness1965 Review of water resources, Pinellas County, Florida, 1965.
Brown, Eugene (see Black, A. P.)
Brown, R. H. (see Ferris, J. G.)
Cherry, R. N.1966 Chloride content of ground water in Pinellas County, Florida, in 1950
and 1963: Florida Geol. Survey Map Ser. 20.
1970 (Stewart, J. W., and Mann, J. A.) General hydrology of the middle Gulfarea, Florida: Florida Bur. Geology Rept Inv. 56.
Collins, W. D.1928 (and Howard, C. S.) Chemical character of waters of Florida: U.S. Geol.
Survey, Water-Supply Paper 596-G.
Cooke, C. W.1945 Geology of Florida: Florida Geol. Survey Bull. 29.
Ferguson, G. E.1947 (Lingham, C. W., Love, S. KI, and Vernon, R. O.) Springs of Florida:
Florida Geol. Survey Bull. 31.
Ferris, J. G.1962 (and Knowles, D. B., Brown, R. H., Stallman, R. W.) Theory of aquifer
tests: U.S. Geol. Survey Water-Supply Paper 1536-E.
Foster, J. B. (see Musgrove, R. H.)
Gunter, Herman (see Sellards, E. H.)
Heath, Ralph C-1954 (and Smith, Peter C.) Ground-water resources of Pinellas County,
Florida: Florida Geol. Survey Rept. Inv. 12.
Howard, C- S. (see Collins, W. D.)
Knowles, D. B. (see Ferris, J. G.)
Love, S. K- (see Ferguson, G. E.)
Mann, J. A. (see Cherry, R. N.)
Matson, G. C.1913 (and Sanford, Samuel) Geology and ground waters of Florida: U.S.
Geol. Survey Water-Supply Paper 319.
Menke, C. G.1961 (and Meredith, E. W., Wetterhall, W. S.) Water resources of Hills-
borough County, Florida: Florida Geol. Survey Rept. Inv. 25.
INFORMATION CIRCULAR NO. 76 39
Meredith, E. W. (see Menke, C. G.)
Musgrove, R. H.1965 (Foster, J. B. and Toler, L. G.) Water resources of the Econfina Creek
basin area in northwestern Florida: Florida Geol. Survey Rept. Inv. 41.
Parker, Gerald G.1945 Salt-water encroachment in southern Florida: Am. Water Works Assoc.
Jour., vol. 37, no. 6.
1950 (and Stringfield, V. T.) Effects of earthquakes, trains, tides, winds, andatmospheric pressure changes on water in the geologic formations ofsouthern Florida: Econ. Geology, voL 45, no. 5.
Pearce, J. M. (see Black, A. P.)
Reynolds, Smith, and Hills1959 Tampa Bay fresh-water lake study for Hillsborough-Pinellas County.
Jacksonville, 1959.
1963 Tampa Bay fresh-water lake study for Hillsborough-Pinellas County.Jacksonville, 1963.
Sanford, Samuel (see Matson, G. C.)
Sellards, E. H.1913 (and Gunter, Herman) The artesian water supply of eastern and
southern Florida: Florida Geol. Survey 5th Ann. Rept.
Shattles, D. E.1965 Quality of water from the Floridan aquifer in Hillsborough County,
Florida, 1963: Florida Geol. Survey Map Ser. 9.
Smith, Peter C. (see Heath, Ralph C.)
Stallman, R. W. (see Ferris, J. G.)
Stewart, J. W. (see Cherry, R. N.)
1968 Hydrologic effects of pumping from the Floridan aquifer in northwestHillsborough, northeast Pinellas, and southwest Pasco counties, Florida:U.S. Geol. Survey open-file report.
Toler, L. G. (see Musgrove, R. H.)
Stringfield, V. T. (Also see Parker, Gerald G.)
1933 Ground-water investigations in Florida: Florida Geol. Survey Bull 11.
Vernon, R. 0. (see Ferguson, G. E.)Wetterhall, W. S. (Also see Menke, C. G.)
Reconnaissance of springs and sinks in west-central Florida: FloridaGeol. Survey Rept Inv. 39.

-FLORIDA-GEOLOGICAL-SURVEY
COPYRIGHT NOTICE© [year of publication as printed] Florida Geological Survey [source text]
The Florida Geological Survey holds all rights to the source text ofthis electronic resource on behalf of the State of Florida. TheFlorida Geological Survey shall be considered the copyright holderfor the text of this publication.
Under the Statutes of the State of Florida (FS 257.05; 257.105, and377.075), the Florida Geologic Survey (Tallahassee, FL), publisher ofthe Florida Geologic Survey, as a division of state government,makes its documents public (i.e., published) and extends to thestate's official agencies and libraries, including the University ofFlorida's Smathers Libraries, rights of reproduction.
The Florida Geological Survey has made its publications available tothe University of Florida, on behalf of the State University System ofFlorida, for the purpose of digitization and Internet distribution.
The Florida Geological Survey reserves all rights to its publications.All uses, excluding those made under "fair use" provisions of U.S.copyright legislation (U.S. Code, Title 17, Section 107), arerestricted. Contact the Florida Geological Survey for additionalinformation and permissions.