hydrolysis of cassava starch by amylases from maize
TRANSCRIPT

41
HYDROLYSIS OF CASSAVA STARCH BY AMYLASES FROM MAIZE
A DISSERTATION SUBMITTED IN PARTIAL FULFILMENT OF
THE REQUIREMENTS FOR AWARD OF DEGREE OF MASTER OF SCIENCE (M.Sc) IN BIOCHEMISTRY, UNIVERSITY OF NIGERIA,
NSUKKA
BY
UGEGE, MARTINS EHIZIENLEN (PG/M.Sc/05/39710)
DEPARTMENT OF BIOCHEMISTRY UNIVERSITY OF NIGERIA
NSUKKA
SUPERVISOR: PROF. F. C. CHILAKA
MARCH, 2010

41
CERTIFICATION
Ugege, Martins Ehizienlen, a postgraduate student of the Department of Biochemistry with the
Reg. No PG/ MSc/05/39710, has satisfactorily completed the requirement of research work, for
the degree of Master of Science (M.Sc.) in Biochemistry. The work embodied in this project
(dissertation) is original and has not been submitted in part or full for any other diploma or
degree of this or any other university.
PROF. F. C. CHILAKA PROF. L. U. S. EZEANYIKA (Supervisor) (Head of Department) EXTERNAL EXAMINER

41
DEDICATION
This work is dedicated to:
♦ My late wife, Abigail Obiageli Ugege
♦ My children and
♦ Blessing

41
ACKNOWLEDGEMENT
This research work was made possible by the special grace of God and through the
dedicated supervision of Prof. F. C. Chilaka who pledged much of his time and academic
expertise to its success. To God certainly is the Glory. To Prof. Ferdinand C. Chilaka is my
gratitude.
I am sincerely grateful to my fellow colleagues, most especially, Mr. Charles Nwamba
for technical assistance, Dr. Joshua Parker Elijah for useful suggestions and advise and Mr. O. E.
Ikwuagwu who made his laboratory facilities available to me as an alternate lab in times of black
out.
My profound gratitude goes to my lecturers among whom are Prof. O. U. Njoku and Dr
E. O. Alumanah who graciously gave me Dinitrosalicyclic acid (DNS) and Folin Ciocalteau
reagents and also Bovine Serum Albumin (BSA), Prof. O. Obidoa, Prof. I. N. E. Onwurah, Prof.
O. F. C. Nwodo, Prof. L. U. S. Ezeanyika and Dr. H. A. Onwubiko who contributed individually
and collectively to the success of this work.
This work would not have been possible without the assistance of Hausen Ikhelea,
Programme Manager, Edo State Agricultural Development Programme (ADP) who gave me all
eight (8) samples of Cassava cultivars in ADP farm in Benin City and Ambrose Ali University
farm, Ekpoma. The twenty (20) maize varieties were given to me by Mr Salawu Adewumi and
Paul Ibrahim, both of International Institute of Tropical Agriculture (IITA), Iwo Road, Ibadan.
May God bless you all.

41
���������
Crude maize amylase was extracted from twenty (20) cultivars of maize grains obtained from
International Institute of Tropical Agriculture (IITA), Ibadan. Cassava starch was extracted from
eight (8) varieties of hydrid cassava tubers from IITA, Ibadan. Maize amylase activity was
determined by the Dinitrosalicyclic acid (DNS) method using 1% pure soluble corn starch as
substrate. The effects of pH, Ca2+ ion on enzyme activity with highest activity was used to
hydrolyze the cassava starch from the eight varieties of cassava. Amylase activity was found in
ungerminated and germinating maize. The highest activity was detected on the third day of
germination in all maize varieties. The pH profile produced three peaks at pH 5.5, 7.5 and 9.5
suggesting three isoenzyme forms suspected to be �-amylase, �-amylase and limit dextrinase,
Ca2+ (0.05M) activated amylase activity two fold, while Ca2+ (0.1M) inhibited it two-fold. The
highest amylase activity was determined with maize variety coded Y-Syn-VAR-IF2. All eight
varieties of cassava starch were hydrolyzed by maize amylase. The highest amount of reducing
sugar (glucose) was obtained from the cassava variety coded TME 419. The rate of hydrolysis of
cassava starch was as pure soluble corn starch.

41
TABLE OF CONTENTS
PAGE Title Page .. .. .. .. .. .. .. .. .. .. i Certification .. .. .. .. .. .. .. .. .. .. ii Dedication .. .. .. .. .. .. .. .. .. .. iii Acknowledgements .. .. .. .. .. .. .. .. .. iv Abstract .. .. .. .. .. .. .. .. .. .. v Table of Contents .. .. .. .. .. .. .. .. .. vi List of Figures .. .. .. .. .. .. .. .. .. .. ix CHAPTER ONE: INTRODUCTION 1.1 Introduction … … … … … … … … … 1
1.2 Biology of Cassava and Maize … … … … … … 2
1.2.1 Cassava … … … … … … … … … 2
1.2.2 Maize … … … … … … … … … 6
1.3 Starch … … … … … … … … … 8
1.3.1 Starch properties … … … … … … … … 8
1.3.2 Test for starch … … … … … … … … 10
1.3.3 Cassava starch … … … … … … … … 11
1.3.4 Starch synthesis … … … … … … … … 12
1.3.5 General biosynthesis of polysaccharides … … … … … 12
1.3.6 Biosynthesis of a glycosidic bond … … … … … 14
1.3.7 Structural alterations to sugar nucleotide before polysaccharide assembly … 16
1.3.8 Starch hydrolysis (degradation) … … … … … … 17
1.3.9 Acid hydrolysis … … … … … … … … 17
1.3.10 Enzyme hydrolysis of starch … … … … … … … 19
1.4 Amylases … … … … … … … … … 19
1.4.1 General properties of amylases … … … … … … 19
1.4.2 Sources of amylases … … … … … … … … 20
1.4.3 Plant amylases … … … … … … … … … 20
1.4.4 Amylases production in germinating cereals … … … … 21
1.4.5 Maize amylases … … … … … … … … 22
1.5 Aims and objectives of research … … … … … … 23

41
CHAPTER TWO: MATERIALS AND METHODS 2.1 Materials … … … … … … … … … 24
2.1.1 Sample collection and location(s) … … … … … … 24
2.1.1.1 Cassava varieties … … … … … … … … 24
2.1.1.2 Maize varieties … … … … … … … … 24
2.1.2 Chemicals/Reagents/Samples … … … … … … 25
2.1.3 Apparatus … … … … … … … … … 26
2.2 Methods … … … … … … … … … 26
2.2.1 Preparation of buffers … … … … … … … 26
2.2.2 Extraction of cassava starch … … … … … … 27
2.2.3 Glucose calibration curve … … … … … … … 27
2.2.4 Enzyme extraction … … … … … … … 27
2.2.5 Method of enzyme assay … … … … … … … 27
2.2.6 Effect of germination on maize amylase activity … … … 27
2.2.7 Effect of pH on maize amylase activity … … … … … 28
2.2.8 Germination of maize … … … … … … … 28
2.2.9 Determination of activity in 20 varieties of hydrid maize … … … 28
2.2.10 Assay of amylase activity in maize … … … … … … 28
2.2.11 Effect of Ca2+ ions on amylase activity … … … … … 29
2.2.12 Determination of protein concentration in all enzyme extracts … … 29
2.2.13 Protein determination … … … … … … … 29
2.2.14 Maize amylase specific activity … … … … … … 30
2.2.15 Activity of maize amylase on cassava starch … … … … 30
2.2.16 Effect of pH on amylase activity using cassava starch as substrate … … 30
2.2.17 Effect of substrate concentration on enzyme activity … … … 30
2.3 Statistical Analysis … … … … … … … 31
CHAPTER THREE: RESULTS 3.1 Effect of germination on amylase activity … … … … … 32
3.2 Effect of pH on amylase activity … … … … … … 32
3.3 Amylase activity before imbibition at pH 5.5, 7.5 and 9.5 … … … 33
3.4 Amylase activity on day 3 after imbibition at pH 5.5, 7.5 and 9.5 … … 34

41
3.5 Amylase activity on day 5 after imbibition at pH 5.5, 7.5 and 9.5 … … 35
3.6 Protein determination … … … … … … … 39
3.7 Maize amylase specific activity … … … … … … 41
3.8 Determination of maize variety with the highest amylase activity … … 45
3.9 Hydrolysis of cassava starch by enzyme extract from VAR.I.F2 … … 45
3.10 Effect of Ca2+ on enzyme activity … … … … … 45
3.11 Effect of substrate (starch) concentration on maize enzyme activity … 45
3.12 Effect of pH on amylase activity using 1% cassava starch … … … 46
CHAPTER FOUR: DISCUSSION AND CONCLUSION
4.1 DISCUSSION … … … … … … … … 50
4.2 CONCLUSION … … … … … … … … 55
REFERENCES … … … … … … … … … 57 APPENDICES … … … … … … … … … 62

41
LIST OF FIGURES PAGE
Fig. 1a TMS 98/2101 Ox-blood petiole (Age 12 Months) … … … … 4
Fig. 1b TME 419 (Age 5 Months) … … … … … … … 4
Fig. 1c TME 94/0561 Carotenoid Yellow Tuber (Age 12 Months) … … 4
Fig. 1d TME 94/0561 Tuber (Age 12 Months) … … … … … 4
Fig. 1e TMS 98/2101 Large Tubers (Age 12 Months) … … … … 5
Fig. 1f TME 419 (Age 12 Months) … … … … … 5
Fig. 1g TMS 419 Long Slender Tubers (Age 6 Months) … … … … 5
Fig. 2 A maize plant … … … … … … … 7
Fig. 3 Chemical structure of amylose and amylopectin … … … … 9
Fig. 4 Synthesis of an activated precursor, uridine
diphosphoglucose from glucose … … … … … 13
Fig. 5 Hydrolysis and synthesis of starch … … … … … 15
Fig. 6 Sugar nucleotides derived from fructose 6 phosphate … … … 17
Fig. 7 Starch hydrolysis … … … … … … … … 18
Fig. 8 Diagram of maize grain (showing Scutellum and Aleurone Layer) … 22
Fig. 9 Effect of germination on enzyme activity … … … … 34
Fig. 10 Effect of pH on maize enzyme activity … … … … … 35
Fig. 11 Amylase activity in ungerminated maize (before imbibition) … … 36
Fig. 12 Amylase activity in maize, day 3 after imbibition (germinated) … … 37
Fig. 13 Amylase activity in maize, day 5 after imbibition (germinated) … … 38
Fig. 14 Protein concentration in all enzyme extract … … … … 40
Fig. 15 Amylase specific activity at pH 5.5 in ungerminated
and germinated maize … … … … … … … 42
Fig. 16 Amylase specific activity at pH 7.5 in ungerminated
and germinated maize … … … … … … … 43
Fig. 17 Amylase specific activity at pH 9.5 in ungerminated
and germinated maize … … … … … … … 44
Fig. 18 Comparative study of four maize varieties with the highest activity … 47
Fig. 19 Activity of maize enzyme from VAR I.F2 on starch extracted
from eight (8) varieties of cassava … … … … … 48
Fig. 20 Enzyme (amylase) activity at different pH using 1% cassava starch from
TME 419 enzyme extracted from VAR I.F2 3 days after imbibition … 49

41
CHAPTER ONE
INTRODUCTION AND LITERATURE REVIEW
1.1 INTRODUCTION
Environmental, agricultural and energy challenges coupled with rapid depletion of fossil
fuel reserves have led to increasing interest in renewable energy sources, one of them being

41
bioethanol. Bioethanol is a readily available clean fuel for combustion engines. It allows engines
to more completely combust fuel which benefits in cleaner emissions. Basically, bioethanol is
made from a variety of starch producing plants, (grains, mostly corn and tubers like cassava) and
sugar plants (sugar beet sugar cane). Cassava is the crop of choice because it contains the highest
concentration of starch among all starch producing plants, 35% of dry weight. It is low in
impurities such as proteins and lipids and in recognized as an excellent source of pure starch.
Upon hydrolysis, it yields the highest concentration of glucose residue which is the basic raw
material for production of bioethanol, glucose syrup for soft drinks, pharmaceutics and
seasoning.
Cereal crops are rich sources of hydrolytic enzymes. Among the cereals, barley and
maize have been found to produce high levels of amylase enzymes during germination which is
naturally produced to digest starch in the endosperm. Barley is grown in the temperate regions
and cannot survive high temperatures. Maize crop requires considerable moisture and warmth
and is grown all over Nigeria where it is well adapted. Amylases for the hydrolysis of cassava
starch are derivable from geminating maize.
Cassava and maize are abundantly available in Nigeria. Both as food for man and feed for
animal, cassava and maize are among the most important crops in Nigeria agricultural economy
Nigeria is the world’s leading cassava producer and has the potential for producing more than
four fold its present production volume (FAO, 1998). Oke (2005) indicated that approximately
30 percent of cassava root produced in Nigeria was lost due to low industrial demand and poor
processing and storage. The high cassava production potential in Nigeria could be a gold-mine
which can be tapped if new technologies are developed for converting raw cassava starch into
industrial raw materials.
Maize production in Nigeria can be accelerated as the crop has great potentials and can
be cultivated in most parts of Nigeria, North and South. An overriding concern would be the
need to streamline breeding objectives for greater effectiveness. In this respect, the emphasis is
on cultivation of special strains of maize that produce high levels of amylases. These varieties
have been developed by International Institute of Tropical Agriculture (IITA), Ibadan and are in
cultivation in Nigeria but the demand for them has not been there.
It is certain that the major raw material for production of bioethanol, cassava and maize
are available in large quantities in Nigeria. Developing a technology that can utilize these local
raw materials to produce value added end products will not only provide employment for more
than about seventy million Nigerians but will also produce economic gains and foreign exchange
for Nigeria.

41
1.2 BIOLOGY OF CASSAVA AND MAIZE
1.2.1 Cassava
Cassava (Manihot Esculenta Crantz) is a perennial woody shrub grown for its edible
tubers which are starch filled. It is vegetatively propagated and grown throughout the low land
tropics. Originating in tropical and sub-tropical areas of central and South America, cassava
arrived in Africa at the end of the sixteenth century through Portuguese settlers from Brazil
(Cork, 1985). The largest producers of cassava are Brazil, Paraguay Nigeria, Thailand, Zaire and
Indonesia.
Cassava is a short-day plant belonging to the family of Euphorbiaceae. Early literature on
cassava described the qenius with two edible species M. Ultissima phol (sweet) and M. Aipi Phol
(Bitter) delineating species which have high and low cyanogenic glycoside concentration
respectively. More recently cassava was classified as being of the same species of M. Esculenta
Crantz. It is the only one of 98 species in its family, widely cultivated for food production.
Cassava uniformly is 2n = 36. Other ploidy levels are not utilized but have been produced
experimentally. Cassava is well adapted to poor soils with marginal nutritional status and pH
from 4 to 9 (Teise, 2004).
In the 1980s, the International Institute of Tropical Agriculture (IITA) Ibadan introduced
about 40 new improved varieties of cassava to most cassava growing countries in Africa. All 40
varieties are in cultivation in Nigeria. Field trials of 35 of these improved varieties are now going
on by Edo State Agricultural Development Programme (ADP) in a research farm in Ambrose Ali
University (AAU), Ekpoma, Edo State. This is an extension of the IITA field experimentation
project. Nationally, five varieties have been recommended and released in Nigeria and they are
rapidly being distributed for cultivation through the cassava growers Association of Nigeria. The
IITA cultivars code names for these five and a few others are: TME 419; TMS/98/2101;
TMS/97/2205; TMS 30572; TMS/94/0561; TMS/95/0379; TMS/4(2) 1425; TMS/97/0211.
TME – Tropical Manihot esculenta (IITA)
TMS – Tropical Manihot selection (IITA).

41
Fig. 1a: 98/2101 Ox-blood petiole (Age 12 months)
Fig. 1b: TME 419 (5 Months) Fig. 1c: 94/0561 Carotenoid white tuber (12 Months)

41
Fig. 1d: 94/0561 (Age 12 months)
Fig. 1e: 98/2101 Large tubers (Age 12 Months)
Fig. 1f: TME 419 (Age 12 months)

41
Fig. 1g: TME 419 Long slender tubers (Age 6 months)
Fig. 1: Photographic representation of some cassava varieties
These improved varieties of cassava are recommended as high yielding in terms of starch
quality and yield per hectare. Starch obtained from various cassava cultivars differ in physico-
chemical properties such as amylose/amylopectin ratio, molecular weight, intrinsic viscosity,
chain length distribution, solubility and gelling rate and these factors are believed to affect their
rates of hydrolysis (Visser et al., 2006).
1.2.2 Maize
Maize is an arable crop, a cereal, of the family of Graminaceae (now Poeceae). It is 2n=
20. It in essentially a warm weather crop and as such is largely dependent upon the rains. It
requires considerable moisture and warmth from germination to flowering. It is grown all over
the world from tropical to temperate region but the yield is dependent on the fertility of the soil,
rainfall temperature, variety cultivated etc.
It is believed to have originated from America and found its way into Nigeria through the
coastal region of West Africa by Portuguese travelers in the seventeenth century (McCain,
2005). Maize is rich in starch, 75%; protein, 10%; fat, 5%; pentosan, 5%; sugar, 2%; ash, 2%.
About 60% of the maize worldwide is produced in the United State alone. Nigeria accounts for
less than 0.5 percent of the world production and demand for maize is increasing exponentially
as a result of its importance in the poultry and other related industries (Ette, 1996). There is the
need for accelerated maize production to meet the present demand. Much pressure has been
brought to bear on maize growers all over the country to increase production volume. It is
believed that Nigeria has the potential to increase its maize production four fold (Nweke, 1999).
In its contribution, the International Institute of Tropical Agriculture (IITA), Ibadan through its
maize improvement programme has developed improved varieties of maize for the Savanna and

41
for the forest zones of Nigeria. These varieties are believed to have very high yield in teams of
quality and quantity. Some verities are modified for specific industrial applications. Many
varieties can be cultivated all through the year with provision of adequate water supply. The
main focus of the IITA improvement programme is to meet the purpose of the various user
industries. Some varieties are produced for popcorn; flint corn for poultry feed, dent corn for
cornflakes and flour for bakery, sweet corn is eaten fresh or boiled, waxy corn for adhesive and
culture medium etc. Some varieties are high lysine varieties for livestock and some are high
amylase varieties for hydrolysis of starch. In the United States “amylase varieties” are already in
cultivation
Fig. 2: A maize plant
41
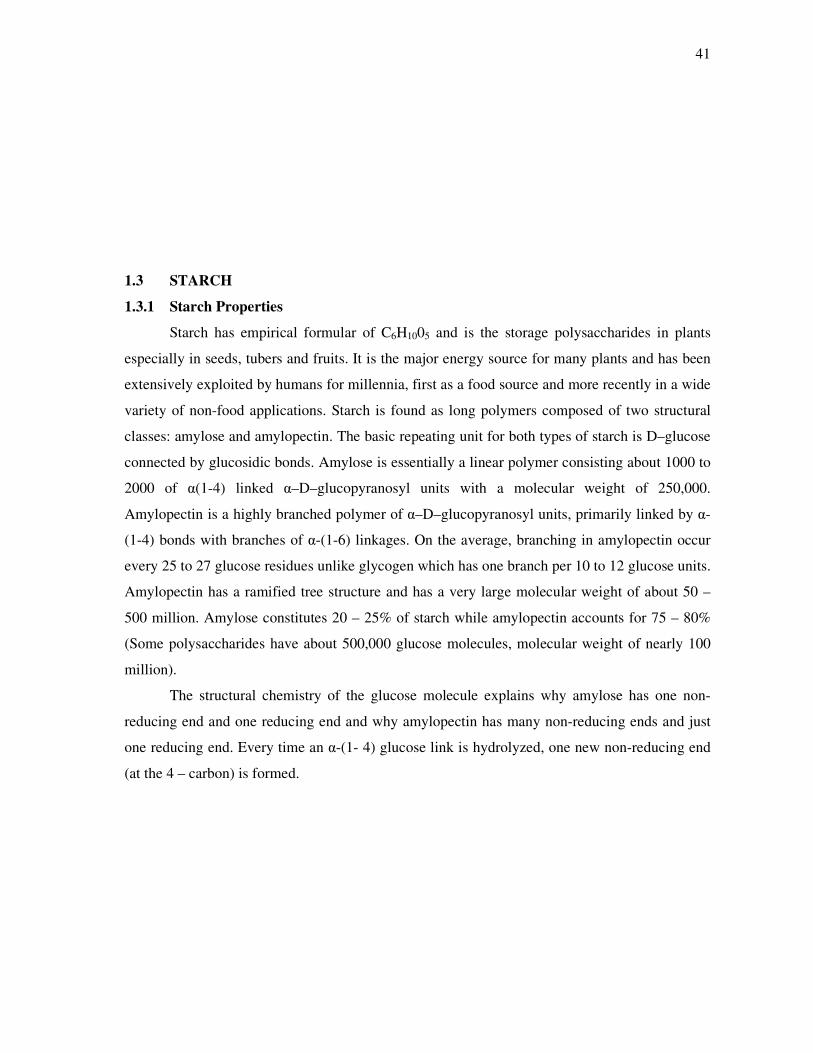
1.3 STARCH
1.3.1 Starch Properties
Starch has empirical formular of C6H1005 and is the storage polysaccharides in plants
especially in seeds, tubers and fruits. It is the major energy source for many plants and has been
extensively exploited by humans for millennia, first as a food source and more recently in a wide
variety of non-food applications. Starch is found as long polymers composed of two structural
classes: amylose and amylopectin. The basic repeating unit for both types of starch is D–glucose
connected by glucosidic bonds. Amylose is essentially a linear polymer consisting about 1000 to
2000 of �(1-4) linked �–D–glucopyranosyl units with a molecular weight of 250,000.
Amylopectin is a highly branched polymer of �–D–glucopyranosyl units, primarily linked by �-
(1-4) bonds with branches of �-(1-6) linkages. On the average, branching in amylopectin occur
every 25 to 27 glucose residues unlike glycogen which has one branch per 10 to 12 glucose units.
Amylopectin has a ramified tree structure and has a very large molecular weight of about 50 –
500 million. Amylose constitutes 20 – 25% of starch while amylopectin accounts for 75 – 80%
(Some polysaccharides have about 500,000 glucose molecules, molecular weight of nearly 100
million).
The structural chemistry of the glucose molecule explains why amylose has one non-
reducing end and one reducing end and why amylopectin has many non-reducing ends and just
one reducing end. Every time an �-(1- 4) glucose link is hydrolyzed, one new non-reducing end
(at the 4 – carbon) is formed.

41
Fig. 3: Chemical structure of amylose and amylopectin
Amylose
Amylopectin

41
These two biopolymers can appear in starch granules in different forms, chain length and
ratio. Complete hydrolysis of starch produce D–glucose also called dextrose sugar. Other food
substances such as proteins, lipids vitamins and minerals are usually found associated with raw
starch.
In plants, the steps in the biosynthesis and degradation of these polysaccharides are much
the same as those involved in glycogen. The main nuclecotide–glucose donor in plants is ADP
glucose. However, in the formation of the more compact forms of amylopectin found in starch
granules. UDP–Glucose also participates. The introduction of �–1–6 glucosidic linkages
producing branch points is by a transfer of existing lengths of �–1,4 chains.
Candy (1980) observed that plants deposit starch in the form of granules. Starch is
generally insoluble in water at room temperature. The granules are quite resistant to penetration
by both water and hydrolytic enzymes due to formation of hydrogen bonds within the same
molecule and with other neighboring molecules. However, these inter and intra hydrogen bonds
can become weak as the temperature of the suspension is raised. When an aqueous suspension of
starch is heated, the hydrogen bonds weaken, water is absorbed, and the starch granules swell.
The process is commonly called gelatinization because the solution formed has a continuous
highly viscous consistency. Because amylose has a higher gelatinization temperature than
amylopectin (Whistler et al., 1984) the amylose component can be separated from such solution
by applying a temperature differential and addition of organic compounds such as n–butanol or
thymol. The amylose slowly precipitates out as a complex with the organic molecule leaving the
amylopectin which is more soluble in water in solution. Gelatinization temperature varies with
the source of the starch but is mostly between 65 and 75oC. As the temperature of a starch
aqueous suspension is raised above the gelatinization range, intramolecular hydrogen bonds
originated from hydroxyl groups continue to be disrupted, water molecule interact with the
liberated hydroxyl groups and the granules continue to swell. As a direct result of granule
swelling, there is a parallel increase in starch solubility.
1.3.2 Test for starch
The extent of starch breakdown can be measured by the number of reducing groups
formed. The rate of formation of reducing groups can be used to estimate the hydrolysis of starch
by amylolytic enzymes. In addition, starch has a powerful colour reaction with iodine solution.
Amylose yields an intense deep blue-black colour because the iodine incorporates itself easily
into the helical structure of amylose to from a chemical entity, a linear polysaccharide – iodine-
iodide chain called a clathrate. Amylopectin gives a considerably less intense blue violet (or red

41
violet) coloration because unlike amylose, the chains in amylopectin are interrupted by the
branching and are unable to take up helical conformations of sufficient length to associate well
with organic solvents or iodine. Thus, amylose will complex appropriately 20% its own weight
of iodine, whereas amylopectin complexes less than 1% its own weight of iodine. The iodine
colour is commonly used to monitor the course of starch breakdown.
1.3.3 Cassava Starch
Cassava roots contain the highest concentration of starch among all starch producing
plants, approximately 35% of dry weight. It is low in proteins and lipids and is recognized as an
excellent source of pure starch suitable for a wide range of applications. Processed cassava starch
is odourless, has paste clarity, high stickiness and upon hydrolysis has the highest concentration
of glucose residues. The properties of starch extracted from cassava plant species have been
improved, (a) by the identification and selection of genotypes with favorable natural variations,
(b) controlled crosses and selection of offspring with desirable traits and (c) more recently by
genetic modification through transformation and regeneration of the protoplasts (Visser et al.,
2006). Many genes involved in starch synthesis have been identified at the molecular level,
providing the means of both manipulating starch properties in novel ways and defining how
useful changes to cassava starch have been made. Starch obtained from improved IITA cassava
varieties contain essentially about 2-5% amylose and 95-98% amylopectin based on the (dry
substance) weight of the starch. The increase in amylopectin content confers some distinct
properties on starch from these transgenic cassava plants, such as high molecular weight, high
intrinsic viscosity, smaller particle size, longer chain length distribution and high solubility
(Visser et al., 2006). These properties place cassava at an advantage over maize (corn), potato
and yam in the choice of plant starch for hydrolysis to sugar. It has been investigated that the rate
of hydrolysis of starch to high glucose syrup is higher in cassava than in Maize, potato, yam and
cocoyam (Omemu et al., 2005).
1.3.4 Starch Synthesis
Starch is composed of two types of polysaccharides, amylose and amylopectin. The
conformation adopted by a particular polysaccharide is unique and produces a surface that
invests the molecule with a particular biological function. The role of many polysaccharides is
structural. As insoluble polymers, they support and protect the fragile membrane bilayer
surrounding the cytoplasm; therefore, they must be located on the exterior face of the cell

41
membrane, sometimes at a particular zone. Nevertheless, these structural carbohydrate polymers
are synthesized intracellularly to perform their functions in the extra-cellular environment.
Therefore, the well known fibrous types such as cellulose are embedded in an extra-cellular gel
formed by other polysaccharides.
1.3.5 General Biosynthesis of Polysaccharides
The sequence starts with a monosaccharide and ends with a functional polysaccharide for
example:-
S S – P S P –P – Nus Sn
Where
S = Sugar
S – P = Sugar–Phosphate
P–P–NUS = Nucleotide Diphospho Sugar
Sn = Polysaccharide.
Biosynthesis of a polysaccharide (Sn) from a monosaccharide (S) intermediate stage are
the formation of a sugar phosphate (SP) and an activated precursor, a nucleoside diphosphosugar
(S – P – P – Nus).
The sequence of monosaccharide residues in a polysaccharide is determined by the
specificity of the synthetase for the donating activated sugar and the accepting residue at the
growing terminus of the polysaccharide chain. Starch synthetase 1 catalyzes only the synthesis of
�-1,4 linkages while a branching enzyme forms the �-1,6 linkages that make starch branched.
CH OH2
H
OH
H
OH
H
H
OH
H
OH
O
Hexokinase
ATP ATP
CH --O-- --O (Glc, 16-biphosphate2
H
OH
H
OH
H
H
OH
H
OH
O
OIIP1O-
CH OH2
H
OH
H
OH
H
H
OH
H
O-- - O + O-- --O-- --O-- --O- Uridine
O
GLUCOSE (Glc)
GLUCOSE 6 PhosphatePhosphoglucomutase
(Gly 1,6- bisphosphatase)
OIIPIO
OIIPIO
OIIPIO
OIIP IO
Glucose 1 - phosphate Uridine triphosphate
UDO-Glucose
hosphorylase
ATP

41
Fig. 4: Synthesis of an activated precursor, uridine diphosphoglucose from glucose.
The incorporation of a sugar residue into a polysaccharide requires about about 15 – 20
KJ mol-1 for each residue transferred. The activated precursors most commonly used are sugar
derivative of nucleotide diphosphate (di(p)), namely, sugar nucleotides. The formation of a sugar
nucleotide requires the cleavage of two phosphoanhydride bonds (Fig. 4). The formation of
UDP-Glc from Glc 1-p is ensured by the hydrolysis of PPi which is highly exogonic reaction.
1.3.6 Biosynthesis of a Glycosidic Bond
The active site of the synthetase 1 catalyses the formation of an unstable oxonium ion in
the sugar being transferred and releases a stable nucleoside diphosphate. Nucleophilic attack by a
specified hydroxylic oxygen of the accepting sugar residue leads to the formation of a glucosidic
bond between the sugar residues. The mechanism of this reaction is shown in Fig. 5.

41
Fig. 5: Hydrolysis and synthesis of starch
1.3.7 Structural alterations to sugar Nucleotide before polysaccharide Assembly
The types of monosaccharide residues required by the cell for incorporation into
polymers are frequently not the same as those available to it in the environment or from

41
endogenous cellular reserves. Monosaccharide residues are altered structurally by intracellular
pathways according to the demands of the cell. With few exceptions, the change from one sugar
to another by epimerization of –OH groups, oxidation of CH2OH to –COO– or introduction of
an –NH2 occurs before polymerization in many cases, usually after the formation of the sugar
nucleotide. In contrast, the structural alterations of carbohydrates without change of
configuration by sulphation, phosphorylation or methyllation occur after the polymer has been
formed. Pre-polymerization structural modification of sugar is shown in Fig. 6.
(UDP, CDP, TDP, ADP and GDP) – glucose
Glocose 1 phosphate
Glucose 6 phosphate
Fructose 6 phosphate Mannose 6 phosphate Mannose phosphate
41
Glucosamine 6 phosphate GDP Mannose N – A cetylglucosamine 6 phosphate
N – A cetylglucosamine 1 phosphate
UDP – N- Acetylglucosamine
Fig. 6: Sugar nucleotides derived from fructose 6 phosphate
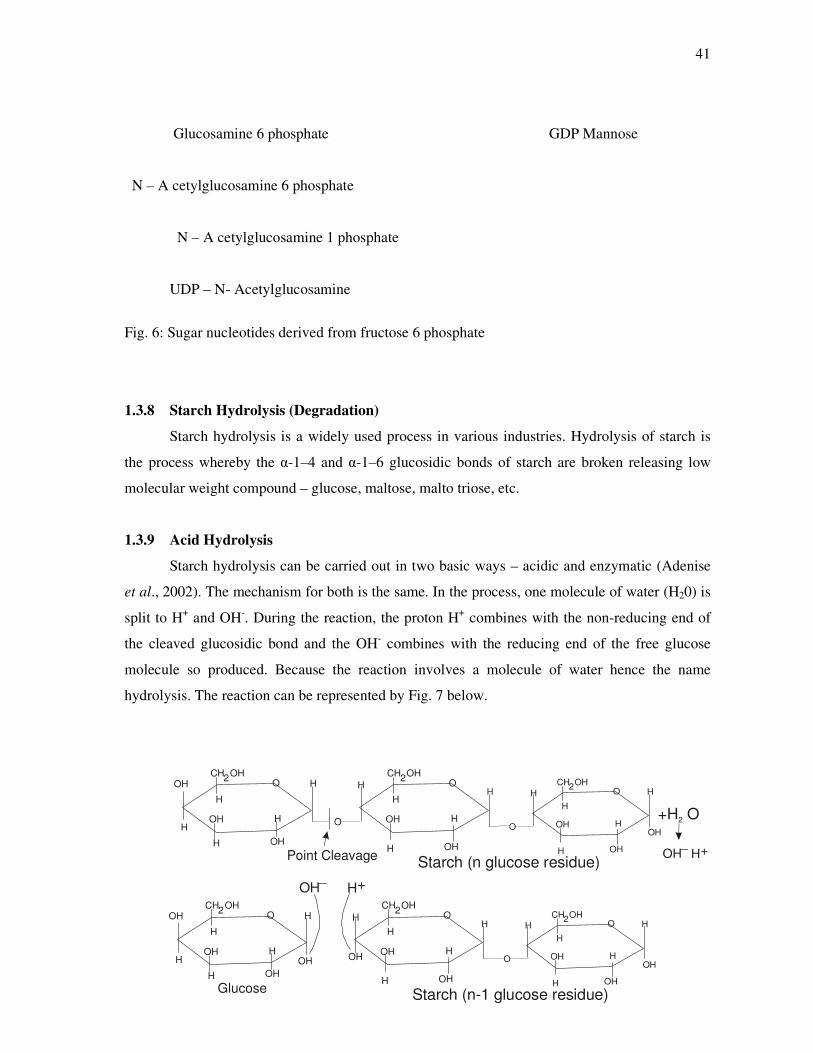
1.3.8 Starch Hydrolysis (Degradation)
Starch hydrolysis is a widely used process in various industries. Hydrolysis of starch is
the process whereby the �-1–4 and �-1–6 glucosidic bonds of starch are broken releasing low
molecular weight compound – glucose, maltose, malto triose, etc.
1.3.9 Acid Hydrolysis
Starch hydrolysis can be carried out in two basic ways – acidic and enzymatic (Adenise
et al., 2002). The mechanism for both is the same. In the process, one molecule of water (H20) is
split to H+ and OH-. During the reaction, the proton H+ combines with the non-reducing end of
the cleaved glucosidic bond and the OH- combines with the reducing end of the free glucose
molecule so produced. Because the reaction involves a molecule of water hence the name
hydrolysis. The reaction can be represented by Fig. 7 below.
CH OH
CH OH
CH OH
CH OH
CH OH
CH OH
2
2
2
2
2
2
H
H
H
H
O O
O
OH
OH
H
H
H
H
H
H
OH
OH
OH
OH
OH
OH
H
H
H
H
H
H
H
H
H
H
H
H
H
H
OH
OHOH OH
OH
OH
OH
OH
OH
OH
H
H
H
H
H
H
O
O
O
O
O
O
Point Cleavage
Glucose
+H O2
OH_
H+
OH_
H+
Starch (n glucose residue)
Starch (n-1 glucose residue)

41
Fig. 7: Starch hydrolysis
The older and more traditional method is acidic hydrolysis which requires high acid
medium (pH = 1 to 2) obtained through mineral acids, high temperatures (150-2300C) and high
pressure (1 – 4 atmosphere). As a result of the thermal processing, acidic hydrolysis produces
unnecessary byproducts which contaminate the end – product hydrolysate.
1.3.10 Enzymatic Hydrolysis
The enzymatic hydrolysis of starch is carried out under milder condition such as lower
temperature (up to 700C), normal pressure and the pH of the medium is around 5 – 9. At the
same, time enzymatic hydrolysis is characterized by high reaction rate, high stability of the
enzyme towards the denaturing action of solvents, detergents, proteolythic enzymes, and a
decrease in the viscosity of the reaction medium at higher temperatures.
The basic parameters which affect the hydrolysis process – temperature, pH of the
medium, concentration of the substrate and concentration of the enzyme – usually vary
depending on the source of the enzyme and substrate.

41
1.4 AMYLASES
Amylases are a family of enzymes capable of digesting glycosidic linkages found in
starches. Amylases are present in all living organisms, but the enzymes vary in activity,
specificity and requirements from species to species and even from tissue to tissue in the same
organism.
1.4.1 General Properties of Amylases
Several amylases are involved in the complete hydrolysis of starch to sugar. The main
enzymes of starch digestion includes �–amylase(s), �–amylase(s) and limit dextrinase(s) �–
amylase �-[1–4–D–glucan 4–glucanohydrolase, EC 3.2.1.1.] an endo-enzyme, hydrolysis �-(1-4)
linkages of both exterior and interior chains of starch (amylose and amylopectin) to give a
mixture of maltose and small molecular weight oligosaccharide. When �–amylase acts on starch
molecules, there is rapid decrease in the size of starch molecules with an accompanying dramatic
decrease in the viscosity of a starch paste, hence the enzyme is commonly called the liquefying
enzyme. �–amylase is so called because it leaves the new reducing group formed as a result of its
action in the �–position.
�–amylase (�–1–4–D – glucan maltohydrolase, EC 3.2.1.2) is an exoenzyme which has a
rigidly ordered action . It is called �–amylase because it was thought to leave the new reducing
group formed by its action in the �–position. It attacks amylose and amylopectin from the non-
reducing ends and sequentially hydrolysis every second �–1–4 links. This yields the
disaccharide, maltose (a fermentable sugar) and a new starch molecule slightly reduced in
molecular size. �-amylase is able to repeat this action with great speed especially in the presence
of large molecules for which it has high affinity. Under these conditions it probably makes
multiple hits on a single chain of amylose or amylopectin before beginning work on another
chain. Its rate of reaction is considerably less with small molecules for which it has less affinity.
The enzyme slows and stops as it approaches the �–1-6 branch point of amylopectin. It is
capable of converting amylose almost entirely to maltose. In contrast to �-amylase activity, �–
amylase attacks only the outer regions of amylopectin releasing about 10-15% of the glucose
residues as maltose and leaving �–limit dextrins. Because �–amylase releases the sweet – tasting
sugar maltose from starch it has been traditionally called the saccharifying enzyme.
The �-1–6 links at the branch points are hydrolysed by limit dextrinase, [amylopectin (or
pollulan)-6–glucano hydrolase EC 3.2.1.41] also known as R–enzyme. Its action is to remove

41
short chains of two or more glucose residues from the branch points of �–limit dextrin by
hydrolyzing the �-(1 – 6) links.
1.4.2 Sources of Amylases
Amylase could be plant based, microbial or animal. Of all the sources, plant amylases are
the most active. They contain the highest active units and can digest more carbohydrates in the
broadest pH range than any other source (Thomas, 1971).
1.4.3 Plant Amylase
More recently, two types of �–amylase have been identified in plants, the endosperm �–
amylase and tissue – ubiquitous �–amylase with each having different expression patterns and
promoters. The tissue – ubiquitous �–amylase is found more commonly and is expressed first
during germination. The chemical properties of �–amylase vary between plant and bacterial
species. The molecular weight of plant derived �–amylase usually falls between 53,000k Da and
64.200kDa. The optimum pH for plants �-amylase is between 8.0 and 9.0 (Zeigler, 1999). The
isoelectric point is between 5.0 and 6.0 for plant. However, the molecular weight of bacterial �–
amylases generally range form 42,000kDa to 70,000kDa and have optimum pH between 6.5 and
7.0. Their isoelectric point is from 8.0 to 9.0 (Williams, 2005). Plant �–amylase has a pH
optimum of 6.0 (Chotineeranat, 1998) and limit dextrinase optimum pH of 7.0 (Lewis et al.,
1998).
Some �–amylases have been reported to catalyze 1-6 hydrolysis and some pullulanases
(debranching enzymes) have been reported to hydrolyze not only �–1-6- but also �–1-4
glucosidic linkages (Lee, 1994). It has been suggested that the amylases operate co-operatively
as one family in starch hydrolysis.
1.4.4 Amylase Production In Germinating Cereal Seeds
The physiological maturity of maize grain generally occurs 45 – 50 days after anthesis,
and marks the end of nutrient delivery and the beginning of senescence, and caryopse
desiccation. The mature grain is then harvested and stored, in a dormant stage. It is characterized
by dehydration and a dramatic decrease of metabolic activity. Germination is induced by
rehydration of the seed, which increases both respiration and metabolic activity, thus allowing
the mobilization of primary and secondary metabolites (Limami et al., 2002). Therefore the
biochemical composition between ungerminated and germinated kernels is different. Amylase
activities may be found in ungerminated maize if total caryopse desiccation has not taken place.

41
Germination induces the synthesis of hydrolytic enzymes e.g. starch degrading enzymes and
proteases. It also increases the availability of minerals (iron, zinc, etc) and essential amino acids
(principally Lys, Tyr and met). The production of hydrolytic enzymes by germinating seeds is
accelerated up to a point where the starch content in the endosperm is very much depleted and
the young embryo is able to synthesize part of its own food. Therefore, the synthesis of
hydrolytic enzymes drops and finally seizes. Amylases in germinating cereals are naturally
produced to degrade starch in the endosperm to glucose. During germination, the principal
enzyme involved in carbohydrate breakdown is �–amylase, which hydrolyeses �-(1-4) bonds in
amylase and amylopectin releasing fragments that can be further broken down by �–amylase and
debranching enzymes to glucose. �–amylase is synthesized de-novo in two specific tissues of the
cereal grain, the scutelliar epithelium of the embryo and the aleurone layer of the endosperm.
Fig. 8: Maize Grain (showing Scutellum and Aleurone Layer)
The germinating embryo produces gibberellins which stimulate the aleurone layer to
produce enzymes including �–amylases, �–amylase and limit–dextrinase during germination.
But �–amylase is present in an inactive form before germination and becomes active during
germination. �–amylase is heat stable in the presence of starch and can survive temperatures up
to 100oC. �–amylase and limit dextrinase are readily denatured by heat above 60oC (Lewis et al.,
1998). �-amylase however is more stable than �–amylase (Zeigler et al. 1999).
1.4.5 Maize Amylase
The choice of maize as source of amylases for hydrolysis of cassava starch is born on the
fact that several varieties of maize produce all amylases required for starch hydrolysis whereas
REMAINS OF STYLE
ENDOSPERM
SCUTELLIUM
EMBRYO
WHOLE MAIZW GRAIN
FUSEO FRUIT ANDSEED COAT
GESTA & TEGMEN
ENDOSPERMCOLEOPTILESCUTELLUMALEURONE LAYER
PLUMULE}EMBRYORADICLE
COLEORHIZALONGHUDINAL SECTION

41
some cereal crops such as sorghum are very low in �–amylase (Mamoudou et al., 2006). It has
been confirmed that maize amylases are produced to digest completely starch in the endosperm
to sugar for germinating embryo (Lewis et al., 1998).
Results of the effects of germination on maize amylase activities show that amylase
production increases with germination. The peak of amylase activity is attained on the third or
fourth day of germination. The total starch content of germinating maize grain is completely
digested by the sixth day. It is established that all enzymes required for starch hydrolysis are
available in adequate quantity in germinating maize.
1.5 AIM AND OBJECTIVES
This work focuses on hydrolysis of cassava starch by amylases from germinating maize.
The ultimate goal is to determine varieties of maize with the highest amylase activity and the
utilization of such varieties of maize to digest starch from several varieties of cassava and to
ascertain which variety(ies) of cassava can produce the highest amount of glucose residue for
production of high glucose syrup for the beverage and pharmaceuticals as well as bioethanol for
combustion engines. It is hoped that the result of this investigation will be found useful in the
development of the technology for processing raw cassava starch into high glucose syrup, very
much in high demand in soft drinks, sweets, bioethanol, confectionery industries. It is estimated
that more than forty (40) million tones of cassava would be needed to service industries that
would produce the listed products to satisfy their needs (RMRDC, 2004). This will provide
employment and economic gains for millions.
In addition, the major product of this technology is the raw material required for the
production of bioethanol. Bioethanol is a good substitute for fossil fuels and burns with little
carbon emission. This could provide the solution to the escalating global warming and ecological
disaster facing many parts of the world today as a result of increasing carbon emission.
Bioethanol could be used to drive autoengines and the manufacturing industries, depending on
the degree of purification.

41
CHAPTER TWO
MATERIALS AND METHODS
2.1 Materials
2.1.1 Sample Collection and Locations
Eight (8) hybrid varieties of cassava (Manihot esculenta) and twenty (20) varieties of
hybrid maize (Zea mays) were obtained from the International Institute of Tropical Agriculture
(IITA). The maize grains were obtained at the IITA (Nigeria) headquarters at Ibadan, while the
eight varieties of cassava tubers were obtained from the IITA extension trial farm in Ambrose
Ali University Campus, Ekpoma, Edo State.
2.1.1.1 Below are the IITA code names for the cassava varieties collected
CASSAVA HYBRIDS COLOUR (TUBER)
1. TMS/94/0561 Yellow
2. TMS/97/2205 White
3. TMS/98 2101 White
4. TMS/4(2) 1425 White
5. TME 419 White
6. TMS/97/0211 Yellow
7. TMS/30572 White
8. TMS/95/.0379 Light Yellow
• TMS – Tropical Manioc selection
• TME – Tropical Manioc esculenta
All eight cassava varieties were harvested at eighteen months of cultivation.

41
2.1.1.2 IITA code names for 20 varieties of maize collected from IITA Ibadan are listed
below:
MAIZE HYBRIDS COLOUR (GRAINS)
1. ACR 20TZL COMP. 4C3 White
2. ACR 95 TZE COMP. 4C3 White/yellow
3. TZL COMP. 1C5 White/Yellow
4. Z/DIPLO SYN 1 White
5. TZL COMP. 3C3 White
6. OBATANPA White (Large Grains)
7. TZL COMP. 1C4 Yellow/White
8. DTSR –W White
9. IWO SYN C3F2 White
10. TZE COMP. 3C3 White
11. TZE COMP. 5-YQPM Yellow
12. IWD – C2 SYN-W White
13. IK 91 TZL COMP. YCI Yellow
14. Y-SYN VAR. I.F2 Yellow
15. TZL COMP. 1 SYN –Y.STR Yellow
16. TZB –SR White
17. TZB – SR SGY Yellow
18. 95 TZEE-W-I White
19. ASABA LOCAL Yellow
20. UMUNZE LOCAL Light Yellow
All maize varieties were harvested in year 2006 by IITA in different farms in the south
and Northern parts of Nigeria.
2.1.2 Reagents
All chemicals used in this study were of analytical grade and products of May and Baker,
England; BDH, England; Sigma, USA and Merck, Darmstadt, Germany.
ϖ Sodium acetate (BDH, England)

41
ϖ Sodium hydrogen phosphate dibasic (anhydrous) Na2HP04 (NW = 142) (Merck,
England).
ϖ Sodium di hydrogen phosphate monobasic NaH2P042H20 (MW =156) (Merck, England).
ϖ Trizma Base (Tris hydroxymethyl) aminomethene MW = 121.14 (Merck, England).
ϖ Iodine crystals (Burgoyne, India).
ϖ Potassium iodide crystals (Burgoyne, India).
ϖ 3,5-Dinitro salicylic acid (DNS) (Sigma, USA).
ϖ Sodium Potassium tartarate (M & B, England).
ϖ Pure soluble corn starch (Riedel-De Haen Ag., Seelze – Hannover, England).
ϖ Glucose (Fluka, England).
ϖ Calcium chloride di hydrate (MW = 147g) (Sigma, England).
ϖ Standard protein – Bovine serum Albumin (BSA) (BDH, England).
ϖ Folin ciocalteau reagent (BDH, England).
ϖ Glacial acetic acid (BDH, England)
ϖ Every other reagent employed in the course of the work was of analar grade.
2.1.3 Apparatus
ϖ ECOSCAN pH meter (Singapore)
ϖ LKB (Biochem) NOVASPEC Spectrophotometer (4049)
ϖ Water bath (Grant instruments, London)
ϖ Balance (Mettler H51)
ϖ Hot plate
ϖ LKB Cold Box, Ultrafraction Collector.
2.2 Methods
2.2.1 Experimental Design
• The ability of the crude amylases from twenty varieties of Zea mays to digest starch from
eight varieties of cassava was investigated.
• Pure corn soluble starch was used as the standard.
• It is intended that the maize variety with highest activity after germination is used to
hydrolyse the cassava starch.

41
• The amount of reducing sugar (mg/g) produced is monitored spectrophotometrically by the
Dinitrosalicylic acid (DNS) method at 540 nm.
• The susceptibility of each cassava starch to maize amylase hydrolysis is described as the
conversion efficiency and calculated relative to the corn derived soluble starch used as the
standard.
• Based on the quantity of reducing sugars produced, the cassava variety(ies) which are more
susceptible to hydrolysis will be determined
• Comparism of means would show if there is significant difference between the yield of the
8 varieties of Cassava Starch.
• Protein determination in maize enzymes pre-imbibition, day 3 and 5 after imbibition (i.e.
germination phases) is done using the Lowry-Folin Ciocalteau method (1951).
2.2.2 Extraction of cassava starch
The cassava tubers were peeled and washed clean, grated air/sun dried. After crumbling
they were sieved to eliminate woody fibres the powdery starch extract which was 100% pure
starch was packed in plastic air tight containers, labeled and kept in a cool, dry place.
2.2.3 Glucose Calibration Curve
A calibration graph was prepared by taking 0, 0.1, 0.2– 1.2ml aliquots of 5 mM glucose
solution in 10ml test tube. Each sample was made up to 2.5ml with distilled water and 0.5ml
DNS reagent added. The 3ml mixture was placed in a boiling water bath for ten minutes, colled
and the absorbance of each test tube was determined against the blank at 540nm (See Appendix
I).
2.2.4 Enzyme Extraction
Before enzyme extraction, 20g of maize (each) was kept at –4OC for about one hour. The
sample (before or after imbibition) was ground and put into 40ml of 0.2M sodium acetate buffer
at pH 5.5. It was stored at –4OC for one hour with intermittent stirring, after which it was filtered
through a Whatman No 1 filter paper in a cold box at 4OC and allowed to stand for two hours for
filtration to complete. The filtrate was used as maize amylase enzyme extract.

41
2.2.5 Method of Enzyme Assay
The coupled assay method in which the product of the enzyme activity (D –glucose)
liberated in starch hydrolysis was estimated by the DNS method (Miller, 1959). One unit of
amylase activity (U) was defined as the amount of enzyme that liberated 1 �mole of D–glucose
from starch in one minute of the reaction under the specified assay condition. Absorbance of the
DNS – glucose complex was read at 540nm with an LKB NOVOSPEC
SPECTROPHOTOMETER.
2.2.6 Effect of Germination on Maize Amylase Activity
Effect of germination on amylase activity was determined in twenty (20) varieties of
maize obtained from IITA, Ibadan, using pure corn soluble starch as substrate.
The varieties of maize were not generally given in large quantities by IITA. It was
however, the variety with the largest amount coded Asaba yellow, that was used to carry out the
initial assays. Initial determination of amylase activity was to demonstrate whether there was
activity in the ungerminated and germinated maize grain. Amylase activity was monitored in the
germinated grain from day one to day six after imbibition.
2.2.7 Effect of pH on Maize Amylase Activity
The activity of the maize enzyme extracted before germination was studied at a narrow
pH range from pH 5.0 – 10.0. The reaction mixture in each tube comprised 0.5ml of 1% pure
soluble corn starch, 1.9ml buffer, 0.1ml enzyme. The control contains 2.5ml buffer and other
reactants except the substrate. Incubation was at room temperature for 30 minutes after which
0.5ml DNS was added. The reaction was terminated by immersing the reaction tubes in boiling
water at 100°C for ten minutes. The tubes were allowed to cool and the absorbance of each test
tube was taken against the blank at 540nm.
2.2.8 Germination of Maize
Sample of maize (20g) was weighed out for each enzyme extraction. Three sets, each of
20g were weighed out for each of the 20 varieties of maize. Each sample was weighed before
imbibition.
The 20g samples for germination were imbibed in distilled water initially for 10hrs,
followed by 2hrs aeration and another 10hrs imbibition (i.e. One day). Each, batch of 20g was
sewn separately on moist filter paper placed on starile jute-bags, labeled and set away to
germinate on laboratory benches at room temperature.

41
2.2.9 Determination of Activity in 20 Varieties of Hybrid Maize
Enzyme activity in 20 varieties of maize (Zea mays) were determined (a) before
imbibition (ungerminated), (b) day 3 after imbibition (germinated) and (c) day 5 after imbibition
(germinated) at pH 5.5, 7.5 and 9.5. The maize samples were processed in three batches. The
first batch comprise 8 varieties while the second and third had 6 varieties each.
2.2.10 Assay of Amylase Activity in Maize
Assay of amylase activity in maize was carried out as described by Ramakirshna et al.
(1982) using a reaction mixture comprising of 0.1ml of crude enzyme solution, 0.5ml of 1% pure
soluble corn starch, 1.9ml sodium acetate buffer pH 5.5 to a total of 2.5ml. Reaction was at room
temperature for 30 minutes and terminated by the addition of 0.5ml DNS reagent. The reaction
tubes containing 3ml of reactant were immersed in boiling water bath (100OC) for ten minutes
and allowed to cool. The absorbance of each tube was taken against the blank as control at OD
540nm. The concentration of reducing sugars liberated from the pure soluble corn starch was
read off the glucose calibration curve (Appendix I). The activity of the various maize extract was
determined using the glucose calibration curve in Appendix I.
2.2.11 Effect of Ca2+ Ions on Amylase Activity
Enzyme activity in the presence of different concentrations of Ca2+ was determined.
Three sets of test tubes were used. Each set contained 0.1ml of enzyme, aliquots of [0], [0.1],
[0.2] – [2.0] ml of 1% pure soluble corn starch and a corresponding volume of buffer to bring the
volume of enzyme, substrate and buffer to 2.5 ml was added to the reaction tubes. Three
categories of 0.1M acetate buffer pH 5.5 were used. In one set of the test tubes 0.1M Ca2+ ion
mixed with the acetate buffer was used. In the second set of test tubes, buffer containing 0.05M
Ca2+ was applied. In the third set Ca2+ free acetate buffer was used.
The enzyme assay was by the DNS method as described in Section 2.2.5.
2.2.12 Determination of protein concentration in all enzyme extracts
Determination of protein concentration in all enzyme extracts was by the Lowry-Folin
Ciocalteau method (1951). Protein standard calibration curve was produced using 0.2g/ml BSA
as the stock solution. Aliquots of 0.1, 0.2 – 1.0 ml of the stock solution of Bovine serum
albumen, BSA – (Solution D) was dispensed into 10 test tubes and the volumes made up to 1ml
using distilled water. A blank of distilled water without protein (Solution D) was also prepared.

41
A known volume, 5ml, of the alkaline solution (E) was added to 1ml of test sample and allowed
to stand at room temperature for ten minutes. A volume of 0.5 ml of diluted Folin Ciocalteau
reagent (i.e. Solution C) was added rapidly with stirring. The test tubes are allowed to stand for
30 minutes after which absorbance was taken at OD 750nm. The blank consisted of all but
solution D. A protein estimation calibration curve was then constructed. Details of the
experiment are shown in Appendix III.
2.2.13 Protein Determination
Protein concentration was determined for all enzyme extract. For each sample, three
dilutions were prepared viz: ×10, ×50 and ×100. From each dilution, 1ml was taken and placed
in a 10ml test tube; 5 ml of the alkaline reagent (Solution E) was added and the mixture allowed
to stand for 10 minutes. Finally, 0.5 ml of freshly mixed Folin-Ciocalteau reagent (Solution C)
was added bringing the total volume of the reactants to 6.5 ml. The mixture was shaken rapidly
and allowed to stand for 30 minutes. A blank containing 1 ml distilled water, 5 ml alkaline
reagent and 0.5 ml Folin-Ciocalteau reagent and no substrate i.e. BSA was also prepared. After
30 minutes, absorbance was taken at 750nm against the blank as control.
The concentration of protein in all enzyme extract was determined by reading of their
optical densities against concentrations in the protein calibration curve. Fig….. shows the protein
concentration of the various extracts
2.2.14 Maize Amylase Specific Activity
Specific activity of maize extract from the 20 varieties of maize was determined as shown
in Fig. 3.7.
2.2.15 Activity of Maize Amylase on Cassava Starch
Enzyme extract from maize variety - VAR.I.F.2 day 3 after imbibition was found to have
the highest activity among the 20 varieties of maize 1% cassava starch stock solution was
prepared for each of the eight varieties of cassava. Enzyme activity with 8 varieties of cassava
starch was assayed by the DNS method, using a reaction mixture of 0.5ml of 1% cassava stock
solution, 0.1ml of enzyme (VAR.I.F2) 1.9ml of acetate buffer; pH 5.5 and 0.5ml DNS. The
substrate, enzyme and buffer are measured out in a test tube, the reaction mixture is left for 30
minutes before DNS reagent is added. 10 minutes after the DNS is introduced the reaction was
terminated by immersing the reaction tubes in boiling water at 100°c for ten minutes. The test
tubes are covered with cotton buds before immersion in boiling water to avoid evaporation. The

41
test tubes are allowed to cool and absorbance taken at OD 540nM. Table below shows details of
the experiment and their absorbance.
2.2.16 Effect of pH on amylase activity using cassava starch as substrate.
Effect of pH on amylase activity extracted from VAR.1F2, Day 3 after imbibition using
1% cassava starch from TME 419 was determined using the DNS method as in 2.2.5.
2.2.15 Effect of Substrate Concentration on Enzyme Activity
The activity of the enzyme using different concentrations of the substrate was determined
in order to ascertain the best concentration at which the enzyme can function optimally. Aliquots
of [0.0], [0.1], [0.2] – [1.0] ml of 1% pure soluble corn starch were measured into eleven 10ml
test tubes. A known quantity, 0.1ml, of enzyme was added to each test tube. The volume in each
test tube was made up to 2.5ml with acetate buffer pH 5.5. The reaction was made to stand for 30
minutes after which 0.5ml DNS reagent was added. Ten minutes after the DNS was introduced,
all the test tubes were immersed in a hot water bath at 100oC for ten minutes. The test tubes and
their contents were cooled and absorbance taken at 540nm.
2.3 Statistical Analysis
Test of statistical significance was carried out using both one-way and two-way analysis
of variance together with postHoc test (Multiple Comparison). Statistical difference was
considered when P�0.05. The statistical package used was Statistical Package for Social
Sciences (SPSS).
41
CHAPTER THREE
RESULTS
3.1 Effect of Germination on Maize Amylase Activity
It was found that the ungerminated and germinated maize had amylase activity. The
activity rose steadily from ungerminated, through day one after imbibition to day three after
imbibition where the peak of activity was observed. Amylase activity in germinating maize
began to decline from day four after imbibition.
The activity of the crude maize extract examined before imbibition at pH 5.5 was 31.5
�mol/min. Activity at pH 7.5 was 11.5 �mol/min and at pH 9.5 was 18.0 �mol/min. The highest
activity was determined 3 days imbibition at pH 5.5 and 9.5. The activity at pH 5.5 was 57.5
�mol/min; pH 9.5 was 30 �mol/min and pH 7.5 was 15.0 �mol/min. Whereas the activity at pH
5.5 and 9.5 rose to a peak on the third day after imbibition and declined from the fourth to the
sixth day, activity at pH 7.5 rose steadily from day one to six. Hence, it was decided to examine
amylase activity (20) vsrirtirs of maize at these three points: ungerminated, day 3 and day 5 of

41
germinated. A graphical representation of amylase activity with days of germination is shown in
Fig. 9.
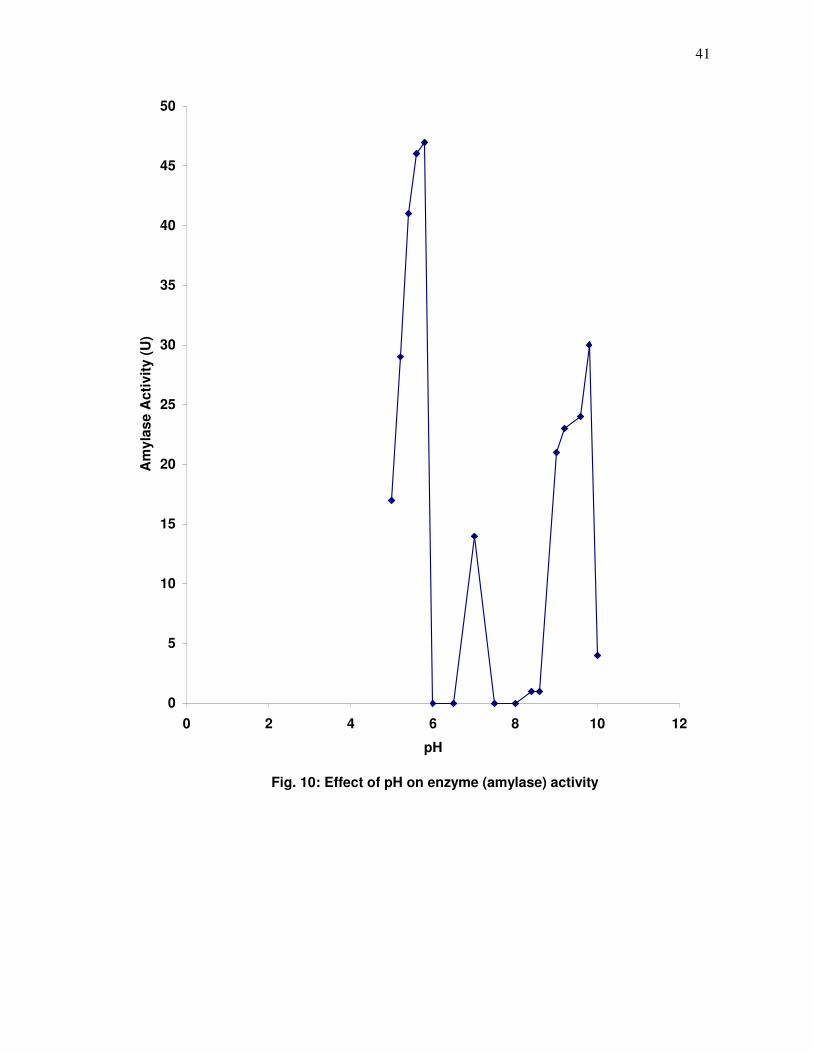
3.2 Effect of pH on Amylase Activity
A pH profile was carried out on enzyme extract from ungerminated and germinated
maize as shown in Section 2.2.8 in order to determine the optimum pH for the maize amylase.
The pH profile from the test samples germinated and ungerminated were similar and produced
three peaks, two major peaks at pH 5.5 and 9.5 with a minor peak at pH 7.5 suggesting different
isoenzyme forms which might be important at the different stages in the hydrolysis of cassava
starch. It was decided to carry out further assays of the 20 varieties of maize extract at these
peaks, pH 5.5, 7.5 and 9.5 using pure soluble corn starch as substrate. The results are shown in
Appendix VIII and a graph showing the pH profile of maize amylase using 1% pure soluble corn
starch as substrate shown in Fig. 10.
Enzyme activity in ungerminated and germinated maize at pH 5.5, 7.5 and 9.5 are
illustrated in Figs. 11, 12 and 13.
Amylase activity on the third day after imbibition was higher than activity in
ungerminated maize at all three pH examined. Just like activity in ungerminated maize, activity
was highest at pH 5.5 and lowest at pH 7.5.
Activity of the enzyme at pH 5.5 is much higher than the activity at pH 7.5 and 9.5. The
activity at pH 9.5 is higher three days after imbibition than before imbibition.
Amylase activity on the fifth day after imbibition was lower than activity on the third day
at pH 5.5 and pH 9.5, but higher at pH 7.5. There was a steady increase in activity at pH 7.5 from
day one to day five after imbibition. This suggests that the production of the isoenzyme
determined at pH 7.5 increased from day 3 to day 5 after imbibition probably in response to a
specific function.
The activity determined at pH 5.5 and 9.5 are lower on Day 5 after imbibition (D5A 1)
than day 3 (D3A 1). The activity at pH 7.5 was higher on the 5DA 1 than the 3 DA 1.

41

41
0
0.2
0.4
0.6
0.8
1
1.2
1.4
1.6
Day 0 Day 1 Day 2 Day 3 Day 4 Day 5 Day 6
Days of Germination
O.D
. at 5
40nm
Absorbance at pH 5.5
Absorbancey at pH 7.5
Absorbance at pH 9.5
Fig. 9: Effect of germination on enzyme activity
Am
ylas
e A
ctiv
ity (U
)
41
Fig. 10: Effect of pH on enzyme (amylase) activity
0
5
10
15
20
25
30
35
40
45
50
0 2 4 6 8 10 12
pH
Am
ylas
e A
ctiv
ity (U
)

4
1
Fig
. 1
1:
Am
yla
se
ac
tivi
ty i
n u
ng
erm
ina
ted
ma
ize
(b
efo
re i
mb
ibit
ion
) a
t p
H 5
.5,
7.5
an
d 9
.5
05
10
15
20
25
30
35
40
ACR 95
4C3
TZL
IC5
Z/DIP
LO S
YN 1TZ
L 3C
3 OBATANPA
TZL
IC4 1K
913Y
C1
ASABA YELL
OWVAR I.
F2IW
DC2TZ
B-SR TZ
EE-W-1
ACR-20
C3 F2
DTSR-W TZ
B-SR-S
GYTZ
E-S-Y
TZE-3
C3
UMUNZE
YELL
OW
TZL-
SYN-Y-S
TR
Ma
ize
Va
rie
tie
s
Amylase Activity (U)
pH
5.5
pH
7.5
pH
9.5

4
1
Fig.
12:
Am
ylas
e ac
tivity
in u
nger
min
ated
mai
ze (b
efor
e im
bibi
tion)
at p
H 5
.5, 7
.5 a
nd 9
.5
0510152025303540
ACR 95 4C
3TZL I
C5
Z/DIP
LO S
YN 1 TZL 3C3
OBATANPATZL I
C4 1K91
3YC1
ASABA YELL
OW VAR I.F2
IWDC2
TZB-SR TZEE-W-1
ACR-20
C3 F2 DTSR-W TZB-S
R-SGY TZE-S
-YTZE-3
C3
UMUNZE YELL
OW
TZL-SYN-Y
-STR
Mai
ze V
arie
ties
Amylase Activity (U)
pH 5
.5pH
7.5
pH 9
.5

4
1
Fig.
13:
Am
ylas
e ac
tivity
in m
aize
, day
5 a
fter
imbi
bitio
n (g
erm
inat
ed) a
t pH
5.5
, 7.5
and
9.5
010203040506070
ACR 95 4C
3TZL I
C5
Z/DIP
LO S
YN 1 TZL 3C3
OBATANPATZL I
C4 1K91
3YC1
ASABA YELL
OW VAR I.F2
IWDC2
TZB-SR TZEE-W-1
ACR-20
C3 F2 DTSR-W TZB-S
R-SGY TZE-S
-YTZE-3
C3
UMUNZE YELL
OW
TZL-SYN-Y
-STR
Mai
ze V
arie
ties
Amylase Activity (U)
pH 5
.5pH
7.5
pH 9
.5

41
3.6 Protein Determination
Protein concentration in all twenty varieties of maize increased from day 1 to Day 5 after
imbibition. This trend is illustrated in Fig. 14.

4
1
Fig
. 14
: P
rote
in c
on
ce
ntr
ati
on
in
all
en
zym
e e
xtr
ac
ts
05
10
15
20
25
30
35
40
ACR 95
4C3
TZL
IC5
Z/DIP
LO S
YN 1TZ
L 3C
3OBATA
NPATZ
L IC
4 1K91
3YC1
ASABA YEL
LOW
VAR I.F2
IWDC2
TZB-S
R TZEE-
W-1
ACR-20
C3 F2
DTSR-W
TZB-S
R-SGY
TZE-S
-YTZ
E-3C3
UMUNZE
YELL
OW
TZL-
SYN-Y-S
TR
Maiz
e V
ari
eti
es
Amylase Activity (U)
Befo
re I
mb
ibit
ion
Day 3
Aft
er
Imb
ibit
ion
Day 5
Aft
er
Imb
ibit
ion

41
3.7 Maize Amylase Specific Activity
Specific activity of amylase from twenty varieties of maize was determined at pH 5.5, 7.5
and 9.5. Activity before imbibition, Day 3 and Day 5 after imbibition are shown in Figs. 15, 16
and 17.

4
1
Fig
. 15:
Am
ylas
e sp
ecifi
c ac
tivity
at
pH 5
.5 in
un
germ
inat
ed a
nd
ger
min
ated
mai
ze
0
0.51
1.52
2.5
ACR 95 4C
3 TZL IC5
Z/DIP
LO S
YN 1TZL
3C3
OBATANPATZL I
C4 1K91
3YC1
ASABA YELL
OWVAR I.F
2IW
DC2TZB-S
R TZEE-W
-1ACR-2
0C3 F
2 DTSR-WTZB-S
R-SGY TZE-S
-Y TZE-3C3
UMUNZE Y
ELLOW
TZL-S
YN-Y-S
TR
Mai
ze V
arie
ties
Amylase Specific Activity (Umg-1
)B
efor
e Im
bib
itio
n (U
nger
min
ated
)D
ay 3
Aft
er Im
bib
itio
n (G
erm
inat
ed)
Day
5 A
fter
Imbi
biti
on
(Ger
min
ated
)

4
1
Fig
. 16:
Am
ylas
e sp
ecif
ic a
ctiv
ity
at p
H 7
.5 in
un
ger
min
ated
an
d g
erm
inat
ed m
aize
0
0.2
0.4
0.6
0.81
1.2
ACR 95 4C
3 TZL IC5
Z/DIP
LO S
YN 1 TZL 3C3
OBATANPATZL I
C4 1K91
3YC1
ASABA YELL
OW VAR I.F2
IWDC2 TZB-S
R TZEE-W-1
ACR-20
C3 F2 DTS
R-WTZ
B-SR-S
GY TZE-S-Y TZ
E-3C3
UMUNZE Y
ELLOW
TZL-SYN-Y
-STR
Mai
ze V
arie
ties
Amylase Specific Activity (Umg-1
)
Bef
ore
Imb
ibit
ion
(U
ng
erm
inat
ed)
Day
3 A
fter
Imb
ibit
ion
(G
erm
inat
ed)
Day
5 A
fter
Imb
ibit
ion
(G
erm
inat
ed)

4
1
Fig.
17:
Am
ylas
e sp
ecifi
c ac
tivity
at p
H 9
.5 in
ung
erm
inat
ed a
nd g
erm
inat
ed m
aize
0
0.2
0.4
0.6
0.81
1.2
1.4
1.6
1.8
ACR 95 4C
3 TZL IC5
Z/DIP
LO S
YN 1 TZL 3C3
OBATANPATZL I
C4 1K91
3YC1
ASABA YELL
OW VAR I.F2
IWDC2 TZB-S
R TZEE-W-1
ACR-20
C3 F2 DTSR-W
TZB-SR-S
GY TZE-S-Y TZE-3C3
UMUNZE YELL
OW
TZL-SYN-Y
-STR
Mai
ze V
arie
ties
Amylase Specific Activity (Umg-1
)B
efor
e Im
bibi
tion
(Ung
erm
inat
ed)
Day
3 A
fter
Imbi
bitio
n (G
erm
inat
ed)
Day
5 A
fter
Imbi
bitio
n (G
erm
inat
ed)

62
3.8 Determination of Maize Activity with the Highest Amylase Activity
The four maize varieties with the highest amylase activities were re-examined.
These choice varieties were coded TZL IC5, Obatanpa, TZL IC4 and VAR.I.F2. A repeat
assay of enzyme extract from the four varieties on the third day after imbibition had
activities as stated in the Fig. 18.
The maize variety coded VAR.I.F2 had increased significant amylase activity
(p<0.05) compared with amylase activities of other three maize varieties. Detailed
computation of a two-way analysis of variance is shown in Appendix XXI.
3.9 Hydrolysis of Cassava Starch by Enzyme Extract from VAR.I.F2
Maize extract from VAR.I.F2 was used to digest the eight varieties of cassava
starch. The rate of hydrolysis was determined by the DNS method as described in Section
2.2.5 The digestibility is shown in Fig. 19.
Starch from the eight (8) varieties of cassava had different glucose production
pattern. The highest level of glucose production was found in cassava variety coded TME
419 (56.5 �mol/min). Others with high glucose production levels in descending order of
hydrolysis are TMS/94/0561, 48.0 �mol/min; TMS/98/2101, 46.5 �mol/min; and
TMS/4/(2)1425, 44.0 �mol/min. These results are illustrated in Fig. 19.
There was significant increase (p<0.05) in the rate of hydrolysis of TME 419
compared with other seven cassava cultivars coded TMS/94/0561, TMS/97/2205,
TMS/98/2101, TMS/4(2)1425, TMS/97/0211, TMS/30572 and TMS/95/0379. Detailed
analysis of variance in Appendix XXI.
3.10 Effect of Ca2+ Ion on Enzyme Activity
It was discovered that 0.05M Ca2+ in 0.1M acetate buffer activated maize amylase
activity two-fold while 0.1M Ca2+ in 0.1M acetate buffer inhibited maize amylase activity
two-fold.
3.11 Effect of Substrate (Starch) Concentration on Maize Enzyme Activity
Results of effects of substrate concentration on maize amylase activity in Section
2.3.6 showed that amylase activity increased with increase in starch concentration from

63
0.1ml to 0.6ml of 1% stock solution of pure soluble corn starch. Beyond 0.6ml, there was
no further increase in amylase activity. The highest activity was observed at 0.5 to 0.6ml
of 1% pure soluble corn starch. Hence, it was decided to use 0.5ml of the substrate
(starch) in all activity experiments.
3.12 Effect of pH on Amylase Activity Using 1% Cassava Starch
The pH profile of the enzyme activity on cassava starch was similar to that of
pure soluble corn starch. Three peaks were produced, two major peaks at pH 5.5 and 9.5
and a small peak at pH as shown in Fig. 20. The pH profile is as pure soluble corn starch.

64
Fig. 18: Activity of four maize varieties at different pH values
0
10
20
30
40
50
60
70
pH 5.5 pH 7.5 pH 9.5
pH
Act
ivity
(U)
TZL IC5OBATANPATZL IC4VAR.I.F2

65
Fig. 19: Activity of maize enzyme from VAR.IF2 on starch extracted from 8 varieties of cassava
0
10
20
30
40
50
60
TMS/94/05
61
TMS/97/22
05
TMS/98/21
01
TMS/4(2)
1425
TME 419
TMS/97/02
11
TMS/3057
2
TMS/95/03
79
Hybrid Cassava Varieties
Act
ivity
or
Rat
e of
Hyd
roly
sis
(U)

66

67
Am
ylas
e A
ctiv
ity (U
)

68
Fig. 20: Enzyme (amylase) activity at different pH using 1% cassava starch from TME 419 enzyme extracted from VAR.I.F2 days after imbibition

69
CHAPTER FOUR
DISCUSSION
Within six months of harvest, dry maize grain may not be fully dehydrated and
amylase activity may yet be detected before imbibition in water. The dormant stage
during storage is characterized by dehydration and a dramatic decrease of metabolic
activity. After prolonged dry storage, the maize grain may not yield amylase activity
before imbibition in water. Germination is induced by rehydration of the grain which
increases both respiratory and metabolic activity thus allowing respiratory mobilization
of primary and secondary metabolites (Limami et al., 2002). It is also accompanied by an
increase of the availability of minerals (iron, zinc, etc) and essential amino acids
principally Lys, Tyr, Met (FAO, 1995). Therefore, the biochemical composition between
ungerminated and germinated kernels is different.
Germination induces the synthesis of hydrolytic enzymes e.g. starch degrading
enzymes and proteases. Amylase activity was detected in the 20 varieties of
ungerminated maize before imbibition probably because they were examined within six
months after harvest and stored in humid environment. Perhaps the same samples after a
long period of proper drying may not produce activity before imbibition. Usually, activity
is restored one or two days after imbibition. In maize and sorghum grains amylolytic
enzymes have be detected in ungerminated grains before imbibition (Dicko et al., 2006).
The reason why Awoyinka et al. (2008) could not detect amylase activity in 100 varieties
of ungerminated maize could be attributable to long storage and total desiccation of the
grains.
The pH profile of the crude enzyme from ungerminated maize was the same as
germinated. Three pH optima were observed, two major peaks at pH 5.5 and pH 9.5 and a
minor peak at pH 7.5. It has been shown by Chotineeranat et al. (1998) and Egwin et al.
(2004) that the pH optimum for plant �-amylase is pH 5.5 to 6.0. Dutta (2006)
determined plant �-amylase broad optimum, pH 8.0 to 10.0. Katsutoshi (1982) and
Ziegler (1999) found the pH optimum for plant limit dextrinase to be at pH 7.5. It is
therefore suggested that the maize crude enzyme contains �-amylase, �-amylase and limit
dextrinase. These isoenzymes are secreted by germinating maize sequentially and the
activity of the enzymes with germination varied. The activity at pH 5.5 which was

70
predominantly �-amylase increased from day one to day three after imbibition and got to
peak on the 3rd day. �-amylase secretion was low from day one to three and increased
from day four to six. This infers a preponderance of �-amylase to �-amylase in the 3 days
of germination. These results agree with the investigations of Wang et al. (2004) and
Awoyinka et al. (2007) who detected only �-amylase activity in maize day 1 to 3 after
imbibition and �-amylase activity from day 4 after imbibition. Dure (1960) also reported
the production of more of �-amylase than �-amylase on the third day of germination of
the maize grain.
Amylases are usually produced by seeds to degrade starch in the endosperm
during germination. Starch is composed of amylose and amylopectin. The basic repeating
unit for both types of starch is D-glucose molecules linked by glucosidic bonds. Amylose
is essentially a linear polymer consisting about 1000 to 2000 � (1–4) linked glucose units.
Amylopectin is a highly branched polymer of glucose units, primarily linked by �(1–4)
bonds with branches resulting from � (1–6) linkages. Amylose constitutes about 20–25%
of native starch while amylopectin accounts for 75–80% (Candy, 1980).
During germination, the principal enzyme involved in starch breakdown is �-
amylase, which hydrolyses �(1–4) glucosidic bonds in amylose and amylopectin
releasing fragments of oligosaccharides, monosaccharides, etc that can be further
hydrolysed by �-amylase to glucose, maltose and �-limit dextrin. A debranching enzyme;
limit dextrinase, completes the hydrolysis by digesting the �(1–6) linkages in �-limit
dextrin that is left after the action the action of � and �-amylase. The amylases are
produced when germinating embryo secrets gibberellic acid which stimulates the
aleurene cells and the scutellum to produce �-amylase, �-amylase and limit dextrinase
(Wang et al., 2004). �-amylase and limit dextrinase are produced during germination but
�-amylase is present in an inactive form before germination and becomes active
germination. �-amylase initiates digestion of starch in the endosperm before the advent of
�-amylase. Limit dextrinase secretion increases as the action of � and �-amylase reduces
to complete the digestion of what is left of the starch-limit dextrin (Candy, 1980). �-
amylase is more stable at higher pH and lower temperatures than �-amylase (Ziegler,
1999).

71
It was observed in this study that the activity of limit dextrinase at pH 7.5
increased from day 1 to day 6. Burton et al. (2003) observed that limit-dextrinase mRNA
was more abundant in already germinated grains of barley, wheat, maize and rice and
suggested that the enzyme participates in starch hydrolysis during endosperm
mobilization especially in already germinated grain. This observation implies the
production of more limit dextrinase when the grain is already germinated.
Earlier works by Lauriere (1992) and Ziegler (1999) have shown that cereal
grains could differ significantly in their modes of amylase development. The
investigation carried out by Kneen (1944) and Bernfeld (1951) on wheat and barley
showed that they produce more of �-amylase than �-amylase in their first three days of
germination and like maize were at the peak on the 3rd day of germination. Burton et al.
(2003) investigated the production of limit-dextrinase in cereal grains and Line et al.
(1982) extracted limit dextrinase and other amylases from germinating rice. It has been
shown by Dicko et al. (2006) that �-amylase and �-amylase are present in all sorghum
varieties, ungerminated and germinated. �-amylase activity increased up to 20 fold in
some varieties (Dicko et al., 2006). �-amylase according to Ziegler (1999) is unlikely de-
novo synthesized during germination. Unlike maize, barley, wheat and rice, limit
dextrinase has not been detected in any variety of sorghum.
Differences were observed in the levels of activity of crude enzyme from the 20
varieties of maize. This was traced to differences in genotype and location of cultivation.
The maize samples were of four major varieties viz: composite (comp), open pollinated,
synthetic (SYN) and hybrid varieties. These differences in maize varieties which result
from difference in heterozygosity of the genes according to Uguru (2005) are responsible
for the characteristic genetic and structural differences. Differences in the genes are
partly responsible for differences in level of protein synthesis and amylase activity in
maize varieties (IITA, 1988–1992). Of the 20 varieties of maize, four were outstanding in
their amylase activity. These four and their activity determined on the 3rd day after
imbibition (3 DAI) were TZL (comp), IC4, 64.0 µmol/min, TZL (comp), IC5, 62.5
µmol/min; Y-SYN–SYN–VAR.I.F2 (SYN), 61.5 µmol/min and Obatanpa (Hybrid), 61.5
µmol/min. Specific activity for the four varieties on 3rd day after imbibition were 30.0
U.mg-1, 26.50 U.mg-1, 26.50 U.mg-1 and 26.0 U.mg-1 respectively. Awoyinka et al.

72
(2007) determined specific activity of two varieties of maize on 3rd day of germination to
be 29.29 U.mg-1 and 31.00 U.mg-1. When assayed together in the same conditions, the
synthetic variety coded Y–SYN–VAR–I.F2 had the highest activity and was applied on
the hydrolysis of the cassava starch.
Differences were observed in the yield and rates of hydrolysis of starch from the
eight cultivars of cassava grown in Nigeria by Edo State for IITA, Ibadan. The eight
samples of cassava were of different genotypes and were expected to show differences in
their rates of hydrolysis. It has be shown by Baafi et al. (2007) that in addition to
genotype age at the time of harvest and location of cultivation also contribute to the
differences in starch yield and rate of hydrolysis. The highest yield was determined in the
cassava variety coded TME 419 with yield of 56.6 µmol/min. Three other cultivars with
high rates of hydrolysis were TMS/94/0561, (48.0 µmol/min); TMS/98/2101, (46.5
µmol/min); and TMS/4(2)1425, (44.0 µmol/min). Crude amylase from maize variety
coded Y–SYN–VAR.I.F2 extracted on the 3rd day of germination was applied on
hydrolysis of the eighty varieties of cassava starch. Any of the four listed above could be
used in industries for production of high glucose syrup, an intermediate raw material for
other end products.
The observed differences in the rate of hydrolysis of the cassava cultivars
examined were due to genotype, age and location of cultivation and these reflect in
differences in solubility, swelling power and water-binding capacity (Reis et al., 2002).
In the investigation of Baafi et al. (2007), cassava yield in the forest ecozone for all
varieties increased from 12 to 13 months and thereafter decline steadily to 15 months. In
the transition ecozone, the starch yield of all varieties generally decreased from 13 to 15
months after planting. For both forest and transition ecozones, the peak starch yield was
generally at 13 months.
The variation in response to the genotype with age at the ecozones suggests
different ages to obtain the optimum starch yield. These have very important breeding
and cassava improvement implications for the emerging starch and biofuel industry in
Nigeria. Solubility is a solute’s ability to dissolve in a solvent. According to Moorthy
(2001), it depends on a number of factors among which are source, inter-associative
forces, swelling power and the presence of other components such as lipids.

73
Significant variations have been observed between solubility values of different
cassava cultivars. Solubility generally increases with age, with the lowest recorded at 12
months and the highest at 15 months after planting. The differences between the varieties
may be attributed to variation in their amylose/amylopectin content and granule size,
these affect the bonding forces between the granules and water molecules. Moorthy
(2001) also observed genotype differences in solubility of cassava varieties studied in
India. The interaction between age and variety was significant (p<0.06). For example, the
highest solubility value was recorded at 15 months and the lowest solubility value at 12
months.
Balagoplan et al. (1998) defined swelling power of starch as the maximum
increase in volume and weight which starch undergoes when allowed to swell freely in
water. This occurs because of the increase in temperature range. Swelling power
generally peaks at the 13th month after planting. Low swelling power is due to
corresponding low solubility (Rikard et al., 1991; Moorthy, 2001).
The rate of hydrolysis of cassava starch is dependent on the starch solubility
which increases with age. Swelling power of the genotypes is affected by age and
location. Water binding capacity decreases with age. These factors, therefore, will be
considered when selecting cassava varieties for specific products, as these may
complicate selection and evaluation of cassava genotype for specific industrial starch
starch-based application. The very high yield and rate of hydrolysis recorded in TME 419
could be due to superior genotype, right age of harvest and location. The eight varieties
of cassava were collected from two locations, ADP, Benin City and Ambrose Ali
University, Ekpoma, Agric Farm. We cannot be too sure of the cultivars collected.
Differences in location and age as well as differences in genotype may have contributed
largely to the differences in rates of hydrolysis and yield of the eight cultivars.
With the discovery of an amylose-free starch mutant in cassava in Wagenningen
University, Netherlands in 1995 and subsequent improvement on this transgenic cassava
by Centro Internationale de Agricultura Tropical (CIAT), Cali, Colombia in 2006, there
is a possibility of the existence of mutant varieties with higher yield and rate of
hydrolysis than TME 419. Starch composed exclusively of amylopectin should have a
higher stability, swelling power and water-binding capacity than those containing

74
amylose/amylopectin and will have a higher rate of hydrolysis than the eight cultivars
examined in this investigation.
4.2 CONCLUSION
Amylase activity was determined in all twenty varieties of maize ungerminated
and germinated with the peak of amylase secretion determined on the 3rd to 4th day after
imbibition. There were, however, differences between the activities of four varieties over
the others. All the varieties had appreciable activity of �-amylase, �-amylase and limit
dextrinase. That shows that maize contains �-amylase, �-amylase and dextrinase required
for complete hydrolysis of starch to high glucose syrup. Amylase secretion during
germination has been reported in wheat, barley, rice and maize. In all four cereal seeds,
�-amylase, �-amylase and limit dextrinase activities have been detected during
germination. Any of these four could be applied on hydrolysis of starch to achieve similar
results. They all have tremendous applications already in the industries. Wheat and barley
are grown in the temperate zones overseas and their cultivation in Nigeria has not been a
success story. Rice cultivation in Nigeria is less than 50% of domestic demand. Maize
thrives in all soils in Nigeria and can be cultivated in relative abundance to accommodate
more maize-dependent industries.
Starch from the eight varieties of cassava examined was digested by maize
amylase but the rate of hydrolysis was different with the cassava cultivars. The highest
rate of hydrolysis was determined in the variety coded TME 419.
The ability of the crude amylase from germinating maize to digest raw cassava
starch presents a remarkable property since cassava plants are abundantly available in
Nigeria. Over 30 million tons of cassava roots are lost yearly since cassava is perishable
after harvesting (Anthony et al., 1996). Conversion of raw cassava starch by maize
amylase means that some of the cassava could be used as raw material by the starch
industry for value added and products. This will reduce wastage, provide employment for
many and improve economic gains.
Importantly, the development of the technology for production of bioethanol from
cassava starches and plant amylases cannot be more timely. Bioethanol is a clean fuel
which combust with cleaner emission unlike fossil fuel which is responsible for global

75
carbon emissions. The bioethanol technology will provide global relief from the threat of
global ecological disaster arising from high carbon emission resulting in high global
warming.
REFERENCES Adwnise, L. W., Saul, N. I., Ashock, P. and Carlos, S. (2002). Acid and enzymatic
hydrolysis to recover reducing sugars from cassava. Bagasse: An Economic Study. Braz. Arch. Bio. Technol., 45(3): 1516 – 1522. doi: 10. 1590/31516.
Amagloh, K. F. (2005). Effect of harvesting time on some agronomic properties and
quality of starch from different cassava (Manihot esculenta) varieties. Kwame Nkrumah, University of Science & Technology, Kumasi, Ghana.
Anthony, O. E., Yusuf, C. and Murray, M. (1996). Culture of Saccharomyces cerevisae
on hydrolysed waste cassava starch for product of baking quality yeast. Enzyme Microbial Technol., 18(7): 519–525.
Archival Report (1988–1992). International Institute of Tropical Agriculture (IITA).
Maize Improvement Programme. Awoyinka, O. A. and Adebawo, O. O. (2008). Influence of malting time on � and �-
amylases secretions in Nigeria amylolytic maize cultures. African Journal of Agriculture Research (AJAR), 3: 007–012.
76
Ayernor, G. S., Hammond, T. K. and Graftham, A. (2006). The combination of rice malt and amyloglucosidase for the production of sugar syrup from cassava fluor. AJST Science Engineering Series, 3(1): 10–17.
Baafi, E. and Safo-Kantanka, O. (2007). Effect of genotype, age and location on cassava
starch yield and quality. Journal of Agronomy, 6: 581–585. Balagoplan, C. G., Padmaja, G., Nanda, S. K. and Moorthy, S. N. (1998). Cassava in
Food, Feed and Industry. CRC Press, Boca Ration, Florida, USA, Pp 113–127. Baskar, G., Muthukumara, C. and Renganathans, S. (2008). Optimizatio n of enzymatic
hydrolysis of Maniho esculenta root starch by immortalized a-amylase using response surface methodology. International Journal of Chemistry and Biomolecular Engineering, 1(3): 156–160.
Burton, R. A., Zhang, X., Hrmova, M. and Fencher, G. B. (2003). A single limit
dextrinase gene is expected both in developing endosperm and germinated grains of barley. Department of Plant Science, University of Adelaide, Waite Campus, Glen Osmond, South Australia, 5064.
Candy, D. L. (1980). Biological Functions of Carbohydrates. Blackie and Son Limited
Bishopbriggs, Glasgow, Pp 117–127 and 186. Chotineeranat, S., Chollakup, R. and Sriroth, K. (1998). Kinetics and products of �-
amylase enzymes in hydrolysis cassava. Cassava and Starch Technology Research Unit, KAPI, Kasetsart University, Thailand. Department of Technology.
CIAT (2006). Discovery of amylase free starch mutant in cassava. Centro Internationale
de Agricultura Tropical. Journal of Agricultural and Food Chemistry, 2006 Annual Report; CIAT, Cali, Columbia 2006.
Cock, J. H. (1988). Cassava, new potential for neglected crop. In: Breth, S. A. (ed) IADS.
Development-oriented Literature Series, Colarado, Westview Press, 25. Dada, A. D., Siyanbola, W. O., Afolabi, O. O. and Oduola, I. A. (2007). Capacity
innovations in cassava production, harvesting and processing in Nigeria. National Centre for Technology Management (NACETEM) Science and Technology Strategies for Improving Cassava Production and Food Security in Nigeria. FMST, Obafemi Awolowo University, Ile-Ife, Nigeria.
Dicko, M. H., Gruppen, H., Traore, A. S., Voragen, A. G. J. and Van Berkel, W. J. H.
(2002). Sorghum grain as human food in Africa: Relevance of content of starch and amylase activities. African Biotechnol., 5: 384–395.
77
Dure, L. S. (1960). Site of origin and extent of activity of amylases in maize germination. Plant Physiol., 35: 925–934.
Dutta, T. K., Jana, M., Pahari, P. R. and Bhattacharya, T. (2006). The effect of
temperature, pH and salt on amylase in Hiliodioptomis viduus (Gureny) (Crustacea; Copepoda; Calanoida), Turk. J. Zool., 30: 197–195.
Egwim, E. C. and Oloyede, O. B. (2004). Comparison of �-amylase activity in some
sprouting Nigerian cereals . Department of Biochemistry, University of Ilorin (Thesis). E-mail: [email protected].
Ette, S. I. (1998). Towards scientific exploitation of local raw materials for employment
generation in Nigeria (RMRDC) in the rate of science and technology. Pp 187–207.
Food and Agriculture Organisation (1998). Cassava development in Nigeria. A country
case study towards a global strategy for cassava development. Development of Agriculture, Rome, Italy, FAO.
Fujimori, H., Ohnishi, M., Sakoda, M., Matsuno, R. and Hiromi, K. (1977). Reaction
mechanism of saccharufying �-amylase from B. subtilis with maltose as a substrate. J. Biochem., 82: 417–427.
Hanes, C. S. (1932). Studies on plant amylases. CLXVII, 1406 – 1421. Heubberger, C. (2005). Cyanide content of cassava and fermented products with focus on
Attieke Garba. Swiss Federal Institute of Technology, Zurich, Switzerland. (A Dissertation for Doctor of Nat. Sciences). Unpublished.
Karkalas, J. (1985). An impaired enzymatic method for the determination of native and
modified starch. J. Sci. Food Agric., 36: 1019. Kneen, E. (1944). A comparative study of the development of amylases in germinating
cereals. Cereal Chem., 21: 304–314. Kruger, J. E. and Limeback, D. R. (1987). Carbohydrate Degrading Enzymes in Cereals.
Cereal Chem. St. Paul, M. N. Pp 117–139. Ku Ismail, K. S., Ahmad, A. A., Inba, T., Kasin, K. F. and Daud, M. Z. M. (2008).
Thermo-enzymatic hydrolysis of cassava starch by �-amylase and glucosidase, Malaysian Technical University Conference on Engineering and Technology.
Kutsutoshi, A., Katsuhisa, S., Kazuaki, L. and Susumu, I. (1992). Optimal temperature,
pH and substrate concentration for pollullanase, Biochemica et Biophysica Acta, Elsemer Scientific Publishers Co., Amsterdam.

78
Kuriki, T. and Imanaka, T. (1999). The concept of �-amylase family; structural similarly and common catalytic mechanism. Journal of Bioscience and Bioengineering, 87(5): 557–565.
Lee, S. P., Morikawa, M., Takagi, M. and Imanaka, T. (1994). Gene cloning and
characterization of �-amylase-pollulanase (Asp 7) from thermophilic and alkaliphilic Bacillus sp. XA 1601. Applied Environ. Microbial., 60: 3764–3773.
Lewis, J. M. and Young, T. W. (1998). Brewing. Chapman and Hall, London, Weinhein,
New York, Tokyo Melbourne, Madras, Pp. 101–115. Lieach, H. W., McCowen, W. L., Schock, T. J. (1959). Swelling and solubility patterns of
various starches. Cereal Chem., 36: 534–544. Liarere, C., Doyen, C., Tevenenot, C. and Daussaut, J. m(1992). A study of the maize �-
amylase. Plant Physiol., 100: 877. Limami, A. M., Rovillan, L., Glevarec, G., Gallais, A. and Hirel, B. (2002). Genetic and
physiological analysis of germination efficiency in maize in relation to nitrogen metabolism. Plant Physiol., 130: 1860–1870.
McCaun, J. C. (2005). Maize and Grace, Africa’s encounter with new world crop.
Cambridge Harvard University Press, XIV. Maria, H. and Finchas, G. B. (2001). Plant enzyme structure. Explaining substrate
specificity and the evolution of function. Plant Physiology, 125: 54–59. Mestres, C. and Rauau, X. (1999). Influence of natural fermentation and drying
conditions on the physicochemical characteristics of cassava starch. Journal of the Science of Food and Agriculture, 74(2): 147–155.
Moorthy, S. N. (2001). Behaviour of cassava starch in various solvents. Starch/Starke,
37: 372–374. Moorthy, S. N. and Kamanujam, T. (1986). Variation in the properties of starch in
cassava varieties in relation to age of the crop. Starch/Starke, 38: 58–61. Moore, G. R. P., Do Canto, L. R., Amante, E. R. and Soldi, V. (2005). Cassava and corn
starch in maltodextrin production. Quimica Nova, 28(4): 100–404. Nweke, F. I., Ugwu, B. O., Dixon, A. G. O., Asadu, C. L. A. and Ajobo, O. (1999).
Cassava production in Nigeria. A function of farmers access to markers and to improved production and processing technology. Collaboration study of cassava in Africa. Working Paper No 22. International Food Policy Research Institute, Washington.

79
O’Hair, S. K. (1995). Cassava, New Crop Fact Sheet. Tropical Research and Education Centre, University of Florida.
Oke, O. L. (2005). Cassava: Yesterday, today and tomorrow. Ife lectures series Number
1, The Postgraduate College, Obafemi Awolowo University, Ile-Ife, Nigeria. Omemu, A. M., Akpan, I., Bankola, M. O. and Tenida, O. D. (2005). Hydrolysis of raw
tuber starches by amylase of Aspergillus niger AM 07 isolated from the soil. African Journal of Biotechnology, 4(1): 19–25.
Onwueme, I. C. and Charles, W. (1994). The tropical root and tuber crops, yams,
cassava, sweet potato and cocoyams, production, perspectives and future prospect. F. O. A. Plant production and production papers, Food and Agricultural Organization of United Nations, Rome, 9–45.
Padmaja, G. (1995). Cyanide detoxification in cassava for food and feed uses. Critical
Reviews in Food Science and Nutrition, 35(4): 299–339. Palmer, T. (1987). Understanding enzymes. 2nd Ed. Eilis Harwood Limited. Raw Materials Research and Development Council. (2004). Cassava Report on Survey of
Agro Raw Materials in Nigeria. Federal Ministry of Science and Technology, Abuja, Nigeria.
Reis, M. M., Ferreira, M. M. C. and Sarmento, S. B. S. (2002). A multi-way analysis of
starch cassava properties. Journal of Chemometrics and Intelligent Laboratory System, 64: 123–135.
Richard, J. E., Asoaka, M., Blanshard, M. V. (1991). Review: The physicochemical
properties of cassava starch. Trop. Sci., 31: 189–207. Subbarao, K. V., Dutta, R. and Sharma, R. (1998). Amylase synthesis in Scutellum and
aleurone layer of maize seeds. Phytochemistry, 49: 657–207. Thoma, J. (1971). Plant and Animal Amylases. In: Boyer, P. Editor, The enzymes (3rd
Ed). Vol. 5 Academic Press, New York, Pp 115–189. Uguru, M. I. (2005). Crop Genetics and Breeding. Department of Crop Science,
University of Nigeria, Nsukka. Visser, R. G. F., Raemakers, C. J. J., Jacobson, E., Bergervoet, V. and Johanna, E. M.
(2006). Methods for producing and transforming cassava protoplasis. United States Patent. 6982327.
Wang, N. S. (2007). Starch hydrolysis by amylase. University of Maryland, Department
of Chemical Engineering. College Part, MD 20742-211/ENCH 485.

80
Wang, S., Yang, F. and Chou, A. (2004). �-amylase is not involved in degradation of
endosperm starch during seed germination of maize. Taiwania, 49: 263–272. Water, D. L. E. and Henry, R. N. (2007). Genetic manipulation of starch properties in
plants. Recent Patents on Biotechnology, 3: 252 – 259. Whistler, R. L., BeMillar, J. N. and Paschall, E. F. (1984). Starch Chemistry and
Technology. 2nd Ed. Academic Press Inc. Orlando, San Diego, New York. Ziegler, P. (1999). Cereal �-amylase. J. Cereals Sci., 29: 195–204.

81
APPENDICES

82
Appendix II: Ca2+ activation and inhibition Without Ca2+ With 0.lM Ca2+ With 0.05M Ca2+ Absorbance at Absorbance at 540nm Absorbance at 540nm 540nm
tube enzyme Substrate Buffer DNS A B A B A B
1% pH
Starch 5.5
1 0.100 0.00 24m1 0.500 Blank Blank blank blank blank blank
2 0.100 0.lml 2.300 0.500 0.34 0.33 0.05 0.15 1.21 1.18
3 0.lml 0.300 2.100 0.500 0.55 0.43 0.05 0.04 1.38 1.32
4 0.100 0.5ml 1.9ml 0.500 0.75 .77 0.12 0.16 1.69 1.62
5 0.100 0.700 1.7ml 0.5ml 0.88 0.95 0.27 0.47 1.80 1.93
6 0.100 1.Oml 1.4ml 0.5ml 1.01 1.12 0.50 0.74 1.97 1.99
7 0.lml 1.300 1.lml 0.500 1.33 1.32 0.67 0.71 1.25 1.99
8 0.100 1.500 0.9ml 0.500 1.32 1.62 0.86 1.00 1.61 1.99
9 O.lml 1.7ml 0.7ml O.5ml 1.51 1.78 1.07 1.13 1.59 1.99
10 0.100 2.0 0.4ml 0.5ml 1.71 1.99 1.36 1.32 1.99 1.99
Appendix III: Standard calibration curve (with BSA for protein estimation) OD 750 nM. Tube No Stock Soln D Distilled Alkaline Fo1in Total A B Final Cons
Water Reagent E Ciocalteau volume
1 0.00 1.00 5ml 0.5ml 6.5ml 0.00 0.00 0.00
2 0.10 0.90 500 0.500 6.5ml 0.40 0.31 200pg/ml 3 0.20 0.80 5ml 0.500 6.5ml 0.64 0.56 400pg/ml
4 0.30 0.70 500 0.5ml 6.5ml 0.87 0.78 60Opg/ml
'5 0.40 0.60 5ml 0.500 6.5ml 0.94 1.03 8000pglml
6 0.50 0.50 500 0.5ml 6.5ml 1.17 112 1000pg/ml
7 0.60 0.40 500 0.500 6.5ml 1.35 1.41 1200pg/ml 8 0.70 0.30 5ml 0.5ml 6.5ml 1.51 1.52 1400pgml 9 0.80 0.20 5ml 0.5ml 6.5ml 1.79 1.67 1600pg/ml

83
Appendix IV: Determination of activity of maize amylase on 8 varieties of cassava starch
Cassava Subtract Buffer Enzyme DNS Control No Control OD 540nm Variety 1% pH 5.5 from Reagent substrate OD
Starch VAR.I.F2 A B TMS/941056I 0.5 ml 1.9 ml 0.1 ml 0.5 m1 2.4m1 Buffer 0.1m1 0.00 1.18 1.20
Enzyme 0.5m1 DNS
TMS/97/2205 0.5 1.9 ml 0.1m1 0.5m1 � 0.00 0.80 0.84
TMS/981210 1 0.5 1.9 ml 0.1m1 0.5m1 � 0.00 1.14 1.16 TMS/4(2) 1425 0.5 1.9 ml 0.1m1 0.5m1 � 0.00 1.09 1.09
TME 419 0.5 1.9 ml 0.1m1 0.5m1 � 0.00 1.39 1.37
TMS/97/0211 0.5 1.9 ml 0.1m1 0.5m1 � 0.00 0.87 0.85
TMS 30572 0.5 1.9 ml 0.1m1 0.5m1 � 0.00 0.78 0.75
TMS/95/0379 0.5 1.9 ml 0.1m1 0.5m1 � 0.00 0.77 0.71
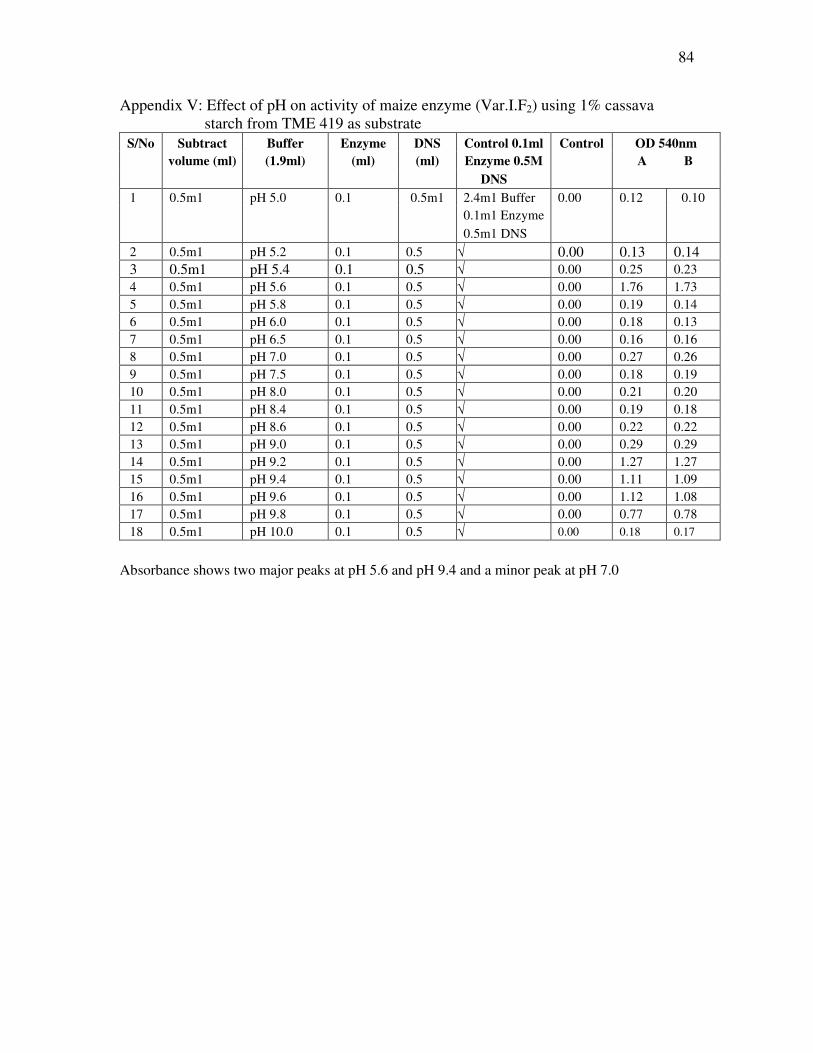
84
Appendix V: Effect of pH on activity of maize enzyme (Var.I.F2) using 1% cassava starch from TME 419 as substrate
S/No Subtract Buffer Enzyme DNS Control 0.1ml Control OD 540nm volume (ml) (1.9ml) (ml) (ml) Enzyme 0.5M A B DNS
1 0.5m1 pH 5.0 0.1 0.5m1 2.4m1 Buffer 0.00 0.12 0.10 0.1m1 Enzyme 0.5m1 DNS 2 0.5m1 pH 5.2 0.1 0.5 � 0.00 0.13 0.14 3 0.5m1 pH 5.4 0.1 0.5 � 0.00 0.25 0.23 4 0.5m1 pH 5.6 0.1 0.5 � 0.00 1.76 1.73 5 0.5m1 pH 5.8 0.1 0.5 � 0.00 0.19 0.14 6 0.5m1 pH 6.0 0.1 0.5 � 0.00 0.18 0.13 7 0.5m1 pH 6.5 0.1 0.5 � 0.00 0.16 0.16 8 0.5m1 pH 7.0 0.1 0.5 � 0.00 0.27 0.26 9 0.5m1 pH 7.5 0.1 0.5 � 0.00 0.18 0.19 10 0.5m1 pH 8.0 0.1 0.5 � 0.00 0.21 0.20 11 0.5m1 pH 8.4 0.1 0.5 � 0.00 0.19 0.18 12 0.5m1 pH 8.6 0.1 0.5 � 0.00 0.22 0.22 13 0.5m1 pH 9.0 0.1 0.5 � 0.00 0.29 0.29 14 0.5m1 pH 9.2 0.1 0.5 � 0.00 1.27 1.27 15 0.5m1 pH 9.4 0.1 0.5 � 0.00 1.11 1.09 16 0.5m1 pH 9.6 0.1 0.5 � 0.00 1.12 1.08 17 0.5m1 pH 9.8 0.1 0.5 � 0.00 0.77 0.78 18 0.5m1 pH 10.0 0.1 0.5 � 0.00 0.18 0.17
Absorbance shows two major peaks at pH 5.6 and pH 9.4 and a minor peak at pH 7.0

85
App
endi
x V
I: E
ffec
t of s
ubst
rate
con
cent
ratio
n on
enz
yme
activ
ity
Subs
trat
e 1%
pur
e so
lubl
e co
rn s
tarc
h en
zym
e fr
om A
saba
Yel
low
A
bsor
banc
e at
540
nm
T
est t
ube
No
Vol
. of
Subs
trat
e (m
l)
Vol
. of
Enz
yme
(ml)
Vol
. of A
ceta
te
Buf
fer
at p
H
5.5
(ml)
Vol
. of D
NS
(ml)
A
B
Ave
rage
OD
Act
ivity
from
G
luco
se
(mm
ol/m
in)
Act
ivity
(U
)
1 0.
00
0.1
2.4
0.5
0.00
0.
00
0.00
0.
000
0.00
2 0.
1 0.
1 2.
3 0.
5 0.
27
0.25
0.
26
0.01
7 17
.00
3 0.
2 0.
1 2.
2 0.
5 0.
41
0.44
0.
43
0.02
8 28
.00
4 0.
3 0.
1 2.
1 0.
5 0.
51
0.50
0.
51
0.03
5 35
.00
5 0.
4 0.
1 2.
0 0.
5 0.
73
0.70
0.
72
0.04
7 47
.00
6 0.
5 0.
1 1.
9 0.
5 0.
91
0.90
0.
91
0.06
1 61
.00
7 0.
6 0.
1 1.
8 0.
5 1.
02
0.94
1.
00
0.06
7 67
.00
8 0.
7 0.
1 1.
7 0.
5 0.
93
0.99
9 0.
8 0.
1 1.
6 0.
5 1.
23
1.08
10
0.9
0.1
1.5
0.5
1.35
1.
16
11
1.0
0.1
1.4
0.5
1.39
1.
29

86
App
endi
x V
IIa:
Det
erm
inat
ion
of e
nzym
e ac
tivity
in 1
st B
atch
of
mai
ze b
efor
e im
bibi
tion
(i.e
. Ung
erm
inat
ed)
at p
H 5
.5, 7
.5 a
nd 9
.5
subs
trat
e 1%
pur
e so
lubl
e co
rn s
tarc
h A
CT
IVIT
Y A
T p
H 5
.5
OD
540
nm
S/N
o Su
bstr
ate
1% S
tarc
h (m
l)
Buf
fer
(pH
5.5
) (m
l)
Enz
yme
Vol
ume
(0.1
ml)
DN
S (m
l) C
ontr
ol T
ube
No
Subs
trat
e C
ontr
ol
OD
A
B
1 0.
5 1.
9 A
CR
95
4C3
0.5
2.4m
l Buf
fer
0.1m
l Enz
yme
0.5m
l DN
S
0.00
0.
61
0.71
2 0.
5 1.
9 T
ZL
IC5
0.5
� 0.
00
0.80
0.
81
3 0.
5 1.
9 Z
/DIP
LO
0.
5 �
0.00
0.
70
0.60
4
0.5
1.9
TZ
L 3
C3
0.5
� 0.
00
0.69
0.
78
5 0.
5 1.
9 O
BA
TA
NPA
0.
5 �
0.00
0.
86
0.89
6
0.5
1.9
TZ
L IC
4 0.
5 �
0.00
0.
84
0.84
7
0.5
1.9
IK 9
13 Y
CL
0.
5 �
0.00
0.
74
0.74
8
0.5
1.9
ASA
BA
YE
LL
OW
0.
5 �
0.00
0.
83
0.73
A
CT
IVIT
Y A
T p
H 7
.5
OD
540
nm
S/N
o Su
bstr
ate
1% S
tarc
h (m
l)
Buf
fer
(pH
5.5
) (m
l)
Enz
yme
Vol
ume
(0.1
ml)
DN
S (m
l) C
ontr
ol T
ube
No
Subs
trat
e C
ontr
ol
OD
A
B
1 0.
5 1.
9 A
CR
95
4C3
0.5
2.4m
l Buf
fer
0.1m
l Enz
yme
0.5m
l DN
S
0.00
0.
61
0.71
2 0.
5 1.
9 T
ZL
IC5
0.5
� 0.
00
0.28
0.
32
3 0.
5 1.
9 Z
/DIP
LO
0.
5 �
0.00
0.
36
0.32
4
0.5
1.9
TZ
L 3
C3
0.5
� 0.
00
0.25
0.
25
5 0.
5 1.
9 O
BA
TA
NPA
0.
5 �
0.00
0.
35
0.36
6
0.5
1.9
TZ
L IC
4 0.
5 �
0.00
0.
36
0.36
7
0.5
1.9
IK 9
13 Y
CL
0.
5 �
0.00
0.
27
0.28
8
0.5
1.9
ASA
BA
YE
LL
OW
0.
5 �
0.00
0.
29
0.27

87
ACTIVITY AT pH 9.5 OD 540nm S/No Substrate
1% Starch (ml)
Buffer (pH 5.5)
(ml)
Enzyme Volume (0.1ml)
DNS (ml)
Control Tube No Substrate
Control OD A B
1 0.5 1.9 ACR 95 4C3 0.5 2.4ml Buffer 0.1ml Enzyme 0.5ml DNS
0.00 0.61 0.71
2 0.5 1.9 TZL IC5 0.5 � 0.00 0.42 0.46 3 0.5 1.9 Z/DIPLO 0.5 � 0.00 0.31 0.33 4 0.5 1.9 TZL 3C3 0.5 � 0.00 0.45 0.48 5 0.5 1.9 OBATANPA 0.5 � 0.00 0.48 0.42 6 0.5 1.9 TZL IC4 0.5 � 0.00 0.42 0.39 7 0.5 1.9 IK 913 YCL 0.5 � 0.00 0.44 0.40 8 0.5 1.9 ASABA YELLOW 0.5 � 0.00 0.46 0.41

88
Appendix VIIb: Determination of enzyme activity in 1st Batch of maize day 3 after imbibition (i.e. Germinated) at pH 5.5, 7.5 and 9.5 substrate 1% pure soluble corn starch ACTIVITY AT pH 5.5
OD 540nm S/No Substrate 1% Starch
(ml)
Buffer (pH 5.5)
(ml)
Enzyme Volume (0.1ml)
DNS (ml)
Control Tube No Substrate
Control OD A B
1 0.5 1.9 ACR 95 4C3 0.5 2.4ml Buffer 0.1ml Enzyme 0.5ml DNS
0.00 1.10 1.34
2 0.5 1.9 TZL IC5 0.5 � 0.00 1.53 1.55 3 0.5 1.9 Z/DIPLO 0.5 � 0.00 1.41 1.44 4 0.5 1.9 TZL 3C3 0.5 � 0.00 1.42 1.38 5 0.5 1.9 OBATANPA 0.5 � 0.00 1.52 1.52 6 0.5 1.9 TZL IC4 0.5 � 0.00 1.58 1.61 7 0.5 1.9 IK 913 YCL 0.5 � 0.00 1.08 1.08 8 0.5 1.9 ASABA YELLOW 0.5 � 0.00 1.44 1.38
ACTIVITY AT pH 7.5 OD 540nm S/No Substrate
1% Starch (ml)
Buffer (pH 5.5)
(ml)
Enzyme Volume (0.1ml)
DNS (ml)
Control Tube No Substrate
Control OD A B
1 0.5 1.9 ACR 95 4C3 0.5 2.4ml Buffer 0.1ml Enzyme 0.5ml DNS
0.00 0.43 0.45
2 0.5 1.9 TZL IC5 0.5 � 0.00 0.58 0.63 3 0.5 1.9 Z/DIPLO 0.5 � 0.00 0.49 0.51 4 0.5 1.9 TZL 3C3 0.5 � 0.00 0.45 0.46 5 0.5 1.9 OBATANPA 0.5 � 0.00 0.54 0.55 6 0.5 1.9 TZL IC4 0.5 � 0.00 0.61 0.52 7 0.5 1.9 IK 913 YCL 0.5 � 0.00 0.55 0.51 8 0.5 1.9 ASABA YELLOW 0.5 � 0.00 0.35 0.42

89
AC
TIV
ITY
AT
pH
9.5
O
D 5
40nm
S/
No
Subs
trat
e 1%
Sta
rch
(ml)
Buf
fer
(pH
5.5
) (m
l)
Enz
yme
Vol
ume
(0.1
ml)
DN
S (m
l) C
ontr
ol T
ube
No
Subs
trat
e C
ontr
ol
OD
A
B
1 0.
5 1.
9 A
CR
95
4C3
0.5
2.4m
l Buf
fer
0.1m
l Enz
yme
0.5m
l DN
S
0.00
0.
81
0.82
2 0.
5 1.
9 T
ZL
IC5
0.5
� 0.
00
0.98
1.
04
3 0.
5 1.
9 Z
/DIP
LO
0.
5 �
0.00
0.
97
0.97
4
0.5
1.9
TZ
L 3
C3
0.5
� 0.
00
0.79
0.
76
5 0.
5 1.
9 O
BA
TA
NPA
0.
5 �
0.00
1.
03
0.99
6
0.5
1.9
TZ
L IC
4 0.
5 �
0.00
0.
95
0.96
7
0.5
1.9
IK 9
13 Y
CL
0.
5 �
0.00
0.
85
0.92
8
0.5
1.9
ASA
BA
YE
LL
OW
0.
5 �
0.00
0.
76
0.72
A
ppen
dix
VII
c: D
eter
min
atio
n of
enz
yme
activ
ity i
n 1st
Bat
ch o
f m
aize
day
5 a
fter
im
bibi
tion
(Ger
min
ated
) at
pH
5.5
, 7.5
and
9.5
su
bstr
ate
1% p
ure
solu
ble
corn
sta
rch
AC
TIV
ITY
AT
pH
5.5
O
D 5
40nm
S/
No
Subs
trat
e 1%
Sta
rch
(ml)
Buf
fer
(pH
5.5
) (m
l)
Enz
yme
Vol
ume
(0.1
ml)
DN
S (m
l) C
ontr
ol T
ube
No
Subs
trat
e C
ontr
ol
OD
A
B
1 0.
5 1.
9 A
CR
95
4C3
0.5
2.4m
l Buf
fer
0.1m
l Enz
yme
0.5m
l DN
S
0.00
1.
10
1.19
2 0.
5 1.
9 T
ZL
IC5
0.5
� 0.
00
1.05
1.
07
3 0.
5 1.
9 Z
/DIP
LO
0.
5 �
0.00
0.
86
0.89
4
0.5
1.9
TZ
L 3
C3
0.5
� 0.
00
1.34
1.
29
5 0.
5 1.
9 O
BA
TA
NPA
0.
5 �
0.00
1.
42
1.40
6
0.5
1.9
TZ
L IC
4 0.
5 �
0.00
0.
95
0.96
7
0.5
1.9
IK 9
13 Y
CL
0.
5 �
0.00
0.
91
0.91
8
0.5
1.9
ASA
BA
YE
LL
OW
0.
5 �
0.00
0.
84
0.82

90
ACTIVITY AT pH 7.5 OD 540nm S/No Substrate
1% Starch (ml)
Buffer (pH 5.5)
(ml)
Enzyme Volume (0.1ml)
DNS (ml)
Control Tube No Substrate
Control OD A B
1 0.5 1.9 ACR 95 4C3 0.5 2.4ml Buffer 0.1ml Enzyme 0.5ml DNS
0.00 0.58 0.59
2 0.5 1.9 TZL IC5 0.5 � 0.00 0.78 0.82 3 0.5 1.9 Z/DIPLO 0.5 � 0.00 0.61 0.62 4 0.5 1.9 TZL 3C3 0.5 � 0.00 0.52 0.48 5 0.5 1.9 OBATANPA 0.5 � 0.00 0.88 0.93 6 0.5 1.9 TZL IC4 0.5 � 0.00 0.84 0.88 7 0.5 1.9 IK 913 YCL 0.5 � 0.00 0.67 0.76 8 0.5 1.9 ASABA YELLOW 0.5 � 0.00 0.58 0.60
ACTIVITY AT pH 9.5 OD 540nm S/No Substrate
1% Starch (ml)
Buffer (pH 5.5)
(ml)
Enzyme Volume (0.1ml)
DNS (ml)
Control Tube No Substrate
Control OD A B
1 0.5 1.9 ACR 95 4C3 0.5 2.4ml Buffer 0.1ml Enzyme 0.5ml DNS
0.00 0.71 0.76
2 0.5 1.9 TZL IC5 0.5 � 0.00 0.68 0.72 3 0.5 1.9 Z/DIPLO 0.5 � 0.00 0.65 0.68 4 0.5 1.9 TZL 3C3 0.5 � 0.00 0.74 0.66 5 0.5 1.9 OBATANPA 0.5 � 0.00 0.95 0.90 6 0.5 1.9 TZL IC4 0.5 � 0.00 0.69 0.69 7 0.5 1.9 IK 913 YCL 0.5 � 0.00 0.60 0.63 8 0.5 1.9 ASABA YELLOW 0.5 � 0.00 0.57 0.59

91
App
endi
x V
IId:
Det
erm
inat
ion
of e
nzym
e ac
tivity
in
2nd B
atch
of
mai
ze b
efor
e im
bibi
tion
(Ung
erm
inat
ed)
at p
H 5
.5,
7.5
and
9.5
subs
trat
e 1%
pur
e so
lubl
e co
rn s
tarc
h A
CT
IVIT
Y A
T p
H 5
.5
OD
540
nm
S/N
o Su
bstr
ate
1% S
tarc
h (m
l)
Buf
fer
(pH
5.5
) (m
l)
Enz
yme
Vol
ume
(0.1
ml)
DN
S (m
l) C
ontr
ol T
ube
No
Subs
trat
e C
ontr
ol
OD
A
B
1 0.
5 1.
9 V
AR
.I.F 2
0.
5 2.
4ml B
uffe
r 0.
1ml E
nzym
e 0.
5ml D
NS
0.00
0.
89
0.89
2 0.
5 1.
9 IW
OC
2 0.
5 �
0.00
0.
74
0.72
3
0.5
1.9
TZ
B-S
R
0.5
� 0.
00
0.70
0.
69
4 0.
5 1.
9 T
ZE
E.W
.I 0.
5 �
0.00
0.
70
0.75
5
0.5
1.9
AC
R-2
0 0.
5 �
0.00
0.
81
0.79
6
0.5
1.9
C3F
2 0.
5 �
0.00
0.
69
0.67
A
CT
IVIT
Y A
T p
H 7
.5
OD
540
nm
S/N
o Su
bstr
ate
1% S
tarc
h (m
l)
Buf
fer
(pH
5.5
) (m
l)
Enz
yme
Vol
ume
(0.1
ml)
DN
S (m
l) C
ontr
ol T
ube
No
Subs
trat
e C
ontr
ol
OD
A
B
1 0.
5 1.
9 V
AR
.I.F 2
0.
5 2.
4ml B
uffe
r 0.
1ml E
nzym
e 0.
5ml D
NS
0.00
0.
38
0.41
2 0.
5 1.
9 IW
OC
2 0.
5 �
0.00
0.
29
0.34
3
0.5
1.9
TZ
B-S
R
0.5
� 0.
00
0.34
0.
34
4 0.
5 1.
9 T
ZE
E.W
.I 0.
5 �
0.00
0.
28
0.34
5
0.5
1.9
AC
R-2
0 0.
5 �
0.00
0.
36
0.34
6
0.5
1.9
C3F
2 0.
5 �
0.00
0.
38
0.36

92
ACTIVITY AT pH 9.5 OD 540nm S/No Substrate
1% Starch (ml)
Buffer (pH 5.5)
(ml)
Enzyme Volume (0.1ml)
DNS (ml)
Control Tube No Substrate
Control OD A B
1 0.5 1.9 VAR.I.F2 0.5 2.4ml Buffer 0.1ml Enzyme 0.5ml DNS
0.00 0.66 0.61
2 0.5 1.9 IWOC2 0.5 � 0.00 0.58 0.58 3 0.5 1.9 TZB-SR 0.5 � 0.00 0.68 0.68 4 0.5 1.9 TZEE.W.I 0.5 � 0.00 0.51 0.55 5 0.5 1.9 ACR-20 0.5 � 0.00 0.56 0.58 6 0.5 1.9 C3F2 0.5 � 0.00 0.54 0.53
Appendix VIIe: Determination of enzyme activity in 2nd Batch of maize day 3 after imbibition (Germinated) at pH 5.5, 7.5 and 9.5 substrate 1% pure soluble corn starch ACTIVITY AT pH 5.5
OD 540nm S/No Substrate 1% Starch
(ml)
Buffer (pH 5.5)
(ml)
Enzyme Volume (0.1ml)
DNS (ml)
Control Tube No Substrate
Control OD A B
1 0.5 1.9 VAR.I.F2 0.5 2.4ml Buffer 0.1ml Enzyme 0.5ml DNS
0.00 1.50 1.52
2 0.5 1.9 IWOC2 0.5 � 0.00 1.36 1.43 3 0.5 1.9 TZB-SR 0.5 � 0.00 1.22 1.16 4 0.5 1.9 TZEE.W.I 0.5 � 0.00 1.21 1.20 5 0.5 1.9 ACR-20 0.5 � 0.00 1.23 1.25 6 0.5 1.9 C3F2 0.5 � 0.00 1.26 1.32

93
ACTIVITY AT pH 7.5 OD 540nm S/No Substrate
1% Starch (ml)
Buffer (pH 5.5)
(ml)
Enzyme Volume (0.1ml)
DNS (ml)
Control Tube No Substrate
Control OD A B
1 0.5 1.9 VAR.I.F2 0.5 2.4ml Buffer 0.1ml Enzyme 0.5ml DNS
0.00 0.60 0.56
2 0.5 1.9 IWOC2 0.5 � 0.00 0.46 0.47 3 0.5 1.9 TZB-SR 0.5 � 0.00 0.44 0.44 4 0.5 1.9 TZEE.W.I 0.5 � 0.00 0.46 0.44 5 0.5 1.9 ACR-20 0.5 � 0.00 0.48 0.48 6 0.5 1.9 C3F2 0.5 � 0.00 0.48 0.44
ACTIVITY AT pH 9.5
OD 540nm S/No Substrate 1% Starch
(ml)
Buffer (pH 5.5)
(ml)
Enzyme Volume (0.1ml)
DNS (ml)
Control Tube No Substrate
Control OD A B
1 0.5 1.9 VAR.I.F2 0.5 2.4ml Buffer 0.1ml Enzyme 0.5ml DNS
0.00 0.99 0.97
2 0.5 1.9 IWOC2 0.5 � 0.00 0.78 0.75 3 0.5 1.9 TZB-SR 0.5 � 0.00 0.84 0.86 4 0.5 1.9 TZEE.W.I 0.5 � 0.00 0.88 0.82 5 0.5 1.9 ACR-20 0.5 � 0.00 0.82 0.78 6 0.5 1.9 C3F2 0.5 � 0.00 0.79 0.80

94
Appendix VIIf: Determination of enzyme activity in 2nd Batch of maize day 5 after imbibition (Germinated) at pH 5.5, 7.5 and 9.5 substrate 1% pure soluble corn starch ACTIVITY AT pH 5.5
OD 540nm S/No Substrate 1% Starch
(ml)
Buffer (pH 5.5)
(ml)
Enzyme Volume (0.1ml)
DNS (ml)
Control Tube No Substrate
Control OD A B
1 0.5 1.9 VAR.I.F2 0.5 2.4ml Buffer 0.1ml Enzyme 0.5ml DNS
0.00 1.43 1.49
2 0.5 1.9 IWOC2 0.5 � 0.00 1.28 1.28 3 0.5 1.9 TZB-SR 0.5 � 0.00 0.78 0.79 4 0.5 1.9 TZEE.W.I 0.5 � 0.00 1.15 1.16 5 0.5 1.9 ACR-20 0.5 � 0.00 1.08 1.02 6 0.5 1.9 C3F2 0.5 � 0.00 1.09 1.14
ACTIVITY AT pH 7.5 OD 540nm S/No Substrate
1% Starch (ml)
Buffer (pH 5.5)
(ml)
Enzyme Volume (0.1ml)
DNS (ml)
Control Tube No Substrate
Control OD A B
1 0.5 1.9 VAR.I.F2 0.5 2.4ml Buffer 0.1ml Enzyme 0.5ml DNS
0.00 0.87 0.80
2 0.5 1.9 IWOC2 0.5 � 0.00 0.57 0.58 3 0.5 1.9 TZB-SR 0.5 � 0.00 0.68 0.58 4 0.5 1.9 TZEE.W.I 0.5 � 0.00 0.57 0.63 5 0.5 1.9 ACR-20 0.5 � 0.00 0.67 0.66 6 0.5 1.9 C3F2 0.5 � 0.00 0.56 0.59

95
ACTIVITY AT pH 9.5 OD 540nm S/No Substrate
1% Starch (ml)
Buffer (pH 5.5)
(ml)
Enzyme Volume (0.1ml)
DNS (ml)
Control Tube No Substrate
Control OD A B
1 0.5 1.9 VAR.I.F2 0.5 2.4ml Buffer 0.1ml Enzyme 0.5ml DNS
0.00 0.82 0.82
2 0.5 1.9 IWOC2 0.5 � 0.00 0.52 0.48 3 0.5 1.9 TZB-SR 0.5 � 0.00 0.71 0.89 4 0.5 1.9 TZEE.W.I 0.5 � 0.00 0.68 0.68 5 0.5 1.9 ACR-20 0.5 � 0.00 0.64 0.64 6 0.5 1.9 C3F2 0.5 � 0.00 0.68 0.62
Appendix VIIg: Determination of enzyme activity in 3rd Batch of maize before imbibition (i.e. Ungerminated) at pH 5.5, 7.5 and 9.5 substrate 1% pure soluble corn starch ACTIVITY AT pH 5.5
OD 540nm S/No Substrate 1% Starch
(ml)
Buffer (pH 5.5)
(ml)
Enzyme Volume (0.1ml)
DNS (ml)
Control Tube No Substrate
Control OD A B
1 0.5 1.9 DT SR-W 0.5 2.4ml Buffer 0.1ml Enzyme 0.5ml DNS
0.00 0.82 0.82
2 0.5 1.9 TZB-SR SGY 0.5 � 0.00 0.72 0.71 3 0.5 1.9 TZB-S-Y 0.5 � 0.00 0.69 0.66 4 0.5 1.9 TZE 3C3 0.5 � 0.00 0.59 0.59 5 0.5 1.9 UMUNZE YELLOW 0.5 � 0.00 0.62 0.63 6 0.5 1.9 TZL SYN-Y-STR 0.5 � 0.00 0.56 0.58

96
AC
TIV
ITY
AT
pH
7.5
O
D 5
40nm
S/
No
Subs
trat
e 1%
Sta
rch
(ml)
Buf
fer
(pH
5.5
) (m
l)
Enz
yme
Vol
ume
(0.1
ml)
DN
S (m
l) C
ontr
ol T
ube
No
Subs
trat
e C
ontr
ol
OD
A
B
1 0.
5 1.
9 D
T S
R-W
0.
5 2.
4ml B
uffe
r 0.
1ml E
nzym
e 0.
5ml D
NS
0.00
0.
37
0.38
2 0.
5 1.
9 T
ZB
-SR
SG
Y
0.5
� 0.
00
0.35
0.
35
3 0.
5 1.
9 T
ZB
-S-Y
0.
5 �
0.00
0.
36
0.38
4
0.5
1.9
TZ
E 3
C3
0.5
� 0.
00
0.41
0.
39
5 0.
5 1.
9 U
MU
NZ
E Y
EL
LO
W
0.5
� 0.
00
0.36
0.
35
6 0.
5 1.
9 T
ZL
SY
N-Y
-ST
R
0.5
� 0.
00
0.30
0.
29
AC
TIV
ITY
AT
pH
5.5
O
D 5
40nm
S/
No
Subs
trat
e 1%
Sta
rch
(ml)
Buf
fer
(pH
5.5
) (m
l)
Enz
yme
Vol
ume
(0.1
ml)
DN
S (m
l) C
ontr
ol T
ube
No
Subs
trat
e C
ontr
ol
OD
A
B
1 0.
5 1.
9 D
T S
R-W
0.
5 2.
4ml B
uffe
r 0.
1ml E
nzym
e 0.
5ml D
NS
0.00
0.
52
0.50
2 0.
5 1.
9 T
ZB
-SR
SG
Y
0.5
� 0.
00
0.44
0.
43
3 0.
5 1.
9 T
ZB
-S-Y
0.
5 �
0.00
0.
45
0.49
4
0.5
1.9
TZ
E 3
C3
0.5
� 0.
00
0.48
0.
48
5 0.
5 1.
9 U
MU
NZ
E Y
EL
LO
W
0.5
� 0.
00
0.45
0.
43
6 0.
5 1.
9 T
ZL
SY
N-Y
-ST
R
0.5
� 0.
00
0.44
0.
48

97
Appendix VIIh: Determination of enzyme activity in 3rd Batch of maize day 3 after imbibition (Germinated) at pH 5.5, 7.5 and 9.5 substrate 1% pure soluble corn starch ACTIVITY AT pH 5.5
OD 540nm S/No Substrate 1% Starch
(ml)
Buffer (pH 5.5)
(ml)
Enzyme Volume (0.1ml)
DNS (ml)
Control Tube No Substrate
Control OD A B
1 0.5 1.9 DT SR-W 0.5 2.4ml Buffer 0.1ml Enzyme 0.5ml DNS
0.00 1.32 1.32
2 0.5 1.9 TZB-SR SGY 0.5 � 0.00 1.27 1.23 3 0.5 1.9 TZB-S-Y 0.5 � 0.00 1.08 1.07 4 0.5 1.9 TZE 3C3 0.5 � 0.00 1.11 1.13 5 0.5 1.9 UMUNZE YELLOW 0.5 � 0.00 1.16 1.12 6 0.5 1.9 TZL SYN-Y-STR 0.5 � 0.00 0.97 0.97
ACTIVITY AT pH 7.5 OD 540nm S/No Substrate
1% Starch (ml)
Buffer (pH 5.5)
(ml)
Enzyme Volume (0.1ml)
DNS (ml)
Control Tube No Substrate
Control OD A B
1 0.5 1.9 DT SR-W 0.5 2.4ml Buffer 0.1ml Enzyme 0.5ml DNS
0.00 0.46 0.46
2 0.5 1.9 TZB-SR SGY 0.5 � 0.00 0.43 0.43 3 0.5 1.9 TZB-S-Y 0.5 � 0.00 0.44 0.43 4 0.5 1.9 TZE 3C3 0.5 � 0.00 0.47 0.45 5 0.5 1.9 UMUNZE YELLOW 0.5 � 0.00 0.41 0.39 6 0.5 1.9 TZL SYN-Y-STR 0.5 � 0.00 0.41 0.43

98
ACTIVITY AT pH 5.5 OD 540nm S/No Substrate
1% Starch (ml)
Buffer (pH 5.5)
(ml)
Enzyme Volume (0.1ml)
DNS (ml)
Control Tube No Substrate
Control OD A B
1 0.5 1.9 DT SR-W 0.5 2.4ml Buffer 0.1ml Enzyme 0.5ml DNS
0.00 0.56 0.52
2 0.5 1.9 TZB-SR SGY 0.5 � 0.00 0.82 0.82 3 0.5 1.9 TZB-S-Y 0.5 � 0.00 0.88 0.88 4 0.5 1.9 TZE 3C3 0.5 � 0.00 0.97 0.96 5 0.5 1.9 UMUNZE YELLOW 0.5 � 0.00 0.91 0.95 6 0.5 1.9 TZL SYN-Y-STR 0.5 � 0.00 0.81 0.79
Appendix VIIi: Determination of enzyme activity in 3rd Batch of maize day 5 after imbibition (Germinated) at pH 5.5, 7.5 and 9.5 substrate 1% pure soluble corn starch ACTIVITY AT pH 5.5
OD 540nm S/No Substrate 1% Starch
(ml)
Buffer (pH 5.5)
(ml)
Enzyme Volume (0.1ml)
DNS (ml)
Control Tube No Substrate
Control OD A B
1 0.5 1.9 DT SR-W 0.5 2.4ml Buffer 0.1ml Enzyme 0.5ml DNS
0.00 0.76 0.76
2 0.5 1.9 TZB-SR SGY 0.5 � 0.00 0.85 0.84 3 0.5 1.9 TZB-S-Y 0.5 � 0.00 0.82 0.82 4 0.5 1.9 TZE 3C3 0.5 � 0.00 0.89 0.87 5 0.5 1.9 UMUNZE YELLOW 0.5 � 0.00 0.76 0.77 6 0.5 1.9 TZL SYN-Y-STR 0.5 � 0.00 0.98 0.99

99
ACTIVITY AT pH 7.5 OD 540nm S/No Substrate
1% Starch (ml)
Buffer (pH 5.5)
(ml)
Enzyme Volume (0.1ml)
DNS (ml)
Control Tube No Substrate
Control OD A B
1 0.5 1.9 DT SR-W 0.5 2.4ml Buffer 0.1ml Enzyme 0.5ml DNS
0.00 0.65 0.68
2 0.5 1.9 TZB-SR SGY 0.5 � 0.00 0.54 0.53 3 0.5 1.9 TZB-S-Y 0.5 � 0.00 0.64 0.66 4 0.5 1.9 TZE 3C3 0.5 � 0.00 0.62 0.59 5 0.5 1.9 UMUNZE YELLOW 0.5 � 0.00 0.52 0.53 6 0.5 1.9 TZL SYN-Y-STR 0.5 � 0.00 0.58 0.59
ACTIVITY AT pH 5.5
OD 540nm S/No Substrate 1% Starch
(ml)
Buffer (pH 5.5)
(ml)
Enzyme Volume (0.1ml)
DNS (ml)
Control Tube No Substrate
Control OD A B
1 0.5 1.9 DT SR-W 0.5 2.4ml Buffer 0.1ml Enzyme 0.5ml DNS
0.00 0.69 0.65
2 0.5 1.9 TZB-SR SGY 0.5 � 0.00 0.58 0.56 3 0.5 1.9 TZB-S-Y 0.5 � 0.00 0.61 0.64 4 0.5 1.9 TZE 3C3 0.5 � 0.00 0.64 0.66 5 0.5 1.9 UMUNZE YELLOW 0.5 � 0.00 0.58 0.58 6 0.5 1.9 TZL SYN-Y-STR 0.5 � 0.00 0.59 0.61

100
Appendix VIII: Effect of pH on enzyme activity using 1% pure soluble corn starch on substrate absorbance showing three peaks of enzyme activity
540 nm S/No Substrate Volume
(ml)
Buffer 1.9ml
Enzyme (ml)
DNS (ml)
Control A B
Activity (�g/min)
1 0.5 pH 5.0 0.1 0.5 0.00 0.26 0.26 17.00 2 0.5 pH 5.2 0.1 0.5 0.00 0.43 0.40 29.00 3 0.5 pH 5.4 0.1 0.5 0.00 0.60 0.59 41.00 4 0.5 pH 5.6 0.1 0.5 0.00 0.74 0.61 46.00 5 0.5 pH 5.8 0.1 0.5 0.00 0.61 0.76 47.00 6 0.5 pH 6.0 0.1 0.5 0.00 0.00 0.00 0.00 7 0.5 pH 6.5 0.1 0.5 0.00 0.00 0.00 0.00 8 0.5 pH 7.0 0.1 0.5 0.00 0.18 0.24 14.00 9 0.5 pH 7.5 0.1 0.5 0.00 0.05 0.06 0.04 10 0.5 pH 8.0 0.1 0.5 0.00 0.00 0.00 0.00 11 0.5 pH 8.4 0.1 0.5 0.00 0.00 0.01 1.00 12 0.5 pH 8.6 0.1 0.5 0.00 0.02 0.00 1.00 13 0.5 pH 9.0 0.1 0.5 0.00 0.28 0.38 21.00 14 0.5 pH 9.2 0.1 0.5 0.00 0.34 0.34 23.00 15 0.5 pH 9.4 0.1 0.5 0.00 0.33 0.25 20.00 16 0.5 pH 9.6 0.1 0.5 0.00 0.33 0.37 24.00 17 0.5 pH 9.8 0.1 0.5 0.00 0.46 0.41 30.00 18 0.5 pH 10.0 0.1 0.5 0.00 0.06 0.05 4.00

10
1

102
Appendix X: Estimation of protein concentration in 20 varieties of maize (Lowry/Folin Ciocalteau Test) S/No Maize Variety Before
Imbibition (mg/ml)
Day 3 After Imbibition
(mg/ml)
Day 5 After Imbibition
(mg/ml) 1 ACR 95 4C3 0.56 0.75 0.93 2 TZL IC5 0.60 0.77 0.94 3 Z/DIPLO SYN 1 0.56 0.78 0.97 4 TZL 3C3 0.55 0.80 0.98 5 OBATANPA 0.61 0.74 0.97 6 TZL IC4 0.68 0.85 0.94 7 IK913YC1 0.58 0.73 0.98 8 ASABA YELLOW 0.62 0.74 0.95 9 VAR1.F2 0.61 0.76 0.94 10 IWOC2 0.61 0.74 0.90 11 TZB – 3R 0.60 0.78 0.89 12 TZEE – W – 1 0.57 0.79 0.91 13 ACR – 20 0.61 0.65 0.85 14 C3F2 0.62 0.67 0.89 15 DT SR – W 0.63 0.72 0.88 16 TZB – SR – SGY 0.62 0.76 0.94 17 TZE – S – Y 0.56 0.70 0.96 18 TZE – 3C3 0.57 0.73 0.92 19 UMUNZE YELLOW 0.55 0.75 0.92 20 TZL – SYN – STR 0.61 0.70 0.94

103
Appendix XI: Result of enzyme activity on starch from eight varieties of cassava digested by amylase from VAR.IF2 extracted day 3 after imbibition
Cassava Varieties OD at 540 nm Activity in �mol/min (U) TMS/94/0561 1.19 48.00 TMS/97/2205 0.82 33.30 TMS/98/2101 1.15 46.70 TMS/4(2)/1425 1.09 44.00 TME 419 1.38 56.00 TMS/97/0211 0.86 35.00 TMS/20572 0.77 31.70 TMS/95/0379 0.74 30.00

104
Appendix XII: Amylase activity in ungerminated maize before imbibition at pH 5.5, 7.5 and 9.5
Activity in �molmin1 (U) S/No Maize Variety pH 5.5 pH 7.5 pH 9.5 1 ACR 95 4C3 26.65 12.50 17.50 2 TZL IC5 33.35 11.50 18.00 3 Z/DIPLO SYN 1 25.85 13.50 17.00 4 TZL 3C3 30.00 10.00 19.00 5 OBATANPA 37.50 14.00 18.50 6 TZL IC4 34.15 14.00 16.50 7 IK913YC1 30.85 11.00 17.00 8 ASABA YELLOW 31.50 11.50 18.00 9 VAR1.F2 36.50 16.00 19.00 10 IWOC2 29.50 13.00 16.50 11 TZB – 3R 28.50 14.00 18.50 12 TZEE – W – 1 31.00 13.00 17.00 13 ACR – 20 33.50 14.00 17.50 14 C3F2 27.50 14.00 16.50 15 DT SR – W 32.50 15.00 18.00 16 TZB – SR – SGY 29.00 14.00 18.00 17 TZE – S – Y 27.50 14.50 17.00 18 TZE – 3C3 27.00 16.00 17.50 19 UMUNZE YELLOW 26.00 14.00 18.00 20 TZL – SYN – STR 26.50 12.00 16.50

105
Appendix XIII: Amylase activity day 3 after imbibition at pH 5.5, 7.5 and 9.5
Activity in �molmin1 (U) S/No Maize Variety pH 5.5 pH 7.5 pH 9.5 1 ACR 95 4C3 50.00 18.50 34.00 2 TZL IC5 62.50 24.00 41.00 3 Z/DIPLO SYN 1 59.50 20.00 39.00 4 TZL 3C3 57.50 19.00 31.50 5 OBATANPA 61.50 22.50 41.50 6 TZL IC4 64.00 23.50 39.00 7 IK913YC1 44.00 21.50 36.00 8 ASABA YELLOW 57.50 15.00 30.00 9 VAR1.F2 61.50 23.50 40.00 10 IWOC2 56.50 18.50 31.50 11 TZB – 3R 48.50 18.00 34.00 12 TZEE – W – 1 49.00 17.00 33.50 13 ACR – 20 51.00 19.50 32.50 14 C3F2 52.50 18.50 32.00 15 DT SR – W 54.00 18.50 38.50 16 TZB – SR – SGY 51.00 17.50 33.50 17 TZE – S – Y 44.00 18.50 36.00 18 TZE – 3C3 45.50 19.50 39.00 19 UMUNZE YELLOW 46.00 16.00 37.00 20 TZL – SYN – STR 43.50 17.00 32.50

106
Appendix XIV: Amylase activity day 5 after imbibition at pH 5.5, 7.5 and 9.5
Activity in �molmin1 (U) S/No Maize Variety pH 5.5 pH 7.5 pH 9.5 1 ACR 95 4C3 46.50 23.50 30.00 2 TZL IC5 43.50 32.50 36.50 3 Z/DIPLO SYN 1 36.00 25.00 27.50 4 TZL 3C3 53.50 20.00 28.50 5 OBATANPA 57.50 36.50 37.50 6 TZL IC4 40.00 35.00 36.50 7 IK913YC1 36.50 29.00 31.50 8 ASABA YELLOW 33.50 24.00 28.50 9 VAR1.F2 57.50 30.00 33.50 10 IWOC2 51.50 27.50 29.00 11 TZB – 3R 44.00 26.00 28.50 12 TZEE – W – 1 47.00 24.00 27.50 13 ACR – 20 45.00 26.50 29.00 14 C3F2 45.50 23.50 26.50 15 DT SR – W 51.50 27.00 32.00 16 TZB – SR – SGY 46.50 26.00 29.00 17 TZE – S – Y 43.50 22.00 27.00 18 TZE – 3C3 44.00 24.50 27.50 19 UMUNZE YELLOW 43.50 21.50 26.50 20 TZL – SYN – STR 41.50 24.00 26.00

107
Appendix XV: A protein concentration in all enzyme extract Umg-1 S/No Maize Variety Before
Imbibition (Umg-1)
Day 3 After Imbibition
(Umg-1)
Day 5 After Imbibition
(Umg-1) 1 ACR 95 4C3 19.50 26.30 32.50 2 TZL IC5 21.00 26.50 33.00 3 Z/DIPLO SYN 1 19.50 27.00 33.70 4 TZL 3C3 20.00 28.00 34.00 5 OBATANPA 21.50 26.00 33.75 6 TZL IC4 23.80 30.00 33.00 7 IK913YC1 20.50 25.50 34.00 8 ASABA YELLOW 22.00 26.00 33.30 9 VAR1.F2 21.50 26.50 31.50 10 IWOC2 21.50 26.00 31.00 11 TZB – 3R 21.00 27.20 32.00 12 TZEE – W – 1 19.80 27.40 29.80 13 ACR – 20 21.50 23.00 29.80 14 C3F2 21.80 23.50 30.00 15 DT SR – W 22.00 25.00 31.00 16 TZB – SR – SGY 21.80 26.00 33.00 17 TZE – S – Y 19.50 24.50 33.50 18 TZE – 3C3 19.80 25.50 32.00 19 UMUNZE YELLOW 19.20 26.30 32.00 20 TZL – SYN – STR 21.50 24.50 33.00

108
Appendix XVI: Estimation of protein concentration in 20 varieties of maize (Lowry/Folin Ciocalteau Test) OD 750 nM Maize Varieties Enzyme Extract
Before Imbibition Enzyme Extract Day 3 After Imbibition
Enzyme Extract Day 5 After Imbibition
ACR 95 4C3 0.56 0.75 0.93 TZL IC5 0.60 0.77 0.94 Z/DIPLO SYN 1 0.56 0.78 0.97 TZL 3C3 0.55 0.80 0.98 OBATANPA 0.61 0.74 0.97 TZL IC4 0.68 0.85 0.94 IK913YC1 0.58 0.73 0.98 ASABA YELLOW 0.62 0.74 0.95 VAR1.F2 0.61 0.76 0.94 IWOC2 0.61 0.74 0.90 TZB – 3R 0.60 0.78 0.89 TZEE – W – 1 0.57 0.79 0.91 ACR – 20 0.61 0.65 0.85 C3F2 0.62 0.67 0.89 DT SR – W 0.63 0.72 0.88 TZB – SR – SGY 0.62 0.76 0.94 TZE – S – Y 0.56 0.70 0.96 TZE – 3C3 0.57 0.73 0.92 UMUNZE YELLOW
0.55 0.75 0.92
TZL – SYN – STR 0.61 0.70 0.94

10
9
App
endi
x X
VII
: A
myl
ase
activ
ity/p
rote
in c
once
ntra
tion/
spec
ific
act
ivity
of
mai
ze e
nzym
e ex
tract
ed a
t 3
poin
ts o
f ge
rmin
atio
n i.e
. be
fore
imbi
bitio
n, d
ay 3
and
day
5 a
fter
imbi
bitio
n ex
amin
ed a
t pH
5.5

110
Appendix XVIII: Amylase activity/protein concentration/specific activity of maize enzyme extracted at 3 points of germination i.e. before imbibition, day 3 and day 5 after imbibition examined at pH 7.5
pH 7.5
BEFORE IMBIBITION
GERMINATED
DAY 3 AFTER IMBIBITIONS GERMINATED
DAY 5 AFTER IMBIBITION GERMINATED
MAIZE VARIETY
ACTIVITY (U)
PROTEIN CONC. (mg/ml)
SPECIFIC (mg-')
ACTIVI- TY (U)
ROTEIN CONC. (mg/ml)
SPECIFIC ACTIVITY (mg-')
ACTIVITY (U)
PROTEIN CONC. (mg/ml)
SPECIFIC ACTIVITY (mg-')
ACR 95 4C 3 12.5 19.5 0.64 18.5 26.25 0.70 23.5 32.50 0.72 TZL 1 C5 11.5 21.0 0.55 24.0 26.50 0.91 32.5 33.00 0.98
lJDIPLOSYNI 13.5 19.5 0.69 20.0 27.0 0.74 25.0 34.00 0.74
TZL 3 C 3 10.0 20.0 0.50 19.0 28.0 0.68 20.0 27.30 0.73
OBATANPA 14.0 21.5 0.65 22.5 26.0 0.87 37.5 34.00 1.10 TZLIC4 14.0 23.75 0.59 23.5 30.0 0.78 35.0 33.00 1.06
lK913YCI 11.0 20.5 0.54 21.5 25.5 0.84 29.0 34.25 0.85 ASABA YELLOW 11.5 22.0 0.52 15.0 26.0 .58 24.0 33.25 0.72
VARI.F2 16.0 21.50 0.74 23.5 26.50 0.89 30.0 33.00 0.95
IWDC2 13.0 21.50 0.60 18.5 26.0 0.71 27.5 31.50 0.87
TZB - SR 14.0 21.0 0.67 18.0 27.15 0.66 26.0 31.00 0.84
TZEE-W-l 13.0 19.75 0.66 17.0 27.40 0.62 24.0 32.00 0.75
ACR - 20 14.0 21.50 0.65 19.5 23.0 0.85 26.5 29.75 0.89
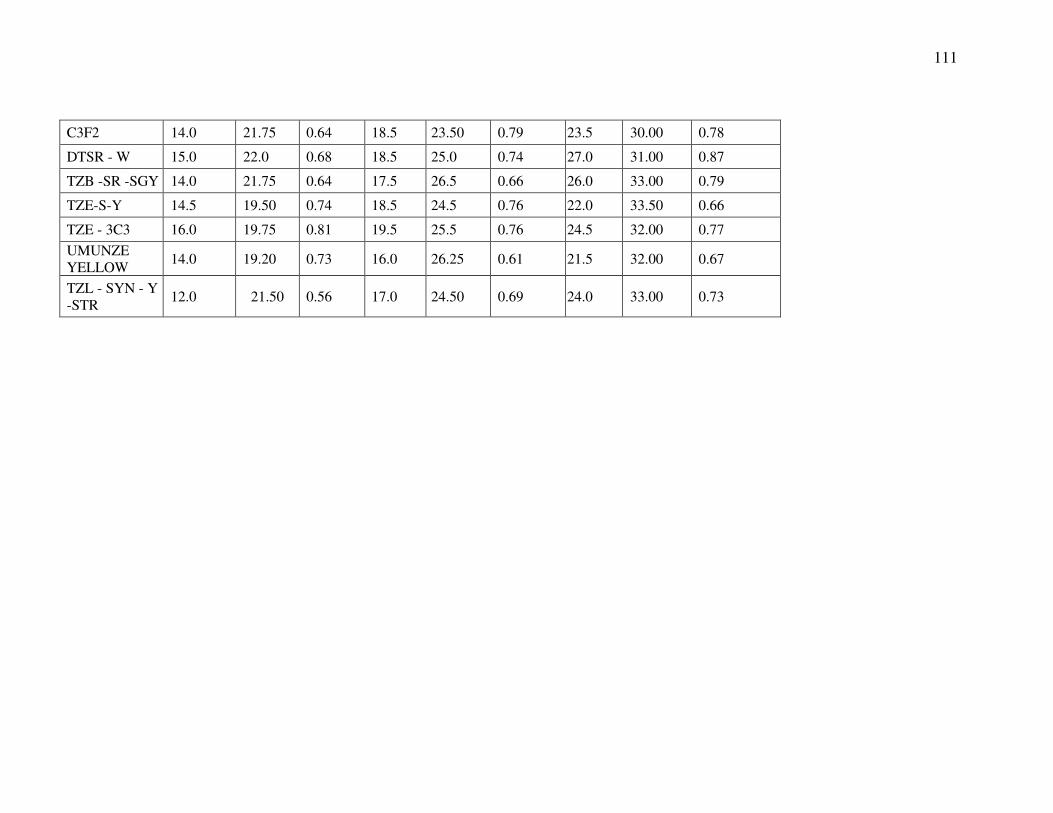
111
C3F2 14.0 21.75 0.64 18.5 23.50 0.79 23.5 30.00 0.78
DTSR - W 15.0 22.0 0.68 18.5 25.0 0.74 27.0 31.00 0.87
TZB -SR -SGY 14.0 21.75 0.64 17.5 26.5 0.66 26.0 33.00 0.79
TZE-S-Y 14.5 19.50 0.74 18.5 24.5 0.76 22.0 33.50 0.66
TZE - 3C3 16.0 19.75 0.81 19.5 25.5 0.76 24.5 32.00 0.77 UMUNZE YELLOW 14.0 19.20 0.73 16.0 26.25 0.61 21.5 32.00 0.67
TZL - SYN - Y -STR 12.0 21.50 0.56 17.0 24.50 0.69 24.0 33.00 0.73

112
Appendix XIX: Amylase activity/protein concentration/specific activity of maize enzyme extracted at 3 points of germination i.e. before imbibition, day 3 and day 5 after imbibition examined at pH 9.5
pH 9.5
BEFORE IMBIBITION DAY 3 AFTER IMBIBITION
GERMINATED DAY 5 AFTER IMBIBITION
GERMINATED
MAIZE VARIETY ACTIV- ITY (U)
PROTEIN CONC. (II12Iml )
SPECIFIC (mg' I)
ACTIVI- TY (U)
PROTEI N CONC. (mg/ml)
SPECIFIC ACTIVITY (mg-I)
ACTIVITY
(U)
PROTEIN CONC. (mg/ml)
SPECIFIC ACTIVITY (mg-1)
ACR 95 4C 3 17.5 19.5 0.90 34.0 26.25 1.30 30.0 32.50 0.92
TZL lC5 18.0 21.0 0.86 41.0 26.25 1.55 36.5 33.00 1.11
ZJDIPLO SYN I 17.0 19.5 0.87 39.0 27.00 1.44 27.5 33.75 0.81
TZL 3 C 3 19.0 20.0 0.95 31.5 28.00 1.13 28.5 34.00 1.04
OBATANPA 18.5 21.5 0.86 41.5 26.00 1.60 37.5 33.75 1.10
TZLIC4 16.5 23.75 0.69 39.0 30.00 1.30 36.5 33.00 1.11
lK913YC1 17.0 20.5 0.83 36.0 25.50 0.91 31.5 34.00 0.92
ASABA YELLOW 18.0 22.0 0.82 30.0 26.00 1.15 28.5 33.25 0.86
VAR I.F2 19.0 21.50 0.88 40.0 26.50 1.51 33.5 33.00 1.02
IWDC2 16.5 21.50 0.77 31.5 26.00 1.21 29.0 31.00 0.92
TZB - SR 18.0 21.0 0.86 34.0 27.15 1.25 28.5 31.00 0.92
TZEE-W-l 17.0 19.75 0.86 33.5 27.40 1.22 27.5 32.00 0.86
ACR - 20 17.5 21.50 0.81 32.5 23.00 1.41 29.0 29.75 0.97
C3F2 16.5 21.75 0.76 32.0 23.50 1.36 26.5 30.00 0.88
DTSR - W 18.0 22.0 0.82 38.5 25.00 1.54 32.0 31.00 1.03
TZB -SR -SGY 18.0 21.75 0.83 33.5 26.50 1.26 29.0 33.00 0.88
TZE-S-Y 17.0 19.50 0.87 36.0 24.50 1.47 27.0 33.00 0.81

113
TZE - 3C3 17.5 19.75 0.89 39.5 25.50 1.55 27.5 32.00 0.86
UMUNZE YELLOW 18.0 19.20 0.94 37.5 26.25 1.43 26.5 32.00 0.83
TZL - SYN - Y - STR 16.5 21.50 0.77 32.5 24.50 1.33 26.0 33.00 0.79
Appendix XX: Activity, Day 3 after imbibition (Germination) Maize variety pH 5.5 (U) pH 7.5 (U) pH 9.5 (U) TZL IC5 62.00 19.00 31.00 OBATANPA 59.00 20.50 33.50 TZL IC4 63.00 20.50 34.00 VAR I.F2 63.50 23.00 38.50 Appendix XXIa: Descriptive Statistics of One-Way Analysis of Variance of All parameters 95% Confidence Interval for Mean
N Mean Std. Deviation Std. Error Lower Bound Upper Bound TMS/94/0561 2 49.1750 .60104 .42500 43.7749 54.5751 TMS/9712205 2 33.7500 1.20208 .85000 22.9497 44.5503 TMS/9812101 2 47.5000 .56569 .40000 42.4175 52.5825 TMS/4(2)1425 2 45.1000 .00000 .00000 45.1000 45.1000 TME 419 2 57.0750 .60104 .42500 51.6749 62.4751 TMS/97/0211 2 35.5000 .70711 .50000 29.1469 41.8531 TMS/30572 2 31.5500 .77782 .55000 24.5616 38.5384 TMS/95/0379 2 30.4000 1.76777 1.25000 14.5172 46.2828 Total 16 41.2563 9.46294 2.36574 36.2138 46.2987

114
Appendix XXIb: Multiple Comparison of One-Way Analysis of Variance of All parameters
Mean
Difference 95% Confidence Interval
en GROUP (J) GROUP (I-J) Std. Error Sig. Lower Bound Upper Bound LSD TMS/94/0561 TMS/9712205 15.4250* .91634 .000 13.3119 17.5381
TMS/98/2101 1.6750 .91634 .105 -.4381 3.7881
TMS/4(2)1425 4.0750* :91634 .002 1.9619 6.1881
TME 419 -7.9000" .91634 .000 -10.0131 -5.7869
TMS/97/0211 13.6750* .91634 .000 11.5619 15.7881
TMS/30572 17.6250* .91634 .000 15.5119 19.7381
TMS/95/0379 18.7750* .91634 .000 16.6619 20.8881
TMS/9712205 TMS/94/0561 -15.4250* .91634 .000 -17.5381 -13.3119
TMS/9812101 -13.7500* .91634 .000 -15.8631 -11.6369
TMS/4(2)1425 -11.3500* .91634 .000 -13.4631 -9.2369
TME 419 -23.3250" .91634 .000 -25.4381 -21.2119
TMS/97/0211 -1.7500 .91634 .093 -3.8631 .3631
TMS/30572 2.2000* .91634 .043 .0869 4.3131
TMS/95/0379 3.3500* .91634 .006 1.2369 5.4631
TMS/98/2101 TMS/94/0561 -1.6750 .91634 .105 -3.7881 .4381
TMS/9712205 13.7500" .91634 .000 11.6369 15.8631
TMS/4(2)1425 2.4000* .91634 .031 .2869 4.5131
TME 419 -9.5750* .91634 .000 -11.6881 -7.4619
TMS/97/0211 12.0000* .91634 .000 9.8869 14.1131
TMS/30572 15.9500" .91634 .000 13.8369 18.0631
TMS/95/0379 17.1000" .91634 .000 14.9869 19.2131
TMS/4(2)1425 TMS/94/0561 -4.0750* .91634 .002 -6.1881 -1.9619
TMS/9712205 11.3500* .91634 .000 9.2369 13.4631
TMS/98/2101 -2.4000* .91634 .031 -4.5131 -.2869
TME 419 -11.9750" .91634 .000 -14.0881 -9.8619
TMS/97/0211 9.6000* .91634 .000 7.4869 11.7131

115
TMS/30572 13.5500* .91634 .000 11.4369 15.6631
TMS/95/0379 14.7000* .91634 .000 12.5869 16.8131
TME 419 TMS/94/0561 7.9000* .91634 .000 5.7869 10.0131
TMS/97/2205 23.3250* .91634 .000 21.2119 25.4381
TMS/9812101 9.5750* .91634 .000 7.4619 11.6881
TMS/4(2)1425 11.9750* .91634 .000 9.8619 14.0881
TMS/97/0211 21.5750* .91634 .000 19.4619 23.6881
TMS/30572 25.5250* .91634 .000 23.4119 27.6381
TMSl95/0379 26.6750* .91634 .000 24.5619 28.7881
TMS/97/0211 TMS/94/0561 -13.6750" .91634 .000 -15.7881 -11.5619
TMS/9712205 1.7500 .91634 .093 -.3631 3.8631
TMS/98/2101 -12.0000* .91634 .000 -14.1131 -9.8869
TMS/4(2)1425 -9.6000* .91634 .000 -11.7131 -7.4869
TME 419 -21.5750* .91634 .000 -23.6881 -19.4619
TMS/30572 3.9500* .91634 .003 1.8369 6.0631
TMS/95/0379 5.1000" .91634 .001 2.9869 7.2131
-
Mean Difference 95% Confidence Interval (I) GROUP (J) GROUP (I-J) Std. Error Sig. Lower Bound Upper Bound LSD TMS/30572 TMS/94/0561 -17.6250. .91634 .000 -19.7381 -15.5119
TMS/9712205 -2.2000. .91634 .043 -4.3131 -.0869 TMS/9812101 -15.9500. '.91634 .000 -18.0631 -13.8369 TMS/4(2)1425 -13.5500. .91634 .000 -15.6631 -11.4369 TME 419 -25.5250. .91634 .000 -27.6381 -23.4119 TMS/97/0211 -3.9500. .91634 .003 -6.0631 -1.8369 TMS/95/0379 1.1500 .91634 .245 -.9631 3.2631 TMS/95/0379 TMS/94/0561 -18.7750. .91634 .000 -20.8881 -16.6619 TMS/97/2205 -3.3500* .91634 .006 -5.4631 -1.2369 TMS/9812101 -17.1000* .91634 .000 -19.2131 -14.9869

116
TMS/4(2)1425 -14.7000. .91634 .000 -16.8131 -12.5869 TME 419 -26.6750. .91634 .000 -28.7881 -24.5619 TMS19710211 -5.1000. .91634 .001 -7.2131 -2.9869 TMS/30572 -1.1500 .91634 .245 -3.2631 .9631
*. The mean difference is significant at the .05 level. Appendix XXIIa: Descriptive Statistics of Two-Way Analysis of Variance of All parameters Oneway (pH 5.5)
I 95% Confidence Interval for
Mean
N Mean Std. Deviation Std. Error Lower Bound Upper Bound TZLICS 2 62.7100 2.06475 1.46000 44.1589 81.2611 OBATANPA 2 59.5850 .58690 .41500 54.3119 64.8581 TZLIC4 2 63.9600 .29698 .21000 61.2917 66.6283 VAR I.F2 2 64.7900 .29698 .21000 62.1217 67.4583 Total 8 62.7613 2.27006 .80259 60.8634 64.6591
Oneway (pH 7.5) Descriptives
95% Confidence Interval for Mean
N Mean Std. Deviation Std. Error Lower Bound Upper Bound TZL IC5 2 18.3350 1.18087 .83500 7.7253 28.9447 OBATANPA 2 20.6250 .28991 .20500 18.0202 23.2298 TZLIC4 2 20.8300 1.17380 .83000 10.2839 31.3761 VAR LF2 2 23.3350 .58690 .41500 18.0619 28.6081 Total 8 20.7813 2.00947 .71046 19.1013 22.4612

117
Oneway (pH 9.5)
95% Confidence Interval for
Mean
N Mean Std. Deviation Std. Error Lower Bound Upper Bound TZL ICS 2 31.7150 1.11016 .78500 21.7406 41.6894 OBATANPA 2 33.1250 .28991 .20500 30.5202 35.7298 TZLIC4 2 33.7500 .59397 .42000 28.4134 39.0866
VAR I.F2 2 39.5850 .58690 .41500 34.3119 . 44.8581
Total 8 34.5438 3.25426 1.15056 31.8231 37.2644
Appendix XXIIb: Multiple Comparison of Two-Way Analysis of Variance of All parameters Oneway (pH 5.5)
Mean
Difference 95% Confidence Interval
(I) GROUP (J) GROUP (I-J) Std. Error Sjg. Lower Bound Upper Bound LSD TZL ICS OBATANPA 3.1250. 1.09362 .046 .0886 6.1614
TZL 1C4 -1.2500 1.09362 .317 -4.2864 1.7864 VAR LF2 -2.0800 1.09362 .130 -5.1164 .9564
OBATANPA TZL ICS" -3.1250. 1.09362 .046 -6.1614 -.0886 TZLIC4 -4.3750. 1.09362 .016 -7.4114 -1.3386 VAR. I.F2 -5.2050. 1.09362 .009 -8.2414 -2.1686
TZLIC4 TZL IC6 1.2500 1.09362 .317 -1.7864 4.2864 OBATANPA 4.3750* 1.09362 .016 1.3386 7.4114 VAR LF2 -.8300 1.09362 .490 -3.8664 2.2064
VAR I.F2 TZL ICS' 2.0800 1.09362 .130 -.9564 5.1164 OBATANPA 5.2050* 1.09362 .009 2.1686 8.2414 TZL 1C4 .8300 1.09362 .490 -2.2064 3.8664
*The mean difference is significant at the .05 level.

118
Oneway (pH 7.5)
Mean
Difference 95% Confidence Interval (I) GROUP (J) GROUP (1"'-') Std. Error Sig. Lower Bound Upper Bound
LSD TZL IC5 OBATANPA -2.2900 .89453 .063 -4.7736 .1936 TZLIC4 -2.4950. .89453 .049 -4.9786 -.0114 VAR I.F2 -5.0000. .89453 .005 -7.4836 -2.5164 OBATANPA TZL ICS" 2.2900 .89453 .063 -.1936 4.7736 TZL 1C4 -.2050 .89453 .830 -2.6886 2.2786 VAR I.F2 -2.7100. .89453 .039 -5.1936 -.2264 TZL 1C4 TZL ICS' 2.4950. .89453 .049 .0114 4.9786 OBATANPA .2050 .89453 .830 -2.2786 2.6886 VAR I.F2 -2.5050* .89453 .049 -4.9886 -.0214 VAR I.F2 TZL ICS- 5.0000* .89453 .005 2.5164 7.4836 OBATANPA 2.7100. .89453 .039 .2264 5.1936 TZLIC4 2.5050* .89453 .049 .0214 4.9886
*The mean difference is significant at the .05 level.

11
9
One
way
(pH
9.5
)
Mea
n
D
iffer
ence
95
% C
onfid
ence
Inte
rval
(I)
GR
OU
P
(J) G
RO
UP
(I-
J)
Std
. Err
or
Sig
. lo
wer
Bou
nd
Upp
er B
ound
LS
D
Tll I
CS
' O
BA
TAN
PA
-1
.410
0 .7
0953
.1
18
-3.3
800
.560
0
TZl 1
C4
-2.0
350*
.7
0953
.0
46
-4.0
050
-.065
0
VA
R I.
F2
-7.8
700*
.7
0953
.0
00
-9.8
400
-5.9
000
O
BA
TAN
PA
TZ
lICS
" 1.
4100
.7
0953
.1
18
-.560
0 3.
3800
TZl 1
C4
-.625
0 .7
0953
.4
28
-2.5
950
1.34
50
VA
R I.
F2
-6.4
600*
.7
0953
.0
01
-8.4
300
-4.4
900
Tl
llC4
TZl r
cS'
2.03
50*
.709
53
.046
.0
650
4.00
50
OB
ATA
NP
A
.625
0 .7
0953
.4
28
-1.3
450
2.59
50
VA
R I.
F2
-5.8
350*
.7
0953
.0
01
-7.8
050
-3.8
650
V
AR
I.F2
TZ
l IC
Er
7.87
00*
.709
53
.000
5.
9000
9.
8400
OB
ATA
NP
A
6.46
00*
.709
53
.001
4.
4900
8.
4300
TZl 1
C4
5.83
50*
.709
53
.001
3.
8650
7.
8050
*The
m
ean
diffe
renc
e is
si
gnifi
cant
at
th
e .0
5 le
vel

120