hydrostatic levelling systems: measuring at the system limits
TRANSCRIPT
Hydrostatic levelling systems: Measuring at the system limits
Edi Meier, Alain Geiger, Hilmar Ingensand, Hans Licht, Philippe Limpach, Andreas Steiger
and Roger Zwyssig
Abstract. Three hydrostatic displacement monitor-ing system applications in Switzerland are discussed;the first concerns experience gained monitoring thefoundation of the Albigna dam, the second relatingto the underground stability of the Swiss LightSource synchrotron and the third concerning the de-formation of a bridge near the city of Lucerne. Twodi¤erent principles were applied, the HydrostaticLevelling System (HLS) using the ‘‘half-filled pipeprinciple’’ developed by the Paul Scherrer Instituteand the Large Area Settlement System (LAS) usingthe ‘‘di¤erential pressure principle’’. With both sys-tems ground deformations induced by tidal forcescan be seen. However, high accuracy of single sen-sors is not su‰cient. A well-designed configurationof the complete system is equally important. On theother hand there are also limits imposed by installa-tion logistics and by the environmental conditions.An example is the bridge monitoring application,where the acceleration along the bridge due to thepassage of heavy trucks limits the feasibility of usinghydrostatic levelling measurements.
Keywords. High-precision ground deformation,long-term stability, hydrostatic leveling system, ver-tical displacement, synchrotron, power dam, bridgecontrol, Earth tide.
1. Introduction
Since ancient times the surface of fluids has beenused as a reference tool to determine precise leveldi¤erences. Nowadays, the hydrostatic measuringprinciple is more often applied, when visual observa-tion is not possible or disturbances such as air turbu-lence prevent optical measurements. The advantagesof hydrostatic measuring systems are their high ac-curacy and resolution. With regard to this aspect,these systems are far superior to modern geodeticinstruments such as tachymeters and digital levelingdevices. Due to their simple and robust configura-tion, hydrostatic measuring systems are well-suitedfor permanent all-season monitoring, combinedwith remote control systems and automated dataacquisition. All hydrostatic measuring systems work
on the fundamental principle that a water surfacewhich is under the influence of a gravitational fieldand free to move, orientates towards a certain levelsurface. Measuring pots, which are connected toeach other, obey the law of the communicating ves-sels and therefore the water surface represents astable, reliable and very accurate reference for level-ling purposes. The fundamental design and compu-tational aspects of hydrostatic measuring systemshave been described in [3]. The various hydrostaticmeasuring systems can be divided into three groupsaccording to their operational mode:
– Half-filled pipe (open surface)– Hydrostatic level– Pressure measuring system
With half-filled pipes as well as with hydrostaticlevels the changing fluid-levels are measured. De-pending on the precision specification of hydrostaticlevels, di¤erent methods of fluid-level sensing areapplied. The pressure measuring system di¤ers basi-cally from the first two designs, as no (or very little)fluid flow occurs. Inductive, capacitive or piezoresis-tive sensors are used for pressure measurements ineither di¤erential or absolute pressure transducers,respectively, depending on the task. At present thehighest accuracies are obtained by capacitive pres-sure transducers.
The advantage of hydrostatic levelling systems istheir high resolution for static and dynamic defor-mation applications. Therefore, hydrostatic systemsare used in large research facilities such as linearand ring accelerators, as well as for monitoringsettlements and tilts, movements of buildings anddams, landslides and rock avalanches. All applica-tions have two essential aims:
– To monitor deformations– To serve as an early-warning system in case of un-
expected movements of the monitored objects.
Hydrostatic levelling systems are not only used forpermanent monitoring. They also allow detectionof the behaviour of buildings during specific events,such as release from snow loads, bending due towind exposure or vibrations caused by trucks pass-
Journal of Applied Geodesy 4 (2010), 91–102 6 de Gruyter 2010. DOI 10.1515/JAG.2010.009
AUTHOR’S COPY | AUTORENEXEMPLAR
AUTHOR’S COPY | AUTORENEXEMPLAR
ing over a bridge. In complex buildings, in whichhydrostatic levelling systems with consistent waterlevel are not continuously applicable, the system canbe disrupted and vertically displaced. Thus this re-quires high precision in data logging, because mea-suring errors accumulate with several lateral o¤sets.
2. The two applied systems
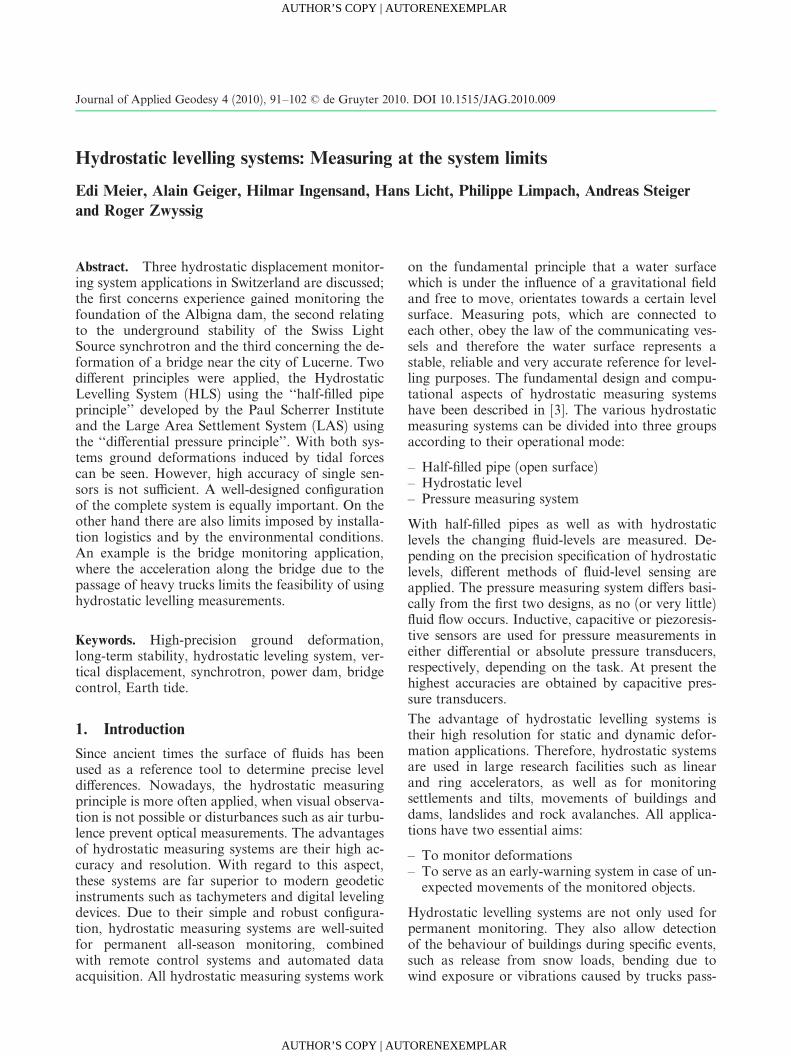
For the hydropower dam monitoring and for thebridge monitoring the LAS-meter, a di¤erentialpressure system, was applied. The LAS-meter wasdeveloped at ETH Zurich in co-operation withthe company Edi Meierþ Partner AG, Winterthur,Switzerland. The Multipoint LAS-meter describedhere uses the pressure di¤erence between two liquidcolumns (Figure 1).
In the middle of the tubes a diaphragm is insertedwhich deforms according to the equalization of the
liquid. As a result of pressure di¤erences betweenthe liquid columns, the diaphragm is deflected. Themovement of this diaphragm is transformed to anelectrical signal, which is a measure for the level dif-ference between the ‘chambers’ at the end of thetube.
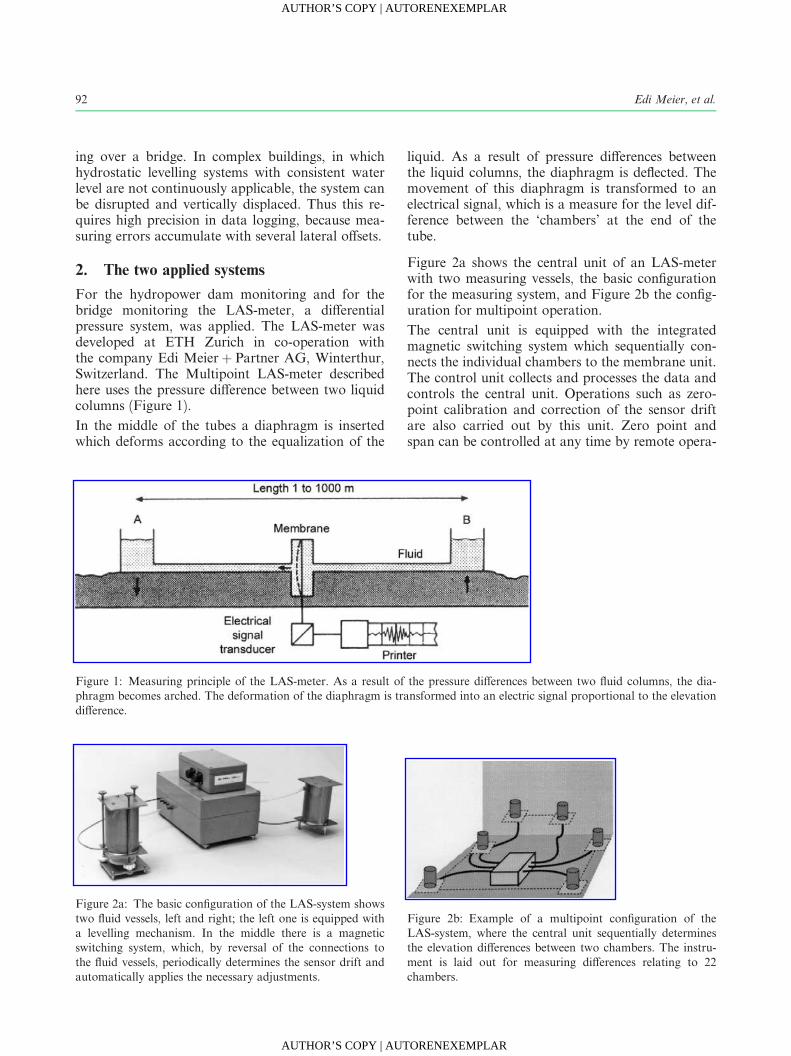
Figure 2a shows the central unit of an LAS-meterwith two measuring vessels, the basic configurationfor the measuring system, and Figure 2b the config-uration for multipoint operation.
The central unit is equipped with the integratedmagnetic switching system which sequentially con-nects the individual chambers to the membrane unit.The control unit collects and processes the data andcontrols the central unit. Operations such as zero-point calibration and correction of the sensor driftare also carried out by this unit. Zero point andspan can be controlled at any time by remote opera-
Figure 1: Measuring principle of the LAS-meter. As a result of the pressure di¤erences between two fluid columns, the dia-phragm becomes arched. The deformation of the diaphragm is transformed into an electric signal proportional to the elevationdi¤erence.
Figure 2a: The basic configuration of the LAS-system showstwo fluid vessels, left and right; the left one is equipped witha levelling mechanism. In the middle there is a magneticswitching system, which, by reversal of the connections tothe fluid vessels, periodically determines the sensor drift andautomatically applies the necessary adjustments.
Figure 2b: Example of a multipoint configuration of theLAS-system, where the central unit sequentially determinesthe elevation di¤erences between two chambers. The instru-ment is laid out for measuring di¤erences relating to 22chambers.
92 Edi Meier, et al.
AUTHOR’S COPY | AUTORENEXEMPLAR
AUTHOR’S COPY | AUTORENEXEMPLAR
tion. After installation, no further modifications tothe instrument are necessary, because all operationscan be carried out directly by the control unit.
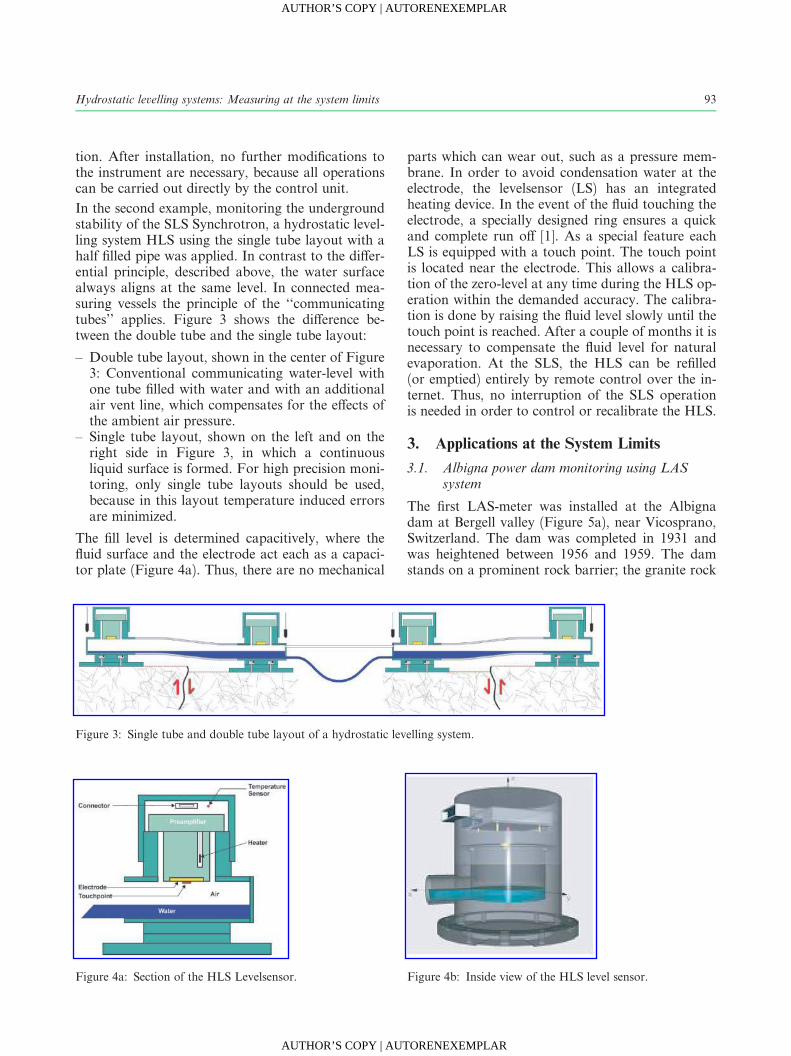
In the second example, monitoring the undergroundstability of the SLS Synchrotron, a hydrostatic level-ling system HLS using the single tube layout with ahalf filled pipe was applied. In contrast to the di¤er-ential principle, described above, the water surfacealways aligns at the same level. In connected mea-suring vessels the principle of the ‘‘communicatingtubes’’ applies. Figure 3 shows the di¤erence be-tween the double tube and the single tube layout:
– Double tube layout, shown in the center of Figure3: Conventional communicating water-level withone tube filled with water and with an additionalair vent line, which compensates for the e¤ects ofthe ambient air pressure.
– Single tube layout, shown on the left and on theright side in Figure 3, in which a continuousliquid surface is formed. For high precision moni-toring, only single tube layouts should be used,because in this layout temperature induced errorsare minimized.
The fill level is determined capacitively, where thefluid surface and the electrode act each as a capaci-tor plate (Figure 4a). Thus, there are no mechanical
parts which can wear out, such as a pressure mem-brane. In order to avoid condensation water at theelectrode, the levelsensor (LS) has an integratedheating device. In the event of the fluid touching theelectrode, a specially designed ring ensures a quickand complete run o¤ [1]. As a special feature eachLS is equipped with a touch point. The touch pointis located near the electrode. This allows a calibra-tion of the zero-level at any time during the HLS op-eration within the demanded accuracy. The calibra-tion is done by raising the fluid level slowly until thetouch point is reached. After a couple of months it isnecessary to compensate the fluid level for naturalevaporation. At the SLS, the HLS can be refilled(or emptied) entirely by remote control over the in-ternet. Thus, no interruption of the SLS operationis needed in order to control or recalibrate the HLS.
3. Applications at the System Limits
3.1. Albigna power dam monitoring using LASsystem
The first LAS-meter was installed at the Albignadam at Bergell valley (Figure 5a), near Vicosprano,Switzerland. The dam was completed in 1931 andwas heightened between 1956 and 1959. The damstands on a prominent rock barrier; the granite rock
Figure 3: Single tube and double tube layout of a hydrostatic levelling system.
Figure 4a: Section of the HLS Levelsensor. Figure 4b: Inside view of the HLS level sensor.
93Hydrostatic levelling systems: Measuring at the system limits
AUTHOR’S COPY | AUTORENEXEMPLAR
AUTHOR’S COPY | AUTORENEXEMPLAR
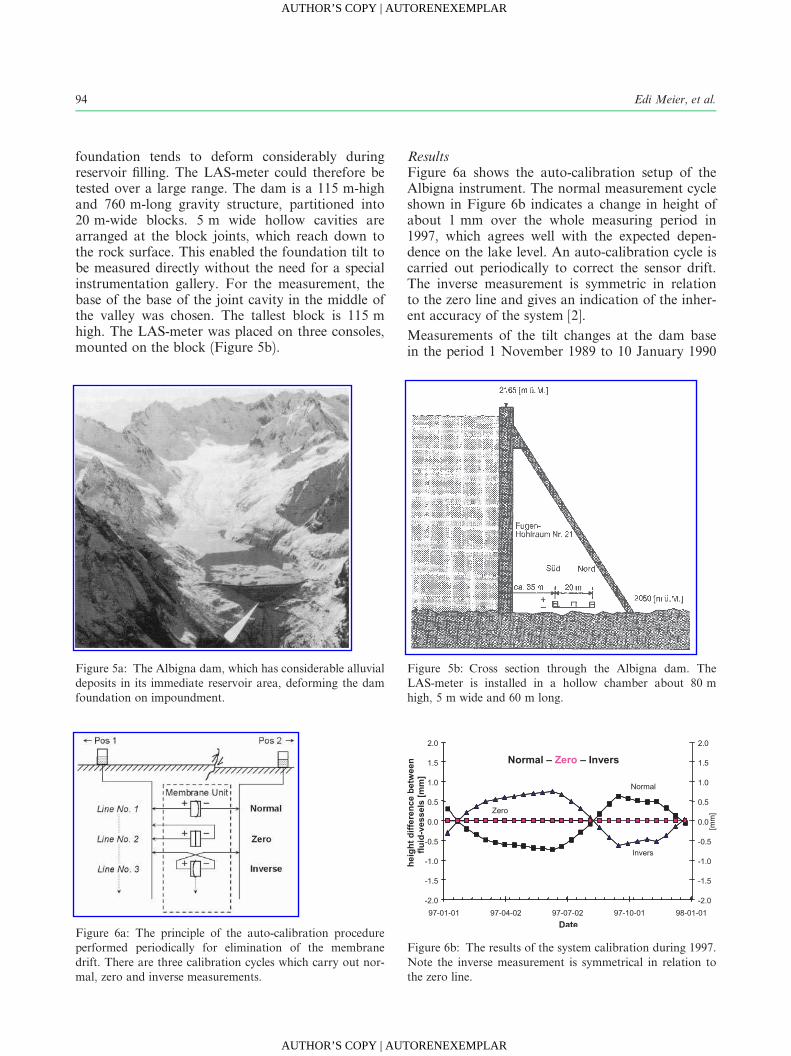
foundation tends to deform considerably duringreservoir filling. The LAS-meter could therefore betested over a large range. The dam is a 115 m-highand 760 m-long gravity structure, partitioned into20 m-wide blocks. 5 m wide hollow cavities arearranged at the block joints, which reach down tothe rock surface. This enabled the foundation tilt tobe measured directly without the need for a specialinstrumentation gallery. For the measurement, thebase of the base of the joint cavity in the middle ofthe valley was chosen. The tallest block is 115 mhigh. The LAS-meter was placed on three consoles,mounted on the block (Figure 5b).
ResultsFigure 6a shows the auto-calibration setup of theAlbigna instrument. The normal measurement cycleshown in Figure 6b indicates a change in height ofabout 1 mm over the whole measuring period in1997, which agrees well with the expected depen-dence on the lake level. An auto-calibration cycle iscarried out periodically to correct the sensor drift.The inverse measurement is symmetric in relationto the zero line and gives an indication of the inher-ent accuracy of the system [2].
Measurements of the tilt changes at the dam basein the period 1 November 1989 to 10 January 1990
Figure 5a: The Albigna dam, which has considerable alluvialdeposits in its immediate reservoir area, deforming the damfoundation on impoundment.
Figure 5b: Cross section through the Albigna dam. TheLAS-meter is installed in a hollow chamber about 80 mhigh, 5 m wide and 60 m long.
Figure 6a: The principle of the auto-calibration procedureperformed periodically for elimination of the membranedrift. There are three calibration cycles which carry out nor-mal, zero and inverse measurements.
Figure 6b: The results of the system calibration during 1997.Note the inverse measurement is symmetrical in relation tothe zero line.
94 Edi Meier, et al.
AUTHOR’S COPY | AUTORENEXEMPLAR
AUTHOR’S COPY | AUTORENEXEMPLAR

showed that the upstream heel of the damwall wassinking in relation to the downstream toe, almostcontinuously. The relationship between the reservoirlevel and the tilt at the dam foundation was exam-ined (see Figure 7a) over this 16 day period, and aclear dependence can be observed. To quantify this,the level of the lake was plotted against the mea-sured tilt for a 2 m lowering of the lake and an al-most linear relationship was substantiated. If, thetilt caused by the reservoir level is subtracted fromthe measured tilt, the di¤erence (residual tilt) isobtained. This was seen to vary within less than amicro-radian, despite the meteorological conditionsvarying greatly.
The curve of residual tilt showed a regular up anddown fluctuation with a period of half a day. Thisled to the conclusion, that the ‘‘earth tide’’ influencewas involved. The shape of the earth is influencedby the gravitational forces between the earth, moonand sun; the deformation is determined by the sizeof the forces, local rigidity and the ocean load e¤ect.This deformation occurs at any point of the earth’ssurface in cycles with a 12 h period and can be calcu-lated from models. The e¤ect is called ‘‘earth tides’’.Reservoir tidal e¤ects are much smaller in compari-son to ground movements. According to informa-tion from the Swiss Meteorological O‰ce, the airpressure during the period fluctuated by 27.7 and27.5 millibars at the two local weather stations;temperatures fluctuated between �17 and þ14 degCelsius at the stations. As no electricity was gener-
ated during the weekend of 11 November, the reser-voir level was approximately constant. Also calmweather conditions existed. The base of the damshould thus have been expected to be stable. Thelower curve of Figure 7b shows the tilt change dur-ing that weekend (with a large vertical scale). Thetwice daily cycles are therefore clearly visible. If thisis compared with theoretically calculated earth tidecycles, calculated from models at the Black ForestObservatory (top curve, Figure 7b) there can be nodoubt that the cause is indeed the moon and the sun.
The provision for mechanical switching of the indi-vidual measuring points makes it possible to deter-mine and eliminate the systematic e¤ects of a hydro-static measuring system. On the other hand, the lossof liquid in the vessels and tubes as a result of evap-oration cannot be neglected when the system is run-ning unattended for a long period of time.
3.2. The HLS at the Swiss Light Sourcesynchrotron (SLS)
For monitoring the underground of the new builtstorage ring of the Swiss Light Source (SLS) at thePaul Scherrer Institute (PSI), Switzerland (Figure8a), the highest resolution and long-term stabilityover more than 10 years was required. As liquidloss over such long periods cannot be eliminated,the use of a di¤erential pressure system was notsuitable. Thus, the principle of half-filled pipes wasused instead, where a slow liquid loss is irrelevant.The HLS installed at the SLS was designed to
Figure 7a: Water level of the Albigna-reservoir between No-vember 1 and 16, 1989. The upper line represents the waterlevel (in metres above sea level). The comparison with thetilt of the dam foundation during the same period (lowerline) shows the influence of the water level fluctuation on thetilt changes of the dam foundation.
Figure 7b: Tilt measurements at the Albigna dam. There wasalmost no fluctuation of the reservoir water level. The lowercurve shows the residual tilt changes. The upper curve showsthe calculated tilt changes of the Earth tides due to gravita-tional forces between moon, sun and earth [1].
95Hydrostatic levelling systems: Measuring at the system limits
AUTHOR’S COPY | AUTORENEXEMPLAR
AUTHOR’S COPY | AUTORENEXEMPLAR
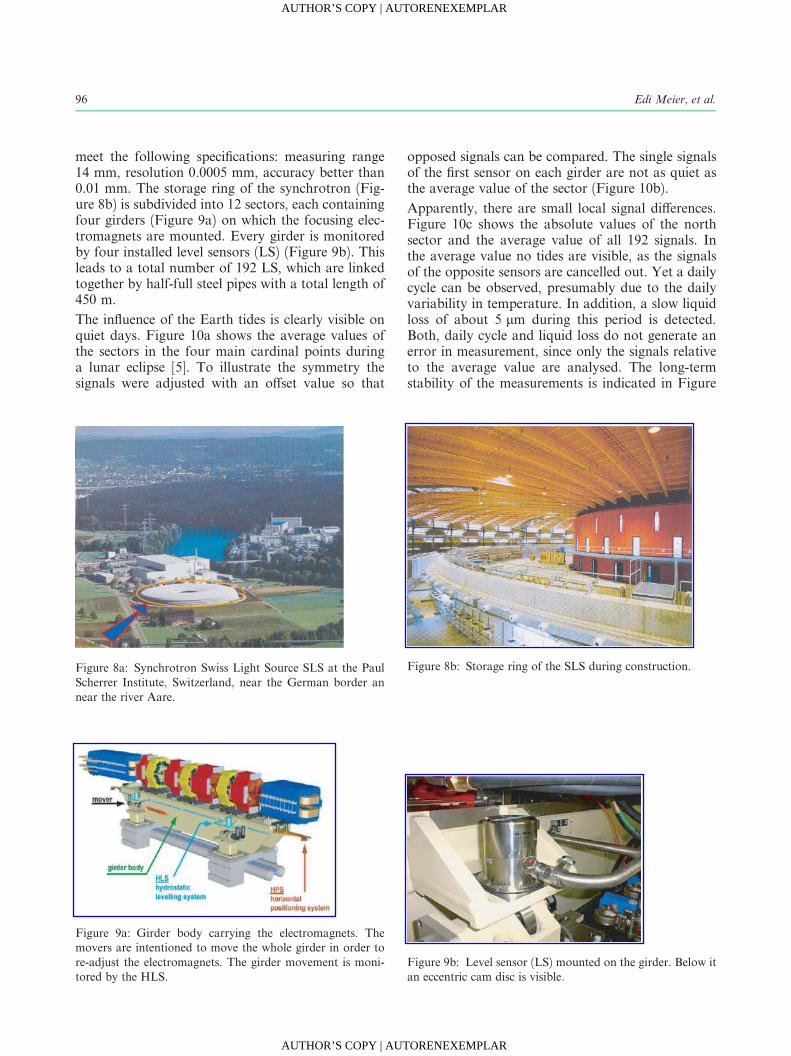
meet the following specifications: measuring range14 mm, resolution 0.0005 mm, accuracy better than0.01 mm. The storage ring of the synchrotron (Fig-ure 8b) is subdivided into 12 sectors, each containingfour girders (Figure 9a) on which the focusing elec-tromagnets are mounted. Every girder is monitoredby four installed level sensors (LS) (Figure 9b). Thisleads to a total number of 192 LS, which are linkedtogether by half-full steel pipes with a total length of450 m.
The influence of the Earth tides is clearly visible onquiet days. Figure 10a shows the average values ofthe sectors in the four main cardinal points duringa lunar eclipse [5]. To illustrate the symmetry thesignals were adjusted with an o¤set value so that
opposed signals can be compared. The single signalsof the first sensor on each girder are not as quiet asthe average value of the sector (Figure 10b).
Apparently, there are small local signal di¤erences.Figure 10c shows the absolute values of the northsector and the average value of all 192 signals. Inthe average value no tides are visible, as the signalsof the opposite sensors are cancelled out. Yet a dailycycle can be observed, presumably due to the dailyvariability in temperature. In addition, a slow liquidloss of about 5 mm during this period is detected.Both, daily cycle and liquid loss do not generate anerror in measurement, since only the signals relativeto the average value are analysed. The long-termstability of the measurements is indicated in Figure
Figure 8a: Synchrotron Swiss Light Source SLS at the PaulScherrer Institute, Switzerland, near the German border annear the river Aare.
Figure 8b: Storage ring of the SLS during construction.
Figure 9a: Girder body carrying the electromagnets. Themovers are intentioned to move the whole girder in order tore-adjust the electromagnets. The girder movement is moni-tored by the HLS.
Figure 9b: Level sensor (LS) mounted on the girder. Below itan eccentric cam disc is visible.
96 Edi Meier, et al.
AUTHOR’S COPY | AUTORENEXEMPLAR
AUTHOR’S COPY | AUTORENEXEMPLAR
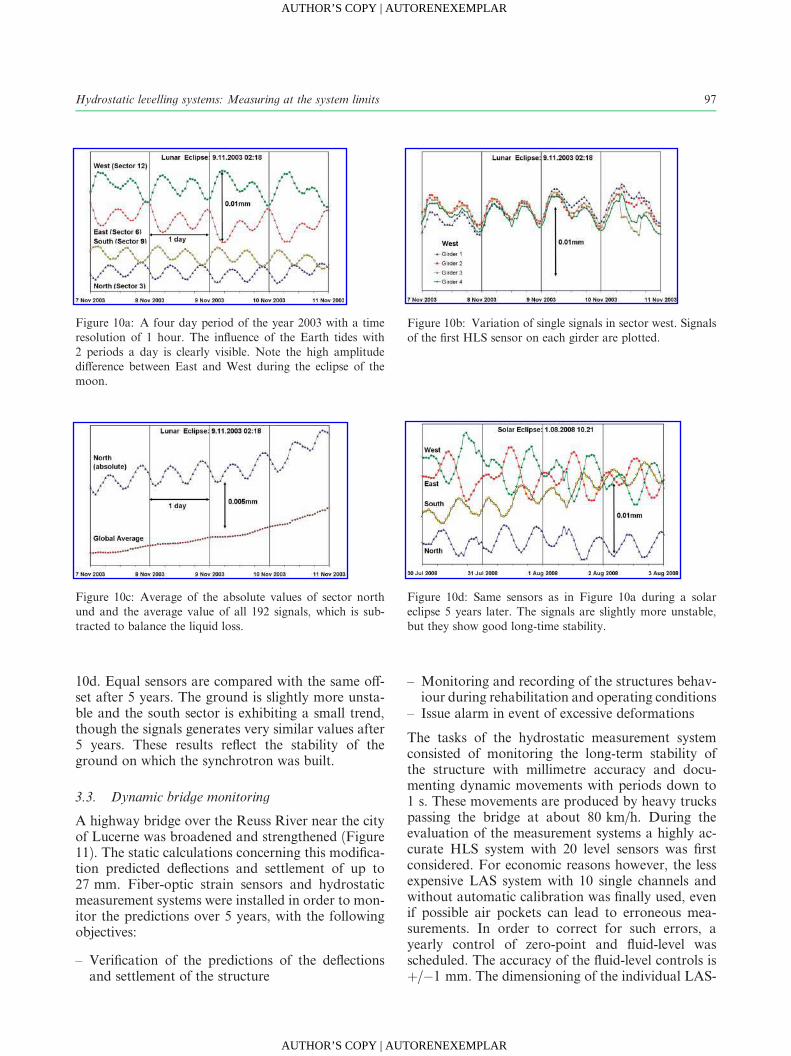
10d. Equal sensors are compared with the same o¤-set after 5 years. The ground is slightly more unsta-ble and the south sector is exhibiting a small trend,though the signals generates very similar values after5 years. These results reflect the stability of theground on which the synchrotron was built.
3.3. Dynamic bridge monitoring
A highway bridge over the Reuss River near the cityof Lucerne was broadened and strengthened (Figure11). The static calculations concerning this modifica-tion predicted deflections and settlement of up to27 mm. Fiber-optic strain sensors and hydrostaticmeasurement systems were installed in order to mon-itor the predictions over 5 years, with the followingobjectives:
– Verification of the predictions of the deflectionsand settlement of the structure
– Monitoring and recording of the structures behav-iour during rehabilitation and operating conditions
– Issue alarm in event of excessive deformations
The tasks of the hydrostatic measurement systemconsisted of monitoring the long-term stability ofthe structure with millimetre accuracy and docu-menting dynamic movements with periods down to1 s. These movements are produced by heavy truckspassing the bridge at about 80 km/h. During theevaluation of the measurement systems a highly ac-curate HLS system with 20 level sensors was firstconsidered. For economic reasons however, the lessexpensive LAS system with 10 single channels andwithout automatic calibration was finally used, evenif possible air pockets can lead to erroneous mea-surements. In order to correct for such errors, ayearly control of zero-point and fluid-level wasscheduled. The accuracy of the fluid-level controls isþ/�1 mm. The dimensioning of the individual LAS-
Figure 10a: A four day period of the year 2003 with a timeresolution of 1 hour. The influence of the Earth tides with2 periods a day is clearly visible. Note the high amplitudedi¤erence between East and West during the eclipse of themoon.
Figure 10b: Variation of single signals in sector west. Signalsof the first HLS sensor on each girder are plotted.
Figure 10c: Average of the absolute values of sector northund and the average value of all 192 signals, which is sub-tracted to balance the liquid loss.
Figure 10d: Same sensors as in Figure 10a during a solareclipse 5 years later. The signals are slightly more unstable,but they show good long-time stability.
97Hydrostatic levelling systems: Measuring at the system limits
AUTHOR’S COPY | AUTORENEXEMPLAR
AUTHOR’S COPY | AUTORENEXEMPLAR

Figure 12: Instrumentation with fiber-optical strain sensors and LAS-meter [4].
Figure 13a: Mounting of a LAS-meter measuring chamberat the inside wall of the bridge, field 2, and connecting it tothe pressure tube, made of copper.
Figure 13b: Mounting of a fiber-optical strain sensors on theroof of the girder box. The fiber-optic string covers 5 m oneach side of pylon 2.
Figure 11a: Highway bridge near Lucerne after enlargingduring construction phase, top view.
Figure 11b: Enlarged part of the bridge, bottom view.
98 Edi Meier, et al.
AUTHOR’S COPY | AUTORENEXEMPLAR
AUTHOR’S COPY | AUTORENEXEMPLAR
meter was evaluated in order to achieve a responsetime of below 1 s.
The 10 separated LAS-meter systems were placedupstream along the western longitudinal girder ofthe bridge, at the inner wall of the box girder. Foreach field of the bridge, separated by two pylons,two independent LAS systems were installed. Foreach of the two systems, one fluid vessel was mountedin the centre between two pylons, and the secondvessel was installed near the pivot (pylon). Thisyields two opposite signals from the two systems.
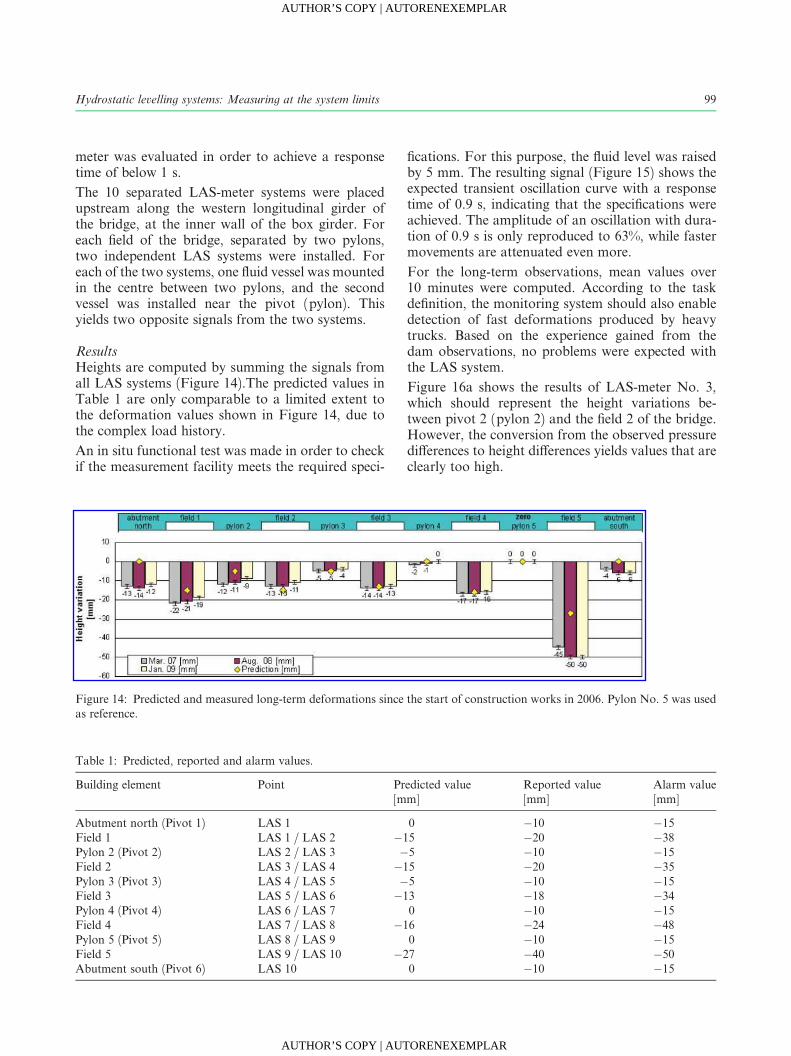
ResultsHeights are computed by summing the signals fromall LAS systems (Figure 14).The predicted values inTable 1 are only comparable to a limited extent tothe deformation values shown in Figure 14, due tothe complex load history.
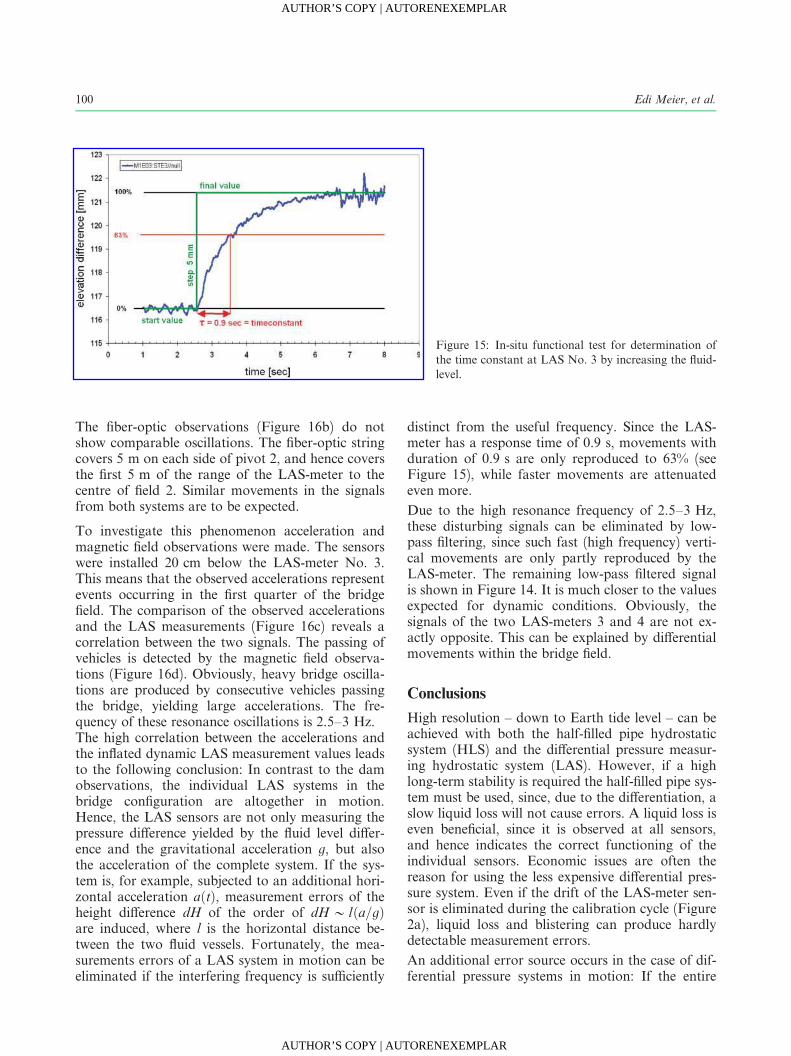
An in situ functional test was made in order to checkif the measurement facility meets the required speci-
fications. For this purpose, the fluid level was raisedby 5 mm. The resulting signal (Figure 15) shows theexpected transient oscillation curve with a responsetime of 0.9 s, indicating that the specifications wereachieved. The amplitude of an oscillation with dura-tion of 0.9 s is only reproduced to 63%, while fastermovements are attenuated even more.
For the long-term observations, mean values over10 minutes were computed. According to the taskdefinition, the monitoring system should also enabledetection of fast deformations produced by heavytrucks. Based on the experience gained from thedam observations, no problems were expected withthe LAS system.
Figure 16a shows the results of LAS-meter No. 3,which should represent the height variations be-tween pivot 2 (pylon 2) and the field 2 of the bridge.However, the conversion from the observed pressuredi¤erences to height di¤erences yields values that areclearly too high.
Figure 14: Predicted and measured long-term deformations since the start of construction works in 2006. Pylon No. 5 was usedas reference.
Table 1: Predicted, reported and alarm values.
Building element Point Predicted value[mm]
Reported value[mm]
Alarm value[mm]
Abutment north (Pivot 1) LAS 1 0 �10 �15Field 1 LAS 1 / LAS 2 �15 �20 �38Pylon 2 (Pivot 2) LAS 2 / LAS 3 �5 �10 �15Field 2 LAS 3 / LAS 4 �15 �20 �35Pylon 3 (Pivot 3) LAS 4 / LAS 5 �5 �10 �15Field 3 LAS 5 / LAS 6 �13 �18 �34Pylon 4 (Pivot 4) LAS 6 / LAS 7 0 �10 �15Field 4 LAS 7 / LAS 8 �16 �24 �48Pylon 5 (Pivot 5) LAS 8 / LAS 9 0 �10 �15Field 5 LAS 9 / LAS 10 �27 �40 �50Abutment south (Pivot 6) LAS 10 0 �10 �15
99Hydrostatic levelling systems: Measuring at the system limits
AUTHOR’S COPY | AUTORENEXEMPLAR
AUTHOR’S COPY | AUTORENEXEMPLAR
The fiber-optic observations (Figure 16b) do notshow comparable oscillations. The fiber-optic stringcovers 5 m on each side of pivot 2, and hence coversthe first 5 m of the range of the LAS-meter to thecentre of field 2. Similar movements in the signalsfrom both systems are to be expected.
To investigate this phenomenon acceleration andmagnetic field observations were made. The sensorswere installed 20 cm below the LAS-meter No. 3.This means that the observed accelerations representevents occurring in the first quarter of the bridgefield. The comparison of the observed accelerationsand the LAS measurements (Figure 16c) reveals acorrelation between the two signals. The passing ofvehicles is detected by the magnetic field observa-tions (Figure 16d). Obviously, heavy bridge oscilla-tions are produced by consecutive vehicles passingthe bridge, yielding large accelerations. The fre-quency of these resonance oscillations is 2.5–3 Hz.The high correlation between the accelerations andthe inflated dynamic LAS measurement values leadsto the following conclusion: In contrast to the damobservations, the individual LAS systems in thebridge configuration are altogether in motion.Hence, the LAS sensors are not only measuring thepressure di¤erence yielded by the fluid level di¤er-ence and the gravitational acceleration g, but alsothe acceleration of the complete system. If the sys-tem is, for example, subjected to an additional hori-zontal acceleration aðtÞ, measurement errors of theheight di¤erence dH of the order of dHP lða=gÞare induced, where l is the horizontal distance be-tween the two fluid vessels. Fortunately, the mea-surements errors of a LAS system in motion can beeliminated if the interfering frequency is su‰ciently
distinct from the useful frequency. Since the LAS-meter has a response time of 0.9 s, movements withduration of 0.9 s are only reproduced to 63% (seeFigure 15), while faster movements are attenuatedeven more.
Due to the high resonance frequency of 2.5–3 Hz,these disturbing signals can be eliminated by low-pass filtering, since such fast (high frequency) verti-cal movements are only partly reproduced by theLAS-meter. The remaining low-pass filtered signalis shown in Figure 14. It is much closer to the valuesexpected for dynamic conditions. Obviously, thesignals of the two LAS-meters 3 and 4 are not ex-actly opposite. This can be explained by di¤erentialmovements within the bridge field.
Conclusions
High resolution – down to Earth tide level – can beachieved with both the half-filled pipe hydrostaticsystem (HLS) and the di¤erential pressure measur-ing hydrostatic system (LAS). However, if a highlong-term stability is required the half-filled pipe sys-tem must be used, since, due to the di¤erentiation, aslow liquid loss will not cause errors. A liquid loss iseven beneficial, since it is observed at all sensors,and hence indicates the correct functioning of theindividual sensors. Economic issues are often thereason for using the less expensive di¤erential pres-sure system. Even if the drift of the LAS-meter sen-sor is eliminated during the calibration cycle (Figure2a), liquid loss and blistering can produce hardlydetectable measurement errors.
An additional error source occurs in the case of dif-ferential pressure systems in motion: If the entire
Figure 15: In-situ functional test for determination ofthe time constant at LAS No. 3 by increasing the fluid-level.
100 Edi Meier, et al.
AUTHOR’S COPY | AUTORENEXEMPLAR
AUTHOR’S COPY | AUTORENEXEMPLAR
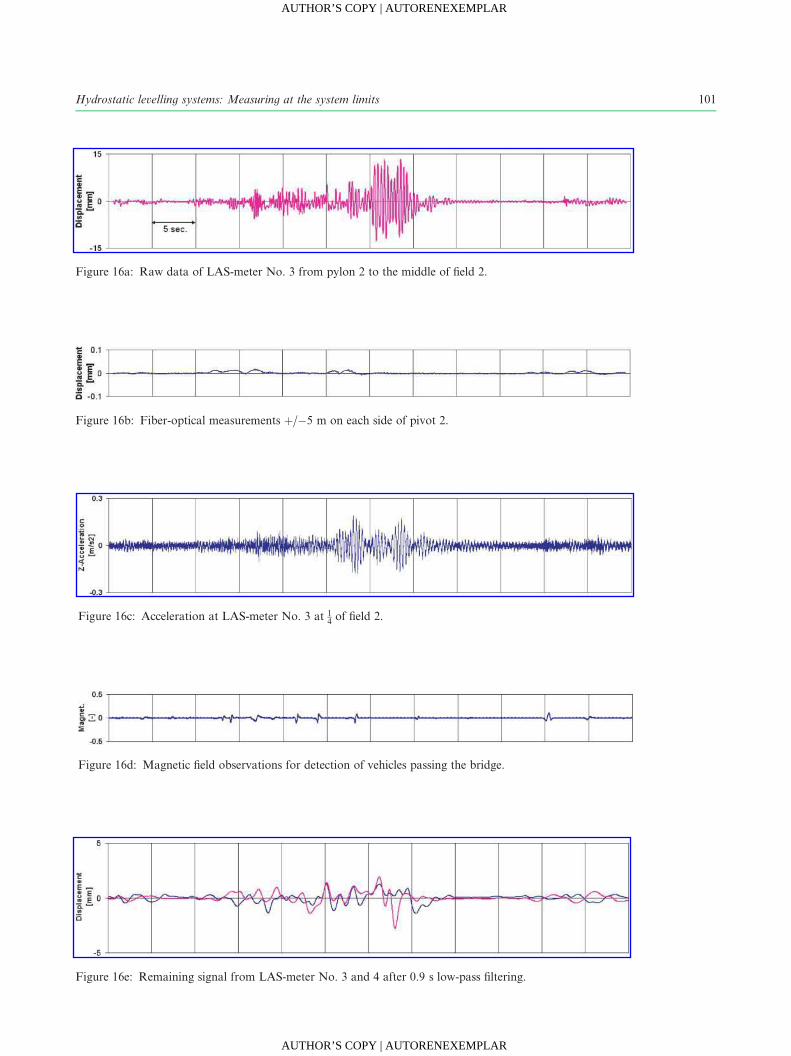
Figure 16a: Raw data of LAS-meter No. 3 from pylon 2 to the middle of field 2.
Figure 16b: Fiber-optical measurements þ/�5 m on each side of pivot 2.
Figure 16c: Acceleration at LAS-meter No. 3 at 14 of field 2.
Figure 16d: Magnetic field observations for detection of vehicles passing the bridge.
Figure 16e: Remaining signal from LAS-meter No. 3 and 4 after 0.9 s low-pass filtering.
101Hydrostatic levelling systems: Measuring at the system limits
AUTHOR’S COPY | AUTORENEXEMPLAR
AUTHOR’S COPY | AUTORENEXEMPLAR

system experiences acceleration along the measure-ment tube, this acceleration overlays the wanted sig-nal and feigns a height variation of the liquid vessel.If the frequency of the acceleration is clearly higherthan the one of the wanted signal, the LAS systemcan nevertheless be used. Two sets of informationcan even be obtained from the same instrument ifthe disturbed LAS signal is both low- and high-passfiltered: low-pass filtering of the raw signal yields thevertical movement, while high-pass filtering gives thelongitudinal acceleration.
The measurements described in this paper are a firstattempt to assess the errors sources of hydrostaticmeasurement systems in motion. To be able todraw also quantitative conclusions, additional mea-surements with multiple comparative systems, suchas high-resolution acceleration sensors and Broad-Band Seismometers, are necessary.
References
[1] Ingensand, H. and Meier, E. (2001): Neuere Entwicklungen von
hydrostatischen Messsystemen fur permanente Uberwachungs-
messung. 11. Internationale Geodatische Woche, 18.–24.2.2001,
Obergurgl, in Proceedings des Instituts fur Geodasie, Insbruck:
Institutsmittteilungen Heft 19, 191–194.
[2] Meier, E., Huggenberger, P. and Ingensand, H. (1998): Precision
monitoring of displacement over large areas, Hydropower &
Dams, Commission 5, Issue Six, 77–88.
[3] Meier, E. and Ingensand, H. (1998): A multipoint hydrostatic
system for permanent deformation monitoring, International
Federation of Surveyors, XXI Congress Brighton, Commission
5, 369–381.
[4] Steiger, A., Licht, H. and Zwyssig, R. (2009): Nationalstrasse
A2/3 – Larmschutz und Instandstellung Ri‰g-Reussegg, Aus-
wertung der Kontrollmessungen, Bericht Nr. 10.106-018, Ingen-
ieurgemeinschaft Kompetenz Emmen.
[5] Wei, F. Q., Meier, E., Rivkin, L. and Wrulich, A. (2004): Data
analysis of SLS hydrostatic levelling system in 2003, PSI Scien-
tific and Technical Reports 2003, vol. 6, 26–27.
Received: Apr 30, 2010 Accepted: July 7, 2010
Author information
Edi Meier, Alain Geiger, Hilmar Ingensand, Hans Licht,
Philippe Limpach, Andreas Steiger and Roger Zwyssig
Edi Meierþ Partner AG
Geophysical and Geotechnical Engineering
Technopark2 Winterthur
Jagerstrasse 2
8406 Winterthur, Switzerland
E-mail: [email protected]
102 Edi Meier, et al.
AUTHOR’S COPY | AUTORENEXEMPLAR
AUTHOR’S COPY | AUTORENEXEMPLAR