hyperion financial managementdbmanagement.info/books/mix/hfm_student_reference_manual.pdfhyperion...
TRANSCRIPT

Hyperion Financial Management
Developed in Partnership with and based on work by
Eric Erikson, 123OLAP
Hyperion Financial Management


HYPERION FINANCIAL MANAGEMENT 11.1.1
IMPLEMENTATION BOOT CAMP
Copyright Notice Copyright 2009 Oracle Corporation All rights reserved. Based upon the copyrighted works of: 123OLAP P.O. Box 459 Plymouth CA 95669 No portion of this document may be reproduced or transmitted in any form or by any means, electronic or mechanical, including photocopying, recording, or information storage and retrieval systems, for any purpose other than the purchaser’s personal use, without the express written permission of Oracle Corporation.
Trademarks
Windows/Windows 2000/Windows XP, and Microsoft Office are trademarks of Microsoft Corporation.
Excel, Windows/Windows 2000/Windows XP, and Microsoft Office are products of Microsoft Corporation. Essbase is a registered trademark of Oracle. Other product names mentioned in this document may be trademarks or registered trademarks of their respective companies and are hereby acknowledged. Disclaimer
The information in this document is subject to change without notice. Neither Oracle Corporation nor 123 OLAP shall be liable for errors contained herein or consequential damages in connection with the furnishing, performance, or use of this material.


TABLE OF CONTENTS
Introduction About the Author ........................................................................................ 1
Chapter 1 - Overview of Oracle Hyperion Financial Management
Financial Reporting .......................................................................................................... 1-2
HFM Structure and Design ............................................................................................. 1-2
What is a Dimension? ........................................................................................................... 1-2
Members ............................................................................................................................... 1-4
Hierarchies - The Family Tree .............................................................................................. 1-5
Point of View ......................................................................................................................... 1-5
Drilling Up and Down a Dimension ....................................................................................... 1-6
Oracle EPM .......................................................................................................................... 1-6
HFM Server Architecture ................................................................................................ 1-6
Summary ............................................................................................................................... 1-7
Chapter 2a – Creating Applications – Profile and Metadata - Classic
Application Profile ......................................................................................................... 2a-1
Creating the Application ............................................................................................... 2a-4
Managing Metadata ........................................................................................................ 2a-5
Loading and Extracting Metadata ............................................................................. 2a-9
Accounts .......................................................................................................................... 2a-10
Application Settings ..................................................................................................... 2a-12
Consolidation Methods ............................................................................................... 2a-14
Currencies ....................................................................................................................... 2a-15
Custom 1-4 ...................................................................................................................... 2a-15

Entity ................................................................................................................................. 2a-17
Scenario ........................................................................................................................... 2a-18
Organization by Period ................................................................................................ 2a-19
Putting Everything Together ..................................................................................... 2a-20
Summary ........................................................................................................................... 2a-21
Chapter 2b – EPM Architect EPMA vs Classic ............................................................................................................. 2b-2
EPMA Components .......................................................................................................... 2b-2
Dimension Maintenance ............................................................................................... 2b-3
Accessing EPMA .............................................................................................................. 2b-3
Application Maintenance ............................................................................................ 2b-10
Application Deployment .............................................................................................. 2b-13
Data Synchronization ................................................................................................... 2b-13
Application Upgrade..................................................................................................... 2b-17
Task Automation ........................................................................................................... 2b-18
Summary ........................................................................................................................... 2b-19
Chapter 3 – Data Loading The Native Format ............................................................................................................ 3-1
Data Loading Alternatives ............................................................................................. 3-6
Data Extracting Alternatives ...................................................................................... 3-11
Copying and Clearing Data .......................................................................................... 3-13
Summary ............................................................................................................................. 3-15
Chapter 4 – HFM Rules The Basics ........................................................................................................................... 4-1
Grouping Rules - Subroutines ....................................................................................... 4-2
Function and Dimension Syntax .................................................................................. 4-3
Variables .............................................................................................................................. 4-3
Restricting When Rules Run.......................................................................................... 4-4

Common Calculations ..................................................................................................... 4-7
Functions – Repeating Code........................................................................................ 4-11
Easy Performance Improvement – With HS ........................................................... 4-11
Calculating Manager ...................................................................................................... 4-12
Summary ............................................................................................................................. 4-12
Chapter 5 – Creating and Building Lists Member Lists ...................................................................................................................... 5-1
Creating Lists ..................................................................................................................... 5-1
Loading and Extracting Lists ........................................................................................ 5-3
Summary ............................................................................................................................... 5-4
Chapter 6 – Shared Services Security Basics .................................................................................................................. 6-1
Provisioning Users and Groups .................................................................................... 6-2
Creating and Assigning Classes .................................................................................. 6-5
The Other Way (for Classic Applications) ................................................................ 6-8
Organizing the Design .................................................................................................... 6-9
Summary ............................................................................................................................. 6-10
Lifecycle Management ................................................................................................. 6-10
Shared Services – Other Features ............................................................................ 6-12
Chapter 7 – HFM Administrative Stuff HFM Copy Application – Classic Only......................................................................... 7-1
HFM Utilities ....................................................................................................................... 7-7
HFM Administration ....................................................................................................... 7-10
System Messages ........................................................................................................... 7-10
Task and Data Audit ...................................................................................................... 7-11
Task Automation ............................................................................................................. 7-13
Other Administration Menu Items ............................................................................. 7-16
Process Control and Validations ............................................................................... 7-16

Creating Data Entry Forms .......................................................................................... 7-19
HFM User Group .............................................................................................................. 7-24
Typical Administrator Life ........................................................................................... 7-25
Chapter 8 – HFM End User Basics Logging In and Logging Out .......................................................................................... 8-1
Tasklists ............................................................................................................................... 8-3
Creating Tasklists ............................................................................................................... 8-4
Adding and Saving Tasklists .............................................................................................. 8-5
Data Grids ............................................................................................................................ 8-6
Creating a Grid ................................................................................................................... 8-6
Modifying the Layout .......................................................................................................... 8-7
Member Selections ............................................................................................................. 8-8
Mulitple Member Selections for Rows and Columns .......................................... 8-10
Working With Data Grids ............................................................................................... 8-12
Grid Background Colors ................................................................................................... 8-13
Common Data Grids ......................................................................................................... 8-14
Data Entry - Multiple Ways ........................................................................................... 8-14
Data Entry Forms ............................................................................................................ 8-15
Journals .............................................................................................................................. 8-16
Journals Overview ............................................................................................................ 8-16
Creating Journals ............................................................................................................. 8-17
Journal Templates ............................................................................................................ 8-20
Chapter 9 – HFM End User Next Steps Intercompany Reporting – Some Background ......................................................... 9-1
Running an Intercompany Report ............................................................................... 9-2
Creating/Modifying an Intercompany Report........................................................... 9-6
Process Control ................................................................................................................. 9-7

Chapter 10 – HFM End User Reporting Running Reports .............................................................................................................. 10-1
Hyperion Smart View for Microsoft Office ............................................................. 10-4
Smart View Functions for Microsoft Excel ............................................................ 10-6
HFM Forms within Microsoft Excel ........................................................................... 10-8
Ad Hoc Analysis .............................................................................................................. 10-8
Opening Reports in Microsoft Office ...................................................................... 10-10
Using Smart Tags .......................................................................................................... 10-12
Chapter 11 – Financial Reporting Studio
Laying Out a Report........................................................................................................ 11-3
Selecting Members ......................................................................................................... 11-6
Adding, Removing,and Moving Member Selections ........................................................... 11-7
Prompts and Current Point of View .................................................................................... 11-7
Placing Selections into Separate Rows .............................................................................. 11-8
Relationship Function Selections........................................................................................ 11-8
Relationship Function Alternatives ................................................................................... 11-10
Advanced Selections ........................................................................................................ 11-11
Lists Tab ........................................................................................................................... 11-12
Editing Selections Manually .............................................................................................. 11-12
Limiting the Point of View Selections ................................................................................ 11-13
Additional Rows/Columns ................................................................................................. 11-14
Previewing the Report ................................................................................................. 11-15
Saving a Report .............................................................................................................. 11-15
Page Dimension ............................................................................................................. 11-16
Text Rows/Columns within Grids ...................................................................................... 11-22
Inserting Functions ........................................................................................................... 11-23
Formulas ........................................................................................................................... 11-29
Charting ............................................................................................................................ 11-31
Chart Layout ..................................................................................................................... 11-32
Types of Charts................................................................................................................. 11-32
Chart Properties ................................................................................................................ 11-33

Chapter 12 – Workspace Reporting Workspace ......................................................................................................................... 12-2
Logging into Workspace ..................................................................................................... 12-2
Books ................................................................................................................................... 12-7
Creating Books ................................................................................................................... 12-8
Deleting Reports from a Book ........................................................................................... 12-10
Selecting Members for Books ........................................................................................... 12-10
Previewing Books ............................................................................................................. 12-12
Saving Books .................................................................................................................... 12-14
Book Setup ....................................................................................................................... 12-15
Batches ............................................................................................................................. 12-16
Scheduling Batches .......................................................................................................... 12-18
Batch Scheduler ............................................................................................................... 12-22
Canceling Batches............................................................................................................ 12-24
Batch Outputs ................................................................................................................... 12-24
Snapshots ........................................................................................................................ 12-26
Assigning Access to Snapshots ....................................................................................... 12-27
Batch Comman Line Processing .............................................................................. 12-28

About the Author
The contents of this course are based on the work of Eric Erikson
Eric Erikson is a Hyperion Certified Professional™ in Hyperion Financial Management and Hyperion Enterprise. With experience working with Hyperion Enterprise since 1993 and Hyperion Financial Management since 2000, he has been exposed to hundreds of consolidation and reporting applications for a wide variety of industries. Eric’s broad consulting background includes working for Hyperion Solutions for several years and a large Hyperion partner for three. While at Hyperion Eric began working with Hyperion Financial Management before its commercial release. His technical skills encompass all aspects of implementing these products. Eric is an active CPA licensed by the state of North Carolina and has MS and BSBA degrees in Accounting from Appalachian State University.
Introduction
I

I-2

1 - 1
Copyright 2009 www.123olap.com
Overview of Oracle Hyperion Financial Management
he focus of this Chapter is to review Oracle Hyperion Financial Management (“HFM”) and understand the dimensional concepts. The first step is to frame where HFM fits into an organization. Next is explanation of some key concepts of HFM
such as the application structure and design, dimensions and attributes, the hierarchical relationships and terminology used throughout the product. We’ll finish up by talking about the Hyperion product family and HFM’s server architecture. By the end of this chapter students have the background necessary for the remainder of the course.
Chapter
1 T

EPM Financial Management© Chapter 1: Overview
1 - 2
Copyright 2009 www.123olap.com
Financial Reporting Financial reporting, at its core, is about creating balance sheet, profit and loss, cash flow, and accompanying reports for a business. While there are many differences from one company to another, there are many similarities. Many of these similarities are determined by GAAP – generally accepted accounting principles. For example, year to date net income should be added to a company’s retained earnings balance.
To provide the ability to report, companies use one or more chart of accounts to categorize the data in their general ledger. Some accounts may have additional detail, like a list of states/provinces for sales tax or a product family for revenue accounts.
Companies also have an organizational structure. This could be by legal entity, by cost center, by manager, or a combination. For each entity a set of reports is required.
For a few companies the reporting for the overall company is a simple matter of adding the accounts together across the organizational units. Usually, however, there are additional tasks, such as currency translation or eliminating any intercompany balances or ownerships.
Along with consolidating the data, the data must be controlled. Approval of journal entries, electronic certification, and controlled access (who can see what and when) are all features that accountants and auditors expect from a consolidation system.
HFM is Oracle’s module for financial consolidation. The product was built with web deployment and support for hundreds of users. Its predecessors extend back into the early 1980s when a company called IMRS developed and marketed a DOS product called Micro Control. In 1991 the next generation product, with a Windows interface and file storage intended for a file server, was released. Initially this product was called Hyperion; later the company changed its name from IMRS to Hyperion and changed the product name to Enterprise. HFM is the latest in this line, being released in 2000. While each product improves on its predecessor in terms of functionality and architecture, some features conceptually work the same way, as some basic accounting principles have not changed in that time!
HFM Structure and Design Data in HFM is stored across a number of dimensions.
What is a Dimension? Dimensions are parameters or pointers to an amount. Each amount placed into HFM will have 12 dimensions defining the reference point for that amount.
The Basic Six…
Consider this sentence for an example of the basic six: Actual Net Income for Total Company in June 2009 on a Year to Date basis was 100. In this sentence there are 6 dimensions:

EPM Financial Management© Chapter 1: Overview
1 - 3
Copyright 2009 www.123olap.com
From the example… What this is / other choices might have been
In HFM the dimension is called …
Actual Type of data Budget, Forecast
Scenario
Net Income Account Total Assets, Sales, Taxes
Account
Total Company Organizational Unit Division, Cost Center
Entity
June Time Period Quarter1, Week1
Period
2008 Calendar or Fiscal Year 2002, 2007, 2020
Year
Year to Date View Periodic, Quarter to Date
View
The Next Five – Account Details…
There are five other dimensions that relate specifically to detail in the chart of accounts. The first of the five is Intercompany Partner. If division A is booking intercompany sales with division B, for instance, the account would be intercompany sales and the ICP dimension would indicate that the sale was to B. For non-intercompany accounts, the partner is simply [ICP None].
The other four are optional (each company specifies which to use and how) and can provide a great deal of flexibility. Called Custom Dimensions, they allow for a greater level of detail and can be used differently across accounts. For example, Sales may be reported by state, customer, product, and sales rep; whereas Salaries may be reported by state and job grade. If the application is designed appropriately, the states can be shared in both cases.
By having the ICP and custom dimensions reporting is easier and much more flexible than if the detail was just stored in multiple accounts. Maintenance is also easier – in the state example above, a new state would only need to be added once to the custom dimension vs. twice (once for the sales account and once for the salaries account) and would apply to all accounts to which the custom dimension is assigned.
The Twelfth – Consolidation Detail…
The last dimension is a bit different from the others in that it is not something that is based within the company’s operations (like accounts, entities, products, etc.). The Value dimension is used to show the detail of the consolidation of data from a member in the entity dimension to its parent. There are various details available, like before and after currency translation and before and after intercompany eliminations. Also, journal adjustments are segregated from data loaded from the general ledger or other data sources. Data starts at the bottom, works its way up the Value dimension to the parent entity where, after added together with the data from the other children of the parent, the new data starts at the bottom again. Note: more about the “children” and “parent” references below.

EPM Financial Management© Chapter 1: Overview
1 - 4
Copyright 2009 www.123olap.com
The member labels and the hierarchy for the Value dimension are predetermined.
The Value dimension looks as shown to the left. The members in < > are specific to the entity, regardless of the parent. The [ ] members represent a combination of the parent and entity. Data from a single entity can consolidate differently based upon the designated parent. A parent entity is the sum of its children’s [Contribution Total] members. This sum feeds into <Entity Currency> at the parent and the process starts over from the bottom.
The commonly used ones are:
<Entity Currency> Data loaded from the general ledger or manual input <Entity Curr Adjs> Local currency journal adjustments <Entity Curr Total> Sum of the first two <Parent Currency> <Entity Curr Total> after currency translation <Parent Curr Adjs> Translated currency journal adjustments <Parent Curr Total> Sum of the previous two [Proportion] Data after translation and ownership calculations [Elimination] Intercompany and other eliminations – note this member ONLY shows the elimination entries, not the full balances. [Contribution] Usually the final amounts going from the entity to its parent.
Members Members in HFM are the unique elements making up a dimension. Some sort of text or numeric descriptor defines every member. This is referred to as a label. For example, in a customer dimension, unique customer names or numbers may define the hierarchy of that dimension. Each of these is a member. In addition, the regions that the customers may belong to (the groupings) are also members. In other words, members are all the elements that define the hierarchy of a dimension. It is important to understand that member names must be unique in HFM within a dimension. For example, Cash in Bank and Petty Cash cannot both be labeled as account 100.

EPM Financial Management© Chapter 1: Overview
1 - 5
Copyright 2009 www.123olap.com
Depending on the dimension there are various attributes or details that the system stores and provides different functionality accordingly. The most common attribute is description, like the description for account 100 might be “Cash.”
Hierarchies - The Family Tree Hmmm….. What were those “children” and “parent” references about?
Dimensions have a natural hierarchy associated with them. As an example, think of a company that has sales offices in their entity dimension. The lowest level of members would be the sales office: Charlotte, Omaha, San Jose. The level above that may be a region: East, Midwest, and West. The top level may be the country. Each lower level of the dimension is more specific. In HFM terms the sales offices are children of the regions and the regions are parents of the sales offices.
Another example: this time using the Account dimension. Total Assets may be made of Current Assets and Long Term Assets. Under Current Assets are Cash, Accounts Receivable, and Prepaids.
Any member that does not have a child – the lowest level – is called a base level member. The hierarchy provides multiple benefits. First, the hierarchy defines the rollup. To the right, the children of Current Assets are added together. If there was a liability account among the asset accounts, like Allowance for Doubtful Accounts, HFM would pick that up (account type is one of the attributes for accounts) and do the correct math. Also, the hierarchy allows for easy report writing, like “Children of Current Assets.” The advantage here is that if another child is added later, like Inventory, then the report picks it up automatically. The third advantage is for drilldowns, meaning a user can look at Current Assets and then click and see the detail underneath.
There may be multiple hierarchies within a dimension. Entities are typically rolled up based on a legal hierarchy, a management hierarchy, and others. Accounts may be rolled together differently for US GAAP vs. IFRS reporting. The key thing is that base level data is stored once. Members can roll into multiple parents for as many types of reporting as needed. Dimension members are either base level members or they are parent level members.
Point of View When looking for a specific amount in HFM, all 12 dimensions are required (the custom dimensions, if not needed, use [None] as the default member similar to the ICP dimension using [ICP None]). The point of view is the specification of each member for the 12 dimensions. Another way to say it is that the point of view is what the user wants to see, like Year to Date Actual Net Income for Total Company in June 2009.

EPM Financial Management© Chapter 1: Overview
1 - 6
Copyright 2009 www.123olap.com
Drilling Up and Down a Dimension Since the dimensions are organized with hierarchies, users can navigate in HFM by drilling down (zooming in) the hierarchy or by drilling up (zooming out). This makes building reports intuitive as you navigate the natural structure of each dimension.
Oracle EPM HFM is the lead Financial Reporting & Compliance product in the Oracle Enterprise Performance Management, Fusion Edition suite. The below diagram shows the major components of the suite: HFM is the main “Financial Reporting and Compliance” component.
HFM Server Architecture HFM was designed to support any number of users that a company would have involved in month-end consolidation and reporting. There are multiple logical layers that can grow as needs warrant.
• End users – end users connect via a web browser or Microsoft Office • Web layer – the web layer provides the web content to end users • Application layer – the application layer contains all of the intelligence and performs
all of the processing for HFM • Database layer – the database layer stores the data, metadata, web components, etc. in
a relational database

EPM Financial Management© Chapter 1: Overview
1 - 7
Copyright 2009 www.123olap.com
For a small implementation, the web and application layers may reside on one physical server. As the implementation size increases, these layers are first separated to different physical servers and then additional servers are added to each layer.
Summary HFM has 12 dimensions that are used to store the amounts. Each dimension is made of members, some of which are base level members. Members are organized hierarchically with children rolling into one or more parents. The point of view is the specification by the user of the data that they want to see. HFM is part of a broader suite and is architected to accommodate different numbers of users.

EPM Financial Management© Chapter 1: Overview
1 - 8
Copyright 2009 www.123olap.com

2a - 1
Copyright 2009 www.123olap.com
Creating Applications – Profile and Metadata - Classic
he focus of this Chapter is to review how to create and build applications using the “classic” method. The first part is creating the profile, which defines the Year, Period, and View dimensions along with languages. The other dimensions, currencies, and
application settings follow. Throughout are performance considerations to effect an efficient design.
Application Profile The application profile is the first piece to be created. The profile defines the years, periods, and views available in the application. These items cannot be changed once the application has been created – to change something, the admin will need to recreate the application and reload everything. Profiles are created in the Windows client. From the left frame, select Define Application Profile. The interface pops up with icons across the top to guide the admin in the required steps.
Chapter
2a T

EPM Financial Management© Chapter 2a: Creating Applications
2a - 2
Copyright 2009 www.123olap.com
Languages – HFM can store descriptions for entities, accounts, etc. for up to 10 languages. Users select which they prefer. Generally add the languages that will likely be used, even if the language will not be used soon.
The third screen is Define Calendar. This window sets up the time periods that will be available. If using a standard monthly/quarterly calendar, the left side has selections to quickly build the calendar. If something different is needed, the right hand side is used to establish the base periods and a prefix if desired. The default is to number the custom periods sequentially: this can be changed on a later screen. At the bottom is the starting year and number of years to be available.

EPM Financial Management© Chapter 2a: Creating Applications
2a - 3
Copyright 2009 www.123olap.com
When thinking of the start year, think of the history to be loaded. In addition, a previous year to that may be needed to provide ending balance sheet balances. For the number of years, consider the number of years the application will be used before business requirements call for a complete rebuild. If long range planning is being considered, then more years may be needed. Setting the number at 15 to 20 is common.
Most applications have months as the lowest period. If a greater frequency is being considered, like weekly, then consideration should be given to the importance of the data and whether it should be in a different application or even a different Hyperion tool like Essbase. HFM builds tables within the database to store data and columns are created for all periods whether used or not – if the profile has weeks and a scenario is created that only specifies monthly data, the table will still have fields for the weeks. These extra fields adversely impact performance; however, the impact may be negligible for smaller applications or immaterial if the frequent data is required.
To give a sense of how performance decreases as periods are added, a data record with monthly periods consumes about 120 bytes of memory. Going to weekly data, the same record consumes about 480 bytes. A daily data record consumes about 3,300 bytes. The more memory consumed by each record means that fewer records can be loaded into memory at any one time, which is important for consolidations and reporting. The fourth screen is for the View dimension. Each period level, like Year, Quarter, Month, needs a view member. Descriptions can be provided in each language.
EPM Financial Management© Chapter 2a: Creating Applications
2a - 4
Copyright 2009 www.123olap.com
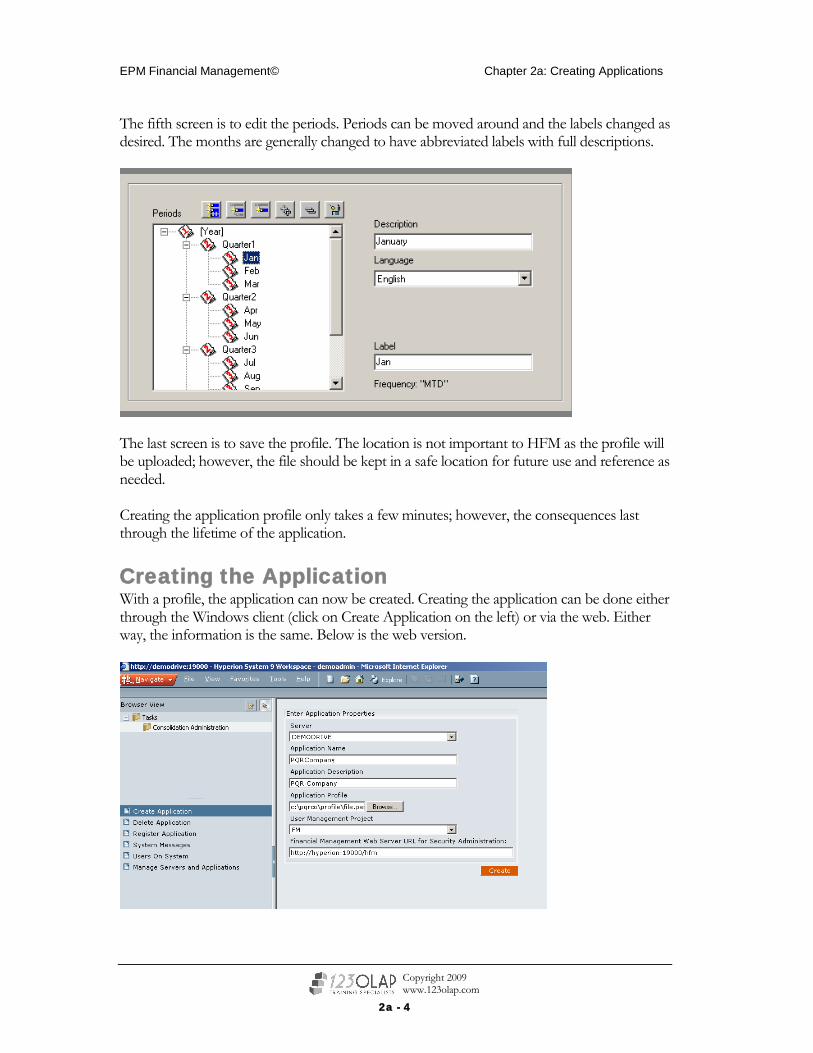
The fifth screen is to edit the periods. Periods can be moved around and the labels changed as desired. The months are generally changed to have abbreviated labels with full descriptions.
The last screen is to save the profile. The location is not important to HFM as the profile will be uploaded; however, the file should be kept in a safe location for future use and reference as needed. Creating the application profile only takes a few minutes; however, the consequences last through the lifetime of the application.
Creating the Application With a profile, the application can now be created. Creating the application can be done either through the Windows client (click on Create Application on the left) or via the web. Either way, the information is the same. Below is the web version.

EPM Financial Management© Chapter 2a: Creating Applications
2a - 5
Copyright 2009 www.123olap.com
To reach this screen, log into the Workspace. From the Navigate menu select Administer, Classic Application Administration, Consolidation Administration. Then, on the left side of the resulting window click on Create Application. Fill in the information and click Create. Application labels cannot start with a number and are limited to 10 characters. See the help guide for more information. The Financial Management Web Server URL will typically use port 19000 and end with /hfm. If the user management project is blank then that will need to be created first within Shared Services. The Year, Period, and View dimensions will be created. The value dimension is built in. The remaining dimensions as well as some settings remain to be done. Also, the user who created the application has been provisioned in security to be the administrator, but no one else has access.
Managing Metadata This section focuses on building the entities, accounts, custom dimensions, scenarios, currencies and application settings. Some of these only take a few minutes (ie, currencies) – some take longer. There are some basic concepts that work for all dimensions and will be covered first. Specific information will follow for each item: commonly used attributes and design and performance considerations. Working with metadata can be done in a few different ways. This chapter will cover two – the Metadata Manager way and the Notepad way. There are a couple of other methods not covered here – EPM Architect and Data Relationship Management. Metadata Manager is part of the HFM Windows client. It provides an interface for building and maintaining the dimensions. It is best used for small amounts of initial entry or changes. Working with Notepad or another text editor, large scale changes can be made – this method is preferred for the initial build (like converting an existing 2,000 member chart of accounts into HFM).

EPM Financial Management© Chapter 2a: Creating Applications
2a - 6
Copyright 2009 www.123olap.com
Working with Metadata Manager
The HFM Windows client is Windows software that has to be installed on the computer. This is the same Windows client where the profile is created. On the left are various tasks. The task involved here is Manage Metadata. The screen above shows an entity structure. For Corporate, the highlighted entity, attributes are shown on the right. At the bottom are tabs for Tree View (currently displayed) and List View (shows everything in a table – good for sorting and making more medium scale changes).

EPM Financial Management© Chapter 2a: Creating Applications
2a - 7
Copyright 2009 www.123olap.com
Going back to the tree hierarchy tab, new items can be added either as a child of the highlighted member or as a sibling by clicking on the appropriate arrow directly above the hierarchy. The items in the hierarchy can be reordered by clicking the blue/black arrows directly above and to the right of the hierarchy. Items can also be moved simply by dragging them.
TIP – in Tree view, to copy an item, press and hold Control and Shift and then click the item, drag, let go of the mouse, then let go of the keys.
Switch from one dimension to another with the Metadata Item dropdown at the top. Use the Save File button to save changes.
When making major changes a new version of the file should be created. This allows the application to be reloaded with the original version.
When saving, the default filename is the originally opened file, EVEN IF IT HAS ALREADY BEEN SAVED AS SOMETHING ELSE. Be careful not to overwrite the original version.
Working with the Text File There are two file types from which to select when saving files. The first is XML – the regular type. The second is APP – this file type saves the metadata in a format that can be used in Notepad and other text editors. Below is the entity hierarchy above in the text format. The fields are delimited by semicolons; therefore, it is best NOT to use semicolons in labels and descriptions. Each dimension will be listed in the file like below in two sections – members and hierarchies.

EPM Financial Management© Chapter 2a: Creating Applications
2a - 8
Copyright 2009 www.123olap.com
Typical initial implementations have a phase where the existing chart of accounts and entity structure are downloaded into text files and reformatted into this format. Much better than keying everything in! The two formats can be used interchangeably. The Metadata Manager can open and save either format. HFM can load and extract either format. Within each dimension can be multiple hierarchies. A company may have an internal entity structure and an external one. In both cases the base or lowest level members should be the same: just different parents. For application efficiency there are two tenets to follow:
• Parents should have more than one child. It is inefficient for the system to add up data from a single child to a parent. The common exception to this is with entities when the currency changes – in the example above, Canada_USD is in US Dollars and Canada is in Canadian Dollars. HFM doesn’t need this for translation and the same currency reporting can still be done, but it is usually easier for the users to think about it with two entities.
• When parts of two hierarchies have identical children, use the same parent both places instead of two separate parents. The system will have to calculate the parent only once vs. twice. Keep in mind that changes to the parent on one hierarchy will show up on the other – it is the same parent. When discrete differences are needed, create the second parent.
When adding to an existing metadata file, do not make a base level member into a parent unless the metadata has not been loaded into the application. In order to perform this change, HFM will have to clear all data – typically not the best thing to do.
Loading and Extracting Metadata The metadata file, in either format, can be loaded into HFM via the web or the Windows client. Below is the screen from the Windows client – the web interface has the same options.

EPM Financial Management© Chapter 2a: Creating Applications
2a - 9
Copyright 2009 www.123olap.com
Click on the search icon to find the metadata file. A log file will be filled in – this will contain any errors – and is usually the same folder and filename with a LOG extension. The load method specifies whether to merge or replace. If doing deletes or moves of members a replace has to be done in order to effect the change. Below that are choices for which dimensions to load. At the bottom of the screen is the Load button to start the load. The scan button checks the metadata file for most errors. In practice administrators typically extract all metadata options into a single file, make the changes, and then do Replace loads. Checking the “Clear All Metadata Before Loading” and then clicking Load will generate this message:
Basically doing this means that everything has to be reloaded – it is not typically used. Extracting metadata provides choices for the file location and filename and the dimensions to be included. The rest of the chapter addresses specific metadata items as listed in the Metadata Manager, reviewing the most commonly used attributes and design and performance considerations.

EPM Financial Management© Chapter 2a: Creating Applications
2a - 10
Copyright 2009 www.123olap.com
Accounts
Commonly Used Attributes When building the chart of accounts there are several attributes that are commonly used. This list is not inclusive of all attributes and does not cover all capabilities of HFM. There are also application design considerations that may differ from the information below. Label The member name. For this dimension it typically works best if the
base level financial accounts are numeric (like on the general ledger) and the parent, statistical, exchange rate, etc. accounts are alphanumeric. Proper case (like CurrentAssets) works better than all caps (CURRENTASSETS) due to the web interface – people are used to proper case. Spaces in the label are not typical, although allowed.
Description Description that will show on reports, spreadsheets, data views within HFM, etc. Proper case works best.
Account Type Most accounts will be flagged Asset, Liability, Revenue, Expense. Other types are Balance and Flow (work like Asset and Expense but do not translate), Dynamic (see the Rules chapter), Currencyrate (exchange rates), and GroupLabel (does not store data but used for organizational purposes).
IsCalculated Prevents input into an account that is calculated. Note – an account can be calculated but not flagged as such. Any data loaded or manually entered will be replaced by the calculated number. Exception to use: when an account is calculated for one scenario, year, etc. but not another. To prevent any misunderstanding, use a NoInput rule to block data entry into the calculated scenario, year, etc.

EPM Financial Management© Chapter 2a: Creating Applications
2a - 11
Copyright 2009 www.123olap.com
IsConsolidated Used on most accounts. Exceptions include ratio accounts. IsICP Enables the use of the ICP dimension to store detail, typically for
intercompany elimination – DOES NOT ENABLE ELIMINATION, but is the first step. There are three choices: N for no, Y for yes, and R for yes AND an entity cannot use itself as the ICP.
PlugAcct Enables intercompany elimination on the account by specifying where to place the surviving amount. Accounts that should match against one another should all use the same plug. Intercompany relationships should all use unique plugs. More on intercompany elimination in the end user section.
C1-4TopMember Specifies whether the account uses the custom dimension and what part of it. For example, the Sales and Cost of Sales accounts may enter a Custom1 member called TotalProducts, but the balance sheet and operating expense accounts would not.
UserDefined1-3 3 fields that can be used for creating lists, restricting calculations, etc. SecurityClass A link to security if to be used for the dimension. Typically exchange
rate accounts are secured to limit input to a few individuals. EnableDataAudit Keeps track of changes to data. Used in conjunction with a setting in
the Scenario dimension. Typically enabled for all base level accounts. CalcAttribute An explanation of the calculation behind an account (not the
calculation itself). Can also be used for comment on account usage. SubmissionGroup Used in process control if more than one group will be used. For
example, the first group of accounts to be signed off could be the financials and the second group could be the supplemental data.
Design and Performance Considerations When building the account dimension, the recommended maximum number of account levels is 13 or fewer. Also remember the two tenets above about metadata: no parent with just one child and no parents with identical children. All parent accounts are calculated when the scenario, year, entity, and value dimension combination (called a subcube) is opened in memory, whether they are needed or not for the particular report, view, calculation, etc. It is best to control the parents to what is needed. However, this statement should not discourage admins from using the capabilities – if three different account hierarchies are needed to meet reporting needs then by all means create them. For contra accounts, like accumulated depreciation, there are two choices:
• Flag the account the same type as the regular account and load the data as negative • Flag the account the opposite type as the regular account and load the data as positive
Either choice will provide the same result – the difference is how numbers are presented in the reports. The desired presentation dictates the correct choice.
EPM Financial Management© Chapter 2a: Creating Applications
2a - 12
Copyright 2009 www.123olap.com
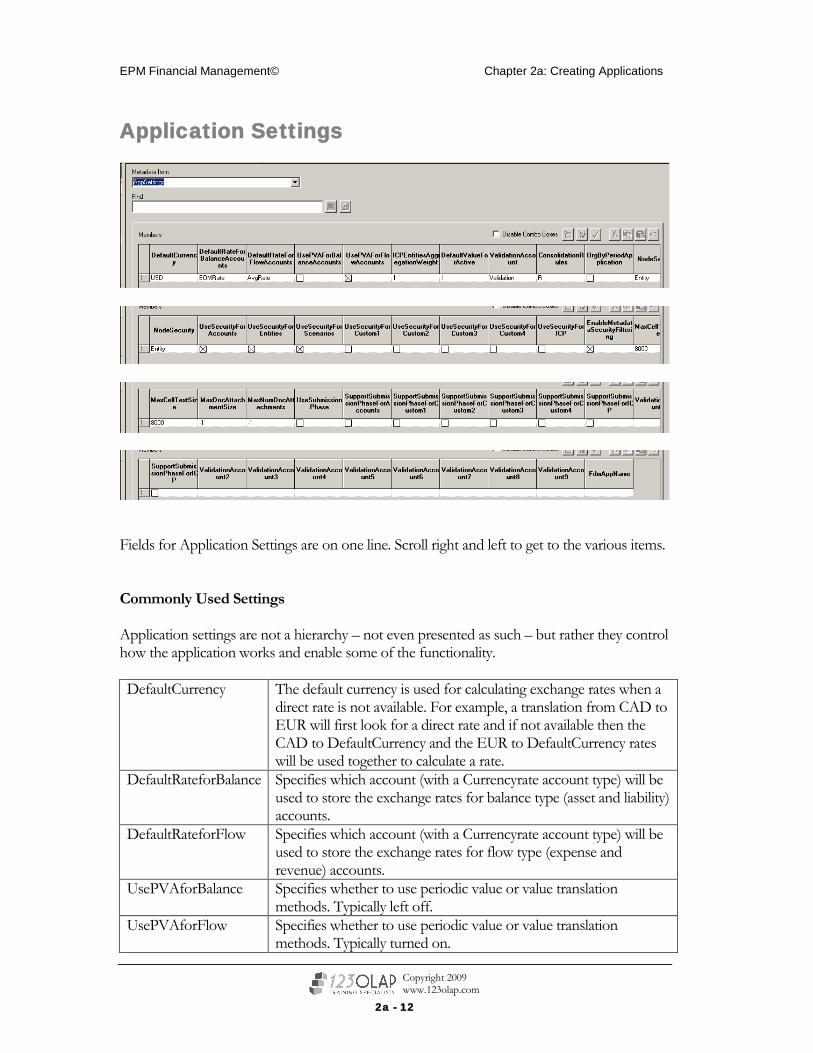
Application Settings
Fields for Application Settings are on one line. Scroll right and left to get to the various items. Commonly Used Settings Application settings are not a hierarchy – not even presented as such – but rather they control how the application works and enable some of the functionality. DefaultCurrency The default currency is used for calculating exchange rates when a
direct rate is not available. For example, a translation from CAD to EUR will first look for a direct rate and if not available then the CAD to DefaultCurrency and the EUR to DefaultCurrency rates will be used together to calculate a rate.
DefaultRateforBalance Specifies which account (with a Currencyrate account type) will be used to store the exchange rates for balance type (asset and liability) accounts.
DefaultRateforFlow Specifies which account (with a Currencyrate account type) will be used to store the exchange rates for flow type (expense and revenue) accounts.
UsePVAforBalance Specifies whether to use periodic value or value translation methods. Typically left off.
UsePVAforFlow Specifies whether to use periodic value or value translation methods. Typically turned on.

EPM Financial Management© Chapter 2a: Creating Applications
2a - 13
Copyright 2009 www.123olap.com
ValidationAccount Specifies the account that should be zero before end users can promote the entity in process control. Typically this is a parent account with the various edits (ie, balance sheet in balance, comments provided for budget variances, etc.) below it. If using multiple process control phases then this will be the first phase.
ConsolidationRules Enables admin created consolidation rules (ownership and elimination) or to use the default process. Generally this setting, even if doing the standard ownership and elimination, will slightly slow down consolidation time, so only enable if something special is to be used (ie, discontinued operations or changes to intercompany elimination process). A third choice is R, meaning use the standard ownership and elimination but calculate the Proportion value member. This setting can provide a performance benefit to many applications if consolidation rules are not needed.
OrgByPeriod Allows the entity hierarchy to vary from one scenario/year/period to another. For example, DivisionA may roll to Region1 for Actual, 2008, January but roll to Region2 for Actual, 2008, February. In Metadata Manager DivisionA will appear to roll to both places but will only be active as listed. If this function is not needed on a regular basis (there are ways to handle exceptions) it is best to leave off.
UseSecurityFor… Specifies whether security is to be used for a dimension. EnableMetadata SecurityFiltering
If an end user does not have access to a member, should they see that it exists or not. Typically enabled to shorten the hierarchies for users to page or scroll through.
UseSubmissionPhases Enables the use of more than one submission phase for process control. Along with this are settings for the customs dimensions and multiple validation account settings.
FDMAppName Specifies the FDM application associated with the application. Can be used in data grids to link back to the source data loaded via FDM.
Design and Performance Considerations The big choices here are using consolidation rules and org by period. Both add flexibility and functionality, but there are performance and maintenance considerations. Consolidation rules, as a rule of thumb, add about 5% to the consolidation time even when doing the standard consolidation (equivalent to HFM not using consolidation rules). Organization by period introduces another level of maintenance and system usage: tracking when entities are active or inactive for each parent. A following section of this chapter provides more information on organization by period. Despite these considerations, consolidation rules and organization by period are powerful features that should be used when required.

EPM Financial Management© Chapter 2a: Creating Applications
2a - 14
Copyright 2009 www.123olap.com
Consolidation Methods Commonly Used Settings Consolidation methods are used to provide settings for various types of consolidation that address various ownership requirements. The methods listed here are assigned to entities and then can be referenced in a consolidation rule to perform the desired aggregation.

EPM Financial Management© Chapter 2a: Creating Applications
2a - 15
Copyright 2009 www.123olap.com
Currencies
Commonly Used Settings List the currencies needed in the application. There are only a few options. Scale Can be useful if scaling the exchange rate is needed. Must be set to
at least zero (units) if scaling is not to be used (cannot be blank). TranslationOperator Multiply or divide – which way are the rates stated? Like CAD to
USD or USD to CAD.
Custom1-4

EPM Financial Management© Chapter 2a: Creating Applications
2a - 16
Copyright 2009 www.123olap.com
Commonly Used Settings Custom dimensions provide additional detail to accounts. Any particular dimension can be reused across accounts. For example, part of custom1 may be used for product detail on the sales accounts and another part used by balance sheet accounts for movement detail. The switch to enable any part of a custom dimension for an account is in the account attributes – CustomXTopMember. Customs may also be used by more than one account, like Custom2 might have a list of states that are both used for sales and fixed assets. IsCalculated Useful for when one member is calculated and another is not. The
IsCalc flag on the account should be off as there is input to at least one custom member. An example of this might be for cash flow accounts where there is a calculation of the line item in one custom member and another member allows for adjustment to the calculated result.
SwitchSignforFlow Have a custom member work like a liability when attached to an asset account, for example. Good for movement detail schedules when positive numbers are desired.
SwitchTypeforFlow Have a custom member work like an expense account (having periodic vs. YTD amounts) when attached to balance sheet type account. Also good for movement schedules.
AggrWeight This attribute is not on the main attribute tab – go to the Node Attribute tab to see this. Normally this is 1, meaning to add the numbers to the parent custom member. There are instances where this is not desired. For example, Custom1 is used for products and the top member is Products. Under Products are two hierarchies of Products, ProdFactory and ProdFamily. The numbers at these two members are the same. One of these would have an aggregation weight set to 0 so that the Products member can also be used as a top member. While a little redundant, its easier for the users.
Design and Performance Considerations Parent custom members are only calculated when they are asked for, so the depth of the dimension, number of parents, etc. does not really matter. Also, the order doesn’t matter. The largest custom dimension could be 1 or 4 or whatever. Typically the most frequently used dimension is placed in custom 1, then 2, etc. This works well with the point of view bar – not having to scroll all the way to the right to get to custom 4 unless needed. If a lot of accounts are sharing a lot of customs then some thought into the arrangement is needed so that everything can be shared adequately. No need to have states listed in both custom 1 and custom 2, for example. It is important to remember that the customs are four per account. A sales account can have four customs assigned to it and a cash account can have four different customs assigned to it. This flexibility in detail meets most needs for financial consolidation.

EPM Financial Management© Chapter 2a: Creating Applications
2a - 17
Copyright 2009 www.123olap.com
If the number of customs is not enough, the solution required is more likely to be Hyperion Essbase. Like if a company is analyzing sales, billings, bookings, and backlog by time, scenario, entity, product, sales rep, geography, customer, and factory/supplier, then Hyperion Essbase is the better tool as this level of detail is moving beyond financial consolidation into operational analysis.
Entity
Commonly Used Settings Entities represent the organizational units of the business. Typically there are multiple rollups, all sharing the same base level members. DefCurrency Specifies the currency of the incoming data. AllowAdjs Whether the entity may be used in a journal. Typically all base level
entities are enabled. Parent entities may be enabled as well, but this functionality can be confusing to users – must use the value dimension to get to the adjusted data – and should be enabled only when required. The alternative is to create a base entity below the parent, like TotCoAdjustment, and place the topside adjustments there.
IsICP Enables the entity to be used as a partner for intercompany balances. The entity must be flagged to be listed in the ICP dimension. Parent entities can and are usually flagged (ie, a division knows it has intercompany with Italy but not which one of the 30 cost centers under Italy); however, some undesired results can occur when using multiple rollups and the parent is not on every rollup (the data will never be matched and thus not eliminate).
SecurityClass Commonly used to restrict access to entities to only those users who need them. Generally grouped by division as opposed to having a class for each specific entity.

EPM Financial Management© Chapter 2a: Creating Applications
2a - 18
Copyright 2009 www.123olap.com
DefaultParent Specifies which parent to drill UP to when using Web Analysis and an entity rolls to multiple parents. As Web Analysis is not used by all HFM clients, it can be more of a nuisance than useful, as a change of the entity’s parent may require this to be updated (and its commonly forgotten). When in doubt, and Web Analysis is not used, then it can always be left blank.
Design and Performance Considerations The two basic tenets strongly apply here: no parent with just one child and no parents with identical children. As mentioned earlier, the one exception may be when the currency changes. While the currency change can also be reported with the Value dimension vs. a separate entity, users can have trouble with this approach and a parent here and there can be added for convenience. The maximum number of children under a parent entity varies based on the number of data records in the children. Note this relates to direct children, not descendants. The total number of records of the children at the [Contribution Total] value member should be kept under 1,500,000 – this number is based upon the usage of memory on the HFM server. As a practical threshold, any parent entity with more than 200 children should be examined.
Scenario

EPM Financial Management© Chapter 2a: Creating Applications
2a - 19
Copyright 2009 www.123olap.com
Commonly Used Settings Scenarios represent types of data: actual, budget, forecast. DefaultFreq Specifies the lowest level of detail from the Period
dimension. This is typically monthly. DefaultView Specifies the default view – periodic, YTD. Users can
change using the point of view. Typically set to YTD. ZeroViewforAdj/NonAdj Specifies how to handle periods when no data has been
provided. Using YTD will instruct HFM to treat no data as an YTD date zero, meaning the periodic view will show a negative of the previous period’s YTD value. Typically this is set the same as the DefaultView.
SupportsProcessManagement MaximumReviewLevel
Used in conjunction with the Process Control (signoff and promotion) process. “A” enables the email capability.
UsesLineItems HFM has the ability to store detail below an account level. Called line item detail, this feature allows for users to input detail. For example, in an account called Travel, users may input Airfare, Hotel, Rental Car, etc. Special reporting functions are available to see the LID, but comparison reporting is not as robust as normal. Useful for budget input but not typically used for Actuals.
EnableDataAudit Keeps track of changes to data by user, date, dimensions. Always used for Actual, optionally used for the other scenarios. “Y” enables all accounts, “O” enables only those flagged in the Account dimension.
Design and Performance Considerations The key thing with scenarios is the frequency – how many periods. This is in conjunction with the profile as described above. Scenarios are best used to segregate data when all else stays the same. Actual, Budget, and multiple Forecast scenarios are common.
Organization by Period For the Entity dimension there is a capability called Organization by Period. Depending on the needs of the company the entity dimension can be controlled by scenario, year, and period. For example members A, B, and C need to roll up to Parent X for Actual, January, 2008 but in February its only A and B that roll to the parent and C rolls to Parent Y.
To accomplish this, the setting is enabled in Application Settings within metadata. Next, the entity dimension is structured accordingly. In the example above, C would be under BOTH Parent X and Parent Y. Within the application a switch – a “system” account called Active – is used to indicate whether the entity is active for the scenario/year/period/parent or not. The DefaultValueForActive within Application Settings provides a default value for use when a value is not provided.

EPM Financial Management© Chapter 2a: Creating Applications
2a - 20
Copyright 2009 www.123olap.com
The Ownership Management screen within HFM can be used to modify the switch. Also, the switches can be extracted, modified, and loaded in the same process as regular data. Below is an example of the screen – the Active switch is the first column and can be changed by clicking an item and choosing Yes or No from the dropdown. Note the other columns relate to consolidation methods and ownership control – these come into play during consolidation.
Putting Everything Together When loaded, the pieces all need to be there; i.e., an entity with a currency of CAD needs to have the CAD currency on the list of currencies. During the initial building of the application, elements can be revisited later. Security is commonly put in place toward the end of the implementation. One key thing to remember is that base members cannot later become parents. If a member will eventually have some children, create a parent member and add the one child now and add the other children later (a temporary exception to the rule). But if the data is at a stage where it is not loaded or can easily be reloaded then it doesn’t matter. The initial build works best when working with the text file format and reformatting a chart of accounts, an entity hierarchy, or a list of products into the correct format. Some things, such as currencies and the application settings, are easy enough to key in. Also, the initial build can be split among multiple people and then the text files put together into one. When creating labels, use of consistent abbreviations is recommended; for example, “Int” might always be Interest, not Intercompany or Investment or Inventory. The length of the labels should also be considered: not too short that no one knows what they are but not too long that a lot of typing and scrolling is required.

EPM Financial Management© Chapter 2a: Creating Applications
2a - 21
Copyright 2009 www.123olap.com
Summary Metadata is collection of members in most of the dimensions that point to a data amount. Multiple hierarchies are available as well as many different consolidation features. Much of an application design session will focus on what should be in the metadata and which features should be utilized.

EPM Financial Management© Chapter 2a: Creating Applications
2a - 22
Copyright 2009 www.123olap.com

2b - 1
Copyright 2009 www.123olap.com
EPM Architect Managing Hierarchies with EPM Architect
PM Architect was introduced in System 9.3 and is the future direction for managing metadata across all the Hyperion products. It is accessed through the Workspace client and it allows developers to manage the hierarchies either manually or through
automation using interface tables or flat files.
An informal survey of Oracle and partner HFM consultants in October 2008 showed that most consultants are still using the Classic method for metadata management. Part of this bias is related to the relative “newness” of EPMA. With the 11.1 Fusion release, new customers should consider using EPMA. Existing customers upgrading to 11.1 should stay with the Classic method.
This chapter begins with the pros and cons of EPMA. Next is how to create dimensions manually and manage them in EPMA. Next is how to import dimensions using flat files and/or interface tables, including setting up profiles. Last is deploying the dimensions to applications.
Chapter
2b E

EPM Financial Management© Chapter 2b: EPM Architect
2b - 2
Copyright 2009 www.123olap.com
EPMA vs. Classic EPM Architect was introduced in System 9.3 and offers developers a different tool for administering and managing databases for HFM. Developers must choose between legacy HFM, or “Classic,” and managing databases through EPMA. Most of this course has been geared towards the legacy HFM administration as general usage by the consulting community has shown that EPMA is generally preferred. This chapter introduces EPMA for knowledge and possible future use but first we outline some of the advantages and disadvantages to each approach:
Classic Advantages • Stability. Been around for several years (since the initial product release). • Less of a learning curve for existing HFM customers – for existing clients upgrading,
remaining on legacy means there is simply less to learn/change/test as EPMA introduces a new paradigm in database management.
Classic Disadvantages
• Development will not focus as much attention on Legacy as on EPMA. Hyperion sees EPMA as the future so we can expect less focus on the legacy HFM administration in the future in the way of new features. This has already been seen with 11.1 and Calculation Manager.
EPMA Advantages • Architecture. EPMA provides a web based solution that does not require an installation
on the local PCs. • Hierarchy maintenance across Hyperion products. Once a dimension has been built in
EPMA it can be used within HFM, Planning, or Essbase. This may make metadata/outline synchronization across products much simpler in the future.
EPMA Disadvantages
• Instability. As of 11.1, this product is essentially a Version 2 product. So, expect some buggy behavior. This behavior has been confirmed even in version 11.1.1. In the field there has been more instability seen with Planning than there has been with HFM.
EPMA Components The following components make up EPMA. These components are accessed via the Workspace from the Navigate, Administer menu. Each of these will be covered in more detail.

EPM Financial Management© Chapter 2b: EPM Architect
2b - 3
Copyright 2009 www.123olap.com
Dimension Library – Contains dimensions and associated members that are either shared (available for all applications) or local (unique to a specific application).
Application Library – Contains and defines applications for the various products in the Hyperion suite.
Data Synchronization – Defines and controls syncing of data from one application to another, including dimension to dimension linking and member mapping.
Application Upgrade – Converts a “classic” application into an EPMA application. To be used only once per application.
Dimension Maintenance This next section shows the mechanics of working in EPMA. This is meant as an introduction to working within the EPMA Library especially for dimensions where little automation will be needed. In general, these are smaller, fixed dimensions that do not change frequently. Good examples of these dimensions are Scenario, Versions, Time Periods, and Years. In a later section, we will show how maintenance is done on larger dimensions using interface tables and flat file uploads.
Accessing EPMA EPMA is accessed through the Workspace client. Login to Workspace and select the Navigate>Administer>Dimension Library menu option as shown here:

EPM Financial Management© Chapter 2b: EPM Architect
2b - 4
Copyright 2009 www.123olap.com
The following tab is displayed within Workspace:
Note there are two types of dimensions: shared and local. Shared dimensions are available for all applications and local relate to a specific application only. The above screenshot shows local dimensions within the TOTCONSOL application. This feature has several applications. For example, a HFM application and a Planning application may share a chart of accounts: when a new account is added to the GL it should also be added to both applications. However, the Planning application may need a set of accounts that are planned for the next year but are not desired in HFM as of yet. Using a shared account dimension for the current accounts and a local account dimension for the next year accounts Planning would have the complete chart whereas HFM would just have the shared component.
New dimensions can be added by going to the File menu and selecting New, Dimension.

EPM Financial Management© Chapter 2b: EPM Architect
2b - 5
Copyright 2009 www.123olap.com
When adding a dimension a prompt will appear for the dimension type. Dimension types in EPMA allow you to set specific properties for members dependent on the type of dimension being added. Here is a brief description of these:
Account –All HFM applications must contain an Accounts type dimension. Usually represents the chart of accounts.
Entity – Typically the organization structure. Entities are required in HFM.
Period – Time periods down to the required level: typically monthly in HFM models. This dimension is required for HFM. You must set properties that specify what the base levels.
Year – Year is simply a listing of years in a flat dimension structure and is required for deploying a View to HFM.
Scenario – This is another required dimension for HFM. Specify the periods for each member.
View – Examples periodic, quarter-to-date, and year-to-date.
Intercompany Partner – The list of entities that are allowed to be partners in intercompany balances.
Value – The Value dimension is used to show the detail of the consolidation of data from a member in the entity dimension to its parent. There are various details available, like before and after currency translation and before and after intercompany eliminations.
HFM applications require the following dimensions: Period, Year, Entity, Account, Scenario, View and Value. Typical HFM applications will also have a couple of additional custom or Generic dimensions associated with them.

EPM Financial Management© Chapter 2b: EPM Architect
2b - 6
Copyright 2009 www.123olap.com
Once dimensions are added, right clicking them will provide a menu of various choices, including moving the dimension between shared and local.
As members are added to the dimension, the property pane on the right will change to show the allowable attributes. These are similar to the metadata attributes within a Classic application.
The category dropdown at the top switches between application types, like from Consolidation to Planning or Essbase.
Adding and renaming members is accomplished via the right click menu shown above. Note the choices will change slightly depending on the highlighted member. There are two options for deleting: delete and remove. Delete erases the member from EPMA. Remove takes the member out of the hierarchy and places it in an “orphaned” state.

EPM Financial Management© Chapter 2b: EPM Architect
2b - 7
Copyright 2009 www.123olap.com
Dimensions may be edited one member at a time as shown above or edited as a group. The Grid Editor allows for selection of dimension members into rows and properties into columns. This view allows for quicker editing when changing fields for multiple, existing members. To reach the Grid Editor, right click any item with Dimension Library and select Grid Editor. Select the members and properties (move them to the right hand side of the screen) and click Finish. The result will look like the below screen.
Dimensions may also be uploaded instead of manually entered. First a profile must be established to guide EPMA how to process the import. Next, there are two methods of importing dimensions: flat file and interface tables.
To create the profile, select File, Import, Create Profile.

EPM Financial Management© Chapter 2b: EPM Architect
2b - 8
Copyright 2009 www.123olap.com
Next, complete the screen to name the profile and to specify a sample file. The sample file will be used to build the profile.
The resulting three screens will define how the fields in the file are delimited, how the dimensions in the file relate to the shared or local dimensions in EPMA, and how the dimension properties in the file map to EPMA. Once set up this profile can be used for future imports.
The flat file option allows for a text file with the dimension(s), their members and the attributes of each member to be uploaded. The format is documented in the help – below is a sample file. Note that the typical file extension is .ADS.

EPM Financial Management© Chapter 2b: EPM Architect
2b - 9
Copyright 2009 www.123olap.com
Note that the languages available for the descriptions are handled by another dimension, Alias.
There is no capability within the software to export a file; however, there is a separate utility that will do this. It is installed with the software and shows on the Start menu as Start EPMA File Generator. Once launched, the screen below appears.
Click the appropriate tab at the top, fill in the fields, and then click Execute.
The status of the export will show below. There is a help file associated with this utility, also available from the Start menu in the same folder.

EPM Financial Management© Chapter 2b: EPM Architect
2b - 10
Copyright 2009 www.123olap.com
The interface tables are used to set up a link to external sources for the metadata. Typically these external sources are within a relational database and can be a general ledger, data mart, etc. The setup of the connection is done within the EPM System Configurator, also used to install and configure all of the other parts of the Hyperion suite.
Once set up, the dimension data is brought in via the File, Import menu. A clear interface table option also exists under the Import menu to clear the tables as needed.
Application Maintenance This next section focuses on the applications. Once the dimensions are defined, an application can be created, dimensions assigned, and deployed.
The application area is accessed by Navigate, Administer, Application Library. Once there, a list of existing applications will be shown.
To create a new application, select the File, New, Application menu option.

EPM Financial Management© Chapter 2b: EPM Architect
2b - 11
Copyright 2009 www.123olap.com
Follow the prompts to create the application. On the first screen name the application and specify the type (Consolidation is HFM). If creating a blank application, check the box and then click Finish at the bottom. This is used if dimensions, etc. will be added to the application manually. Checking the Auto Create box will fill in the second screen automatically. If not checked then the second screen must be completed manually.
On the second screen, specify whether dimensions should come from the shared library or are local. Shared dimensions can be created if needed by clicking on the appropriate [Select] and choosing new dimension.

EPM Financial Management© Chapter 2b: EPM Architect
2b - 12
Copyright 2009 www.123olap.com
Click Next to get to the third screen and specify the application settings. If there is some trouble getting to this screen, a workaround is to create a blank application (in step 1) and add the settings and the dimensions later. A partial list of the application settings are below and are the same as the application settings in Classic.

EPM Financial Management© Chapter 2b: EPM Architect
2b - 13
Copyright 2009 www.123olap.com
Application Deployment Once the application has been created and the dimensions provided, the application must be deployed. The process of deployment creates the application within the specified product. Once deployed, applications will need more development: web forms, security provisioning, etc. Deployment is also needed when dimensions have been edited (new members, etc.).
To deploy the application, right click the application in Application Library and select Deploy. Complete the fields and click Deploy.
Data Synchronization With multiple applications, whether HFM, Planning, etc., there is usually a need to move data from one application to another. If both applications are not EPMA, this is done via one of the methods discussed in Chp 3. If both applications are EPMA, then data synchronization may be used. This tool allows for application data to be copied with mapping in between.
To access the module, log into Workspace and from Navigate select Administer, Data Synchronization. Once there, the screen will be blank unless something has been established. From the File menu, select New, then there are multiple choices.

EPM Financial Management© Chapter 2b: EPM Architect
2b - 14
Copyright 2009 www.123olap.com
The Synchronization option is the first place to start if going between applications. If using an external file or a data interface table then the last two choices on the menu are the first places to start. Each choice will open a wizard to go through the steps.
The first screen on Synchronization will ask for the type. If the lower two choices are selected, the next screen asks for the item created in the menus above.

EPM Financial Management© Chapter 2b: EPM Architect
2b - 15
Copyright 2009 www.123olap.com
With the application choice, the wizard asks for source and destination applications and then presents the following screen.
The software matches the dimensions where possible. Lines can be extended (by click and drag) to match additional dimensions, like mapping Custom1 to Channels. Right clicking a line opens a menu allowing for the removal of the link or to define mapping.
Mappings can be added if the dimension members are not the same. Mappings can be one for one and can also be many to one through the use of wildcards. The common wildcard choices are * to match one or more characters, ? to match a single character, and ~ to indicate a range. Other choices are listed in the help.

EPM Financial Management© Chapter 2b: EPM Architect
2b - 16
Copyright 2009 www.123olap.com
Once the mapping is created then the mapping is validated to ensure all destination members are valid. If the mapping is incorrect go back and address and revalidate.
The mapping must be valid before the mapping table can be saved.
Returning to the application to application screen above, the link will now be a dashed line to indicate there is a mapping.
Once created, use the disk icon on the toolbar to save the synchronization. Also the synchronization may be validated and executed from the toolbar with the other icons.
The initial blank screen when launching Data Synchronization now shows two items: a mapping and a synchronization.

EPM Financial Management© Chapter 2b: EPM Architect
2b - 17
Copyright 2009 www.123olap.com
Each item can be highlighted and right-clicked to open a menu of appropriate choices.
Application Upgrade For customers with an existing Classic application, there is an upgrade utility that converts the Classic application to an EPMA application. Note that this conversion is a one time procedure and cannot be redone.
From the Workspace click on Navigate, select Administer, then Application Upgrade.

EPM Financial Management© Chapter 2b: EPM Architect
2b - 18
Copyright 2009 www.123olap.com
A dialog box will appear that will step through the information needed to perform the upgrade. Step 2 will show the available applications and whether they can be upgraded. Step 3 is the selection and Step 4 is the confirmation before the process proceeds.
Once the application has been upgraded the application is an EPMA application – the Classic metadata management is no longer available.
Task Automation It is possible to create taskflows to synchronize dimensions across Hyperion products, to load from flat files or interface tables into EPMA and more. Task Automation is covered in Chapter 7. The key point here is that EPMA tasks may also be automated. Below is an example showing the Import Dimension from Interface Table action.

EPM Financial Management© Chapter 2b: EPM Architect
2b - 19
Copyright 2009 www.123olap.com
Summary EPMA is the next step in the evolution of metadata maintenance for the Hyperion suite. As the product matures the reliability continues to increase along with the features.

EPM Financial Management© Chapter 2b: EPM Architect
2b - 20
Copyright 2009 www.123olap.com

3-1
Copyright 2009 www.123olap.com
Data Loading
he focus of this Chapter is to review the various methods for loading data into HFM. Some time will be spent with the native load format. Next additional data load and extract methods will be discussed. Lastly, clearing and copying data will be covered.
However data is loaded, loading zeroes should be avoided. HFM treats a zero as data and makes space for it and spends time consolidating it. Within the Application Settings of metadata are settings that tell HFM what to do with “no data.” “No data” does not use system resources. Loading a zero is rarely useful and always consumes resources.
The Native Format Data can be loaded into HFM without any other mechanism. However, the file must be in a specific format. The requirement of the specific format can limit its usefulness but the administrator must know how to work with the file as there are several tasks, such as merging the data of two entities, where the native format is the best option.
This is a basic data file.
Data files can be opened in Notepad or other text editors. There is a section at the top for data and optionally one below for descriptions. The !DATA and !DESCRIPTIONS headers are required when loading those types of information. The dimensions are listed in a standard order: scenario, year, period, view, entity, value, account, icp, custom1, custom2, custom3, and custom4. There are semicolons delimiting (separating) each field.
Chapter
3 T

EPM Financial Management© Chapter 3: Data Loading
3-2
Copyright 2009 www.123olap.com
The default order can be changed by adding a !COLUMN_ORDER header to specify the desired order. Also, if a dimension is constant, a header line (like !Scenario = Actual) can be used to specify the member for the dimension and it can then be left out of the records. There is also a header available for line item detail if that is being loaded.
The native format is useful for administrators when extracting and loading existing data. One reason is for merging data. For example, Salaries and Benefits have separate accounts but the decision is made to merge the data into Salaries and delete Benefits. So, extract all data for the two accounts, use Notepad to do an Edit, Replace to change Benefits to Salaries, and reload the data (as a merge and accumulate within file – we’ll review these in a minute). Next clear the Benefits account and then delete it from the metadata.
Data Loads
To get to the data load screen, use the Browser view pane on the left to navigate to Tasks, Load Tasks, Load Data. When loading data to HFM, there are a few options to consider.

EPM Financial Management© Chapter 3: Data Loading
3-3
Copyright 2009 www.123olap.com
From this screen multiple files may be loaded at one time, each with their own load options if needed. The delimiter can be different from the standard semicolon. The load mode tells HFM the kind of data load – each has its uses.
Data Load Type What happens Uses Merge Loads data and only
replaces cells that are specifically listed in the data file
Good for data loading where existing data not being loaded should remain, like loading supplemental data after general ledger data already has been loaded
Replace by Security This is the most common data load type for end users
Deletes all data within the year, period, scenario and entity being loaded, except for accounts that user cannot modify
Users can load their data as they typically do not have modify access to all accounts (like exchange rates). Clearing the existing data ensures that any previous data that is now nonexistent doesn’t remain
Replace Deletes all data within the year, period, scenario and entity being loaded
Assumes that user can modify all accounts, which is generally not the case. Data load fails if any account cannot be modified.
Accumulate Adds the data in the file to any existing data in the system
Specific uses only, like loading the Benefits data to the Salary account, adding the new data to any existing data.
There is also an option for Accumulate within File. This is handy where there are multiple records going to the same cell. In the Salaries/Benefits example, the file should be loaded with a Merge as the data in the other accounts should remain untouched. And as there will be two numbers going to the same spot, selecting this option will tell HFM to add them together.
If using organization by period (see chapter 2a on Metadata) ownership information may also be loaded.
To ensure a specific load order, load each file one at a time vs. specifying multiple files.

EPM Financial Management© Chapter 3: Data Loading
3-4
Copyright 2009 www.123olap.com
Data Extracts
HFM creates the same format listed above when extracting data.
The choices at the bottom are to include calculated data or not (if sending data to an external source, then calculated data is probably desired; if loading back into HFM, probably not) and to extract Process Management data (this extracts the signoff level).
The primary choices to be made here are the dimensions in the point of view: scenario, year, period, entity, and account. The ICP and Customs all come along as part of the accounts – native data extracts cannot be filtered for a specific member or members of these dimensions. As shown above, choices can either be specific (Actual, 2007), a list ({[Third Generation]}, {[Base]}, or multiple selections (Account(2)). Click on any point of view dimension to open the selection box. The selections are made a variety of ways.
Extracts can only be done for a single scenario and year combination. If multiple scenarios/years are desired then multiple extracts are required.

EPM Financial Management© Chapter 3: Data Loading
3-5
Copyright 2009 www.123olap.com
To select just one member, find it and click on it. Scenarios and years can only have one selection. Period, entity, and account can have multiple – in these cases the single selection will need to clicked to be moved over to the selected values pane.
Here, a list of periods is being selected from the dropdown. Unlike specific members which are simply clicked to move over to selected values, once the list is selected the gray box to the left of the dropdown is clicked to move the list over to selected values.
To use a list on a subset of the dimension, there are three steps. Find the top member of the dimension and click on the icon to the left, turning it blue. Next select the list. Last, click the gray box. The selection will show on the right.

EPM Financial Management© Chapter 3: Data Loading
3-6
Copyright 2009 www.123olap.com
After the point of view selections are made click Extract to start the extract. The resulting screen will provide a link to click. Click on the link to save the data.
Data Loading Alternatives The native format is useful when the incoming data is in the appropriate format; however, this is generally not the case. There are multiple solutions available to meet specific needs. Below is a summary of several methods. Also, data synchronization within EPMA is an option: this item is covered in Chp 2b.
Hyperion Financial Data Quality Management
Hyperion Financial Data Quality Management (FDM) is perfect for loading multiple general ledgers into HFM. In the typical scenario, a company may have 20 subsidiaries with their own general ledger and chart of accounts. The process is for each general ledger to create a trial balance and save it as a text file. Within FDM a location for each subsidiary will be created. The text files are then mapped to the different HFM fields (ie, the first column is cost center, the second is account, and the fifth is the amount).
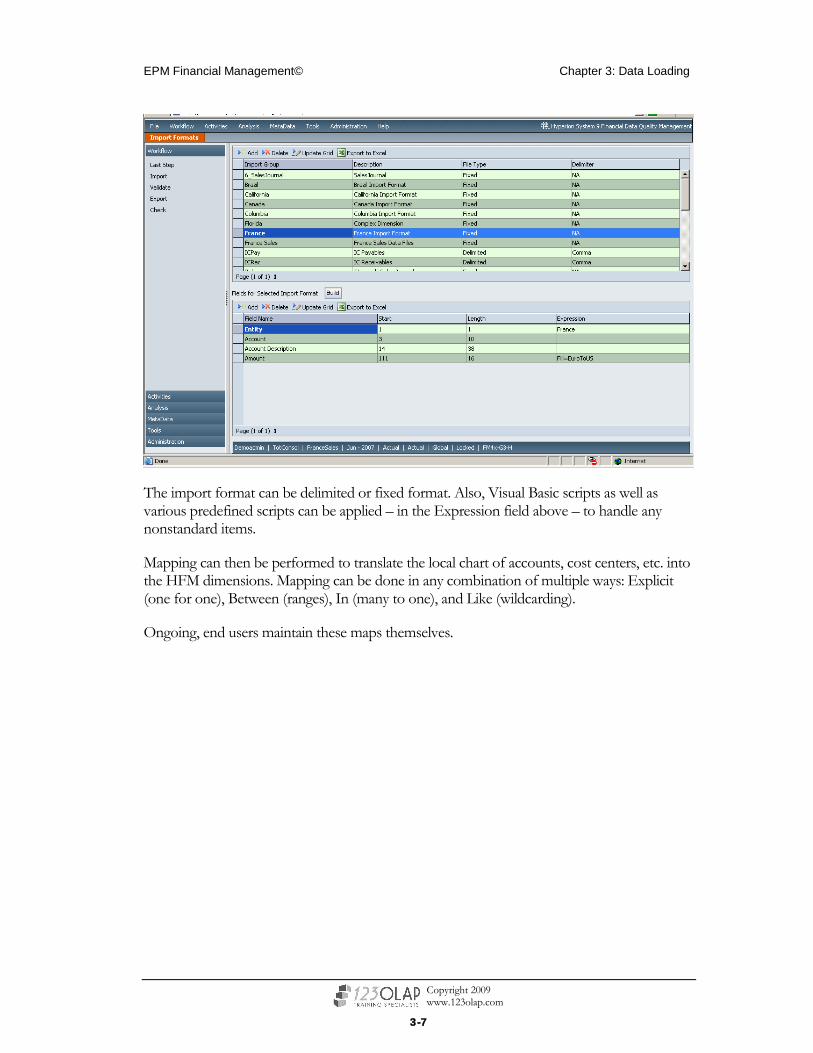
EPM Financial Management© Chapter 3: Data Loading
3-7
Copyright 2009 www.123olap.com
The import format can be delimited or fixed format. Also, Visual Basic scripts as well as various predefined scripts can be applied – in the Expression field above – to handle any nonstandard items.
Mapping can then be performed to translate the local chart of accounts, cost centers, etc. into the HFM dimensions. Mapping can be done in any combination of multiple ways: Explicit (one for one), Between (ranges), In (many to one), and Like (wildcarding).
Ongoing, end users maintain these maps themselves.

EPM Financial Management© Chapter 3: Data Loading
3-8
Copyright 2009 www.123olap.com
During the loading process the user follows a process that imports the trial balance file, applying any mapping at the same time, validates the mapped items to ensure they are valid in HFM, and exports the data to HFM. Optionally, a validation report can be produced that shows whether the data, once loaded to HFM, will be acceptable. For example, if the balance sheet will be out of balance then the load is prohibited. Also, a Sarbanes-Oxley certification questionnaire can be completed as part of the load process. Reports are available for all to run and see what mapped to where, where locations are in the process, etc.

EPM Financial Management© Chapter 3: Data Loading
3-9
Copyright 2009 www.123olap.com
A significant control problem with FDM is that users have the capability of manually changing the text files before loading. This weakness can be worked around by using a script that does an ODBC connection and extract of the data as the import step, thus eliminating the user involvement with the file.
Hyperion Data Integration Management
Hyperion Data Integration Management (DIM) built on top of Informatica’s platform for data integration. It is useful for building connections between HFM and data sources with no user involvement needed for the running. Typically set up by IT, no text file or user input is involved. It is also handy when multiple data movements are needed with reliance that the same data ends up everywhere.
FDM is useful for situations where the end users are involved in the process. After they’re closed they control the loading into HFM. DIM is useful when data movement happens on a scheduled basis or whenever requested. No files are in the middle that can be altered, eliminating the FDM problem. But DIM is a more complicated setup.

EPM Financial Management© Chapter 3: Data Loading
3-10
Copyright 2009 www.123olap.com
Oracle Data Integrator
Similar to Hyperion DIM above, Oracle Data Integrator is an IT based solution to data integration. The tool allows for data integration among many different sources.

EPM Financial Management© Chapter 3: Data Loading
3-11
Copyright 2009 www.123olap.com
Manual Input
Data can be manually entered into HFM through a couple different ways. Covered more in the end user section, the premise is that a screen is opened, users key data, and click Submit. While neither Sarbanes-Oxley friendly for financials nor very quick (imagine keying 1,000 data records without error and quickly), this process can be used acceptably for supplemental data or a very small set of financials acceptably. The manual input can also be done within Microsoft Excel and from there formulas used to push the data to HFM: the same concerns apply.
Hyperion Smart View for Microsoft Office
Smart View is covered in the End User section but listed here as a data load tool (also can do extracts). With this alternative, a template is created in Excel that users either input into or cut/paste data and Smart View formulas are used to send the data to HFM.
Data Extracting Alternatives The native data extract works fine in most instances but there are some deficiencies. Extracts cannot be limited to a specific ICP or custom dimension. Extracts are only for the <Entity Currency> value member, meaning that data net of journal adjustments or intercompany elimination data cannot be extracted. Here are some of the alternatives.
Extended Analytics
Within HFM is a module called Extended Analytics. This is used to export HFM data either into a relational database for use by other systems or into a flat file. This is accessed via the Administration menu.

EPM Financial Management© Chapter 3: Data Loading
3-12
Copyright 2009 www.123olap.com
Hyperion Smart View for Microsoft Office
Smart View is covered in the End User section but listed here as a data extract tool (also can do loads). With this alternative, there are two choices. In the first, a report or template is created in Excel that users refresh and Smart View formulas are used to pull the data to HFM. In the second, the dimensions needed are specified in the rows and columns and the ad hoc capability populates the cells with the requested data.
HFM Rule
A rule can be written within HFM to extract data into a text file. A loop basically goes through each desired member (generally a list is used) and extracts the desired data. The format can be controlled as well. A second loop can pick up the intercompany elimination entries that are made in the [Elimination] Value dimension member. A “trigger” is used to control when the extract is run – also allows for the process to be secured.
There are additional solutions for loading and extracting data that are developed, marketed, and supported by various Oracle/Hyperion partners.

EPM Financial Management© Chapter 3: Data Loading
3-13
Copyright 2009 www.123olap.com
Copying and Clearing Data Within HFM is the capability to copy and clear data. These can be reached via the Browser View by selecting Tasks, Data Tasks, then Database Management. Below is the data copy screen. Source and destination points of view are selected.
Note that the copy is only from a scenario/year/period (multiple periods may be selected) combination to another scenario/year/period (same number of periods must be selected). The entities and accounts cannot be changed (so, this capability would not have helped in the Salaries/Benefits example above).
The other options are similar to data loading. A factor can be applied to the copied data. For example, if seeding the budget scenario with expenses from actuals then a factor of .95 could be used to decrease expenses 5% across the board. A separate copy could be done for revenues with a factor of 1.1 to increase revenue by 10%. Exchange rates and cell text can optionally be copied as well.
Copy and Clear only work for the <Entity Currency> value member.

EPM Financial Management© Chapter 3: Data Loading
3-14
Copyright 2009 www.123olap.com
To clear data, click on the Clear Data tab at the top of the screen. For a selected scenario and year multiple periods, entities, and accounts may be cleared. Once the point of view is set, click Clear Data.
This functionality does not delete the journals that are posted to the entities/accounts.
What if the data to be cleared no longer is listed in the metadata?
The remaining tab at the top is called Delete Invalid Records. When members are removed from metadata and the data was not cleared first, the data is still there and this process gets rid of it. Administrators can run a scan to see what is there first before running the process for real. Below is the output of a delete – a scan looks the same except the top says “Scanning Invalid Records…”

EPM Financial Management© Chapter 3: Data Loading
3-15
Copyright 2009 www.123olap.com
Summary Data can be loaded and extracted from HFM in a variety of ways. The key is to determine the most appropriate process(es) for the company and apply them. Once data is in, HFM also provides tools for copying and deleting.

EPM Financial Management© Chapter 3: Data Loading
3-16
Copyright 2009 www.123olap.com
4-1
Copyright 2009 www.123olap.com
HFM Rules
he focus of this Chapter is to review how calculations are created and maintained in HFM. HFM uses Visual Basic script for rules. The first part of the chapter reviews the basic format and structure of the rules. Next the chapter shows various Visual
Basic techniques that can be applied. Throughout the chapter are examples of the most common rule functions and best practices on rule writing.
The Basics… Rules are written in a plain text file. The HFM Rules Editor includes integration with the application for validation purposes. Also, the functions are built in and available. Notepad and other text editors work just fine as well, and using the Administrator PDF guide is recommended to look through the functions for syntax and examples.
Refer to the below screenshot for the following. More will follow on each area.
• Rules are organized into parts called subroutines. HFM looks for specific subroutines for specific purposes. Others can be used to help organize the calculations.
• Sub Calculate and Sub Dynamic are two of the “expected” subroutines.
• Comments may be added by placing an apostrophe in front of the comment.
• TotCo is an example of a variable, which is handy for storing something once and referring to it multiple times.
• HS.Entity.Member, HS.Exp, and HS.Dynamic are HFM functions.
• An If/Then statement is the most common way of restricting when a calculation is run.
Chapter
4 T

EPM Financial Management© Chapter 4: HFM Rules
4-2
Copyright 2009 www.123olap.com
Grouping Rules – Subroutines With the subroutines there are several “special” ones that HFM looks for. These labels must only be used for the purpose intended.
• Calculate – runs whenever calculating an entity. Most rules go here. • Translate – used to translate accounts with special rates. Runs when the currency
changes from Value dimension members <Entity Curr Total> to <Parent Currency>.
• Consolidation – used to calculate ownership and eliminations when default behavior is not adequate
• Allocation – can be used to perform allocations; can also be used for other types of rules – execution is separate from the consolidation process
• Input – enables data input into parent level entities at <Entity Currency> value member – not recommended
• NoInput – disables data input into members. Strict limits on the functions that can be used.
• Dynamic – used for calculations where the result will vary based on the View dimension, like Gross Margin Percentage
• Transactions – specifies the accounts to be used in the intercompany transaction module (not covered in this class)

EPM Financial Management© Chapter 4: HFM Rules
4-3
Copyright 2009 www.123olap.com
These should be listed before any “custom” subroutines. Custom subroutines can be added for either referring to a set of lines multiple times or just for organizational purposes. In the example above Sub ABCDEF is a custom subroutine. .
Function and Dimension Syntax When referring to a dimension label, one or two characters followed by a hash or pound sign ( # ) is used to denote the dimension in which the member exists. For example A#NetIncome refers to the member NetIncome in the Account dimension. The dimension labels are:
A Account I Intercompany Partner C1 Custom1 P Period C2 Custom2 S Scenario C3 Custom3 V Value C4 Custom4 W View E Entity Y Year
Generally the HFM functions expect to have a string of text provided to them or they produce a string of text. In the example above, HS.Entity.Member produces a string of text that is the entity dimension member currently being calculated. Also in the example, the Hs.Exp function is supplied with a string of text that supplies the calculation to be performed. To denote something as a string of text vs. a function or other Visual Basic item, strings are placed in double quotes. Like:
HS.Exp “A#NetWorkingCapital = A#CurrentAssets – A#CurrentLiabilities”
When using multiple dimensions to specify a data point, use a period ( . ) to connect. The order in which dimensions are listed does not matter. For example, the following statement sets one account equal to the combination of the account, year, and period dimensions.
HS.Exp “A#BegRetEarn = A#TotRetEarn.Y#PRIOR.P#LAST”
Variables The example above is very straightforward, but not flexible. In some cases, and there are some below, a component of a calculation needs to dynamically change. Variables can be used to hold a string of text and then apply it later. Below, Total8 is a variable.
HS.Exp “A#Totalof8s = ” & Total8
Variables can be used a variety of places. One special type of variable, called a constant, is used to store a not-changing string that can be used through all rules. The idea is that the string can be written once and used throughout. If maintenance is needed then the change only needs to be made once, not every time the constant is used. The cash flow example near the end of the chapter demonstrates this technique.

EPM Financial Management© Chapter 4: HFM Rules
4-4
Copyright 2009 www.123olap.com
The ampersand ( & ) is used to concatenate variables and text strings. As HS.Exp is expecting one string to follow, the text string within the quotations and the variable are put together with the ampersand.
Restricting When Rules Run Without restrictions, all rules would run for all scenarios, years, periods, value members and entities. That would most likely produce bad results as well as slow down the application. For example, verifying that the balance sheet is in balance only needs to be done at input levels (the exception is currency translation – more on that later). Another restriction would be to calculate something differently from year to year: in 2008 the working capital calculation was changed to include long term debt, for example. Below are the most common methods used to restrict.
If / Then – the most common and straightforward. If the entity is ABC then calculate XYZ. If the equation is simple then a single line can be used; else, multiple lines can be used by adding an End If. The previous sentence also introduces the next step of If/Then – Else. These examples calculate WC and EBIT multiple ways.
Select Case – sometimes If/Thens can get stretched out a bit too far – too many criteria and ElseIfs. In those situations a Select Case works better. This example calculates the number of days in each month based upon the period number (assumes calendar fiscal year).

EPM Financial Management© Chapter 4: HFM Rules
4-5
Copyright 2009 www.123olap.com
For / Next – For/Next is used to loop through a list of items and perform something on each. This is very handy for more complex calculations. This example checks all base level accounts under NetIncome using a built in member list called [Base] and adds up (ignoring account type although that could be accomodated) the amounts from any accounts that starts with an 8. The neat thing about this calculation is that no maintenance is needed whenever an new 8 account is added – it automatically gets picked up.

EPM Financial Management© Chapter 4: HFM Rules
4-6
Copyright 2009 www.123olap.com
Custom Dimensions - Self Restricting
For accounts that have a custom dimension assignment, calculations can be written using only the custom dimension members. While seemingly opening the calculation up to all accounts, HFM only runs the calculation for accounts for which the custom members are valid.
HS.Exp “C1#OpeningBalance = C1#EndingBalance.Y#PRIOR.P#LAST”
This calculation would only run for accounts that have OpeningBalance and EndingBalance as valid Custom1 members. Note: if the custom members are assigned to thousands of accounts, this syntax, as is, may not have adequate performance. Placing the line within an For/Next loop using OpenDataUnit (more later) to define the loop may improve performance.
When to Restrict
Knowing when to restrict is as important as knowing how to do it. Basically, calculations should only run when needed. The most common restriction is to calculate things at only base level entities. Other restrictions can involve all of the other dimensions.
When using HS.Exp, the function used to calculate and store data (most commonly used function), some dimensions cannot be on the left side: Scenario, Year, Period, Entity, and Value. For example, the rule
HS.Exp “S#Budget.A#BegRetEarn = S#Actual.A#TotRetEarn.Y#PRIOR.P#LAST” has Budget on the left, which is not permitted. The proper way of doing this rule is to use an If/Then to restrict when the rule runs.
If HS.Scenario.Member = “Budget” Then HS.Exp “A#BegRetEarn = S#Actual.A#TotRetEarn.Y#PRIOR.P#LAST” End If
In the below example, the calculations in the Calculate subroutine only run for base level entities and only at Value dimension members <Entity Currency>, <Entity Curr Adjs>, or <Parent Currency>. Also, no calculations are run at [Proportion], as many applications do not require them at this level in the Value dimension, thus lowering the consolidation time a little. In the newer versions of HFM the consolidation rule setting of R in Application Settings takes care of this.

EPM Financial Management© Chapter 4: HFM Rules
4-7
Copyright 2009 www.123olap.com
Common Calculations While practically impossible to discuss every possible type of calculations, there are several basic and advanced calculations that appear in many applications. Where practical, the basic calculation is shown here with generic labels to get the idea across. Depending on the situation some tweaking may be required to the below to produce the desired results. Note: the first five are also in the above example. 1 – Opening Balances – used for movement schedules, cash flow, beginning retained earnings. PRIOR and LAST are keywords – not members – that must be capitalized. HS.Exp “A#BegRetEarn = A#TotRetEarn.Y#PRIOR.P#LAST” 2 – Year-to-date net income into retained earnings on the balance sheet. HS.Exp “A#CurrYearEarnings = A#NetIncome.W#YTD” 3 – Balance the balance sheet - good internal control and helpful before currency translation – run this calc at <Entity Currency> and any of the four adjustment Value members if used. HS.Clear “A#Balance” HS.Exp “A#Balance = A#Assets – A#LiabilitiesEquity”

EPM Financial Management© Chapter 4: HFM Rules
4-8
Copyright 2009 www.123olap.com
4 – Dollar Overrides – used as part of currency translation to hold historical rate amounts for accounts where the amount should not change, like common stock. No matter what the translated amount is, replace it with the dollar amount stored in the override account. Override accounts should be flagged with a type of BalanceRecurring so they don’t translate and so any amount entered carries forward to the end of the year. If HS.Value.IsTransCur Then HS.Exp “A#ComStock = A#ComStockOverride” 5 – Currency Translation Adjustment – same calc as balance but different target account If HS.Value.IsTransCur = True Then
HS.Clear “A#CTA” HS.Exp “A#CTA = A#Assets – A#LiabilitiesEquity”
End If 6 – Impact Status – good for causing next year to require calculation when current year data changes. This is important when data is being rolled forward (#1 above). If 2009 is recalculated then 2010 is impacted and requires recalculation. The FIRST and NEXT are not members of the period and year dimensions; they are special keywords that HFM picks up and treats accordingly – they must be uppercase. If HS.Period.IsLast and HS.Entity.IsBase Then HS.Impact.Status “P#FIRST.Y#NEXT” The HS.Period.IsLast restricts the calculation to run in only the last period of the year. If consolidation performance is an issue then comment this out and compare the consolidation times with and without and weigh the difference to the need for the control. 7 – WriteToFile – a special subroutine enabling comments to be written to a text file during rule execution. Best used by the administrator to debug new code, it can also be used to extract data into a file or create emails by writing the text file of an email into the drop box of a mail server. For the code, look in the rules file for the Comma application that is provided with the HFM client software installation in the sample applications. FYI – there are examples in the same file of many other types of calculations. 8 – Cash Flow – there are several moving parts to cash flow. Start with net income (ie, CF_NetInc = NetIncome) and then calc line items to back out non cash P&L items like depreciation. For changes in the balance sheet, compare to last year’s ending balance and do the math one way or the other based on account type. One approach is to simply list the accounts within the rule for each cash flow line item. Another approach is to use a user defined field on the balance sheet accounts to indicate which line item they impact and then use a for/next loop to cycle through them and calculate the change. Some items will need to come from movement detail, like capital expenditures – a change in fixed assets does not adequately capture capital expenditures vs. disposals, retirements, etc. The net increase in cash is then added to the opening balance. At the end is a comparison to cash on the balance sheet. Lastly is a calculation to calculate the currency translation effect within cash flow, as the ending balance will translate at the end of month rate and the cash flow line items translate at the average rate.

EPM Financial Management© Chapter 4: HFM Rules
4-9
Copyright 2009 www.123olap.com
See below for a basic cash flow example. Note that the Function code at the bottom is explained in more detail later in the chapter.
9 – NoInput – for many different reasons input may be restricted from certain cells, whether related to data conversion, new accounts active for 2010 and beyond but not earlier, etc. In this example, a NoInput rule is used to block input to the ICP dimension member [ICP None] for intercompany accounts – data in this member does not eliminate and can cause user confusion. The rule uses a dynamic account list called ICPAccountsWithPlugs – see the chapter on creating lists. This rule would be executed within the NoInput subroutine.

EPM Financial Management© Chapter 4: HFM Rules
4-10
Copyright 2009 www.123olap.com
10 – Open Data Unit. - Open Data Unit is a specific HFM function that gathers the specific records that exist for a given criteria. HFM does do a good job of knowing when to calculate (like if an account equals another and no data exists in the source account then don’t try). Sometimes though it is useful to limit the scope of a calculation to where there is actual data. For example, the example above that adds together the accounts that start with 8 might benefit from using OpenDataUnit because the rule would be limited to cycling through only records with data to look for the 8____ accounts versus cycling through all of the accounts. Below is an example of Open Data Unit being used to copy data into the current entity/scenario/year/period from another scenario.

EPM Financial Management© Chapter 4: HFM Rules
4-11
Copyright 2009 www.123olap.com
Functions – Repeating Code Functions are used to perform repetitive steps. A function differs from a subroutine in that it takes variables passed to it, performs calculations, builds a string, etc., and then returns a result back to the code that called it. A subroutine performs the actions without returning a result and is used more for organizational purposes. The above code for cash flow in #8 shows how a function works. In the example, the DFB (short for Difference From Base) function is used to repetitively build a string that is passed back to the invoking code that performs a HS.Exp calculation. The result of using the function and the variables takes the line…
HS.Exp “A#CF_AcctPay” & gCFNones & “ = ” & DFB(“AcctPay”) and when the rule is run it turns into…
HS.Exp “A#CF_AcctPay.I#[ICP None].C1#CF_Calculation.C2#[None]. C3#[None].C4#[None] = A#AcctPay.I#[ICP Top].C1#AllCustom1. C2#AllCustom2.C3#[None].C4#[None] - A#AcctPay.I#[ICP Top]. C1#AllCustom1.C2#AllCustom2.C3#[None].C4#[None].P#LAST.Y#PRIOR
The code following the equal sign (=) is generated by the function. The variables and the function not only make things much easier to read but reduce maintenance (change the variable or function once instead of each instance) and the amount of code to be written (the code in the function will execute every time the function is invoked).
Easy Performance Improvement – With HS There is another way of writing all rules above that use HS.____. The With statement tells VB Script to open the specified object and keep it open. Without With, the HS object is opened and closed each time it is used. The syntax looks like this – note the HS is removed from each HS.Exp line but the dot remains.

EPM Financial Management© Chapter 4: HFM Rules
4-12
Copyright 2009 www.123olap.com
The With must be ended with an End With. Also, the With/End With must be added to each subroutine. The results have varied but one person has reported a performance improvement of over 10% to consolidation times.
Calculation Manager With the 11.1.1 release there is a new graphical calculation manager. Calculations are written and managed via the EPM Architect interface and can be deployed to applications similar to dimensions. The VB script items above can be integrated into the graphical calculations.
In October 2008 several long-time Hyperion consulting partners reported that they had not performed any implementations of this feature at client sites; accordingly we recommend not using this feature for production use and do not include it in the course. There is documentation within the product to explain the features and usage.
Summary Rules are written in Visual Basic script to create calculations in HFM. Rules are grouped into subroutines, with HFM looking for specific ones. A modular approach – functions, variables – is recommended for repetitive components and to reduce maintenance and increase “readability.” Referring to the HFM Admin guide chapter for the rule functions and their uses as well as looking through the sample rule files for examples is very useful.

5-1
Copyright 2009 www.123olap.com
Creating Member Lists
he focus of this Chapter is to how to create and build member lists. Lists can be used for a variety of purposes.
Member Lists A member list can be created and used for a variety of activities: data extracts, data grids and forms, rules, and filtering when selecting members. Lists can be static, like accounts 100, 110, and 120, or dynamic, like all accounts that start with 1. Both have their purposes. Member lists are only created by the administrator but can be used by all users. Member lists are loaded to and extracted from HFM in the same manner as metadata and rules. Member list files typically use the .LST extension and can be edited with Notepad or other text editor. Note – changing the extension to .RLE will enable the file to be opened in the HFM Rules Editor with the proper color coding. With HFM there are some system maintained lists. These do not require maintenance and are not included in the extract/load. The names, like [Base], start and end with brackets and have common definitions when repeated across dimensions. [Base], for example, will list all of the lowest level members in each dimension (or below an optionally specified parent member). Do not create lists that start and end with brackets to avoid confusion with the system lists.
Creating Lists Member lists are written using Visual Basic techniques. There are two sections, called subroutines. The first subroutine, EnumMemberLists, defines the number of lists for each dimension and the labels for each. The second subroutine, EnumMembersInLists, defines the members (for fixed or static lists) or criteria (for dynamic lists) for each list. Below is a simple member list that defines one list for the Account dimension and one for the Entity dimension. Text preceded with an apostrophe ( ‘ ) are comments and have no effect on the code. Comments are recommended for documenting the code for both rules and lists. The screenshots are divided to separately show each of the two subroutines – these subroutines must be in the same file when loading.
Chapter
5 T

EPM Financial Management© Chapter 5: Creating Member Lists
5-2
Copyright 2009 www.123olap.com
The first subroutine has two parts. First, Dim statements are used to define arrays that will designate how many lists each dimension will have. Note: the system generated lists do not need to be included. The second part creates the names for each list. The number in parentheses will increment to add multiple labels to the array. The HS.SetMemberLists function “sets” the number of labels and label names in HFM.

EPM Financial Management© Chapter 5: Creating Member Lists
5-3
Copyright 2009 www.123olap.com
The second subroutine is used to define the members of each list. The members can either be static (like the account example below) or dynamic (like the entities).
The dynamic entity list will automatically pick up any new entities that are not USD. The fixed account list will remain the same until changed. Note there are two functions used to add members to lists: HS.AddEntityToList and HS.AddMemberToList. They do the same thing but AddEntity is for the Entity dimension and AddMember is for all other dimensions. AddEntity also allows for a specific parent to be used for the member being added. There is also a technique that can be used to build a dynamic member list that uses the user’s point of view as input. Refer to the Administrator’s Guide PDF for more information.
Loading and Extracting Lists Member lists are loaded and extracted as text files in the same manner as rules. Loading and extracting lists is a “replace all” option just like rules – the whole file must be loaded or extracted each time.
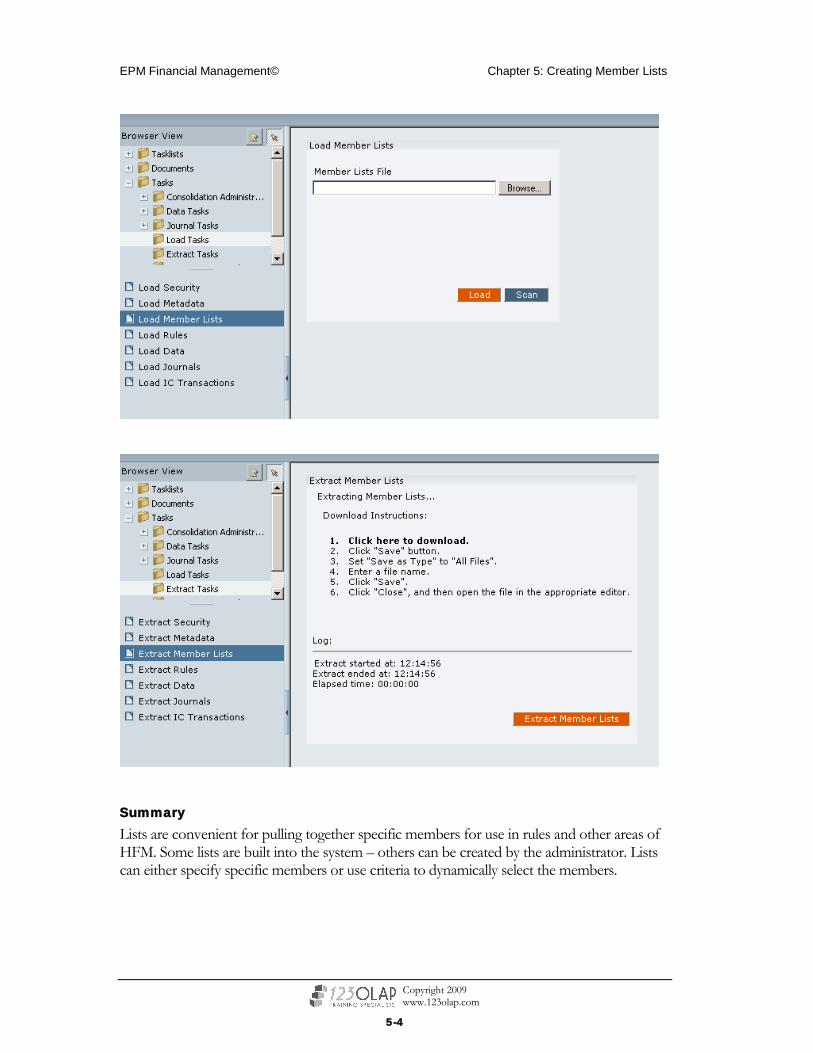
EPM Financial Management© Chapter 5: Creating Member Lists
5-4
Copyright 2009 www.123olap.com
Summary Lists are convenient for pulling together specific members for use in rules and other areas of HFM. Some lists are built into the system – others can be created by the administrator. Lists can either specify specific members or use criteria to dynamically select the members.

6 - 1
Copyright 2009 www.123olap.com
Shared Services
he focus of this Chapter is to review the main components of Shared Services. There are two main parts to Shared Services: security and lifecycle management. Security is managed within Hyperion Shared Services. The chapter discusses provisioning users
to log into the application and once they do restricting what they can or cannot do. After provisioning the chapter discusses limiting the members users can see and/or modify. Lifecycle management is a tool used to migrate items from one application to another.
Security Basics Users and Groups - Users are provisioned (meaning granted access) to the application within Hyperion Shared Services. Users are typically provisioned using their network IDs – the connection between Hyperion and the active directory or LDAP server is established during the software installation. Alternatively, IDs may be created “natively” within Shared Services. For HFM this is not recommended for production use due to Sarbanes-Oxley compliance; plus, its one more ID and password for the users to remember.
Groups can be established within Shared Services and then provisioned for access. One set of groups may control role assignments and another set of groups may control entity access – more on these below. Groups are typically created and maintained within Shared Services with the user IDs from the network being placed into the groups. Alternatively network groups can be provisioned within Shared Services; however, the Hyperion administrator will typically have no control or visibility as to who are in the groups. Also monitoring the software licenses could be impaired.
Users can either be provisioned individually or, preferably, placed into one or more groups that are then provisioned. The group method is preferred as the groups can be managed easier than hundreds of users. If a user changes departments then they can simply be moved among the groups. But if a customer has a very small user base then groups may be overkill and individual provisioning would be preferred.
Chapter
6 T

EPM Financial Management© Chapter 6: Shared Services
6 - 2
Copyright 2009 www.123olap.com
Roles – when provisioning users or groups the administrator grants specific roles to the users. For example, a user or group may be provisioned to create journals but not post them. Users are typically divided into groups based upon role that reflects both the product licensing and the controls/procedures that apply to the users.
Classes – Classes are assigned to metadata items (see the metadata chapter) and web components (grids, forms, etc.). Users/groups can then be granted various access levels to each class. If a user has no access to a class, then the user will not see any entities, accounts, grids, etc. that have been assigned the class, likewise with view and modify. For example, a group of data grids may be assigned a class that all users can view but not modify. This ensures that the grids are not changed except by those with modify access.
Provisioning Users and Groups User provisioning is performed in Shared Services. The URL will be provided from the installation. After logging in with the default ID and password, the administrators should immediately provision their own IDs to be Shared Services administrators.
The screen below shows native users (this is a demo application and not a production environment – if it were production, there would be a folder at the same level as Native Directory called MSAD or something that would connect to the network users). Right clicking opens the menu shown. Note the choices will change depending upon the logged in user and the highlighted item.
Groups are provisioned in the same manner as the user above. The administrator will create the groups and then assign users and provision them. The users within the group can be changed at any time.
To create groups, click on Groups on the left under Native Directory. To see the existing groups, click on Show All. To create a new group, click on the New icon on the toolbar (the third one).
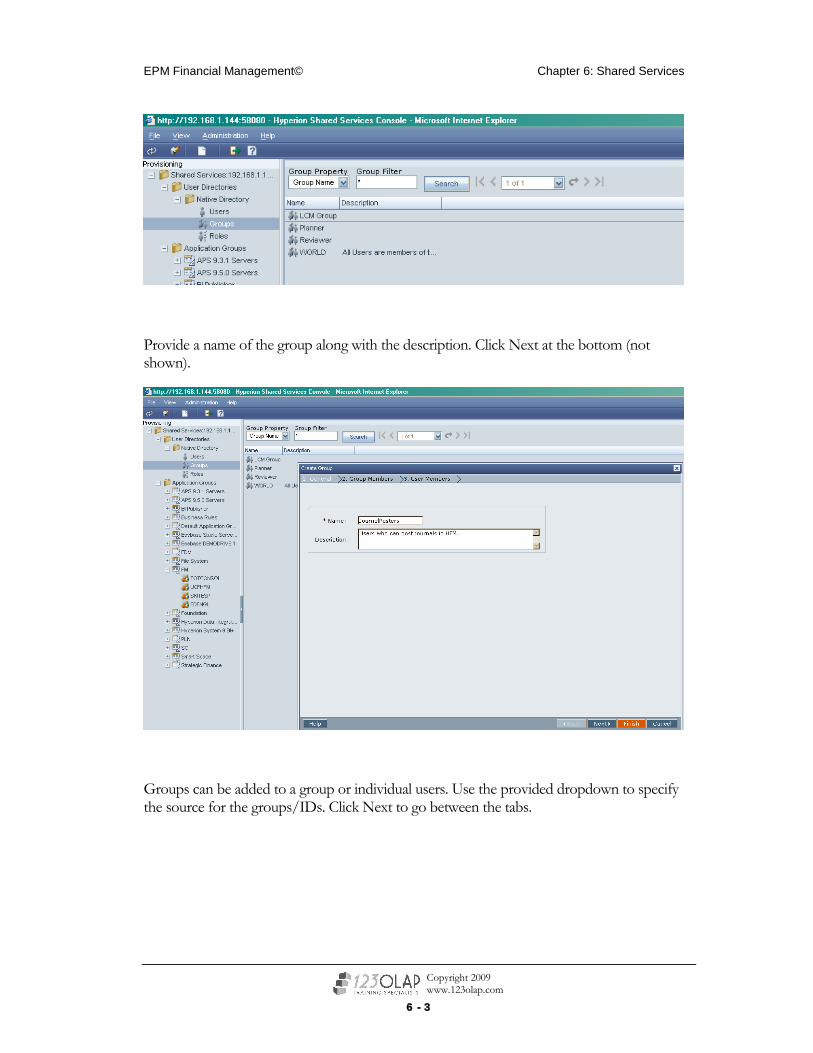
EPM Financial Management© Chapter 6: Shared Services
6 - 3
Copyright 2009 www.123olap.com
Provide a name of the group along with the description. Click Next at the bottom (not shown).
Groups can be added to a group or individual users. Use the provided dropdown to specify the source for the groups/IDs. Click Next to go between the tabs.

EPM Financial Management© Chapter 6: Shared Services
6 - 4
Copyright 2009 www.123olap.com
The groups can be used not only by HFM but the other Hyperion products. When multiple products are being used some overall design should be done to develop a cohesive and integrated security approach.
Right clicking a user or group will open a menu with choices – the choices will vary depending on what is highlighted and the source (native or otherwise). The Provision choice is used to assign role access (what functions can the user do).

EPM Financial Management© Chapter 6: Shared Services
6 - 5
Copyright 2009 www.123olap.com
In the resulting window, drill down through the choices and select the role(s) that are appropriate for the user, moving them over to the pane on the right. When done, click Save in the lower right corner.
The administrator is generally flagged to be Provisioning Manager (unless there is a segregation of duties required between managing security and managing the application) and Application Administrator. End users typically are set up with something as shown above: the required controls and processes will help determine the appropriate settings.
Creating and Assigning Classes The other part of the security equation is to create and assign classes to application elements. To create the classes, navigate to the application on the left starting with Application Groups, then the product (typically FM). Right-click on the application label and select Assign Access Control.

EPM Financial Management© Chapter 6: Shared Services
6 - 6
Copyright 2009 www.123olap.com
On the first tab, Select Users and Groups, at least one user must be selected (moved to the right pane) in order to continue to the subsequent tabs. Click on Show All to see the provisioned users/groups. Highlight the user/group and click the arrow pointing right in the middle to move the item over.
When at least one user/group is in the right hand pane, click Next. This will bring up a list of classes. [Default] is the class that is assigned in the absence of any other. Add new classes by typing them in the box provided and clicking Add. Move classes over to the right pane in order to assign access to them on the next tab.

EPM Financial Management© Chapter 6: Shared Services
6 - 7
Copyright 2009 www.123olap.com
When designing classes, create a class that will be modifiable by only the admin or a select few people. All other users should be assigned Read access to this class – call it Standard or AdminOnly or ModByAdminOnly or whatever. Next, assign the class to things that should not be changed by everyone: data forms, exchange rate accounts, etc.
The resulting table – shown on the left – can be pivoted to that on the right by clicking the Pivot Table button. Highlight one or more items and select an Access Right from the dropdown. Click on the Check button to the right – nothing changes without doing this. When done, click Save in the upper left.
Access Right Choices:
• None – No access – user does not see that the item exists • Metadata – Sees that the dimension member exists but cannot view/edit data • Promote – View data for the dimension member and promote/reject in process
control • Read – View data for the dimension member but not promote/reject in process
control • All – Modify the item and promote/reject in process control
The Add Alert button enables the email notification for process control and intercompany transactions. For process control, the software environment must be set up to send emails and these features enabled on the scenario (set SupportsProcessManagement to A) and on the user Receive E-mail Alerts security role. Also, the user must be assigned a proper review level, All or Promote access to the class assigned to the entity(ies) and the alert must be enabled here. In short, emails don’t happen unless all components are enabled.
The last tab, Security Reports, allows for reporting of the groups and users granted access. The reports are useful for documenting and reviewing security access as typically required for Sarbanes-Oxley. Select the desired choices and click the appropriate format for the report.

EPM Financial Management© Chapter 6: Shared Services
6 - 8
Copyright 2009 www.123olap.com
The Other Way (for Classic Applications) If working with a Classic application there is another way to do most of this. Manually doing everything one at a time through the web interface could take a while. Security can be extracted out of the application, modified in a text file, and then reloaded. The extract and load menus and processes are located and work the same way as metadata load/extract, data load/extract, etc.

EPM Financial Management© Chapter 6: Shared Services
6 - 9
Copyright 2009 www.123olap.com
In the sample to the left, there are three users provisioned for the application and eight classes (including [Default]).
Following are the role assignments. Only the assignments that are enabled need to be listed. For example, demoadmin is provisioned as the Provisioning Manager and the Application Administrator.
Next are security class assignments. On the left, Barry has been given access to the classes but George has not. The administrator can copy the lines, change Barry to George, and upload the new file.
Groups and user assignments to groups cannot be created/changed in this manner. This maintenance must be done online.
Organizing the Design When designing security, a matrix in Microsoft Excel works well for listing the roles and classes and showing which users have what access. The AutoFilter feature in Excel can help narrow the list. The matrix is easy for those involved to review and approve the access before development starts. Also, the matrix can typically be reformatted into the security load file format above.

EPM Financial Management© Chapter 6: Shared Services
6 - 10
Copyright 2009 www.123olap.com
Summary Security is used to control what users can and cannot do and what they can see and not see. A good security design starts with a matrix of the users to design what is needed. If there are a large number of users then the use of groups is highly recommended. The initial implementation and major changes can be done in a file (if working with a Classic application) and loaded while small changes, as well as group management, should be done online.
Lifecycle Management Lifecycle management is a component of Shared Services that provides a mechanism of moving artifacts – web data entry forms, for example – from one application to another. In prior versions items required extracting and loading. The ability to use Lifecycle Management is controlled via a unique role for which the user must be provisioned.
Clicking the application within the application group opens the artifact list. These are the items that Lifecycle Management can migrate.

EPM Financial Management© Chapter 6: Shared Services
6 - 11
Copyright 2009 www.123olap.com
Click on the plus signs to expand the items. Check the desired items to migrate and then click Define Migration. The Migration Wizard will pop up and provide a guide for the options. Specify the destination application and the migration options (like merge or replace). There is a final summary screen from which to review the selections before performing.
When migrating artifacts from one Shared Services environment to another (from production to development where these are completely separate), an output file is created that is then loaded in the second environment. Within the same environment (different applications only within the same environment) no file is used.
Reporting is available for migrations under the Administration menu: the menu option is Migration Status Report. Selecting this choice will bring up the following screen.
Use the dropdowns to select the desired criteria and then select Refresh. For each found item, go to the right and click on View Details to see more information.

EPM Financial Management© Chapter 6: Shared Services
6 - 12
Copyright 2009 www.123olap.com
Shared Services – Other Features Along with security and lifecycle management there are a few other features of Shared Services. There is an audit capability of the changes made. From the Administration menu select Configure Auditing. This will open a dialog box where auditing can be enabled/disabled and for which modules.
Auditing also enables the audit reports, also accessible from the Administration menu. If the Audit Reports menu item is not there then click on a higher level under Shared Services on the left hand pane and try again. There are a couple of report choices.
In the report above use the search button to the right of the Performed By to select users and then click View Report. There is a button at the bottom of the screen to export the report.

7-1
Copyright 2009 www.123olap.com
HFM Administration Stuff
he focus of this Chapter is to review various parts of the software, the application setup, and other stuff. Some of these are invisible to the end users and some are set up items that control how the application works.
HFM Copy Application – Classic Only The HFM Copy Application utility is used to copy one application to another. The utility copies the relational tables for the application. The application can be copied to another one on the same server or another. Common examples include copying the production application to development for testing and making a copy of the development application within development to test and compare different settings.
This utility uses the UDL files that connect HFM to the relational database(s). No ID and password are needed to start the process, so access to the utility and the UDLs must be controlled.
No users should be logged into the application(s) when running the utility. The utility is run from the HFM application server, typically through Remote Desktop. The utility is in the Server folder within the program folder.
Chapter
7 T

EPM Financial Management© Chapter 7: Admin Stuff
7-2
Copyright 2009 www.123olap.com
Running the application will open a series of dialog boxes that guide the user through the process. Clicking Next will go to the next box.
Select the UDL file for the source application. The UDL file is used to create the connection to the relational database storing the HFM tables. The UDL file is created during the installation of HFM. Navigate to the UDL file used and click Next.

EPM Financial Management© Chapter 7: Admin Stuff
7-3
Copyright 2009 www.123olap.com
In the next box, highlight the source application and click Next. The next two boxes are similar to the above except the emphasis is on the destination. With the list of applications, if copying to a new application simply type in the desired application label in the box. The destination UDL file will be the same as the source if copying the application within the same environment. If copying across environments, like test to development, navigate to the appropriate UDL file.
Clicking Next will provide some options for the copy. The screenshot below indicates settings appropriate for creating a development application. Depending on company policy regarding the retention of audit data in the application the audit data may be desired. Here’s why: if the audit data is not copied to development then the audit data will be lost if the application is copied back to production. A good practice would be to extract and archive the audit log before copying. The Advanced Options do not typically need to be changed. If there are issues in the copy, the settings therein can be adjusted to [hopefully] provide a better result. Click Next to continue.

EPM Financial Management© Chapter 7: Admin Stuff
7-4
Copyright 2009 www.123olap.com
After clicking Next a confirmation screen appears, providing an overview of the source and destination. Clicking Next from this screen will begin the copy.

EPM Financial Management© Chapter 7: Admin Stuff
7-5
Copyright 2009 www.123olap.com
As records in each table are being copied the status screen will show the progress. The time required is based on the amount of the data in the application. A confirmation box will appear when the copy is complete. Click OK and then click Close (the Cancel button in the above screen will change to Close) to exit the utility.
The last box provides a link to the log file that will show the details of the copy. Click View Log File to view the log. Click Finish to exit the utility.

EPM Financial Management© Chapter 7: Admin Stuff
7-6
Copyright 2009 www.123olap.com

EPM Financial Management© Chapter 7: Admin Stuff
7-7
Copyright 2009 www.123olap.com
HFM Utilities To help administrators with some commonly requested tasks, someone at Hyperion not involved with the development group created a utility with some handy features. The popularity of the utility grew until it is now included with the software installation. It is installed in the software folder under the Consultant Utilities subfolder and is called HFMUtilities.exe.
Note to use this utility the Windows client must be installed on the PC as well as the utility. Running directly on the server is not required.
When using the utility for the first time, it will not be on the Start menu. Navigate to the file in Explorer or by browsing from the Start.Run menu. The first time it is run it will do an installation, including creating a Start menu item. Launching a subsequent time will, after asking for the ID, password, and application, provide the following screen.
The Application Info box on the lower left can be clicked to show several tabs.
• Security – provides basic reporting. Click on the item to see who has access to it or click on the user to see to what they have access. Click Send to Excel to get the info in Excel.
• Shared Members – Click on the dimension to see members that are shared (under more than one parent).
• Member Lists – See the output of member lists in each dimension. If applicable, provide a top member for the filter.

EPM Financial Management© Chapter 7: Admin Stuff
7-8
Copyright 2009 www.123olap.com
• Base Member Compare – Pick a dimension and then select two parent members. The utility will show base members that are under the parent on the left and not under the parent on the right.
• Duplicates Below Parent – Pick a dimension and then select a parent member. The utility will show any members under the parent more than once.
• Statistics – Pick a dimension and see statistics regarding the depth and number of members.
Out of these items the Base Member Compare and Statistics are the most useful; although, the others can be the right tool for the right problem.
There is no close button: click on the X in the upper right corner of the window to close and return to the main screen.
From the main screen, selecting a dimension from the dropdown will enable the three buttons (note – entity does not enable the Member List Builder). The most commonly used of the three buttons is Metadata Viewer.

EPM Financial Management© Chapter 7: Admin Stuff
7-9
Copyright 2009 www.123olap.com
Click on Metadata Viewer to see the dimension in a tree view.
The one feature used here is to send the metadata to Excel. There is no need to expand the levels first: the utility will do that. From the above screen, clicking on Send to Excel will generate the file below. Note – there is a prompt to print the file. This prompt is for printing to Excel, not printing to paper. The Excel file is a very easy way of distributing the metadata structure to users for review, reference, etc.

EPM Financial Management© Chapter 7: Admin Stuff
7-10
Copyright 2009 www.123olap.com
HFM Administration Within the web interface there is an Administration menu that has several items of note. The next several items discuss various pieces.
System Messages HFM creates various messages as tasks are being performed. These messages may (many times they don’t) provide some insight into problems when experienced.
Select the menu item and provide a date range and click View.
In this example OoogaBooga is an invalid account. If we click on the “Invalid … Booga” we get the following:
The message is rather cryptic but on the last line on the far right there is a line from the rules file that needs to be corrected.

EPM Financial Management© Chapter 7: Admin Stuff
7-11
Copyright 2009 www.123olap.com
Another way to access the same messages is another utility in the Consultant Utilities folder: HFMErrorLogViewer.exe. This does not require an ID or password and is typically run directly from the application server.
Other messages will show here. Sometimes the user ID is included, sometimes not. When requesting assistance from technical support sometimes the information in this file will be requested. The file is called HsvEventLog.log and is located in the Server Working Folder of the installation folder on the application server.
Task and Data Audit From the Administration menu there are two audit tasks: Task and Data. The Task Audit shows when users log in, where they go, and when they log off. The list may be filtered by date, server, user, and task.
The Task Audit is useful for verifying that users are logging in and doing what they need to do. It can also help indicate what was happening within the application at a particular time if a problem occurs.

EPM Financial Management© Chapter 7: Admin Stuff
7-12
Copyright 2009 www.123olap.com
The Data Audit is useful for reviewing changes to data. The feature must be enabled in metadata for BOTH scenarios and accounts. Data Audit is useful for confirming which user changed which data point and how (data load, data entry, journal entry) and when. Selecting Data Audit from the Administration menu opens the screen.

EPM Financial Management© Chapter 7: Admin Stuff
7-13
Copyright 2009 www.123olap.com
Clicking a record will open the detail and show all of the changes to the cell.
For both Task Audit and Data Audit, the recommended practice is to extract the records and store offline and delete the online records periodically.
Task Automation Under the Administration menu is a selection called Manage Taskflows. Taskflows allow for steps to be scheduled to run either just once or on a regular schedule. The most popular choice is consolidations.
Selecting Manage Taskflows opens a window showing a list of any existing task flows.
Clicking New will open the window to create one. Enter the label, confirm the application, and enter a description. Click Submit.

EPM Financial Management© Chapter 7: Admin Stuff
7-14
Copyright 2009 www.123olap.com
The resulting window shows three tabs at the top that need to be completed. Note that each additional stage will only have two – the third one applies to the first state only. Each step in the process is called a stage. On the general tab, name the stage (or leave it as Stage1, 2, etc.) and provide an ID and password.
Click on the Processing tab to go to the next tab. This tab has a dropdown for the application (not all are HFM) – select the desired application. Next, the Action dropdown will display the available tasks for the application.
After selecting an action, the list of parameters will show the items that need to be completed. Depending on the item, the choices may be a URL (click Edit to make changes), Variable passed from another stage (like a filename), or Picklist (a second dropdown will appear with choices). In the case of consolidations, the URL is used for the point of view and a picklist provides the consolidation type.

EPM Financial Management© Chapter 7: Admin Stuff
7-15
Copyright 2009 www.123olap.com
On the first stage only clicking on Starting Event will open the last tab. Starting event is used to schedule the task. Task flows can be scheduled to occur monthly, daily, etc. with optional ending information. Task flows can always be started on demand from the main screen.
Each stage must also have a link. A link is used to pass control from one stage to another. The link can be simple, like Stage 2 starts after Stage 1 finishes. Or, links can conditionally start the next stage. Like if a data load is successful then run a consolidation.
Highlight the starting stage and click Add Link. Provide a label and description for the link as needed and select the receiving stage (what should run next).
On the Condition tab, use the dropdowns to build any conditions that must be met. A stage can have multiple links to it and a stage can have multiple links to other stages. For example, a data load stage may have a link to a consolidation stage if the load is successful and a End task flow if the data load was not successful.

EPM Financial Management© Chapter 7: Admin Stuff
7-16
Copyright 2009 www.123olap.com
The last stage should have a link to End. Also, stages should have links to End if a stage finishes unsuccessfully.
Other Administration Menu Items Users on System simply lists the users and provides some information about where they are. From this screen users can also be logged off by the administrator.
Running Tasks simply lists the tasks running at a given moment; however, most tasks do not show up here. The one key task that does is consolidation. If several users call at one time and say their consolidations are taking a long time, Running Tasks would be where to go.
Manage Servers and Applications can be used to disable user logins into the application. The idea is that logins are disabled, users are then logged off by Users in System, the admin does maintenance changes, and then enables the logins. Whenever maintenance is loaded the users are automatically logged off anyway, but this method is a bit more structured.
Process Control and Validations Within HFM there is a process that can be used to collect an electronic signoff that is used to indicate the data is “good.” Called process control, this signoff has a few different moving parts. Coverage of this topic is in two places: here and in chapter 3 of the End User section.
There are several design questions that must be answered before beginning the setup.
• Which scenarios will require the feature? Maybe Actual will use process control and Forecast and Budget will not.
• What edits must be passed, if any, before signoff can occur? The most common one is that the balance sheet is in balance.
• Are there groupings of accounts that will be promoted on different schedules? Maybe the balance sheet and profit and loss accounts are promoted first and then statistics and movement detail data are promoted later. This feature is called phased submissions.

EPM Financial Management© Chapter 7: Admin Stuff
7-17
Copyright 2009 www.123olap.com
• Who will be involved in the signoff? Signoff is driven by the entity structure and parent entities cannot be signed off unless the children are also. Typically a local accountant signs off first, then a corporate accountant, then a controller/VP.
• Will users be able to see a unit’s data before signoff? By assigning or not assigning access to review levels in security, an administrator can control when a user would see data. For example, a corporate controller may not see data until the numbers have been loaded and promoted by the local accountant and the corporate accountant. Or, the controller may have access immediately upon loading.
The setup of process control is in metadata and security. Within metadata, scenarios must be enabled for process control (the attribute is called SupportsProcessManagement) and a maximum number of review levels (the attribute is called MaximumReviewLevel) must be specified. For SupportsProcessManagement the choices are Y (yes), N (no), and A (yes, with generation of emails). The Classic version is shown below.
The MaximumReviewLevel attribute is a number from 1 to 10.
NOTE: Review 1 has some drawbacks from a security standpoint (not fully controllable) so most implementations skip over it and focus on Review 2 through Review 10. If 3 review levels are needed then the attribute for review levels should be 4.
Within the application settings, there are settings for the phased submissions (one group of accounts now, another group later) and the validation account for each. Phased submissions can also be enabled for the customs and ICP dimensions.
On the account, ICP, and custom dimensions there is an attribute called SubmissionGroup. This setting is a 1, 2, 3, etc. that corresponds with the submission group that is to be used based upon the groups enabled in application settings.
Within Security, there are a couple of items that need to be provisioned. When assigning access to the review levels, the choices will determine when data can be changed or accessed.

EPM Financial Management© Chapter 7: Admin Stuff
7-18
Copyright 2009 www.123olap.com
If a user is assigned review levels 1, 2, and 3, they will be able to modify the data (assuming proper access to the other dimensions) as long as the data is at 1, 2, or 3. Once promoted to 4 or higher they lose the ability to make changes, even if they promoted it. The concept is that a user loads the data, verifies, and then promotes, meaning that the numbers are good and month end is done for us. The control enforces this concept by disabling the users’ ability to make changes after signing off.
Alternatively, if a user is only assigned review level 4, then they would not be able to see the numbers until promoted to that level. Then, depending on the access to the dimensions, they could modify (preferably via a journal) or view the data. Once promoted above 4, then they would lose any ability to modify.
Both of these security plans have their advantages and disadvantages: the decisions are typically based on the closing process and the culture of the company. It is also possible to use both approaches: a corporate controller may have instant access to all data but the CEO, CFO, etc. may not have access until signed off by the controller.
The Review Supervisor and Submitter roles are special roles that can be used based upon the process control design. The Review Supervisor can perform all tasks. The Submitter can perform the “submit” function, which is a special signoff level (more on this later).
The possible review levels are:
• Not Started – the period is not open and users cannot load data, see any data that has been loaded by the administrator, etc. The administrator or review supervisor is responsible for starting the period.
• First Pass – the period is open and users can load data. • Review 1-10 – practically 2-10, users have loaded data and promoted. • Submitted – the data has reached a submitted level. • Approved – data has been approved.

EPM Financial Management© Chapter 7: Admin Stuff
7-19
Copyright 2009 www.123olap.com
• Published – the data has been “published.” Only administrators can make changes. Also, data must be at this level before the entity can be locked. Locking an entity prevents recalculation/reconsolidation of data after rule (excluding dynamic accounts) or entity hierarchy changes. IMPORTANT NOTE – parent accounts and parent customs are not locked, as these items are always calculated “on the fly” and are not stored data.
In a typical setup, the administrator will start the period, users will promote, and then the corporate accountant will submit. Lastly, the highest level signoff or the administrator will promote to Publish. This is by no means the only route.
For information on the validation account and the actual promotion steps go to chapter 3 of the end user section.
Creating Data Entry Forms Sometimes data cannot be loaded from a file and must be manually entered. For reclasses, accruals etc. a debit/credit style journal is preferred (in some environments required). However, for headcount, statistics, etc. a data entry form is the best approach. If journals were used, users would need the ability to create unbalanced journals: not typically recommended. The data entry forms can be created by the administrators and sufficiently control the input of data to prevent balance sheet and profit & loss accounts from being impacted. To prevent input into these accounts, end users should not have the ability to create/modify data entry forms.
As an example, the data entry form below is for entering headcount. The point of view is mostly grayed out, meaning the dimensions are locked and cannot be changed. With this form the user can only change the scenario, and there the available selections can be limited.

EPM Financial Management© Chapter 7: Admin Stuff
7-20
Copyright 2009 www.123olap.com
To create a form, navigate to the Manage Documents screen – either from the Administration menu select Manage Documents, the Data Forms link on the left, or the first icon to the right of Explore on the toolbar.
Click on the Data Forms tab. Note that among the buttons below the tabs are buttons to load and extract – useful for moving forms across applications. In addition to creating forms, from here forms can also be deleted, edited, and added to the user’s favorites menu. Like the items on the other tabs data entry forms can be organized into folders.
Click on the New button to open the form builder. Provide a label, security class (typically a class is assigned that users can view but not change), description, and instructions. The instructions will appear when users click an icon on the form. HTML tags, such as the <b> and </b> can be used to format the text – the <b> tag puts things in bold type. Click Next to go to the next tab.

EPM Financial Management© Chapter 7: Admin Stuff
7-21
Copyright 2009 www.123olap.com
From the POV tab the point of view is controlled. There are two columns. The column on the left, Member, is used to hardcode the dimension to a single member. The item will show on the point of view bar and will be grayed out. The second column, Selectable, is used to allow users to select a member. While a single list must be selected, the list can be adjusted to limit the selection. For example, the {[Base]} selection below for Entity limits the selection to all base level entities. If the selection was {Europe.[Base]} then the selection would be limited to only base level entities under Europe.
Dimensions that are not filled in here should be in either the rows or the columns of the form. Click Next to go to the next tab.
The Columns tab controls what dimension(s) are specified in the columns. Each column can have a different selection, either a list (col 1) or a specific member (col 2). Below, each column can be scaled, formatted differently, etc. Refer to the software documentation for the options – there are many functions that can be used to control the look and functionality of the form. Click Next to go to the next tab.

EPM Financial Management© Chapter 7: Admin Stuff
7-22
Copyright 2009 www.123olap.com
The Rows tab is very similar to the Columns tab. After completing click Next to go to the next tab.
The Details tab provides various settings that control how the form looks, such as suppression and repeating row/column headers. The best approach is to leave these set to the defaults and change as needed after reviewing the completed form. Click Next to go to the next tab.

EPM Financial Management© Chapter 7: Admin Stuff
7-23
Copyright 2009 www.123olap.com
The Headers tab is used to control how the row and column headers are presented. Click Next to go to the next tab.
At this point the form can be saved. The last tab, Script, shows how the form is stored. Note that this script can be edited directly if desired. If the form needs to be longer than 99 rows then working with the script is required, as the form builder does not go larger than that.

EPM Financial Management© Chapter 7: Admin Stuff
7-24
Copyright 2009 www.123olap.com
Capabilities within forms:
• Basic calculations to be done on the form itself • Column showing cell text. • Linking one form to another. An input form for sales volumes may have a linked
form for the intercompany sales account (would be specified on the intercompany sales account row on the Rows tab of the form) so that when the row header is clicked a second form launches that lists the ICP dimension members. The point of view is carried over to the second form.
• Bolding, italics, custom headings, etc.
HFM User Groups The Hyperion Solutions Financial Management group on Yahoo! has over 750 members, mainly administrators and consultants. Members can post questions and receive answers from the group. Logging into Yahoo! groups is not needed as the correspondence can all be done via email; however, a free Yahoo! ID will be needed. Also, the past correspondence is archived at Yahoo! and can be searched: there is 6 years of history available. The group is moderated and potential members must apply (basically stating that they are a HFM administrator for XYZ company and wish to join the group). For more information go to http://tech.groups.yahoo.com/group/hsfm.
Other groups exist for various components of the Oracle EPM suite: FDM, Planning, Financial Reporting, etc.
Another source of assistance is local user groups. These groups meet regularly and can be a source of local assistance and networking. Go to oracle.com for more information.

EPM Financial Management© Chapter 7: Admin Stuff
7-25
Copyright 2009 www.123olap.com
Typical Administrator Life Once the implementation is complete and the application is in production, most companies and administrators expect a monthly routine for life with HFM. Below are some of the tasks that may be performed either before or after month end: typically the administrator is not heavily involved with the actual month end process other than ensuring the system is running smoothly and assisting users with their tasks.
• Open the period in process control and in journals • Enter exchange rates. • Help users load data, run reports, input manual data, etc. • Review task audit and data audit logs for proper usage. • After month end:
o periodically extract the logs to a secure folder and clear from the application. o Add/change/delete accounts, entities, custom members, make changes to
reports, add/change security access, etc. in preparation for the next month end. A change request form filled out by the requestor, signed by the manager, and then signed by the administrator when completed is highly recommended and is usually required for Sarbanes-Oxley.
o Update rules as needed – best done in a test application and verified before loading into production. And the same change request form above should be used.
o Review updates from Oracle and determine the need to install upgrades and patches. Some patch releases fix critical issues and should be installed promptly to avoid problems. Larger releases are more involved in terms of upgrading and the need to perform such should be evaluated based on the new features. Testing the upgrade with test hardware is highly recommended before changing the production environment.

EPM Financial Management© Chapter 7: Admin Stuff
7-26
Copyright 2009 www.123olap.com

8 - 1
Copyright 2009 www.123olap.com
HFM End User Basics he focus of this Chapter is to review the basic tasks that end users typically perform: working with tasklists, data grids, and data forms, and entering journal adjustments. Some of these functions may not be required by a company, so check with the
administrator for the exact close process.
Logging In and Logging Out The administrator will establish security for all users, specifying what users can see, change, and do. A user may only see part of the company and be able to change only a subset of that part. Also, some features in the software may be disabled for a particular user. Check with the administrator for any questions or difficulties.
Users log into HFM through the Hyperion Workspace. The administrator will provide the web address. Typically the same ID and password that users use to log into the computers and network are used for the login. If the password is locked or the ID is deleted then the user will not be allowed into Hyperion.
Chapter
8 T

EPM Financial Management© Chapter 8: HFM End User Basics
8 - 2
Copyright 2009 www.123olap.com
The resulting page will show the Repository, a listing of reporting documents and folders. The menu and toolbar across the top provide navigation to many different areas and tasks.
The first time a user logs in, they should set their Preferences. The administrator will provide direction on the selections. These preferences can be reached from the File menu “within the window;” that is, on the Hyperion menu/toolbar and not the File menu that is part of Internet Explorer.
To access HFM, click on the Navigate menu, then select Applications, then Consolidation, then the appropriate application. Depending on the user’s security and the Oracle EPM modules installed, the items listed may be different and/or not accessible.

EPM Financial Management© Chapter 8: HFM End User Basics
8 - 3
Copyright 2009 www.123olap.com
At the bottom of the screen, tabs will appear as a user goes into HFM, runs a report, etc. Navigation across modules can be done simply by clicking on the appropriate tab.
When ready to exit, click on the File menu within the window and select Exit. This action will not only close the window but will also properly log the user out of Hyperion. There is also a button on the toolbar for logging out.
Tasklists When selecting the application, users will be directed into HFM. Depending on the security provided to them, they will most likely see a dropdown on the left with a list of tasks. These tasklists are designed to guide the users through the appropriate steps. Clicking the dropdown will bring up all available tasklists. Clicking the arrow on the right above the dropdown will change the user into browser view, where all items may be found (without the navigation provided by the tasklist).
The gold arrows above the dropdown on the left will toggle between Project View (using Tasklists) and Browser View (navigating to all items)

EPM Financial Management© Chapter 8: HFM End User Basics
8 - 4
Copyright 2009 www.123olap.com
The WD2 tasklist is shown in Project View. Any other tasklists would appear in the dropdown.
All available tasks/documents can be found in Browser View.
Creating Tasklists To create a tasklist, click on the Manage Documents icon on the toolbar or select Manage Documents from the Administrator menu and go to the Tasklists tab. Click New Tasklist to create a new one or check the box on the left of an existing tasklist and click Edit to view and change the included items.

EPM Financial Management© Chapter 8: HFM End User Basics
8 - 5
Copyright 2009 www.123olap.com
Below is the detail for the Budget User tasklist above. The items may be reordered by highlighting an item and using the blue arrows on the right. Also, a user may select a tasklist to be their default, meaning when they log in they are automatically presented with the tasklist.
Adding and Saving Tasklists The Add dropdown allows for additional items to be added. The list shows the type of item – selecting a type will provide the appropriate window for the user to find and select the desired item. Note that an existing tasklist may be included in another tasklist – no need to “recreate the wheel.”
Saving the tasklist when complete will provide a window in which the user provides a label and description. A security class may be chosen that will restrict who can view and modify the tasklist and the tasklist may be marked as private. Marking as private will hide the tasklist from all users except the creator and the administrator.

EPM Financial Management© Chapter 8: HFM End User Basics
8 - 6
Copyright 2009 www.123olap.com
Data Grids In many ways data grids are the heart of HFM. From data grids users can review and analyze data, change data (security allowing), consolidate (run the process that adds the children of a parent entity together), and other tasks. And the key to getting the most from data grids is understanding the dimensions.
When creating data grids users place dimensions in either rows or columns. Any dimension not placed such is left in the point of view, meaning that a single member will be used for each dimension and may be changed at any time to see something else.
Grids are usually created by the administrator for the common views of the data and are secured to prevent accidental changes. Users may also create their own, and can also flag them as private to prevent other users from seeing them. The administrator will provide the desired guidelines.
Grids can display data, consolidation status, or process control status. Right clicking a cell brings up a menu of various options.
Creating a Grid To create a grid, use the Administrator menu on the toolbar and select Manage Documents. There is also a Manage Documents button on the toolbar.

EPM Financial Management© Chapter 8: HFM End User Basics
8 - 7
Copyright 2009 www.123olap.com
Select the Data Grid tab and then click New Data Grid.
The result will be a data grid, although it may not be formatted as desired. In the grid below the Entity dimension is in the rows and the Period dimension is in the columns. All other dimensions are in the point of view. In this case the Scenario is Actual and the Year is 2008.
Modifying the Layout Below the point of view and above the grid is a toolbar. The first button opens Grid Settings. Within Grid Settings users may choose where the dimensions are placed on the Layout tab and various display settings on the Display Options tab.
Multiple dimensions may be placed in the rows and columns, providing more and more detailed views into the data. The plain blue arrows to the right of the row/column boxes will control the order. The arrows pointing into the box will move the dimensions among the row, column, and page areas. Select the dimension and then click the appropriate arrow.
One important note about the Layout tab:

EPM Financial Management© Chapter 8: HFM End User Basics
8 - 8
Copyright 2009 www.123olap.com
At least one dimension must always be specified for the rows and columns, so if changing the current dimension then a user must add the new one before removing the old one.
Once OK is clicked the grid will appear with the dimensions as specified. There is also a second tab that controls the display options.
Member Selections The point of view in the initial grid, including the members showing in the rows and columns, may not be as desired. To change any dimension member, click on the item. For members in the rows and columns, click on the dimension label in the upper left corner box on the grid. The resulting dialog box will also provide links to all dimensions, enabling easy navigation to all dimensions – no need to click OK, let the grid refresh, and then open another dimension.
In the dialog box below, the Scenario dimension members are listed. Scenario is in the point of view in the grid above, so only one member may be selected at a time. In the “Selector” section of the dialog box, a user can click on the specific member. In the case of parent members (parent members have “children”) click on the plus (+) to the left of the member to see the children. The + will change to a minus (-) enabling the user to collapse that member to just show the parent again.

EPM Financial Management© Chapter 8: HFM End User Basics
8 - 9
Copyright 2009 www.123olap.com
In the case of a large dimension, navigating via point and clicking through the parents can be tedious. In these cases, type the member label in the “Selected ____ Value” field (above it contains Actual) and click on the binocular icons on the right. There are choices to either go up or go down from the current position (whatever is highlighted below) to find members. Also, a user can type a specific member label in and let the system alert them when OK is clicked whether it is valid or not.
When the desired choice has been made, a user can either click OK at the bottom of the screen to return to the grid with the selected member in use; or, click on another dimension label listed above “Selected Scenario Value.” The items above, like 2008, show the member label and not the dimension – in this case 2008 is the year dimension. Over time users learn the order of the dimensions and what to expect in each. Generally its best to use these links to navigate to all dimensions, select the appropriate choice, and then click OK to return to the grid.

EPM Financial Management© Chapter 8: HFM End User Basics
8 - 10
Copyright 2009 www.123olap.com
Multiple Member Selections for Rows and Columns It is rare that a single dimension member is desired for rows and columns, as that works best in the point of view. The same dialog box above, with the 12 dimensions listed at the top, can be used to navigate to and select multiple members for the rows and columns.
In the example below the dialog box shows a Selected Values window on the right. As items are selected the window will show, with one major exception, the items will display in the grid. Items will be listed in the grid in the order listed in the window: highlight members and click the blue up and down arrows to change the order.
In the box above, the periods January, February and March have been selected and are listed in the Selected Values window. To remove items, highlight them and click the trashcan icon above the window. Clicking the icon without selecting anything will move all items out of the window – a prompt will ask for confirmation first.
In the example above, the three members were individually selected. A better way of selecting these would be to specify “children of Q1.” While not likely for the period dimension, if another month is added to Q1 then it will automatically get picked up. Doing so is a two step process – if items are in the selected values window like above then the real first step is to remove them. First, click on the folder icon to the left of Q1 – it will turn blue. Then, from the dropdown, currently showing [Hierarchy], select [Children]. The window will adjust to show the three months as below.

EPM Financial Management© Chapter 8: HFM End User Basics
8 - 11
Copyright 2009 www.123olap.com
Note with this method the choice is not moved over to the Selected Values window – this is the aforementioned exception. By clicking OK, HFM will display the members shown; in this case Jan, Feb and Mar.
The items listed in the dropdown are called member lists. The lists starting and ending with square brackets ([ and ]) are system generated. Any other lists were created by the administrator.
Working with the various lists will provide many different views to the data. Examining grids created by the administrator and personally working with the selections will demonstrate and inform users to the choices available.

EPM Financial Management© Chapter 8: HFM End User Basics
8 - 12
Copyright 2009 www.123olap.com
Working with Data Grids Data can be viewed and acted upon within the grid once it is established with the rows and columns and point of view.
Right clicking a cell will provide a menu that has various choices. Note that the choices will change depending on what is right clicked – a parent entity vs. a base level entity, a whole row vs. a single cell, etc.
The most commonly used menu choices are:
Calculate/Force Calculate/Calculate Contribution/Force Calculate Contribution
Runs the calculations on the specified entity/year/period/scenario. The “contribution” choices flow all the way up the Value dimension.
Consolidate/Consolidate All/Consolidate All with Data
Adds up the data from the descendants of the selected parent entity.
Entity Details The entity detail highlights the Value dimension, showing how the data goes from the bottom/input level up to the top.
Cell Information Displays a variety of information about the cell.
Cell Text Allows input of text/comments regarding the cell. The text can later be pulled into reports and Excel worksheets.
Audit Intersection Showing only for base level data, this option will, if set up, link to FDM to show the mapping detail for the intersection.
Printing a data grid does not always work well. The commonly used approach to overcome this limitation is to do the following:
• Hold the ALT key down and then press PrtSc.
• Then, open Microsoft Word or Microsoft PowerPoint and from the menu select Edit, then Paste. This will place an image of the screen into the document.

EPM Financial Management© Chapter 8: HFM End User Basics
8 - 13
Copyright 2009 www.123olap.com
• Cropping the image and then enlarging as needed will produce a satisfactory print, although multiple screenshots will be required if any scrolling in the data grid is needed.
Grid Background Colors The grid will display various background colors for each cell. The color is an indication of what is available for the cell.
Dark green
Cell is calculated or at least one member is a parent member or value dimension member is not <Entity Currency>.
Light beige
Cell is available for data entry.
Light green
Cell is a parent level period – available for input. Input will be spread to the base level members either evenly or based on the seasonality of any existing data.
Dark orange
Cell is an invalid data intersection: listing intercompany partners for a non intercompany account, for example.
Sometimes grids are created for one-off or ad hoc analysis and then are simply navigated away from and not saved. If the grid format will be useful again then the grid should be saved. Use
the disk icon on the toolbar to save the grid.
When saving a grid, provide a label and a description. A grid may also be assigned a security class, meaning users that have view or modify access to the selected class will be able to use and modify, respectively, the grid. Check with the administrator for information on classes. Lastly, the grid may be marked as private, meaning only the creator and the administrator can see the grid.
The concepts of using security classes and the private setting help to manage the number of grids that a user may see. Folders may also be used to arrange the grids. The administrator will provide guidance on the desired procedure(s).

EPM Financial Management© Chapter 8: HFM End User Basics
8 - 14
Copyright 2009 www.123olap.com
Common Data Grids Label
Row Dimension
Column Dimension
Purpose
Accounts Account Periods (Months) General purpose grid to view data and perform operations
Consolidation Entities Periods (Months) Display setting to Calc Status – used to consolidate the data
Currency Rates Custom1 Accounts (Exchange Rates)
Viewing/entering currency exchange rates
Intercompany Intercompany Partners
Intercompany Accounts (use list if available from administrator)
Viewing intercompany balances
Process Control Entities Periods (Months) Display setting to process control – used to view/promote/reject entities
Value Accounts OR Value
Value OR Accounts
Show consolidation detail of data from entity to its parent
Data Entry – Multiple Ways Data entry may be accomplished a variety of ways. Data grids may be used, and have some useful spreading across period features that are handy for forecast or budget input if Oracle EPM/Hyperion Planning is not in use. However, internal control and audit policies may prohibit the use of data grids for input due to the possibility of changing data loaded from the general ledger. In most cases, general ledger data is loaded and not manually entered. HFM provides for two other types of data input.
There is a variety of methods used to load data into HFM besides manual entry. Except for data entry forms (next) these are not covered in this class. The administrators will provide guidance in this area.

EPM Financial Management© Chapter 8: HFM End User Basics
8 - 15
Copyright 2009 www.123olap.com
Data Entry Forms Data entry forms look similar to data grids in that there are rows and columns. Forms do have several advantages:
• Forms are more administrator controlled, meaning the selection of dimensions can be restricted. A user may have the opportunity to input data to a headcount account but not cash or revenue.
• Forms may be exported from HFM to Microsoft Excel, data entered there, and then the data imported. The Excel workbook that is exported is highly protected (no changes are allowed) but the input may be worked on offline.
• Instructions may be placed on forms to provide assistance to the users. • Forms are easier to print with a satisfactory output. • Simple calculations may be placed on the forms to provide assistance/information.
What forms lack are the easy-to-change and analysis capabilities of data grids; therefore, each has their place.
A sample data form is below.
The buttons on the lower toolbar allow users to submit the data after entering, calculate the entity, enter cell text, get instructions provided by the administrator, export to and import from Microsoft Excel, and turn on suppression options. The cells in the form may also be right clicked to show the cell information and to enter cell text.
The important step to remember with data entry forms is to submit the data. The first icon on the toolbar above is Submit Data. Cells with unsubmitted input are dark yellow and almost any navigation away from the screen will create a warning message.
The online help provides information on how to create data forms. Generally this is an administrator performed task (controlled via security) so it is not covered here.

EPM Financial Management© Chapter 8: HFM End User Basics
8 - 16
Copyright 2009 www.123olap.com
Journals Data entry forms work well for supplemental schedule information. What they do not work well for are adjustments to the financial statements.
There is no control requiring balanced entry using data entry forms nor are there explicit approval processes. The journal module within HFM provides the capabilities to adjust financials with the appropriate controls.
Journals Overview Journals may be reached in the browser view under the heading of Tasks. If using Tasklists, there will most likely be an item called “Process Journals.”
When navigating through the browser view, there are a couple of additional options. Manage Periods is performed by the administrator to control when periods are available to accept journals. Also, templates may be created for any journal that is repeated each month – create a template once and then apply it each time creating the entry. Lastly, the administrator may create journal groups that can be used in journal reports, like Local GAAP to US GAAP journals or Tax journals or Year End Audit Adjustments.
When clicking on Process Journals, a list will appear and may have some journals listed or not. The point of view bar at the top will filter the journals that are shown. Any journal created will apply to the scenario, year, period, and value dimensions that are listed in the point of view.
The first three dimensions are obvious as to their purpose. The value dimension can provide up to four different places for adjustments – check with the administrator as to which are valid for the company.
<Entity Curr Adjs> Adjust local currency data. <Parent Curr Adjs> Adjust translated data in the currency of the selected parent. [Parent Adjs] Adjust translated data as it relates to a specific parent before ownership and elimination entries. [Contribution Adjs] Adjust translated data as it relates to a specific parent after ownership and elimination entries.

EPM Financial Management© Chapter 8: HFM End User Basics
8 - 17
Copyright 2009 www.123olap.com
The last two can be a bit complicated, as users can adjust what an entity contributes to a particular parent and not another. For example, an expense reclass may be needed to an entity but only for the entity rolling up on a management reporting entity hierarchy and not the external/SEC entity hierarchy. The last two choices provide the capability. The first two choices adjust the entity’s contribution to all parents.
Adjustments are typically allowed for all base level entities and may be allowed for parent entities. The Parent and Contribution adjustments may not be enabled depending on the application design and setup. The administrator will provide guidance.
Creating Journals Based on the screenshot above, assuming the point of view is correct, a user clicks New… to create a journal. The available choices are completed – if a template is required then a list of choices will appear for selection. Auto reversing journals will reverse themselves the next period – note the journal is not automatically posted and will require posting to take effect.
The grid below is the journal entry screen. First the desired entity should be selected in the point of view. If a single entity journal was deselected above, then the grid will have two additional columns for entity and the appropriate parent of the entity. Provide a label and select a group, balance type, and security class as needed. Note that all balance types may not be available to all users. The large box between the header information and the journal lines is for a description.

EPM Financial Management© Chapter 8: HFM End User Basics
8 - 18
Copyright 2009 www.123olap.com
When entering the journal, either type the desired member label or double click the cell to open a selection dialog box. The buttons may be used as well. Scrolling to the right will show columns for the remaining custom dimensions as well as a description for each line item.
When the journal is ready, click the Save button to save.
Depending on the control process in the company, the user may be able to go ahead and post the journal; or, another person may be required to approve and post the journal.
If not allowed to approve and/or post, the user should submit the journal. Once saved, a new button will appear above the journal label and group called Process. From this dropdown button select Submit.
Return to the Process Journals list by clicking on the item on the left in Browser View or in the tasklist. If an approver or poster, the user may select multiple journals and process them all at once. The filter button will allow users to select the displayed columns and to limit the journals shown to a specific entity, group, status, etc.

EPM Financial Management© Chapter 8: HFM End User Basics
8 - 19
Copyright 2009 www.123olap.com
Clicking the Reports button will present a new window with three tabs to guide the user to create a journal report. First, fill out the Properties tab:
Next, select the columns to display with sort and other options to choose from:
Lastly, fill out the filter properties:

EPM Financial Management© Chapter 8: HFM End User Basics
8 - 20
Copyright 2009 www.123olap.com
To see all journals, leave the four text fields blank. Do not use the wildcards.
Journal Templates Journal templates are created the same way as journals. The point of view does not apply unless a single entity journal template is being created. Templates may be saved and used at any time – the journal created from the template may be adjusted before saving and posting. Below is a sample of a new journal template.

EPM Financial Management© Chapter 8: HFM End User Basics
8 - 21
Copyright 2009 www.123olap.com
For journals that do not change from period to period, recurring journals may be used. Located in the journal template area on a separate tab, recurring journals are created just the same as templates. The difference is that the recurring journal screen has a button called Generate. Checking the desired journals and clicking Generate will open a point of view selector and then will create the journals. They will still require posting. Security access is required from the administrator to generate recurring journals.
Summary
Users access HFM via the company’s intranet. Users log in and security will control what they can and cannot see and do. Tasklists can be used to guide users through the tasks and screens. Data grids are the most convenient way for users to review data and perform various tasks. Changing data can be accomplished via data grids, data forms, and journals.

EPM Financial Management© Chapter 8: HFM End User Basics
8 - 22
Copyright 2009 www.123olap.com

9 - 1
Copyright 2009 www.123olap.com
HFM End User Next Steps he focus of this Chapter is to review the tasks beyond data input: intercompany reporting and process control. Some of these functions may not be required by a company, so check with the administrator for the exact close process.
Intercompany Reporting – Some Background Intercompany transactions occur when a division within a company has a business transaction with another division of the company. Sales, accounts receivable, interest, and investments are all types of intercompany transactions. HFM provides two types of intercompany eliminations: balances and transactions. The transaction elimination capability is rarely used in the United States and is not covered in this class. The basic premise is invoice level transactions are loaded with appropriate currency rates, matched or not matched with a reason code given, and then the results are posted to the financial accounts. Please refer to the product documentation.
One of the main consolidation tasks that HFM performs is intercompany balance eliminations. An intercompany balance is eliminated when the entity that booked the balance and the partner entity aggregate together. In this entity hierarchy, any intercompany balance between Office A1 and Office A2 will be eliminated when the data is consolidated to Division A – the first common parent. An intercompany balance between Office A1 and Office B1 will not eliminate until Total Company. Divisions A and B will show these intercompany balances when reporting.
Along with the account, HFM uses the intercompany partner dimension when storing the data. The partner is used in the consolidation process to know when to create the elimination as the data aggregates up the entity hierarchy. Elimination entries are created after translation to the parent entity’s currency.
Usually the intercompany relationship is a set of one or more accounts compared to another set of one or more accounts, like intercompany receivables vs. intercompany payables. Another type of elimination is one-sided, where there is no second set of accounts. The common example is intercompany sales, where the sales are eliminated and an offset is created under cost of sales. Either way, the administrator will have specified an account to
Chapter
9 T
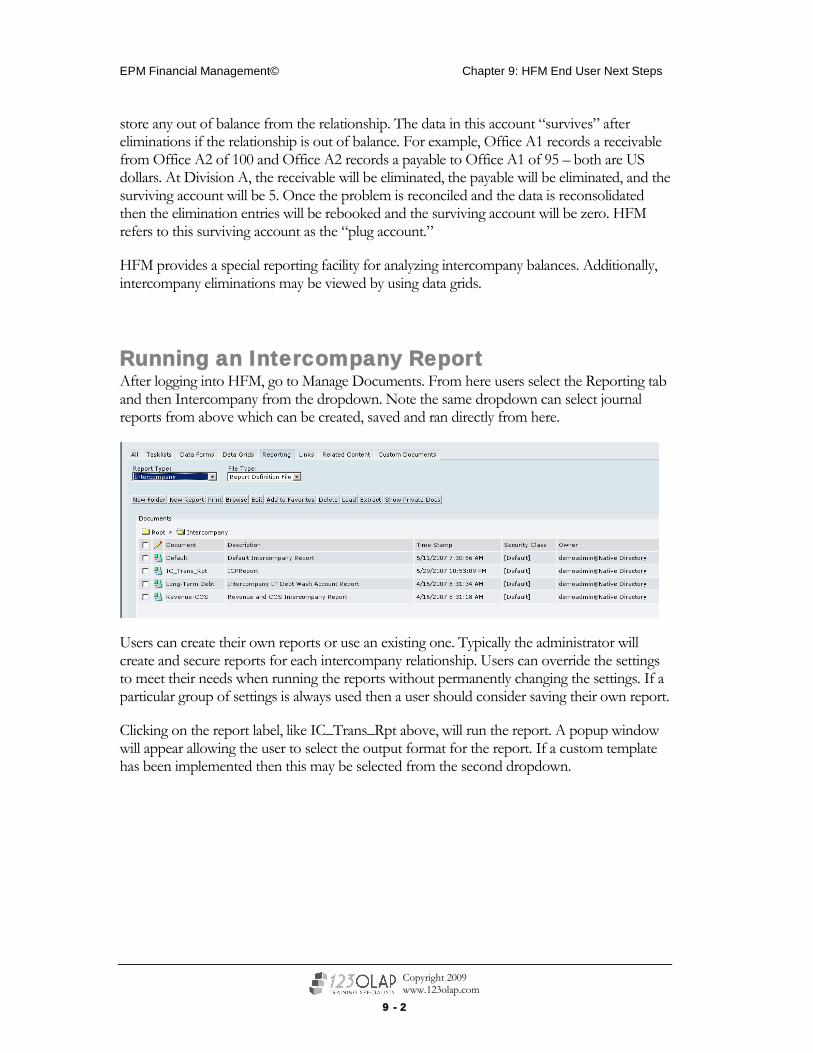
EPM Financial Management© Chapter 9: HFM End User Next Steps
9 - 2
Copyright 2009 www.123olap.com
store any out of balance from the relationship. The data in this account “survives” after eliminations if the relationship is out of balance. For example, Office A1 records a receivable from Office A2 of 100 and Office A2 records a payable to Office A1 of 95 – both are US dollars. At Division A, the receivable will be eliminated, the payable will be eliminated, and the surviving account will be 5. Once the problem is reconciled and the data is reconsolidated then the elimination entries will be rebooked and the surviving account will be zero. HFM refers to this surviving account as the “plug account.”
HFM provides a special reporting facility for analyzing intercompany balances. Additionally, intercompany eliminations may be viewed by using data grids.
Running an Intercompany Report After logging into HFM, go to Manage Documents. From here users select the Reporting tab and then Intercompany from the dropdown. Note the same dropdown can select journal reports from above which can be created, saved and ran directly from here.
Users can create their own reports or use an existing one. Typically the administrator will create and secure reports for each intercompany relationship. Users can override the settings to meet their needs when running the reports without permanently changing the settings. If a particular group of settings is always used then a user should consider saving their own report.
Clicking on the report label, like IC_Trans_Rpt above, will run the report. A popup window will appear allowing the user to select the output format for the report. If a custom template has been implemented then this may be selected from the second dropdown.

EPM Financial Management© Chapter 9: HFM End User Next Steps
9 - 3
Copyright 2009 www.123olap.com
Next, a window will be presented where the user can override the settings.
The POV is usually always overridden to provide the appropriate month and year. The below screenshot is the same as above, with various settings overridden. The key to the overrides is to check the box to the left of each option.

EPM Financial Management© Chapter 9: HFM End User Next Steps
9 - 4
Copyright 2009 www.123olap.com
Most of the options are self-explanatory. The ones to particularly mind are:
• Value dimension (last part of point of view – shown as USD above). Changing this will control the currency that is used on the report. A report that shows a Canadian unit compared to a Swedish unit would not be useful if each entity is shown in <Entity Currency> - their local currency. Selecting either CAD or SEK or even USD or EUR as the currency would be appropriate.
• Entity and Partner. These selections dictate the set of entities and partners that will be included in the report. In the example above, the entity list ICP Entities is used to include all entities flagged to be intercompany partners. Note this is a special type of member list that is typically created by the administrator – if the list does not exist then use the system generated [Hierarchy]. The other common selection is to use a specific entity as the entity and then the ICP Entities list for the partners. This is useful when a particular entity is reconciling their balances with everyone else.
Clicking OK will run the report. When generating the intercompany report, HFM will allow an entity to see another entity’s data when the requesting entity is the partner. For example, Office A1 typically cannot view Office A2’s data; however, when running the report, the balance that A2 has booked with A1 will be visible. This behavior, while typical, can be changed, so check with the administrator if the result works differently.
The resulting report shows the details and options in the header. This particular relationship is a one-sided elimination of intercompany sales. The line items are shown below. The report can be printed – if wide then change the printing preferences to landscape.
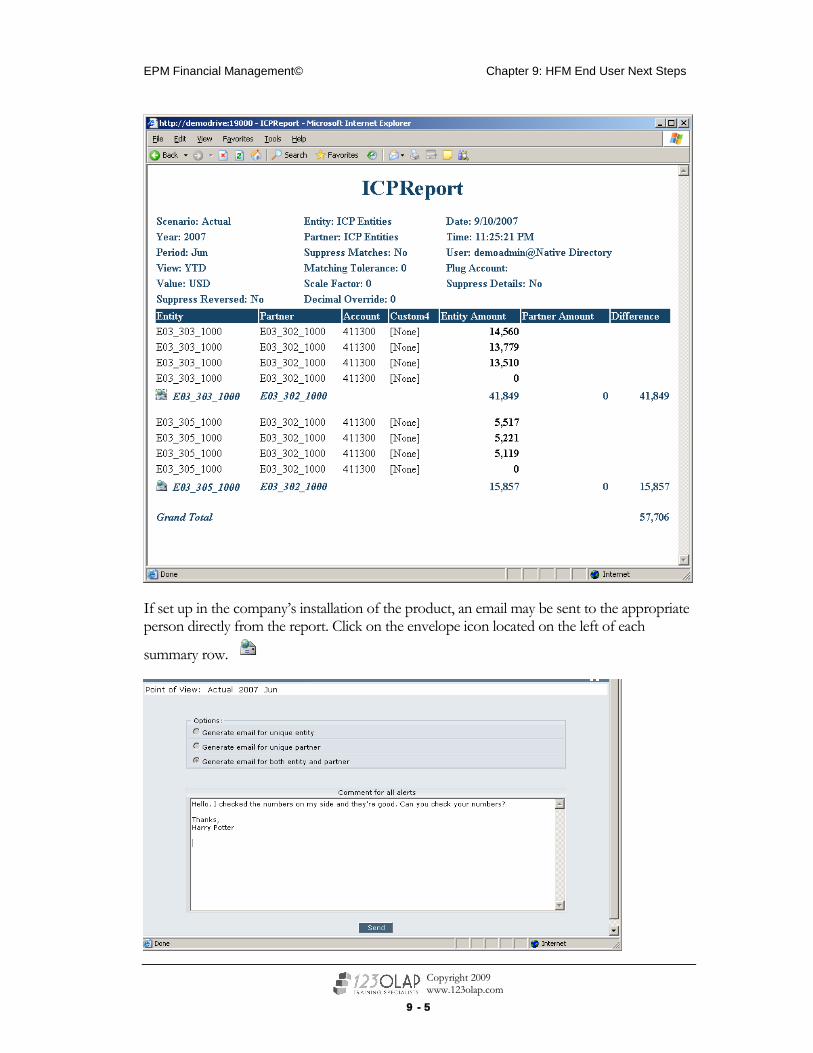
EPM Financial Management© Chapter 9: HFM End User Next Steps
9 - 5
Copyright 2009 www.123olap.com
If set up in the company’s installation of the product, an email may be sent to the appropriate person directly from the report. Click on the envelope icon located on the left of each
summary row.

EPM Financial Management© Chapter 9: HFM End User Next Steps
9 - 6
Copyright 2009 www.123olap.com
Creating/Modifying an Intercompany Report All of the items above regarding running an intercompany report also apply to creating a report. From the Manage Documents screen click New Report.
The resulting window is similar to the override options window above with the addition of the format and template options at the top and the accounts at the bottom.
The accounts fields are used to specify the set of accounts that are to be compared. When possible, use the plug account. By specifying the plug account a report will automatically include all accounts in a relationship and will print additional details on the report. Without the plug, it is possible to omit an account that is eliminated against the others and the report will not display the entire elimination and be incorrect.
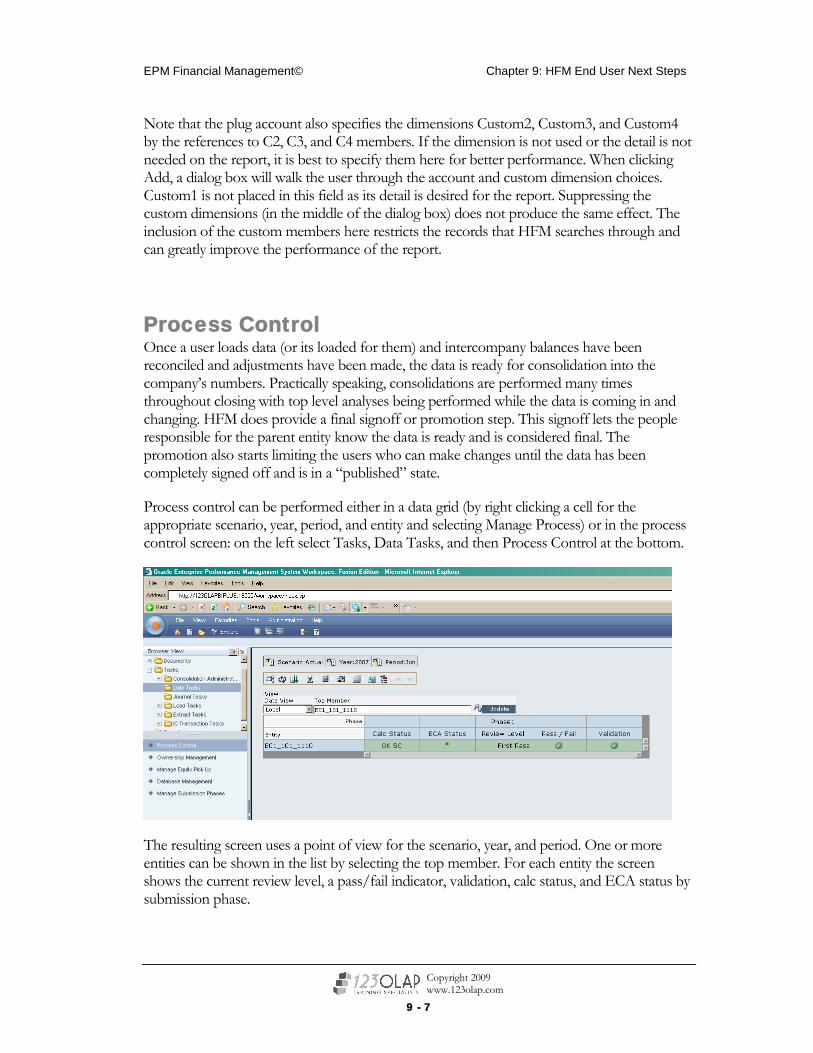
EPM Financial Management© Chapter 9: HFM End User Next Steps
9 - 7
Copyright 2009 www.123olap.com
Note that the plug account also specifies the dimensions Custom2, Custom3, and Custom4 by the references to C2, C3, and C4 members. If the dimension is not used or the detail is not needed on the report, it is best to specify them here for better performance. When clicking Add, a dialog box will walk the user through the account and custom dimension choices. Custom1 is not placed in this field as its detail is desired for the report. Suppressing the custom dimensions (in the middle of the dialog box) does not produce the same effect. The inclusion of the custom members here restricts the records that HFM searches through and can greatly improve the performance of the report.
Process Control Once a user loads data (or its loaded for them) and intercompany balances have been reconciled and adjustments have been made, the data is ready for consolidation into the company’s numbers. Practically speaking, consolidations are performed many times throughout closing with top level analyses being performed while the data is coming in and changing. HFM does provide a final signoff or promotion step. This signoff lets the people responsible for the parent entity know the data is ready and is considered final. The promotion also starts limiting the users who can make changes until the data has been completely signed off and is in a “published” state.
Process control can be performed either in a data grid (by right clicking a cell for the appropriate scenario, year, period, and entity and selecting Manage Process) or in the process control screen: on the left select Tasks, Data Tasks, and then Process Control at the bottom.
The resulting screen uses a point of view for the scenario, year, and period. One or more entities can be shown in the list by selecting the top member. For each entity the screen shows the current review level, a pass/fail indicator, validation, calc status, and ECA status by submission phase.

EPM Financial Management© Chapter 9: HFM End User Next Steps
9 - 8
Copyright 2009 www.123olap.com
Submission phase is a feature where different accounts and/or custom dimensions can be submitted in different groups. For example, the balance sheet and profit and loss accounts may be signed on in phase 1 and supplemental accounts in phase 2.
If the pass/fail indicator is a small x surrounded by a red circle and not a check mark surrounded by a green circle, some action is required before promoting. The reasons for the failure are either a validation edit has not passed or the calculation status is not OK or OK SC. The ECA status provides a warning if there are any unposted journals for the entity. In the case above, the validation edits are not met. By clicking on the x in the circle we get a screen showing the validations.
The edits listed will differ from company to company based on the closing process. In the example, flash (preliminary close) data has not been provided for three accounts.
The missing data has been provided but the validation flag has not changed; also, the calculation status has changed from OK to CH, meaning changed. Highlighting the row and right clicking will provide an option to calculate. Also, the toolbar below the point of view provides all processing options.

EPM Financial Management© Chapter 9: HFM End User Next Steps
9 - 9
Copyright 2009 www.123olap.com
With the status now all good, we can promote. Below uses the toolbar to find Promote.
The review level is the current level of signoff. Users are provided with a specific signoff level. For example, division accountants may be Review 3, corporate accountants may be Review 5, and the corporate controller may be Review 7. Data is “promoted” from one review level to another. The initial level above, First Pass, indicates that the period is open (otherwise, the status would be Not Started and end users could not access the period) and no signoffs have been performed. After a user promotes the data, they lose the ability to change the data.
The box to the left is the promotion box. The user can enter a comment and attach a file (note: the attachment must first be uploaded to HFM from the Manage Documents screen on the Custom Documents tab). If a parent entity was selected the dropdown at the bottom allows the user to promote all descendants as well as the entity.
A parent entity CANNOT be promoted higher than any of its children.
If one entity out of 100 is not signed off, then the total company cannot be signed off. This becomes very apparent during month end, when a corporate manager goes to sign off

EPM Financial Management© Chapter 9: HFM End User Next Steps
9 - 10
Copyright 2009 www.123olap.com
the close and one or more divisions are delayed.
Once promoted, the person at the next level can get an email showing the entity has been promoted. Then they can review the entity and either promote it to the person above them or reject it. Above, a pension accrual was noted in the comment field. If the accrual was incorrect, then the person could reject the unit back to the previous level. All of the promotion history is stored for each entity.
On the screens above there has been a “phase” indicator of 1. HFM allows for data to be submitted in phases or subsets. For example, the basic financials may be phase 1, headcount and sales volume may be phase 2, and fixed asset movement detail phase 3. Each phase may be promoted independently and with different validation edits. This capability is used when the data for each phase is on a different timeline (like basic financials due on the 2nd day of month end and headcount/sales volume due on the 4th day).
There are different strategies involved in setting up process control, like whether senior managers are allowed to see the data before it is promoted up to them or if they have to wait. The administrator will inform users about the appropriate steps.
Summary
Once data has been entered, the next steps usually are reconciling intercompany balances and signing off on the numbers. HFM provides tools for both of these steps. Intercompany balances may be researched in any currency and from various viewpoints (all entities vs. all entities or one entity vs. all). For signoff, HFM validates the data and ensures calculations have been performed before allowing promotion. Higher level users can reject the data as needed. All signoffs are stored and can be reviewed if needed.
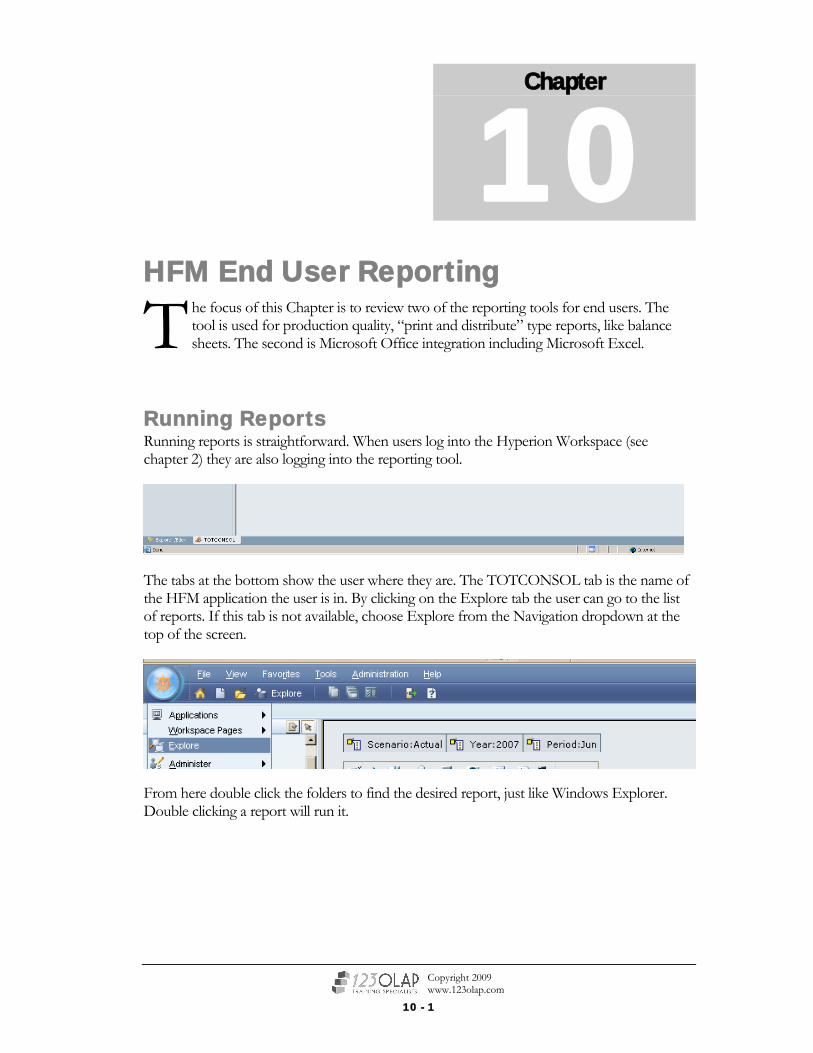
10 - 1
Copyright 2009 www.123olap.com
HFM End User Reporting he focus of this Chapter is to review two of the reporting tools for end users. The tool is used for production quality, “print and distribute” type reports, like balance sheets. The second is Microsoft Office integration including Microsoft Excel.
Running Reports Running reports is straightforward. When users log into the Hyperion Workspace (see chapter 2) they are also logging into the reporting tool.
The tabs at the bottom show the user where they are. The TOTCONSOL tab is the name of the HFM application the user is in. By clicking on the Explore tab the user can go to the list of reports. If this tab is not available, choose Explore from the Navigation dropdown at the top of the screen.
From here double click the folders to find the desired report, just like Windows Explorer. Double clicking a report will run it.
Chapter
10 T

EPM Financial Management© Chapter 10: HFM End User Reporting
10 - 2
Copyright 2009 www.123olap.com
Depending on their settings and the report, users may experience one or two prompts. The first prompt is to preview the point of view. Just like in HFM, reporting using a point of view for the dimensions that have not been specified in the report. Users can change the point of view and rerun the report as needed. Whether the point of view is previewed is a user preference setting – see chapter 2 for more information.
The second type of prompt is built into the report. There may be a specific dimension which is needed to make the report flexible. The prompt and the valid choices are determined by the report writer. Also, the point of view and the prompt may be used at the same time.
When the report is rendered it will be in one of two formats: HTML or PDF. HTML is useful for analysis – in the report below, the triangles beside the row items can be clicked to show the children below each. PDF is useful for printing, saving, and emailing to others. Right clicking the report before running provides the user with a choice when opening the report. A user preference also controls which format is used by default. Lastly, users can click the toolbar buttons to switch between them.

EPM Financial Management© Chapter 10: HFM End User Reporting
10 - 3
Copyright 2009 www.123olap.com
Above, the report is shown in HTML format and the line “Cash from Current Operations” has been expanded – the others have not. The point of view at the top can be changed to run the report for a different entity, period, etc.
The report may be exported either from the link provided at the bottom or from the File menu. PDF reports can be saved/distributed/etc. as normal PDF files.
Another type of document, other than a report, that a user may choose (depends on the implementation) is a Web Analysis document. This document type is an interactive dashboard that visually presents information intended more for online consumption vs. printing and distribution.

EPM Financial Management© Chapter 10: HFM End User Reporting
10 - 4
Copyright 2009 www.123olap.com
Hyperion Smart View for Microsoft Office Smart View is the addin for connecting to HFM Microsoft Office. Users can pull data from and, if allowed, push data into HFM. Much of this interaction is performed with Microsoft Excel; additional capabilities are available for Microsoft Word and Microsoft PowerPoint.
Note that the appearance of the menus, dialog boxes, etc. may differ based upon the version of Microsoft Office in use; however, the concepts will still apply.
Installation of the addin can be done by end users by first downloading the installer from the Hyperion Workspace. From the Tools menu select Install, then Smart View. Save the file to the local computer and then run the file to start the installer.

EPM Financial Management© Chapter 10: HFM End User Reporting
10 - 5
Copyright 2009 www.123olap.com
Follow the prompts for the installed. The best recommendation is to accept the defaults.
After installation there will be a Hyperion menu. The first step is to create connections to Hyperion. As Microsoft Excel is used most often, the examples here will use that.
From the Hyperion menu select Connection Manager.
This dialog box controls the connections to the different Hyperion modules – in addition to HFM Smart View can connect to Hyperion Workspace (for reports) and Hyperion Planning.
Click Add and then select URL provider. Leave the first dropdown as Hyperion Provider and place http://xxxxxxxx/HFMOfficeProvider/HFMOfficeProvider.aspx where xxxxxxxx is the server name. In the resulting dialog box, navigate down to the application name. Note: select the LOWER level application name, not the higher level, as shown below.
Next, provide a name and description for the connection and click Finish. This connection will be used each time a connection is made to the specific application. A username and password will be needed.

EPM Financial Management© Chapter 10: HFM End User Reporting
10 - 6
Copyright 2009 www.123olap.com
Creating a connection to the Workspace is similar. Click Add, then select URL provider. In the next dialog box, change the first dropdown to Hyperion System 9 BI+ Provider and enter the appropriate URL – as shown below.
Click Next and enter a name and description for the connection and then click Finish.
The first connection – to HFM – allows users to pull data directly from HFM. The second connection allows users to pull reporting objects from the workspace. The remainder of this section focuses on these capabilities.
Smart View Functions for Microsoft Excel The most flexible part of Smart View allows users to enter formulas in cells that pull a specific data point. Cell references may be used to allow one cell to change, like the current month, and all appropriate formulas update. This capability is very useful for most end users; however, using Microsoft Excel as a reporting tool is not very Sarbanes-Oxley compliant. For Sarbanes compliance reporting, running reports via the Workspace is preferred due to the greater degree of control of report development.
To get started with a function, open a connection to a HFM application and then from the Hyperion menu select Functions the Function Builder.

EPM Financial Management© Chapter 10: HFM End User Reporting
10 - 7
Copyright 2009 www.123olap.com
The dialog box guides users through the function choices (HSGetValue is the most common) and the parameters needed for each; basically the connection name and the dimensions. Clicking OK will place the function into the cell.
As with other Microsoft Excel formulas cell references may be used for the dimensions. As a best practice, users create cells that have the shared dimension labels. The idea is to change these labels once and all functions update accordingly.

EPM Financial Management© Chapter 10: HFM End User Reporting
10 - 8
Copyright 2009 www.123olap.com
In this example, the formula bar shows the HsGetValue function with cell references to various dimension members. Changing the members will cause the cell to show “Need Refresh.” To refresh the data, select the Hyperion menu and then choose Refresh.
Any dimension members that are not specified use the point of view; for example, customs 2, 3, and 4 are not specified in the formula above. The general recommendation is to explicitly specify all 12 dimensions.
HFM Forms within Microsoft Excel The data entry forms from Chapters 7 and 8 can also be used in Microsoft Excel. After opening a connection select the Hyperion menu, then Active Connection. Click on the HFM application to be used. Next, select the Hyperion menu, then Forms, then Select Form. Choose a form and then the form will open. Note that form is protected and may not be changed. This capability provides an alternative to using the web interface for data entry forms.
Ad Hoc Analysis Also within Microsoft Excel is the ability to view data without functions. This ad hoc analysis capability is similar to data grids. The capability controls the entire worksheet (not the workbook but just the sheet) so a worksheet with nothing else is required.
After opening a connection select the Hyperion menu, then Active Connection. Click on the HFM application to be used. Note: this is required here but not for functions as the first parameter of the function is the connection. Also, functions can pull data from multiple applications into the same worksheet whereas ad hoc analysis is one application per worksheet.
When ready, double click the worksheet. If nothing happens, go to the Hyperion menu and select Options. The resulting window has various display options that will apply to all aspects of the add-in. The one to check now is on the lower left and is called Mouse Operation. As shown below, the check is needed to enable the double click.

EPM Financial Management© Chapter 10: HFM End User Reporting
10 - 9
Copyright 2009 www.123olap.com
After double clicking the default grid will open. Accounts are in the rows, periods are in the columns, and everything else is in the point of view. To quickly see the capabilities, double click the period – it will say [Year] to start. Users can continue double clicking until they reach the lowest level periods.
To change the point of view, click on the Options dropdown on the floating toolbar. Note the toolbar may also be moved to the top of the window and will dock with the other toolbars. The Options dropdown will also allow users to move the dimensions to the rows and columns. Note like data grids a row and a column cannot be blank – there must always be one dimension assigned.
When selecting members for the point of view, multiple choices may be made. This allows the dropdowns on the point of view to easily switch between the desired choices.

EPM Financial Management© Chapter 10: HFM End User Reporting
10 - 10
Copyright 2009 www.123olap.com
Place checks in the boxes on the left of the members and click the top arrow to move them to the selection window.
Opening Reports in Microsoft Office The Smart View addin also works with reports. By opening a connection to the Hyperion Workspace (set up provided above) users can basically run a report and have an image placed into Microsoft Office.
From the Hyperion menu open the connection to the Workspace. Next, from the Hyperion menu select BI Document, then Import.
The resulting window will show the reporting repository. Navigate through the folders and select the desired report. The report will run and then provide a window with a few choices.

EPM Financial Management© Chapter 10: HFM End User Reporting
10 - 11
Copyright 2009 www.123olap.com
The point of view bar is at the top, allowing changes as needed. Below the report, users can select whether to bring in all pages or to allow refreshes via the Workspace point of view. Clicking OK will insert the report as an image (Microsoft Word or Microsoft PowerPoint) or as rows/columns (Microsoft Excel).
If the document is a standard package that is used regularly, the reports may be updated by clicking them and selecting Hyperion, BI Document, then Edit. The report is rerun and the point of vie w may be adjusted.

EPM Financial Management© Chapter 10: HFM End User Reporting
10 - 12
Copyright 2009 www.123olap.com
Using Smart Tags The last integration is useful when writing commentary and needing a number. Using the Smart Tag technology in Microsoft Office 2003 and Microsoft Office 2007, users can easily link to HFM and pull a number.
Type the word smartview and hover the mouse pointer over it. An icon will appear as below – click on it to see the menu.
Data may be pulled in by selecting Functions. If a connection to HFM isn’t open then no choices will appear. A report may be pulled in by selecting BI+ Content. The word smartview will be replaced by the data.
Summary
Hyperion provides a variety of reporting tools to meet various needs. The two most common are the financial reports run from the Workspace and Microsoft Excel with the Smart View addin. With Smart View there are various options to meet any type of data need.

11-1
Copyright 2009 www.123olap.com
Financial Reporting Studio The Mechanics of Building Reports
he focus of this chapter is to discuss the basic and advanced steps of building a report using Hyperion Financial Reporting Studio. Reports usually start out simply and then become more complex as additional features and complexity are added reiteratively.
Chapter
11 T

EPM Financial Management© Chapter 11: Financial Reporting Studio
11-2
Copyright 2009 www.123olap.com
Getting Started Regardless of the version of Financial Reporting that is being used, you will need to launch the Financial Reporting client. This is a Windows program that must be installed in order to build reports.
The ID provided must be provisioned for the Report Designer role within Shared Services.
After login a screen similar to the following should appear. This is the Repository that shows all reports and the objects which have been created. It is Financial Reporting’s equivalent to Windows Explorer.
Folders can be created here as needed to organize reports and other content to be viewed within the Workspace. The folder should make sense for the users and in the overall design of the environment (shared with Planning, etc.).
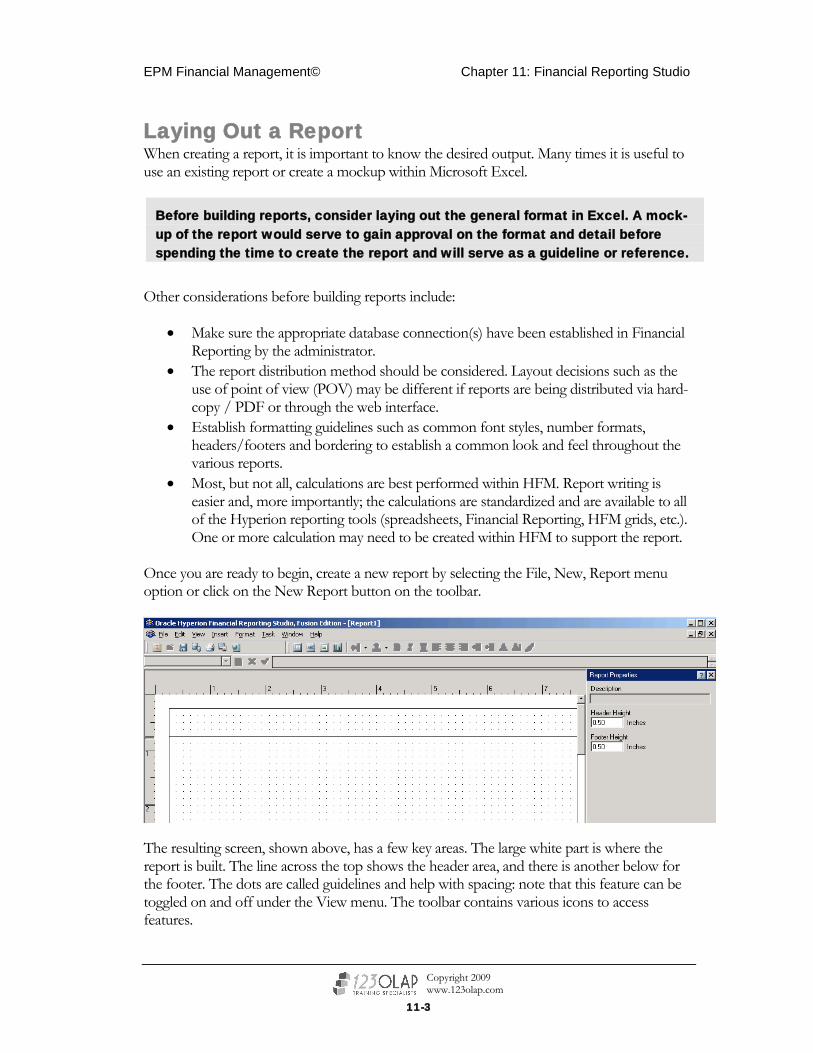
EPM Financial Management© Chapter 11: Financial Reporting Studio
11-3
Copyright 2009 www.123olap.com
Laying Out a Report When creating a report, it is important to know the desired output. Many times it is useful to use an existing report or create a mockup within Microsoft Excel.
Before building reports, consider laying out the general format in Excel. A mock-up of the report would serve to gain approval on the format and detail before spending the time to create the report and will serve as a guideline or reference.
Other considerations before building reports include:
• Make sure the appropriate database connection(s) have been established in Financial Reporting by the administrator.
• The report distribution method should be considered. Layout decisions such as the use of point of view (POV) may be different if reports are being distributed via hard-copy / PDF or through the web interface.
• Establish formatting guidelines such as common font styles, number formats, headers/footers and bordering to establish a common look and feel throughout the various reports.
• Most, but not all, calculations are best performed within HFM. Report writing is easier and, more importantly; the calculations are standardized and are available to all of the Hyperion reporting tools (spreadsheets, Financial Reporting, HFM grids, etc.). One or more calculation may need to be created within HFM to support the report.
Once you are ready to begin, create a new report by selecting the File, New, Report menu option or click on the New Report button on the toolbar.
The resulting screen, shown above, has a few key areas. The large white part is where the report is built. The line across the top shows the header area, and there is another below for the footer. The dots are called guidelines and help with spacing: note that this feature can be toggled on and off under the View menu. The toolbar contains various icons to access features.

EPM Financial Management© Chapter 11: Financial Reporting Studio
11-4
Copyright 2009 www.123olap.com
The report properties pane on the left shows information about the highlighted item. The pane will change based upon the item and what about it can be changed. This pane is the first place to look for settings about anything in a report.
Before adding anything to a report, change the header space in the properties pane to 1.0. This can be changed later; however, any object on the report must be dragged down to allow the header to grow.
Next, determine the appropriate object for the report. There are four types: grids, images, text boxes, and charts. The most common object is the grid, which pulls data from HFM. Click the appropriate toolbar button (the first on the right hand toolbar) or select Insert Grid from the menu.
Draw the grid object by dragging the left mouse button into an area of the report work area. The placement of the grid can be moved later – initially it is not critical to lay it out exactly where it will be. In fact, for single grid reports, the placement of the grid is generally not important because grids will autosize by default.
Once the grid has been inserted, a prompt will ask for the connection information to the source database. Specify the database connection, provide and ID and password, and click OK. If a suitable connection has not been created, click on New Database Connection. Fill in the items or select from the dropdowns and click OK. Note that once the connection has been created, any future report can re-use the connection.

EPM Financial Management© Chapter 11: Financial Reporting Studio
11-5
Copyright 2009 www.123olap.com
After the database connection has been established, the Dimension Layout dialog box is displayed. At this point dimensions are placed into rows, columns, or pages. Dimensions not placed in any of these three areas remain in the point of view. Scroll down to access Custom3 and Custom4.

EPM Financial Management© Chapter 11: Financial Reporting Studio
11-6
Copyright 2009 www.123olap.com
There are five main components to the grid layout:
• Rows – displayed on the Y-axis of a report as rows. Multiple dimensions with multiple member selections can be selected for any rows.
• Columns – displayed in the X-axis of a report as columns. Multiple dimensions with multiple member selections can be selected for any columns.
• Pages – pages are displayed on a report so that the report will repeat for all page selections. The formatting on pages can display multiple reports on one page or on separate pages. Multiple dimensions with multiple member selections can be selected for any columns. Dimensions set as Page dimensions will appear in selectable drop down boxes for a Spreadsheet in the web client.
• Point of View – POV dimensions represent single member selections for the entire report. Only one member can be selected for each POV dimension. Books that reference Reports can create reports POV member selections in books. All of the dimensions initially appear in this section.
• Data Area – the data area displays the column/row data intersections in the report. All formatting is applied to the report in the Data Area. This area is not configurable from the Dimension Layout dialog box.
Drag the dimension labels to the desired areas and click OK when done. Note that multiple dimensions may be placed in any of the areas. After clicking the OK button, the report now looks like the following (Account are in the rows, and Period and Scenario are in the columns).
Selecting Members The Select Members dialog box is the key to selecting the members you want in the database. The selections can either be simple (a few members) or complex (children of CurrentAssets).
• For POV dimensions, only one member can be selected from a dimension. To select a member, expand the hierarchy and click on it.
• For Column, Row, and Page dimensions, multiple members are selected or lists are created.

EPM Financial Management© Chapter 11: Financial Reporting Studio
11-7
Copyright 2009 www.123olap.com
Adding, Removing, and Moving Member Selections Members are selected by double clicking on any of the columns or rows in the grid. The Select Members dialog box appears. The most basic method of selecting members is to expand the hierarchy on the left window of the Select Members dialog box. Click on the member and select the Add toolbar button. Items on the right will show in the rows/columns/pages.
Below adds the Budget scenario to the Actual scenario shown in the grid above.
To remove any members, select them in the Selected area, and choose the Remove button.
The top button moves a highlighted item, the lower button moves all items.
The toolbar button below the remove button will remove all selections. It is possible to change the order of the selected members with the up and down arrow toolbars:
Prompts and Current Point of View Along with the members shown on the left, there are two additional choices – refer to the above screenshot. Current point of view allows the dimension to be placed in the row or column but still dynamic to be in the point of view. This treatment is required when the row / column needs the dimension but still needs to be dynamic. The prompt creates a dialog box when the user runs the report to select the member(s). The developer can limit the choices provided to the user or allow them to pick from the hierarchy.

EPM Financial Management© Chapter 11: Financial Reporting Studio
11-8
Copyright 2009 www.123olap.com
Placing Selections into Separate Rows At the bottom right of the member selection box there is a check box to place the selections into separate rows. While not required, doing so provides two benefits. First, it is easier to see the contents of the rows/columns in the report. Second, the formatting is generally easier (does not require conditional formatting). For example, the total of a group of numbers may need to be formatted differently. Having the account for the total in a separate row makes it easier to format.
Relationship Function Selections Relationship functions allow reports to be more flexible by relying on hierarchies within the application. Well-designed reports rely heavily on relationship function definitions, as they offer the following advantages:
• Minimizes future maintenance. As new members are added into the relationship they automatically are shown on the report.
• Minimizes hard-coding of member names. This is important because member names can to change over time and all reports will need to be updated with them.
• Simplifies reports. Larger report selections clicking individual member names would be cumbersome and impractical and require an undesired level of maintenance, not only for changes but for new dimension members.
• Apply complex logic. Selections using And/Or logic can achieve more complex reports.
When adding a member, select the member and then click the Add Relationship button. It is the second button in the middle of the two panes. In the following screenshot, “Children of 110000” is added by clicking on 110000 and then clicking the Add Relationship button and selecting Children.

EPM Financial Management© Chapter 11: Financial Reporting Studio
11-9
Copyright 2009 www.123olap.com
Most functions selected will be applied relative to the member that is selected. Some functions may work independently of the member that is selected.
The selection now looks like the following:
Use the Remove button to move [None] out of the Selected area and click OK. The selection in the grid now shows the member selection just chosen.
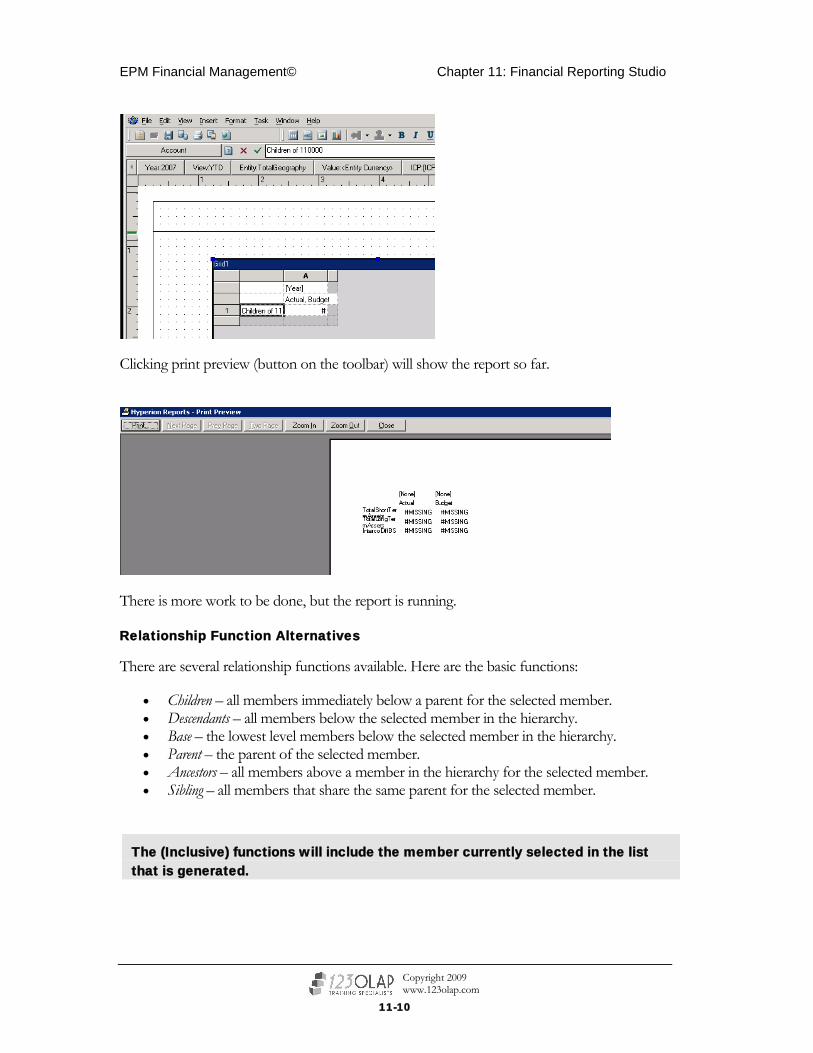
EPM Financial Management© Chapter 11: Financial Reporting Studio
11-10
Copyright 2009 www.123olap.com
Clicking print preview (button on the toolbar) will show the report so far.
There is more work to be done, but the report is running.
Relationship Function Alternatives
There are several relationship functions available. Here are the basic functions:
• Children – all members immediately below a parent for the selected member. • Descendants – all members below the selected member in the hierarchy. • Base – the lowest level members below the selected member in the hierarchy. • Parent – the parent of the selected member. • Ancestors – all members above a member in the hierarchy for the selected member. • Sibling – all members that share the same parent for the selected member.
The (Inclusive) functions will include the member currently selected in the list that is generated.

EPM Financial Management© Chapter 11: Financial Reporting Studio
11-11
Copyright 2009 www.123olap.com
In addition to the selections that are specified in the relationship functions, there are more functions available through the Functions tab:
Some of the functions in this tab are redundant – they are already included in the Members tab such as Children and Descendants. Note that the functions will change depending on the dimension – the above shows the functions for the Account dimension. With Match, members matching a specified pattern are shown. Examples include:
• D* – will find all members that start with the letter D. The * serves as a wildcard for any number of characters.
• ?ing – this is a character wildcard search so that all members ending in “ing” with any other first letter initiating the word will be selected – e.g. Bing, sing. The ? serves as a wildcard for a specific character.
Advanced Selections All of the selections can be combined to make more complex selection lists. Using And/Or/Union and Not logical operators, it is possible to extend the functionality of the Select Members dialog box.
After selecting the desired members, click View and then select Advanced.

EPM Financial Management© Chapter 11: Financial Reporting Studio
11-12
Copyright 2009 www.123olap.com
This selection changes the window to allow for operators to modify the selection. By adding account 111000 as a second selection, the operators can be used to exclude this account from the “Children of 110000” selection. Note also the check box for the first column to indicate “Not.”
This type of report building is useful when showing different members accounts at different levels – some in detail, some in summary – yet still wanting the report to be as dynamic as possible.
Lists Tab
The Lists Tab in the Select Members dialog box refers to the system generated and the administrator created member lists for the dimension.
Editing Selections Manually A shortcut to changing the selection is to type the selection directly into the selection text box. This requires knowing the exact member names.
Changing member names in the selection box can be much faster than going through the Member Select dialog box but should be used with caution when changing more complex selections based on relationship functions.
The reason for this is that the relationship function syntax varies per function and can be tricky. Although it is possible to change relationship functions, member names are more commonly edited directly.
Highlight the label to be changed and type directly into the text box above the point of view bar. Once complete, the green checkmark to the left of the box must be clicked in order for the change to be accepted.

EPM Financial Management© Chapter 11: Financial Reporting Studio
11-13
Copyright 2009 www.123olap.com
Select the checkbox to check the syntax and save the selection. Failing to do so will not save the new selection.
The error checker will let you know if a member is not valid such as in the following where we have typed a member incorrectly:
Limiting the Point of View Selections There are instances where one or more dimension may need to be hard-coded so that the user does not pick something wrong or the dimension is just not applicable; however, the dimension is not needed in the row/column/page either. Each grid has a point of view that is normally hidden. These can be opened up and one or more dimension set to a specific member.
To open the grid point of view, highlight the whole grid, right click, and select Grid Point of View.

EPM Financial Management© Chapter 11: Financial Reporting Studio
11-14
Copyright 2009 www.123olap.com
A point of view bar will be added to the grid, with each dimension pointing to the user point of view. If a dimension is hard-coded – see the View dimension set to YTD below – the dimension is removed from the user point of view. Note that View is on the user point of view above and not below.
The concept is to limit the users’ choices to just those that they would care about for the report. When the grid point of view has been set open the right click menu in the same fashion and turn off the grid point of view: the member settings will still be maintained.
Additional Rows/Columns When needing to insert a new row or column, highlight the row or column to come after the new, right click and select New. A second menu will appear with three options: data, formula, and text. The member selections described above are all data. Formulas and text will be covered later.
When wanting to add a new row or column to the end of the existing items, click on the gray box following the last item and perform the procedure above.

EPM Financial Management© Chapter 11: Financial Reporting Studio
11-15
Copyright 2009 www.123olap.com
Previewing the Report At any time the report can be previewed to see how it looks both printed and online. There are two icons for print preview.
The left button is print preview and provides an output equivalent to what would print. The right button is web preview and provides an output equivalent to viewing in Workspace. Both have their advantages. Print preview shows how the report will look printed, whereas web preview shows how the web only features, such as expansions (covered later), work with the report. Generally print preview is faster and is used more often during development.
When viewing a report in web preview, or running a report directly within Workspace, the view may be toggled via toolbar buttons to display the report via HTML or PDF. Generally HTML is quicker here.
Saving a Report To save a report, select the File>Save As menu option. Once you have chosen to save a report, the following dialog box will appear.

EPM Financial Management© Chapter 11: Financial Reporting Studio
11-16
Copyright 2009 www.123olap.com
Navigate to and select a folder into which to save the report. If needed, click the Create New Folder button. Type in a name and description and click Save.
Reports are saved with a .DES extension.
Keep in mind that reports can be easily renamed later, but renaming them must be done via the web interface. Reports cannot be renamed within Financial Reporting Studio. However, a report can be opened and saved with a different name (Save As). Deleting reports can be done via Financial Reporting Studio.
Page Dimension Rows and columns are familiar to everyone with prior reporting experience, including Microsoft Excel. The page area may not be as familiar. Within Financial Reporting, placing dimensions into the Page area has multiple purposes.
• Page dimensions are used to repeat reports for different member selections. • Printed reports can display paged reports on one or multiple sheets for each page
member selection. • From the web client, users will be able to select members from the page dimension
selections. These drop down box controls are filled with all the selections from the page dimensions.
• If reports will be run from books, page dimension selections are less commonly used. Books can cycle across POV dimensions. The exception to this is when multiple page member selections are printed on one sheet.
PERFORMANCE NOTE – When the report is run, all data is retrieved for all members on the page dimension, whether displayed or not. If the page dimension is significant the run times for the report can be excessive. Consider moving the members to the POV for one at a time selection and/or build a book to run the report with all of the members provided to the POV.
Grid Properties - Basic Formatting As shown earlier in the first print preview, the reports are not much without formatting. Within a report there are various levels of formatting, from the whole report to a single cell. The Property Sheet – shown as Report Properties at the beginning of the chapter – appears to the right of the report. The F4 key toggles the sheet on and off as needed. The contents of this dialog box will change based upon the clicked item in the report and the title of the box will change accordingly.

EPM Financial Management© Chapter 11: Financial Reporting Studio
11-17
Copyright 2009 www.123olap.com
The different items to click and format with the pane are:
• The report area itself (no object) • The label (as shown) • The cell in the grid (like A1) • The whole row or column • The whole grid (the gray box where the
row and column labels intersect)
The choices for formatting are different for each selection, and experimentation is the best way to learn the choices (highlight each and see what the choices are). Formatting changes for the whole grid are numerous enough to require multiple pages. Highlighting the whole grid will add a selection of pages at the top of the pane, each with its own set of choices.
Some of the most commonly used choices are:
• Show label or description – click on the row or column members and choose between label, description or both. A custom header is also available which can be hard-coded text and/or a text function – more on text functions later.
• Showing row headings between columns – click on entire grid and on the General page look for the Row Heading Before Column dropdown.
• Suppressing rows/columns with missing data or zero data – click on the row/column and check the radio buttons as appropriate. There are also suppression options available for the whole grid. There is also a conditional suppress that is covered later.
• Changing how missing data is displayed – click the whole grid and on the Suppression page change the boxes provided.
• Row and column heights/widths – click on the row/column and change the number. These may also be changed simply by clicking and dragging the line in between rows/columns as in Microsoft Excel.

EPM Financial Management© Chapter 11: Financial Reporting Studio
11-18
Copyright 2009 www.123olap.com
Another type of formatting is for the text: how do things appear on the report. While using the same selections above, click on either the Format toolbar button (has an A on it) or select the Format, Cells menu option.
The choices here will be familiar to Microsoft Excel users. Use the tabs at the top to navigate to the various areas. There is also a conditional format that is discussed later. One of the commonly used formatting options here is to place an overline on the subtotals. To put a line between a subtotal and the items adding up to the total, which may be a “children of” or other dynamic relationship, use a overline (on the border tab) on the subtotal. If an underline was placed on the row with the items, then the line would appear on the report under each item, not just the last one.
Sorting Sorting and ranking functions are built into Studio. Highlight the whole grid and on the properties pane check the Sort box and then click Setup.

EPM Financial Management© Chapter 11: Financial Reporting Studio
11-19
Copyright 2009 www.123olap.com
In the result box select the rows to sort and by what column. Multiple sorts can be added.
Expansions and Related Content Expansions are a significant feature enabled through the grid properties pane. Expansions enable users to drill down from parent members to their descendants while in the web interface. This feature is useful for when different users want different items shown in more detail. They can all start with a summary report, drill down their desired areas, and then print. Click the member label and check the box to enable.
Note that the user may drill down on the member(s) while in web preview but not in PDF or print preview mode. But, the user may drill down in web preview and then switch to PDF mode to print the report in the desired expanded state. Related content is similar to expansions and enabled in a similar fashion. The difference is that related content opens another report or document that relates to the original doc in some fashion. For example, the developer may add a related content link to a balance sheet for the intercompany accounts that opens a second report showing the intercompany account balance by intercompany partner. With related content users, in the HTML view, will click on the actual number to open the content. The point of view of the number clicked is passed to the second report.

EPM Financial Management© Chapter 11: Financial Reporting Studio
11-20
Copyright 2009 www.123olap.com
Highlight the desired cell or row or column and select Related Content. Then click on Setup to specify the report or URL (multiple may be chosen) that the user should see after clicking the link.
Conditional Suppression Discussed above is how to use the properties pane to perform basic suppression options: suppress if zero, suppress if no data, suppress if error. Sometimes, suppression is needed based on a condition. Highlighting a whole row or column changes the properties pane accordingly. Then, check the Advanced Options box and then click on Setup….
The line of dialog boxes guides the developer through the available choices. Note that the suppression can be done based on a single condition or multiple: use the and/or radio buttons on the far right accordingly after adding another condition.
A common use of this feature is to hide one row if another row is suppressed or equal to a specific number.

EPM Financial Management© Chapter 11: Financial Reporting Studio
11-21
Copyright 2009 www.123olap.com
Conditional Formatting Similar to conditional suppression, there is the option to conditionally format items. Highlight the row/column/grid/cell to be formatted and select Conditional Format (either from the Format menu, the toolbar button, or with a right click).
The resulting dialog box is similar to the conditional suppress in that the dialog boxes and fields guide the developer through the choices. There are two additional features. The first is the Format Cells button. Once the condition has been entered, click the Format Cells button to set the format for those items meeting the condition. The format cells dialog box is the same as seen before. Next, there is Add Format x and Delete Format in the upper right. These allow for multiple conditions to have different formats. For example, if a variance is greater than 10% then the row could be formatted as green and if the variance is less than -10% then the row could be formatted as red. The different formats are managed by the tabs that will extend above the conditions.
A common conditional format to use is to format the first row of a report to have a currency symbol. This format is easy if the first row is a single member; however, if the first row contains multiple members (ie, as a result of “children of …”) then a conditional format can perform the necessary formatting.

EPM Financial Management© Chapter 11: Financial Reporting Studio
11-22
Copyright 2009 www.123olap.com
Adding Text There are a couple of different ways of adding text. On the body of the report, there may be a need for a text box: a report title is the most common. One of the four object types – grid being one – is a text box. Either choose the Insert Text menu option or click on the Text Box toolbar button. As with grids, then drag within the report to create the box. Once created either hard-coded text or text functions can be added as needed.
Here is the Text Box properties pane which will appear when the text box is selected:
Besides the bordering and shading properties, an important property is Autosize – this feature will autosize the height (not the width) of a Text Box so that all the text fits.
The Show Text Function Errors should be displayed to more easily find any report function errors and to indicate potential problems to the end user.
Text Rows/Columns within Grids Text can also be added within a grid in rows and columns. This text could be a blank row for spacing, a header, a divider, or a comment. Using the new row/column method shown above, add a text row. This row can either be left blank, text entered, and/or one or more functions entered.

EPM Financial Management© Chapter 11: Financial Reporting Studio
11-23
Copyright 2009 www.123olap.com
Inserting Functions Functions can be added to the text boxes and rows/columns to provide references to report names, current dates, page numbers, and more. To insert a function in the text area, position the cursor where the function should be inserted and click the Insert Function button.
This will bring up the function browser. Select the function and type in the parameters for the function. Reference the online help for the syntax of each function.
Note that some functions are for other Hyperion products, such as Hyperion Planning or Hyperion Essbase and do not apply to Hyperion Financial Management.

EPM Financial Management© Chapter 11: Financial Reporting Studio
11-24
Copyright 2009 www.123olap.com
The report below shows the application of various functions.
Here is a summary of the most commonly used function capabilities:
• Page numbering including how many pages of the total • Date/Time /User ID/Report name references • References to data cell values • Member name or alias references for row, column or page dimensions • Referencing the data source name
Most implementations will use a standard footer and sometimes a standard header that are applied to all reports thus providing users consistent and common reference points.

EPM Financial Management© Chapter 11: Financial Reporting Studio
11-25
Copyright 2009 www.123olap.com
Adding Images In the same way that grids and text boxes are added to reports, an image may be added also. This is most commonly the company’s logo. Either choose the Insert Image menu option or click on the Image toolbar button. As with grids, then drag within the report to create the box. Once created a dialog box appears allowing the developer to navigate to and add the image.
Once on the report the image may be resized. Check the Stretch box on the properties pane to have the image resize with the box.

EPM Financial Management© Chapter 11: Financial Reporting Studio
11-26
Copyright 2009 www.123olap.com
Saved and Linked Objects With logos and standard text boxes, these should be all linked together across all reports, so that if the logo or the standard footer changes, all reports are updated automatically. This is accomplished with the used of saved and linked objects.
There are two parts to the procedure. The procedure is the same whether the object is a grid, text box, image, or chart. First, the object is saved in the repository. Right click the object and from the menu select Save Object….
Next, navigate to the desired folder in the repository and save the object. Ensure that the box at the bottom is checked to link to source object. With this link, the report will be linked to the object and will pick up any future changes to the object.
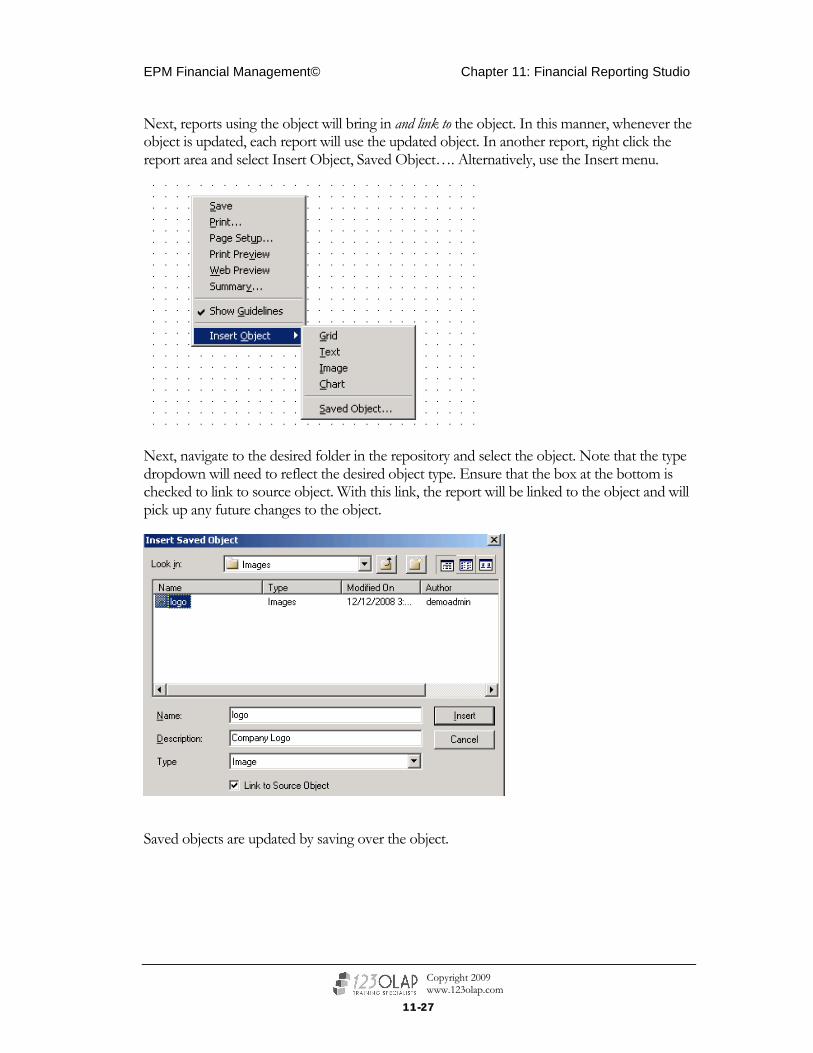
EPM Financial Management© Chapter 11: Financial Reporting Studio
11-27
Copyright 2009 www.123olap.com
Next, reports using the object will bring in and link to the object. In this manner, whenever the object is updated, each report will use the updated object. In another report, right click the report area and select Insert Object, Saved Object…. Alternatively, use the Insert menu.
Next, navigate to the desired folder in the repository and select the object. Note that the type dropdown will need to reflect the desired object type. Ensure that the box at the bottom is checked to link to source object. With this link, the report will be linked to the object and will pick up any future changes to the object.
Saved objects are updated by saving over the object.

EPM Financial Management© Chapter 11: Financial Reporting Studio
11-28
Copyright 2009 www.123olap.com
Row and Column Templates Just as objects can be saved to the repository, sets of rows and columns can be saved and reused. Called templates, these can be brought into other reports and save time with report building. If the templates remain linked (in the same manner as objects), the report will reflect any changes made to the saved template.
LIMITED USE – There are several system limitations that prevent the use of row and column templates. These are listed in the documentation. The limitations are significant enough to render templates useless in many instances.
To create a template, highlight the rows or columns to save out. Right click and select Save as Row and Column Template.
Navigate to the appropriate folder within the Repository and save the template.

EPM Financial Management© Chapter 11: Financial Reporting Studio
11-29
Copyright 2009 www.123olap.com
Linking to the source object works the same way as with objects. After clicking Save, a dialog box appears to ask how to handle some features that can either be saved with the template or inherited from the grid using the template.
Use the Insert Row and Column template to bring a template into a grid. When a template is in a grid and is linked, the rows/columns will be shaded yellow to indicate their status as a template. If the link is removed then the rows/columns return to normal.
There must be at least one data row and one data column native to each grid. These can be suppressed if just placeholders and the template has 100% of the rows/columns required. In the above screenshot row 2 is native and row 1 is a template.
Formulas Formulas can be added to reports to augment the data coming from HFM. A formula could be a simple subtotal or could be a built in function.
To add a formula, add a new row/column to the data grid and select Formula. Note the new row/column is added with an equal sign in front of the # signs in the grid. Formulas can either be added for the whole row/column (by highlighting) or each cell.

EPM Financial Management© Chapter 11: Financial Reporting Studio
11-30
Copyright 2009 www.123olap.com
In the screenshot above, a formula column has been added. Also note the dropdown under the menu and toolbar: the current value is Sum(). This dropdown contains the formulas that HFM knows. Formulas may be chosen from the dropdown or just directly entered into the formula bar. The help icon to the right of the dropdown can be used to see directions and samples for each formula.
In the example below the PercentOfTotal formula is used to show each member in row 1’s percentage of row 2. The square brackets ( [ and ] ) are used to denote rows/columns/pages and cells as needed.

EPM Financial Management© Chapter 11: Financial Reporting Studio
11-31
Copyright 2009 www.123olap.com
When formulas are used, generally custom headers are also used to provide an appropriate header; otherwise, the formula prints as the header.
Refer to the help for information about each formula.
Charting Charts can be added to reports to provide a visual display of the data and is particularly informative with trends. Note that a grid must exist in the report to support the chart.
Charts can be linked to one Grid object. Inserting Charts into a report with no Grid object to attach the Chart to will result in a blank output for the Chart. To see only the Chart when running, hide the Grid.
To create a chart follow these steps:
• Insert a Grid Object. • Lay out the dimensions in the Grid. • Select members from each of the Grid dimensions. • Select Insert>Chart. Then, draw out the Chart in the Report workspace:
• Position the Chart in the Report Designer workspace.
• Change the properties for the Chart. • Suppress the grid to prevent from printing if necessary.

EPM Financial Management© Chapter 11: Financial Reporting Studio
11-32
Copyright 2009 www.123olap.com
Chart Layout If we preview the previous report, the following report is displayed:
Notice that the columns (Time) form the Y-axis and the rows (Products) show up as the X-axis. If multiple dimensions exist on the rows/columns then the chart will be executed for all combinations of rows/columns.
Types of Charts There are four different types of Charts to select from. We find that the most common charts used are the Bar and Pie charts.
To select a different Chart type, select the Chart that was inserted in the Report Designer workspace. Then, select the Chart Type drop down box:
Here are the choices with some samples:
Line Charts Pie Charts
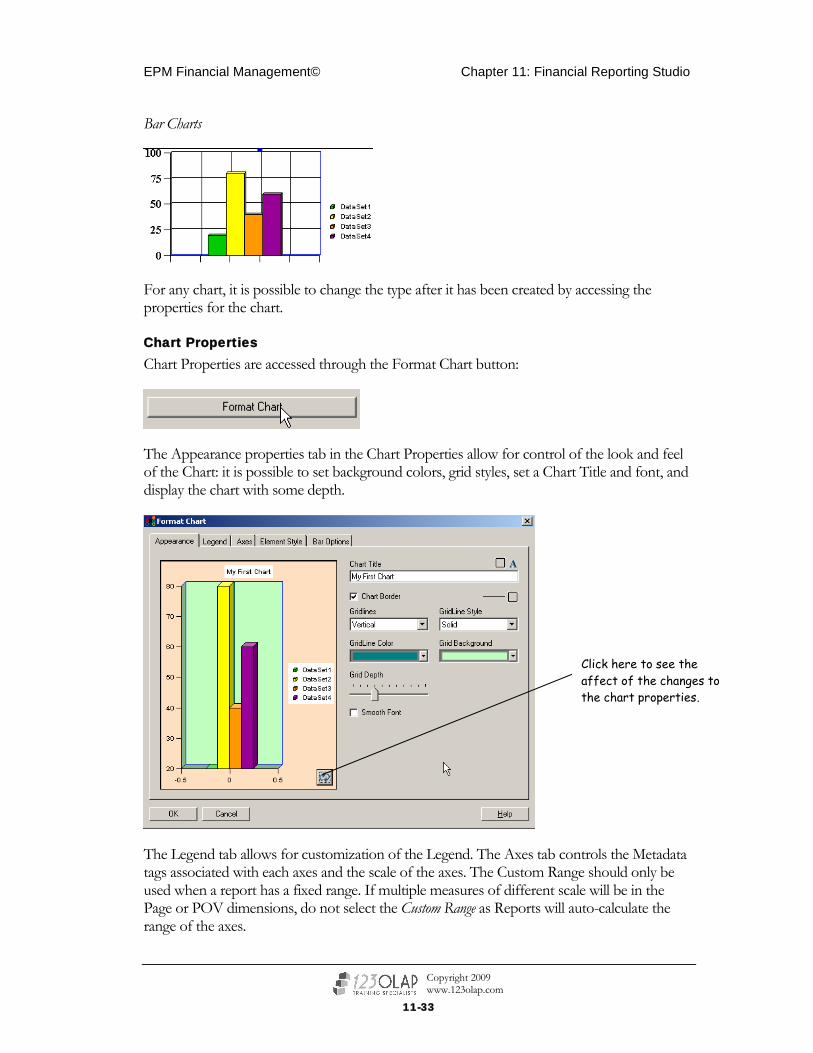
EPM Financial Management© Chapter 11: Financial Reporting Studio
11-33
Copyright 2009 www.123olap.com
Bar Charts
For any chart, it is possible to change the type after it has been created by accessing the properties for the chart.
Chart Properties Chart Properties are accessed through the Format Chart button:
The Appearance properties tab in the Chart Properties allow for control of the look and feel of the Chart: it is possible to set background colors, grid styles, set a Chart Title and font, and display the chart with some depth.
The Legend tab allows for customization of the Legend. The Axes tab controls the Metadata tags associated with each axes and the scale of the axes. The Custom Range should only be used when a report has a fixed range. If multiple measures of different scale will be in the Page or POV dimensions, do not select the Custom Range as Reports will auto-calculate the range of the axes.
Click here to see the affect of the changes to the chart properties.

EPM Financial Management© Chapter 11: Financial Reporting Studio
11-34
Copyright 2009 www.123olap.com
Although it is possible to hard-code the scale of the Chart, not selecting it will automatically scale the chart based on the selection in the POV and/or Page dimensions. This is useful when a report changes from displaying amounts to percents.
The Element Style allows designers to change colors and styles for the data sets within a Chart. There is also a special tab for Bar Charts that allow for additional control of this type of chart.
Charting is a reiterative process of changing a setting, previewing the report, and then repeating to find the appropriate look and feel for the report.
Summary Financial Reporting Studio is the developer’s tool to build production quality reports. There are many tools at the developer’s disposal and most report types can be produced with ease.

12-1
Copyright 2009 www.123olap.com
Workspace Reporting Working with reports in Workspace
he focus of this Chapter shifts to working with reports and various reporting features within the Hyperion Workspace.
Chapter
12 T

EPM Financial Management© Chapter 12: Workspace Reporting
12-2
Copyright 2009 www.123olap.com
Workspace Workspace is the front end for all end user activity with the Hyperion suite.
• Access is through a web browser and requires no distribution. No printing, no emailing – users come through the web to access reports.
• The interface is easy to use. Drop down box controls for POV and page dimensions provide bulletproof front-end interactivity.
• Offers the ability for dynamic reports. Users will interact with the reports so that real-time numbers are retrieved from Hyperion. The exception is snapshot reports where copies are distributed after having been run at a specific point in time. These run quicker in that data does not have to be retrieved each time; however, they reflect the data at a point in time and do not recognize any subsequent changes.
• Besides providing the web interface for end-users, Workspace is used by developers and administrators for other tools not available in Financial Reporting Studio. Some of these tools include creating and managing Books, Batches, and Snapshots.
Logging into Workspace Users accessing Workspace would enter a URL into the browser as in the following example:
The address contains the server name, the port number used during the installation (19000 is the default). At the dialog box, users enter their user ID and password. Once logged in, they navigate the same Repository as shown in the prior chapters.
User POV Setup The User Point of View (POV) allows for the default POV dimensions to be represented with the selected POV member combinations. In addition, books that do not have members specified for the POV will use the User POV by default.
In Workspace, the default setting is to not show the selected POV members on the report. This can be customized by changing the Financial Reporting properties in Workspace so that the POV selected members show up at the top of the report.

EPM Financial Management© Chapter 12: Workspace Reporting
12-3
Copyright 2009 www.123olap.com
To change the properties so that the POV selections show on the report, select File>Preferences from the menu option in Workspace:
Select the Financial Reporting icon from the left navigation panel and click on the Above Report/Book radio button.
The following dialog box is displayed. Note that all the dimensions are displayed and that default member selections can be made for any of the members in any of the dimensions. Depending on the report layout, the dimensions that are set up as POV dimensions will vary. For this reason, it is possible to select defaults for all dimensions.

EPM Financial Management© Chapter 12: Workspace Reporting
12-4
Copyright 2009 www.123olap.com
Note that you can also further restrict members by choosing the Setup Members: In addition, choose properties for how to display the POV dimensions. For example, in the drop down selections at the bottom, choose to show dimension labels and whether to display descriptions or member names, as well as if to include the dimension label.
Select the button next to the ALL buttons to the right: The web Member Select dialog box will allow you to select the member combinations. This Member Select offers the same capabilities as the Financial Reporting Studio selects.
Click OK for the Setup User POV and click OK for the Financial Reporting
Most of the time, simply refreshing a report will not show changes to the properties for Financial Reporting – you must close and reopen the report to see the effect of your changes.

EPM Financial Management© Chapter 12: Workspace Reporting
12-5
Copyright 2009 www.123olap.com
While a user is in Preferences, the other preferences should be established as well. Click the icons on the left of the pane to access the various areas.
Users can select on any of the page dimensions to change the report view. The use of pages depends on the deployment technique – if using the web to deploy reports, pages can provide a nice interface for giving users access to predefined selections; but for printed reports, report books tend to drive the number of reports and it is best to leave the dimensions in the POV section of the layout.
POV’s can be changed by clicking on the header dimension buttons.
Regardless of the Page Printing Position selection (one or multiple sheets), pages are always displayed as drop down boxes in the web client. If multiple pages should appear in a report, consider using multiple grids in the report designer.
If there are multiple Page dimensions in the report, then all of the selections combinations across the page dimensions are displayed in concatenated form. This form shows the drop down selection as a concatenation of all the selected product and dealer combinations:
As more dimensions are added to the Page section of a Report, the drop down box in the web client list will become a concatenation of all the dimensions. Selections with more than a couple of dimensions can become cluttered.

EPM Financial Management© Chapter 12: Workspace Reporting
12-6
Copyright 2009 www.123olap.com
Note that the report was run with the POV dimensions set to the current setting from the Financial Reporting Studio. To change the POV dimension selections, select the View>Preview User Point of View menu option:
The following POV selections are displayed:
Select the desired members from the POV dimensions by clicking the Select button for that dimension. Keep in mind that changes made to the Point of Views can be changed later and the entire report will be displayed for the selected POVs.
Web selection of POV members follow the same rules as with the Reports Client - only one member can be selected at any one time.

EPM Financial Management© Chapter 12: Workspace Reporting
12-7
Copyright 2009 www.123olap.com
Here’s the Member Select dialog box through the web:
The Member Select web dialog box offers similar capabilities as the Reports Client. Most of the time, the selection is done by clicking through the hierarchy or searching on a known member name. However, all of the functions can be utilized for more complex selections.
Select a member and click OK. The report output will change to the new selection.
Books Books are collections of reports. The most common book is a month end reporting package. The book can be comprised of many reports for one or more points of view or just a single report for multiple points of view. The results of the book can be output in multiple directions. It is common to choose multiple members from each POV dimension in a report – each report is executed for all combinations of the selected members.
Leave members that will have multiple selections representing different pages of reports as POV dimensions in a report. If a report will be distributed through Books, using Page dimensions on the same report only makes sense when they are printed on the same sheet.

EPM Financial Management© Chapter 12: Workspace Reporting
12-8
Copyright 2009 www.123olap.com
Creating Books From Workspace, select File>New Document::
Select the Collect Reports into a Book radio button:

EPM Financial Management© Chapter 12: Workspace Reporting
12-9
Copyright 2009 www.123olap.com
Click Next and the report selection dialog box will show. Add a report from the Repository by browsing to find it. Either multiple or a single report can be selected.
If a book has already been created, add reports by right clicking and selecting Add Reports:

EPM Financial Management© Chapter 12: Workspace Reporting
12-10
Copyright 2009 www.123olap.com
Deleting Reports from a Book Once reports have been added to a Book, they can be deleted selecting the report and selecting Remove from selected button:
Selecting Members for Books Once one or more reports have been added to a book, the next step is to set the point of view for the reports.

EPM Financial Management© Chapter 12: Workspace Reporting
12-11
Copyright 2009 www.123olap.com
Double-click on the dimensions to bring up the member name selector. Alternately, select the Select Members toolbar button.
The Member Select capabilities for the web are identical to those shown previously in the Reports Client. The three tabs in the report allow selection between Members, Lists, and Functions. Select members from each of the POV dimensions for each report.

EPM Financial Management© Chapter 12: Workspace Reporting
12-12
Copyright 2009 www.123olap.com
Previewing Books To preview a Book once the reports have been added and the members for the POV dimensions have been selected, choose the File>Open In>PDF Preview:
Below is a screenshot for all the pages of the reports that will be displayed depending on what the POV selections that were made. Click on a report in the Book and select the Show Report button:
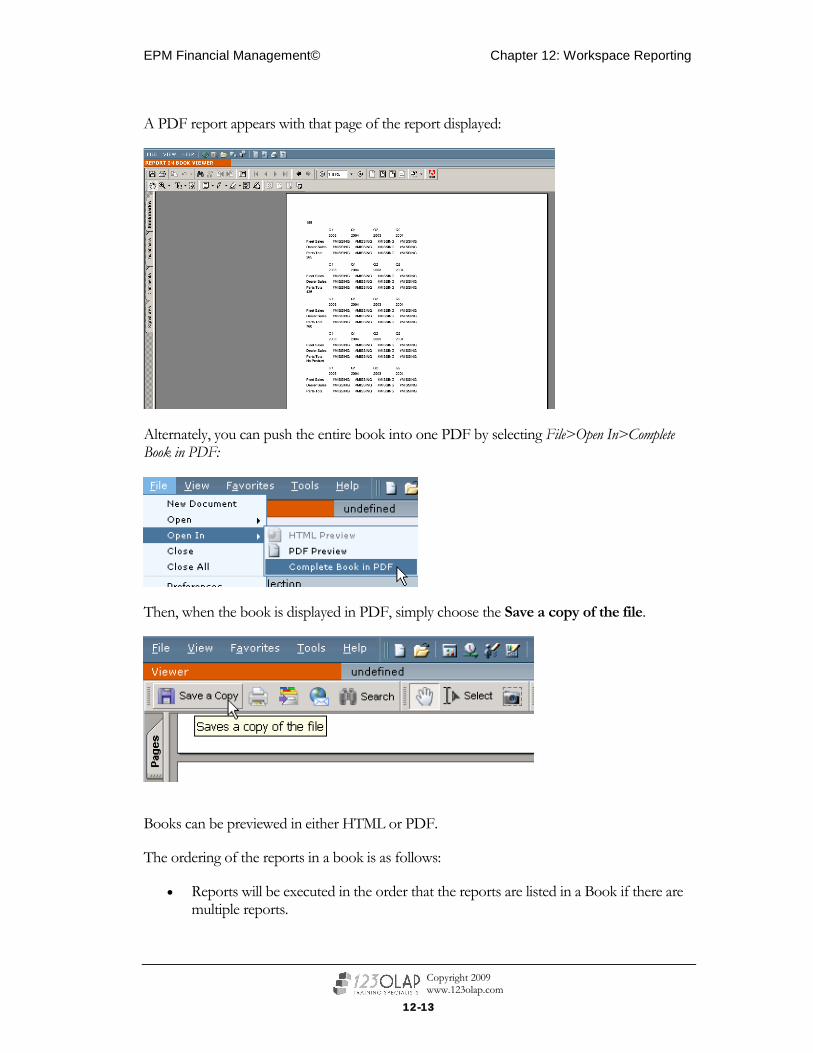
EPM Financial Management© Chapter 12: Workspace Reporting
12-13
Copyright 2009 www.123olap.com
A PDF report appears with that page of the report displayed:
Alternately, you can push the entire book into one PDF by selecting File>Open In>Complete Book in PDF:
Then, when the book is displayed in PDF, simply choose the Save a copy of the file.
Books can be previewed in either HTML or PDF.
The ordering of the reports in a book is as follows:
• Reports will be executed in the order that the reports are listed in a Book if there are multiple reports.

EPM Financial Management© Chapter 12: Workspace Reporting
12-14
Copyright 2009 www.123olap.com
• Report printing will be run in the sort order of the dimension POVs listed. In the example above, the reports are sorted by Dealer and then by Department because they appear that way in the Book..
To change the report execution order in a Book move the reports up or down in the book. Report execution will be in the order they are listed.
For each report, it is possible to change the dimension order within a report. To do this, right-click on the dimension and select Move Up or Move Down:
Saving Books As with reports, books can be saved in any directory within the Repository. It is probably best to keep it in the same directory where the reports contained within the book are stored. Simply select File>Save from the menu option.

EPM Financial Management© Chapter 12: Workspace Reporting
12-15
Copyright 2009 www.123olap.com
Book Setup The book setup is much like the page setup for printing. Book setup controls various aspects of the appearance such as whether the distribution will be by hard copy, PDF, or HTML.
Table of Contents. Choose this option to display a table of contents
Paper Size – the default as with normal print options is letter size
Orientation – choose between landscape and portrait modes
Page Numbering – turn on or off the Page numbering feature
Collation – the reports can be grouped by reports or by member selections. This affects the order that reports are printed out when multiple reports are contained in a Book. The order of the pages can be by report or by member name.
To change the Book setting, select File>Book Setup from the menu option in the Workspace:
Next, select the options to control the properties as shown below:

EPM Financial Management© Chapter 12: Workspace Reporting
12-16
Copyright 2009 www.123olap.com
Batches Batches are used to automate report and book execution. Batches allow you to schedule reports and specify the output format. When executing reports through batches, designers have, among others, the following output options.
• Hardcopy - Printing to a specified printer. • PDF – The batch will generate a PDF document that can be distributed via email. • HTML – The batch will generate HTML documents that can be distributed via the
web. A location can be specified on the web. • Snapshot – This will generate all reports in a pre-retrieved format and is most often
used when a report will be distributed through the Reports Client. It is important to note that snapshots represent a pull of the data as of the batch execution time – they are not dynamically pulled when the users interface with them.
To create a batch, select File>New Document. Next, select the Batch radio button:
Click the Next button. Both reports and books can be added.
Click Finish when all the reports and books have been added.

EPM Financial Management© Chapter 12: Workspace Reporting
12-17
Copyright 2009 www.123olap.com
The Batch Editor appears and shows the book that we added in the previous step:
Select the Edit>Add Item(s) menu option, if you want to add another report or book. Can also choose to delete an item from the Batch, or change the member selections for a book.
Once all books, reports, and snapshots have been added, save the batch by selecting File>Save As from the menu option:
Here we give the batch a name and save it in the 123olapReports folder.

EPM Financial Management© Chapter 12: Workspace Reporting
12-18
Copyright 2009 www.123olap.com
Scheduling Batches Once a batch has been created, it is possible to schedule the Batch to run at a specific time in the future or immediately. To do so, select Edit>Schedule Batch:
The Schedule Batch dialog box appears. Navigate to a batch that has been saved, highlight, and click Next.

EPM Financial Management© Chapter 12: Workspace Reporting
12-19
Copyright 2009 www.123olap.com
Select the NEXT button to proceed:
The Start Time dialog box appears. It is possible and often the case to just run it “Now” or immediately. However, it is also possible to schedule the Batch to run at the following times:
• Once – run the batch at a specified time. Select this if you do not want to run the Batch immediately but on a specific time later.
• Weekdays – run the batch every weekday at a specified time. • Daily – Same as weekdays but on weekends too. • Weekly – run the batch only a weekly basis at a specified day and time. • Monthly – run the batch every month at a specified day and time. • Quarterly, Semiannually, Annually – these options are not often used but will run
quarterly, two times a year, or once a year at the specified days and times.
Note that the section at the bottom specifies the members from each dimension for the reports:

EPM Financial Management© Chapter 12: Workspace Reporting
12-20
Copyright 2009 www.123olap.com
It is possible to change the Batch Point of View for each batch, but generally this is not practical.
Select the NEXT button to continue scheduling the Batch job:
The Destinations allow you to specify the Batch output. When executing reports through Batches, designers have the following available options for output:
• Hardcopy – Select the Print to option and specify a printer. This will create a hardcopy report to a specified printer.
• PDF – Select the Export as PDF option. The batch will generate a PDF document that can then be distributed via email. It is possible to specify an “External directory”. This is any directory not in the Financial Reporting repository.
• HTML – Select the Export as HTML option. The batch will generate HTML documents that can then be distributed via the web. If an external directory is specified, then the report will be saved to that directory. This is most commonly an intranet site (external refers to any location outside the repository).
• Snapshot – Choose the Save As Snapshot option. It is important to note that snapshots represent a pull of the data as of the batch execution time – they are not dynamically pulled when the users interface with them.
• Email – If successful, the batch output can be distributed to a specified list of users. If unsuccessful, the details are usually sent to the administrator(s).

EPM Financial Management© Chapter 12: Workspace Reporting
12-21
Copyright 2009 www.123olap.com
If selecting this option, select the users to receive the report as below.
Click the FINISH button to finish scheduling the Batch job:

EPM Financial Management© Chapter 12: Workspace Reporting
12-22
Copyright 2009 www.123olap.com
Batch Scheduler To view all of the batches that have been scheduled, open up the Batch Scheduler. From the Reports Web Client, select the Tools>Schedule>Batch Scheduler menu option:
The batch just scheduled will be displayed:
Notice the status shows that the Batch above is currently Successful.
The various status options are:
• Running – a Batch that is currently being executed will display this status. • Successful – a Batch has been executed without errors will display this status. • Error – a Batch that resulted in an error during execution will display this status. • Pending – a Batch that is currently scheduled to execute at a future time will display
this status.
While working with the Scheduler, refresh to see the latest status settings. Select View>Refresh:

EPM Financial Management© Chapter 12: Workspace Reporting
12-23
Copyright 2009 www.123olap.com
To view the details of a batch especially when errors have occurred, select the batch in the scheduler and right-click select Show Details:
The details of the batch execution are displayed:

EPM Financial Management© Chapter 12: Workspace Reporting
12-24
Copyright 2009 www.123olap.com
Canceling Batches If a batch has been scheduled but is pending execution, it is possible to cancel it. Select the batch in the scheduler and right-click on it. Select the Delete menu option:
Confirm to delete the batch.
Batch Outputs Where does the output of PDF go when the External option is not chosen in the Batch scheduler? When you do not specify “External location”, the default location is the repository home directory. A folder with a number is stored in the Scheduler Output directory. Each batch that will run will have a batch number associated with it – this number is incremented each time. The folders can later be renamed. Here is a screenshot of the PDF output that was generated for the first batch run on the system.

EPM Financial Management© Chapter 12: Workspace Reporting
12-25
Copyright 2009 www.123olap.com
A Zip file will be created with all the PDF reports zipped into it. This may be optimal for sending files over email as the files will be compressed. By navigating to the Class Reports folder, we can see the actual PDF that was created:
Alternately, and more likely, it is possible to retrieve the output via the Workspace. This may be necessary as administrators typically do not have access to folders on the Reports server directories. From the Scheduler, select the batch that was run and right-click on it. Choose the Retrieve Output menu option:

EPM Financial Management© Chapter 12: Workspace Reporting
12-26
Copyright 2009 www.123olap.com
Next is a prompt to save the Zip file to a specific location. It is also possible to rename the file.
If this seems like a lot to go through, consider this:
During batch creation, it is possible to specify an external directory. If the Financial Reporting server is set up to map to a networked directory, then the process of retrieving batch output can be bypassed altogether.
Snapshots Snapshots allow distribution of reports without requiring dynamic retrievals from Hyperion. This will improve report performance as all the reports have already been executed and saved. In addition, consider the following advantage:
Because Snapshots are static, they represent reports that have been audited and verified. Dynamic reports may be executed at a point in time when the database is being reloaded or calculated – the problem here is that the database may be available but the data may not have been audited!
Snapshots can be previewed by selecting the Snapshot as we have in the following:
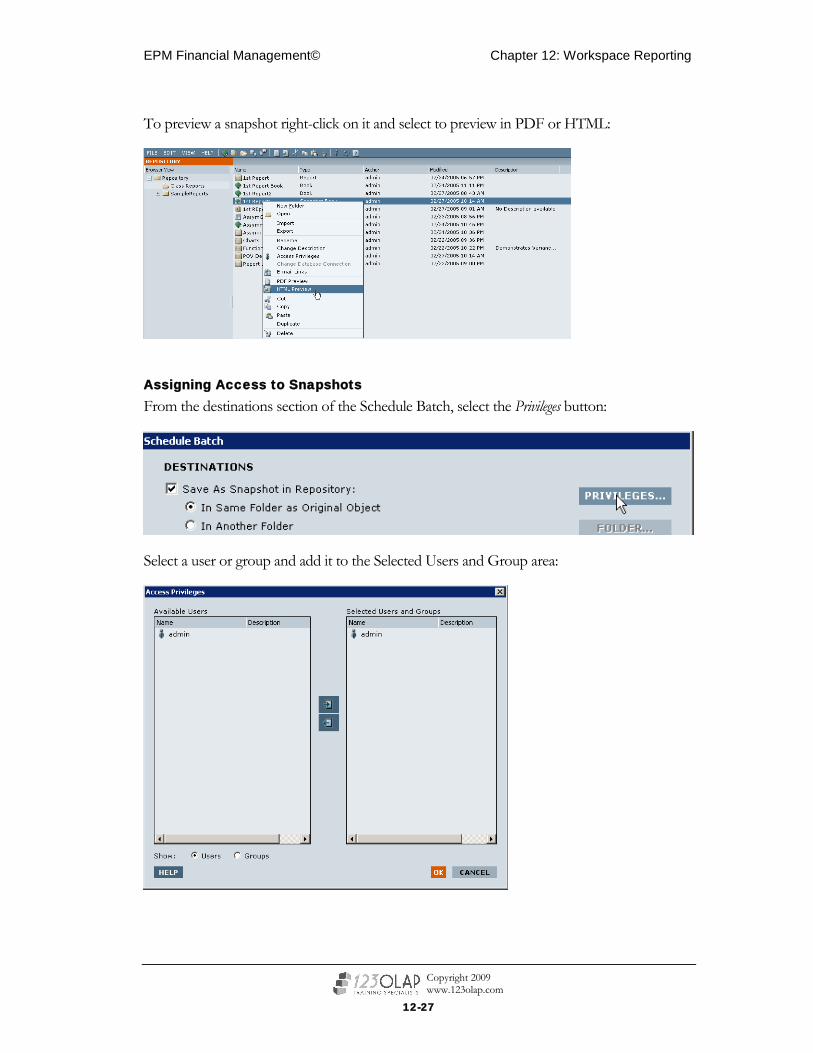
EPM Financial Management© Chapter 12: Workspace Reporting
12-27
Copyright 2009 www.123olap.com
To preview a snapshot right-click on it and select to preview in PDF or HTML:
Assigning Access to Snapshots From the destinations section of the Schedule Batch, select the Privileges button:
Select a user or group and add it to the Selected Users and Group area:
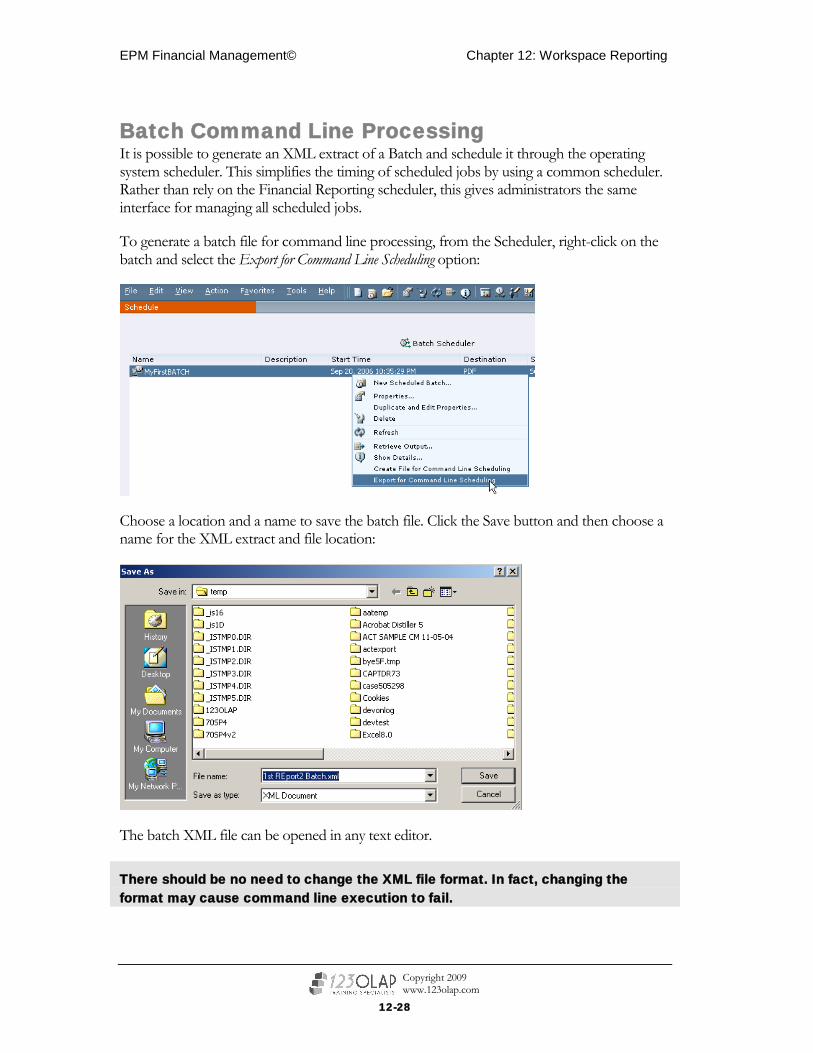
EPM Financial Management© Chapter 12: Workspace Reporting
12-28
Copyright 2009 www.123olap.com
Batch Command Line Processing It is possible to generate an XML extract of a Batch and schedule it through the operating system scheduler. This simplifies the timing of scheduled jobs by using a common scheduler. Rather than rely on the Financial Reporting scheduler, this gives administrators the same interface for managing all scheduled jobs.
To generate a batch file for command line processing, from the Scheduler, right-click on the batch and select the Export for Command Line Scheduling option:
Choose a location and a name to save the batch file. Click the Save button and then choose a name for the XML extract and file location:
The batch XML file can be opened in any text editor.
There should be no need to change the XML file format. In fact, changing the format may cause command line execution to fail.

EPM Financial Management© Chapter 12: Workspace Reporting
12-29
Copyright 2009 www.123olap.com
Here is an excerpt of the XML file that is generated:
When generating command line references for batches, follow this guideline:
Batches that will be used for command line processing should use the Schedule Now option. For automation purposes with database maintenance – reports should be executed as soon as the batch command line is referenced.
To not reference a batch that has already been scheduled for processing, you can create a command line from scratch. To do select the Create File for Command Line Scheduling:
Walk through all of the steps for scheduling a batch as we have shown in creating a batch. The result of this will be to prompt to save the report in XML format.
To launch XML batches from a command line, you must reference the ScheduleBatch.cmd command. The basic format is:
ScheduleBatch exportBatchName.xml ReportServer

EPM Financial Management© Chapter 12: Workspace Reporting
12-30
Copyright 2009 www.123olap.com
In the following command window, launch the ScheduleBatch and feed it the XML export first generated and reference the report server: