hypoglycemia - nyspfpa. insulin induced hypoglycemia is a top source of inpatient ades b....
TRANSCRIPT
Hypoglycemia
1
Outline
• Top causes of inpatient hypoglycemia• Strategies preventing hypoglycemia• RN driven hypoglycemia protocols• Systems for tracking hypoglycemic
events
2
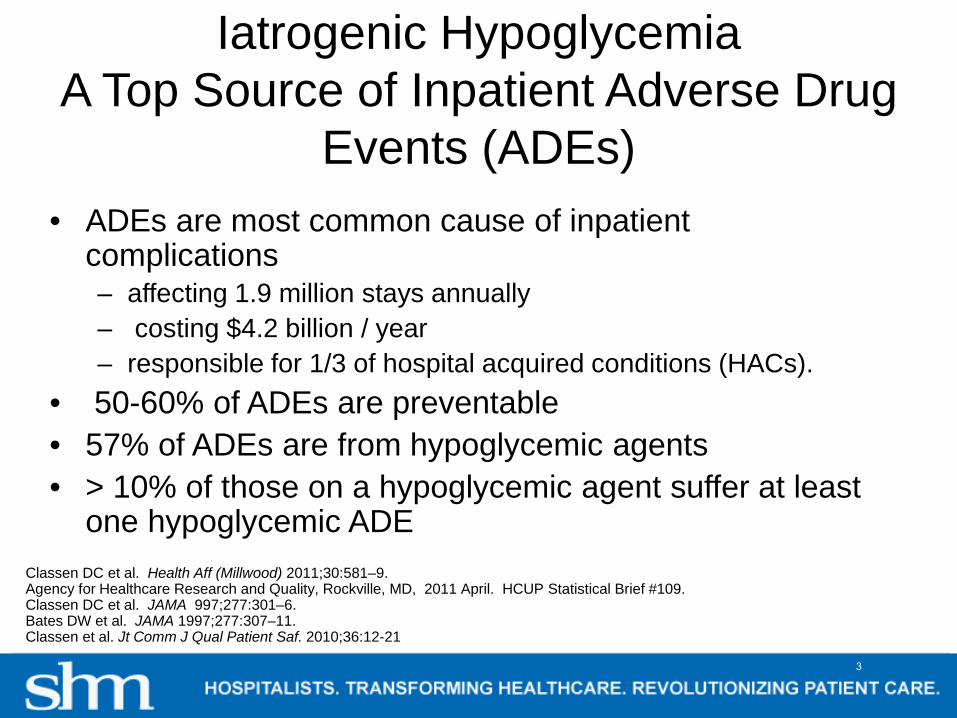
Iatrogenic HypoglycemiaA Top Source of Inpatient Adverse Drug
Events (ADEs)• ADEs are most common cause of inpatient
complications– affecting 1.9 million stays annually– costing $4.2 billion / year– responsible for 1/3 of hospital acquired conditions (HACs).
• 50-60% of ADEs are preventable• 57% of ADEs are from hypoglycemic agents• > 10% of those on a hypoglycemic agent suffer at least
one hypoglycemic ADEClassen DC et al. Health Aff (Millwood) 2011;30:581–9.Agency for Healthcare Research and Quality, Rockville, MD, 2011 April. HCUP Statistical Brief #109.Classen DC et al. JAMA 997;277:301–6. Bates DW et al. JAMA 1997;277:307–11. Classen et al. Jt Comm J Qual Patient Saf. 2010;36:12-21
3
What level of BG constitutes Hypoglycemia?
A. 80 mg/dLB. 70 mg/dLC. 60 mg/dLD. 40 mg/dL
4
What level of BG constitutes Hypoglycemia?
A. 80 mg/dLB. 70 mg/dL physiologic response occursC. 60 mg/dLD. 40 mg/dL (severe hypoglycemia)
5
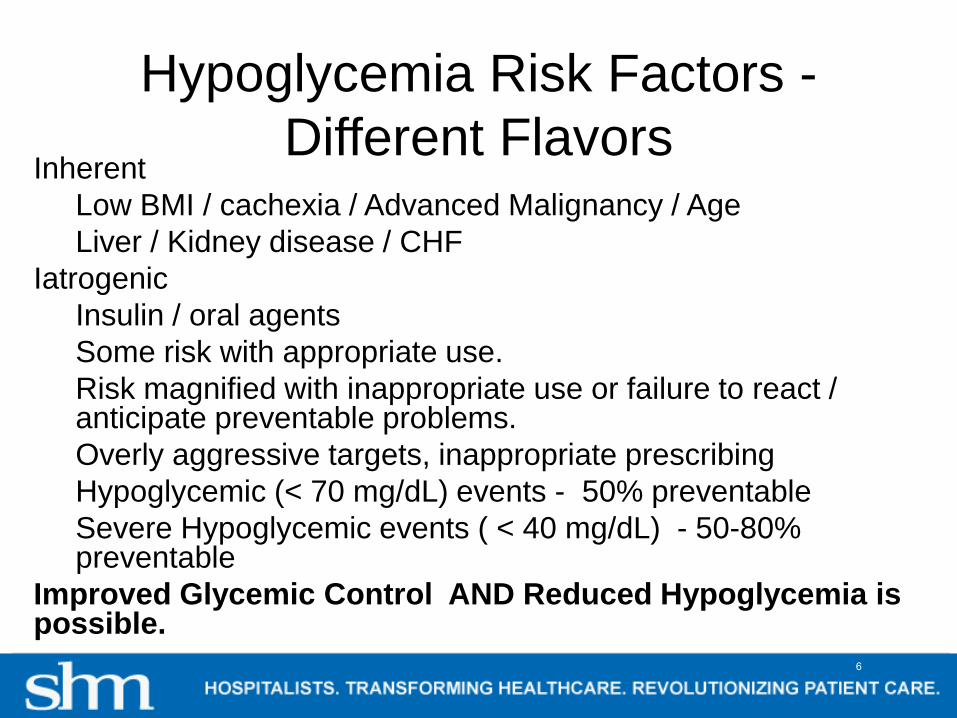
Hypoglycemia Risk Factors -Different Flavors
InherentLow BMI / cachexia / Advanced Malignancy / AgeLiver / Kidney disease / CHF
IatrogenicInsulin / oral agentsSome risk with appropriate use.Risk magnified with inappropriate use or failure to react / anticipate preventable problems.Overly aggressive targets, inappropriate prescribingHypoglycemic (< 70 mg/dL) events - 50% preventableSevere Hypoglycemic events ( < 40 mg/dL) - 50-80% preventable
Improved Glycemic Control AND Reduced Hypoglycemia is possible.
6
The most powerful predictor for an inpatient to experience an iatrogenic
hypoglycemic ADE?
A. Liver DiseaseB. Advanced AgeC. A prior hypoglycemic event during same stayD. Cancer
7
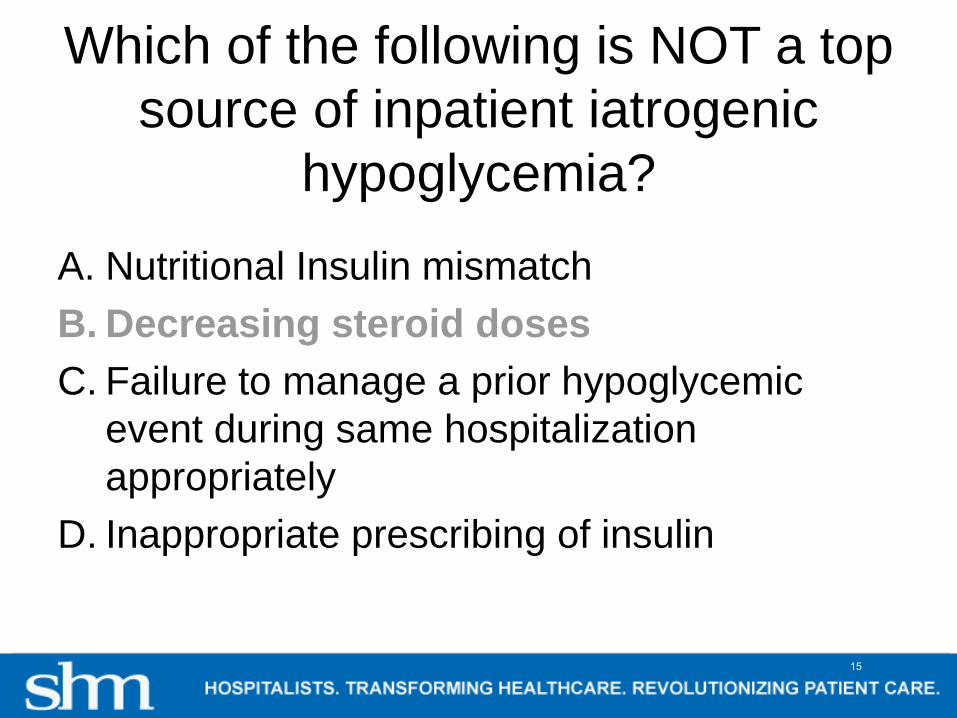
Which of the following is NOT a top source of inpatient iatrogenic
hypoglycemia?A. Nutritional Insulin mismatch B. Decreasing steroid dosesC. Failure to manage a prior hypoglycemic
event during same hospitalization appropriately
D. Inappropriate prescribing of insulin
8

Iatrogenic Hypoglycemia– Etiologic factor % of hypo cases– Reduction in enteral intake 40– Insulin adjustment 6.1– Steroid withdrawal 0.4– Unclear 43– “Diverse causes” 10.4– Medication error none
• Poor hypoglycemia management and follow up was the rule– < 50% with documented euglycemia within 2 hours of hypo
event– Average time to documented resolution was 4 hrs, 3mins – (median 2 hrs, 25mins)
Varghese P, et al. J Hosp Med. 2007; 2:234-240)9
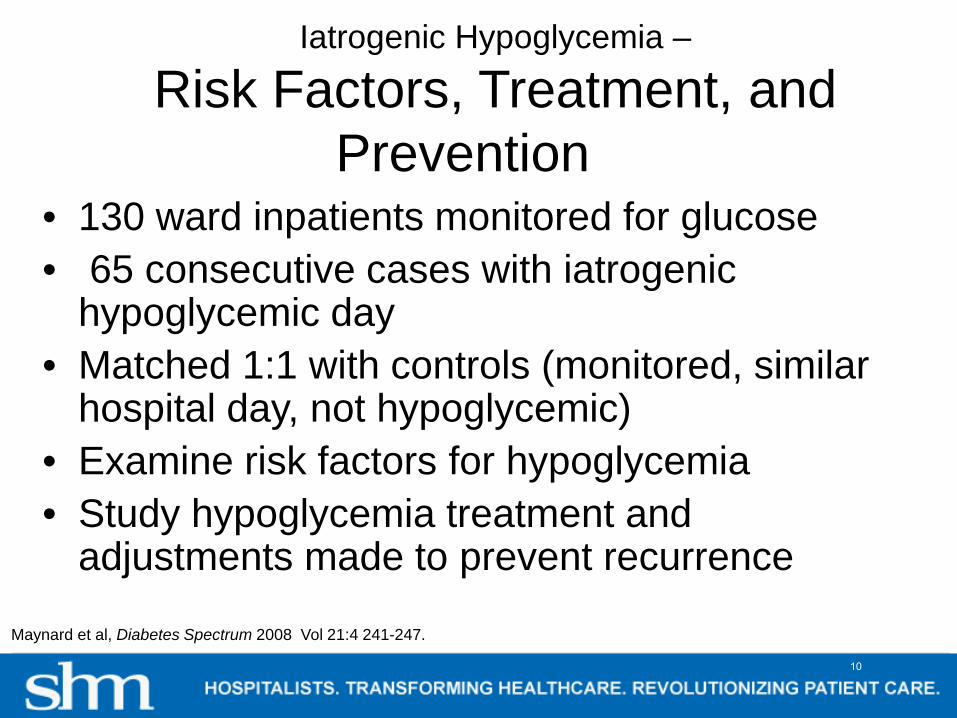
Iatrogenic Hypoglycemia –
Risk Factors, Treatment, and Prevention
• 130 ward inpatients monitored for glucose• 65 consecutive cases with iatrogenic
hypoglycemic day• Matched 1:1 with controls (monitored, similar
hospital day, not hypoglycemic)• Examine risk factors for hypoglycemia• Study hypoglycemia treatment and
adjustments made to prevent recurrence
Maynard et al, Diabetes Spectrum 2008 Vol 21:4 241-247.
10

Unexpected interruption of Nutrition and Prior Hypoglycemic Day – Top PredictorsBasal – Bolus errors: Creeping basal dose violating 50:50 rule
Management: We did not follow our own protocol.Poor or absent documentation, prolonged time to resolution.Frequent failure to prevent recurrent hypoglycemia.
11

Iatrogenic Hypoglycemia from Insulin
Most Common Failures1. Inappropriate prescribing
2. Failure to respond to unexpected nutritional interruption
3. Poor coordination of nutrition delivery, monitoring, and insulin delivery
4. Failure to respond to a prior hypoglycemic event
Cobaugh DJ et al. Am J Health Syst Pharm;70(16):1404-13.Hellman R. Endocr Pract 2004;10 Suppl 2:100-8.Maynard GA, et. Diabetes Spectr 2008;21 241-247.
12
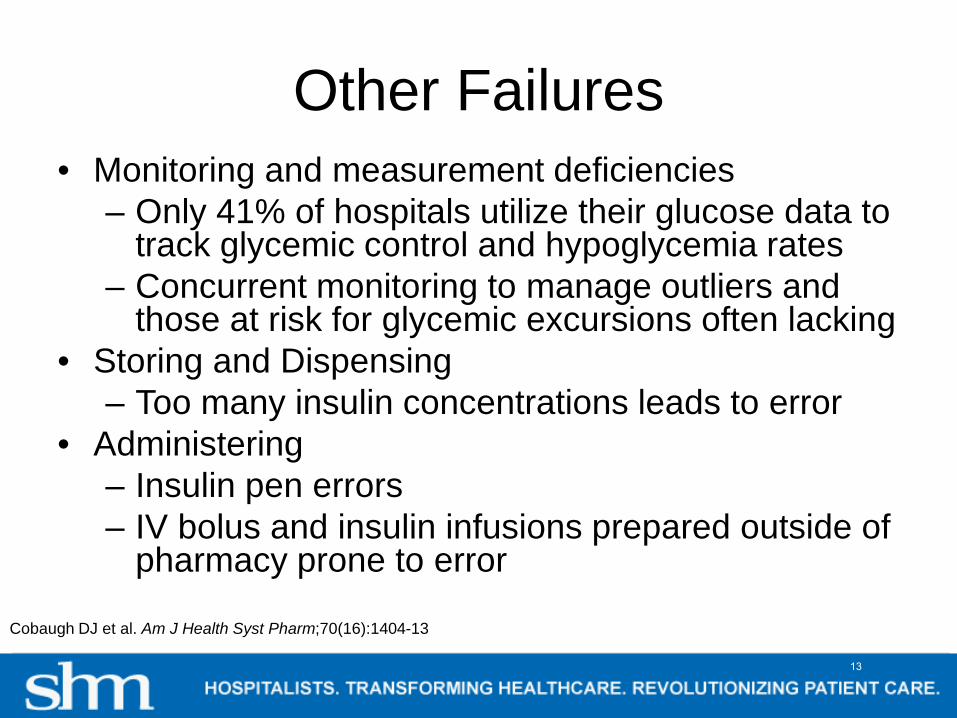
Other Failures• Monitoring and measurement deficiencies
– Only 41% of hospitals utilize their glucose data to track glycemic control and hypoglycemia rates
– Concurrent monitoring to manage outliers and those at risk for glycemic excursions often lacking
• Storing and Dispensing– Too many insulin concentrations leads to error
• Administering– Insulin pen errors– IV bolus and insulin infusions prepared outside of
pharmacy prone to error
Cobaugh DJ et al. Am J Health Syst Pharm;70(16):1404-13
13

The most powerful predictor for an inpatient to experience an iatrogenic
hypoglycemic ADE?
A. Liver DiseaseB. Advanced AgeC. A prior hypoglycemic event during same
stayD. Cancer
14
Which of the following is NOT a top source of inpatient iatrogenic
hypoglycemia?A. Nutritional Insulin mismatch B. Decreasing steroid dosesC. Failure to manage a prior hypoglycemic
event during same hospitalization appropriately
D. Inappropriate prescribing of insulin
15
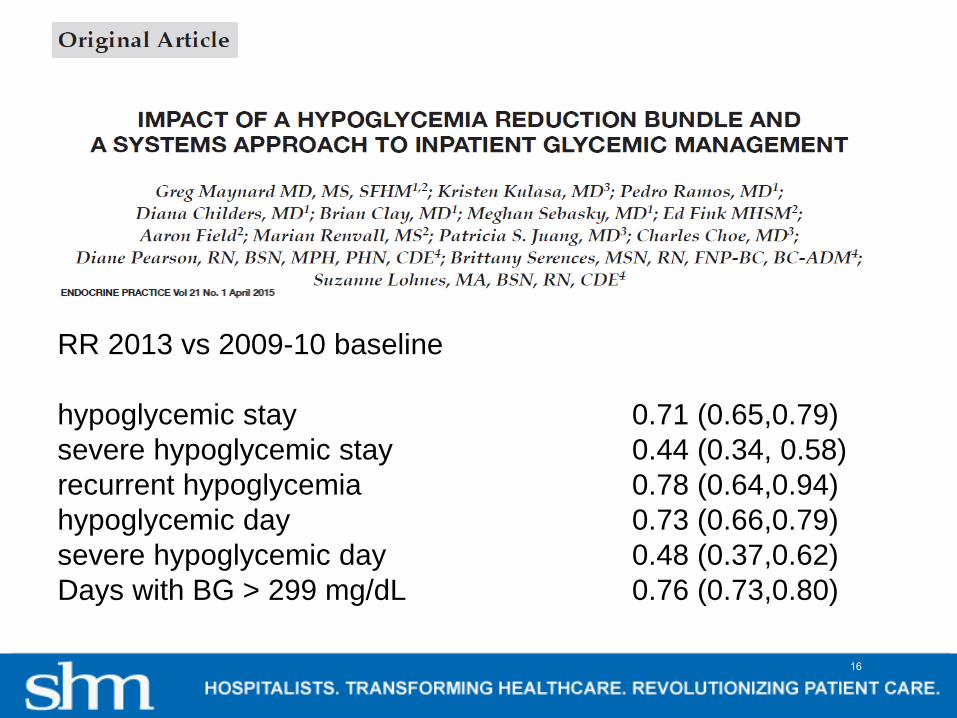
RR 2013 vs 2009-10 baseline
hypoglycemic stay 0.71 (0.65,0.79)severe hypoglycemic stay 0.44 (0.34, 0.58)recurrent hypoglycemia 0.78 (0.64,0.94)hypoglycemic day 0.73 (0.66,0.79)severe hypoglycemic day 0.48 (0.37,0.62)Days with BG > 299 mg/dL 0.76 (0.73,0.80)
16
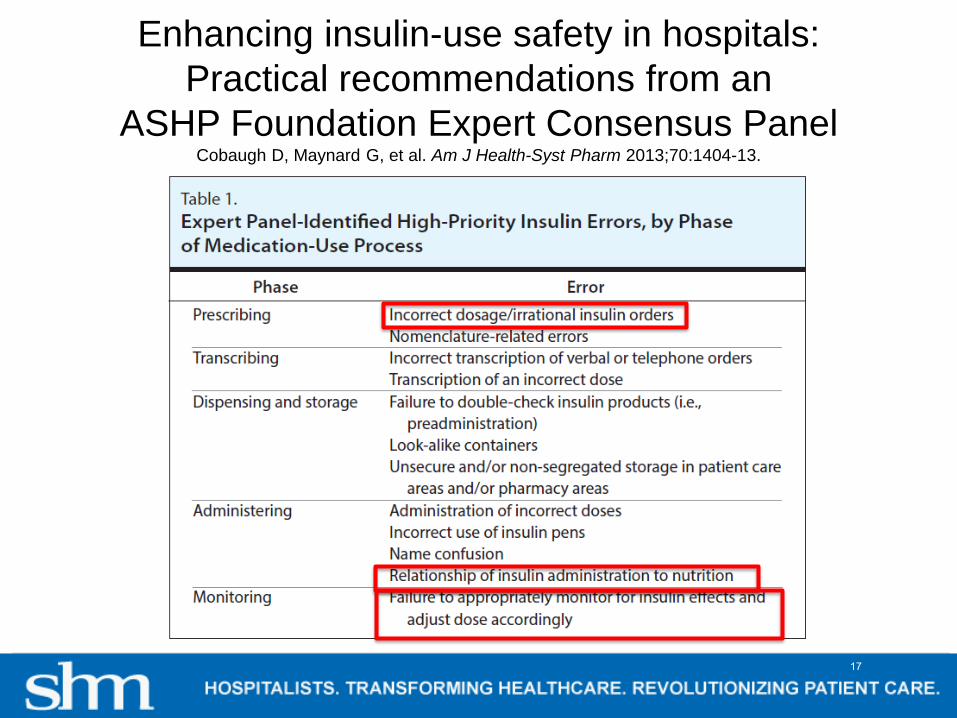
Enhancing insulin-use safety in hospitals:Practical recommendations from an
ASHP Foundation Expert Consensus PanelCobaugh D, Maynard G, et al. Am J Health-Syst Pharm 2013;70:1404-13.
17

Prescribing: Recommendations 1 - 3Recommendation 1Develop protocol-driven and evidence-based order sets for specific uses of insulin:
– IV to Subcutaneous insulin transitions, DKA, etc– Include decision-support to guide insulin use based on patient’s
nutritional status and for appropriate monitoring
Recommendation 2Eliminate the routine administration of correction / sliding scale insulin doses as the primary strategy to treat hyperglycemia
Recommendation 3Eliminate the use of “free text” insulin orders in electronic and paper records.
Replace them with protocol-driven and evidence-based order sets that allow for the prescribing of complex insulin regimens.
Cobaugh D, Maynard G, et al. Am J Health-Syst Pharm 2013;70:1404-13. 18

Integrate Best Practice into Protocols, Order Sets, Documentation
• Actionable glycemic target • Consistent carbohydrate / dietary / consult• A1c • Patient education plan• Hypoglycemia protocol• Guidance for transitions (linked protocols)• Coordinated monitoring / nutrition / insulin• DC oral agents, insulin preferred• Insulin regimens for different conditions• Dosing guidance
19
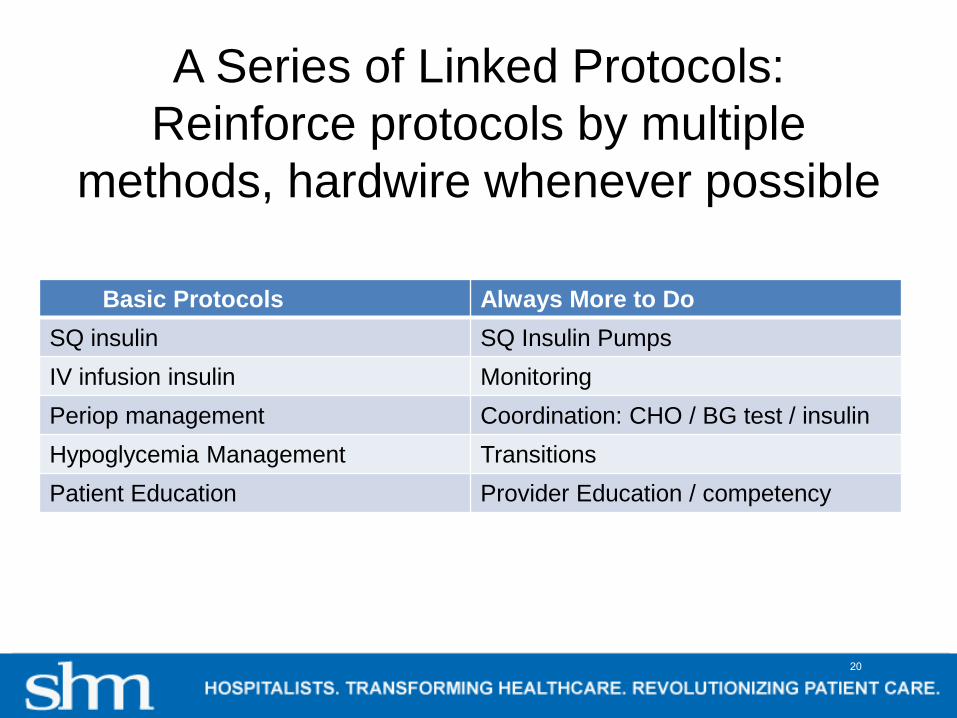
A Series of Linked Protocols: Reinforce protocols by multiple
methods, hardwire whenever possible
Basic Protocols Always More to DoSQ insulin SQ Insulin PumpsIV infusion insulin MonitoringPeriop management Coordination: CHO / BG test / insulinHypoglycemia Management TransitionsPatient Education Provider Education / competency
20
21

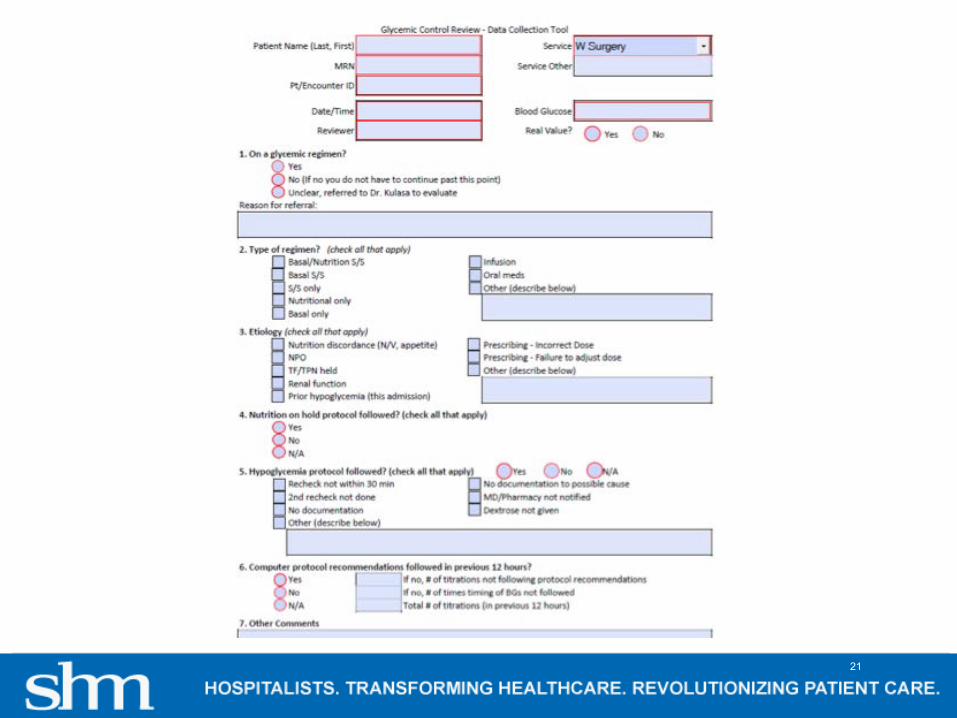
Proposed CDS Display for hypoglycemia evaluation– Federal Interagency Workgroup to prevent ADE
22
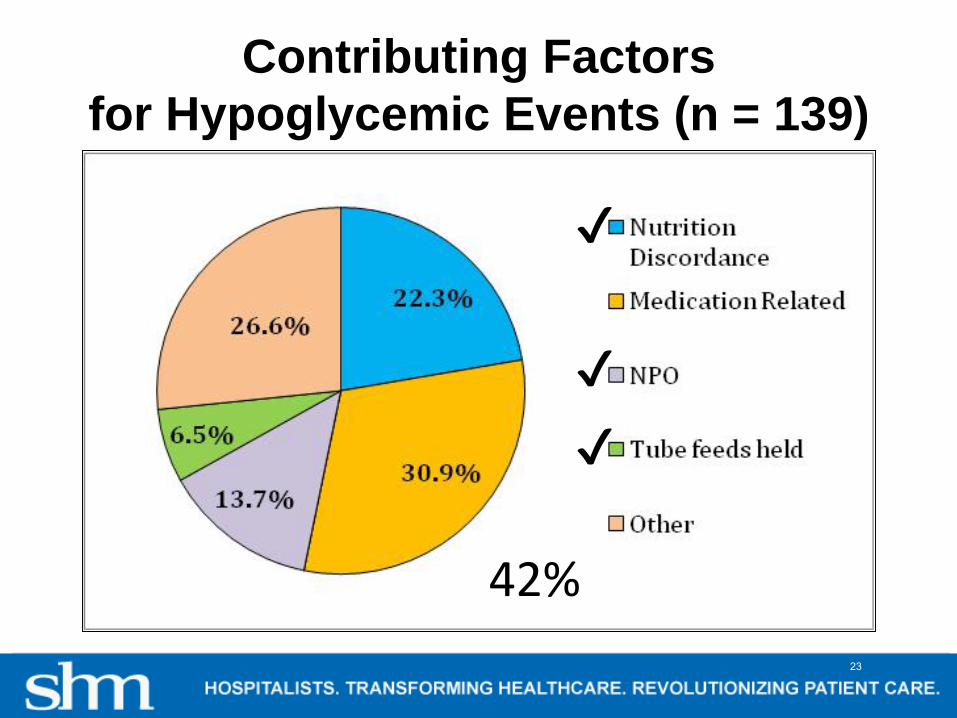
Contributing Factorsfor Hypoglycemic Events (n = 139)
✔
✔
✔
✔✔
42%23

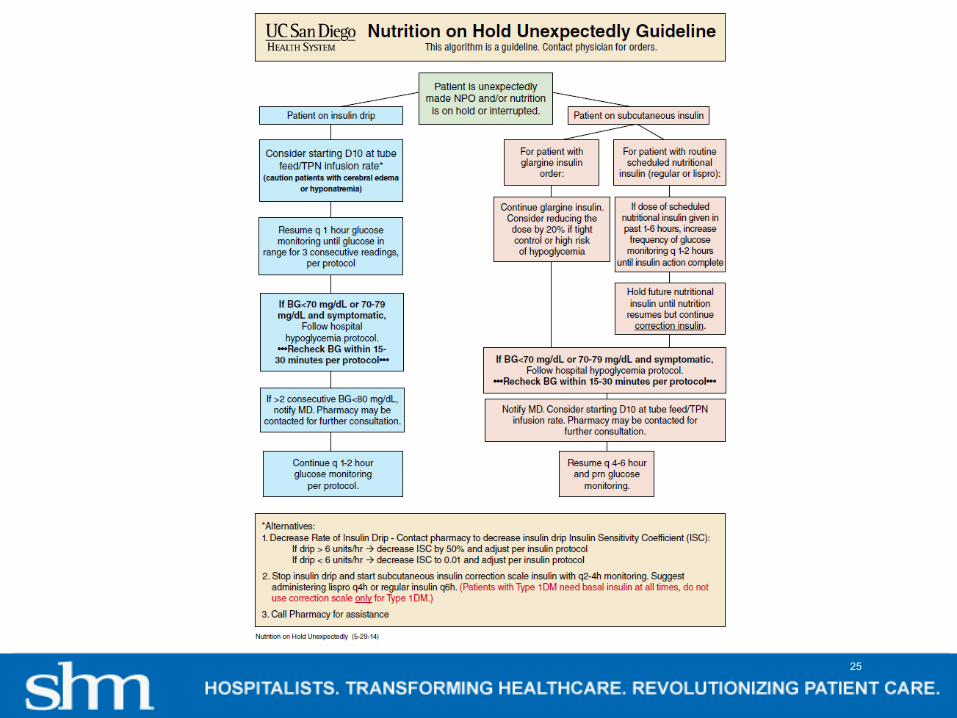
Guidance for Scheduled Temporary NPOExample UC San Diego
• Basal / Nutritional / Correction insulin terms reinforced across orders, MAR, documentation venues
• New orders not required for temporary NPO
Basal Insulin: “basal insulin should still be administered even if the patient is temporarily NPO for a procedure, or has temporary interruption of nutrition”
Nutritional RAA-I guidance for eating patients: “Give with first bite of food (or up to 30 minutes after first bite of food if patient is nauseated or has poor appetite). Give 0% if patient ate less than 50%, half if patient eats 50%, and full dose if they eat all / almost all (>50%) of meal.”
24
25
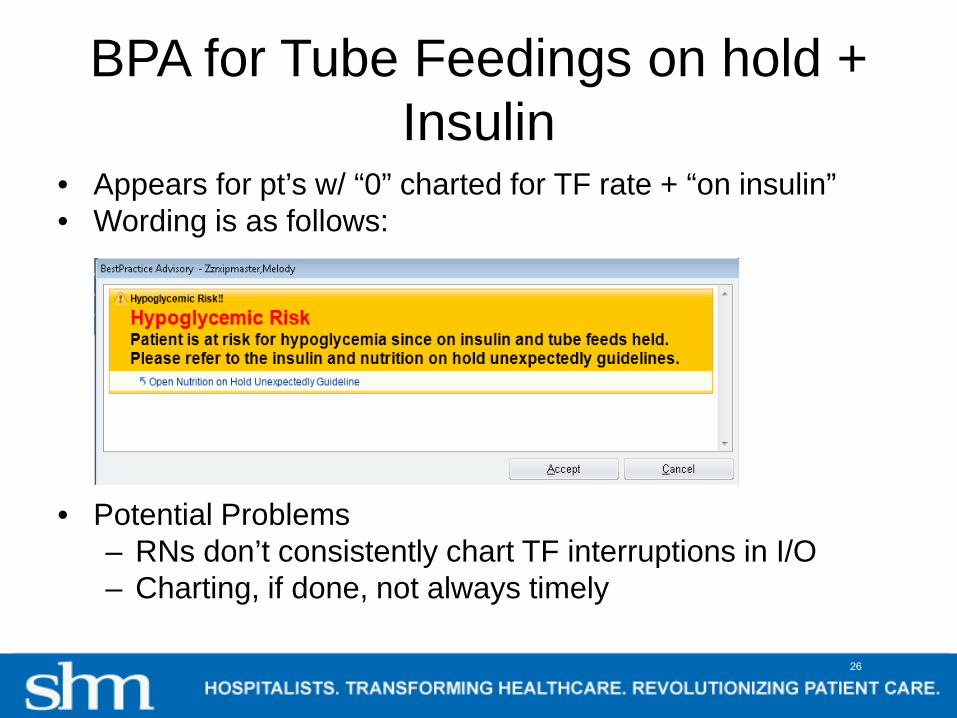
BPA for Tube Feedings on hold + Insulin
• Appears for pt’s w/ “0” charted for TF rate + “on insulin”• Wording is as follows:
• Potential Problems– RNs don’t consistently chart TF interruptions in I/O– Charting, if done, not always timely
26
27

28
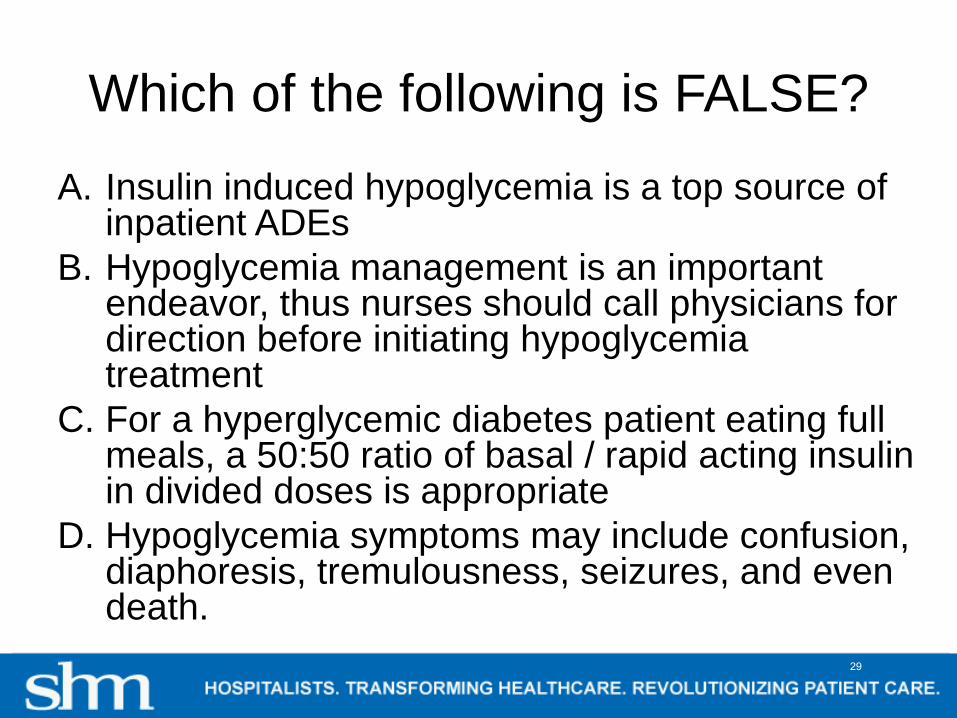
Which of the following is FALSE?A. Insulin induced hypoglycemia is a top source of
inpatient ADEsB. Hypoglycemia management is an important
endeavor, thus nurses should call physicians for direction before initiating hypoglycemia treatment
C. For a hyperglycemic diabetes patient eating full meals, a 50:50 ratio of basal / rapid acting insulin in divided doses is appropriate
D. Hypoglycemia symptoms may include confusion, diaphoresis, tremulousness, seizures, and even death.
29
Which of the following is FALSE?A. Insulin induced hypoglycemia is a top source of
inpatient ADEsB. Hypoglycemia management is an important
endeavor, thus nurses should call physicians for direction before initiating hypoglycemia treatment
C. For a hyperglycemic diabetes patient eating full meals, a 50:50 ratio of basal / rapid acting insulin in divided doses is appropriate
D. Hypoglycemia symptoms may include confusion, diaphoresis, tremulousness, seizures, and even death.
30

Nurse Driven Hypoglycemia Protocol
Hypoglycemia Protocol for diabetic patients or patients receiving insulin
If BG < or =70mg/dL, treat as follows:
If patient is ABLE to drink, �Give 6-8 oz. of clear (not pulpy) juice example: apple juice, then call MD
�Recheck BG in 30 minutes�Continue rechecking until BG is >70mg/dL
If patient is UNABLE to drink �Give 12.5 g (½ amp) of D50% IV then call MD�Recheck BG in 30 minutes.
�If BG is < or = 70mg/dL, give another 12.5g (½ amp) of D50% IV.�Recheck BG in 30 minutes�Continue rechecking until BG >70mg/dL
31

And Why?
32
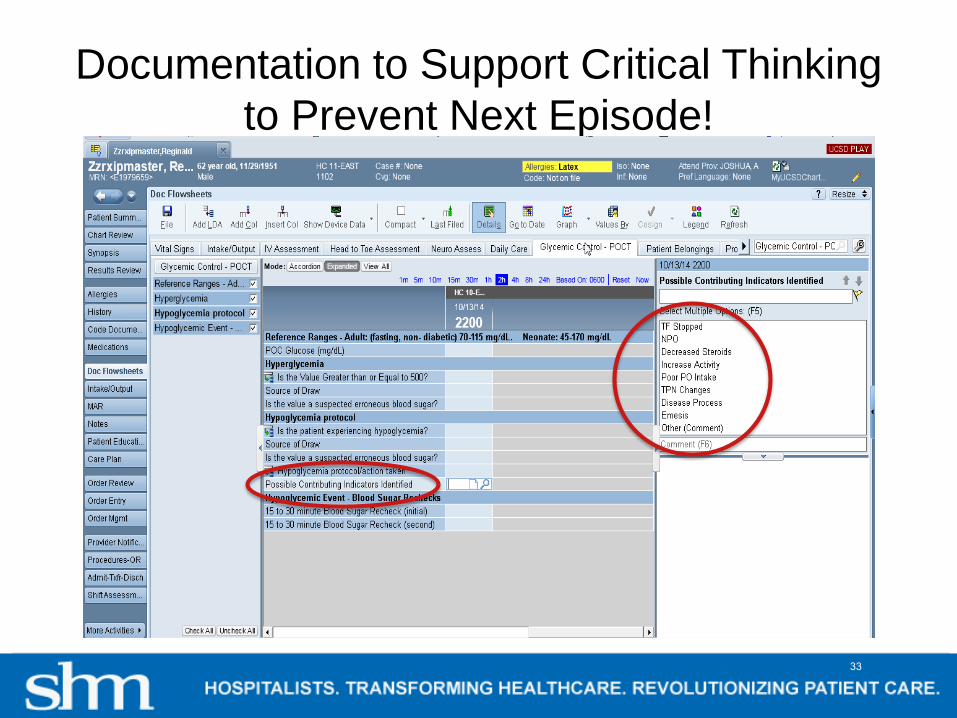
Documentation to Support Critical Thinking to Prevent Next Episode!
33
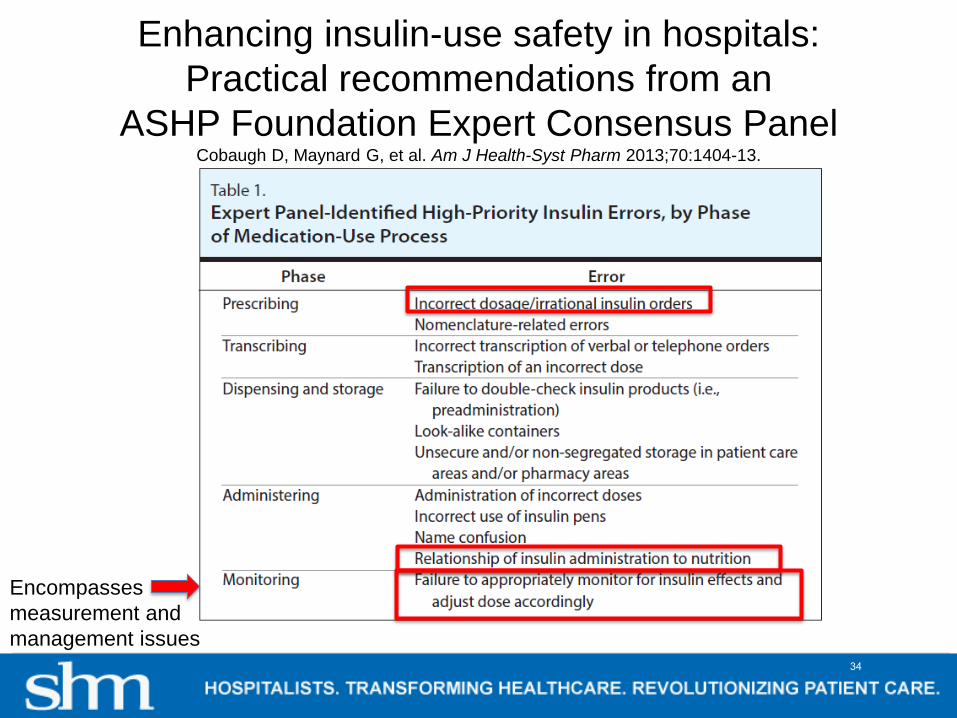
Enhancing insulin-use safety in hospitals:Practical recommendations from an
ASHP Foundation Expert Consensus PanelCobaugh D, Maynard G, et al. Am J Health-Syst Pharm 2013;70:1404-13.
Encompasses measurement and management issues
34

Evaluating: Recommendation 9Every hospital should prospectively monitor/measure:
– rates of hypoglycemia and hyperglycemia– Insulin use patterns– Coordination of insulin administration, glucose testing,
and nutrition delivery
Real-time, institution-wide glucose reports should be provided to health care team members to ensure appropriate surveillance and management of patients with unexpected hypoglycemia and hyperglycemia
Cobaugh D, Maynard G, et al. Am J Health-Syst Pharm 2013;70:1404-13.
35
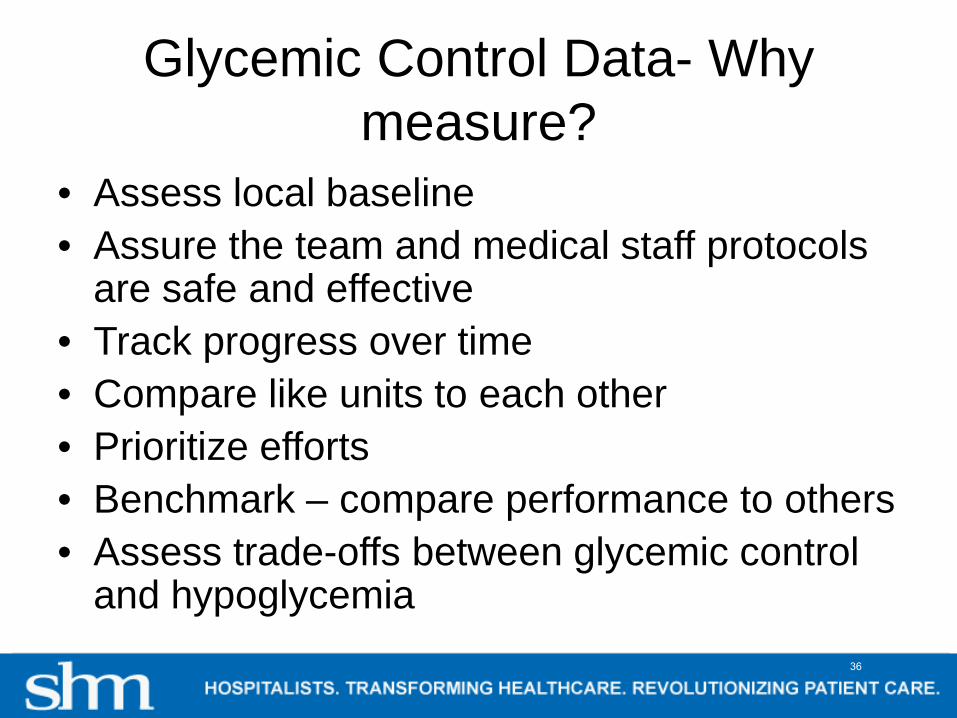
Glycemic Control Data- Why measure?
• Assess local baseline• Assure the team and medical staff protocols
are safe and effective• Track progress over time• Compare like units to each other• Prioritize efforts• Benchmark – compare performance to others• Assess trade-offs between glycemic control
and hypoglycemia36
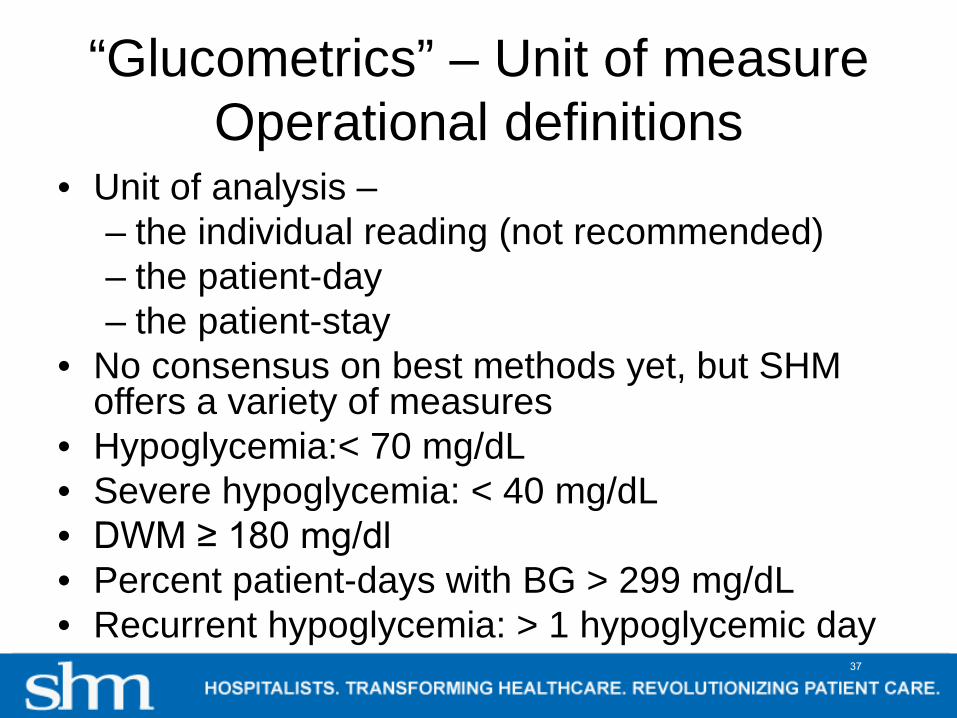
“Glucometrics” – Unit of measureOperational definitions
• Unit of analysis –– the individual reading (not recommended)– the patient-day– the patient-stay
• No consensus on best methods yet, but SHM offers a variety of measures
• Hypoglycemia:< 70 mg/dL• Severe hypoglycemia: < 40 mg/dL• DWM ≥ 180 mg/dl• Percent patient-days with BG > 299 mg/dL• Recurrent hypoglycemia: > 1 hypoglycemic day
37
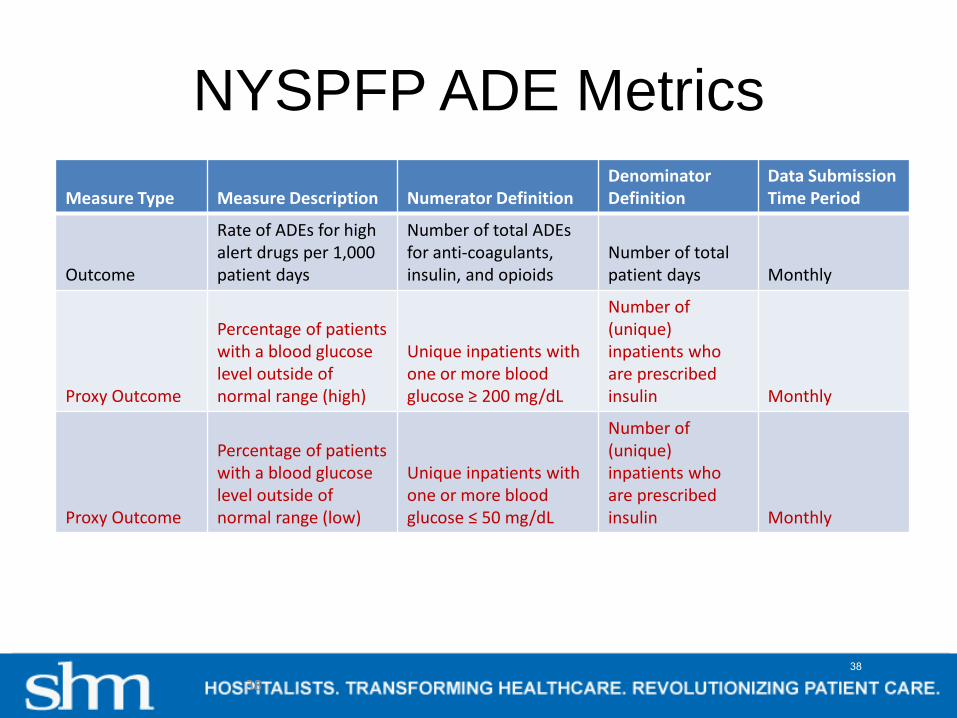
NYSPFP ADE Metrics
38
Measure Type Measure Description Numerator DefinitionDenominator Definition
Data Submission Time Period
Outcome
Rate of ADEs for high alert drugs per 1,000 patient days
Number of total ADEs for anti-coagulants, insulin, and opioids
Number of total patient days Monthly
Proxy Outcome
Percentage of patients with a blood glucose level outside of normal range (high)
Unique inpatients with one or more blood glucose ≥ 200 mg/dL
Number of (unique) inpatients who are prescribed insulin Monthly
Proxy Outcome
Percentage of patients with a blood glucose level outside of normal range (low)
Unique inpatients with one or more blood glucose ≤ 50 mg/dL
Number of (unique) inpatients who are prescribed insulin Monthly
38
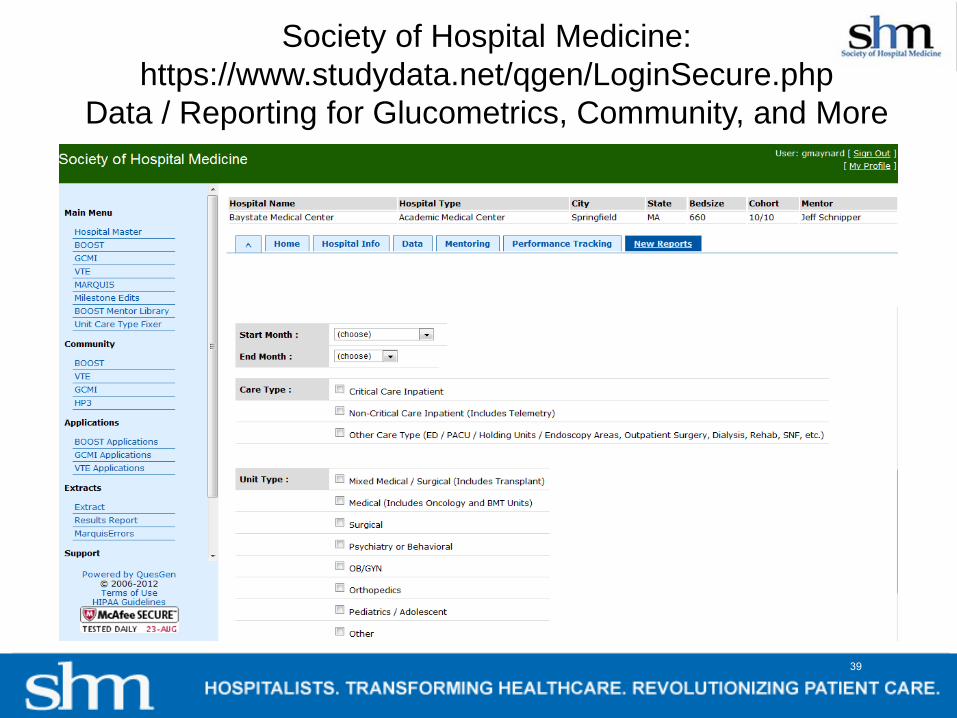
Society of Hospital Medicine: https://www.studydata.net/qgen/LoginSecure.php
Data / Reporting for Glucometrics, Community, and More
39
40
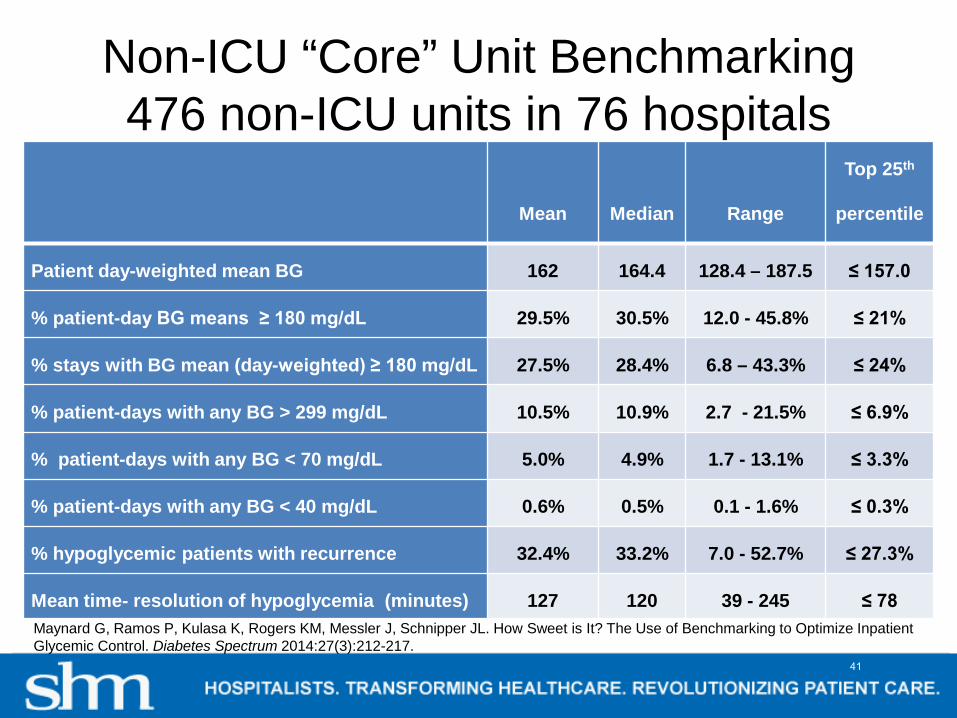
Non-ICU “Core” Unit Benchmarking476 non-ICU units in 76 hospitals
Mean Median Range
Top 25th
percentile
Patient day-weighted mean BG 162 164.4 128.4 – 187.5 ≤ 157.0
% patient-day BG means ≥ 180 mg/dL 29.5% 30.5% 12.0 - 45.8% ≤ 21%
% stays with BG mean (day-weighted) ≥ 180 mg/dL 27.5% 28.4% 6.8 – 43.3% ≤ 24%
% patient-days with any BG > 299 mg/dL 10.5% 10.9% 2.7 - 21.5% ≤ 6.9%
% patient-days with any BG < 70 mg/dL 5.0% 4.9% 1.7 - 13.1% ≤ 3.3%
% patient-days with any BG < 40 mg/dL 0.6% 0.5% 0.1 - 1.6% ≤ 0.3%
% hypoglycemic patients with recurrence 32.4% 33.2% 7.0 - 52.7% ≤ 27.3%
Mean time- resolution of hypoglycemia (minutes) 127 120 39 - 245 ≤ 78 Maynard G, Ramos P, Kulasa K, Rogers KM, Messler J, Schnipper JL. How Sweet is It? The Use of Benchmarking to Optimize Inpatient Glycemic Control. Diabetes Spectrum 2014:27(3):212-217.
41
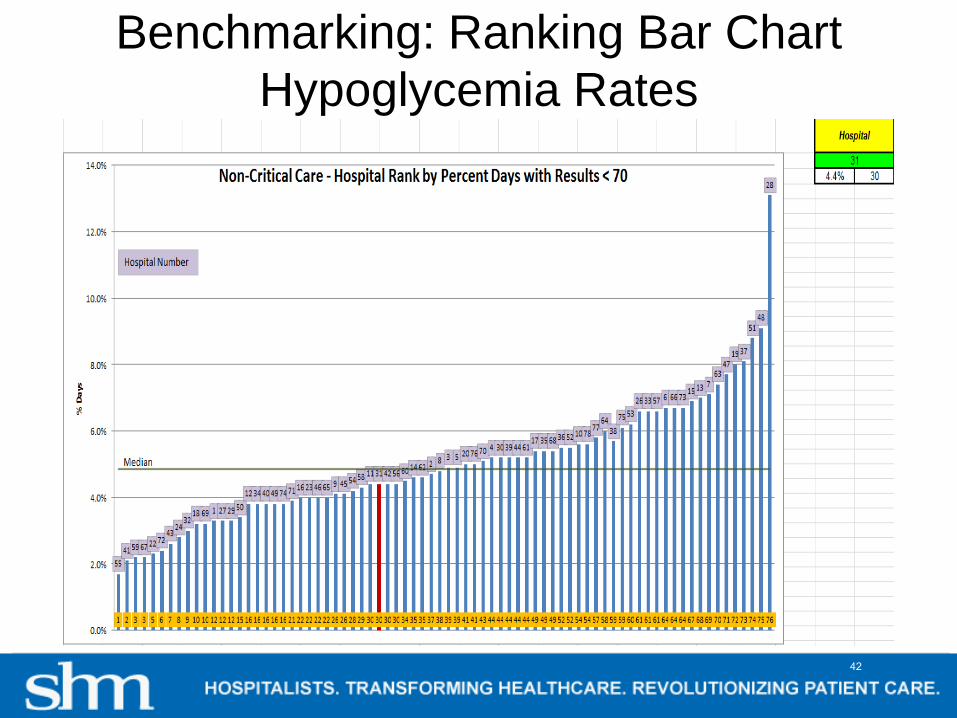
Benchmarking: Ranking Bar Chart Hypoglycemia Rates
42
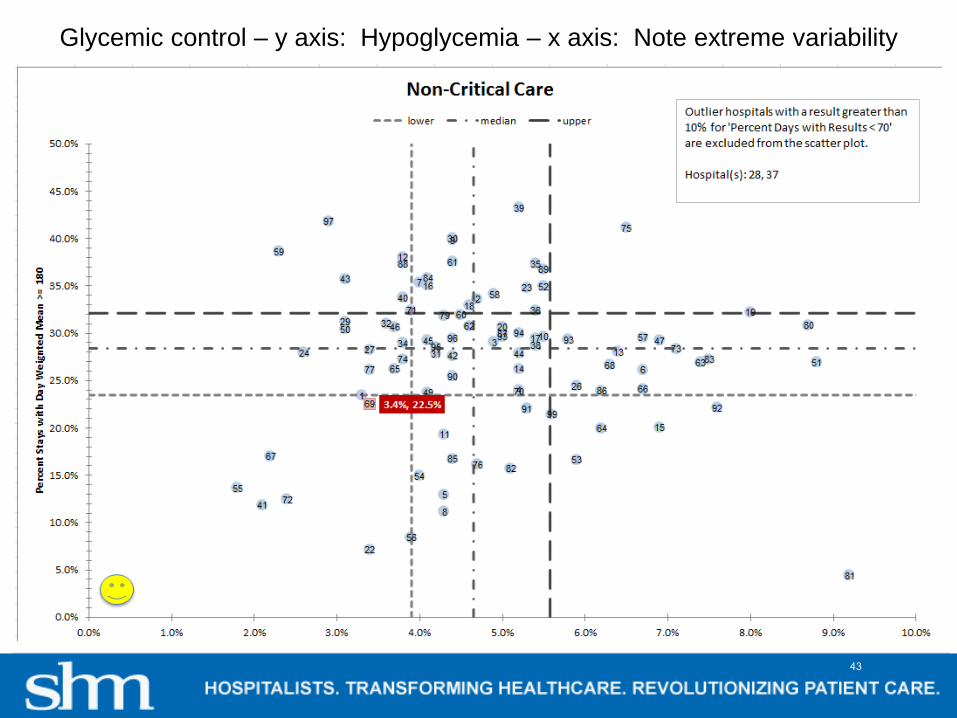
Glycemic control – y axis: Hypoglycemia – x axis: Note extreme variability
43
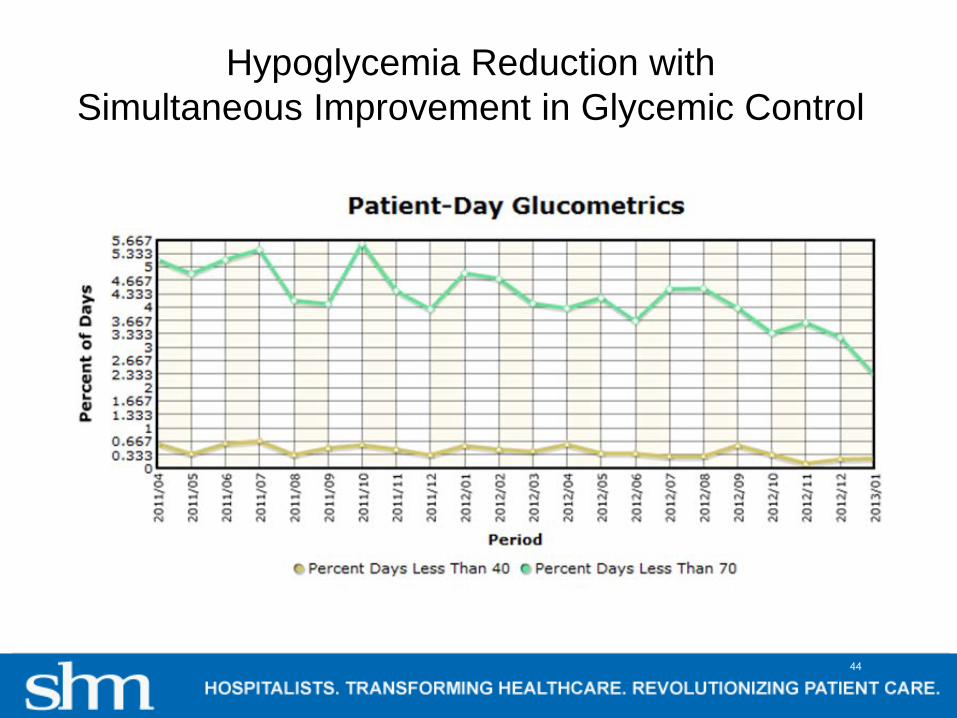
Hypoglycemia Reduction with Simultaneous Improvement in Glycemic Control
44

Secondary prevention of Hypoglycemia
45

Iatrogenic Hypoglycemia from InsulinMost common failures and strategies to address them
• Inappropriate prescribing– Standardized orders with embedded CDS – mandatory use– Ongoing monitoring for inappropriate prescribing, just in time
intervention• Failure to respond to unexpected nutritional interruption
– Protocols and Education– Methods to reduce interruptions in tube feeding
• Poor coordination of nutrition delivery, monitoring, and insulin delivery– Clear directions in protocols and order sets– Regular education / competency training– Redesign process
• Failure to respond to a prior hypoglycemic day– Make sure ASSESSMENT is part of hypoglycemia protocol– Competency and case based-training – Monitor recurrent hypoglycemia rates
46
Hypoglycemia: Take Home Points• Opportunities for prevention often missed• Assess need for change after hypoglycemic
event• Existence of a hypoglycemia protocol does not
guarantee good management• Protocol for unexpected interruption of nutrition• Carbohydrate intake / insulin rate should be
tethered and accounted for• Flow sheets can help pull together required data
and make trends more apparent• You can’t improve what you don’t measure
47
Thank you
48