hyshot-t4supersonic combustion experiments distance history ..... •..... 11 0-degree angle of...
TRANSCRIPT
_S'lt t-, 7/7t_.///'lJ. - '_- :!:_
HyShot-T4Supersonic
Combustion Experiments
Report for NAG- 1-2113
A.Paull, M.Frost and H.Alesi
The Centre for Hypersonics
Dept. of Mechanical Engineering
The University of Queensland, 4072
Australia
https://ntrs.nasa.gov/search.jsp?R=20000037781 2018-06-26T12:20:55+00:00Z
TABLE OF CONTENTS
Introduction .................................................................................................................. 3
Flight Test Description .................................................................................................. 3Model Configuration ................................................................................................... 3
Flight and Experimental Model Relationships ...................................................... 3General Overview .................................................................................................... 4Intake ......................................................................................................................... 5
Combustion Chamber ............................................................................................ 6Thrust Surface ............................................................................................................ 7
Experimental Matrix ..................................................................................................... 9Results ............................................................................................................................ 9
General Overview .................................................................................................... 9Fuel Flow Rate ......................................................................................................... 10
Pressure Time History .............................................................................................. 10
Pressure Distance History ...................................................... • ................................ 110-Degree Angle of Attack ................................................................................. 11
Angle of Attack ................................................................................................... 12
4° Angle of Attack and 4° Skew ....................................................................... 14Average Combustion Chamber Pressure ........................................................... ] 4Thrust ........................................................................................................................ ] 8
Boundary Layer Separation .................................................................................. 20Summary ..................................................................................................................... 23References ................................................................................................................. 23
Table 1 - Run Summary ............................................................................................. 24
P_

PRELIMINARY REPORT ON THE HYSHOT 5CRAM-lET EXPERIMENTS IN T4
INTRODUCTION
A series of experiments were initiated to investigate the operation of a two-dimensional, hypersonic,air-breathing engine (scramjet) inclined at angles of attack to the freestream. The experiments wereundertaken to obtain data for use in the Hyshot flight test program.
Experiments on the Hyshot scramjet were undertaken in the T4 shock tunnel. Experiments were made at anominal total enthalpy of 3.0MJkg-1 using a nozzle that produced flows with a Mach number of
approximately 6.5. The conditions produced correspond to flight at Mach 7.6 at an altitude range of 35.7 -21.4km. A summary of the flow conditions is included as Table 1.
The scramjet was tested at 0, plus 2, plus 4, minus 2 and minus4 degrees angle of attack. Experimentswere also undertaken at 2 and 4 degrees angle of skew.
FLIGH T TES T DESCRIPTION
The Hyshot flight program will perform a flight test of a configurationrepresenting a two-dimensional,supersonic combustion ramjet (scramjet) that has also been tested in the T4 shock tunnel. The aim of theHyshot program is to obtain a correlation between flight based testing and ground based testing in the 1"4shock tunnel.
The scramjet will be accelerated to Mach 8 using a Terrier-Orion sounding rocket. The sounding rocket willreach a maximum altitude of 350kin. Before re-entry the sounding rocket and scramjet will be maneuveredinto the experimental attitude. Between altitudes of 35km and 23kin gaseous hydrogen will be injected intothe scramjet and pressure measurements will be recorded. A flight Mach No. of 7.6 with a 3-sigma variationof 0.2 is expected.
I'_ODEL CONFIGURATION
Flight and Experimental Model Relationships
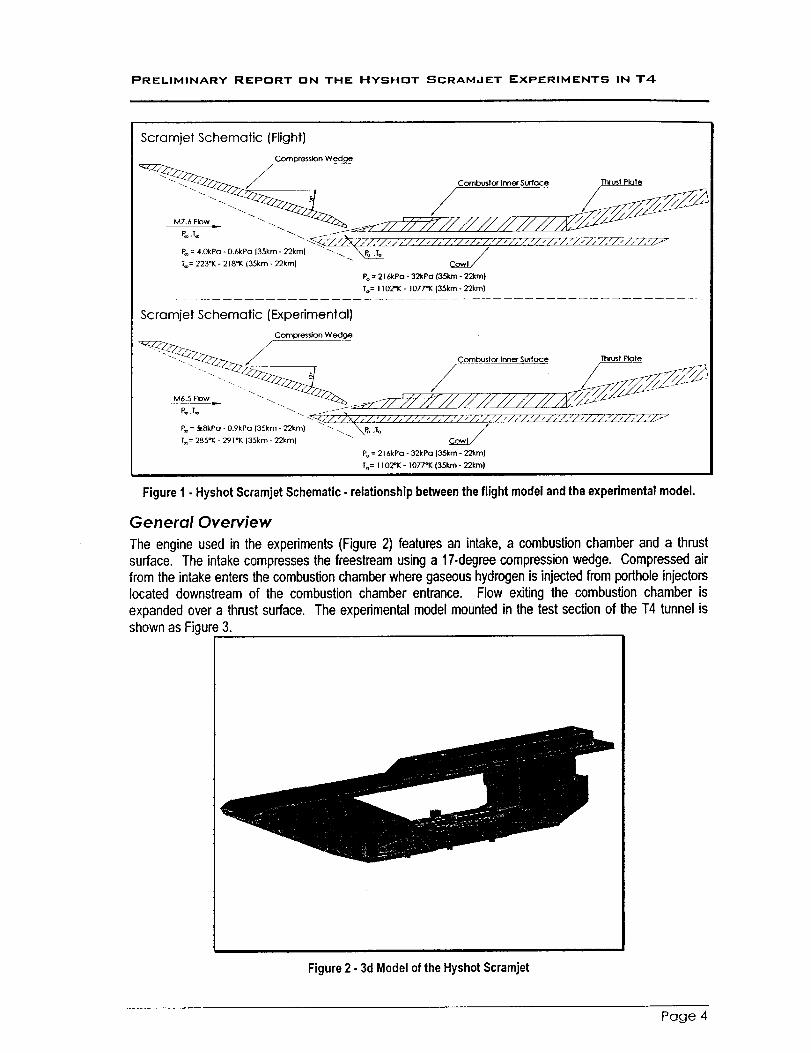
A schematic of the flightmodeland the experimentalmodelis shown as Figure 1. Flightconditionsassumea Mach 7.6 flow. The range of freestream pressures and temperatures (P® and T_orespectively) expected
during flight are deflected by an 18° wedge and are processed the shock system, depicted in Figure 1, toproduce a combustion chamber entry temperature of approximately 1100°K and a combustion chamberentrance pressure which ranges between 22kPa and 32kPa. The combustion chamber entry pressures andtemperatures (Poand To) are shown in Figure 1.
Experiments in the T4 shock tunnel used a nozzle with a Mach number of 6.5. To reproduce thecombustion chamber entrance conditions expected during flight, a 17° compression wedge was used, seeFigure 1. The total enthaply of the flow was the same as in flight.
Page 3
PRELIHINARY REPORT ON THE HYSHOT SCRAM,JET EXPERIHENTS IN T4
Scramjet Schematic (Flight) I
_. Coml::_sion Wedge II_/ Combustor Inner Surface Th_usl Plale I
P_ = 4.0kPo - 0.6kPa J35km - 22kin) _- _ ._._T_= 223"K - 218"K (35kin - 22kin) C_ /
Po= 216kPo - 32kPo (35kin - 22kin)
To= I102"K - 1077"K (35km - 22kin)
Scramjet Schematic (Experimental)
Compcesdon wedge
_/ Combuslo¢ Inner Surface l"hrust Role
M,5,._ --..P.,T. _. I-
-.<_'l.,)x/,l.,I,l,'l.'l,l,'/.'l,I, /.'l,lz I.'1,1, I.'1,1, I.'i,I,/.'lJ
P= = _.SkP(] - O.gkPa (35kin - 22kin) _- _ _. p'X_'x_o,1_ //T®= 285"K - 291°K (35kin - 22kml
Po= 216kPo - 32kPa (35kin - 2"2krn)
To= 110"Z"K - 1077"K (35kin - 22kin)
FigureI - HyshotScramjetSchematic - relationshipbetweenthe flight modelandthe experimentalmodel.
General Overview
The engine used in the experiments (Figure 2) features an intake, a combustion chamber and a thrustsurface. The intake compresses the freestream using a 17-degree compression wedge. Compressed airfrom the intake enters the combustion chamber where gaseous hydrogen is injected from porthole injectorslocated downstream of the combustion chamber entrance. Flow exiting the combustion chamber isexpanded over a thrust surface. The experimental model mounted in the test section of the T4 tunnel isshown as Figure 3.
Figure 2 - 3d Modelof the HyshotScramjet
Page 4
PRELIMINARY REPORT ON THE HYSHOT SCRAM,JET EXPERIMENTS IN T4
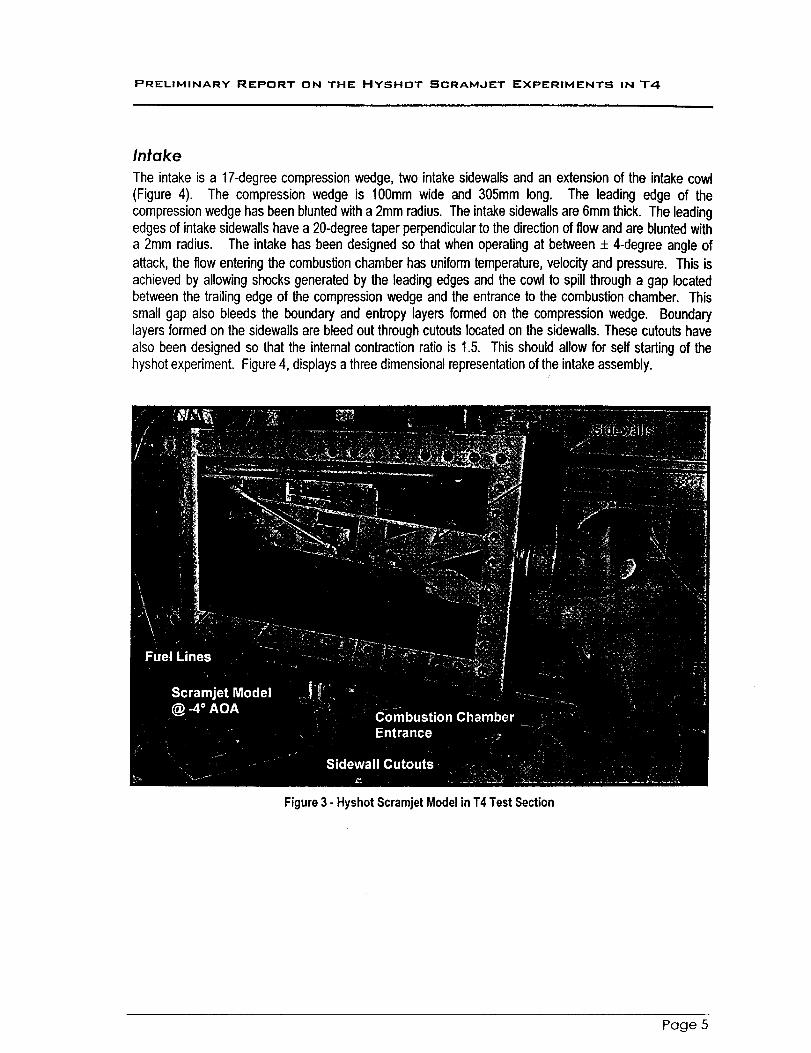
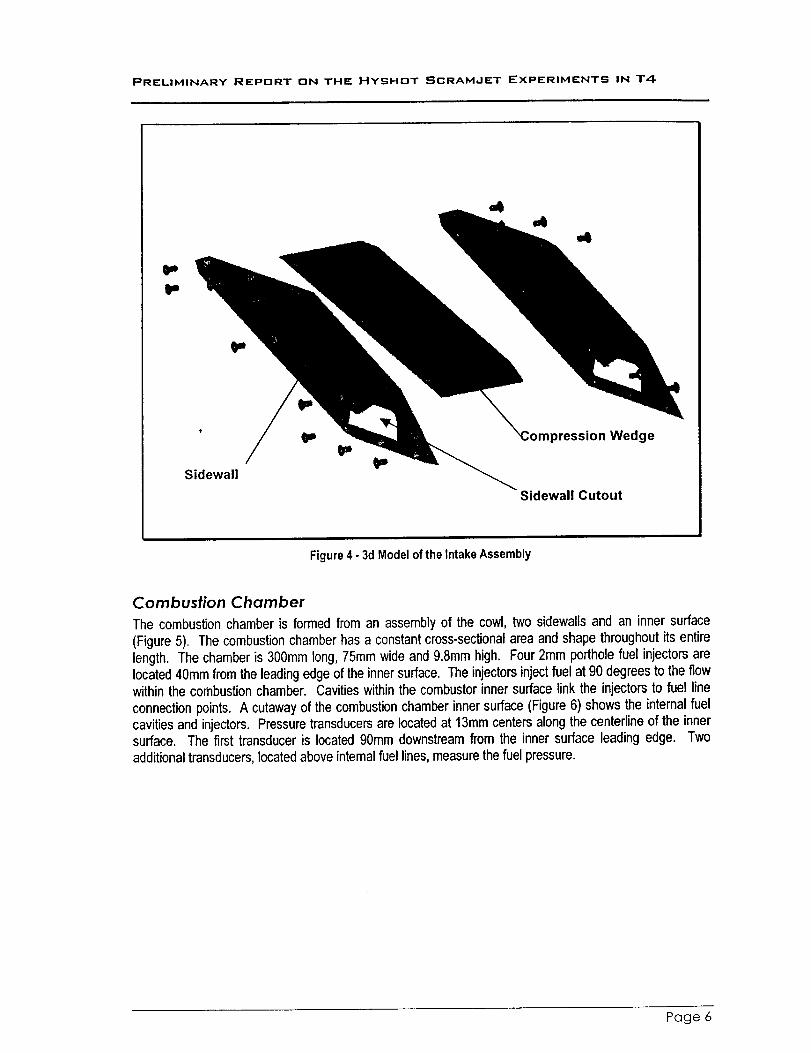
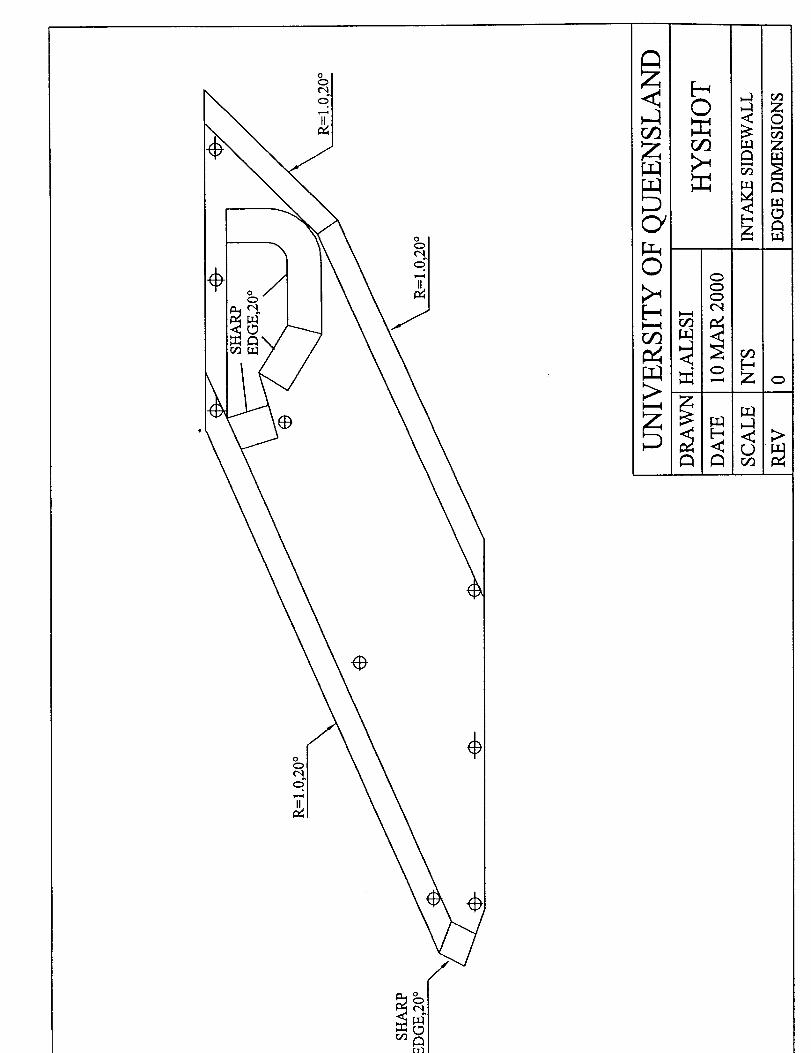
Intake
The intake is a 17-degree compression wedge, two intake sidewalls and an extension of the intake cowl(Figure 4). The compression wedge is lOOmm wide and 305ram long. The leading edge of thecompression wedge has been blunted with a 2mm radius. The intake sidewalls are 6ram thick. The leadingedges of intake sidewalls have a 20-degree taper perpendicular to the direction of flow and are blunted witha 2ram radius. The intake has been designed so that when operating at between + 4-degree angle of
attack, the flow entering the combustionchamber has uniform temperature,velocity and pressure. This isachieved by allowing shocks generated by the leading edges and the cowl to spill through a gap locatedbetween the trailing edge of the compression wedge and the entrance to the combustion chamber. Thissmall gap also bleeds the boundary and entropy layers formed on the compression wedge. Boundarylayers formed on the sidewalls are bleed out through cutouts located on the sidewalls. These cutouts have
also been designed so that the internal contraction ratio is 1.5. This should allow for self starting of thehyshot experiment. Figure 4, displays a three dimensional representation of the intake assembly.
Figure 3 - Hyshot Scramjet Model in T4 Test Section
Page 5
PRELIMINARY REPDRT ON THE HYSHDT SCRAM,JET EXPERIMENTS IN T4
qP
Sidewall
(p _pression Wedge
Sidewall Cutout
Figure4 - 3d Modelof the IntakeAssembly
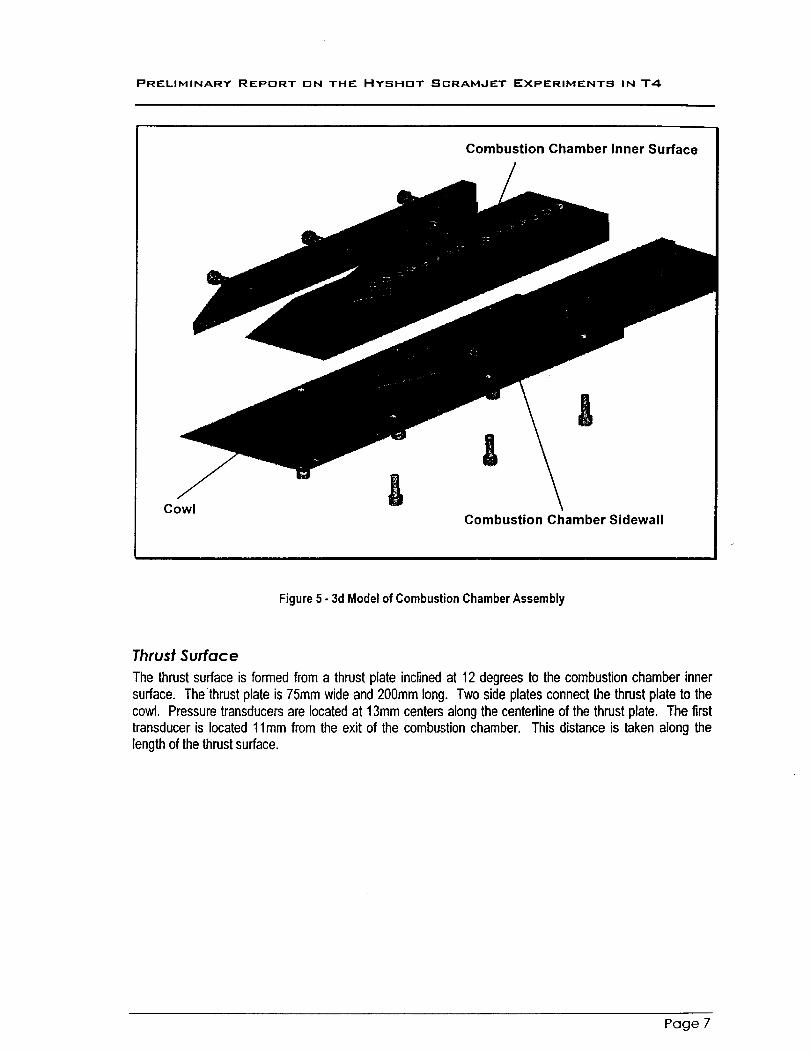
Combustion Chamber
The combustion chamber is formed from an assembly of the cowl, two sidewalls and an inner surface
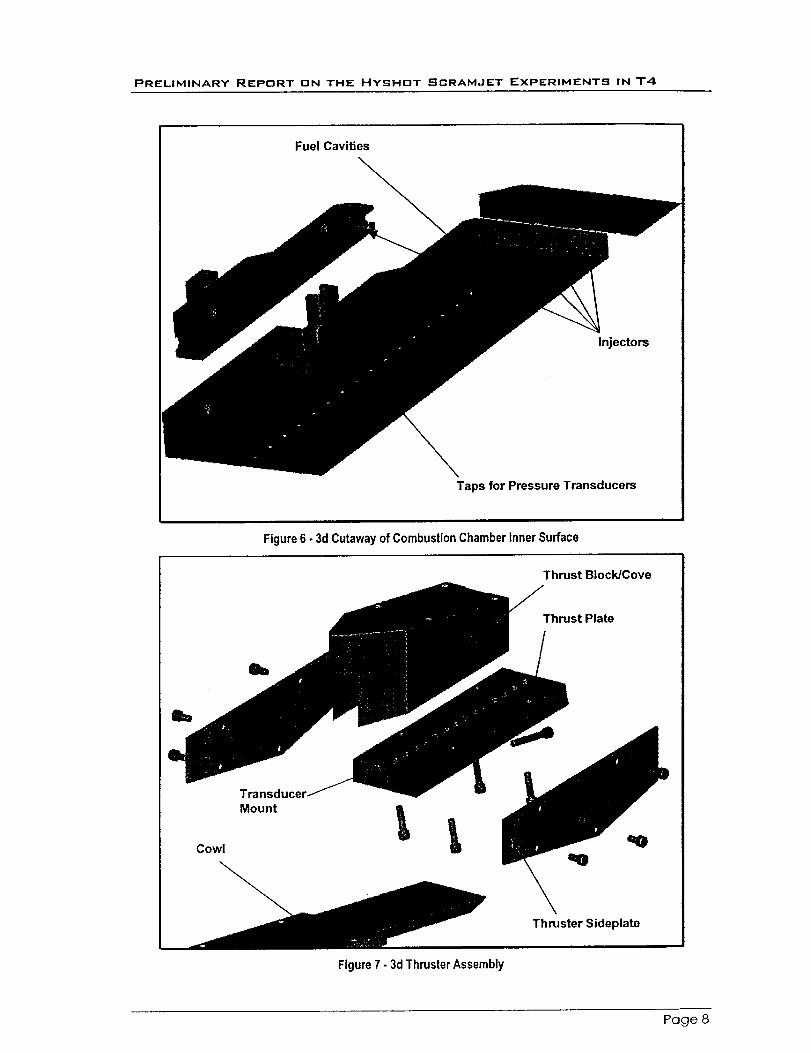
(Figure 5). The combustion chamber has a constant cross-sectional area and shape throughout its entirelength. The chamber is 300mm long, 75mm wide and 9.8ram high. Four 2mm porthole fuel injectors arelocated 40ram from the leading edge of the inner surface. The injectors inject fuel at 90 degrees to the flowwithin the combustion chamber. Cavities within the combustor inner surface link the injectors to fuel line
connection points. A cutaway of the combustion chamber inner surface (Figure 6) shows the internal fuelcavities and injectors. Pressure transducers are located at 13ram centers along the centerline of the innersurface. The first transducer is located 90ram downstream from the inner surface leading edge. Twoadditional transducers, located above internal fuel lines, measure the fuel pressure.
Poge 5
PRELIMINARY REPORT ON THE HYSHOT -qCRAMJET EXPERIMENTS IN T4
Combustion Chamber Inner Surface
CowlCombustion Chamber Sidewall
Figure5- 3d Modelof CombustionChamberAssembly
Thrust Surface
The thrustsurface is formed from a thrust plate inclinedat 12 degrees to the combustionchamber innersurface. The thrust plate is 75ram wide and 200ram long. Two side platesconnectthe thrustplate to thecowl. Pressuretransducersare locatedat 13ram centersalong the centerlineof the thrustplate. The firsttransducer is located 11ram from the exit of the combustionchamber. This distance is taken along thelengthof the thrustsurface.
Page 7
PRELIMINARY REPORT ON THE HYSHOT SCRAMJET EXPERIMENTS IN T4
Fuel Cavities
Injectors
Taps for Pressure Transducers
Figure 6 - 3d Cutaway of Combustion Chamber Inner Surface
Thrust Block/Cove
Thrust Plate
Mount
Cowl
Thruster Sideplate
Figure 7 - 3d Thruster Assembly
Page 8
PRELIMINARY REPORT ON THE HYSHDT SCRAM,JET EXPERIMENTS IN T4
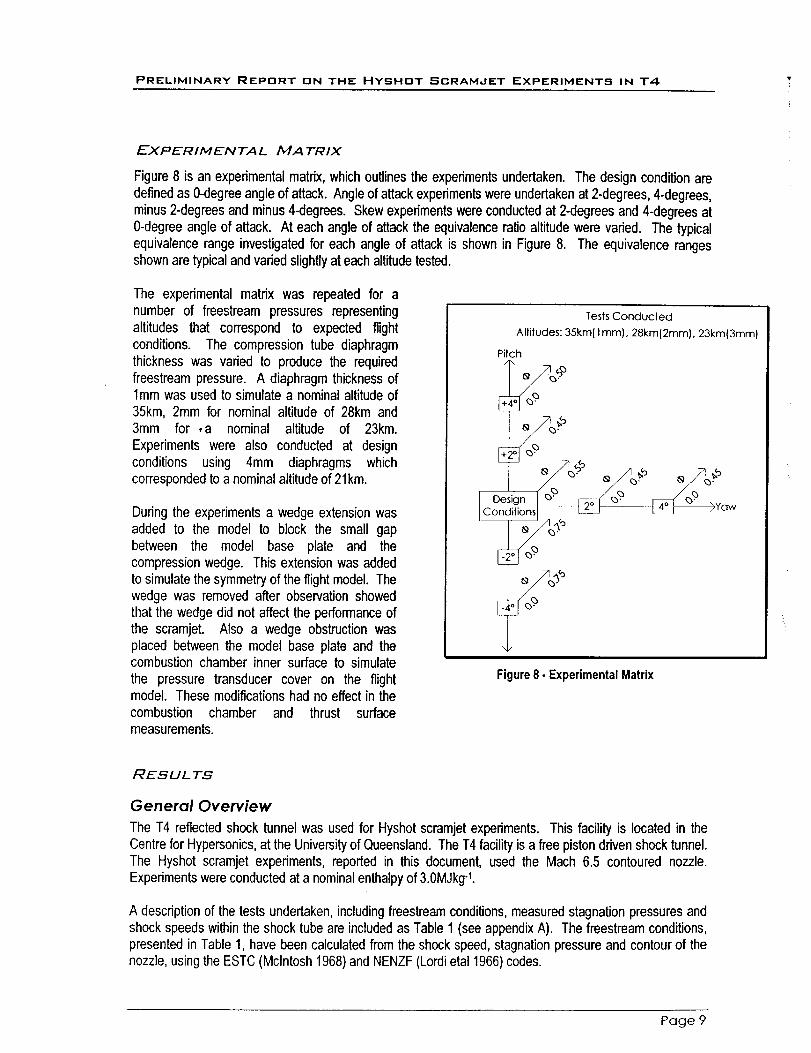
EXPERIMENTAL MATRIX
Figure 8 is an experimental matrix, whichoutlines the experiments undertaken. The design conditionaredefined as 0-degree angle of attack. Angle of attack experiments were undertaken at 2-degrees, 4-degrees,minus 2-degrees and minus 4-degrees. Skew experiments were conducted at 2-degrees and 4-degrees at0-degree angle of attack. At each angle of attack the equivalence ratio altitude were varied. The typicalequivalence range investigated for each angle of attack is shown in Figure 8. The equivalence rangesshown are typical and varied slightly at each altitude tested.
The experimental matrix was repeated for anumber of freestream pressures representingaltitudes that correspond to expected flightconditions. The compression tube diaphragmthickness was varied to produce the requiredfreestream pressure. A diaphragm thickness of1ram was used to simulate a nominal altitude of35kin, 2mm for nominal altitude of 28km and3ram for ,a nominal altitude of 23km.
Experiments were also conducted at designconditions using 4mm diaphragms whichcorresponded to a nominal altitude of 21kin.
During the experiments a wedge extension wasadded to the model to block the small gapbetween the model base plate and thecompression wedge. This extension was addedto simulate the symmetry of the flight model. Thewedge was removed after observation showedthat the wedge did not affect the performance ofthe scramjet. Also a wedge obstruction wasplaced between the model base plate and thecombustion chamber inner surface to simulate
the pressure transducer cover on the flightmodel. These modifications had no effect in thecombustion chamber and thrust surfacemeasurements.
Tests Conducted
Altitudes: 35km(Imm}, 28kmJ2mm}, 23km(3mm)
Pitch
j Conditionsj_ z_j- .... [_Yaw
Figure8- ExperimentalMatrix
RESUL TS
General Overview
The T4 reflected shock tunnel was used for Hyshot scramjet experiments. This facility is located in theCentre for Hypersonics, at the University of Queensland. The T4 facility is a free piston driven shock tunnel.The Hyshot scramjet experiments, reported in this document, used the Mach 6.5 contoured nozzle.Experiments were conducted at a nominal enthalpy of 3.0MJkg-1.
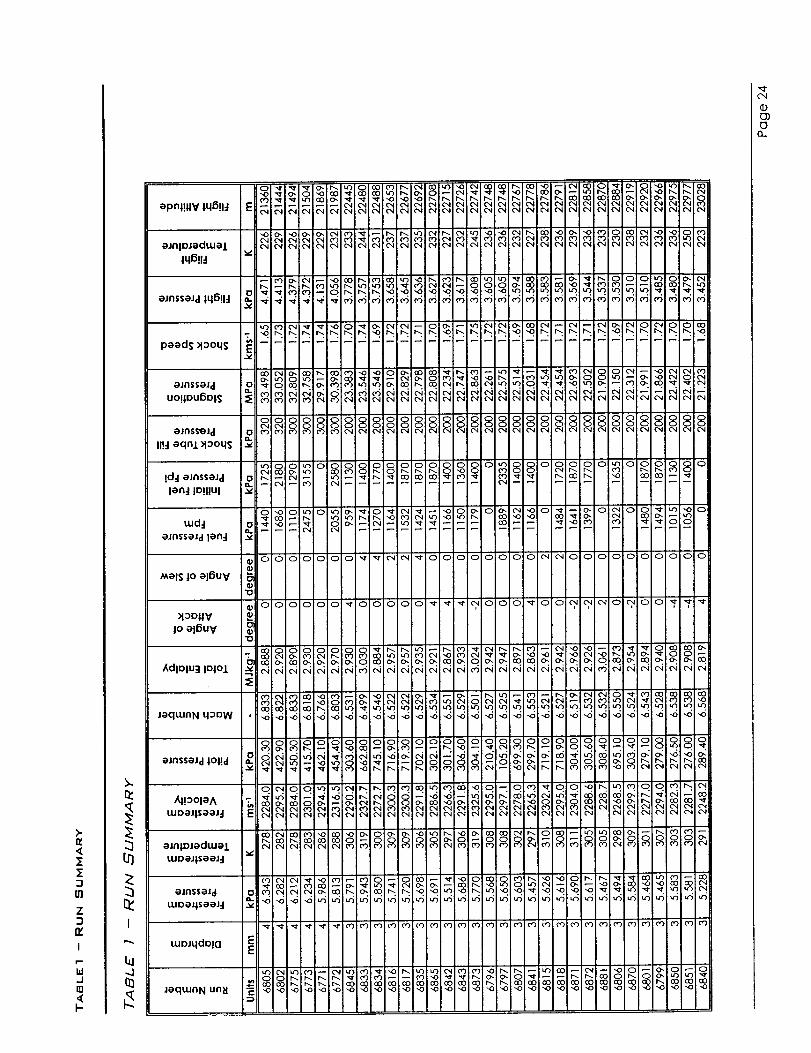
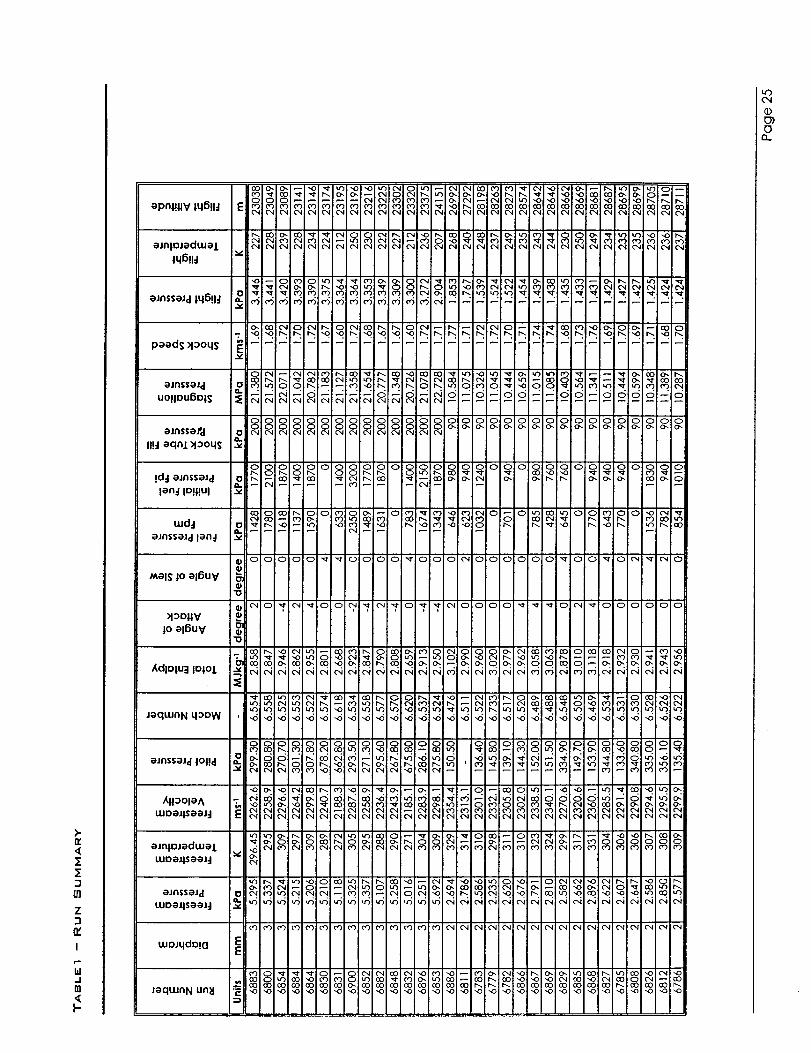
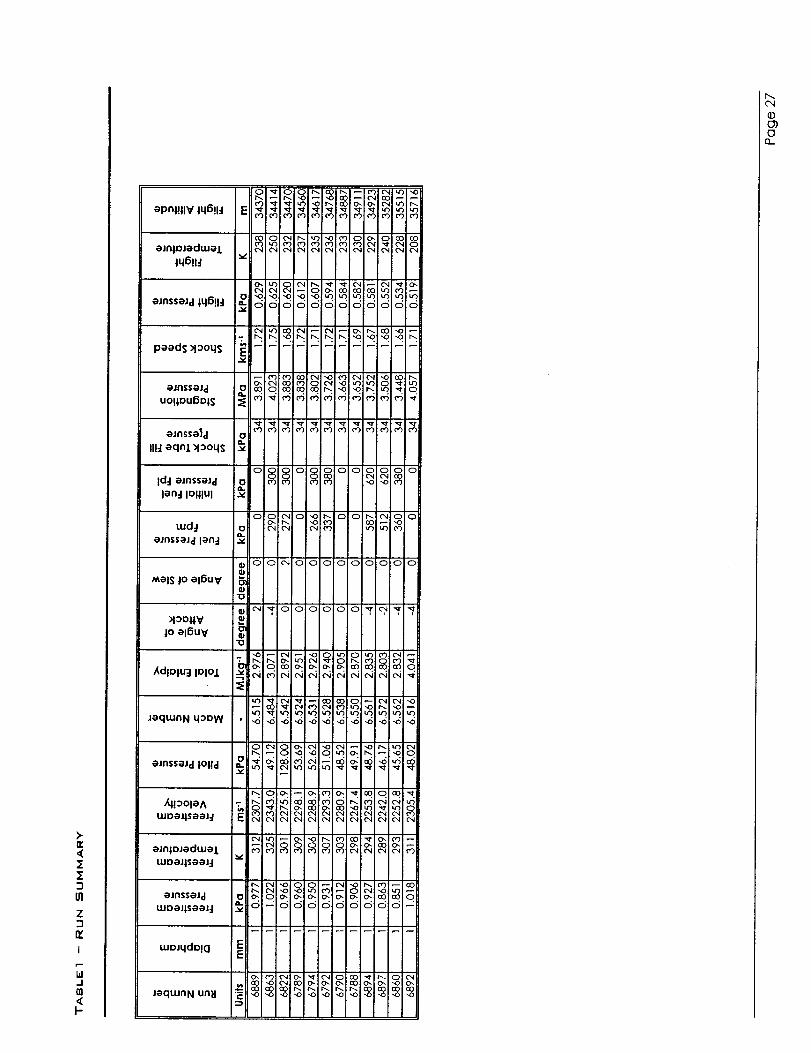
A description of the tests undertaken, including freestream conditions,measured stagnation pressuresandshock speeds within the shock tube are included as Table 1 (see appendix A). The freestream conditions,presented in Table 1, have been calculated from the shock speed, stagnation pressure and contour of thenozzle, using the ESTC (Mclntosh 1968) and NENZF (Lordi eta11966) codes.
Page 9

PRELIMINARY REPORT ON THE HYSHOT _qCRAMJET EXPERIMENTS IN T4
Pressure measurements were recorded using PCB pressure transducers. Measurements were recorded ata rate of 250kHz on each transducer using a 12bit analog to digital converter. The data was reduced usingthe UQ program, MONC v4.8.
Fuel Flow Rate
Fuel is supplied to the injectors from the T4 fuel system. The T4 fuel system consists of a Ludwich tube, afast acting large mass flow rate valve, interconnecting pipe work and associated valving. The Ludwich tubeis of sufficient length to supply fuel, at a steady pressure, to the scramjet model for approximately 30milliseconds. The fast acting fuel valve is located between the Ludwich tube and the injectors.
The fuel system wascalibratedby filling the Ludwichtube to a known pressure withgaseous hydrogen. Thefast acting fuel valve was then activated and a fuel pressure (FPm)time history was recorded upstream ofthe injectors. The pressure within the Ludwich tube after valve activation wasalso recorded. Assuming thefuel flow is isentropic and adiabatic it can be shown that the mass flow rate of fuel is:
x fFPm / °''4' r'h =k x FPm L'-_-i ,)
Where FR - filling pressure of the Ludwich tube and k is the proportionality constant.
By integrating both sides of the above equation with respect to the time that the valve was opened, andusing the change in Ludwich tube pressure to determine the mass of the injected fuel, the proportionalityconstant, k, can be determined experimentally. The proportionality constant for the Hyshot scramjetexperiments was determined to be 1.62x10⁸. The error in this measurement was + 3%.
Pressure Time History
Figure 9 displays a typical pressure time history for a pressure transducer located in the combustionchamber. The pressure history shown is for transducer number 15, located 272mm downstream from theleading edge of the combustion chamber. This transducer is the second last transducer in the combustionchamber. The chart shows the traces for a fuel off shot (6779) and a fuel on shot (6782). Theseexperiments were conducted at a 0-degree angle of attack and a nominal altitude of 28km. The tracehighlights the pressure rise that is associated with combustion.
Page 10
PRELIMINARY REPDRT ON THE HYSHOT SCRAM,JET EXPERIMENTS IN T4
Aillo.
.=
=.=r,
350
300
250
200
150
100
50
0
Pressure vs Time
' Transducer # 15, 0 ° Angle of Attack,I
J__N_°eLna_'_A_t_u_e_ 28k_m............................... I
I
..................................
I
..................... 1 .......................
I
t Time Average Range 1......... t=z_ 5m -b_3ms---- -- -S-------- .... t, .................
>I,1 I
2 4 6 8 10Time (ms)
Figure 9 - Typical Pressure Time History
A
D.
P
(/)
P
300
250
200
150
100
50
0
Pressure vs Distance at t = 3.5ms
.......... i .....
Combustor
0° angleof attack,
_ _ __a'_A"_u"e28__
Thrus_r + r i
0 1O0 200 300 400 500
Distance (ram)
Figure 10 - Pressure vs Distance Plot
Pressure Distance History
O-Degree Angle of Affack
A graph displaying the pressure as a function of distance at t = 3.5ms is shown as Figure 10. Pressure as a
function of distance for a fuel off shot (6779) is compared with the pressure as a function of distance for a
fuel on shot (6782). These experiments were conducted at a 0-degree angle of attack and a nominal
altitude of 28kin. Pressure rise due to combustion can be observed, particulady towards the rear of the
combustion chamber.
Page 11
PRELIMINARY REPORT ON THE HYSHOT SCRAMdET EXPERIMENTS IN T4
Angle of Affack
A pressure distance historycomparison between4-degree, minus4-degree and 0-degree angle of attackshots is shown as Figure 11. These shots were conducted at a nominal altitude of 23km with a nominal
equivalence ratio of 0.310. At the same nominal equivalence ratio, the 4-degree angle of attack resultsproduced combustion chamber pressures which were greater than the 0-degree angle of attack pressures.Likewise the minus 4-degree angle of attack experiments produced combustion chamber pressures whichwere lower than the 0-degree angle of attack.
==.=
Q.
Pressure vs Distance at t = 3.Sms5oo
400
3OO
200
100
= 0.321_ _,,_ Normal Altitude 23km,
100 200 300 400 500
Distance (mm)
______.0 ° AOA ----II-- +4° AOA _ -4 ° AOA
Figure11- Pressurevs DistanceAngleof AttackVariation
Pressure distance histories for 0-degree, 4-degree and minus 4-degree angles of attack at 35km are shownas Figure 12 - Figure 14. The combustion chamber pressures in these plots have been normalised with thestagnation pressure to eliminate shot to shot variation. The small pressure rise between the fuel off and fuelon experiments at 35kin and 0-degree angle of attack indicates that only a small amount of combustion isoccurring. Experiments at 4-degree angle of attack and 35 km, Figure 13, displays a much higher pressurerise between the fuel off and the fuel on shots. This trend indicates that combustion is occurring at theseconditions. The pressure rise is more noticeable toward the rear of the combustion chamber. The minus 4-degree experiments at 35kin showed little pressure rise between the fuel off and fuel on shots indicating thatvery little, if any, combustion was occurring.
Page 12

PRELIMINARY REPORT ON THE HYSHDT SCRAMJET EXPERIMENTS IN T4
2.2E-02
Normalised Pressure vs Distance : 0° AOA
NominalAltitude 351q_
"_ 1.0E-02
2.0E-03 l , , ,90 140 190 240 290
Distance (ram)
--e-- FuelOn -!1-- FuelOff
Figure 12 - Normalised Pressure versus Distance for fuel off and fuel on at 0° A0A
.=:3(#
Q.13
E
Z
Normalised Pressure vs Distance : 4 ° AOA
2.2E-02
1.8E-02
1.4E-02
1.0E-02
6.0E-03
2.0E-03
_t= 0.413
....................................
9O 140 190 240
Distance (mm)
--_-- FuelOn _ FuelOff I
290
Figure 13 -Normalised Pressure versus Distance for fuel off and fuel on at 4° AOA
Page 13
PRELIMINARY REPORT nN THE HYSHnT SCRAMJET EXPERIMENTS IN T4
Normalised Pressure vs Distance (mm) : -4° AOA
2.2E-02 Nominal Altitude 351¢n
P 1.8E-02
u)¢)
P 1.4E-02n
_ 1.0E-02
6.0E-03
Z
2.0E-03
90
= 0.466
140 190 240
Distance (mm)
Fuel On --m-- Fuel Off ]J
290
Figure 14- Normalised Pressure versus Distance for fuel on and fuel off at -4° AOA
4° Angle of Aflack and 4 ° Skew
Analysisof experimental results shows a similarity between 4-degree angle of attack results and 4-degreeskew results. Figure 15 displays the relationship between the 4-degree angle of attack pressure distancedistribution and the 4-degree skew pressure distance distribution. These experiments were conducted at anominal altitude of 23kin and a nominal equivalence of 0.310.
Pressure vs Distance at t = 3.5ms
_t = 0.321 Nominal Altitude 23km
500 | _ _ _ J_ Nominal-_=OJ10_
400t-0| ........ _ .............. I_11, _ Illmm I001 ................ ,-_0._3_15___
= 200t...... --"-"........ .... .............o
0 50 100 150 200 250 300 350 400 450 500
Distance (mm)
.-4-- +4 ° AOA -m-4 ° Skew]
Figure 15 - Pressure vs Distance 4° AOA and 4° Skew
Average Combustion Chamber Pressure
An average combustion chamber pressure has been calculated for all shots. The average pressure is a
time average and has been calculated over 3 milliseconds during the test time, see Figure 9. Each pressuretransducerin the combustionchamberhas beenaveragedusingthis methodand then an overallaverage
Page 14

PRELIMINARY REPORT ON THE HYSHOT -qCRAMJET EXPERIMENTS IN T4
combustion chamber pressure has been calculated. To eliminate shot to shot variation the overall averagehas been normalised with respect to the stagnation pressure.
Plots of normalised average combustion chamber pressure versus equivalence are presented as Figure 16 -Figure 18. Each plot displays the normalised average combustion chamber pressure versus equivalence foreach altitude tested. These plots show that positive angles of attack have produced greater combustionchamber pressures than those generated at 0-degree angle of attack. Likewise negative angles of attackhave produced lower average combustion chamber pressures than those produced at 0-degree angle ofattack.
Normalised Pressure vs Equivalence Ratio3.0E-02
Nominal Altitude 35kin
2.5E-02 ........................
P2.0E-02 .......................................
" 4== f
1.5E-02 ..................... _< ................... __
o __, ........ 0OAOA _. 2OAOAz 5.0E-03 ......... _ _-. 4_AOA-__._ - - Sk-e_,-
O.OE+O0 [- ....
0.0 0.2 0.4 0.6 0.8 .0
Equivalence Ratio
• 0 ° AOA • 2 ° Skew ,,, 4 ° Skew x 2° AOA x 4° AOA tl -2° AOA + -4 ° AOA
Figure 16. NormalisedAverage Combustor Pressureversus EquivalenceRatio at 35kin
Normalised Pressure vs Equivalence3.0E-02
t Nominal Altitude 28km
2.5E-02 ..............................................o
2.0E-02
[ ............. -_ _-_._---:_----.--:--:--:--.-----:--:--._---
:_ 1.0E-02 __,,,_ ,__,___ _,.......... O=..AOA- ____2=-AOA _ _
I0.0E-K)0
0.0 0.2 0.4 0.6 0.8 1.0
Equivalence Ratio
• 0°AOA ii 2°Skew & 4°Skew x 2°AOA _{4°AOA •-2°AOA +-4°AOA ]
Figure 17- NormalisedAverageCombustorPressureversusEquivalenceRatioat 28km
Page 15
PRELIMINARY REPORT ON THE HYSHOT SCRAM,JET EXPERIMENTS IN T4
Normalised Pressure vs Equivalence
==
.=Q.
"0
0Z
3.0E-02
2.5E--02
2.0E.-02
1.5E-02
1.0E-02
5.0E-03
O.OE-_O00.0
I NorrinalAltitude23kin
........................................
.................... _ .....................
0.2 0.4 0.6 0.8 1.0Equivalence Ratio
• 0°AOA • 2"Skew & 4° Skew x 2°AOA x 4°AOA • -2°AOA + -4°AOA J
Figure18- NormalisedAverageCombustorPressureversusEquivalenceRatioat 23kin
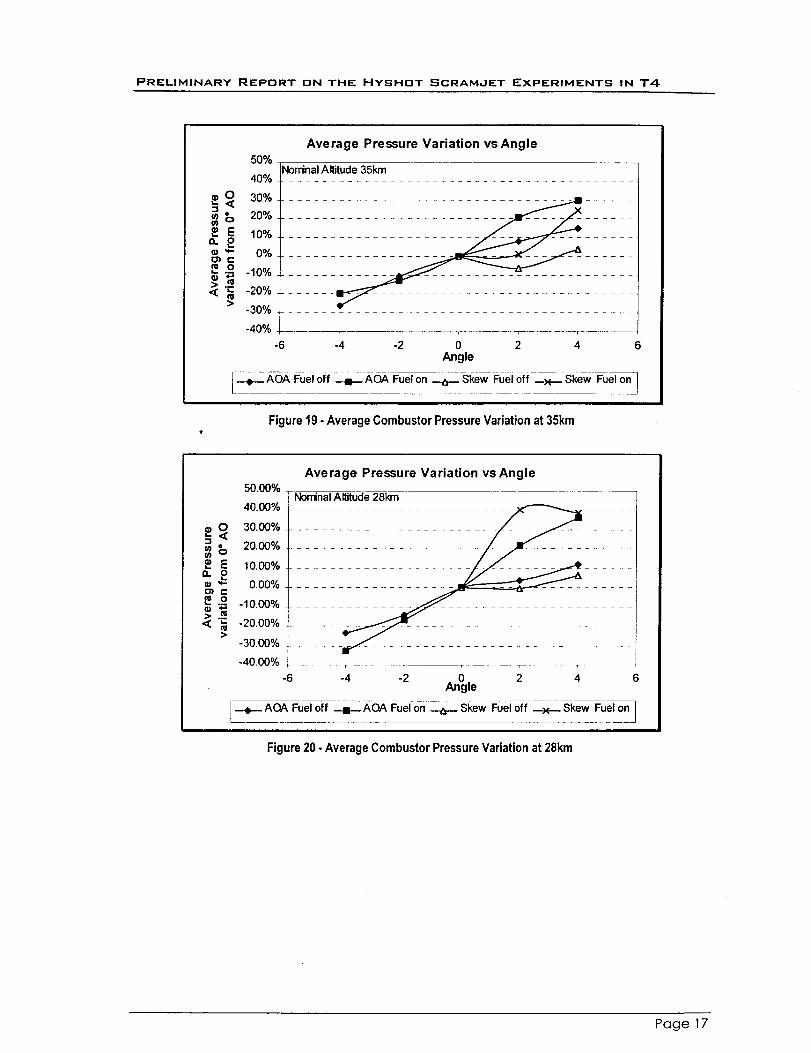
The average combustion chamber pressure at each angle of attack and angle of skew have been comparedto the average combustion chamber pressure at O-degreeangle of attack. These comparisons have beenmade for fuel off and fuel on shots. Figure 19 - Figure 21 display the average combustion chamberpressure variation from the O-degreeangle of attack average combustion chamber pressures for angles ofattack and skew at the altitudes tested. The pressure variation is presented as a percentage of the O-degree average combustion chamber pressure.
Experiments at positive 2-degree and minus 2-degrees produced average combustion chamber pressuresthat typically varied by +_.10-20% from the average pressures generated at O-degree angle of attack. Whenoperating at positive 4-degree and minus 4-degree angle of attack average combustion chamber pressuresdeviated by _+15-40%from the average pressures developed at O-degreeangle of attack.
Average combustion chamber pressures formed when operating a 2-degree skew are similar to 0-degreeresults,except at 28kin altitudewhere the fuelon averagecombustionchamber pressurewas 40% greaterthan the 0-degree angle of attack average combustionchamber pressure. 4-degree skew averagecombustion chamber pressuresat 23km varied by 10% from the 0-degree average combustionchamberpressures. At an altitudeof 28km and with fuel on, the 4-degree average combustorpressureswere 40%greater than those producedat 0-degree angle of attack. 4-degree skew average combustionchamberpressures at 35kin where 25% greater than the 0-degree angle of attack average combustionchamber
pressures.
Page 16
PRELIMINARY REPORT ON THE HYSHOT SCRAM,JET EXPERIMENTS IN T4
Average Pressure Variation vs Angle50%
4O%
0 30%20%
==o_-_ lo%
0%•_ °= -lo%
•_ -2o%<
> -30%
-40%
NominalAltitude 35km
..........................................
-6 -4 -2 0 2 4 6Angle
+ AOA Fuel off --I1--- AOA Fuel on _ Skew Fuel off ---x--- Skew Fuel on J
Figure 19 - Average Combustor Pressure Variation at 35km#
Average Pressure Variation vs Angle50.00%
40.00% Nornina_____l __ _
.e 0 30.00% ..............................
_ 20.00%u) o
P _ 1°.°°%a.
g 0.00%•_ °= -lo.oo%
< -20.00%
> -30.00%
-40.00% • __
-6 -4 -2 AnOle 2 4 6
+AOA Fuel off -!-- AOA Fuel on _ Skew Fuel off + Skew Fuel on I
Figure 20 - Average Combustor Pressure Variation at 28km
Page 1 7
PRELIMINARY REPORT ON THE HYSHDT SCRAM,JET EXPERIMENTS IN T4
Average Pressure Variation vs Angle5O%
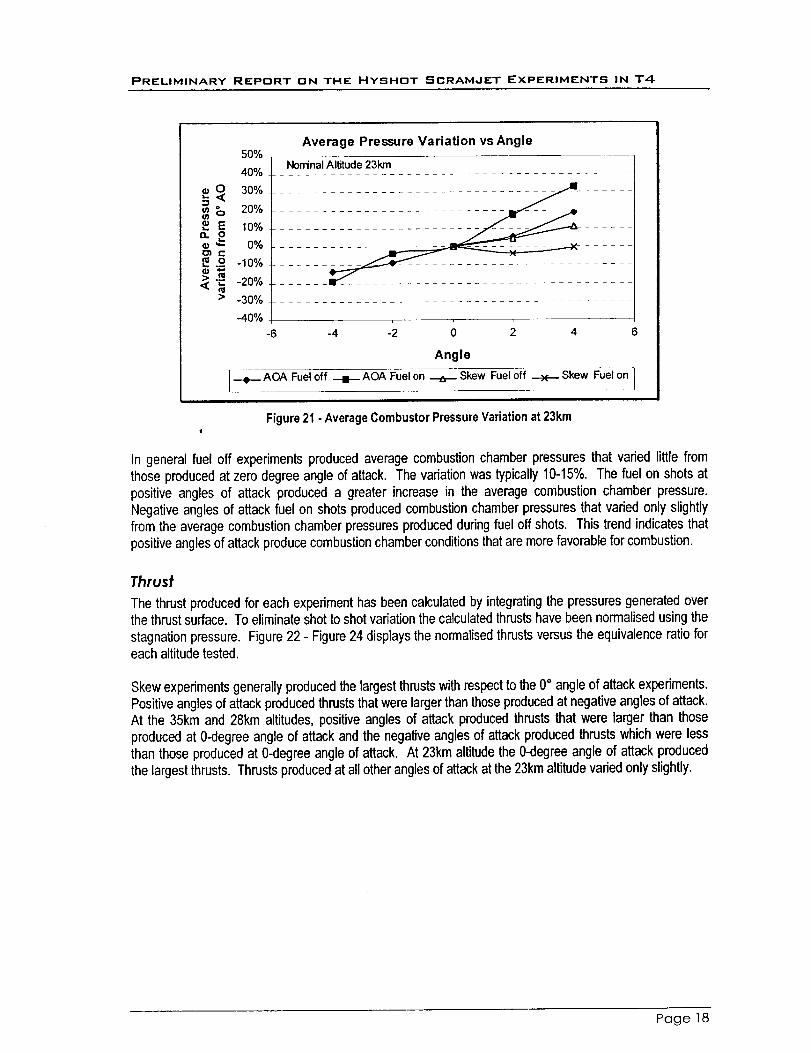
NominalAltitude 23kin40% .......................................
o%0%0%0%P -10%
< _ -20% ...... _ ...............................> -30% .....................................
-4o%
-6 -4 -2 0 2 4 6
Angle
AOA Fueloff -41-- AOA Fuel on _ Skew Fueloff --x--- Skew Fuelon tP
Figure 21 - Average Combustor Pressure Variation at 23km
In general fuel off experiments produced average combustion chamber pressures that varied little fromthose produced at zero degree angle of attack. The variation was typically 10-15%. The fuel on shots atpositive angles of attack produced a greater increase in the average combustion chamber pressure.Negative angles of attack fuel on shots produced combustion chamber pressures that varied only slightlyfrom the average combustion chamber pressures produced during fuel off shots. This trend indicates thatpositive angles of attack produce combustion chamber conditions that are more favorable for combustion.
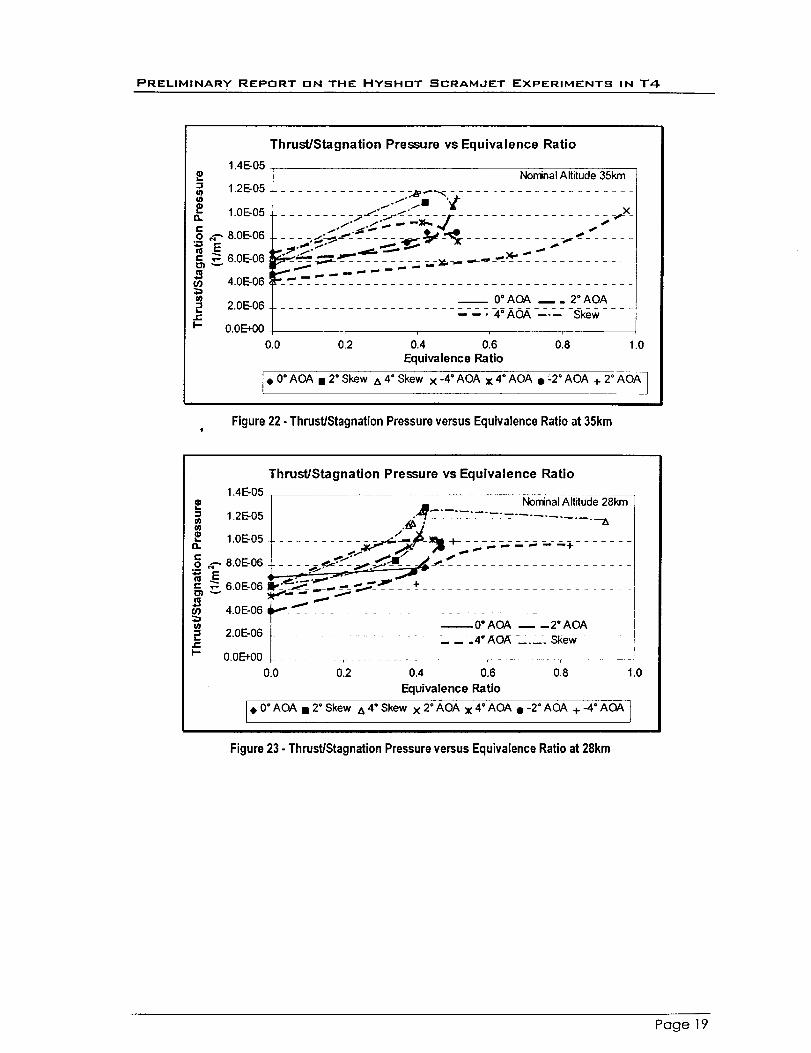
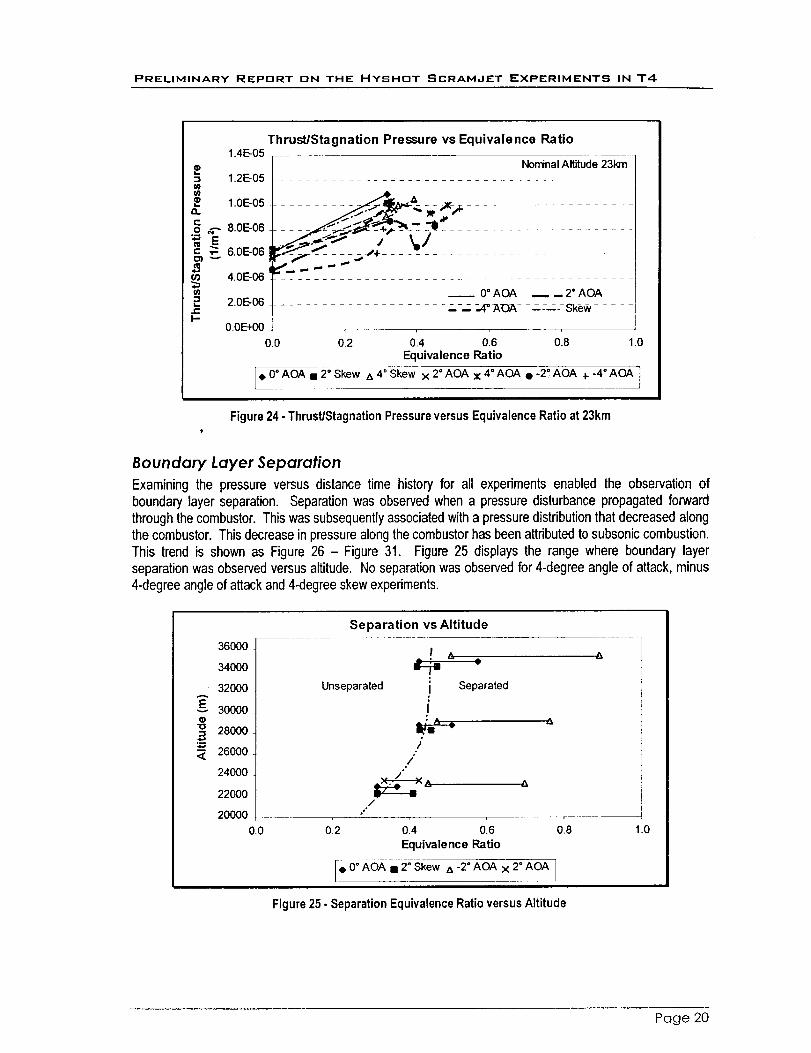
Thrust
The thrust produced for each experiment has been calculated by integrating the pressures generated overthe thrust surface. To eliminate shot to shot variation the calculated thrusts have been normalised using the
stagnation pressure. Figure 22 - Figure 24 displays the normalised thrusts versus the equivalence ratio foreach altitude tested.
Skew experiments generally produced the largest thrusts with respect to the 0° angle of attack experiments.Positive angles of attack produced thrusts that were larger than those produced at negative angles of attack.At the 35kin and 28kin altitudes, positive angles of attack produced thrusts that were larger than thoseproduced at 0-degree angle of attack and the negative angles of attack produced thrusts which were lessthan those produced at 0-degree angle of attack. At 23krn altitude the 0-degree angle of attack producedthe largest thrusts. Thrusts produced at all other angles of attack at the 23kin altitude varied only slightly.
Page 18
PRELIMINARY REPORT nN THE HYSHDT SCRAM,JET EXPERIMENTS IN T4
,on
I.
J=I-
Thrust/Stagnation Pressure vs Equivalence Ratio
1.4E-05
1.2E-05
1.0E-05
_-- 8.0E-06E
_ 6.0E-06
4.0E-06 1
2 0E-06 0° AOA __. 2 ° AOA.......................................
----. 4°AOA ---- Skew0.0E+00
Nominal Altitude 35km ]I
............... :.J_"- "_ _ ....................... I-- - 'Z vl
...... _- - _._ ..........................
_._" .." _. _..,,- ,.., ._P*/- I"" =_ V-. .==. _ ,,,.i ,,IMP" ,.. ,,,,..-p-_'_ _ _ __ ............ _f,._.. ---- ................
I__'__ ........................................
0.0 0.2 0.4 0.6 0.8 1.0
Equivalence Ratio
e 0° AOA • 2 ° Skew & 4 ° Skew x -4" AOA x 4° AOA • _2 ° AOA + 2° AOA ]
Figure22- Thrust/StagnationPressureversusEquivalenceRatioat35kin
Thrust/Stagnation Pressure vs Equivalence Ratio14E-05
U}
a.
r-I-
t Nominal Altitude 28kin
1.2E-05 .............. ,,_,__'_1, _'_ L--'-" _ .... ._&
1.0E-05 ............= _ ._J_""_-_7" -'_-? +-_ _'-';-'; :-_ ---_"r'l"......
_-_ 8.0E-06E
6.0E-06
4.0E-06
2.0E-06
0.0E+00
¢....-__._'___+_.........................
__0°AOA __ _2°AOA
............. __-.4"AOA .... SRew - -
0.0 0.2 0.4 0.6 0.8 1.0
Equivalence Ratio
e 0°AOA i2°Skew &4°Skew x 2°AOA x 4°AOA I-2"AOA +-4°AOA lt
Figure23- Thrust/StagnationPressureversusEquivalenceRatioat 28km
Page 19
PRELIMINARY REPDRT DN THE HYSHOT SCRAMdET EXPERIMENTS IN T4
Thrust/Stagnation Pressure vs Equivalence Ratio1.4E-05
-_ 12E-05u)u}• 1.0E-05a.
_ 8.0E-06
o -oo4.0E-06
IR2 2.0E-06J=I-
0,0EK)0
NominalAltitude 231o'n......................................
0°AOA _--2"AOA.................. ----; :-4"_,OA- --_:-_-- Sk_,h....
0.0
e O°AOA
0.2 0.4 0.6 0.8 1.0Equivalence Ratio
• 2° Skew z_4=Skew x 2=AOA x 4° AOA • -2",AOA + -4°AOA ]J
Figure 24 - Thrust/Stagnation Pressure versus Equivalence Ratio at 23km
Boundary Layer Separation
Examiningthe pressureversusdistancetime historyfor all experimentsenabled the observationofboundarylayer separation. Separationwas observedwhena pressuredisturbancepropagatedforwardthroughthecombustor.Thiswassubsequentlyassociatedwitha pressuredistributionthatdecreasedalongthecombustor.Thisdecreaseinpressurealongthecombustorhasbeenattributedto subsoniccombustion.This trend is shown as Figure 26 - Figure 31. Figure 25 displaysthe range where boundary layerseparationwas observedversusaltitude. Noseparationwasobservedfor4-degreeangleof attack,minus4-degreeangleof attackand4-degreeskewexperiments.
A
36000
34000
32000
30000
28000
26000
24000
22000
20000
0.0
Separation vs Altitude
_! A _
Unseparated I Separated
I
o-
/,°
/,*
0.2 0.4 0.6 0.8
Equivalence Ratio
{e0°AOAi2°Skew &-2°AOAx2°AOA]
1.0
Figure 25 - Separation Equivalence Ratio versus Altitude
Page 20

I-Z
[11I-zW
WO.×w
I-W
_r
IXU
I-inT
>-T
"1"I-
ZIn
F-IXInO.W
>.
z
.5Wn,Q.
00
E
II
0
(/)
0
_ ._ _,_
i I
I I 1 I0 0 0 0 00 0 0 0
(_d_l) e_nsseJd
00_r
0
00
N
00
0_0
00
0
c.
_. "_ 0 I
0.0. O'
0LO_r
0
0
00
A
E
o
r_00O,I
0t_
00"r-
I q I I o0 0 0 0 0 00 0 0 0 0
(_dM) e_nsse_d
A
O
II
00
II
0
..
E
E0
E
I!
-!
.__
A
O
II
I!
0
-_
E _•,- o.I!
E mo _
II
® P
Q.
m
°_
0o
o
00
I I I1#) f'_ I
I i I
I I I I
I:_ 0 C) 00 0 0
(ed_l)o.m_eJd
_r
o
oc_
8A
E
oo
ov-
oo
0u')
0 0 0 0 00 0 O 0 0
(ed)O eJnsseJd
A
II
II
._
E
I!
d0
z
E0
II
C
|
A
II
II
II
d0
z
E0
II
Ue.-
Q.
;;3

PRELIMINARY REPDRT ON THE HYSHDT SCRAMJET EXPERIMENTS IN T4
5O0
Pressure vs Distance at t = 4.5ms
Pressure distribution begins to
400 decrease alongthe combustion................. _:ffa_mS_r_............
300
_= 200=*
IO0
O , p , ,
50 100 150 200 250 300 350 400 450
Distance (mm)
Figure 30 - Pressure vs Distance at t = 4.5ms (Nora. AIt = 28kin; AOA = 0°; _ = 0.511)
Pressure vs Distance at t = 5.0ms
5OO
400
_" 300
200==
100
Pressure decrease along the
__ _"_-____ __ c;gimbuU;tionchambernow q_u__e _
50 100 150 200 250 300 350 400 450
Distance (mm)
Figure 31 - Pressure vs Distance at t = 5.0ms (Nora. AIt = 28km; AOA = 0°; _k= 0,511)

TABLE1 -- RUN SUMMARY
,-qUMMA R Y
It is concluded that supersonic combustion was taking place withinthe combustionchamber. Pressurerises within the combustion chamber were observed during fuel-on shots. Fuel-on shots for lowfreestream pressures produced combustion towards the rear of the combustion chamber. As thefreestream pressure increased, combustion moved forward in the combustion chamber. At highfreestream pressures, a pressure rise along the length of the duct indicated combustion was occurringtowards the front of the combustion chamber.
Angle of attack tests showed an increase in combustion chamber pressures for positive angle of attacksand a decrease in pressure for negative angles of attack. This result is due to intake shock geometrychanges associated with angle of attack operation. 2-degree angle of skew produced combustionchamber pressures which were similar than those produced at 0 degree angle of attack. Thus smallchanges in skew have a negligible effect on the operation of the scramjet. Positive 4-degree angle ofattack experiments produced similar combustion chamber pressures to the 4-degree skew results.
The experimental scramjet operated in a stable manner for equivalences less than 0.4 betweenaltitudes of 35km and 28kin. The stability limit decrease to an equivalence of 0.3 at the lower altitude of23kin. No separation was observed when the scramjet operated at 4-degree skew, positive 4-degreeand minus,4-degrees angle of attack.
REFERENCES
Lordi, J.A., Mates, R.E., and Moselle, J.R. (1966), Computer program for the Numerical Solution ofNon-equilibrium Expansion of Reactinq Gas Mixtures, NASA CR-742.
Mclntosh, M.K. (1968), Computer Program for the Numerical Calculation of Frozen andEquilibrium Conditions in Shock Tunnels, Dept of Physics, ANU Report.
>.
Z
DB
Z
I
.Jol<
epnl!llV lqS!l-i E
emloJedtuellq6!lt
eJnsseJcl lq6qd o• v
peads >looqs E
eJnss_J d
UO!IDU6DIS
gJnssg/dII!d eqnl M::)oq$
ldd eJnsseJdI_nd ID!gUl
"'dd
_JNS$_Jd land
MelS Jo el6uVcp"O
e)pogV
!o el6uV o"O
AdlOlU] IOl01 _,
J_qLunN q_ow
eJnssoJd |Ol!d
AP.:)OlOAIIIDOJIS_,OJd
eJn|oJedI.LleJ.
UJO_J)$ooJ d
_iJnssaJlJ
UJDa/|seeJ d
tuoJqdo!a E
,eqLunN una "E=)
88ooo oo o oo8o
000_000 0000000
i000000 _ 00000 _ _ _ _ 000 _ 00 _ _ _ 0 _ 00'_ __,,
__i_'_:_
O4
E)')DEL.
)-n,
ZZ-1
Z3n,
I
..I
I11
q
apnI!IIV lq6!hl
amloJ_dw_t
lq6!H
eJnsseJcl lq6!H
paed$ >looqs
@Jnss_J d
UO!|DU_DIS
_JNSS_)P¢I
IllJ aqnl >looqs
idJ aJnssaJdlenJ IDi|iUl
mdJ
_Jr_Ss_J d J_l:J
MgIS JOal6Uy
NOOgVJO Ol6UV
AdlolU3 IOlOJ.
JgqWNN N:>DW
_JrIss_JcJ |0_
XllOOl_^LUD_J|Sa_J.I
OJN|DJ_duLI_ 1
aJfISS_JcJ
U.JD@JIS_gJJ
WDJqdDK]
JaquJnN unH
!v
Ev
.................... _ ,._: i ,__ .... !,_: ....
!_ o ooo ooooooooooooooooooo
nv
_o_0o_o _0__0_0_0,0_00_
(7e
"10
e
e
7,
0 0 C 0 0 _ _ 0 0'010 _ 0 0 0 _ 0 0 0 0 0 0 _ 0 0 _ 0 _ _ _i0
_ o _ _ _ oo_ _ Voi_ _ooo,o _!_ _ o_ _ ooo o oo
o o o o o o o o o o o oo o o _ _ ol _ _ _ o-- _
___--_ __'_oooooo
v
O4
©
O)
0
n

)-rv<Z
301
Z3n_
I
?,.J
m
<I-
ePnlillVlq6!hl E
eJnlmaduJallq6!H v
aJnsseJd lq6!hl
paads >lOOqS
oJnssoJ4 oUO!lOU6Ol$
_JnSS_J_l Oo.
Ilhl oqnJ.)looqs ,,
Id:! aJnss_Jd olan:l IOg!Ul -_
tUd:l oamsseJd lan:l ._
MalS IO al6UV t7
"0
)lOOllVJo el6UV o
AdlolU:l IOlOl ._o
zeqkunN q3ow ,
aJnssoJd lO_d o
AI!.OOleAllloaJ|$aaJj E
eJnlOJadLUal
LUD_J|S_J:I
_JNSS_Jcl
ILMDOJ|$G OJ.I
UJOJCldo!Q
J_qLUNN UI3_l
(v-) o3 0,,")_ C'1!("4 CN (_
C_I C',l ; C'q CN C'q C'_I C"q C_ C_ C'4 Cq
!_0__ ____
______i_........................ o o'o o'o oio
_o _ _ _ _ w _ _-- _ w _ _ o_ _ _!w= _,_ _ _,_ _,_ _,_ _,_ _,_ _,_ _,_ _,_ _,_ _
_0___0___d_'dd d d'd d'd _ _'d _'_ _' "
o o o- o ,_ ,oi_",0 ",0 ",_ ",0 "_3 ",01"40
d d'd d'o d;d
CO _ O- _,_ _ O0
-q _..-q_.._ h'q
--000000
_'_'_
oo ooooooo ooooo8o 8 oooooooooO_ 1--_ (>. O r_. O_. O_ O_ _r) cO r_. _ c_, O_ ("3 (_) !t'r) I_0 t"r)
O_O_iO_O000OO00000_O_OOiO0000_
o! 0000000000000000_0_0_0__0_
_'_ _:_'_'_'_'_'_'_'_'_ _'_ _'d'_'_ _
v
",0CN
O)00_
>-n,',¢_r:E:3Lrl
Z-Ii1,,
I
5,J
I-
apnI!IIV lq6!l-I E
eJnlma, d,,,ellq6!l:l ""
elnsseJd lq6!lt
"T
peeds >lOOq$v
eJnssaJa oUOgDU6DIS
aJnss_d !oI&.
lilt aqnl )l:)oqs v
Id:l e,lnssa,ld orL
lanl IO!flUl
u4d=l oo.
emsseJd lan:l .._
MelS |0 al6U V
"0
¢J
>l:)OgVlo allSuv o
'13
AdlolU ] iO|O 1 C
_,_=__m_
_0__0_0_'_
_0____0__
_ dddddddddddd
OO_O_OO_OO
JequJnN qoow ,
O O _ O O O O O O O10 O
__O_O___O_O__O___0
N_NNNNNNNNN_
__0_
_.o_ _ _._-_._io. o0-_
moaqseaJ:! E c_ c_ _ c_ c_ c_ _ c_ c_;_ c_ c_
eln|oJedUJel _;m oo e3 co co'_ _ _ _tuoaJlSaaJ.I
,.._.ooo-_.o,.._o-oo
o-- o C c5 c5 c5 c5 c5 c5:c5.-:LUD_J|SO_J.I
EUJDJLIdD!Q E
J_qtunN unH c _ _ _ "_ "_ _ _ _oi_ _ _
p.,.
C_
(1)(9)0

_..J- i
8Lcl
I.I.I.--i
<
i-.-
<
l.i_l
-i-
l.l.i
z
zl.i..l
-'-I' I
i
ii!I
/--i l i
ILl
(.Jl/)
..J
z
m
li
00
__ oo zI_ t",i
__O_o
0

cc
ie
\
@
(N
O'OL
@
O'OI
A
r--1
r_l
©
©
000Cq
_ i e-,<_1__1_<1,_
Z
_ g
_ b
r_
Z o
< >r..) _rm _
@
@
ZI
0_1
ZIUJI
Oil
©l
_.-41
0_1
k
©_n
000
.- 2:
o
H
o

II
¢.e-i
U, r-
@
\\
@
©Q
__ _o

y Io Atln. of:
National Aeronautics andSpace Administration
Langley Research Center100 NASA Road
Hampton, VA 23681-2199
126
The University of QueenslandBrisbane, Queensland 4072Australia
iTHEUNIVERSITYOFQUEENSLANu:I
7 APR 2000
l
"7 APR 21u u
OFFICE OF REAND p SEARCH
OSTGP. DUATE$TUOIES
(."
MANAGEMENT
2 ".,. .... .;"LUuU
Subject: NASA Langley Research Center (LaRC) Research Grant NAG-l-2113-- Notice ofDelinquent Summary of Research Report Submission (Principal Investigator:,.,,.n-Allan Pau!l)
The purpose of this letter is to inform you that your institution is beyond the 90-day grace period allowedfor the submission of the Summary of Research report required by the subject grant. The grant expiredon 9/30/99.
Pursuant to the NASA Grant and Cooperative Agreement Handbook, Section 1260.21, a Summary ofResearch report is due within 90 days after the expiration of the grant, regardless of whether or notsupport is continued under another grant. There is no specified format for this report; however, it shouldinclude, as a minimum, a comprehensive summary of significant accomplishments made throughout thetotal period of the grant.
In as much as the Summary of Research report is the onlv deliverable required under the subject grant,it is imperative that the LaRC Grant Office, Mail Stop 126, receive this report. Copies of the reportshould also be submitted to MS 168, Dr. Aaron H. Auslender, LaRC Technical Officer, and to the NASACenter for AeroSpace Information (CASI). The CASI copy should be easily reproducible (i.e., one-sided, no-staples, and no-binder) and should be submitted to the following address:
NASA Center for AeroSpace Information (CASI)7121 Standard DriveHanover, MD 21076-1320
If the Summary of Research report has not been submitted to the undersigned by April 18, 2000, theCenter will withhold all future grants, grant supplements, and/or payments to your institution. Youshould contact the LaRC Grant Administrator, Ms. Carol Reddic, within 1 week of receipt of this letter tomake arrangements for submitting this delinquent report. Ms. Reddic can be reached by phone at(757) 864-6042. If you have other questions regarding this requirement, contact me at (757) 864-2477or e-mail me at r.t.lacks('_,larc.nasa.qov.
R. Todd LacksLaRC Grant Officer