i-5/sr-56 interchange project hydraulic study...906.50. the 440 square kilometer hydrologic unit...
TRANSCRIPT

CARMEL VALLEY CREEK LOCATION HYDRAULIC STUDY
I-5/SR-56 Interchange Project
Carmel Valley CreekLocation Hydraulic Study
February 2010


ii February 2010
CARMEL VALLEY CREEK LOCATION HYDRAULIC STUDY
TABLE OF CONTENTS
Executive Summary...................................................................................................................iv
1. Introduction......................................................................................................................... 1
1.1 Project Purpose and Vicinity Map...............................................................................1
1.2 Description of Project Alternatives............................................................................. 2
1.3 Description of Creek................................................................................................... 3
2. Floodplain Modeling Methodology.................................................................................... 4
2.1 HEC-RAS Input.......................................................................................................... 4
2.1.1 Cross Sectional Geometry...............................................................................4
2.1.1.1 Bridges..............................................................................................5
2.1.1.2 Ineffective Flow
Areas.................................................................................................9
2.1.1.3 Flood Insurance Study Cross
Sections............................................................................................ 9
2.1.2 Existing Floodplain
Conditions....................................................................................................... 9
2.1.2.1 Existing Floodplain Delineation as Shown by FEMA..................... 9
2.1.2.2 Existing Conditions Model Structures............................................. 10
2.1.3 Manning’s Roughness Coefficient.................................................................. 10
2.1.4 Starting Water Surface Elevation....................................................................11
2.1.5 Discharge.........................................................................................................12
2.2 HEC-RAS Output........................................................................................................12
2.3 Warning Messages...................................................................................................... 13
3. Risk Assessment...................................................................................................................14
4. Summary and Conclusions................................................................................................. 15
5. References............................................................................................................................16

iii February 2010
CARMEL VALLEY CREEK LOCATION HYDRAULIC STUDY
APPENDICES
Appendix A: Floodplain Exhibits
Proposed Alternatives Exhibits
Flood Insurance Rate Map (FIRM)
Flood Insurance Study (FIS)
VERTICON Conversion Output
Base Flood Elevation Table
Appendix B: Results Summary
HEC-RAS Cross Section Input/Output
Appendix C: Location Hydraulic Study Form
Floodplain Encroachment Form
Record of Conversation with FEMA
As-builts
Planning Study
Appendix D: HEC-RAS Model on CD

iv February 2010
CARMEL VALLEY CREEK LOCATION HYDRAULIC STUDY
EXECUTIVE SUMMARY
The Location Hydraulic Study presents the impacts to the Carmel Valley Creek 100-yearfloodplain from the proposed improvements to the interchange at Interstate 5 (I-5) and StateRoute 56 (SR-56). The study analyzes the existing 100-year floodplain of Carmel Valley Creekalong the south of SR-56 from the Carmel Country Road overcrossing (upstream) to the I-5overcrossing and confluence with Soledad Canyon (downstream) and determines if the proposedI-5/SR-56 Project will have impacts on the floodplain.
The proposed I-5/SR-56 Interchange Improvement Project includes four build alternatives toimprove traffic flow at the interchange. The build alternative which would impact the floodplainmost, if at all, is the Direct Connector Alternative. This alternative proposes two direct connectorstructures in addition to grading and road widening along SR-56.
The Location Hydraulic Study is based on a computerized model of the existing floodplain usingHydraulic Engineering Center River Analysis System (HEC-RAS 4.0) software, developed bythe US Army Corps of Engineers for the purpose of modeling water flow through natural openchannels. The HEC-RAS model utilizes available flood information from the FederalEmergency Management Agency (FEMA). Attempts were made to match the 100-yr floodplainas shown in the Flood Insurance Rate Maps (FIRMs), dated 1997. However, comparing theFIRM maps to more recent topography, it was determined that the existing floodplain modelwould not match with FEMA, so a new model was created to represent current existingconditions.
The results of the study showed the proposed I-5/SR-56 Interchange improvement alternativeswould not add any piers or fills to the floodplain or alter the topography within the 100-yrfloodplain in any way. The functionality of the interchange and freeways would be improvedwithout causing water surface elevations to rise, and without causing any greater risks to life orproperty within the floodplain.

1 February 2010
CARMEL VALLEY CREEK LOCATION HYDRAULIC STUDY
1. Introduction
The Location Hydraulic Study presents the impacts to the Carmel Valley Creek 100-yearfloodplain from the proposed improvements to the interchange at I-5 and SR-56. The studyanalyzes the existing 100-year floodplain of Carmel Valley Creek along the south of SR-56 fromthe Carmel Country Road overcrossing (upstream) to the I-5 overcrossing and confluence withSoledad Canyon (downstream) and determines if the proposed I-5/SR-56 Project will haveimpacts on the floodplain.
1.1 Project Purpose and Vicinity Map
Figure 1: Project Vicinity MapThe Carmel Valley Creek is located in the City of San Diego just south of Carmel Valley Road.
(Thomas Bros. Maps, 2009 – pages 1187, 1188, 1207, 1208)
This study was prepared for Caltrans for the purpose of determining impacts to the CarmelValley Creek 100-year floodplain resulting from the proposed improvements to the interchangeat I-5 and SR-56. The proposed I-5/SR-56 improvements include four alternatives to improvetraffic flow at the interchange: the Direct Connector alternative, the Auxiliary Lane alternative,the Hybrid alternative, and the Hybrid with Flyover alternative.
This study specifically addresses the following:• The Carmel Valley Creek 100-year floodplain as it will exist after the I-5 North Coast
Widening Project and the Sorrento Valley Road Pedestrian Bridge are constructed.• The Carmel Valley Creek 100-year floodplain after the proposed Direct Connectors have
been constructed.• The Carmel Valley Creek 100-year floodplain after the proposed Auxiliary Lane alternative
has been constructed.• The Carmel Valley Creek 100-year floodplain after the proposed Hybrid alternative has
been constructed.
Project Site

2 February 2010
CARMEL VALLEY CREEK LOCATION HYDRAULIC STUDY
• The Carmel Valley Creek 100-year floodplain after the proposed Hybrid with Flyoveralternative has been constructed.
• A risk assessment associated with any possible encroachment, including impacts on naturaland beneficial floodplain values, probable incompatible floodplain development, andspecial mitigation measures needed (if any) to minimize impacts to the floodplain.
1.2 Description of Project Alternatives
The proposed improvements to the I-5/SR-56 interchange include four alternatives that wouldimprove traffic conditions at the interchange during peak hours, and would be constructed nearCarmel Valley Creek. The Direct Connector Alternative is the more extensive of thealternatives, and would be constructed nearest the creek. Therefore, this alternative waschosen to represent proposed conditions for the study. Results are provided in this report,which demonstrate that no rise in the water surface elevation (WSE) of the existing CarmelValley Creek floodplain should occur due to the proposed improvements.
The Direct Connector alternative proposes the construction of direct freeway to freewayconnector structures in the westbound SR-56 to northbound I-5 direction and the southbound I-5 to eastbound SR-56 direction. The southbound to eastbound connector structure would addpiers near the right bank of the creek between I-5 and El Camino Real. The westbound tonorthbound connector structure is located far away from the floodplain and not of concern inthis study. This alternative would also add lanes and grading along eastbound SR-56, nearCarmel Valley Creek.
The Auxiliary Lane alternative proposes the addition of an auxiliary lane at southbound I-5between Del Mar Heights Road and Carmel Valley Road, and the addition of a multi-purposelane to westbound SR-56 between Carmel Country Road and I-5. This alternative would notadd any piers to the creek banks, but would add improvements and grading along SR-56, nearCarmel Valley Creek.
The Hybrid alternative is a combination of the Direct Connector Alternative and the AuxiliaryLane Alternative. This alternative proposes the construction of a westbound SR-56 tonorthbound I-5 direct connector and the proposed southbound to eastbound local streetimprovements featured in the Auxiliary Lane Alternative. Since the westbound to northbounddirect connector structure is not of concern in this study, the impacts to Carmel Valley Creekfrom the Hybrid alternative would be similar to the Auxiliary Lane alternative.
The Hybrid with Flyover alternative proposes the construction of a westbound SR-56 tonorthbound I-5 direct connector and the addition of a flyover structure that would connecteastbound Carmel Valley Road to eastbound SR-56. Both structures are far enough away fromCarmel Valley Creek that neither would add any piers to the creek banks. This alternativeproposes local street improvements and grading along eastbound SR-56.

3 February 2010
CARMEL VALLEY CREEK LOCATION HYDRAULIC STUDY
1.3 Description of Creek
Figure 2: Regional Basin Area
The Carmel Valley Creek is located within the Los Penasquitos Lagoon watershed basin,designated as the Regional Water Quality Control Board’s (RWQCB) Hydrologic Unit 906.10-906.50. The 440 square kilometer hydrologic unit includes the cities of San Diego, Poway, DelMar and unincorporated regions of San Diego County. The major basins within the LosPenasquitos Lagoon watershed are Carroll (Soledad) Canyon, Los Penasquitos Canyon, andCarmel Valley. These basins flow in a westerly direction towards the Pacific Ocean.Elevations within the watershed range from 880 meters above mean sea level in the upperwatershed to mean sea level.
The 40.7 square kilometer Carmel Valley sub-basin flows through the valley in a westwarddirection from its headwaters on Black Mountain to the Los Penasquitos marsh area. Thecreek was historically an ephemeral drainage; however, due to development within the upperwatershed, the creek now supports year-round flow. Carmel Valley Creek is slightly incisedwithin its upper reaches. Material eroded from the Carmel Valley network is depositeddownstream in gradients as the drainage approaches the lagoon. Runoff from Carmel ValleyCreek enters the Los Penasquitos Lagoon within the northeastern corner.
Project Site
PENASQUITOS WATERSHEDHydrologic Unit 906.10-906.50
4 February 2010
CARMEL VALLEY CREEK LOCATION HYDRAULIC STUDY
2. Floodplain Modeling Methodology
The Carmel Valley Creek model begins upstream of the Carmel Country Road Bridge crossing.Upstream of the crossing, the creek flows through a relatively clean channel of short grass andscattered brush. Immediately after the crossing, the creek opens up into a heavily vegetated plainover 200 meters wide and 400 meters long. After the plain, the creek narrows, following anequally vegetated channel for 1400 meters and crosses under the Carmel Creek Road and ElCamino Real bridge crossings. Downstream of El Camino Real, the creek opens up into anotherplain over 200 meters wide and 400 meters long.
2.1 HEC-RAS Input
HEC-RAS 4.0 software was used to model the existing Carmel Valley Creek. Cross sectionswere defined at all bridge crossings, expansions, contractions, and other significanttopographical changes to accurately depict the shape of the floodplain and account for anybackwater effects that would occur due to flow constrictions.
2.1.1 Cross Sectional Geometry:
Since Carmel Valley Creek has an established FEMA floodway, the model ties into existingFEMA cross sections at the upstream and downstream locations. Additionally, a LocationHydraulic Study has already been completed for part of this floodway, included in the I-5North Coast Improvement project, which models Carmel Valley Creek from Soledad Canyonto just upstream of El Camino Real crossing. Because the I-5/SR-56 Interchange project willbe constructed after the I-5 North Coast Project, the proposed conditions model from theprevious study was incorporated into the existing conditions model for this study at FEMA’scross section J. Additional cross sections were placed upstream of cross section J and aroundeach of the bridges to properly model them individually. Just upstream of Carmel CountryRoad Bridge, the model ties into another FEMA cross section with a known base floodelevation. ArcGIS 9.2 was used to cut the contours from topographic surveys provided bythe San Diego Geographic Information Source (SanGIS) (2 foot contours, NAVD 88).Digital topography was also supplied by Caltrans (0.5 meter contours, NAVD 88).Topography provided by Caltrans, compiled by Olympic Mapping System, was used to inputthe elevation of the I-5 bridge deck elevations. Cross section stations and elevations wereobtained by using CAiCE Visual Transportation 10. All elevations given are in NAVD 88.For this study, HEC-RAS was analyzed with the Standard Step Method under mixed flowconditions.

5 February 2010
CARMEL VALLEY CREEK LOCATION HYDRAULIC STUDY
2.1.1.1 Bridges
The existing bridges within the study area include the Carmel Country Road Bridge,Carmel Creek Road Bridge, El Camino Real Bridge, the northbound to eastbound SR-56Truck Connector, the I-5 Bridge, the Carmel Valley Creek Sorrento Valley Road (SVR)Bridge, and the westbound to southbound SR-56 Truck Connector. All of the bridge decksare entirely above the floodplain and only their piers have any effect on the floodplainwater surface elevations. The bridges were modeled using Energy (Standard Step) methodand Momentum equations, with the highest energy answer selected.
The bridges were modeled at the following Cross sections:
• Cross section #1100 - westbound to southbound SR-56 Bridge Connector• Cross section #1163 - Carmel Valley Creek SVR Bridge• Cross section #1400 - I-5 Bridge• Cross section #1500 - northbound to eastbound SR-56 Bridge Connector• Cross section #3100 - El Camino Real Bridge• Cross section #5900 - Carmel Creek Road Bridge• Cross section #11100 - Carmel Country Road Bridge
The as-built drawings and advanced planning studies (APS) used to model the structureslisted above are located in Appendix C. In addition, the modeling was augmented frominformation gathered in the field. A clogging factor of +25% was added to the bridge pierswith diameters greater than 1.2 meters, and the smaller diameter piers were doubled in size.This approach was used to account for debris which could catch on the many piers withinthe floodplain and provide additional blockage to the flow.
At the most upstream location of the model, the Carmel Country Road Bridge (Figure 3) isconstructed atop two sets of piers, each 1.2 meters thick, and the bridge deck is above the100-yr floodplain. The piers were modeled as 2.4 meters thick to account for debris.
Figure 3: Carmel Country Road Bridge

6 February 2010
CARMEL VALLEY CREEK LOCATION HYDRAULIC STUDY
The Carmel Creek Road Bridge (Figure 4) is constructed atop two pairs of piers, 1.5 metersthick, and the bridge deck is well above the 100-yr floodplain. The pier walls weremodeled as 1.9 meters thick to account for the clogging factor.
Figure 4: Carmel Creek Road Bridge
The El Camino Real Bridge (Figure 5) is constructed atop 6 pier walls, 0.45 meters thick,and the bridge deck is well above the 100-yr floodplain. The pier walls were modeled as0.9 meters thick to account for debris. This bridge deck supports a small gas pipe thathangs along the east side. To account for this, 0.5 meters was added to the thickness of theupstream bridge deck.
Figure 5: El Camino Real Bridge

7 February 2010
CARMEL VALLEY CREEK LOCATION HYDRAULIC STUDY
The northbound to eastbound SR-56 Bridge Connector, located east of the I-5 Bridge, hasten rows of 0.5 meter diameter concrete piers within the floodplain (structure contract planno. 11-030111 in Appendix C). The deck of this connector is entirely above the floodplainand was not a concern in the model. The bridge piers were modeled with 1.0 meterdiameters, including the clogging factor.
Figure 6: Carmel Valley Creek beneath the northbound to eastbound SR-56 Bridge Connector, lookingsouth.
The existing I-5 Bridge (Figure 7) consists of ten rows of 0.6 meter piers. The bridge pierswere modeled as 1.2 meter diameters to account for debris. The proposed widening of theI-5 Bridge was input in accordance with the Carmel Valley Creek (Widen) Planning Study,dated November 2004 (Appendix C) as an existing condition. The bridge would bewidened to the west by 1.6 meters to 2.4 meters, and ten additional piers would beconstructed within the floodplain.
Figure 7: Carmel Valley Creek beneath the I-5 Bridge, looking east

8 February 2010
CARMEL VALLEY CREEK LOCATION HYDRAULIC STUDY
The existing Carmel Valley Creek SVR (Figure 8) spans a 12 meter wide triple box culvert.However, a pedestrian bridge that will replace the culvert was modeled using HEC-RAS torepresent existing conditions. The Sorrento Valley Road Pedestrian Bridge was input inaccordance with the Carmel Valley Creek SVR, Planning Study, dated June 2006(Appendix C). The proposed replacement bridge was designed solely for pedestriantraffic. At 4.55 meters wide and 135 meters long, with thirteen rows of 0.46 meter piers,the bridge spans the entire width of Carmel Valley Creek and removes the existingconstriction of the flow. Because the pedestrian bridge will be constructed before theproposed I-5/SR-56 improvements, the pedestrian bridge was modeled instead of theculvert as an existing condition in this study. The bridge piers were modeled as 0.9 meterdiameter piers to account for debris.
Figure 8: Carmel Valley Creek SVR Triple Box Culvert Bridge, looking northeast
The westbound to southbound SR-56 Bridge Connector (Figure 9) has three rows of 1.7meter diameter concrete piers within the floodplain (structure contract plan no. 11-030114in Appendix C). The deck of this connector is entirely above the floodplain and was not aconcern in the model. The bridge piers were modeled with 2.1 meter diameters, includingthe clogging factor.

9 February 2010
CARMEL VALLEY CREEK LOCATION HYDRAULIC STUDY
Figure 9: Westbound to southbound SR-56 Bridge Connector, looking southwest
2.1.1.2 Ineffective Flow AreasThe cross section exhibits in Appendix A show the ineffective flow areas for the postproject conditions. The contraction and expansion areas upstream and downstream of thebridges within the project vicinity are modeled as ineffective flow.
2.1.1.3 Flood Insurance Study Cross SectionsDetailed hydraulic analyses have been performed in this area, and a base floodplainelevation has been determined as shown in the Flood Insurance Rate Map (FIRM) (seeAppendix A). The downstream boundary of the Carmel Valley Creek/ I-5 models tie intothe confluence of Carmel Valley Creek and the Soledad Canyon FEMA floodplain at riverstation 356. Upstream the models tie into the Carmel Valley Creek FEMA base floodelevation cross section between W and X, at river station 11503.
2.1.2 Existing Floodplain ConditionsIn determining existing conditions of the floodplain, available data from FEMA was studiedand incorporated as much as possible. A HEC-2 model was received, dated 4/15/93, fromFEMA per a backup data request that was submitted on 1/13/05 for use with the I-5 NorthCoast Floodplain study. In addition to the HEC-2 model, topography, and a plan view of thecut cross sections along the Carmel Valley Creek were requested. Upon further coordinationwith FEMA during the North Coast Project, it was concluded that all of the available data forthe established federal floodway had been received and back-up topography or working mapswere not available. Only the HEC-2 output was received. Attempts were made to salvagethe existing model by matching the HEC-2 model to FIRM cross sections and recenttopography. Based on cross sections within the FIRM, recent topography and the HEC-2stations, elevations and reach lengths, it was determined that the model could not beregenerated with reasonable certainty. Therefore, a new existing conditions model wascreated using more recent information.

10 February 2010
CARMEL VALLEY CREEK LOCATION HYDRAULIC STUDY
2.1.2.1 Existing Floodplain Delineation as Shown by FEMASeveral hydraulic models were developed to determine the most accurate methods in whichto depict the floodplain of the Carmel Valley Creek. Attempts were made to match the100-yr floodplain as shown in the FIRM maps (dated 1997) in Appendix A. However, incomparing the FIRM maps to more recent topography, it was determined that the existingfloodplain model would not match with FEMA due to outdated topography. The FIRMmaps do not show the floodplain following within the existing creek banks, but insteadcrossing over the existing SR-56, indicating that the FIRM floodway delineation wasestablished prior to construction of SR-56 and not updated to reflect the freeway. Thefloodplain exhibits in Appendix A compare the FIRM maps to the determined existingfloodplain.
2.1.2.2 Existing Conditions StructuresThe new existing conditions model incorporated both the proposed North Coast I-5Widening Project and the proposed Sorrento Valley Road pedestrian bridge. The existingSorrento Valley Road Culvert located downstream of the I-5 bridge does not currently havethe required capacity to pass the 100-yr storm and would overtop during a 100-yr stormevent. However, replacement of the culvert and widening of the existing I-5 freewaywould be constructed in accordance with the North Coast Widening Project before the I-5/SR-56 Interchange Improvement Project and is used as the existing conditions floodmodel.
2.1.3 Manning’s Roughness Coefficient:Each cross section contained a left overbank, main channel, and right overbank, whichrepresented the different regions of the waterway in terms of roughness coefficients. Themain channel and overbanks were simulated as the creek bottom and channel side slopesrespectively. Manning’s Roughness Coefficients were obtained from Haestad Methods,Floodplain Modeling Using HEC-RAS, first edition, and through field verification. Upstreamof the northbound to eastbound I-5/SR-56 connector, the left overbank consisted of timberand dense brush (0.12), while the main channel consisted of medium to dense brush with lessmature trees (0.10) in most locations, and scattered patches of reeds and light brush. In aflood event, reeds lay flat and light brush washes out, reducing Manning’s RoughnessCoefficient within the channel. The timber within the left overbank had thicker trunks thanthat of the channel, indicating that some brush and small trees within the channel may washout during a storm event. The right overbank covered straight and uniform ground with shortgrass and few weeds (0.03). Beneath the I-5 Bridge and connector bridges, the main channelwas modeled as uniform clean gravel (0.025). Downstream of I-5 and the connectors, themain channel passes through scattered brush (0.05), before entering another section of timberwith dense brush (0.12).

11 February 2010
CARMEL VALLEY CREEK LOCATION HYDRAULIC STUDY
Figure 10: Gravel, uniform section, clean Figure 11: Short grass
Figure 12: Scattered brush, heavy weeds Figure 13: Light brush and trees
Figure 14: Medium to dense brush Figure 15: Timber and dense brush
2.1.4 Starting Water Surface Elevation
The Carmel Valley Creek was originally analyzed under subcritical flow and was finalized asa mixed flow regime model based on model trial output (see section 2.3 Warning Messagesfor further discussion). The majority of the channel upstream of the northbound to eastboundSR-56 Connector Bridge would flow under a subcritical flow regime. Downstream of the I-5Bridge there would be a section of supercritical flow, followed by a hydraulic jump as theCarmel Valley Creek flow enters the wider and flatter terrain of Soledad Canyon. The
n = 0.025 n = 0.030
n = 0.050 n = 0.060
n = 0.100 n = 0.120
12 February 2010
CARMEL VALLEY CREEK LOCATION HYDRAULIC STUDY
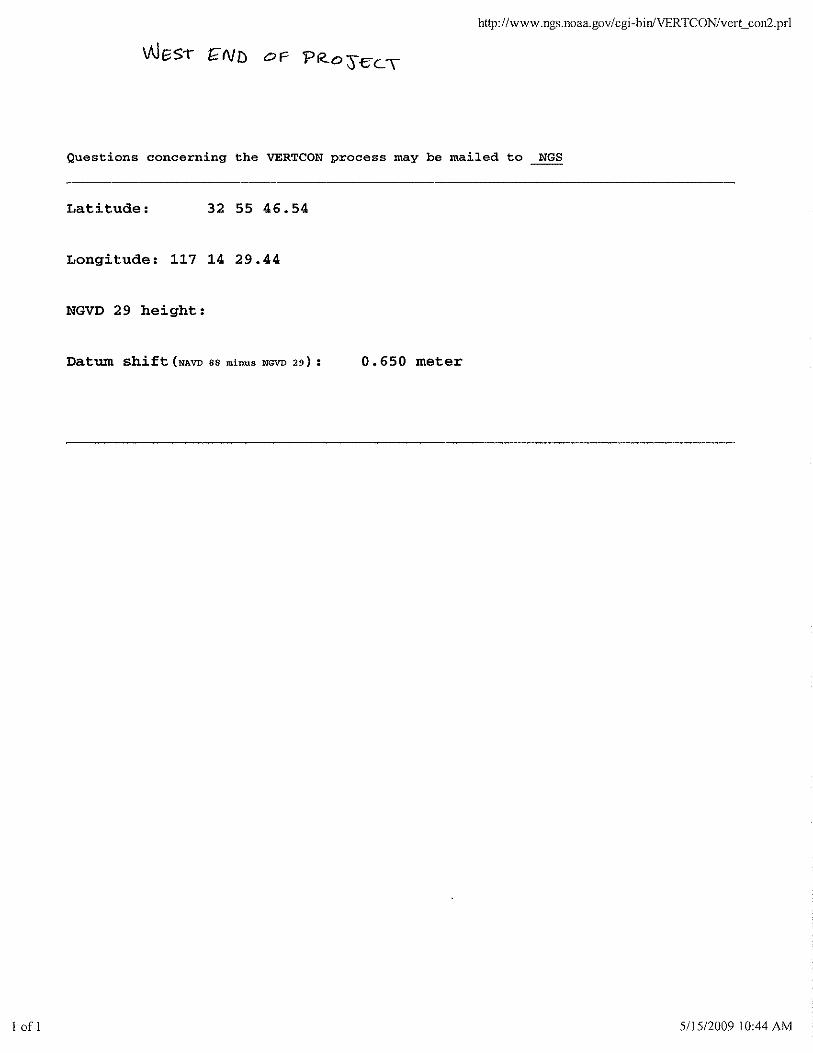
Carmel Valley Creek basin is located in a Zone AE, an area subject to inundation by the 1-percent-annual-chance flood event determined by detailed methods. Title 44 of the Code ofFederal Regulations, Part 65 – Identification and Mapping of Special Hazard Areas statesthat proposed floodplain models must tie into existing FEMA approved water surface profileswithin “one-half foot.” Since a detailed analysis has been performed by FEMA for theCarmel Valley Creek in the vicinity of the project, tie-in information upstream of the modelwas obtained from a FIRM Cross Section between W and X: water surface elevation of 27.16meters in NAVD 88. Downstream of the model, cross section 356 was placed perpendicularto the Soledad Canyon floodplain, between Soledad Canyon FEMA cross sections I and J.The water surface elevation at downstream cross section #356 was determined to be 4.37meters in NAVD 88 (See Flood Elevations table and VERTICON Conversion Output,Appendix A). Cross section 356 was placed at the confluence with Soledad Canyon wherethe base flood elevation has been determined.
2.1.5 Discharge
Two peak 100-year storm discharge values were identified for the floodplain study; one atSoledad Canyon, downstream of the I-5 bridges, and one at the confluence with Shaw ValleyCreek, near the beginning of the model but just downstream of Carmel Country Road bridge.
Above the tie-in with Shaw Valley Creek, 7,400 cfs (210 m3/s) was selected as the peak 100-year storm discharge, as identified in the Carmel Valley Creek Bridge Foundation Plan(dated 1999) provided in Appendix C. This flow was input at the most upstream crosssection (Cross Section #11503) of the model. This flow rate applies to each cross sectionupstream of #10541.
At the confluence with Soledad Canyon Creek, 10,000 cfs (283 m3/s) was selected as thepeak 100-year storm discharge, as identified in the Carmel Valley Creek Bridge ConnectorFoundation Plan (dated 1999) provided in Appendix C. Flow was increased to 283 m3/s atCross Section #10541 to account for the additional contribution from Shaw Valley Creek.This flow rate applies to Cross Section #10541 and each cross section downstream of#10541.
Discharge information obtained from the Federal Emergency Management Agency (FEMA)Flood Insurance Study, San Diego County: 9,800 cfs at Soledad Canyon and 6,300 cfs atShaw Valley Creek (dated 1997), was not used for this analysis due to the more recentinformation available.
2.2 HEC-RAS OutputThe water surface elevations which are displayed in the appendices and output of this study arebased on flooding that would occur during a 100-year storm. Appendix B contains watersurface elevations of each cross section, as well as other hydraulic results for comparison.Based on the cross sections, water surface elevations, and the exhibits in Appendix A, noincrease to the existing 100-year floodplain would occur from the proposed improvements tothe I-5/SR-56 Interchange. All proposed work, including structure piers, road widening, andgrading, is well above the modeled 100-yr flow, and therefore will have no impact on the watersurface elevations.

13 February 2010
CARMEL VALLEY CREEK LOCATION HYDRAULIC STUDY
2.3 Warning MessagesWarning messages encountered during the model include the following:Critical depth could not be determined within the specified number of iterations. The programused the iteration with the lowest energy, displayed at cross sections #11064, #11100. Thismessage is common at cross sections that include a levee or ineffective flow area, where theprogram tries to balance the energy equation both above and below the levee/ineffective flow area.The lowest energy selection is appropriate.
The velocity head has changed by more than 0.5 ft (0.15 m). This may indicate the need foradditional cross sections, displayed at cross sections #1045, #1400, #1442, #7465, #7703, #8979,#9169, #9475, #9584, #9696, #11064, #11191. This message is common at obstructions such asbridges, or expansions or contractions. Additional cross sections are not normally added.
The conveyance ratio (upstream conveyance divided by downstream conveyance) is less than 0.7or greater than 1.4. This may indicate the need for additional cross sections, displayed at crosssections #774, #1045, #1100, #1163, #1182, #1400, #1442, #1500, #1543, #1826, #2255, #2846,#3082, #4086, #4674, #5722, #5900, #5932, #6012, #7086, #7465, #7703, #8979, #9475, #9584,#10085, #10541, #10973, #11064, #11303. Portions of the Carmel Valley Creek were relativelyuniform and allowed for cross sections to be placed several hundred feet apart. These changes areappropriate based on the spacing of the sections.
The energy loss was greater than 1.0 ft (0.3 m) between the current and previous cross section.This may indicate the need for additional cross sections, displayed at cross sections #1045,#1400, #1826, #2255, #2846, #3082, #3100, #3531, #4086, #4421, #4674, #5229, #5722, #6449,#7086, #7305, #7465, #7703, #8244, #8575, #8815, #8979, #9169, #9475. This message isoccurring because of the changes and spacing of consecutive cross sections.
Divided flow computed for this cross section, displayed at cross sections #1045 and #10541. Thismessage was expected because cross section #10541 cuts through a small island within a largeplain, and localized flooding occurs on Carmel Valley Road at cross section #1045.
During the standard step iterations, when the assumed water surface was set equal to criticaldepth, the calculated water surface came back below critical depth. This indicates that there isnot a valid subcritical answer. The program defaulted to critical depth. This warning displayedat cross sections #1400, #9169. These situations occur at transition points (under a bridge orthrough a constriction point), where top width decreases and velocity increases, indicating that themodel goes between supercritical and subcritical. Critical depth is appropriate at these locations.
For the final momentum answer at the bridge, the upstream energy was computed lower thanthe downstream energy. This is not physically possible; the momentum answer has beendisregarded. This warning was displayed for cross section #1100. The Energy (standard step)method was used for this cross section.
The energy equation could not be balanced within the specified number of iterations. Theprogram used critical depth for the water surface and continued on with the calculations. Thiswarning was displayed for cross section #1400, #9169, #11100. In each situation, top widthdecreases and velocity increases due to flow under bridges or through constriction points,indicating that the model is transitioning between subcritical and supercritical. Critical depth isappropriate at these locations.

14 February 2010
CARMEL VALLEY CREEK LOCATION HYDRAULIC STUDY
3. Risk Assessment
Encroachment is defined by the Federal Emergency Management Agency (FEMA) as“construction, placement of fill, or similar alteration of topography in the floodplain that reducesthe area available to convey floodwaters,” and by the Federal Highway Administration (FHWA)as “an action within the base floodplain” (Environmental Handbook Vol. 1). As proven in thehydraulic analysis provided in Appendix B, upgrading the I-5/SR-56 interchange through any ofthe proposed alternatives would not prevent the Carmel Valley Creek from conveying the 100-yrstorm within the same limits as current conditions, both upstream and downstream of theproposed improvements. As shown in the cross section location exhibits in Appendix A, allproposed work for each alternative would be located well above the 100-year water surfaceelevation and therefore would have no impact to the flow.Natural and beneficial floodplain values, as defined in Chapter 17 “Definitions” in the CaltransStandard Environmental Reference (SER), include fish, wildlife, plants, outdoor recreation,aquaculture, forestry, etc., that are found within a designated floodplain. Listed below are thebeneficial uses of Carmel Valley Creek obtained from the Water Quality Control Plan for theSan Diego Basin along with a short description and determination of impacts.
• Agricultural supply. This includes uses of water for farming, horticulture, or ranching,including but not limited to, irrigation, stock watering, or support of vegetation for rangegrazing. These items will not be affected since the agricultural areas along CarmelValley Creek are considerably upstream of the project location.
• Industrial service supply. This includes uses of water for industrial activities that do notdepend primarily on water quality including, but not limited to, mining, cooling watersupply, hydraulic conveyance, gravel washing, fire protection, or oil well re-pressurization. These activities do not occur around the project site and therefore willremain unaffected.
• Non-contact water recreation. This includes the uses of water for recreational activitiesinvolving proximity to water, but not normally involving body contact with water, whereingestion of water is reasonably possible. These uses include, but are not limited to,picnicking, sunbathing, hiking, beachcombing, camping, boating, tide pool and marinelife study, hunting, sightseeing, or aesthetic enjoyment in conjunction with the aboveactivities. A golf course exists within the floodplain upstream of the Carmel CountryRoad bridge; however, the proposed conditions would not alter the amount of non-contact water recreation that may occur within the Carmel Valley Creek.
• Warm freshwater habitat. This includes uses of water that support warm waterecosystems including, but not limited to, preservation or enhancement of aquatic habitats,vegetation, fish or wildlife, including invertebrates. A Natural Environment Study (NES)has been prepared to support the I-5/SR-56 Interchange Project. The NES assessed thesensitive freshwater marsh species, and determined that the proposed project alternativesdo not impact the warm freshwater habitat to the south of SR-56.

15 February 2010
CARMEL VALLEY CREEK LOCATION HYDRAULIC STUDY
• Wildlife habitat. This includes uses of water that supports terrestrial ecosystemsincluding, but not limited to, preservation and enhancement of terrestrial habitats,vegetation, wildlife, or wildlife water and food sources. The construction areasassociated with the connector structures may impact a limited amount of wildlife habitat.An NES has been prepared to support the I-5/SR-56 Interchange Project. The NESassessed the wildlife habitat, and determined that the proposed project alternatives do notimpact the wildlife habitat as it relates to Carmel Valley Creek.
Since the effects of the proposed changes are localized at eastbound SR-56, far above the 100-yrfloodplain within the far right creek bank, the beneficial uses of Carmel Valley Creek wouldremain unchanged by the proposed I-5/SR-56 Interchange improvements. None of the proposedalternatives have significant affects to the floodplain or its beneficial uses.
4. Summary and Conclusions
The proposed I-5/SR-56 Interchange improvement alternatives would not add any piers or fills tothe floodplain or alter the topography within the 100-yr floodplain in any way. The functionalityof the interchange and freeways would be improved without causing water surface elevations torise, and without causing any greater risks to life or property within the floodplain.

16 February 2010
CARMEL VALLEY CREEK LOCATION HYDRAULIC STUDY
5. References
California Department of Transportation, Standard Environmental Handbook Vol. 1: Guidancefor Compliance, Chapter 17 – Floodplains, November 21, 2008.
County of San Diego, “Los Peñasquitos Watershed,” March 13, 2009,<http://www.projectcleanwater.org/html/ws_penasquitos.html>, accessed on June 8,2009.
David T. Barker, P.E., et al., “Water Quality Control Plan for the San Diego Basin,” CaliforniaRegional Water Quality Control Board, Chapter 2, San Diego, CA, September 8, 1994.
Dokken Engineering, “Interstate 5 North Coast Floodplain Studies,” Book 1 of 3, February 2008.
Federal Emergency Management Agency, Flood Insurance Rate Map: San Diego County,California and Incorporated Areas, Map Number 06073C1336 F, 06073C1328 F, and06073C1329 F (Carmel Valley Creek), June 19, 1997.
Federal Emergency Management Agency, Flood Insurance Study: San Diego County, Californiaand Incorporated Areas, July 2, 2002.
Federal Emergency Management Agency, Title 23: Highways, Part 650, April 1, 2002.
Federal Emergency Management Agency, Title 44: Emergency Management and Assistance,Part 60.3(b), October 1, 2002.
Gary Dyhouse, et al., Floodplain Modeling Using HEC-RAS, Haestad Press, Waterbury, CT,2003.
Gary W. Brunner, HEC-RAS River Analysis System User’s Manual, US Army Corps ofEngineers, Version 4.0, March 2008.
Joshua Corona-Bennett, “I-5/SR-56 Interchange Project: Natural Environment Study,” EDAWInc., San Diego, CA., April 2009.
National Geodetic Survey, <http://www.ngs.noaa.gov/cgi-bin/VERTCON/vert_con.prl>.

CARMEL VALLEY CREEK LOCATION HYDRAULIC STUDY
APPENDIX ‘A’
Floodplain Exhibits
Proposed Alternatives Exhibits
Direct Connector Alternative
Auxiliary Lane Alternative
Hybrid Alternative
Hybrid with Flyover Alternative
Flood Insurance Rate Map (FIRM)
Flood Insurance Study (FIS)
Flood Profiles
FIS - Soledad Canyon
VERTICON Conversion Output
Base Flood Elevation Table


CVC Cross Section
FEMA label Location DescriptionFEMA
BFE (ft)Base Flood
Elevation (m)
SOLEDAD CANYON Confluence with Soledad Canyon crosssections I & J 12.2 4.3686 Known downstream WSE
12.0 4.3076A West of I-5 bypass 12.3 4.3990
26.0 8.5748B West of I-5 Southbound 26.0 8.5748C East of I-5 Northbound 27.7 9.0930
28.0 9.1844D 27.8 9.1234E 27.9 9.1539
28.0 9.1844F 28.0 9.1844G Downstream of El Camino Real Bridge 28.3 9.2758
29.0 9.4892H Upstream of El Camino Real Bridge 29.1 9.5197
31.0 10.098833.0 10.7084
I 33.1 10.738936.0 11.6228
J 36.4 11.744739.0 12.537242.0 13.4516
K 44.9 14.335545.0 14.366047.0 14.9756
L Downstream of Carmel Creek Rd Bridge 47.7 15.189049.0 15.585251.0 16.1948
M Upstream of Carmel Creek Rd Bridge 51.1 16.2253N 52.8 16.7434
53.0 16.804455.0 17.4140
O 55.1 17.444558.0 18.328461.0 19.242863.0 19.8524
P 63.2 19.913466.0 20.766868.0 21.3764
Q 68.2 21.4374R 69.9 21.9555
70.0 21.986072.0 22.595674.0 23.2052
Base Flood Elevationsby cross section

CVC Cross Section
FEMA label Location DescriptionFEMA
BFE (ft)Base Flood
Elevation (m)
Base Flood Elevationsby cross section
S 74.3 23.296675.0 23.510077.0 24.1196
T 77.5 24.272079.0 24.7292
U 79.3 24.820681.0 25.3388
V Downstream of Carmel Country Rd Bridge 82.5 25.796083.0 25.948484.0 26.2532
W 84.6 26.436186.0 26.862887.0 27.1676 Known upstream WSE
X 87.9 27.4419
NOTE:Base Flood Elevations are calculated by converting the FEMA data from English to Metric and adding 0.650 m toaccount for the datum shift at this location from NGVD29 to NAVD 88. See VERTICON Conversion Output.
CARMEL VALLEY CREEK LOCATION HYDRAULIC STUDY
APPENDIX ‘B’
Results Summary
HEC-RAS Cross Section Input/Output

Existing Conditions Model
Carmel Valley Creek

HEC-RAS Plan: Plan 02 River: CV Creek Reach: Lower Profile: 100-yearReach River Sta Profile Q Total Min Ch El W.S. Elev Crit W.S. E.G. Elev E.G. Slope Vel Chnl Flow Area Top Width Froude # Chl
(m3/s) (m) (m) (m) (m) (m/m) (m/s) (m2) (m)Lower 11503 100-year 209.55 25.15 27.36 26.77 27.67 0.002276 2.48 88.88 56.72 0.57Lower 11303 100-year 209.55 24.99 27.26 27.52 0.002137 2.27 92.27 50.94 0.54Lower 11191 100-year 209.55 24.69 27.08 26.42 27.40 0.005393 2.35 85.30 44.61 0.52Lower 11100 BridgeLower 11064 100-year 209.55 24.82 26.27 26.58 27.40 0.045571 4.72 44.61 41.92 1.39Lower 10973 100-year 209.55 24.77 26.86 25.84 26.97 0.008699 1.46 143.17 126.77 0.33Lower 10743 100-year 209.55 24.03 26.65 26.68 0.002093 0.70 299.11 210.86 0.14Lower 10541 100-year 283.17 23.72 26.53 26.56 0.001901 0.68 414.55 278.41 0.14Lower 10285 100-year 283.17 23.56 26.46 26.47 0.000618 0.48 586.99 231.88 0.09Lower 10085 100-year 283.17 23.10 26.42 26.43 0.000691 0.46 608.01 216.23 0.08Lower 9696 100-year 283.17 22.63 26.23 26.29 0.002287 1.09 259.77 167.51 0.19Lower 9584 100-year 283.17 22.32 25.92 26.18 0.003582 2.25 129.11 106.28 0.39Lower 9475 100-year 283.17 22.16 25.55 25.99 0.007814 2.95 96.42 61.13 0.56Lower 9169 100-year 283.17 21.54 23.68 23.68 24.65 0.030699 4.35 65.03 33.77 1.00Lower 8979 100-year 283.17 19.71 22.30 21.62 22.67 0.024765 2.68 105.99 51.19 0.57Lower 8815 100-year 283.17 19.07 21.96 22.06 0.005806 1.39 202.89 87.82 0.28Lower 8575 100-year 283.17 18.89 21.59 21.67 0.004811 1.22 231.69 100.22 0.25Lower 8244 100-year 283.17 18.14 21.04 21.14 0.005755 1.37 206.11 84.37 0.28Lower 7878 100-year 283.17 17.83 20.48 20.56 0.004581 1.27 221.94 94.01 0.25Lower 7703 100-year 283.17 17.34 20.19 20.29 0.005395 1.40 201.95 81.70 0.27Lower 7465 100-year 283.17 16.87 19.08 19.46 0.034229 2.75 102.87 56.52 0.65Lower 7305 100-year 283.17 14.81 18.62 18.78 0.006504 1.79 158.20 53.79 0.31Lower 7086 100-year 283.17 15.02 18.20 18.36 0.006250 1.62 170.15 66.24 0.30Lower 6663 100-year 283.17 14.00 17.88 17.92 0.001851 0.80 342.12 107.75 0.14Lower 6449 100-year 283.17 14.00 17.72 17.77 0.002940 1.01 280.26 89.10 0.18Lower 6012 100-year 283.17 13.70 17.17 17.25 0.005242 1.25 228.11 83.96 0.23Lower 5932 100-year 283.17 13.79 16.88 15.51 17.05 0.012265 1.81 154.72 66.53 0.35Lower 5900 BridgeLower 5788 100-year 283.17 13.52 16.30 16.53 0.013512 2.09 136.11 58.52 0.43Lower 5722 100-year 283.17 13.20 16.05 16.25 0.013113 2.00 141.82 60.81 0.42Lower 5229 100-year 283.17 11.48 14.94 15.05 0.005164 1.48 192.13 67.75 0.27Lower 4674 100-year 283.17 10.68 14.06 14.14 0.005533 1.25 227.42 81.67 0.23Lower 4421 100-year 283.17 10.48 13.32 13.48 0.014220 1.80 157.24 66.59 0.37Lower 4086 100-year 283.17 9.52 11.87 12.04 0.014094 1.78 159.02 86.04 0.42Lower 3531 100-year 283.17 8.00 10.36 10.45 0.006541 1.31 216.27 105.84 0.29Lower 3254 100-year 283.17 7.32 9.90 8.39 9.97 0.004886 1.19 237.87 182.15 0.25Lower 3100 BridgeLower 3082 100-year 283.17 6.77 9.37 9.47 0.007613 1.39 203.21 100.24 0.31Lower 2846 100-year 283.17 6.71 9.06 9.10 0.003415 0.94 300.22 145.87 0.21Lower 2255 100-year 283.17 6.45 8.11 8.18 0.008598 1.17 242.99 172.09 0.31Lower 1826 100-year 283.17 5.49 7.60 7.62 0.002407 0.75 380.04 212.31 0.17Lower 1543 100-year 283.17 4.88 7.22 6.03 7.28 0.007546 1.14 249.26 143.18 0.26Lower 1500 BridgeLower 1442 100-year 283.17 4.88 6.78 5.67 6.85 0.000360 1.15 246.86 130.21 0.27Lower 1400 BridgeLower 1197 100-year 283.17 3.66 5.55 5.63 0.000421 1.23 230.07 123.74 0.29Lower 1182 100-year 283.17 3.66 5.57 4.37 5.62 0.000264 0.98 288.81 154.34 0.23Lower 1163 BridgeLower 1143 100-year 283.17 3.66 5.55 4.37 5.60 0.000267 0.98 287.79 154.10 0.23Lower 1100 BridgeLower 1045 100-year 283.17 3.86 5.19 5.12 5.48 0.020649 2.37 119.32 226.51 0.87Lower 774 100-year 283.17 3.13 4.44 4.53 0.006531 1.37 207.31 398.99 0.49Lower 356 100-year 283.17 2.23 4.37 3.34 4.38 0.000395 0.47 606.32 475.68 0.13

050
010
0015
0020
0025
0030
0035
0005101520253035
Exi
stin
gC
ondi
tions
Pla
n:P
lan
028/
3/20
098:
54:1
6A
MG
eom
:CV
_Exi
stin
g
Flow
:Car
mel
Val
ley
Flow
Mai
nC
hann
elD
ista
nce
(m)
Elevation(m)
Legend
EG
100-
year
WS
100-
year
Crit
100-
year
Gro
und
CV
Cre
ekLo
wer

2040
6080
100
120
140
160
180
200
2526272829
Exis
ting
Con
ditio
ns
P
lan:
Pla
n 02
8
/3/2
009
8:5
4:16
AM
Geo
m:C
V_E
xist
ing
Fl
ow:C
arm
elV
alle
y Fl
owR
iver
=C
VC
reek
Rea
ch=
Low
erR
S=
1150
3(3
0)
Sta
tion
(m)
Elevation(m)
Legend
EG
100-
year
WS
100-
year
Crit
100-
year
Gro
und
Ban
kS
ta
.03
.03
. 0 3
050
100
150
200
250
242526272829
Exis
ting
Con
ditio
ns
P
lan:
Pla
n 02
8
/3/2
009
8:5
4:16
AM
Geo
m:C
V_E
xist
ing
Fl
ow:C
arm
elV
alle
y Fl
owR
iver
=C
VC
reek
Rea
ch=
Low
erR
S=
1130
3(2
9)
Sta
tion
(m)
Elevation(m)
Legend
EG
100-
year
WS
100-
year
Gro
und
Ban
kS
ta
.03
.03
. 0 3
050
100
150
200
250
242526272829303132
Exis
ting
Con
ditio
ns
P
lan:
Pla
n 02
8
/3/2
009
8:5
4:16
AM
Geo
m:C
V_E
xist
ing
Fl
ow:C
arm
elV
alle
y Fl
owR
iver
=C
VC
reek
Rea
ch=
Low
erR
S=
1119
1(2
8)
Sta
tion
(m)
Elevation(m)
Legend
EG
100-
year
WS
100-
year
Crit
100-
year
Gro
und
Ban
kS
ta
.03
.05
. 0 5
050
100
150
200
250
242628303234
Exis
ting
Con
ditio
ns
P
lan:
Pla
n 02
8
/3/2
009
8:5
4:16
AM
Geo
m:C
V_E
xist
ing
Flow
:Car
mel
Val
ley
Flow
Riv
er=
CV
Cre
ekR
each
=Lo
wer
RS
=11
100
BR
Car
mel
Cou
ntry
Rd
Brid
ge
Sta
tion
(m)
Elevation(m)
Legend
EG
100-
year
WS
100-
year
Crit
100-
year
Gro
und
Ban
kS
ta
.03
.025
. 0 5

050
100
150
200
250
24252627282930313233
Exis
ting
Con
ditio
ns
P
lan:
Pla
n 02
8
/3/2
009
8:5
4:16
AM
Geo
m:C
V_E
xist
ing
Flow
:Car
mel
Val
ley
Flow
Riv
er=
CV
Cre
ekR
each
=Lo
wer
RS
=11
100
BR
Car
mel
Cou
ntry
Rd
Brid
ge
Sta
tion
(m)
Elevation(m)
Legend
EG
100-
year
WS
100-
year
Crit
100-
year
Gro
und
Inef
f
Ban
kS
ta
.03
.025
. 0 5
050
100
150
200
250
24252627282930313233
Exis
ting
Con
ditio
ns
P
lan:
Pla
n 02
8
/3/2
009
8:5
4:16
AM
Geo
m:C
V_E
xist
ing
Fl
ow:C
arm
elV
alle
y Fl
owR
iver
=C
VC
reek
Rea
ch=
Low
erR
S=
1106
4(2
7)
Sta
tion
(m)
Elevation(m)
Legend
EG
100-
year
Crit
100-
year
WS
100-
year
Gro
und
Inef
f
Ban
kS
ta
.03
.05
. 0 5
050
100
150
200
250
24252627282930
Exis
ting
Con
ditio
ns
P
lan:
Pla
n 02
8
/3/2
009
8:5
4:16
AM
Geo
m:C
V_E
xist
ing
Fl
ow:C
arm
elV
alle
y Fl
owR
iver
=C
VC
reek
Rea
ch=
Low
erR
S=
1097
3(2
6)
Sta
tion
(m)
Elevation(m)
Legend
EG
100-
year
WS
100-
year
Crit
100-
year
Gro
und
Inef
f
Ban
kS
ta
.03
.1. 0 5
050
100
150
200
250
300
2425262728
Exis
ting
Con
ditio
ns
P
lan:
Pla
n 02
8
/3/2
009
8:5
4:16
AM
Geo
m:C
V_E
xist
ing
Fl
ow:C
arm
elV
alle
y Fl
owR
iver
=C
VC
reek
Rea
ch=
Low
erR
S=
1074
3(2
5)
Sta
tion
(m)
Elevation(m)
Legend
EG
100-
year
WS
100-
year
Gro
und
Inef
f
Ban
kS
ta
.03
.12
. 0 5

050
100
150
200
250
300
350
232425262728
Exis
ting
Con
ditio
ns
P
lan:
Pla
n 02
8
/3/2
009
8:5
4:16
AM
Geo
m:C
V_E
xist
ing
Fl
ow:C
arm
elV
alle
y Fl
owR
iver
=C
VC
reek
Rea
ch=
Low
erR
S=
1054
1(2
4)
Sta
tion
(m)
Elevation(m)
Legend
EG
100-
year
WS
100-
year
Gro
und
Inef
f
Ban
kS
ta
. 0 3
.06
.12
. 0 5
050
100
150
200
250
232425262728
Exis
ting
Con
ditio
ns
P
lan:
Pla
n 02
8
/3/2
009
8:5
4:16
AM
Geo
m:C
V_E
xist
ing
Fl
ow:C
arm
elV
alle
y Fl
owR
iver
=C
VC
reek
Rea
ch=
Low
erR
S=
1028
5(2
3)
Sta
tion
(m)
Elevation(m)
Legend
EG
100-
year
WS
100-
year
Gro
und
Inef
f
Ban
kS
ta
.05
.1. 0 5
050
100
150
200
250
232425262728
Exis
ting
Con
ditio
ns
P
lan:
Pla
n 02
8
/3/2
009
8:5
4:16
AM
Geo
m:C
V_E
xist
ing
Fl
ow:C
arm
elV
alle
y Fl
owR
iver
=C
VC
reek
Rea
ch=
Low
erR
S=
1008
5(2
2)
Sta
tion
(m)
Elevation(m)
Legend
EG
100-
year
WS
100-
year
Gro
und
Ban
kS
ta
.05
.12
. 0 5
020
4060
8010
012
014
016
018
0222324252627
Exis
ting
Con
ditio
ns
P
lan:
Pla
n 02
8
/3/2
009
8:5
4:16
AM
Geo
m:C
V_E
xist
ing
Fl
ow:C
arm
elV
alle
y Fl
owR
iver
=C
VC
reek
Rea
ch=
Low
erR
S=
9696
(21)
Sta
tion
(m)
Elevation(m)
Legend
EG
100-
year
WS
100-
year
Gro
und
Inef
f
Ban
kS
ta
.03
.1. 0 5

020
4060
8010
012
014
016
022232425262728
Exis
ting
Con
ditio
ns
P
lan:
Pla
n 02
8
/3/2
009
8:5
4:16
AM
Geo
m:C
V_E
xist
ing
Fl
ow:C
arm
elV
alle
y Fl
owR
iver
=C
VC
reek
Rea
ch=
Low
erR
S=
9584
(20)
Sta
tion
(m)
Elevation(m)
Legend
EG
100-
year
WS
100-
year
Gro
und
Inef
f
Ban
kS
ta
.03
.06
. 0 5
020
4060
8010
022232425262728
Exis
ting
Con
ditio
ns
P
lan:
Pla
n 02
8
/3/2
009
8:5
4:16
AM
Geo
m:C
V_E
xist
ing
Fl
ow:C
arm
elV
alle
y Fl
owR
iver
=C
VC
reek
Rea
ch=
Low
erR
S=
9475
(19)
Sta
tion
(m)
Elevation(m)
Legend
EG
100-
year
WS
100-
year
Gro
und
Inef
f
Ban
kS
ta
.03
.06
. 0 3
010
2030
4050
212223242526
Exis
ting
Con
ditio
ns
P
lan:
Pla
n 02
8
/3/2
009
8:5
4:16
AM
Geo
m:C
V_E
xist
ing
Fl
ow:C
arm
elV
alle
y Fl
owR
iver
=C
VC
reek
Rea
ch=
Low
erR
S=
9169
(18)
Sta
tion
(m)
Elevation(m)
Legend
EG
100-
year
WS
100-
year
Crit
100-
year
Gro
und
Ban
kS
ta
.03
.06
. 0 3
010
2030
4050
6070
801920212223242526
Exis
ting
Con
ditio
ns
P
lan:
Pla
n 02
8
/3/2
009
8:5
4:16
AM
Geo
m:C
V_E
xist
ing
Fl
ow:C
arm
elV
alle
y Fl
owR
iver
=C
VC
reek
Rea
ch=
Low
erR
S=
8979
(17)
Sta
tion
(m)
Elevation(m)
Legend
EG
100-
year
WS
100-
year
Crit
100-
year
Gro
und
Ban
kS
ta
.05
.1.0
3

020
4060
8010
012
01920212223242526
Exis
ting
Con
ditio
ns
P
lan:
Pla
n 02
8
/3/2
009
8:5
4:16
AM
Geo
m:C
V_E
xist
ing
Fl
ow:C
arm
elV
alle
y Fl
owR
iver
=C
VC
reek
Rea
ch=
Low
erR
S=
8815
(16)
Sta
tion
(m)
Elevation(m)
Legend
EG
100-
year
WS
100-
year
Gro
und
Ban
kS
ta
.05
.1.0
3
020
4060
8010
012
01819202122232425
Exis
ting
Con
ditio
ns
P
lan:
Pla
n 02
8
/3/2
009
8:5
4:16
AM
Geo
m:C
V_E
xist
ing
Fl
ow:C
arm
elV
alle
y Fl
owR
iver
=C
VC
reek
Rea
ch=
Low
erR
S=
8575
(15)
Sta
tion
(m)
Elevation(m)
Legend
EG
100-
year
WS
100-
year
Gro
und
Ban
kS
ta
.05
.1. 0 3
020
4060
8010
012
018192021222324
Exis
ting
Con
ditio
ns
P
lan:
Pla
n 02
8
/3/2
009
8:5
4:16
AM
Geo
m:C
V_E
xist
ing
Fl
ow:C
arm
elV
alle
y Fl
owR
iver
=C
VC
reek
Rea
ch=
Low
erR
S=
8244
(14)
Sta
tion
(m)
Elevation(m)
Legend
EG
100-
year
WS
100-
year
Gro
und
Ban
kS
ta
.05
.1. 0 3
020
4060
8010
012
01718192021222324
Exis
ting
Con
ditio
ns
P
lan:
Pla
n 02
8
/3/2
009
8:5
4:16
AM
Geo
m:C
V_E
xist
ing
Fl
ow:C
arm
elV
alle
y Fl
owR
iver
=C
VC
reek
Rea
ch=
Low
erR
S=
7878
(13)
Sta
tion
(m)
Elevation(m)
Legend
EG
100-
year
WS
100-
year
Gro
und
Ban
kS
ta
.05
.1.0
3

020
4060
8010
01718192021222324
Exis
ting
Con
ditio
ns
P
lan:
Pla
n 02
8
/3/2
009
8:5
4:16
AM
Geo
m:C
V_E
xist
ing
Fl
ow:C
arm
elV
alle
y Fl
owR
iver
=C
VC
reek
Rea
ch=
Low
erR
S=
7703
(12)
Sta
tion
(m)
Elevation(m)
Legend
EG
100-
year
WS
100-
year
Gro
und
Ban
kS
ta
.05
.1. 0 3
010
2030
4050
6070
8016171819202122
Exis
ting
Con
ditio
ns
P
lan:
Pla
n 02
8
/3/2
009
8:5
4:16
AM
Geo
m:C
V_E
xist
ing
Fl
ow:C
arm
elV
alle
y Fl
owR
iver
=C
VC
reek
Rea
ch=
Low
erR
S=
7465
(11)
Sta
tion
(m)
Elevation(m)
Legend
EG
100-
year
WS
100-
year
Gro
und
Ban
kS
ta
.05
.1.0
3
010
2030
4050
6070
8014151617181920212223
Exis
ting
Con
ditio
ns
P
lan:
Pla
n 02
8
/3/2
009
8:5
4:16
AM
Geo
m:C
V_E
xist
ing
Fl
ow:C
arm
elV
alle
y Fl
owR
iver
=C
VC
reek
Rea
ch=
Low
erR
S=
7305
(10)
Sta
tion
(m)
Elevation(m)
Legend
EG
100-
year
WS
100-
year
Gro
und
Ban
kS
ta
.05
.1.0
3
020
4060
8010
015161718192021
Exis
ting
Con
ditio
ns
P
lan:
Pla
n 02
8
/3/2
009
8:5
4:16
AM
Geo
m:C
V_E
xist
ing
Fl
ow:C
arm
elV
alle
y Fl
owR
iver
=C
VC
reek
Rea
ch=
Low
erR
S=
7086
(9)
Sta
tion
(m)
Elevation(m)
Legend
EG
100-
year
WS
100-
year
Gro
und
Ban
kS
ta
.05
.1.0
3

020
4060
8010
012
014151617181920
Exis
ting
Con
ditio
ns
P
lan:
Pla
n 02
8
/3/2
009
8:5
4:16
AM
Geo
m:C
V_E
xist
ing
Fl
ow:C
arm
elV
alle
y Fl
owR
iver
=C
VC
reek
Rea
ch=
Low
erR
S=
6663
(8)
Sta
tion
(m)
Elevation(m)
Legend
EG
100-
year
WS
100-
year
Gro
und
Ban
kS
ta
.05
.12
. 0 3
020
4060
8010
0141516171819
Exis
ting
Con
ditio
ns
P
lan:
Pla
n 02
8
/3/2
009
8:5
4:16
AM
Geo
m:C
V_E
xist
ing
Fl
ow:C
arm
elV
alle
y Fl
owR
iver
=C
VC
reek
Rea
ch=
Low
erR
S=
6449
(7)
Sta
tion
(m)
Elevation(m)
Legend
EG
100-
year
WS
100-
year
Gro
und
Ban
kS
ta
.05
.12
. 0 3
020
4060
8010
012
0121416182022242628
Exis
ting
Con
ditio
ns
P
lan:
Pla
n 02
8
/3/2
009
8:5
4:16
AM
Geo
m: C
V_E
xist
ing
Flow
: Car
mel
Val
ley
Flow
Riv
er=
CV
Cre
ek
Rea
ch=
Low
er
R
S=
6012
(6) U
pstre
amof
Car
mel
Cre
ek R
dbr
idge
Sta
tion
(m)
Elevation(m)
Legend
EG
100-
year
WS
100-
year
Gro
und
Ban
kS
ta
.03
.12
.05
020
4060
8010
012141618202224262830
Exis
ting
Con
ditio
ns
P
lan:
Pla
n 02
8
/3/2
009
8:5
4:16
AM
Geo
m: C
V_E
xist
ing
Flow
: Car
mel
Val
ley
Flow
Riv
er=
CV
Cre
ek
Rea
ch=
Low
er
R
S=
5932
(5)E
ast f
ace
of C
arm
el C
reek
Rd
brid
ge
Sta
tion
(m)
Elevation(m)
Legend
EG
100-
year
WS
100-
year
Crit
100-
year
Gro
und
Ban
kS
ta
.03
.12
.05

020
4060
8010
0101520253035
Exis
ting
Con
ditio
ns
P
lan:
Pla
n 02
8
/3/2
009
8:5
4:16
AM
Geo
m:C
V_E
xist
ing
Flow
:Car
mel
Val
ley
Flow
Riv
er=
CV
Cre
ekR
each
=Lo
wer
RS
=59
00B
RC
arm
elC
reek
Rd
Brid
ge
Sta
tion
(m)
Elevation(m)
Legend
EG
100-
year
WS
100-
year
Crit
100-
year
Gro
und
Ban
kS
ta
.03
.05
.05
020
4060
8010
0101520253035
Exis
ting
Con
ditio
ns
P
lan:
Pla
n 02
8
/3/2
009
8:5
4:16
AM
Geo
m:C
V_E
xist
ing
Flow
:Car
mel
Val
ley
Flow
Riv
er=
CV
Cre
ekR
each
=Lo
wer
RS
=59
00B
RC
arm
elC
reek
Rd
Brid
ge
Sta
tion
(m)
Elevation(m)
Legend
EG
100-
year
WS
100-
year
Crit
100-
year
Gro
und
Ban
kS
ta
.12
.05
.05
020
4060
8010
012141618202224262830
Exis
ting
Con
ditio
ns
P
lan:
Pla
n 02
8
/3/2
009
8:5
4:16
AM
Geo
m: C
V_E
xist
ing
Flow
: Car
mel
Val
ley
Flow
Riv
er=
CV
Cre
ek
Rea
ch=
Low
er
R
S=
5788
(4)W
est f
ace
of C
arm
el C
reek
Rd
brid
ge
Sta
tion
(m)
Elevation(m)
Legend
EG
100-
year
WS
100-
year
Gro
und
Ban
kS
ta
.12
.1.0
5
020
4060
8010
012
0121416182022242628
Exis
ting
Con
ditio
ns
P
lan:
Pla
n 02
8
/3/2
009
8:5
4:16
AM
Geo
m: C
V_E
xist
ing
Flow
: Car
mel
Val
ley
Flow
Riv
er=
CV
Cre
ek
Rea
ch=
Low
er
R
S=
5722
(3) D
owns
tream
of C
arm
el C
reek
Rd
brid
ge
Sta
tion
(m)
Elevation(m)
Legend
EG
100-
year
WS
100-
year
Gro
und
Ban
kS
ta
.12
.1.0
5

020
4060
8010
012
014
016
018
0111213141516171819
Exis
ting
Con
ditio
ns
P
lan:
Pla
n 02
8
/3/2
009
8:5
4:16
AM
Geo
m:C
V_E
xist
ing
Fl
ow:C
arm
elV
alle
y Fl
owR
iver
=C
VC
reek
Rea
ch=
Low
erR
S=
5229
(2)
Sta
tion
(m)
Elevation(m)
Legend
EG
100-
year
WS
100-
year
Gro
und
Ban
kS
ta
. 1 2
.1.0
3
020
4060
8010
012
014
016
018
01011121314151617
Exis
ting
Con
ditio
ns
P
lan:
Pla
n 02
8
/3/2
009
8:5
4:16
AM
Geo
m: C
V_Ex
istin
gFl
ow: C
arm
elVa
lley
Flow
Riv
er =
CV
Cre
ek
Rea
ch =
Low
er
R
S =
4674
(1)F
irstc
utup
stre
amof
J
Sta
tion
(m)
Elevation(m)
Legend
EG
100-
year
WS
100-
year
Gro
und
Ban
kS
ta
. 0 6
.12
.03
020
4060
8010
012
014
016
018
0101112131415161718
Exis
ting
Con
ditio
ns
P
lan:
Pla
n 02
8
/3/2
009
8:5
4:16
AM
Geo
m:C
V_E
xist
ing
Fl
ow:C
arm
elV
alle
y Fl
owR
iver
=C
VC
reek
Rea
ch=
Low
erR
S=
4421
J
Sta
tion
(m)
Elevation(m)
Legend
EG
100-
year
WS
100-
year
Gro
und
Ban
kS
ta
.05
.12
.03
050
100
150
200
250
81012141618
Exis
ting
Con
ditio
ns
P
lan:
Pla
n 02
8
/3/2
009
8:5
4:16
AM
Geo
m:C
V_E
xist
ing
Fl
ow:C
arm
elV
alle
y Fl
owR
iver
=C
VC
reek
Rea
ch=
Low
erR
S=
4086
I
Sta
tion
(m)
Elevation(m)
Legend
EG
100-
year
WS
100-
year
Gro
und
Ban
kS
ta
.12
.1.0
3

050
100
150
200
250
300
350
8101214161820
Exis
ting
Con
ditio
ns
P
lan:
Pla
n 02
8
/3/2
009
8:5
4:16
AM
Geo
m:C
V_E
xist
ing
Fl
ow:C
arm
elV
alle
y Fl
owR
iver
=C
VC
reek
Rea
ch=
Low
erR
S=
3531
H
Sta
tion
(m)
Elevation(m)
Legend
EG
100-
year
WS
100-
year
Gro
und
Inef
f
Ban
kS
ta
.03
.1.0
3
010
020
030
040
050
06810121416182022
Exis
ting
Con
ditio
ns
P
lan:
Pla
n 02
8
/3/2
009
8:5
4:16
AM
Geo
m:C
V_E
xist
ing
Fl
ow:C
arm
elV
alle
y Fl
owR
iver
=C
VC
reek
Rea
ch=
Low
erR
S=
3254
Sta
tion
(m)
Elevation(m)
Legend
EG
100-
year
WS
100-
year
Crit
100-
year
Gro
und
Inef
f
Ban
kS
ta
.12
.1.0
3
010
020
030
040
050
06810121416182022
Exis
ting
Con
ditio
ns
P
lan:
Pla
n 02
8
/3/2
009
8:5
4:16
AM
Geo
m: C
V_Ex
istin
gFl
ow: C
arm
elVa
lley
Flow
Riv
er =
CV
Cre
ek
Rea
ch =
Low
er
R
S =
3100
BREl
Cam
ino
Rea
lBrid
ge
Sta
tion
(m)
Elevation(m)
Legend
EG
100-
year
WS
100-
year
Crit
100-
year
Gro
und
Ban
kS
ta
.05
.1.0
3

010
020
030
040
050
06810121416182022
Exis
ting
Con
ditio
ns
P
lan:
Pla
n 02
8
/3/2
009
8:5
4:16
AM
Geo
m:C
V_E
xist
ing
Fl
ow:C
arm
elV
alle
y Fl
owR
iver
=C
VC
reek
Rea
ch=
Low
erR
S=
3082
Sta
tion
(m)
Elevation(m)
Legend
EG
100-
year
WS
100-
year
Gro
und
Ban
kS
ta
.05
.1.0
3
010
020
030
040
050
0510152025
Exis
ting
Con
ditio
ns
P
lan:
Pla
n 02
8
/3/2
009
8:5
4:16
AM
Geo
m:C
V_E
xist
ing
Fl
ow:C
arm
elV
alle
y Fl
owR
iver
=C
VC
reek
Rea
ch=
Low
erR
S=
2846
G
Sta
tion
(m)
Elevation(m)
Legend
EG
100-
year
WS
100-
year
Gro
und
Inef
f
Ban
kS
ta
.05
.1.0
3
050
100
150
200
250
300
350
400
67891011121314
Exis
ting
Con
ditio
ns
P
lan:
Pla
n 02
8
/3/2
009
8:5
4:16
AM
Geo
m:C
V_E
xist
ing
Fl
ow:C
arm
elV
alle
y Fl
owR
iver
=C
VC
reek
Rea
ch=
Low
erR
S=
2255
F
Sta
tion
(m)
Elevation(m)
Legend
EG
100-
year
WS
100-
year
Gro
und
Inef
f
Ban
kS
ta
. 1 2
.1.0
3
010
020
030
040
050
0468101214161820
Exis
ting
Con
ditio
ns
P
lan:
Pla
n 02
8
/3/2
009
8:5
4:16
AM
Geo
m:C
V_E
xist
ing
Fl
ow:C
arm
elV
alle
y Fl
owR
iver
=C
VC
reek
Rea
ch=
Low
erR
S=
1826
E
Sta
tion
(m)
Elevation(m)
Legend
EG
100-
year
WS
100-
year
Gro
und
Inef
f
Ban
kS
ta
.12
.1.0
3

010
020
030
040
050
060
0468101214161820
Exis
ting
Con
ditio
ns
P
lan:
Pla
n 02
8
/3/2
009
8:5
4:16
AM
Geo
m:C
V_E
xist
ing
Fl
ow:C
arm
elV
alle
y Fl
owR
iver
=C
VC
reek
Rea
ch=
Low
erR
S=
1543
D
Sta
tion
(m)
Elevation(m)
Legend
EG
100-
year
WS
100-
year
Crit
100-
year
Gro
und
Inef
f
Ban
kS
ta
.05
.12
.03
010
020
030
040
050
060
0468101214161820
Exis
ting
Con
ditio
ns
P
lan:
Pla
n 02
8
/3/2
009
8:5
4:16
AM
Geo
m: C
V_E
xist
ing
Fl
ow: C
arm
elVa
lley
Flow
Riv
er=
CV
Cre
ek
Rea
ch=
Low
er
R
S=
1500
BR
SR
-56
Con
nect
orea
stof
I-5
Sta
tion
(m)
Elevation(m)
Legend
EG
100-
year
WS
100-
year
Crit
100-
year
Gro
und
Inef
f
Ban
kS
ta
.05
.12
.03
010
020
030
040
050
060
070
0468101214161820
Exis
ting
Con
ditio
ns
P
lan:
Pla
n 02
8
/3/2
009
8:5
4:16
AM
Geo
m: C
V_E
xist
ing
Fl
ow: C
arm
elVa
lley
Flow
Riv
er=
CV
Cre
ek
Rea
ch=
Low
er
R
S=
1500
BR
SR
-56
Con
nect
orea
stof
I-5
Sta
tion
(m)
Elevation(m)
Legend
EG
100-
year
WS
100-
year
Crit
100-
year
Gro
und
Inef
f
Ban
kS
ta
.035
.025
.03
010
020
030
040
050
060
070
0468101214161820
Exis
ting
Con
ditio
ns
P
lan:
Pla
n 02
8
/3/2
009
8:5
4:16
AM
Geo
m:C
V_E
xist
ing
Fl
ow:C
arm
elV
alle
y Fl
owR
iver
=C
VC
reek
Rea
ch=
Low
erR
S=
1442
C
Sta
tion
(m)
Elevation(m)
Legend
EG
100-
year
WS
100-
year
Crit
100-
year
Gro
und
Inef
f
Ban
kS
ta
.035
.025
.03

010
020
030
040
050
060
070
0468101214161820
Exis
ting
Con
ditio
ns
P
lan:
Pla
n 02
8
/3/2
009
8:5
4:16
AM
Geo
m:C
V_E
xist
ing
Fl
ow:C
arm
elV
alle
y Fl
owR
iver
=C
VC
reek
Rea
ch=
Low
erR
S=
1400
BR
I-
5B
ridge
Sta
tion
(m)
Elevation(m)
Legend
EG
100-
year
WS
100-
year
Crit
100-
year
Gro
und
Inef
f
Ban
kS
ta
.035
.025
.03
010
020
030
040
050
060
070
0246810121416
Exis
ting
Con
ditio
ns
P
lan:
Pla
n 02
8
/3/2
009
8:5
4:16
AM
Geo
m:C
V_E
xist
ing
Fl
ow:C
arm
elV
alle
y Fl
owR
iver
=C
VC
reek
Rea
ch=
Low
erR
S=
1400
BR
I-
5B
ridge
Sta
tion
(m)
Elevation(m)
Legend
EG
100-
year
WS
100-
year
Crit
100-
year
Gro
und
Ban
kS
ta
.035
.025
.03
010
020
030
040
050
060
070
02468101214
Exis
ting
Con
ditio
ns
P
lan:
Pla
n 02
8
/3/2
009
8:5
4:16
AM
Geo
m:C
V_E
xist
ing
Fl
ow:C
arm
elV
alle
y Fl
owR
iver
=C
VC
reek
Rea
ch=
Low
erR
S=
1197
Sta
tion
(m)
Elevation(m)
Legend
EG
100-
year
WS
100-
year
Gro
und
Ban
kS
ta
.035
.025
.03
010
020
030
040
050
060
070
02468101214
Exis
ting
Con
ditio
ns
P
lan:
Pla
n 02
8
/3/2
009
8:5
4:16
AM
Geo
m:C
V_E
xist
ing
Fl
ow:C
arm
elV
alle
y Fl
owR
iver
=C
VC
reek
Rea
ch=
Low
erR
S=
1182
Sta
tion
(m)
Elevation(m)
Legend
EG
100-
year
WS
100-
year
Crit
100-
year
Gro
und
Ban
kS
ta
.035
.025
.03

010
020
030
040
050
060
070
02468101214
Exis
ting
Con
ditio
ns
P
lan:
Pla
n 02
8
/3/2
009
8:5
4:16
AM
Geo
m:C
V_E
xist
ing
Fl
ow:C
arm
elVa
lley
Flow
Riv
er=
CV
Cre
ekR
each
=Lo
wer
RS
=11
63B
RS
orre
nto
Valle
yR
oad
Pro
pose
dB
ridge
Sta
tion
(m)
Elevation(m)
Legend
EG
100-
year
WS
100-
year
Crit
100-
year
Gro
und
Ban
kS
ta
.035
.025
.03
010
020
030
040
050
060
070
02468101214
Exis
ting
Con
ditio
ns
P
lan:
Pla
n 02
8
/3/2
009
8:5
4:16
AM
Geo
m:C
V_E
xist
ing
Fl
ow:C
arm
elV
alle
y Fl
owR
iver
=C
VC
reek
Rea
ch=
Low
erR
S=
1143
B
Sta
tion
(m)
Elevation(m)
Legend
EG
100-
year
WS
100-
year
Crit
100-
year
Gro
und
Ban
kS
ta
.035
.025
.03
010
020
030
040
050
060
070
02468101214161820
Exis
ting
Con
ditio
ns
P
lan:
Pla
n 02
8
/3/2
009
8:5
4:16
AM
Geo
m: C
V_E
xist
ing
Fl
ow: C
arm
elVa
lley
Flow
Riv
er=
CV
Cre
ek
Rea
ch=
Low
er
R
S=
1100
BR
SR
-56
Con
nect
orw
esto
f I-5
Sta
tion
(m)
Elevation(m)
Legend
EG
100-
year
WS
100-
year
Crit
100-
year
Gro
und
Ban
kS
ta
.035
.025
.03

010
020
030
040
050
060
070
02468101214161820
Exis
ting
Con
ditio
ns
P
lan:
Pla
n 02
8
/3/2
009
8:5
4:16
AM
Geo
m: C
V_E
xist
ing
Fl
ow: C
arm
elVa
lley
Flow
Riv
er=
CV
Cre
ek
Rea
ch=
Low
er
R
S=
1100
BR
SR
-56
Con
nect
orw
esto
f I-5
Sta
tion
(m)
Elevation(m)
Legend
EG
100-
year
WS
100-
year
Crit
100-
year
Gro
und
Inef
f
Ban
kS
ta
.035
.05
.05
010
020
030
040
050
060
070
02468101214
Exis
ting
Con
ditio
ns
P
lan:
Pla
n 02
8
/3/2
009
8:5
4:16
AM
Geo
m:C
V_E
xist
ing
Fl
ow:C
arm
elV
alle
y Fl
owR
iver
=C
VC
reek
Rea
ch=
Low
erR
S=
1045
A
Sta
tion
(m)
Elevation(m)
Legend
EG
100-
year
WS
100-
year
Crit
100-
year
Gro
und
Inef
f
Ban
kS
ta
.035
.05
.05
010
020
030
040
050
060
0246810121416
Exis
ting
Con
ditio
ns
P
lan:
Pla
n 02
8
/3/2
009
8:5
4:16
AM
Geo
m:C
V_E
xist
ing
Fl
ow:C
arm
elV
alle
y Fl
owR
iver
=C
VC
reek
Rea
ch=
Low
erR
S=
774
Sta
tion
(m)
Elevation(m)
Legend
EG
100-
year
WS
100-
year
Gro
und
Inef
f
Ban
kS
ta
.035
.05
.05
010
020
030
040
050
060
070
0051015202530
Exis
ting
Con
ditio
ns
P
lan:
Pla
n 02
8
/3/2
009
8:5
4:16
AM
Geo
m:C
V_E
xist
ing
Fl
ow:C
arm
elV
alle
y Fl
owR
iver
=C
VC
reek
Rea
ch=
Low
erR
S=
356
Sta
tion
(m)
Elevation(m)
Legend
EG
100-
year
WS
100-
year
Crit
100-
year
Gro
und
Inef
f
Ban
kS
ta
. 0 1 6
.05
. 0 1 6

Errors Warnings and Notes for Plan : Plan 02Location: River: CV Creek Reach: Lower RS: 11303 Profile: 100-yearWarning: The conveyance ratio (upstream conveyance divided by downstream conveyance) is less than 0.7
or greater than 1.4. This may indicate the need for additional cross sections.Location: River: CV Creek Reach: Lower RS: 11191 Profile: 100-yearWarning: The velocity head has changed by more than 0.5 ft (0.15 m). This may indicate the need for
additional cross sections.Location: River: CV Creek Reach: Lower RS: 11100 Profile: 100-year UpstreamWarning: Critical depth could not be determined within the specified number of iterations. The program used
the iteration with the lowest energy.Location: River: CV Creek Reach: Lower RS: 11100 Profile: 100-year DownstreamWarning: The energy equation could not be balanced within the specified number of iterations. The program
used critical depth for the water surface and continued on with the calculations.Location: River: CV Creek Reach: Lower RS: 11064 Profile: 100-yearWarning: The velocity head has changed by more than 0.5 ft (0.15 m). This may indicate the need for
additional cross sections.Warning: The conveyance ratio (upstream conveyance divided by downstream conveyance) is less than 0.7
or greater than 1.4. This may indicate the need for additional cross sections.Warning: Critical depth could not be determined within the specified number of iterations. The program used
the iteration with the lowest energy.Note: The energy method has computed a class B profile.Location: River: CV Creek Reach: Lower RS: 10973 Profile: 100-yearWarning: The conveyance ratio (upstream conveyance divided by downstream conveyance) is less than 0.7
or greater than 1.4. This may indicate the need for additional cross sections.Note: Hydraulic jump has occurred between this cross section and the previous upstream section.Location: River: CV Creek Reach: Lower RS: 10541 Profile: 100-yearWarning: Divided flow computed for this cross-section.Warning: The conveyance ratio (upstream conveyance divided by downstream conveyance) is less than 0.7
or greater than 1.4. This may indicate the need for additional cross sections.Location: River: CV Creek Reach: Lower RS: 10085 Profile: 100-yearWarning: The conveyance ratio (upstream conveyance divided by downstream conveyance) is less than 0.7
or greater than 1.4. This may indicate the need for additional cross sections.Location: River: CV Creek Reach: Lower RS: 9696 Profile: 100-yearWarning: The velocity head has changed by more than 0.5 ft (0.15 m). This may indicate the need for
additional cross sections.Location: River: CV Creek Reach: Lower RS: 9584 Profile: 100-yearWarning: The velocity head has changed by more than 0.5 ft (0.15 m). This may indicate the need for
additional cross sections.Warning: The conveyance ratio (upstream conveyance divided by downstream conveyance) is less than 0.7
or greater than 1.4. This may indicate the need for additional cross sections.Location: River: CV Creek Reach: Lower RS: 9475 Profile: 100-yearWarning: The velocity head has changed by more than 0.5 ft (0.15 m). This may indicate the need for
additional cross sections.Warning: The conveyance ratio (upstream conveyance divided by downstream conveyance) is less than 0.7
or greater than 1.4. This may indicate the need for additional cross sections.Warning: The energy loss was greater than 1.0 ft (0.3 m). between the current and previous cross section.
This may indicate the need for additional cross sections.Location: River: CV Creek Reach: Lower RS: 9169 Profile: 100-yearWarning: The energy equation could not be balanced within the specified number of iterations. The program
used critical depth for the water surface and continued on with the calculations.Warning: The velocity head has changed by more than 0.5 ft (0.15 m). This may indicate the need for
additional cross sections.Warning: The energy loss was greater than 1.0 ft (0.3 m). between the current and previous cross section.
This may indicate the need for additional cross sections.

Errors Warnings and Notes for Plan : Plan 02 (Continued)Warning: During the standard step iterations, when the assumed water surface was set equal to critical depth,
the calculated water surface came back below critical depth. This indicates that there is not a validsubcritical answer. The program defaulted to critical depth.
Location: River: CV Creek Reach: Lower RS: 8979 Profile: 100-yearWarning: The velocity head has changed by more than 0.5 ft (0.15 m). This may indicate the need for
additional cross sections.Warning: The conveyance ratio (upstream conveyance divided by downstream conveyance) is less than 0.7
or greater than 1.4. This may indicate the need for additional cross sections.Warning: The energy loss was greater than 1.0 ft (0.3 m). between the current and previous cross section.
This may indicate the need for additional cross sections.Note: Hydraulic jump has occurred between this cross section and the previous upstream section.Location: River: CV Creek Reach: Lower RS: 8815 Profile: 100-yearWarning: The energy loss was greater than 1.0 ft (0.3 m). between the current and previous cross section.
This may indicate the need for additional cross sections.Location: River: CV Creek Reach: Lower RS: 8575 Profile: 100-yearWarning: The energy loss was greater than 1.0 ft (0.3 m). between the current and previous cross section.
This may indicate the need for additional cross sections.Location: River: CV Creek Reach: Lower RS: 8244 Profile: 100-yearWarning: The energy loss was greater than 1.0 ft (0.3 m). between the current and previous cross section.
This may indicate the need for additional cross sections.Location: River: CV Creek Reach: Lower RS: 7703 Profile: 100-yearWarning: The velocity head has changed by more than 0.5 ft (0.15 m). This may indicate the need for
additional cross sections.Warning: The conveyance ratio (upstream conveyance divided by downstream conveyance) is less than 0.7
or greater than 1.4. This may indicate the need for additional cross sections.Warning: The energy loss was greater than 1.0 ft (0.3 m). between the current and previous cross section.
This may indicate the need for additional cross sections.Location: River: CV Creek Reach: Lower RS: 7465 Profile: 100-yearWarning: The velocity head has changed by more than 0.5 ft (0.15 m). This may indicate the need for
additional cross sections.Warning: The conveyance ratio (upstream conveyance divided by downstream conveyance) is less than 0.7
or greater than 1.4. This may indicate the need for additional cross sections.Warning: The energy loss was greater than 1.0 ft (0.3 m). between the current and previous cross section.
This may indicate the need for additional cross sections.Location: River: CV Creek Reach: Lower RS: 7305 Profile: 100-yearWarning: The energy loss was greater than 1.0 ft (0.3 m). between the current and previous cross section.
This may indicate the need for additional cross sections.Location: River: CV Creek Reach: Lower RS: 7086 Profile: 100-yearWarning: The conveyance ratio (upstream conveyance divided by downstream conveyance) is less than 0.7
or greater than 1.4. This may indicate the need for additional cross sections.Warning: The energy loss was greater than 1.0 ft (0.3 m). between the current and previous cross section.
This may indicate the need for additional cross sections.Location: River: CV Creek Reach: Lower RS: 6449 Profile: 100-yearWarning: The energy loss was greater than 1.0 ft (0.3 m). between the current and previous cross section.
This may indicate the need for additional cross sections.Location: River: CV Creek Reach: Lower RS: 6012 Profile: 100-yearWarning: The conveyance ratio (upstream conveyance divided by downstream conveyance) is less than 0.7
or greater than 1.4. This may indicate the need for additional cross sections.Location: River: CV Creek Reach: Lower RS: 5932 Profile: 100-yearWarning: The conveyance ratio (upstream conveyance divided by downstream conveyance) is less than 0.7
or greater than 1.4. This may indicate the need for additional cross sections.Location: River: CV Creek Reach: Lower RS: 5900 Profile: 100-year DownstreamWarning: The conveyance ratio (upstream conveyance divided by downstream conveyance) is less than 0.7

Errors Warnings and Notes for Plan : Plan 02 (Continued)or greater than 1.4. This may indicate the need for additional cross sections.
Location: River: CV Creek Reach: Lower RS: 5722 Profile: 100-yearWarning: The conveyance ratio (upstream conveyance divided by downstream conveyance) is less than 0.7
or greater than 1.4. This may indicate the need for additional cross sections.Warning: The energy loss was greater than 1.0 ft (0.3 m). between the current and previous cross section.
This may indicate the need for additional cross sections.Location: River: CV Creek Reach: Lower RS: 5229 Profile: 100-yearWarning: The energy loss was greater than 1.0 ft (0.3 m). between the current and previous cross section.
This may indicate the need for additional cross sections.Location: River: CV Creek Reach: Lower RS: 4674 Profile: 100-yearWarning: The conveyance ratio (upstream conveyance divided by downstream conveyance) is less than 0.7
or greater than 1.4. This may indicate the need for additional cross sections.Warning: The energy loss was greater than 1.0 ft (0.3 m). between the current and previous cross section.
This may indicate the need for additional cross sections.Location: River: CV Creek Reach: Lower RS: 4421 Profile: 100-yearWarning: The energy loss was greater than 1.0 ft (0.3 m). between the current and previous cross section.
This may indicate the need for additional cross sections.Location: River: CV Creek Reach: Lower RS: 4086 Profile: 100-yearWarning: The conveyance ratio (upstream conveyance divided by downstream conveyance) is less than 0.7
or greater than 1.4. This may indicate the need for additional cross sections.Warning: The energy loss was greater than 1.0 ft (0.3 m). between the current and previous cross section.
This may indicate the need for additional cross sections.Location: River: CV Creek Reach: Lower RS: 3531 Profile: 100-yearWarning: The energy loss was greater than 1.0 ft (0.3 m). between the current and previous cross section.
This may indicate the need for additional cross sections.Location: River: CV Creek Reach: Lower RS: 3100 Profile: 100-year UpstreamWarning: The energy loss was greater than 1.0 ft (0.3 m). between the current and previous cross section.
This may indicate the need for additional cross sections.Location: River: CV Creek Reach: Lower RS: 3082 Profile: 100-yearWarning: The conveyance ratio (upstream conveyance divided by downstream conveyance) is less than 0.7
or greater than 1.4. This may indicate the need for additional cross sections.Warning: The energy loss was greater than 1.0 ft (0.3 m). between the current and previous cross section.
This may indicate the need for additional cross sections.Location: River: CV Creek Reach: Lower RS: 2846 Profile: 100-yearWarning: The conveyance ratio (upstream conveyance divided by downstream conveyance) is less than 0.7
or greater than 1.4. This may indicate the need for additional cross sections.Warning: The energy loss was greater than 1.0 ft (0.3 m). between the current and previous cross section.
This may indicate the need for additional cross sections.Location: River: CV Creek Reach: Lower RS: 2255 Profile: 100-yearWarning: The conveyance ratio (upstream conveyance divided by downstream conveyance) is less than 0.7
or greater than 1.4. This may indicate the need for additional cross sections.Warning: The energy loss was greater than 1.0 ft (0.3 m). between the current and previous cross section.
This may indicate the need for additional cross sections.Location: River: CV Creek Reach: Lower RS: 1826 Profile: 100-yearWarning: The conveyance ratio (upstream conveyance divided by downstream conveyance) is less than 0.7
or greater than 1.4. This may indicate the need for additional cross sections.Warning: The energy loss was greater than 1.0 ft (0.3 m). between the current and previous cross section.
This may indicate the need for additional cross sections.Location: River: CV Creek Reach: Lower RS: 1543 Profile: 100-yearWarning: The conveyance ratio (upstream conveyance divided by downstream conveyance) is less than 0.7
or greater than 1.4. This may indicate the need for additional cross sections.Location: River: CV Creek Reach: Lower RS: 1500 Profile: 100-year UpstreamWarning: The conveyance ratio (upstream conveyance divided by downstream conveyance) is less than 0.7

Errors Warnings and Notes for Plan : Plan 02 (Continued)or greater than 1.4. This may indicate the need for additional cross sections.
Location: River: CV Creek Reach: Lower RS: 1442 Profile: 100-yearWarning: The velocity head has changed by more than 0.5 ft (0.15 m). This may indicate the need for
additional cross sections.Warning: The conveyance ratio (upstream conveyance divided by downstream conveyance) is less than 0.7
or greater than 1.4. This may indicate the need for additional cross sections.Location: River: CV Creek Reach: Lower RS: 1400 Profile: 100-year UpstreamWarning: The energy equation could not be balanced within the specified number of iterations. The program
used critical depth for the water surface and continued on with the calculations.Warning: The velocity head has changed by more than 0.5 ft (0.15 m). This may indicate the need for
additional cross sections.Warning: The conveyance ratio (upstream conveyance divided by downstream conveyance) is less than 0.7
or greater than 1.4. This may indicate the need for additional cross sections.Warning: The energy loss was greater than 1.0 ft (0.3 m). between the current and previous cross section.
This may indicate the need for additional cross sections.Warning: During the standard step iterations, when the assumed water surface was set equal to critical depth,
the calculated water surface came back below critical depth. This indicates that there is not a validsubcritical answer. The program defaulted to critical depth.
Location: River: CV Creek Reach: Lower RS: 1400 Profile: 100-year DownstreamWarning: The velocity head has changed by more than 0.5 ft (0.15 m). This may indicate the need for
additional cross sections.Warning: The conveyance ratio (upstream conveyance divided by downstream conveyance) is less than 0.7
or greater than 1.4. This may indicate the need for additional cross sections.Warning: The energy loss was greater than 1.0 ft (0.3 m). between the current and previous cross section.
This may indicate the need for additional cross sections.Location: River: CV Creek Reach: Lower RS: 1182 Profile: 100-yearWarning: The conveyance ratio (upstream conveyance divided by downstream conveyance) is less than 0.7
or greater than 1.4. This may indicate the need for additional cross sections.Location: River: CV Creek Reach: Lower RS: 1163 Profile: 100-year DownstreamWarning: The conveyance ratio (upstream conveyance divided by downstream conveyance) is less than 0.7
or greater than 1.4. This may indicate the need for additional cross sections.Location: River: CV Creek Reach: Lower RS: 1100 Profile: 100-yearWarning: For the final momentum answer at the bridge, the upstream energy was computed lower than the
downstream energy. This is not physically possible, the momentum answer has been disregarded.Location: River: CV Creek Reach: Lower RS: 1100 Profile: 100-year UpstreamWarning: The conveyance ratio (upstream conveyance divided by downstream conveyance) is less than 0.7
or greater than 1.4. This may indicate the need for additional cross sections.Location: River: CV Creek Reach: Lower RS: 1045 Profile: 100-yearWarning: Divided flow computed for this cross-section.Warning: The velocity head has changed by more than 0.5 ft (0.15 m). This may indicate the need for
additional cross sections.Warning: The conveyance ratio (upstream conveyance divided by downstream conveyance) is less than 0.7
or greater than 1.4. This may indicate the need for additional cross sections.Warning: The energy loss was greater than 1.0 ft (0.3 m). between the current and previous cross section.
This may indicate the need for additional cross sections.Location: River: CV Creek Reach: Lower RS: 774 Profile: 100-yearWarning: The conveyance ratio (upstream conveyance divided by downstream conveyance) is less than 0.7
or greater than 1.4. This may indicate the need for additional cross sections.

CARMEL VALLEY CREEK LOCATION HYDRAULIC STUDY
APPENDIX ‘C’
Location Hydraulic Study Form
Floodplain Encroachment Form
Record of Conversation with FEMA
As-builts
Planning Study

LOCATION HYDRAULIC STUDY FORM
Dist. 11 Co. SD Rte. 005 K.P. 52.6 / 56.0Rte. 056 K.P. 0.0 / 4.1
EA 177900 Bridge Nos. 57-0590, 57-0606, 57-0607Floodplain Description:Year-round flowing creek with heavy vegetation and several bridge crossing. Locationof interest: I-5 / Carmel Valley Creek Intersection to Carmel Country Rd / CarmelValley Creek Intersection
1. Description of Proposal (include any physical barriers i.e. concrete barriers,soundwalls, etc. and design elements to minimize floodplain impacts)
This project includes improvements to the I-5 / SR-56 interchange near Carmel ValleyCreek. The improvements extend along SR-56 from I-5 to Carmel Country Roadcrossing over the creek. Proposed improvements would not have significant impacts tothe existing floodplain.
2. ADT: Current 313,000 Projected 391,800 (year 2030)(Current ADT values taken from SANDAG: Transportation Forecast InformationCenter for I-5)
3. Hydraulic Data: Base Flood Q100= 10,000 ft3 / s at confluence with SoledadCanyon (Taken from 1999 Carmel Valley Creek Connector As-builts)Base Flood Q100= 7,400 ft3 / s at confluence with ShawValley Creek (Taken from 1999 Carmel Valley Creek BridgeFoundation As-builts)
WSE100= 6.82 meters (Upstream face of I-5 Bridge)The flood of record, if greater than Q100:
Q= N/A ft3 / s WSE= N/AOvertopping flood Q=(no increase from existing condition) ft3 / sWSE= (no increase from existing condition)
Are NFIP maps and studies available? YES X NO
4. Is the highway location alternative within a regulatory floodway?YES X NO
All project alternatives are within the existing FEMA floodway delineation. However,it seems that the FEMA floodway was established prior to construction of SR-56 and isobsolete. A new ‘effective floodway’ was developed for the purpose of this studyutilizing base flood elevations from the outdated Flood Insurance Study and currenttopography. It was determined that none of the project alternatives include workwithin this new effective floodway.

5. Attach map with flood limits outlined showing all buildings or other improvementswithin the base floodplain. (See Appendix ‘A’)
Potential Q100 backwater damages:
A. Residences? NO YES (no increase from existing condition)B. Other Bldgs? NO YES (no increase from existing condition)C. Crops? NO X YESD. Natural and beneficial
FLOODPLAIN VALUES? NO X YES
6. Type of Traffic:
A. Emergency supply or evacuation route? NO YES XB. Emergency vehicle access? NO YES XC. Practicable detour available? NO YES XD. School bus or mail route? NO YES X
7. Estimated duration of traffic interruption for 100-year event hours: There are nosignificant changes to the I-5 bridge crossing the Carmel Valley Creek, El CaminoReal bridge crossing, Carmel Creek Road bridge crossing, or the Carmel Country Roadbridge crossing. Traffic interruptions are not anticipated. (no increase from proposedimprovements).
8. Estimated value of Q100 flood damages (if any) – moderate risk level.
A. Roadway $ (no increase from existing condition)B Property $ (no increase from existing condition)
Total $ (no increase from existing condition)
9. Assessment of Level of Risk Low XModerateHigh
For High Risk projects, during design phase, additional Design Study Risk Analysis maybe necessary to determine design alternative.
Is there any longitudinal encroachment, significant encroachment, or any support ofincompatible floodplain development? NO X YES
If yes, provide evaluation and discussion of practicability of alternatives in accordancewith 23 CFR 650.113
Information developed to comply with the Federal requirement for the LocationHydraulic Study shall be retained in the project files.
Signature – District Hydraulic Engineer Date

FLOODPLAIN ENCROACHMENT REPORT SUMMARY
Dist. 11 Co. SD Rte. 005 K.P. 52.6 / 56.0Dist. 11 Co. SD Rte. 056 K.P. 0.0 / 4.1Bridge Nos. 57-0590, 57-0606, 57-0607Limits: I-5 / Carmel Valley Creek Intersection to Carmel Country Rd / Carmel Valley
Creek Intersection
Floodplain Description: Year-round flowing creek with heavy vegetation and severalbridge crossings.
No Yes1. Is the proposed action a longitudinal encroachment of the base floodplain?
X ___2. Are the risks associated with the implementation of the proposed action
significant?X ___
3. Will the proposed action support probable incompatible floodplaindevelopment?
X ___
4. Are there any significant impacts on natural and beneficial floodplain values? X ___
5. Routine construction procedures are required to minimize impacts on thefloodplain. Are there any special mitigation measures necessary to minimizeimpacts or restore and preserve natural and beneficial floodplain values? Ifyes, explain.
X ___
6. Does the proposed action constitute a significant floodplain encroachment asdefined in 23 CFR, Section 650.105(q).
X ___
7. Are Location Hydraulic Studies that document the above answers on file? Ifnot explain.
__ X
PREPARED BY:
______________________________________ __________Signature – District Hydraulic Engineer Date
______________________________________ __________Signature – District Environmental Branch Chief Date
______________________________________ __________Signature – District Project Engineer Date

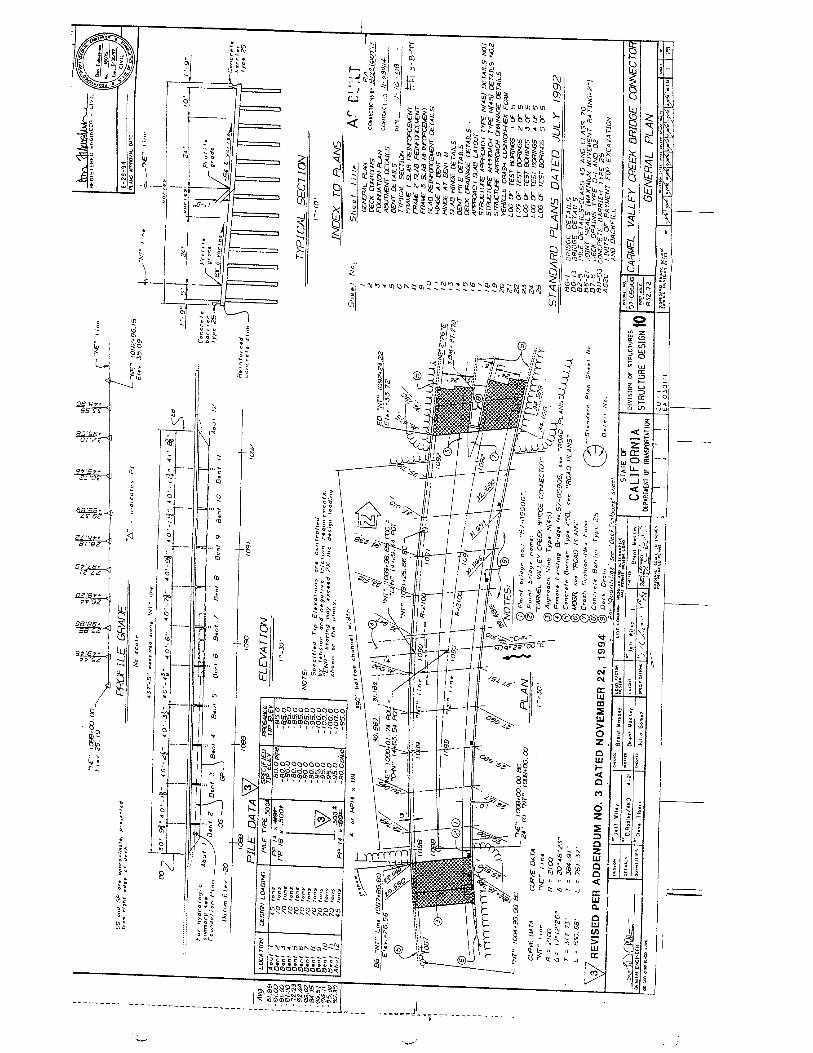
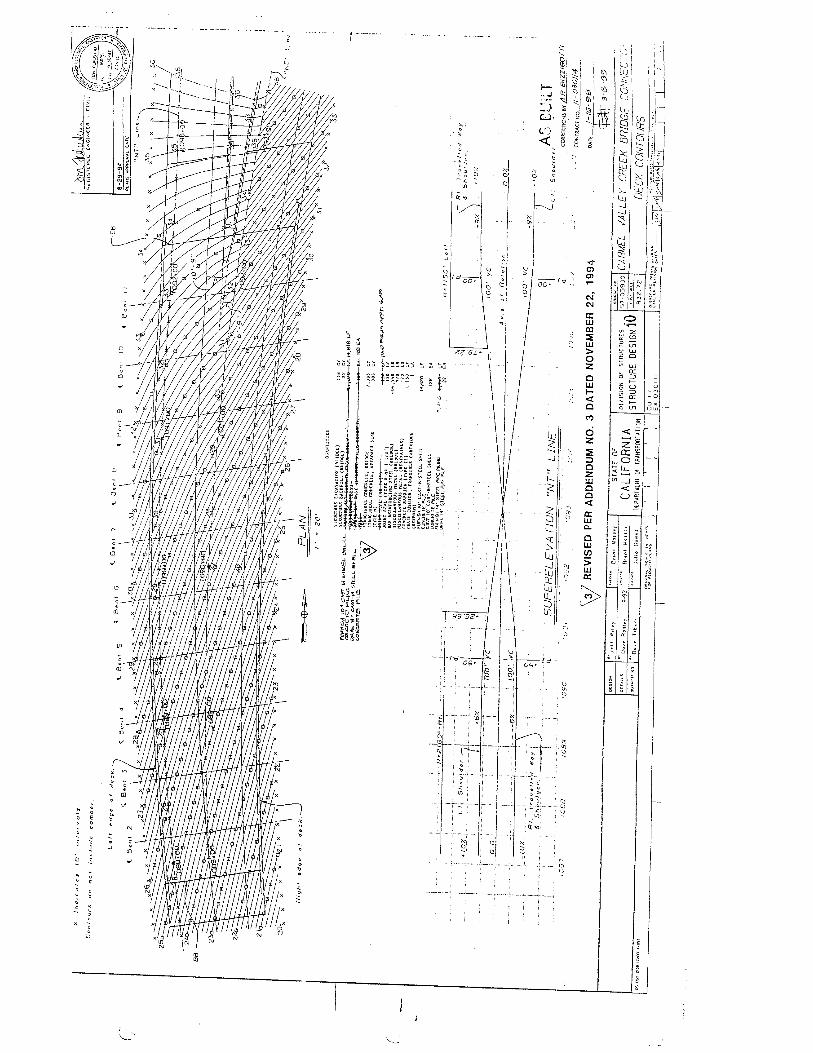

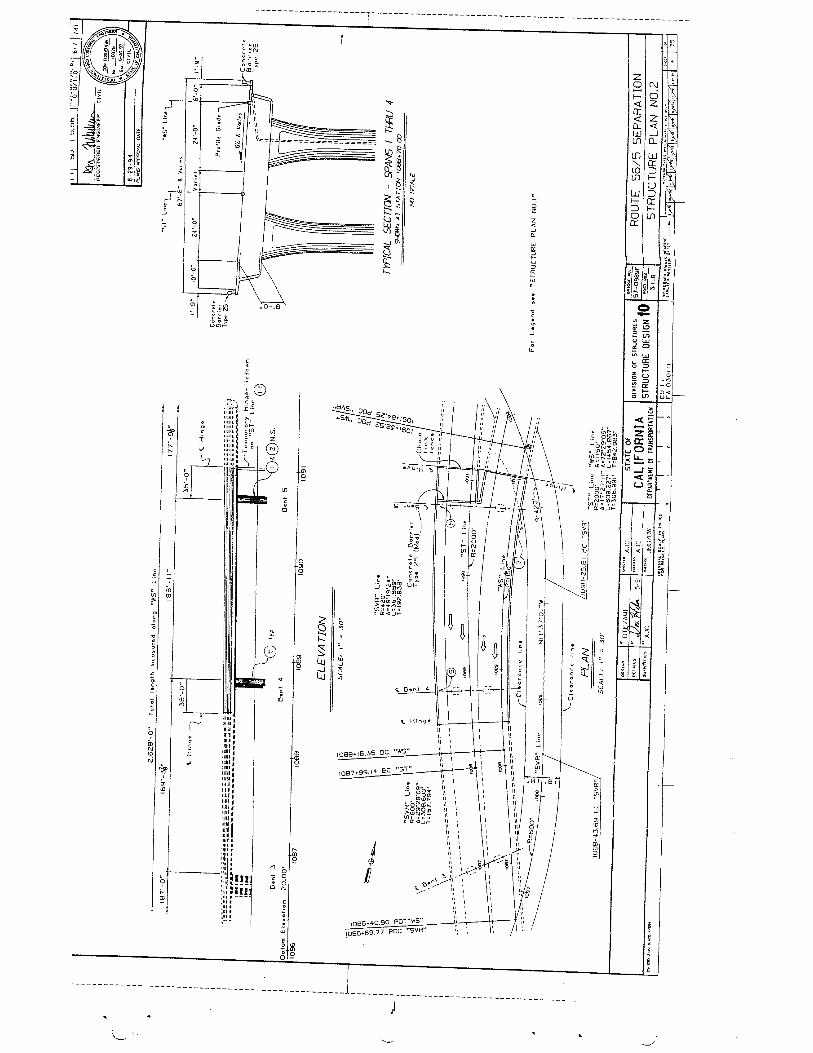


Clib
PD
F -
ww
w.f
asti
o.c
om

Clib
PD
F -
ww
w.f
asti
o.c
om

Clib
PD
F -
ww
w.f
asti
o.c
om

Clib
PD
F -
ww
w.f
asti
o.c
om

Clib
PD
F -
ww
w.f
asti
o.c
om

Clib
PD
F -
ww
w.f
asti
o.c
om
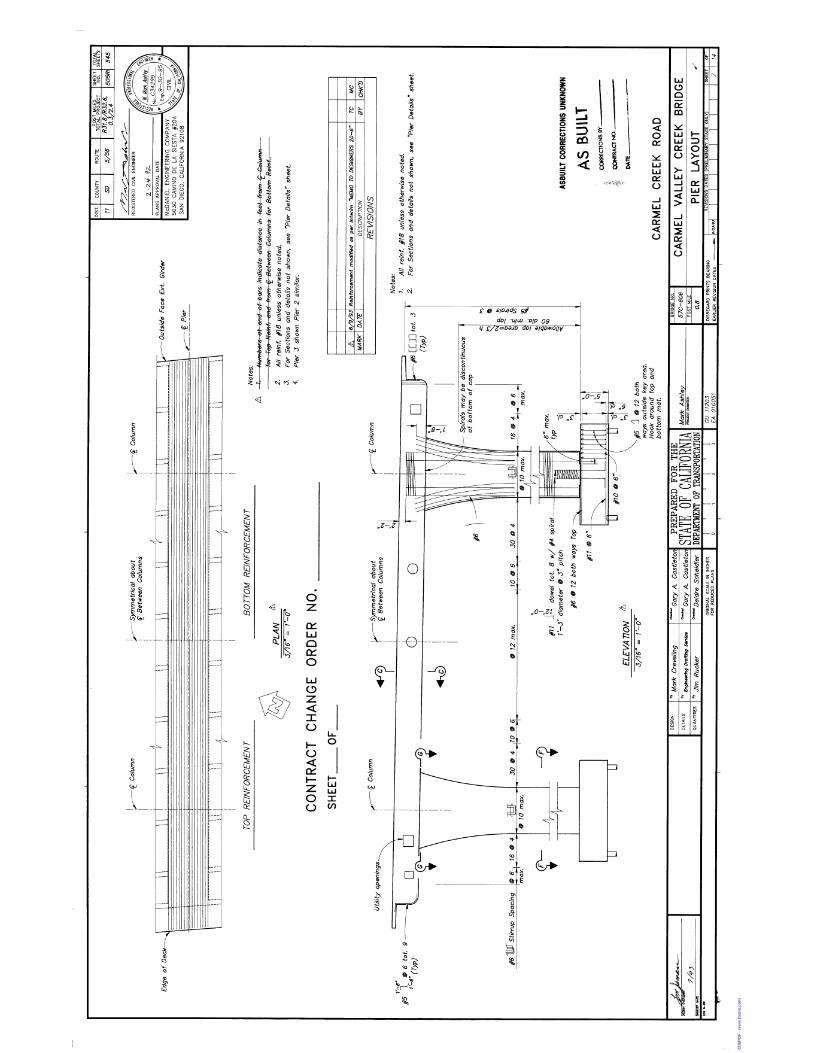
Clib
PD
F -
ww
w.f
asti
o.c
om

Clib
PD
F -
ww
w.f
asti
o.c
om

Clib
PD
F -
ww
w.f
asti
o.c
om

Clib
PD
F -
ww
w.f
asti
o.c
om

Clib
PD
F -
ww
w.f
asti
o.c
om

Clib
PD
F -
ww
w.f
asti
o.c
om

Clib
PD
F -
ww
w.f
asti
o.c
om

Clib
PD
F -
ww
w.f
asti
o.c
om

Clib
PD
F -
ww
w.f
asti
o.c
om
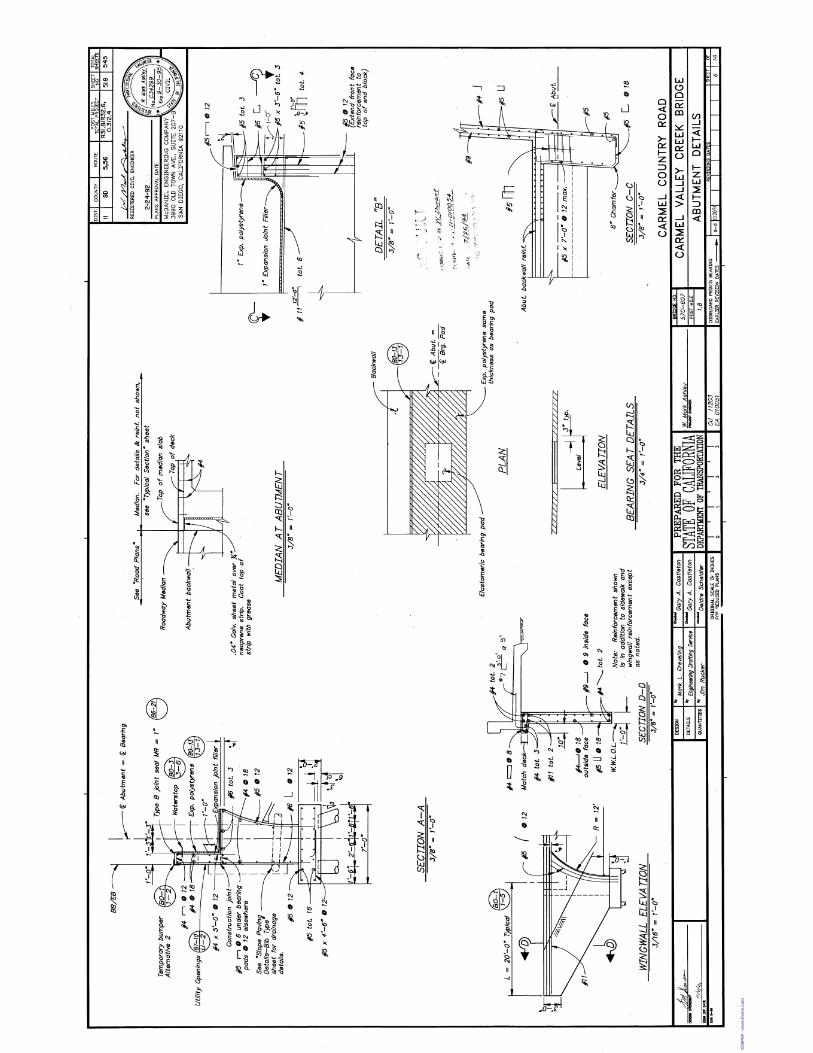
Clib
PD
F -
ww
w.f
asti
o.c
om

Clib
PD
F -
ww
w.f
asti
o.c
om

Clib
PD
F -
ww
w.f
asti
o.c
om

CARMEL VALLEY CREEK LOCATION HYDRAULIC STUDY
APPENDIX ‘D’
HEC-RAS Model on CD