i building a strategy for marketing
TRANSCRIPT

I I I I I I I I I I I I I I I I I I I
Building a Strategy for Marketing
Minnesota's Secondary Materials
Volume I: Market Status Report
Center for Urban and Regional Affairs
in cooperation with The Minnesota Project
ElOLfG

I I' I I
' I I I I I I I I I 1.,
I I I I
Building a Strategy for Marketing
Minnesota's Secondary Materials
Volume I: Market Status Report
by Thomas R. Peek
Center for Urban and Regional Affairs
in cooperation with The Minnesota Project

Funded in part by a grant from the Northwest Area Foundation.
A publication of the Center for Urban and Regional Affairs, 330 Hubert H. Humphrey Center, 301 19th A venue S., Minneapolis, MN 55455.
The content of this report is the responsibility of the author and is not necessarily endorsed by CURA.
February 1990
Publication CURA 90-4
Copies of this report distributed by CURA are printed on paper containing secondary fibers.
I ·1
I I I I I I· I I I I I I .. 1 I J I I

I I I I I I: I I I I I I I 1· I t I I I
TABLE OF CONTENTS
Foreword
I. Introduction
II. Background
What is Recycling? What are Secondary Materials?
What is Market Development?
What Does the Waste Stream Look Like? How Much is Being Recycled?
III. The Markets for Minnesota's Secondary Materials
General Factors Affecting Secondary Materials Markets
Three Types of Market Conditions
Market Observations For Particular Secondary Materials
Intermediate and End-Users of Secondary Materials What Existing Market Analyses Say-Some Key Conclusions
IV. Building A Strategy for Action
What Are the Impediments to Marketing Minnesota's Secondary Materials?
Who Has Responsibility for Building A Strategy to Overcome these Impediments?
How Can We Overcome these Impediments and Better Utilize our Market Opportunities?
What is the State of Minnesota Doing to Enhance Utilization of Secondary Materials?
Several Key Process Issues
V. Summary Findings and Conclusions
Bibliography
Appendices
Page
V
1
5 5 6
8
8
11
12
13
14
22 24
27
27
28
29
33
34
37
41
45
iii

-
r
I~
I I, I I I \I I I I I I I ,I ·I I I I I I
I

I i1
I I I I I I I ,, I I I I· I I I I· I
FOREWORD
This report was prepared under contract with the Center for Urban and Regional Affairs (CURA) at the University of Minnesota as part of a project designed to explore strategies for marketing secondary materials diverted from the waste streams in Minnesota and other mid western states. The project is being conducted by CURA in cooperation with The Minnesota Project, funded by a grant from the Northwest Area Foundation.
This report was prepared as a background document for use by participants at a two-day workshop entitled: "A Blueprint for Action: Secondary Materials Market · Development," held on December 13 and 14, 1989 at the University of Minnesota's Hubert H. Humphrey Center. This report is intended to provide an introduction to the topic, and pulls together existing information on Minnesota's secondary materials and their markets, identifies impediments to full market utilization of these materials, outlines options for overcoming these barriers, and reviews state actions in this regard.
While the focus of this report is on Minnesota, much of the discussion is directly relevant to the Midwest as a whole. This is particularly true of the section on markets (Chapter III), which contains significant regional information, and the strategy discus-
. sion (Chapter IV), which identifies actions that any state in the Midwest could employ as part of its market strategy. To date, no multi-state market studies have been conducted for the Midwest. In general, states within the region have examined their own circumstances, recognizing conditions in other states only to the degree that those other states contain markets for their secondary materials. Nor have multi-state market strategies been developed, although linkages among people involved in the various states have been made as a result of efforts like those of the Midwest Recycling Coalition. Thus far, Minnesota, like other states in the Midwest, has conducted its market studies and market development programs independent of the activities of other states in the region.
.This report contains five chapters. First, there is an introduction to the topic which reviews the reasons Minnesotans, and others in the Midwest, are interested in expanding markets for secondary materials. Second, a background discussion is included which defines recycling, secondary materials, and market development, and describes the waste streams in the United States and Minnesota. Third, the markets for Minnesota's secondary materials are discussed based on existing market analyses. Fourth, there is a strategy discussion which identifies the impediments to marketing these materials, outlines the parties responsible for building marketing strategies, lists eight types of actions and thirty-one specific options which could be employed to expand the use of Minnesota's secondary materials, reviews current Minnesota market develop-
V
ment programs, and raises several key process issues associated with building market strategies for the state. The final chapter is a brief summary of findings and conclusions.
This report is based on existing information and is therefore limited, especially with respect to some materials. Despite the necessary limitations, it is hoped that this report will provide useful background for those interested in building a strategy for marketing secondary materials in Minnesota and other midwestern states.
The author wishes to acknowledge the conceptual and editorial assistance provided by John Gilkeson of CURA and Susan Schmidt of The Minnesota Project. A number of other people have been helpful in locating reports, data, and other materials useful in the preparation of the report. These include the members of the project's Planning Committee, Tim Nolan of the Minnesota Office of Waste Management, Bill Dunn of the Minnesota Pollution Control Agency, and John McGough of the Metropolitan Council of the Twin Cities Area, among others. The contributions of all these people are greatly appreciated.
vi
I I I ,'I I I I ,, I/ -I I ·I I

I I I I I I I I I I I I ,,
' I I I I I
I. INTRODUCTION
Finding markets for secondary materials-the paper, plastics, glass, and other items diverted from the waste stream for recycling-has become a major concern in Minnesota, the Midwest, and the nation. People from government, industry, environmental groups, and the citizenry are now engaged in a serious discussion about how to market the growing volumes of these materials.
The current interest in finding markets for secondary materials goes back to the early 1970s, when a new environmental ethic, growing out of widespread environmental concerns, began to take hold. Then, after the 1973 oil embargo and rising prices in many resource-based commodities, concern about limited natural resources grew. As a result, fledgling community recycling programs were established to augment commerciaVindustrial scrap collection and other recycling activities. People began saving not only newspapers-for years collected by the Boy Scouts, local church groups, and other community organizations-but also bottles, cans, and other materials. Until recently, community recycling efforts were quite modest, and there were sufficient markets to absorb much of what was collected. But then something happened to change all that.
Minnesota, along with the Midwest and the rest of the nation, found itself in a solid waste disposal crisis caused by a growing volume of garbage. Despite environmental concerns and the increased public awareness that natural resources are limited, the amount of garbage being generated steadily increased, nationally and in Minnesota.
The amount of municipal solid waste in the U.S. almost doubled between 1960 (88 million tons) and 1986 (158 million tons) and is expected to increase another 25 percent (to 193 million tons) by the year 2000. But this was not just due to increased population. The average American's trash contribution rose from about two and onehalf pounds a day in 1960 to over three pounds in 1986, and is projected to reach almost three and one-half pounds of trash a day by the year 2000 (Franklin Associates 1988, p. 17).
The situation in Minnesota is not all that different from the nation as a whole. It is estimated that the state generates about 4 million tons of solid waste a year. Half of this, or about two and one-half pounds per person per day, is residential waste, although the amount varies depending on the degree of urbanization. In rural areas the average residential waste is estimated to be under two pounds a day, while urban people throw out about two and one-half pounds a day. Suburban residents generate the most waste, almost three pounds a day (SCORE 1989b; Cal Recovery Systems 1988, pp. 2-5). Other estimates, which include all solid wastes-commercial, business, and institutional
1

MARKET STATUS REPORT
wastes, as well as residential wastes-suggest that Minnesota's per capita generation rate may be over four pounds of garbage per day (MPCA 1988a, p. 39).
While the amount of waste landfilled in Minnesota has remained relatively constant-because of garbage diversion to incineration, recycling (including increased recycling of commercial/industrial wastes), and other· disposal alternatives-the amount of waste generated is assumed to parallel the U.S. trends. If that is the case, the per capita increase in garbage, combined with an expected population rise of about 10 percent, will result in a 22 percent increase .in Minnesota wastes by the year 2000--at least 2,000 tons more per day (MPCA 1988a, pp. 38-40).
Yet, ironically, as the need for more landfill space has increased, so has the opposition to landfills. By the early 1980s, soil and ground water contamination from toxic materials in landfills was clearly documented, and that news hit the media. In addition, the use of prime farmland for the location or expansion of landfills, especially near metropolitan areas, became controversial for both environmental and preferred land use reasons. So despite the growing need for places to "get rid of' garbage, public opposition made it difficult to locate new and expanded facilities.
Public officials responded to the situation by increasing regulation of landfills and planning for a diversion of materials away from these facilities. In 1985, through amendment to the Waste Management Act of 1980, the Minnesota State Legislature banned the disposal of unprocessed mixed municipal solid waste in the Twin Cities metropolitan area by January 1, 1990 and in subsequent years enacted landfill bans on batteries and oil (having already banned landfill disposal of tires some years earlier). As a result of these regulations, illegal dumping of prohibited items and hazardous wastes increased, heightening environmental concerns. The 1988 Minnesota Legislature enacted a ban on landfill disposal and incineration of yard wastes by 1990 in the Twin Cities metropolitan area, and by 1992 for the rest of the state-creating further pressure to find alternatives. By 1989, only 8 of the state's 1,500 open landfills remained operational, and only 87 of the 131 permitted landfills remained open. Half of these 87 landfills have less than five years capacity remaining and at least a third are known to be leaking contaminants (MPCA 1988a, pp. 16-22; SCORE 1989b).
Although public officials have viewed incineration as the primary landfill alternative, recycling has gained substantial favor as an important alternative. In part responding to state regulatory and planning requirements, municipalities throughout the state, particularly in the Twin Cities metropolitan area, have beefed up their previously limited efforts to recycle. The amount of secondary materials recovered has grown, even though some cities are moving toward massive incineration of their garbage. By 1989 Minnesota had fourteen waste-to-energy incinerators permitted or under development, with an anticipated capacity to burn 50 percent of the state's wastes and · 72 percent of the Twin Cities area wastes by 1991 (SCORE 1989b).
But as the 1990s approach, public opposition.to incineration grows, fueled in part by concerns about the release of toxic materials into the atmosphere and the difficulty of ash disposal due to the concentration of toxins left in the ash. At the same time, environmental concerns in general are heightened by numerous scientific studies and a continual barrage of news stories showing dangerous environmental trends worldwide-including continued exploitation of limited natural resources and increasing
· health and safety problems associated with waste disposal.
2
I i I I I I I I I
' I I ,I I I I I I I

I ,. ,. I I I/ t I I I I I I I I I I I I
INTRODUCTION
All of these factors-environmental and natural resource concerns; growing amounts of wastes; opposition to, and increasing regulation of, landfills; government plans for diversion of materials away from on-land disposal; and public opposition to incineration-have increased government programs to encourage recycling and heightened public participation in recycling efforts. The result is more secondary materials are collected than anyone would have expected, or that existing markets can absorb .. There is more material than can readily be recycled into useful products, and some of that material has ended up back in landfills and incinerators. On top of that, more material is expected as all of these factors contribute to a steadily growing solid waste crisis.
But it was a nationwide glut in old newsprint, which hit the Twin Cities in the • spring of 1989, that took the topic of secondary materials markets out of the offices of government and industry officials and spread it across the front of Minnesota's televisions and newspapers. Other states and cities throughout the Midwest and the nation, which have responded similarly to landfill problems, have also experienced oversupplies of secondary materials.
Obviously, waste diversion from the landfills is occurring, and recycling-along with incineration-is increasingly becoming a part of the solid waste solution. While the glut in newspapers and other materials may turn out to be a relatively short-term problem, it is at least partially responsible for drawing attention. to the need for finding markets for secondary materials, the challenge that Minnesota, the Midwest, and the rest of the nation now face.
At the same time, the 1989 Minnesota Legislature, meeting in special session, passed recycling legislation based on the recommendations of the Governor's Select Committee on Recycling and the Environment (SCORE). Included in the new programs enacted are state monies for secondary materials market development, a particularly important aspect of the new law since it also establishes ambitious recycling rates for the state to achieve by 1993: 25 percent for greater Minnesota and 35 percent for the Twin Cities metropolitan area (SCORE 1989c).
3

·I ,, I j_
I 11 t ,, I I ·I I I i I I I I I

I I I I I :I I ,., l1 I .. -
1 I\ I I I\ -j
I I I ,.
II. BACKGROUND
Before examining the markets for secondary materials, it is useful to clarify what is meant by "recycling," "secondary materials," and "market development." While these terms mean various things to various people, for the purposes of this report, they are defined as discussed below. A discussion of the U.S. and Minnesota waste streams is also included in this section of the report.
WHAT IS RECYCLING?
After secondary materials are diverted from the waste stream, they are recycled in a variety of ways, depending on the material. In most cases, recycling involves the reprocessing o_f the materials to prepare them for remanufacture into new products~ Examples of reprocessing include deinking and repulping of waste paper, detinning and remelting of tin cans, shredding and remelting of other metals and plastics, and crushing and remelting of glass. Once processed, these materials are remanufactured into new products. These products may be similar to the original discards, such as new beverage containers made from old ones, or they may be entirely different products, such as building materials made from old plastic milk bottles. Often these materials are reprocessed and remanufactured a number of times, over several generations of the material, such as is done with beverage containers and waste paper.
In other cases, recycling involves the reuse of discarded materials in the same or similar form without significant reprocessing or remanufacturing, such as the reuse of textiles either as used clothing or rags. Sometimes secondary materials are reused with minimal reprocessing, such as when old newsprint is shredded and packaged for re-use as animal bedding. However, in that case the material is re utilized only once and then is disposed of in some way.
While composting of yard wastes and other organic materials is often considered a type of recycling, it rarely ends up in the form of useful products. More often it is utilized merely as a more environmentally sound disposal method than landfilling or incineration. When it is reused in the form of new products, like potting soil and soil conditioners, it is not typically remanufactured, although some type of processing may be required to sort, clean, and package the material. In addition, the useful life of yard wastes and other organic materials utilized as compost is extended by only one generation, in a manner similar to animal bedding made from newsprint.
It is important to distinguish between post-consumer materials-such as waste paper, plastics, glass, and other materials discarded by households, offices, and other institutions-and commercial/industrial wastes-such as scrap materials from manufac-
5

MARKET STATUS REPORT
turing and other waste items generated by commercial and industrial operations. Postconsumer materials are heterogeneous wastes of highly variable quality, usually diverted after their incorporation into the mixed municipal solid waste stream. By contrast, commercial/industrial wastes are typically high-quality, homogeneous materials, usually diverted from the waste stream at the commercial or industrial site rather than through the municipal solid waste system.
Another important distinction is between recycling and "resource recovery"-the one-time diversion of materials from the waste stream, usually through incineration to produce energy. While the material is being "converted" into electricity or heat, it is being destroyed rather than recycled into reusable products. Used tires, wood scraps, and mixed solid wastes are the materials typically diverted from the waste stream for resource recovery.
WHAT ARE SECONDARY MATERIALS?
Secondary materials are the old newspapers, cans, refrigerators, bottles, tires, and other discards diverted from the waste stream for recycling. The major materials for which markets are sought are listed and defined below (Minnesota Waste Management Board 1988; Gilkeson, pers. comm. with author, November 20, 1989). Additional secondary materials are listed in Appendix 1.
6
Waste paper includes the following:
• Old newspapers-old newsprint
• Corrugated (paperboard)-a rigid paper structured in parallel furrows, such as cardboard boxes
• High-grade paper-white or colored ledger ("office paper") or computer paper
• Mixed paper-low and high grade paper mixed together
Plastics include the following:
• PET-polyethylene terephthalate, used in beverage bottles and other food and household products
• HDPE-high density polyethylene, used in milk and water jugs and many other products
• LDPE-low density polyethylene, a plastic film used for food packaging wrap and garbage bags
• PS-polystyrene, used in cups and bowls, fast-food foam containers, cassette tapes and cutlery
• Other plastics-including polypropylene (used in housewares, containers and battery cases), polyvinyl chloride (used in pipes, drains and furniture) and acrylonitrile butadiene styrene (used in automobile trim, grills and telephone bodies)
I I I I I I I ,, ,I I I ii I I 'I I I I I

I I
' I ' I I ,, I,
I I I I
BACKGROUND
• Mixed plastics-a mixture of different plastic types or multi-resin containers
Glass includes the following:
• Color sorted-glass containers separated by color (i.e. clear/flint, green, amber/brown)
• Color mixed-glass containers of different colors mixed together
Metals include the following:
• Ferrous-metals which have magnetic character and contain iron, such as cast iron
• Nonferrous-nonmagnetic metals with no iron content, including aluminum, copper, lead and brass
• Aluminum scrap-aluminum in scrap form, such as window and door frames, lawn furniture frames and drain pipes
• Aluminum cans-usually twelve ounce soda pop cans (UBC-used beverage cans)
• Bi-metal beverage cans-steel beverage cans with steel tops or bottoms
• "Tinned" food cans-tin-plated steel cans, such as soup, vegetable and pet food cans
• White goods-large appliances, such as washing machines and refrig-erators, accepted in whole form or as scrap
-Rubber: primarily tires, but also other rubber items
Waste oil: used motor oil, such as from automobiles, trucks and other vehicles
Construction materials: materials resulting from demolition or construction, including tar, asphalt, cement and concrete.
Yard wastes: brush (such as tree branches and bush trimmings), grass clippings, leaves and other yard wastes
Batteries include:
• Automobile batteries--common lead-acid batteries from cars, trucks, tractors, snowmobiles and motorcycles
• Other batteries-includes batteries made with mercury (used in hearing aids), lithium (used in calculators), alkaline (used as common household batteries), nickel cadmium (for rechargeable batteries), and dry-cell batteries
Textiles: usable or wearable clothing, rags or clean textile scraps
Much of the discussion about expanding markets for secondary materials centers around waste paper (particularly old newspapers), plastics (particularly PET and HOPE containers), metals (particularly aluminum, bi-metal and "tinned" cans, scrap metal, and
7
MARKET STATUS REPORT
white goods), and yard wastes. All of these make up significant volumes of waste, especially waste paper and yard wastes. Waste oil and batteries, which present less problem from a waste volume point of view, are of concern because they contain hazardous materials.
WHAT IS MARKET DEVELOPMENT?
For .the purposes of this report, market development is defined as the public and private activities employed to overcome whatever impediments prevent full utilization of secondary materials diverted from the waste stream. Some market development actions are designed to enhance the utilization of secondary materials that have market potential but are not reaching those markets by: increasing and stabilizing price and demand for these materials; increasing the quality -and reliability of the materials flow; enhancing the quality of the materials presented to their markets; or improving the collection, processing and transportation systems utilized during recycling. Other actions are designed to create new markets for secondary materials with limited market potential by: developing new markets; developing new products; or requiring reuse of undesirable materials. Market development actions may also be geared toward overcoming prejudices about the quality of products made from secondary materials. These actions are discussed in detail in Chapter IV of the report.
The market development activities identified in this report are generally designed to influence local, state, and Midwest regional markets, but some of these actions may affect national markets as well. Although local, state and regional markets _ may be part of a national market situation-and therefore affected by national market circumstances-these "close-to-home" market development activities can positively influence secondary materials markets that are greatly determined by national circumstances. . ··
WHAT DOES THE WASTE STREAM LOOK LIKE? HOW MUCH IS BEING RECYCLED?
The single largest component of the U.S. waste stream is waste paper, followed by yard wastes. Together they make up alm~st 60 percent of the gross discards in the municipal waste stream. Metal, glass and plastics together compose nearly a quarter of discarded solid waste. Only three secondary materials have substantial recycling rateswaste paper at about 23 _ percent, aluminum at 25 percent, and glass at 8.5 percent recycled. Overall, about 11 percent of U.S. secondary materials are recycled. Details on the composition of the U.S. waste stream and the recycling rates for particular materials are contained in Table 1.
The amount of waste generated in Minnesota is estimated to be 4 million tons a year (SCORE 1989b). Unfortunately, Minnesota data detailing the amounts and types of waste generated, the composition of the waste stream, and the percentages of materials recycled do not exist, making direct comparisons with the national data difficult (MPCA 1988a, p. 11). However, several composition studies have been conducted in recent years for particular counties and the Twin Cities metropolitan area. One study, prepared by Resource Conservation Consultants with Pope-Reid Associates, compared four counties-Benton, Hennepin, Olmstead, and Wright-each varying in their estimates ofwaste stream composition (see Appendix 2 for details). By averaging
8
I I ,, ,i I I I ,, ,1
I I I I

I 1,
I I I I
I I I I I I I I I I
BACKGROUND
TABLE 1. COMPONENTS OF THE U.S. WASTE STREAM (gross discards)
(In million tons and percentage of the waste stream; also noted are percentages of each material recycled.)
Percentage Percentage Material U.S. of Waste Stream Recycled
Waste paper 65.7 41.0 22.6 Plastics 10.3 6.5 1.0 Glass 12.9 8.0 8.5 Ferrous metal 11.0 7.0 3.6 Aluminum 2.4 1.5 25.0 Other nonferrous metals 0.3 0.0 0.2 Rubber and leather 4.0 2.5 2.5 Textiles 2.8 1.8 0.0 Wood 5.8 3.7 0.0 Yard wastes 28.3 17.9 0.0 Other wastes 14.2 10.1 0.0
Total Wastes 157.7 100.0 10.8
NOTES: 0.0 percent indicates negligible amounts (less than 100,000 tons). Other wastes include food wastes and miscellaneous inorganics.
Source: Franklin Associates. 1988. Characterization of Municipal Solid Waste in the United States, 1960 to 2000 (Update 1988). Washington D.C.: U.S. Environmental Protection Agency, p. 21.
the available estimates of those counties, a very rough, but illuminating, set of percentages can be calculated for the state as a whole. These are included in Table 2, along with the Franklin Associates comparable figures for the nation.*
These statistics (assuming they are sufficiently accurate to be comparable) indicate that Minnesota's waste stream is very similar to that of the nation as a whole, with waste paper and yard wastes being major components of the state's garbage. However, food wastes are also a major component of the waste stream and Minnesotans appear to use less plastic and more glass than their national counterparts.
* Other studies, using varying methodologies during different periods of time, have yielded generally similar results. However, significant variations in the proportions of some materials are evident. For example, one study done by Cal Recovery Systems, Inc. for the Metropolitan Council of the Twin Cities Area, looked at the waste stream composition of the seven metropolitan counties and reported significantly higher percentages of plastics and lower percentages of glass and metal than the Resource Conservation Consultants/Pope-Reid study (Cal Recovery Systems, Inc. 1988, pp. 3-3 to 3-4). These variations underscore the need for more reliable and consistent data on Minnesota's waste stream composition.
9

MARKET STATUS REPORT
Unfortunately, no data exist to indicate the recycling rates for individual waste materials. The only figures available are gross estimates of the percentage of total wastes being recycled-a 4 percent rate (in 1987) for greater Minnesota and an 11 percent rate (in 1988) for the Twin Cities metropolitan area (SCORE 1989b). That puts the Twin Cities recycling rate at about the same level as the U.S. rate.
TABLE 2. COMPOSITION OF THE MINNESOTA AND U.S. WASTE STREAMS COMPARED
(By weight in percentages of the Minnesota and U.S. waste streams.)
Material
Waste paper Plastics Glass Metal Rubber Leather/textiles rubber and leather/textiles total
Wood Yard wastes Food wastes Miscellaneous/other
Minnesota Percentage
of Waste Stream
38.3 3.6 6.0 7.6 1.9 1.8 3.7 5.7
11.7 12.2 20.5
NOTES: N.C. indicates non-comparable data due to categorization.
United States Percentage
of Waste Stream
41.0 6.5 8.2 8.7
N.C. N.C. 4.3 3.7
17.9 7.9 1.8
Due to rounding, the Minnesota percentages do not total 100 percent.
Sources: Resource Conservation Consultants/Pope-Reid Associates, 1988, Intennediate Processing System Demonstration Project, St Paul, Minn.: Ramsey County, Washington County, and Northern States Power Company, p. 2-2; Franklin Associates, 1988, Characterization of Municipal Solid Waste in the United States, 1960 to 2000 (Update 1988), Washington D.C.: U.S. Environmental Protection Agency, p. 21.
10
I ,1 I ,I I I
I I I I I I I I I I

I I I I I I I ,, I I I I I I I I I I I
III. THE MARKETS FOR MINNESOTA'S SECONDARY MATERIALS
To date only two comprehensive surveys have been conducted on markets for Minnesota's secondary materials. The first was done in the mid-1980s by the Twin Cities Metropolitan Council as part of their effort to develop a Regional Solid Waste Policy Plan. The result was their 1986 Solid Waste Market Identification and Expansion Report. While intended to focus on the Twin Cities, much of its analysis is pertinent to the situation in Minnesota as a whole. It looks primarily at existing markets (in 1986) that utilize Minnesota's secondary materials.
A second comprehensive study was done later in the decade by Resource Conservation Consultants with Pope-Reid Associates for Ramsey and Washington counties and Northern States Power. It is contained in the 1988 report, Intermediate Processing System Demonstration Project (pp. 2-1 to 2-23), and was conducted as part of a feasibility assessment of an intermediate processing system for recyclables (specifically, to determine the potential markets for mechanically separated recyclables from a facility in Newport, Minnesota). The assessment was funded by those two counties and the Metropolitan Council's Demonstration Grant Program. The report's market survey is the most thorough and up-to-date analysis of market conditions for each of the major Minnesota secondary materials. It also contains information useful in considering potential as well as existing markets for the materials. In addition, it provides a Midwest frame of reference, in some cases examining the midwestem markets for these materials. This is particularly useful since the markets for Minnesota's recyclable materials are regional as well as local and national. Because of its Midwest perspective, the study may be useful to people from others states in the region who are interested in markets for secondary materials.
In addition to these two reports, a brief and partial market analysis is included in the Minnesota Pollution Control Agency's (MPCA's) State Solid Waste Policy ReponRecycling, Dec;ember 1988 (pp. XI-17 to XI-21).
Additional market analysis is expected to be developed in the next several years by the MPCA in cooperation with the Minnesota Office of Waste Management (MOWM) as part of their new responsibilities mandated under the 1989 SCORE legislation. The Metropolitan Council is currently commissioning an updated regional market analysis, due in March 1990 (the information from that study will be utilized by the MPCA and MOWM in their analysis). In the meantime, the three existing reports must be relied upon (despite whatever flaws and out-of-date information they may contain), and they are the primary sources for the following market summary.
11

MARKET STA TIJS REPORT
GENERAL FACTORS AFFECTING SECONDARY MATERIALS MARKETS
All three reports acknowledge that the market conditions for secondary materials tend to be volatile and cyclical, reflecting the general U.S. economic situation, but that the degree to which markets for particular materials are affected by U.S. trends varies.
In addition, the MPCA report notes that "as with all commodities, relatively high market prices have traditionally resulted in an increase in recyclables collected, which may then produce a glut on the market followed by a drop in prices caused by the excess supply." (MPCA 1988d, pp. XI-17 to XI-18). It is critically important to recognize this dynamic because the view of long-term prospects and problems for marketing particular secondary materials may be unduly influenced by the immediate short-term market situation, thereby giving an unrealistically optimistic or pessimistic outlook on the current situation and future prospects. It is important, therefore to look at these markets over the duration of their economic cycles in order to develop market strategies that will work over the long-term, through the general ups and downs in demand and prices for particular secondary materials.
The MPCA report also notes that since secondary materials generally compete with their substitutes-virgin materials-the prices paid for recyclables are affected by changes in the costs of manufacturing end-products from virgin materials (MPCA 1988d, p. XI-18). This, then, adds to the volatility of markets already affected by general U.S. economic conditions.
Several other factors that affect the marketability of secondary materials are noted in the MPCA report (and others). The quality of the materials delivered to their markets is one of these. Prices are affected by how "clean" the materials are-free of foreign substances ( e.g. metal rings on glass bottles and food, greases, and oils on paperboard) and properly separated (e.g. to avoid mixed colors in glass or glossy magazines in newspaper bundles). The quantity of material is also important. Large volumes ( e.g. truckloads) of materials, consistently delivered, not only reduce transportation costs,. but bring higher prices and greater profits per ton (MPCA 1988d, p. XI-20).
Transportation costs also affect the marketability of these materials. The MPCA report points out, for example, that because markets for recyclables are concentrated in the Twin Cities metropolitan area, counties in greater Minnesota are faced with relatively higher costs to transport the materials to their markets (as a result, some counties have developed creative ways to reduce transportation costs, such as using A VTI trainees to deliver recyclables at reduced· rates or arranging "back hauls" of recyclables for the return trips after truckers' primary hauls have been made) (MPCA 1988d, p. XI-21).
Transportation is an especially important factor to the Midwest, located far from the two coasts-and their access to international markets (including the Far East, Mexico, South America and southern Europe}--and considerable distance from some national markets. At the same time, several midwestern states have access to Great Lakes and Mississippi River shipping, which could provide some transportation advantages if there were sufficient material for bulk handling (Nolan, McGough, and Hancock-pers. comm. with author, September/October 1989).
12
I I I I ·I I i /I I I I I I I I I I I I

I I I I I I I I I, I I I I I I I 1. I I
THE MARKETS FOR MINNESOTA'S SECONDARY MATERIALS
Other factors that influence the costs of transportation include the availability of container freight shipping, particularly for exports, and the presence of differential shipping rates which often favor virgin materials over their secondary materials counterparts (Gilkeson, pers. comm. with author, November 20, 1989). ·
THREE TYPES OF MARKET CONDITIONS
The Metropolitan Council's 1986 Solid Waste Market Identification and Expansion Report identifies three types of market conditions that prevail over Minnesota's recyclable materials and notes examples of materials affected by each type of market (Metropolitan Council 1986, pp. 13-14 ).
First, the markets for some materials-waste paper, aluminum and ferrous metals-are affected strongly by national market trends because these materials are essentially national commodities. The demand and prices for these are closely tied to, and affected by, national market trends and the end-users are generally national rather than local. In such cases, local market expansion is unlikely to significantly affect the demand for, or prices of, these materials at the end markets. One notable exception to this analysis is the presence of Waldorf Paper Company of St. Paul, which since the time of the 1986 Metropolitan Council study has played a key role (as a local end-user) in absorbing much of the current oversupply of old newsprint and other waste paper in Minnesota.
Second, some materials markets-including those for glass and old corrugated containers-are affected by national trends but have strong local markets. The primary markets for these materials in Minnesota are in the Twin Cities metropolitan area. Materials are recovered and processed locally, even though the finished products are marketed outside Minnesota.
Third, some materials markets-such as those for waste motor oil and waste paper used for cellulose insulation-are, for all practical purposes, strictly local markets. The prices for these materials are set locally based on the local demand for the materials. Collection, processing, and reuse occur locally and are thus less affected by national economic trends (although they can be affected by federal regulation such as in the federal designation of oil as a hazardous waste).
Because of the nature of these three types of market conditions, some secondary materials have more stable locarmarkets (e.g. price and demand) than others. According to the Metropolitan Council's analysis, these markets will be affected by "future changes in market conditions, the solid waste management system, technological advances, and public or private efforts to improve existing or new markets." Even so, according to the Council's report, "nearly all recyclable materials have some local market. For the purposes of collection, the questions are how well developed is the market and how soon is it likely to be saturated?" (Metropolitan Council 1986, pp. 13-14). This suggests that enhancing local markets for secondary materials could be advantageous, even for those markets significantly affected by national circumstances.
13

MARKET STATUS REPORT
MARKET OBSERVATIONS FOR PARTICULAR SECONDARY MATERIALS
The 1988 Resource Conservation Consultants/Pope-Reid Associates (RCC/ Pope-Reid) study, Intermediate Processing System Demonstration Project, provides the most up-to-date review of the market conditions for each of the major Minnesota secondary materials. The key findings of the study are summarized below, along with pertinent information from the other market surveys and other sources (including for secondary materials not examined in the RCC/Pope-Reid study). Each material is discussed with respect to its overall market, the current demand for the material and the capacity to process it, market stability, and prices for the material. A brief set of key conclusions, gleaned from this summary, is contained in the next section of this paper and a table of the market findings of the RCC/Pope-Reid study is included in Appendix 3.
Waste Paper
14
• The Market: Waste paper markets vary by type---old newspapers, corrugated, high-grade waste paper and mixed paper. In general, large quantities of waste paper are not used in Minnesota. However, a strong market exists in neighboring Wisconsin,. the nation's third largest waste paper consumer (after California and Ohio). In fact, about 8 percent of the waste paper used in the U.S. is purchased by Wisconsin producers alone (RCC/Pope-Reid 1988, p. 2-4).
An increasingly important Midwest market factor is the sale of waste paper to foreign consumers. Exporting secondary fibers from the Midwest has been cost-prohibitive due to the expense of shipping fibers to East Coast or West Coast piers. However, changes in the transportation system-particularly the use of trains designed to carry export containers only-have opened up some export markets to Midwest waste paper processors (RCC/Pope-Reid 1988, p. 2-4). Mixed paper is an example of a material whose primary market is export (although some local markets-such as animal bedding operations-do exist, they do not use large volumes of the material) (MPCA 1988d, p. XI-20).
• Demand and Capacity: There is a great deal of concern about marketing Minnesota's waste paper. Much of this concern is driven by the recent glut of newspapers brought on by increasing volumes of old newsprint, changes in foreign markets, and cyclical trends in the waste paper industry. This glut is not exclusively a Minnesota or mid western phenomenon: It is possible, however, that it is a short-term problem, which over the next several years may be ameliorated by anticipated increases in industry use of waste paper and expanded foreign markets (author's pers. comm. with various public and private officials involved with paper recycling programs and marketing, October 1989).
In fact, the Midwest regional demand for secondary fibers is expected to increase in the coming years according to the RCC/Pope-Reid analysis. That report identifies thirty major consumers of secondary materials in Illinois, Iowa, Minnesota and Wisconsin, and notes the existence of about a dozen cellulose insulation manufacturers in the region that purchase old newspapers.
I I I I I I I ,, I I I I I I I I ,, I I

I I I I I I. I I I. I II a l I I I I I
THE MARKETS FOR MINNESOTA'S SECONDARY MATERIALS
The report contains figures demonstrating that the expected 1990 demand for newspapers, corrugated and office paper exceeds 1986 consumption by 11
· percent, 10 percent and 9 percent, respectively (RCC/Pope-Reid 1988, p. 2-5).
A soon-to-be-released report of the American Paper Institute's Solid Waste Task Force suggests that even with anticipated increases in waste paper recovery rates, the paper industry will be able to utilize virtually all the recovered paper by the year 2000 given expected plant capacity expansion and increased foreign markets (Hancock, pers. comm. with author, October 10, 1989).
• Stability: Several major waste paper consumers in the region have recently installed new equipment and expanded capacity, and several other mills have announced similar plans. At the same time, however, demand for and manufacture of cellulose insulation is declining regionally and nationwide (RCC/Pope-Reid 1988, p. 2-5). See Appendices 4 and 5 for a list of waste paper consumers and their locations in the region.
• Prices: The waste paper market is very volatile, and over the last five years Midwest waste paper prices have risen or fallen dramatically in short periods of time. In 1987 prices of some markets reached record levels, although prices in the Midwest did not attain the levels achieved on the West Coast (RCC/ Pope-Reid 1988, p. 2-8). For example, market prices for newspapers ranged from $20 a ton to $60 a ton between 1984 and 1987 (MPCA 1988d, p. XI-18). See Appendix 6 for historical fluctuations in waste paper prices.
Plastics
• The Market: There are two types of markets for post-consumer scrap plastics. The .dominant market requires suppliers to deliver plastics separated according to resin or product. HDPE and PET are the principal source-separated plastics desired by reclaimers, and milk jugs (HDPE) and soft drink bottles (PET) are the predominant items targeted. After washing, drying and pelletizing, the clean regrind is then sold to a wide variety of HD PE and PET users. Recycled HDPE is employed in toys, drain pipes, flower pots and other applications. Reclaimed PET is utilized by fiber producers for use in carpet, strapping, clothing, fiberfill and other products.
A less sizable market entails the recycling of mixed or unseparated thermoplastics. Typically this entails granulation, reheating and molding. Th.ese reclaimers produce dimension lumber for use in pallets, stadium seating, parking lot bumpers and other durable items (RCC/Pope-Reid 1988, p. 2-19).
· • Demand and Capacity: Plastics are a significant and rapidly growing part of the waste stream projected to increase from 7 percent of the national waste stream (by weight) in 1984 to almost 10 percent in the year 2000 (MPCA 1988d, pp. XI-18, XI-19). Even so, the demand and processing capacity for clean, separated HDPE and PET plastic scrap exceeds the present level of recovery. Recovery levels are very low. Milk bottles represent 25 to 30 percent of overall HDPE resin sales (almost 8 billion pounds in 1987), yet only 1
15

MARKET STATUS REPORT
Glass
16
or 2 percent of these bottles are recovered for recycling. Similarly, PET soft drink bottles are just 40 percent of polyester thermoplastics use, though about 20 percent (140 million pounds per year) are recovered for recycling; virtually all from states using container deposits. In other words, only 8 percent of polyester plastics are recycled (RCC/Pope-Reid 1988, p. 2-20).
The demand for mixed thermoplastics is very small and processors in Iowa, Michigan and elsewhere in the U.S. are able to acquire sufficient supplies of the scrap material. The major barrier to increased demand for mixed thermoplastics appears to be the need for increased utilization of plastic lumber products (RCC/Pope-Reid 1988, p. 2-20).
• Stability: The market for source separated HDPE and PET is stable and growing. It will take more time before mixed thermoplastics recycling is a stable, large-scale element of the Midwest recycling industry (RCC/Pope-Reid 1988, p. 2-20).
• Prices: Prices for source separated HDPE and PET scrap tend to reflect the cost of virgin resin. As a result, HDPE prices have generally risen and fallen in the last several years while "deep price discounting" by PET resin producers has resulted in lower but stable prices for PET scrap (RCC/Pope-Reid 1988, p. 2-20).
In addition, prices can be related to the volume sold. HDPE delivered to Midwest processors has ranged from $.05 to $.15 per pound in 1986 and 1987 while PET scrap typically got from $.04 to $.12 per pound delivered. While prices can get up to $300 per ton, the cost to collect, process, store and ship these bulky, lightweight containers may not be covered by the price paid for scrap (RCC/Pope-Reid 1988, pp. 2-20 to 2-21).
• The Market: The market for recycled glass containers is dominated by container producers, with over 90 percent of the reclaimed containers being purchased by bottle-makers. The comparable figure for the Twin Cities area is even higher due to its distance from alternative markets. There are eight glass container plants located in Minnesota, Illinois, and Wisconsin, representing 10 percent of U.S. glass container production capacity. These facilities purchase scrap glass bottles and jars (cullet) for use in the manufacture of new con-
' . tamers.
The market for mixed-color cullet in the Midwest is very small. The OwensIllinois plant in Streator, Illinois accepts some mixed cullet, but open purchases are not made. The major mixed cullet market is in California, where it is used to make dark green wine bottles (RCC/Pope-Reid 1988, pp. 2-9 to 2-11). See Appendices 7 and 8 for a list of cullet companies and their consumption and the location of these in the region.
• Demand and Capacity: The recycling consumption level at the Midwest processing plants is approximately 25 to 30 percent of raw material needs. In combination, near-term demand exceeds supply by approximately 100 percent,
I I I I I I I I' I I I I I I I I I I I

I _I
I I I I I I I I I I I l I I 1. I I
THE MARKETS FOR MINNESOTA'S SECONDARY MATERIALS
although several purchasing executives interviewed by RCC/Pope-Reid felt that cullet could provide as much as 70 percent or more of raw material needs (representing excess demand of at least 180 percent above existing consumption). The Anchor Glass plant in Shakopee could increase cullet consumption by about 40,000 tons annually (RCC/Pope-Reid 1988, pp. 2-11, 2-12).
• Stability: Glass container shipments fell more than 6 percent between 1980 · and 1986 (primarily due to a decrease in the use of non-returnable beer bot
tles), with many container plants forced to close, including one in Rosemount, Minnesota. This trend has abated, with shipments rising modestly in both 1986 and 1987. U.S. Department of Commerce reports suggest that glass container industry retrenchment and consolidation has stabilized (RCC/Pope-Reid 1988, p. 2-12).
• Prices: There is a two-tier price schedule for cullet. Small suppliers are paid a standard over-the-scale price for delivered cullet. Since the early 1970s (when cullet was first purchased from the public) the price has risen very slowly, climbing from about $20 per ton to $40 to $50 per ton today. Anchor Glass of Shakopee paid $45 per ton for cullet in 1987.
Container producers also buy sizable quantities of the raw material from cullet suppliers-scrap glass containers from bottlers and others. The cullet is then processed to a furnace-ready specification for which bottle-makers are sometimes willing to pay more thari for unprocessed cullet. Owens-Illinois, for example, has instituted a special program to attract more communities to collect bottles and jars. They pay $70 per ton at the Streator plant for colorsorted cullet supplied by specific programs or firms (RCC/Pope-Reid 1988, p. 2-12).
Aluminum
• The Market: Used beverage containers are a major form of recyclable aluminum (especially in residential solid waste) where beer and soft drink cans are the prevalent form of aluminum scrap. Primary aluminum producers have developed nationwide recovery systems for the purchase, processing, and remelting of these containers.
Recycled aluminum markets are strong, and the material is eagerly sought by primary aluminum producers and secondary smelter operators, although mixed aluminum scrap is not as valuable as sorted material (MPCA 1988d, p. XI-20; RCC/Pope-Reid 1988, p. 2-13).
• Demand and Capacity: The demand and processing capacity for scrap beverage containers exceed supply. Although few scrap cans are sold to
· foreign reclaimers, domestic demand continues to grow. The same is true for other forms of aluminum scrap, although export demand is considerably greater (as much as one-fifth of the market for some grades). One "market negative" is the decline in recent years in the number of independent secondary aluminum smelters, particularly in the Midwest (RCC/Pope-Reid 1988, p. 2-14).
17

MARKET STATUS REPORT
• Stability: With primary aluminum ingot valued in the 1980s between $1,000 to $2,000 per ton, scrap aluminum demand is very stable. In particular, aluminum's high value has resulted in a strong worldwide scrap market where the cost of shipping to distant consumers is a relatively small part of the overall transaction. However, scrap prices rise and fall rapidly (RCC/Pope-Reid 1988, p. 2-14).
• Prices: The RCC/Pope-Reid report shows a wide variation in the price of aluminum cans over time: $.34-$.40 per pound in January 1987, $.50-$.53 per pound in July 1987, and $.60-$.70 per pound in January 1988 (among other prices included in a five-year summary from America Metal Market) (RCC/Pope-Reid 1988, p. 2-14).
Ferrous Metals
18
• The Market: The major forms of ferrous scrap in municipal solid waste are tin cans, enameled metal appliances (white goods), and steel containers. The Minnesota market consists of one minimill-North Star Steel in Newportand a network of scrap collectors and brokers which rely heavily on auto hulks for supply. Scrap that is not processed by North Star Steel is exported to mills in Chicago, Indiana, Nebraska, the Far East and Mexico.
Most tin cans recovered in Minnesota are shipped to out-of-state consumers, purchased by detinners who strip the valuable tin from the ferrous, producing two recyclable products: tin and steel. The nearest detinners are in Chicago, Illinois and Gary, Indiana. In addition, nineteen steel mills in the U.S. now purchase and melt can scrap to make new steel. The nearest consuming mills are five in Indiana and Illinois (MPCA 1988d, p. XI-20; RCC/Pope-Reid 1988, p. 2-15).
• Demand and Capacity: The demand for tin cans is strong. For example, AMO Resources (formerly Vulcan Materials) of Gary, Indiana processes 120,000 to 145,000 gross tons of scrap tin cans annually but could process significantly greater volumes of these cans. AMO Resources has developed a small modular processor/detinner for installation in Newport, Minnesota. This should strengthen regional demand and capacity for ferrous scrap cans (RCC/ Pope-Reid 1988, p. 2-16; Gilkeson, pers. comm. with author, November 20, 1989).
North Star Steel could process about 4,200 gross tons of tin cans each year. In addition, the five can-purchasing steel mills in Illinois and Indiana are some of the nation's largest ferrous scrap consumers. As a means of fighting the trend away from steel toward aluminum, these companies have pledged to buy separated can scrap from municipalities and recycling processors (RCC/PopeReid 1988, p. 2-16).
At present production levels, North Star Steel could accept 300 to 350 gross tons per month of tin cans without affecting negatively the steel quality, and up to 2,000 gross tons per month of white goods and steel containers. North Star Steel's demand for white goods and steel containers is strong if material
I I ,, I I 'I I I I I I I
-I I I I I I

I I I I I I I I I Tires
l1
I I I I I I I\ I I
THE MARKETS FOR MINNESOTA'S SECONDARY MATERIALS
specifications (related to the elimination of scrap containing PCBs) can be met. While the mill requires 40,000 gross tons of ferrous scrap per month, only 16,000 to 20,000 gross tons of scrap metal (mostly auto hulks) are received and shredded at the mill monthly. So the remaining 20,000 to 24,000 gross tons represent additional monthly demand for scrap metal-some of which could be met by white goods and steel containers (RCC/Pope-Reid 1988, pp. 2-15, 2-16).
• Stability: The stable demand for scrap tin cans should continue into the future. In recent years the recovery of white goods has declined in many parts of the U.S. due to the expense of collecting and processing the material and regulatory concerns over PCBs in capacitors. However, this trend has reversed in recent years and should continue to stabilize as additional information on PCB use in white goods becomes available (RCC/Pope-Reid 1988, p. 2-16).
• Prices: Scrap tin cans were purchased in the Midwest for about $45 to $75 per gross ton (FOB the detinning plant) between 1986 and 1988. White goods and steel containers are low valued forms of ferrous scrap. In late 1987 /early 1988
· North Star Steel paid $15 to $20 per gross ton for whole material delivered to the mill (RCC/Pope-Reid 1988, p. 2-16).
• The Market: About 10 to 15 percent of Minnesota's discarded tires are retreaded and resold. The remaining tires are typically stockpiled on land, although several firms process scrap tires (RCC/Pope-Reid 1988, p. 2-17).
There was much optimism about the potential of the now defunct Rubber Research Elastomerics Tirecycle plant in Babbitt, Minnesota, designed to consume three million scrap tires annually. The plant, which received substantial state and local funds, opened in early 1987. But after defaulting on its loans it was vacated in July 1989 and is now in the possession of St. Louis County. The county is hoping to sell or lease the plant. At its peak it employed more than fifty people shredding discarded auto tires and producing crumb rubber and rubber polymers for industrial use (RCC/Pope-Reid 1988, p. 2-16; Duluth News-Tribune, July 29, 1989).
Several other processors remain, but their product is tire-derived fuel. Tonson, Inc. and Waste Recycling, Inc. are two such firms, located in Andover, Minnesota. Tonson has stored several million tire carcasses on the site, while Waste Recycling owns and operates the processing facility. The shredded rubber is used at the Nekoosa Packaging mill in Tomahawk, Wisconsin. Waste Recovery, Inc., which operates tire-derived fuel production sites in two other states, may establish a similar fuel preparation plant in Minnesota. A test burn of its product was recently completed at the Champion International paper mill in Sartell, Minnesota. Waste Recovery may use as many as two million tires annually at a Twin Cities area plant. Maust Fiber Fuels, of Preston, Minnesota, also processes tires into a fuel product, and Northern States Power (NSP) has expressed interest in using tire-derived fuel at several coal-fired boilers (RCC/Pope-Reid 1988, p. 2-17; Gilkeson, pers. comm. with author, November 20, 1989).
19

MARKET STATUS REPORT
• Demand and Capacity: The supply of scrap tires far outstrips demand in the U.S. and in Minnesota. While considerable investment is being made in tire recycling technologies, there remain nearly one million tons of scrap tires available in the U.S. for recycling (RCC/Pope-Reid 1988, p. 2-18).
• Stability: Scrap tire recovery is economically risky. Consumer demand for retreaded tires continues to fall. Swings in the price of competitive solid fuels affects producers of tire-derived fuel. Products like those that were produced at the Babbitt plant have not yet received widespread industry acceptance. Other processing technologies, such as pyrolysis, are uneconomical in many cases (RCC/Pope-Reid 1988, p. 2-18).
• Price: Few scrap tires are purchased for recycling. Some facilities will accept them and others charge a tipping fee (the Tonson operation charges $44 per ton) (RCC/Pope-Reid 1988, p. 2-18).
Waste Oil
• The Market: More than two million gallons of motor oil are improperly disposed of each year. Over 95 percent of the used oil that is commercially collected in Minnesota is sold to asphalt plants for use as fuel in readying hot mix (MOWM 1989c and 1989d). The demand for waste oil has been reduced by federal and state regulation of the burning of unprocessed oil. Manyrerefiners have been forced to close, unable to cost-effectively process waste oil while complying with environmental standards (RCC/Pope-Reid 1988, p. 2-21).
In order to seek additional market options for used oil, in 1988 the State of Minnesota awarded a $50,000 matching grant to Kinetics Technology International Corporation of California to study the feasibility of developing a used oil fuel processing/re-refining facility in Minnesota. That analysis is expected in December 1989 (MOWM 1989d; Nolan, pers. comm. with author, November 21, 1989).
• Price: The price paid for used oil has fallen in recent years. Many collectors have had to give the oil to reclaimers and occasionally even pay for removal (RCC/Pope-Reid 1988, p. 2-22).
Building Materials (demolition wastes)
20
• The Market: The market for building materials (demolition wastes) is dominated by asphalt reclaimers. Asphalt from road projects is often reused as a roadbase in new highway construction. Sometimes scrap lumber is used as shredded fuel in power boilers. In addition, a few firms also shred and pulverize rock, rubble and other demolition wastes to use as aggregate replacement (RCC/Pope-Reid 1988, p. 2-21).
• Demand: Generally these materials are reused if disposal costs are high and the ability to site and operate demolition landfills is limited by ground water contamination problems and lack of available land (RCC/Pope-Reid 1988, p. 2-21).
I I I I I I I I I ,, I I I I I
I

I I I I I I I I I I I I I I I I I I I
THE MARKETS FOR MINNESOTA'S SECONDARY MATERIALS
• ~: No discussion included in any of these reports.
Yard Wastes
• The Market: This is a high-volume waste item, little of which is currently being recycled despite some beginning efforts. The primary markets for compost are from the commercial sector, including nurseries and landscapers .
. Other markets include golf courses, parks and highway construction. A 1983 survey indicated that 25,000 cubic yards of yard waste are used annually in the Twin Cities region-a small portion of total yard wastes. All state agencies are required by a Governor's Executive Order on Compost to give preference to the use of compost over other soil amendments when compost is of equal price and performance (Metropolitan Council 1986, pp. 10-11 ).
• Demand. Capacity. Stability and Price: No discussion included in any of these reports.
Used Batteries
• The Market: Prior to the mid-1980s, almost all of Minnesota's spent lead-acid batteries were recycled. But then the market price for lead dropped and new environmental regulations were promulgated, resulting in a dramatic decline in the recycling rate and a significant rise in the improper disposal of these · environmentally hazardous items. In response to these problems, the State of Minnesota outlawed the landfill disposal of lead-acid batteries, effective January 1, 1988. In 1989, the Minnesota Legislature enacted provisions requiring battery retailers to accept and recycle spent lead-acid batteries. The law also required consumers to pay a $5 surcharge on the purchase of any new battery unless they return to the retailer a spent battery at the time (or within thirty days) of purchase (Spent Lead Acid Battery Task Force 1987; MOWM 1989b; SCORE 1989a, pp. 393-394).
These spent batteries are then picked up by scrap dealers, battery manufacturers or battery haulers to be transferred to a secondary lead smelter. There, the lead, acid and plastic or rubber casings from the batteries are recycled. One Minnesota smelter (located in Eagan) serves a large portion of the Midwest including North Dakota, South Dakota, Iowa, Wisconsin and Minnesota (Spent Lead Acid Battery Task Force 1987, pp. 1-2).
• Demand and Capacity: The effect of these state actions on the demand for these recycled batteries, and the capacity of industry to handle them, is unknown at this time.
• Prices: Prior to the mid-1980s spent lead-acid batteries were worth $5 to $6 a piece. Then prices dropped to $.25 to $.60 a piece in 1987 (Spent Lead Acid Battery Task Force 1987, p. 3). The effect of the new law on spent battery prices is unknown at this time.
21
MARKET STATUS REPORT
Textiles
• The Market: Textile recycling is an international industry with three distinct markets-reused clothing, rags and recycled fiber. Major products from this material include wiping cloths; soundproof materials in automobiles; stuffing for furniture, mattresses and toys; carpet backing; lining for ironing board covers; and similar products.
Minnesota has six textile recycling companies: Minneapolis Ragstock Company, Inc., Brotex Inc., Land-0-Nod (all in the Twin Cities), Fabricraft (in Cokato), Miller Waste Mills (in Winona), and St. Peter Woolen Mills in St. Peter. An estimated 85 percent of all textiles are recycled (Metropolitan Council 1986, p. 10).
• Demand : The supply of textiles for reuse and recycling markets exceeds demand. Most textile materials, whether of natural or synthetic fibers, are reused or recycled (Metropolitan Council 1986, p. 10).
• Prices: While the demand for recycled textiles is stable, the price paid for them is less than what was paid in the past, declining from $.08 per pound some years ago to $.01 to $.02 per pound in 1986 (Metropolitan Council 1986, p. 10).
INTERMEDIATE AND END-USERS OF SECONDARY MATERIALS
Another way to examine the markets for secondary materials is to identify the users of the materials. In June 1988 the Minnesota Waste Management Board issued its Markets for Recyclable Materials Directory. It shows that Minnesota has numerous intermediate users (brokers and processors) and end-users (manufacturers) who purchase or accept secondary materials. Table 3 lists the number of users identified in the directory for each type of material purchased or accepted. Significant subcategories are broken out where specified in the directory (some directory subcategories are omitted). While this list may not be complete or fully up-to-date, it does provide a useful impression of the existing Minnesota markets for particular types of secondary materials.
22
I I I I I I I I I I I I I I I I I I I

I I I I I I I I t I I I I I I I I I I
THE MARKETS FOR MINNESOTA'S SECONDARY MATERIALS
TABLE 3. INTERMEDIATE AND END-USERS OF SECONDARY MATERIALS LOCATED IN MINNESOTA
Number of Users
Waste Paper Total users listed Old newspapers Corrugated High-grade Mixed paper
Plastics
Glass
Metals
Total users listed PET HDPE
Total users listed Color sorted Color mixed
Total users listed Auto parts (and autos) Ferrous Aluminum (including cans) Aluminum cans "Tinned" food cans/bi-metal beverage cans White goods
Batteries (total users listed)
Rubber (total users listed)
Oil (total users listed)
Textiles (total users listed)
42 26 28 18 6
15 10 7
16 13 2
208 120 48 48 41 14 4
7
4
1
4
Construction Materials ( total users listed) 8
Wood (total users listed) 7
Source: Minnesota Waste Management Board. 1988. Minnesota Markets for Recyclable Materials Directory. St. Paul, Minn.: Minnesota Office of Waste Management.
23

MARKET STATUS REPORT
WHAT EXISTING MARKET ANALYSES SAY-SOME KEY CONCLUSIONS
The existing market analyses-particularly the RCC/Pope-Reid study-present a generally optimistic picture of the market potential for Minnesota's secondary materials especially in the long term. This is true for most of Minnesota's secondary materials including waste paper, plastics, glass, aluminum, ferrous metals, and textiles. For these materials, markets exist, demand is strong or moderate, the existing or anticipated capacity to reprocess and remanufacture them exceeds their current supply, and new products can be (and are being) made out of these old materials. However, others, including certain plastics (those other than PET and HDPE), used oil, yard wastes, spent batteries, and discarded tires are plagued with low demand and prices or are not easily made into new end-use products.
In addition to this overall picture, several key conclusions about each of the major secondary materials can be gleaned from the existing market analyses:
24
• Over time the demand for waste paper and the capacity to process it should meet anticipated increases in supply, even though there currently is (and may periodically be) a glut of old newspapers. However, waste paper prices are volatile so the economics of collection and processing will vary considerably over time.
• Even though the amount of plastic trash is growing, the demand for this material (particularly for PET and HDPE) and the capacity to process it exceed the current supply. Prices for PET and HDPE scrap reflect the costs of virgin resin, and so rise and fall accordingly. The main problem is that these milk and soda pop containers are bulky and lightweight so the costs to collect, process, store and ship these materials often makes them uncompetitive with their virgin materials counterparts.
• The demand for glass, particularly color-sorted glass, is strong, and the capacity to process it far exceeds the current supply. More needs to be collected.
• The demand for recycled aluminum is strong and the demand for scrap beverage containers exceeds the supply. Unfortunately, aluminum scrap prices rise and fall rapidly, creating instability in the market.
• The demand for ferrous metals, especially tin cans, is strong. The capacity to process ferrous exceeds current supply. This stable demand should continue into the future.
• Almost all Minnesota tires-millions of them-are being stockpiled on land, and there is essentially no demand for them. While an increasing number of tires may eventually be burned as fuel, at the current time tire collectors get no renumeration or actually pay for disposal.
• The demand for waste oil is declining due to state and federal regulations and many collectors have to give it away or pay for its removal.
• Building materials are reused only when on-land disposal is either costly or difficult because of possible ground water contamination or limited space.
I I I I I I I I I I I I I
I I I I

I I I I, I I I I
' I I I I I I I I I I
THE MARKETS FOR MINNESOTA'S SECONDARY MATERIALS
• While potential markets exist for yard wastes, little of this material is being recycled or composted despite some beginning efforts to utilize. this highvolume waste.
• After the demand for spent lead-acid batteries dropped in the mid-1980s-due to a decline in the price for iead and new environmental regulations-the State of Minnesota took actions to outlaw landfill disposal of these batteries and to require retailers to accept and recycle them. The effects of those actions on demand, capacity, and prices are unknown at this time.
• The supply of textiles for reuse or recycling exceeds demand. The prices paid for them now is less than in the past, despite stable demand.
25

I,_
-1
I I I I I I I I
-I I I I I I I I I I
I

I I I I I I I I I I I I I I I I I I I
IV. BUILDING A STRATEGY FOR ACTION
The existing market analyses reviewed in Chapter III provide a generally optimistic picture of the market potential for Minnesota's secondary materials. Yet, we know these materials are not currently being fully utilized-that some are not being collected, that others are not being reprocessed and remanufactured, and that some, like old newspapers, are badly in oversupply. If most of these materials have market potential, why aren't more of them reaching their markets, and what can be done about that?
Chapter III · is a strategy discussion, including the identification of possible impediments to full market utilization, discussion of who is responsible for building a strategy for action, a listing of possible options for enhancing market utilization of Minnesota's secondary materials, a brief review of Minnesota programs to enhance market utilization of these materials, and an outline of several key process issues that need to be addressed when beginning to develop a marketing strategy.
While Chapter III is only a sketch of the strategy considerations, it is hoped that this section of the paper provides a framework for discussing potential market enhancements and a "jumping off point" for formulating a secondary materials market strategy for Minnesota.
WHAT ARE THE IMPEDIMENTS TO MARKETING MINNESOTA'S SECONDARY MATERIALS?
One thing is clear from the market analyses reviewed in Chapter III of this report-most Minnesota secondary materials have market potential, but some do not. When examining the possible impediments to full market utilization of secondary materials, these differences in potential must be recognized. The impediments-and the actions to overcome them-are different for materials that have market potential and those which don't.
Impediments for Materials With Market Potential
Even those secondary materials that have potential markets (particularly waste paper and plastics) are not fully reaching those markets. Nor is there any assurance whatever that increased amounts of these materials resulting from future collection efforts will find their markets. Obviously, when there is an oversupply of secondary materials, even when markets exist, there must be impediments blocking the way to · their full market utilization.
Several key impediments are suggested by the market analyses reviewed in Chapter III, which help explain why some secondary materials are not currently reaching
27

MARKET STATUS REPORT
their potential markets. They include inherent price instability related to cyclical gluts in materials and price swings in their virgin materials counterparts ( especially for waste paper, plastics, and aluminum). This means that at least some of the time the price of the secondary material is more expensive than its virgin counterpart, especially given the costs of collection, processing and transportation (particularly for waste paper and plastics). In some cases these price instabilities and cost disadvantages are related to an unreliable flow or insufficient quantity of material collected (especially in the cases of plastics, glass, and aluminum). In addition, inadequate quality may also be responsible for less than optimal utilization of the material (especially for waste paper, plastics, and glass).
Impediments for Materials with Limited Market Potential
Those materials with limited market potential-certain plastics, used oil, spent batteries, yard wastes, and discarded tires-may also suffer from price instability due to cyclical trends and competition with virgin counterparts, but they also face other significant impediments. They may be hazardous materials (such as used oil and spent batteries) and therefore subject to state and federal regulations which limit their market potential. Or they may not easily be made into new end-use products (especially the case with used tires). In other cases the sheer volume of the materials makes it difficult to collect and use what is generated (particularly true of yard wastes and some plastics).
WHO HAS RESPONSIBILITY FOR BUILDING A STRATEGY FOR OVERCOMING THESE IMPEDIMENTS?
It is not enough to simply assume that existing market forces, left unto themselves, will take care of the growing volume of secondary materials-they haven't and they won't. While the "free market" has responded to.the increased demand for, and volume of, secondary materials,_ there are some market "imperfections" and considerable market "lag" that require public sector involvement. In addition, the motivation for enhancing the marketability of Minnesota's secondary materials is not strictly-or even primarily-economic. In fact, fundamentally it derives from very important public needs and concerns in response to a growing solid waste crisis, environmental problems associated with landfilling and incineration, and wasteful use of limited natural resources. Public and private coordination and cooperation are critically important given the magnitude and significance of these problems.
Nor is the responsibility for responding to these problems primarily a public one, even though government has long taken responsibility for, and borne most of the costs of, waste disposal. The solution to these problems is generally an economic one requiring market responses to the growing demand for, and supply of, recycled materials.
So enhancing the marketability of Minnesota's secondary materials is the responsibility not just of industry or state government and local jurisdictions. It is a responsibility shared by all three of those parties along with nonprofit entities (including foundations, trade associations, research organizations and advocacy groups) and research and educational institutions (including private industry research groups and public and private colleges and universities). Each of these parties has particular capabilities and limitations, certain legally-designated responsibilities, and important perspectives that can help solve Minnesota's solid waste crisis. Vigorous discussion among all these par-
~ 28
I I I I I .., I I I I I I I I I I I I I
I I I I I I I I I I I I I I I I I I I
BUILDING A STRATEGY FOR ACTION
ties is an important first step in developing realistic and workable strategies for action. Partnerships among the various parties-shared responsibilities and actions-will be at the heart of any successful strategy.
HOW CAN WE OVERCOME THESE IMPEDIMENTS AND BETTER UTILIZE OUR MARKET OPPORTUNITIES?
Both classes of secondary materials-those with market potential and those with limited markets-face differing impediments and require different types of action to overcome those barriers. For materials with market potential, four major types of action may be needed to: increase and stabilize price and demand, increase the quantity and reliability of the materials flow, enhance the quality of the materials presented to their markets, and improve collection, processing and transportation systems.
For the materials with limited markets--certain plastics, used oil, spent batteries, yard wastes and discarded tires-the problem is more complicated. While they, too, may require the four types of action mentioned above, they also require actions to foster market development, develop new products, and foster reuse of undesirable materials.
In addition, the marketability of all secondary materials is to some degree impeded by prejudices against new products made from trash-because of concerns · about quality and cleanliness. So an eighth type of response is needed-actions to overcome. prejudices about the quality of new products made from secondary materials.
A number of specific options, related to each of these eight types of actions, are identified below (drawn in large part from the general literature about secondary materials markets). The specific materials for which options seem particularly appropriate are noted.
Actions to Increase and Stabilize Price and Demand
• Public and private procurement--designed to increase and stabilize the demand for materials. Applies to end-use products made from all Minnesota secondary materials, but especially waste paper, yard wastes, and remanufactured tires.
• Stockpiling collected materials--establishment of facilities where materials can be stored for the duration· of short-term supply gluts or cyclical downturns in demand or price. Particularly applies to newspapers, plastics, and aluminum.
• Direct marketing of materials-marketing by municipalities or other local governments, perhaps cooperatively, in order to eliminate profit share loss that would otherwise go to brokers (currently being done with newspapers by some Twin Cities municipalities because of the newspaper glut). This would be most practical with high-demand but price-volatile, materials, particularly newspapers, glass, and metal beverage containers.
• Public subsidies and price supports----designed to ensure materials marketability despite periodic downturns in price or undesirability of the material. Programs should reflect the "avoided cost savings" of not having to dispose of the materials in some other way. Particularly applies to plastics, yard wastes, tires, waste oil, and batteries.
29

MARKET STATUS REPORT
• Modification or elimination of public subsidies for virgin materials--to remove unfair competition from the secondary materials counterparts. Key examples of such subsidies are the forest management activities of the U.S. Forest Service, oil and other natural resource depletion allowances, and oil market arrangements that keep U.S. petroleum products-including plastics resins-well below the world price. Such changes (which would involve federal action) apply particularly to waste paper and plastics, whose virgin counterparts are heavily subsidized.
• Imposition of packaging fees-nominal fees on packaging imposed to create an incentive to manufacturers to use recycled and/or recyclable materials. Applies to packaging made from all Minnesota secondary materials, but especially from paper, plastics, metals, and glass.
• Development of new products and new markets-to augment existing product and market potential, particularly on a state or Midwest regional basis, thereby increasing the local demand for secondary materials. Applies to all Minnesota secondary materials.
Actions to Increase the Reliability and Quantity of the Materials Flow
30
• Promotion of recycling and use of secondary materials-geared toward the public, industry, and government to increase recycling and reuse of collected materials. Applies to all Minnesota secondary materials.
• Establishment of recycling goals-overall and for particular materials, with public and private policies to reach those goals. Applies to all Minnesota secondary materials.
• Placing deposits on containers-so that consumers have an incentive to return soda, alcoholic beverage, milk and other containers for recycling, thereby increasing the quantity of materials available for secondary use. Applies to beverage and other common containers made of glass, metals, and plastics.
• Improved processing of materials-primarily through the application of new technology, with an eye toward diminishing volume relative to weight and therefore reducing transportation and other handling costs. These cost reductions will in turn stimulate collection of these materials, increasing quantity. Particularly applies to plastics, where there is an urgent need to develop and apply cost-effective shredding technology.
• Stockpiling collected materials-facilities to store materials experiencing shortterm supply gluts so that the flow of materials can be better managed. Particularly applies to newspapers, aluminum, and· plastics.
• Collective marketing of materials-done on a multi-city, intrastate regional and/or multi-state basis in order to increase the volume of materials; maximize collection, processing and transportation systems (through sharing and joint ownership of facilities, equipment, and management); and improve markets through collective promotion and price negotiation efforts. Applies to all Minnesota secondary materials, but especially waste paper and plastics.
I I I I I I I I I I I I I I I I I I I

,, I I I I I I I I I I I I I I I I I I
BUILDING A STRATEGY FOR ACTION
Actions to Enhance the Quality of Materials
• Improved source separation of materials prior to collection-through educational efforts, regulations, or management improvements that increase materials separation prior to curbside or industry collection. Applies to all Minnesota secondary materials, but especially waste paper, glass, and plastics.
• Improved separation of materials after collection-primarily through improvements in mechanical separation so that more unmixed material is available to brokers and processors. Particularly applies to waste paper, glass, and plastics.
• ReIDJlation of packaID,ng design-to minimize the manufacture and use of packaging made of difficult-to-recycle materials (such as those made of multiple materials). This applies to packaging made from all Minnesota secondary materials, but especially from waste paper, plastics, metals, and glass.
• Improved processing of materials-primarily through the application of new technology, with an eye toward improving quality. Applies to all Minnesota secondary materials.
• Materials content labeling-to identify the content of secondary materials for · the purpose of separation and processing. This is primarily applicable to plastics where numerous resins are used which are not easily identifiable in many forms of plastic scrap.
• Secondary materials standards-to standardize and improve the content of secondary materials to enhance their quality for reuse (recyclability) and more easily identify their content to facilitate separation and processing. This is primarily applicable to plastics, but also waste paper.
Actions to Improve Collection, Processing and Transportation Systems
• Investigation of systems improvements-studies to determine ways (through technology and management) to improve collection, processing and transportation systems in order to increase efficiency, facilitate materials separation, improve quality of materials, and reduce costs. Particularly applicable to waste paper, plastics, and glass.
• Application of new technology-to improve these systems as noted above. Par-ticularly applicable to waste paper and plastics. ·
• Improved management-to improve these systems as noted above. Particularly applicable to waste paper and plastics.
• Public subsidies and/or tax incentives to promote private systems improvements-designed to stimulate or facilitate improvements as noted above, in those cases where improvement is unlikely without public assistance. Programs should reflect the "avoided cost savings" of not having to dispose of the materials in some other way. Particularly applicable to plastics and yard wastes.
31

"
MARKET STATUS REPORT
Actions to Foster Market Development
• Market surveys----studies to determine the potential marketability of secondary materials given existing circumstances, especially for problem materials. Applicable to all Minnesota secondary materials, but especially yard wastes, used oil, spent batteries, and tires.
• Market promotion and education-to encourage industry, government and other potential markets to use recycled materials. Applicable to all Minnesota secondary materials, but especially waste paper, plastics, and yard wastes.
Actions to Develop New Products
• Research and development-to develop new products from secondary mater- . ials, especially those that are viewed as undesirable. Applicable to all Minnesota secondary materials, but especially used tires and yard wastes.
Actions to Foster Reuse of Undesirable Materials
• Research and development-to develop new markets for, or new products from, undesirable secondary materials. Applicable to used tires, waste oil, spent batteries, and yard wastes.
• Subsidized reuse-subsidies and other public support such as reimbursements for accepting, processing and reusing undesirable materials. These schemes should reflect "avoided cost savings" from not having to dispose of these materials in some other way. Applicable to used tires, waste oil, spent batteries, and yard wastes.
Actions to Overcome Prejudices About the Qu.ality of New Products Made from Secondary Materials
32
• Standards for end-use products made from secondary materials----to explicitly establish levels of quality necessary for products made with secondary materials; making it possible for these products to compete ( on qualitative measures) with products made from virgin materials and make clear their quality to potential end-users. App,licable to products made from all Minnesota secondary materials, particularly products from waste paper.
• End-use product testing-to examine the quality of products made from secondary materials in order to identify variations in quality among these products and in comparison with similar products made from virgin materials; and to make their quality clear to potential end-users. Applicable to products made from all Minnesota secondary materials, particularly waste paper and used tires (remanufactured tires).
• Secondazy materials promotion and education-to promote the use of secondary materials by educating potential end-users, particularly industry, government, and the public, about the quality of products made from these materials and how use of these materials helps alleviate Minnesota's solid
.1 I I I I I I I I I I I I I I I I I I

I I I I I I I I I I I I I I I I I I I
BUILDING A STRATEGY FOR ACTION
waste crisis. Applicable to all Minnesota secondary materials, but especially waste paper, plastics, and yard wastes.
WHAT IS THE STATE OF MINNESOTA DOING TO ENHANCE UTILIZATION OF SECONDARY MATERIALS?
Minnesota has taken a number of actions to enhance the utilization of secondary materials. Several of the most significant state actions of recent years are highlighted below.
In 1987 Minnesota established a waste education program to provide a unified approach to waste education throughout the state. As part of this effort a Waste Education Coalition was established consisting of representatives from public agencies and other organizations involved in waste management or public education. In addition to forming the Coalition, the program established a Waste Education Clearinghouse of educational materials, and reviewed existing environmental and waste-related curricula for possible use in Minnesota schools. Among other things, the program also developed a Community Waste Education Manual for use by local governments and citizens. The 1989 SCORE legislation broadens the activities of the program and involves industry representatives on the Waste Education Coalition (Minnesota Waste Education Coalitipn 1989; SCORE 1989a, pp. 390-391).
In 1988 the Minnesota Waste Management Board issued a recycling directory which identifies the intermediate and end-users of Minnesota's secondary materials. The document helps direct suppliers of recycled materials to potential markets for the reprocessing and remanufacture of these materials (Minnesota Waste Management Board 1988).
In 1989 the Minnesota Legislature created the Minnesota Office of Waste Management (MOWM) to oversee programs formerly handled by the Minnesota Waste Management Board (dissolved in 1988). Among it's responsibilities, the MOWM is charged with market development for Minnesota's secondary materials. The 1989 SCORE legislation significantly increased the funding, staffing and responsibilities of MOWM. As a result, MOWM officials are currently in the process of adding twentyeight additional staff, planning the implementation of the SCORE program requirements, and drafting rules for expanded market development grant and loan programs. MOWM is also establishing a Market Development Coordinating Council, as required by 1989 amendments to the Minnesota Waste Management Act (MOWM 1989a; Nolan, pers. comm. with author, November 21, 1989).
The state has established a number of loan and grant programs implemented by the Office of Waste Management. These programs are designed to foster the development of projects or practices that will reduce the generation of solid waste through reuse or remanufacture of secondary materials and develop waste management alternatives (some of which involve recycling). These include loans and grants for feasibility studies, technical assistance, facilities demonstration projects, capital assistance, and improvements in materials collection and separation systems (SCORE 1989a, p. 377; MOWM 1989a; Nolan, pers. comm. with author, November 21, 1989).
Minnesota also requires state procurement of secondary materials. The 1989 SCORE legislation requires that the recycled content and recyclability of commodities
33

MARKET STATUS REPORT
used by the state must be considered in bidding specifications. State agencies must purchase recycled materials when specifications allow the practical use of those materials and their price does not exceed the price of nonrecycled materials by more than 10 percent. The Department of Administration, in cooperation with the Office of Waste Management, is required to develop waste reduction .procurement programs, including an expanded life cycle costing system for procuring durable and repairable items. Local jurisdictions, educational institutions, and other public agencies are required to "aggressively pursue" procurement practices that encourage solid waste reduction and recycling (SCORE 1989a, pp. 351-355).
In order to intelligently guide these policies and programs, Minnesota will, through the efforts of several state agencies, conduct studies on solid waste composition (MPCA, MOWM, and the Metropolitan Council), procurement of recycled materials (Department of Administration), and waste management of plastics (MOWM). The findings of each of these studies will have implications for marketing Minnesota's secondary materials (SCORE 1989a, p. 393).
All of these activities will help Minnesota meet the recycling goals set by the 1989 SCORE legislation. By 1993 the state hopes to achieve recycling rates of 40 percent for state agencies, 25 percent for counties in greater Minnesota, and 35 percent for Twin Cities metropolitan area counties. How these county goals will be achieved is left to the discretion of individual counties (SCORE 1989c).
SEVERAL KEY PROCESS ISSUES
The actions already taken by the state are important first steps toward the development of a strategy for marketing Minnesota's secondary materials. But much is yet to be accomplished. Given what is known about the state's secondary materials, their potential m·arkets, the impediments that cause underutilization of these materials, and the possible options for overcoming those barriers, what needs to be done in order to formulate a successful marketing strategy? Outlined below are several key issues important to the process of building a market strategy:
34
• Given the increasing concern and involvement of industry, government, and other parties in marketing secondary materials, what kinds of processesformal and informal, private and public-should be initiated in order to begin a cooperative effort to build a strategy for marketing Minnesota's · secondary materials?
• What other information about the current situation is needed, and how can existing and future information be brought together to improve the knowledge and understanding of all the parties that play a critical role in building that strategy?
• How can these activities be broadened to include others from the Midwest region so that Minnesota's actions can be informed by, and perhaps coordinated with, those of other states in the region?
• What several key actions could be taken in the short-term to immediately affect the current situation-actions which would constitute the initial elements of the longer-term strategy?
I I I I I I I I I I I I I I I I I I I

I I I I I I I I I I I I I I I I I I I
BUILDING A STRA 1EGY FOR ACTION
• What follow-up steps can be identified now which would eventually build on the initial elements of the strategy?
• What types of evaluation should be used to determine when and how well these market development actions have worked? Who should be responsible for evaluating the strategy?
• In the long-term, what actions-no matter how challenging-will be required to successfully implement a strategy for marketing Minnesota's secondary materials and solving the solid waste crisis?
35

I I I I I I
·I I I I I I I I I I I
-~ I I

I I I I I I I I I I I I I I I I I I I
V. -SUMMARY FINDINGS AND CONCLUSIONS
1. Minnesota, like other states in the Midwest and the nation, is keenly interested in expanding markets for secondary materials for a variety of reasons, including: a new environmental ethic; concern about limited natural resources; and a solid waste disposal crisis brought on by increasing amounts of garbage, public opposition to landfills, increasing government regulation of landfills, diversion of garbage to nonland alternatives, and public opposition to incineration.
2. Minnesotans throw away a total of 4 million tons of waste a year, and residential waste generation is about two and one-half pounds per person per day. This is expected to increase 22 percent by the year 2000. The single largest component of the Minnesota waste stream is paper, followed by food wastes and yard wastes. About 11 percent of solid wastes are recycled in the Twin Cities, only 4 percent in greater Minnesota.
3. The existing market analyses present a generally optimistic picture of the market potential for most of Minnesota's secondary materials-waste paper, plastics, glass, aluminum, ferrous metals, and textiles. Even so, the potential markets for these materials are apparently underutilized for a variety of reasons, including (depending on the material) inherent price instability, higher prices for secondary material than for their virgin counterparts, and an unreliable flow, insufficient quantity or inadequate quality of materials.
4. Other secondary materials, according to these analyses, have limited market potential-certain plastics (those other than PET and HDPE), used oil, spent batteries, yard wastes, and discarded tires. Not only do they sometimes suffer from the impediments affecting Minnesota's other secondary materials (those with markets), but they are (depending on the material) subject to regulations which limit their market potential, are not easily made into end-use products, or are generated in such volumes that it is difficult to collect and reuse the material.
5. The responsibility for building market strategies for Minnesota's secondary materials is shared among industry, state government, local jurisdictions, nonprofit entities, and research and educational institutions. Vigorous discussion among all these parties is necessary to formulate realistic strategies, and partnerships among them will be at the heart of successful strategy-building.
6. The report identifies eight types of action which can be employed to overcome the impediments to marketing Minnesota's secondary materials. These include actions to: increase and stabilize price and demand; increase the quantity and reliability of the materials flow; enhance the quality of the materials presented to their markets;
37

MARKET STATUS REPORT
improve collection, processing and transportation systems; foster market development; develop new products; foster reuse of undesirable materials; and overcome prejudices about the quality of new products made from secondary materials.
7. The report identifies thirty-one specific options for overcoming the impediments to marketing Minnesota's secondary materials (each related to the various types of actions discussed in the report). Applied in various ways to various materials, these include:
38
• public and private procurement
• stockpiling collected materials during short-term supply gluts and price downturns
• direct marketing of materials
• use of public subsidies and price supports
• modification or elimination of public subsidies for virgin materials
• imposition of packaging fees
·• new market and product development to augment existing potential
• promotion of recycling and secondary materials use
• establishment of recycling goals
• placing deposits on beverage and other containers
• collective marketing of materials
• improved source separation of materials prior to collection
• improved separation of materials after collection
• regulation of packaging design
• improved processing of materials to improve quality and decrease volume relative to weight
• establishment of materials content labeling
• establishment of secondary materials standards
• investigation and application of new technology, improved management, and public subsidy and/or tax programs to improve collection, processing, and transportation systems for secondary materials
• conduct market surveys
• conduct market promotion and education
• conduct research and development for new products and new markets (especially for undesirable materials)
• subsidize reuse of undesirable materials
• establish standards for end-use products made from secondary materials
I I I I I I I I I I I I I I I I I I I

I I I I I I I I I I I I I I I I I I I
SUMMARY FINDINGS AND CONCLUSIONS
• test end-use products made from secondary materials for quality
• promotion of, and education on, the use of products made from secondary materials
8. The State of Minnesota has taken a number of-actions to enhance the utilization of secondary materials. Among other things, the state has established a waste education program, issued a recycling directory, created the Office of Waste Management (with market development responsibilities), and established loan and grant programs for projects that utilize secondary materials or develop waste management alternatives (including recycling). The state also requires procurement of secondary materials by state agencies and other public entities, and is planning to conduct several studies with implications for marketing secondary materials. The state has also set recycling goals for Minnesota.
9. Several key process issues should be addressed when beginning to build a strategy for marketing these materials, including consideration of what kinds of processes should be initiated to foster cooperative strategy building, what kinds of current and future information will be needed, how others from the Midwest region can become involved in these strategy building activities, what key short-term actions would have an immediate effect on the situation, what longer-term actions could be built upon those, and what types of evaluation should be used to determine the effectiveness of the strategy.
39

I I I I I I I I I I I I I I I I I I I

I I I I I I I I I I I I I I I I I I I
BIBLIOGRAPHY
American Paper Institute, Inc. 1987. Paper Recycling and its Role in Solid Waste Management. New York: American Paper Institute, Inc.
Andress, Carol. 1989. "Solid Waste - A Primer for the Northeast-Midwest Region." Northeast-Midwest Economic Review, August 7, pp. 12-13.
Cal Recovery Systems, Inc. 1988. Waste Generation and Composition Study -Executive Summary. St. Paul, Minn.: Metropolitan Council of the Twin Cities Area.
Cavaney, Red. 1989. "Paper Recycling and its Role in Solid Waste Management." (American Paper Institute, Inc. testimony before the Subcommittee on Transportation and Hazardous Materials, Committee on Energy and Commerce, U.S. House of Representatives), July 13.
Center for Economic Development, University of Minnesota-Duluth. 1989. Alternative Courses of Action with Regard to Tirecycle Project. Duluth, Minn.: Center for Economic Development, University of Minnesota-Duluth, May 19.
Citizens League. 1987. The New Weigh to Recycle. Minneapolis, Minn.: The Citizens League, May 22.
City Pages. (Minneapolis) 1989. "Slow Burn," by Craig Cox, October 3, pp. 8-11.
Duluth News - Tribune. 1989. "Rubber Research Vacates Tirecycle Plant in Babbitt," July 29.
Dunn, Bill (Minnesota Pollution Control Agency). 1989. Conversation with author, October 11.
Environmental Defense Fund. 1988. Coming Full Circle. New York: Environmental Defense Fund.
Franklin Associates. 1988. Characterization of Municipal Solid Waste in the United States, 1960 to 2000 (Update 1988). Washington D.C.: U.S. Environmental Protection Agency.
Frosch, Robert A. and Gallopoulos, Nicholas E. 1989. "Strategies for Manufacturing." Scientific American, September, pp. 144-152.
"Garbage Burners Losing Steam." 1989. Utne Reader, September/October, pp. 21-22.
Gilkeson, John. 1989. "A Resounding 'Yes' for Recycling." CURA Reponer, April, pp. 10-11.
41

MARKET STATUS REPORT
Gilkeson, John (Center for Urban and Regional Affairs). 1989. Conversation with author, November 20.
Gilkeson, John and Schmidt, Susan (Center for Urban and Regional Affairs). 1989. Conversations with author, September 22 and 28.
Glenn, Jim. 1989. "Market Development Goes into Action." BioCycle, August, pp. 28-30.
Hancock, Bill (American Paper Institute, Inc.). 1989. Conversation with author, October 10.
Hillbery, Rhonda. 1989. "Landfill Costs Prompt More Recycling By Printers." City Business, September 25, p. 13.
Meade, Kathleen. 1989. "Mills Eye Expansion." Recycling Times, September 12, p. 7.
Metropolitan Council of the Twin Cities Area. 1986. Solid Waste Market Identification and Expansion Report. St. Paul, Minn.: Metropolitan Council of the Twin Cities Area, F_ebruary 5.
McGough, John (Metropolitan Council of the Twin Cities Area). 1989. Conversation with author, October 16.
Midwest Recycling Coalition. 1989. "1989 State of the Region Annual Report" (draft # 2). Minneapolis, Minn.: Midwest Recycling Coalition, September.
Star Tribune. (Minneapolis) 1989a. "Recycling Efforts Dido 't Include Locating Markets," May 2, p. lB.
Star Tribune. (Minneapolis) 1989b. "Recycling Loses in Competition with TimberIndustry Subsidies," by Lilias Jones, May 8, commentary page.
Star Tribune. (Minneapolis) 1989c. "Minneapolis Incinerator Faces Trial By Fire," by Steve Brandt, August 13, p. lB.
Minnesota Department of Administration. 1987. Procurement Test for Recycled Paper (report for the Legislative Commission on Waste Management). St. Paul, Minn.: Minnesota Department of Administration, November 16.
Minnesota Office ofWaste Management (MOWM). 1989a. OverviewofOWM Programs Fact Sheet. St. Paul, Mirin.: Minnesota Office of Waste Management, September.
__ . 1989b. Spent Lead-Acid Batteries Fact Sheet. St. Paul, Minn.: Minnesota Office of Waste Management, September.
__ . 1989c. Used Motor Oil Fact Sheet. St. Paul, Minn.: Minnesota Office of Waste Management, September.
__ . 1989d. Used Oil Management Programs Fact Sheet. St. Paul, Minn.: Minnesota Office of Waste Management, September.
Minnesota Pollution Control Agency (MPCA). 1989a. Solid Waste Recycling Market Development: Closing the Loop. St. Paul, Minn.: Minnesota Pollution Control Agency.
__ . 1989b. Waste Tire Program Update. St. Paul, Minn.: Minnesota Pollution Control Agency, June.
42
I I I I I I I I I I I I I I I I I I I
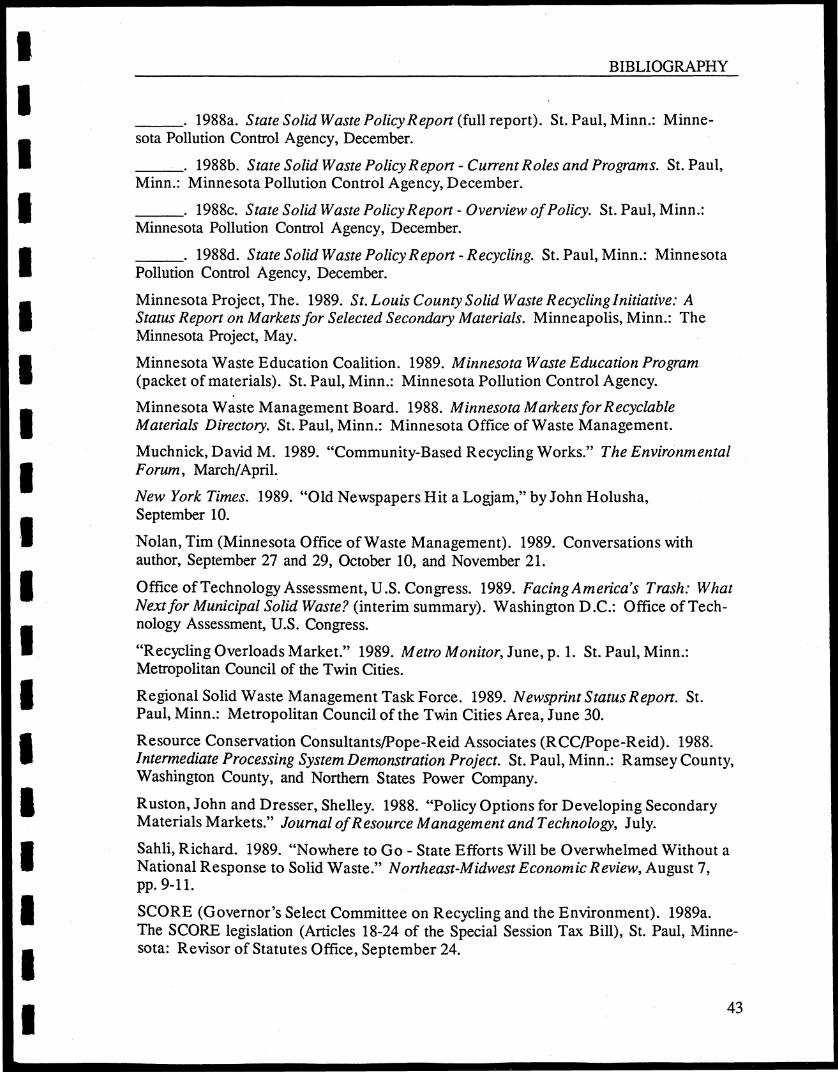
I I I I I I I I I I I I I I I I I I I
BIBLIOGRAPHY
___ . 1988a. State Solid Waste PolicyRepon (full report). St. Paul, Minn.: Minnesota Pollution Control Agency, December.
___ . 1988b. State Solid Waste PolicyRepon- Current Roles and Programs. St. Paul, Minn.: Minnesota Pollution Control Agency, December.
___ . 1988c. State Solid Waste Policy R epon - Overview of Policy. St. Paul, Minn.: Minnesota Pollution Control Agency, December.
___ . 1988d. State Solid Waste PolicyRepon-Recycling. St. Paul, Minn.: Minnesota Pollution Control Agency, December.
Minnesota Project, The. 1989. St. Louis County Solid Waste Recycling Initiative: A Status Report on Markets for Selected Secondary Materials. Minneapolis, Minn.: The Minnesota Project, May.
Minnesota Waste Education Coalition. 1989. Minnesota Waste Education Program (packet of materials). St. Paul, Minn.: Minnesota Pollution Control Agency.
Minnesota Waste Management Board. 1988. Minnesota Markets/or Recyclable Materials Directory. St. Paul, Minn.: Minnesota Office of Waste Management.
Muchnick, David M. 1989. "Community-Based Recycling Works." The Environmental Forum, March/ ApriL
New York Times. 1989. "Old Newspapers Hit a Logjam," by John Holusha, September 10.
Nolan, Tim (Minnesota Office of Waste Management). 1989. Conversations with author, September 27 and 29, October 10, and November 21.
Office of Technology Assessment, U.S. Congress. 1989. Facing America's Trash: What Next/or Municipal Solid Waste? (interim summary). Washington D.C.: Office of Technology Assessment, U.S. Congress.
"Recycling Overloads Market." 1989. Metro Monitor, June, p. 1. St. Paul, Minn.: Metropolitan Council of the Twin Cities.
Regional Solid Waste Management Task Force. 1989. NewsprintStatusRepon. St. Paul, Minn.: Metropolitan Council of the Twin Cities Area, June 30.
Resource Conservation Consultants/Pope-Reid Associates (RCC/Pope-Reid). 1988. Intermediate Processing System Demonstration Project. St. Paul, Minn.: Ramsey County, Washington County, and Northern States Power Company.
Ruston, John and Dresser, Shelley. 1988. "Policy Options for Developing Secondary Materials Markets." Journal of Resource Management and Technology, July.
Sahli, Richard. 1989. "Nowhere to Go - State Efforts Will be Overwhelmed Without a National Response to Solid Waste." Northeast-Midwest Economic Review, August 7, pp. 9-11.
SCORE (Governor's Select Committee on Recycling and the Environment). 1989a. The SCORE legislation (Articles 18-24 of the Special Session Tax Bill), St. Paul, Minnesota: Revisor of Statutes Office, September 24.
43

MARKET STATUS REPORT
___ . 1989b. Solid Waste Management in Minnesota - A 1989 Fact Sheet. St. Paul, Minn.: Minnesota State Planning Agency.
___ . 1989c. Waste Reduction and Recycling Legislation ( a legislative summary). St. Paul, Minn.: House of Representative Research Department, September 28.
___ . 1988. Recommendations to Rudy Perpich, Governor, State of Minnesota by the Governor's Select Committee on Recycling and the Environment. St. Paul, Minn.: Minnesota State Planning Agency, November 22.
Shea, Cynthia Pollock. 1988. "Building a Market for Recyclables." World Watch, May/June, pp. 12-18.
Shull, H. Eugene, et al. 1987. Feasibility Study on Long-Term Management Options for Used Oil in Minnesota. Duluth, Minn.: Natural Resources Research Institute.
Soulsby, John (Canadian Pulp and Paper Association). 1989. Conversation with author, October 10.
Spent Lead Acid Battery Task Force. 1987. Recycling of Spent Lead Acid Batteries (issue statement). St. Paul, Minn.: Minnesota Office of Waste Management, January 13.
Taylor, Linda (Minnesota House Research). 1989. Conversation with author, September 26.
Turgeon, Curtis M. 1989. The Use of Asphalt-Rubber Products in Minnesota. St. Paul, Minn.: Minnesota Department of Transportation.
44
I I I I I I I I I I I I I I I I I I I

I I I I I I I I I I I I I I I I I I I
APPENDICES
45

I I I I I I I I I I I I I I I I I I I

I I I I I I I I I I I I I I I I I I I
APPENDIX 1
SECONDARY MATERIALS
Secondary materials are materials collected for re-use or re-processing into new products, specifically including the following: ·
Waste paper includes the following:
• Old newspapers-old newsprint
• Corrugated (paperboard)-a rigid paper structured in parallel furrows, such as cardboard boxes
• High-grade paper-white or colored ledger (office paper) or computer paper
• Mixed paper-low and high grade paper in mixed form
• Fiber barrels-drums made from strong paper fibers, such as 55-gallon drums
Plastics include the following:
• PET-polyethylene trephthalate, used in beverage bottles and other food and household products
• HDPE-high density polyethylene, used in milk and water jugs and many other products
• LOPE-low density polyethylene, a plastic film used for food packaging wrap and ·garbage bags
• PS-polystyrene, used in cups and bowls, fast-food foam containers, cas-sette tapes and cutlery
• PP-polypropylene, used in housewares, containers and. battery cases
• PVC-polyvinyl chloride, used in pipes, drains and furniture
• ABS-acrylonitrile butadiene styrene, used in automobile trim, grills and telephone bodies
• Mixed plastics-a mixture of different plastic types
Glass includes the following:
• Color sorted-glass containers separated by color (i.e. clear/flint, green, amber/brown)
• Color mixed-glass containers of different colors mixed together
• High tempered-tempered glass, used in automobile glass, window panes and plate glass
• Other glass-glass materials, other than containers and high tempered glass, such as mirrors and lightbulbs
47

MARKET STATUS REPORT
48
Metals include the following:
• Automobiles, auto parts and auto scrap-(respectively) whole automobiles or auto bodies; reusable or rebuildable auto parts; and scrap metal from cars and automotive parts which can't be .rebuilt
• Ferrous-metals which have magnetic character and contain iron, such as . cast iron
• Nonferrous-nonmagnetic metals with no iron content, including aluminum, copper, lead and brass
• Aluminum scrap-aluminum in scrap form, such as window and door frames, lawn furniture frames and drain pipes
• Aluminum cans-usually twelve ounce soda pop cans (UBC-used beverage cans)
• Bi-metal beverage cans-steel beverage cans with steel tops or bottoms
• "Tinned" food cans-tin-plated steel cans, such as soup, vegetable and pet food cans
• White goods-large appliances, such as washing machines and refrigerators, accepted in whole form or as scrap
• Machinery-equipment, such as farm machinery, which is accepted as scrap or reusable parts
Batteries include:
• Automobile batteries-common lead-acid batteries from cars, trucks, tractors, snowmobiles and motorcyles
• Other batteries-includes batteries made with mercury (used in hearing aids), lithium (used in calculators), alkaline (used as common household batteries), nickel cadmium (for rechargable batteries), and dry-cell batteries
Rubber: material primarily from tires, as well as other rubber items
Oil: used motor oil, such as from automobiles, trucks and other vehicles
Textiles: usable or wearable clothing, rags or clean textile scraps
Yard Wastes: brush (such as tree branches and bush trimmings), grass clipping, leaves and other yard wastes
Construction materials: materials resulting from demolition or construction, including tar, asphalt, cement and concrete.
Wood: reusable pallets (for transport and storage) scrap lumber (used as small pieces for construction and manufacturing shorts) and other scrap lumber or pallets (used for firewood)
I I I I I I I I I I I I I I I I I I I

I I I I I I I I I I I I I I I I I I I
APPENDIX 1
Note: Other secondary materials exist-including renderings (from animal hides and oils), hardware (used bricks, pipes, etc), and household materials (such as bric-a-brac, furniture and small appliances).
Sources: Minnesota Waste Management Board, 1988, Minnesota Markets/or Recyclable MaterialsDirectory, St. Paul, Minn.: Minnesota Office of Waste Management, glossary of terms; Gilkeson, pers. comm. with author, November 20, 1989.
49

I I I I I I I ,, I I I I I I I I I I I

I I I I I I I I I I I I I I I I I I I
Appendix 2
TABLE 2-1
WASTE COMPOSITION IM PERCEH'l'
Material
Newspaper Corrugated Office paper Other paper
Subtotal
Glass
Ferrous Aluminum
Benton . County
1985
7.2 10.5 4.4
14.7 36.8
9.4
Other non-ferrous Subtotal
7.8 0.7 0.3 8.8
Plastics Rubber Leather/textiles Wood Food waste Yard waste Miscellaneous
Total
3.5 l. 9 2.0 3.4
15.5 17.4
1.3 100.0
Hennepin County
1986
6.6 10.8
14.8 32.2
3.7
5.2 0.9 0.1 6.2
7.8
8.7 41.4
100.0
Olmsted County
1983
14.5
19.5 34.0
5.1
6.9 0.5
7.4
3.6
2.1 7.2 s.o 7.7
.27. 9 100.0
Wright County
1985
7.0 14.0 5.0 ~ 34.0
6.0
7.1 0.6
7.7
3.6
1.4 4.3
16.2 12.8 11.5
100.0
Sources: Tri-County Solid Waste Management Plan, 1986; Hennenin County Solid Waste Master Plan, 1986; Olmsted County Solid Waste Management Plan, 1984; Pope-Reid Associates for Wright County.
Source: Resource Conservation Consultants/Pope-Reid Associates (RCC/Pope-Reid). 1988. Intermediate Processing System Demonstration Project. St. Paul, Minn.: Ramsey County, Washington County, Northern States Power Company, p. 2-2.
51

- - -
TABLK 2-9
SUHMARY OP MARKKT PORTRAYAL
Harket Harket Material Market Material Hateria! De11arul..1Jl StabilJt~ Price~_j_H LOCQ t;JQ!L._Lll Specifications
Haste paper newspaper 11odest 111oderate corrugated strong high oftJce paper strong high
Glass bottles
25 60 regional not stringent 25 10 regional not stringent 60 - 250 regional fairly stringent
color-sorted modest high 11ixed-color very s111all weak
Hatala
,o 70 regional stringent regional not stringent
alu111inu111 cans high high alu111inu111 scrap nigh high
800 -HOO national stringent 200 -1600 national stringent
white goods strong 111odsrate tin cans modest high
15 20 local not stringent ,o 6!1 regional stringent Tires weak poor Plastics
in-state not stringent
HDPB high 111oderate PBT high 111oderate
100 - 300 regional very stringent 80 - 240 regional very stringent
mixed weak poor regional not stringent
Source: Resource Conservation Consultants (1) Ability to absorb new quantities of material (21 Dollars per ton, POB consuming mill.
from Ramsey and Washington Counties.
(31 Regional is the upper Midwest.
- - - - - - - - - - - - - -
~ "0 n,
= Q. ... ~
tH
- -
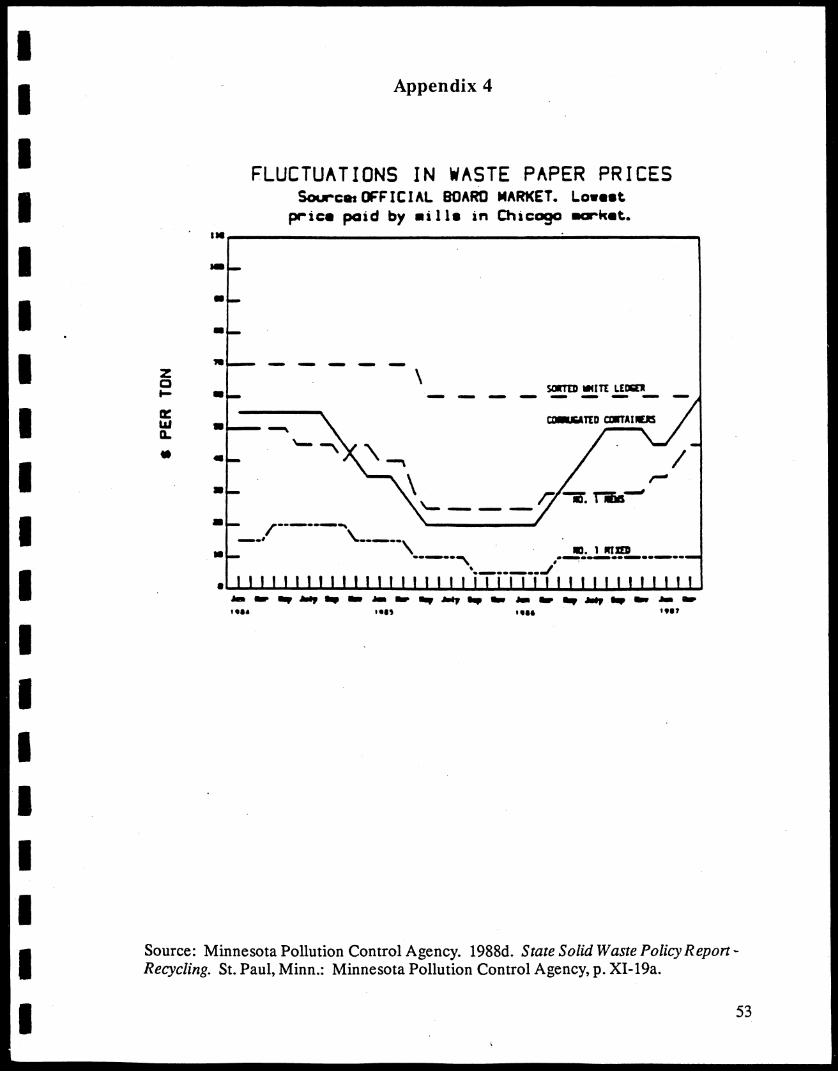
I I I I I I I I I I I I I I I I I I I
•• .. --,.
z C I- • a: ul -11.
• • • -•
Appendix 4
FLUCTUATIONS IN WASTE PAPER PRICES Sources OFFICIAL BOARD MARKET. Lo•••t
prica paid by ■ i 11 ■ in Chicago ac:rkat .
\ S01TtD 11un LEDliP
'\~ I \ n -.r. nm-,-\_. __ _
/------,, __ , '------, Ill. 1 "1m -----, --~-----------, _______ J
, ... , .. , • ••• ,,.,
Source: Minnesota Pollution Control Agency. 1988d. State Solid Waste Policy R epon -Recycling. St. Paul, Minn.: Minnesota Pollution Control Agency, p. XI-19a.
53

Appendix 5
TABLE 2-5
REGIONAL COHStJMERS OP WASTE PAPER (1)
Company
Illinois Celotex Corp. Chicago Paperboard Davey Corp. FSC Paper Ivex Corp. Jefferson Smurfit Manville Corp. Quaker Oats Sonoco Products
Iowa Packaging Corp.
Minnesota CertainTeed Corp. USG Acoustical Waldorf Corp.
Wisconsin Beliot Boxboard Consolidated Papers Fort Howard Paper Gens~ar Corp. Glatfelter Corp. Green Bay Pack. James River Corp. Keiding, Inc. Kimberly-Clark Ponderosa Pulp Pope & Talbot Tomahawk Tissue U.S. Paper U.S. Paper Ward Paper Wi. Paperboard Wisconsir Tissue
Location
Quincy Chicago Aurora Alsip Joliet Alton Joliet Pekin Rockton
X X X X X X X X X X X X X X X X X
Tama X
Shakopee Cloquet St.· Paul
X X X X
Beloit X Wi. Rapids X Green Bay. Cornell X Neenah Green Bay Ashland Milwaukee X Neenah Oshkosh
.Eau Claire Tomahawk De Pere X Menasha X Merrill Milwaukee X Menasha
X X
X
X
X
X X
X
X
X X
X
X
X
X X X X X X
X X
X
Capacity Tons Per Day
300 190 100 315 150 625 200
80 62
105
185 unknown
355
50 95
850 220 385 380
60 unknown
250 150 200
23 98
150 100 400 300
Source: Resource Conservation Consultants from industry interviews, Post's Puln and Paner Directory and other industry docufnents.
(1) ONP = old newspapers: OCC cold corrugated container: OP• office papers (deink grades but not pulp
substitutes) .
Source: Resource Conservation Consultants/Pope-Reid Associates (RCC/Pope-Reid). 1988. Intermediate Processing System Demonstration Project. St. Paul, Minn.: Ramsey County, Washington County, Northern States Power Company, p. 2-6.
54
I I I I I I I I I I I I I I I I I I I
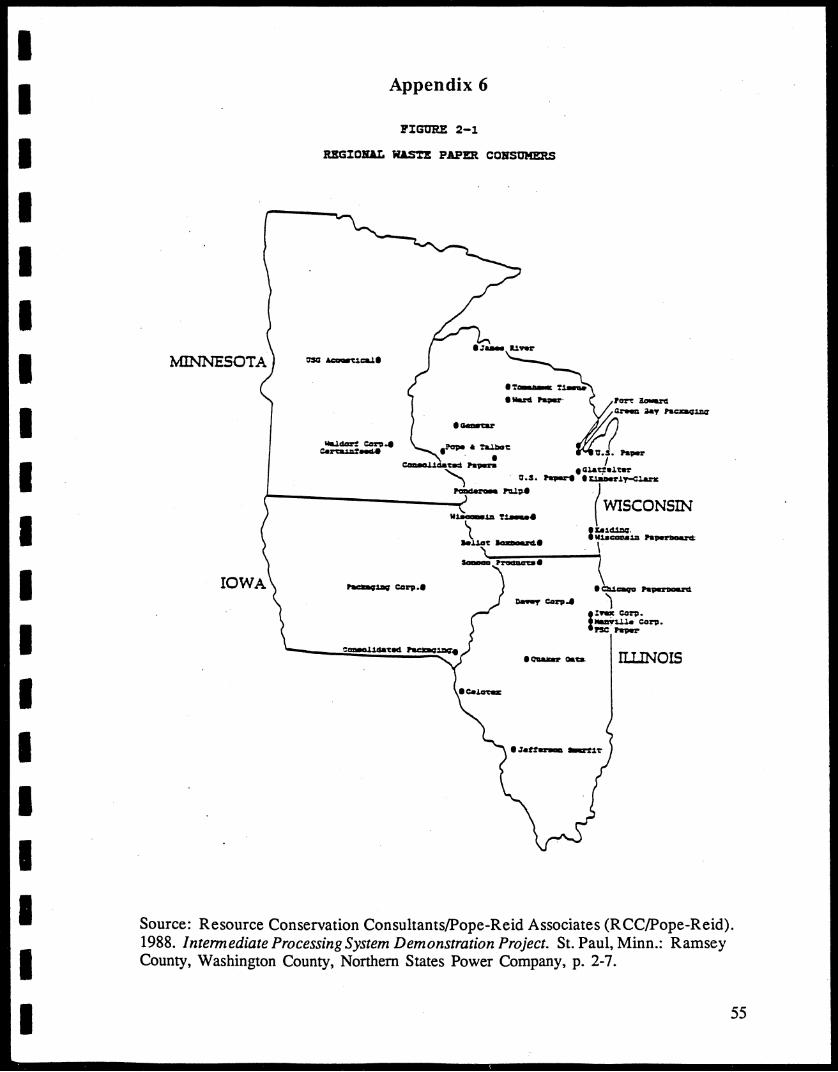
I I I I I I I I I I I I I I I I I I I
Appendix 6
!'IGORE 2-1
RBGIOlDL W.I.S'1'X PAPER COBSOMERS
MINNESOTA
·-c:=.;:v.. .Pape. ?alm'O . .
c-.1..1.sa .. .: h'P'lft ea1ac:..1.....-~ o . .s.~t1::.1aDar.1..,..clarlo
(-"-------~- ,w ...,,.( WISCON!ilN
l ii:..-1,uz,q. llu=ma.t.:h~
I
~ Pacaq.1.Dq car;i.e I =c:ava Pa~
~ corp.. ')
I 1.-- car;,. ~:U.J.■ car;,. !'SC l'lllle1"
Ill.INOIS
Source: Resource Conservation Consultants/Pope-Reid Associates (RCC/Pope-Reid). 1988. lntennediate Processing System Demonstration Project. St. Paul, Minn.: Ramsey County, Washington County, Northern States Power Company, p. 2-7.
55

-~
Appendix 7
TABLE 2-7
REGIOHAL COLLET CONS~TIOH (1)
Current Estimated Comcany Location ( 2) Output Cullet Ose ( 3 )
Anchor Glass Gurnee, IL and 1,000 Amber= 80 Shakopee, MN Green= as
Flint= 90 Ball-InCon Dolton, IL 480 Flint=ll0-120 Ball-InCon Lincoln, IL 260 Foster-Forbes Burlington WI 450
Kerr Glass Plainfield, IL 440 Owens-Illinois Streator, IL NA
Source: Resource Conservation Consultants (1) Tons per day.
Flint= SO-Amber= 50 Flint=lOO Green= 50 Ambers 80-Total=lSO
(2) The figures for Anchor Glass combine data from two plants. Figures were unavailable for Anchor's Streator, Illinois plant, as it was just recently purchased from Diamond-Bathurst.
(3) At the Foster-Forbes plant amber and green cullet are alternated in six month production periods. Flint cullet is consumed daily.· Total 1987 cullet use at the Owens-Illinois plant was 55,200 tons.
65
90
Source: Resource Conservation Consultants/Pope-Reid Associates (RCC/Pope-Reid). 1988. Intermediate Processing System Demonstration Project. St. Paul, Minn.: Ramsey County, Washington County, Northern States Power Company, p. 2-11.
56
I -1 I I I I I I I I I I I I I I I I I

I I I I I I I I I I I I I I I I I I I
MINNESOTA
Appendix 8
FIGORE 2-2
REGIOBAL cm.rzr COBSOMERS
WISCONSIN
BaJ.l-lDCoa. 01oena-t::.:.:i.a1a.
Anel>ar a.1 ... e
BaJ.1-=•
ILUNOIS
Source: Resource Conservation Consultants/Pope-Reid Associates (RCC/PopeReid). 1988. Intermediate Processing System Demonstration Project. St. Paul, Minn.: Ramsey County, Washington County, Northern States Power Company, p. 2-10.
57

Center for Urban and Regional Affairs
University of Minnesota
330 Humphrey Center
301 ·19th Avenue South
Minneapolis, MN 55455
612/625-1551
I I I I I I I I I I I I I I I I I I I