i i iiii 111111 ii i - defense technical information center limits of the bear-ing loads in turn...
TRANSCRIPT

GVTDOC Ir00
D 21 1 .9:"9:
0
1 IAL SHIP RESEARCH AND DEVELOPMENT CENTERBethesda, Md. 20034
NIMITZ URARY - U.S NAVAL ACADEMYI I IIII I II 111111 I3 9337 00374 0603
RUDDER FORCE AND MOMENT MEASUREMENTS
ON A 1/4-SCALE SES 100 RUDDER
by
00
Douglas E. Layne LIBRARY
OCT 30 1974
U. S. NAVAL ACADE Y
z
E-.z
SHIP PERFORMANCE DEPARTMENT
RESEARCH AND DEVELOPMENT REPORT
0qLL.
November 1973 Report 4118
The Naval Ship Research and Development Center is a U. S. Navy center for laboratoryeffort directed at achieving improved sea and air vehicles. It was formed in March 1967 bymerging the David Taylor Model Basin at Carderock, Maryland with the Marine EngineeringLaboratory at Annapolis, Maryland.
Naval Ship Research and Development Center
Bethesda, Md. 20034
MAJOR NSRDC ORGANIZATIONAL COMPONENTS
NSRDC
COMMANDER00
*REPORT ORIGINATOR TECHNICAL DIRECTOR01
OFFICER-IN-CHARGE OFFICER-IN-CHARGECARDEROCK 05 ANNAPOLIS 04
SYSTEMSDEVELOPMENTDEPARTMENT 11
*J AVIATION ANDSHIP PERFORMANCE SURFACE EFFECTS
DEPARTMENT 15 DEPARTMENT 16
STRUCTURES COMPUTATION
DEPARTMENT AND MATHEMATICS17 DEPARTMENT 18
PROPULSION ANDSHIP ACOUSTICS AUXILIARY SYSTEMS
DEPARTMENT D19 DEPARTMENT 2
MATERIALS CENTRAL
DEPARTMENT INSTRUMENTATION28 DEPARTMENT 29
NDW-NSRDC 3960/43b (Rev. 3-72)
GPO 928-108

DEPARTMENT OF THE NAVY
NAVAL SHIP RESEARCH AND DEVELOPMENT CENTERBETHESDA, MD. 20034
RUDDER FORCE AND MOMENT MEASUREMENTS
ON A 1/4-SCALE SES 100 RUDDER
by
Douglas E. Layne
aAPPROVED FOR PUBLIC RELEASE: DISTRIBUTION UNLIMITED
November 1973 Report 4118

USi

TABLE OF CONTENTS
Page
ABSTRACT ........................................................... 1
ADMINISTRATIVE INFORMATION ......................................... 1
INTRODUCTION ...................................................... 1
METHOD AND PROCEDURES ............................................. 1
RESULTS AND DISCUSSION . ............................................ 4
CONCLUSIONS ....................................................... 6
LIST OF FIGURES
Figure 1 - Rudder Profile and Section Shapes ..................... 7Figure 2 - Coordinate System Showing Positive Direction
of Forces and Moments and Angle of Attack ............. 8
Figure 3 - Data Acquisition System ............................... 9
Figure 4 - Lift Coefficients versus Rudder Angle atVarious Velocities Using Cavitation andFroude Scaling (Condition I) .......................... 10
Figure 5 - Drag Coefficients versus Rudder Angle atVarious Velocities Using Cavitation andFroude Scaling (Condition I) .......................... 11
Figure 6 - Torque Coefficients versus Rudder Angle atVarious Velocities Using Cavitation andFroude Scaling (Condition I) .......................... 12
Figure 7 - Bending and Pitch Moment Coefficients versusRudder Angle at Various Velocities UsingCavitation and Froude Scaling (Condition I) ........... 13
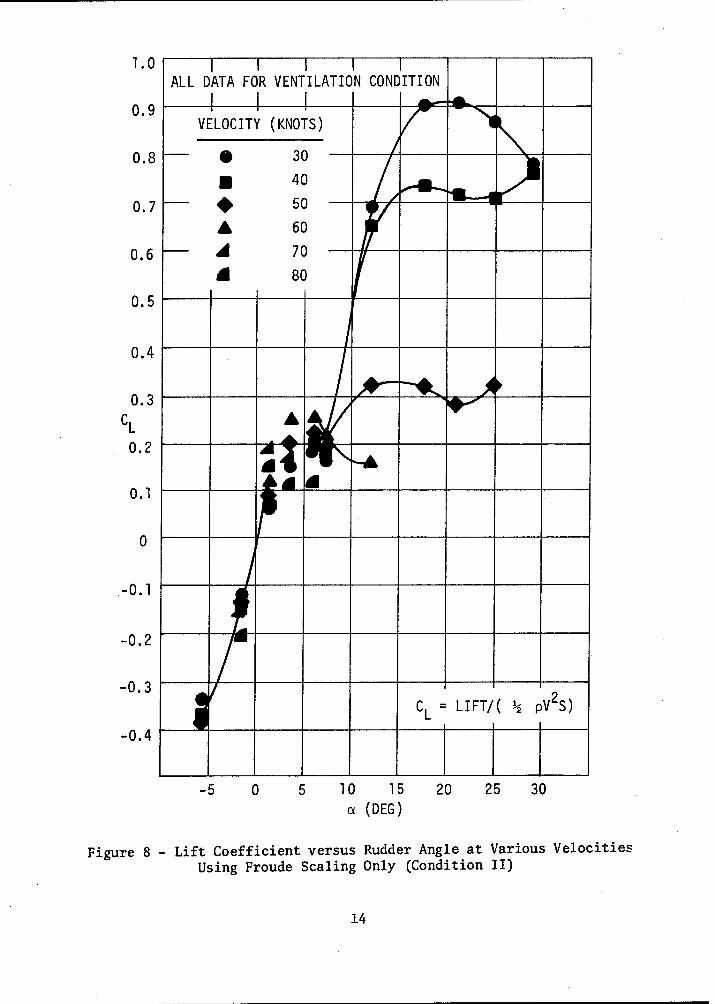
Figure 8 - Lift Coefficient versus Rudder Angle atVarious Velocities Using Froude ScalingOnly (Condition II) ................................... 14
Figure 9 - Drag Coefficient versus Rudder Angle atVarious Velocities Using.Froude ScalingOnly (Condition II) ................................... 15
Figure 10 -Torque Coefficient versus Rudder Angle atVarious Velocities Using Froude ScalingOnly (Condition II) ................................... 16
Figure 11 - Bending and Pitching Moment Coefficients versusRudder Angle at Various Velocities Using FroudeScaling Only (Condition II) ............................ 17
iii

Page
Figure 12 - Comparison of Lift Data Obtained underConditions I and II ................................... 18
Figure 13 - Condition I Corresponding to 30 Knots FullScale ................................................. 19
Figure 14 - Condition I Corresponding to 40 Knots FullScale .............................................. ... 20
Figure 15 - Condition I Corresponding to 50 Knots FullScale ................................................. 21
Figure 16 - Condition I Corresponding to 60 and 70 KnotsFull Scale ............................................ 22
Figure 17 - Condition II Corresponding to 30 Knots FullScale ................................................. 23
Figure 18 - Condition II Corresponding to 40 Knots FullScale ................................................. 24
Figure 19 - Condition II Corresponding to 50 Knots FullScale ..... ............................................ 25
Figure 20 - Condition II Corresponding to 60 and 70 KnotsFull Scale ............................................ 26
Figure 21 - Comparison of Torque Moment and Drag Curves forCondition I and Data from Another Investigation ....... 27
Figure 22 - Comparison of Bending Moment and Lift Curvesfor Condition I and Data from AnotherInvestigation ......................................... 28
TABLE 1 - Evaluation Conditions ................................... 2
iv

NOTATION
A Aspect ratio b 2 IS
b Span measured perpendicular to the plane of the rootsection, ft
Mean geometric chord (Chord tip ' Chord root )/2
C Drag coefficient D/1 PV2SD 2
1 2C L Lift coefficient L/f PV S
C Root bending moment coefficient about the intersection of the
rudder stock with the rudder root chord Mb/.L PV2 Sb2
1 2C MC/2 Torque coefficient about the rudder stock M C If PSCV
C e Root pitching moment coefficient about the intersection of the
rudder stock with the rudder root chord M /.L PV2 Sb0 2
D Drag parallel to flow
F n Froude number V/vrgT
9 Acceleration due to gravity
L Lift normal to direction of flow
M C Rudder stock torque about the rudder stock
Mb Rudder bending moment about the intersection of the rudderstock with the rudder root chord
M Rudder pitching moment about the intersection of the rudderstock with the rudder root chord
v

p sStatic pressure
P
P vVapor pressure
R Reynolds number VC/ve
S Rudder planform area
V Velocity of free stream
a Rudder angle (angle of attack)
V Kinematic viscosity
p Mass density
CT Cavitation number (P - Pv)/I pV
vi

ABSTRACT
Force and moment measurements were obtained in the NSRDC36-in. variable-pressure water tunnel on a high-speed rudderwith a geometric aspect ratio of 1.47. Data presented adhereto Froude scaling with an attempt to scale appropriate cavita-tion number. The cavitation index was varied from 3.4 to 0.16for angles of attack of 0 to 29 deg. Lift, drag, and rudderstock torque were all significantly affected by variations inthe cavitation number. Additional data are presented forFroude scaling only without considering the effect of cavita-tion number. The report also indicates a decrease in forcesand moments with ventilation of the rudder at the trailingedge versus no ventilation.
ADMINISTRATIVE INFORMATION
The Naval Ship Research and Development Center (NSRDC) was requested
by the Surface Effect Ship Program Office (SESPO) to construct a 1/4-scale
model of a rudder designed for the SES-100 test craft and to conduct force
and moment measurements. This work was funded under SESPO Project PM-17,
Task Area S4229, NSRDC Work Unit 1556-022.
INTRODUCTION
Predictions of rudder forces and moments are required to determine
rudder stock bearing loads for the SES test craft. The limits of the bear-
ing loads in turn restrict the rudder angle of attack. The limitation on
the angle of attack has the effect of decreasing the allowable angle with
increase in speed. The requested evaluations were to include force and
moment measurements for conditions comparable to full scale. The conditions
were to be simulated through use of corresponding cavitation indices and
Froude scaling.
METHOD AND PROCEDURES
The rudder was a 1/4-scale model of one designed for use with the
SES-100 test craft. It was constructed of 17-4PH steel with a 4.5 in.-
long shaft located 4.125 in. from the trailing edge. In turn, the rudder
shaft was connected by a coupling to the strain dynamometer and lift and
drag gages. The geometric aspect ratio was 1.47 with a projected area of
57.6 in.
1

The rudder profile is presented in Figure 1 together with typical
section shapes. Lift, drag, and moments were measured on the rudder over a
wide range of angles and cavitation indices.
The experiment was conducted in the NSRDC 36-in. variable-pressure
water tunnel at water velocities from 25 to 59 ft/sec (corresponding to
Reynolds numbers of 1.35 x 10⁶ to 3.18 x 10 6), cavitation indices of 0.16 to
3.4, and angles of attack from 0 to 29 deg. The variations in velocity
yielded the corresponding values to achieve Froude scaling. Pressure in
the tunnel was also varied to give cavitation indices that corresponded to
full scale. In effect, two separate evaluations were conducted:
1. Condition I considered both Froude and cavitation scaling under
conditions of external venting and no venting. Cavitation number scaling
was used in order to simulate the full-scale cavitation number. An explana-
tion of this method of scaling has been given by Coder. 1
2. Condition II consisted of Froude scaling only, and pressure was
maintained close to atmospheric in the test section.
Table 1 gives the conditions under which the experiments were
conducted.
TABLE 1 - EVALUATION CONDITIONS
Full Scale Condition I Condition IICaiainCavitation Cavitation
Velocity Cavitation Velocity Number Velocity NumberNumber Number Number
knots knots knots
30 0.832 15 0.85 15 3.4
40 0.468 20 0.49 20 1.9
50 0.300 25 0.30 25 1.2
60 0.208 30 0.21 30 0.86
70 0.153 35 0.16 35 0.63
iCoder, D. W. et al., "Hydrodynamic Design and Testing of HYSURCH SensorBody," NSRDC Report 3304, pp. 28-30 (Apr 1970).
2
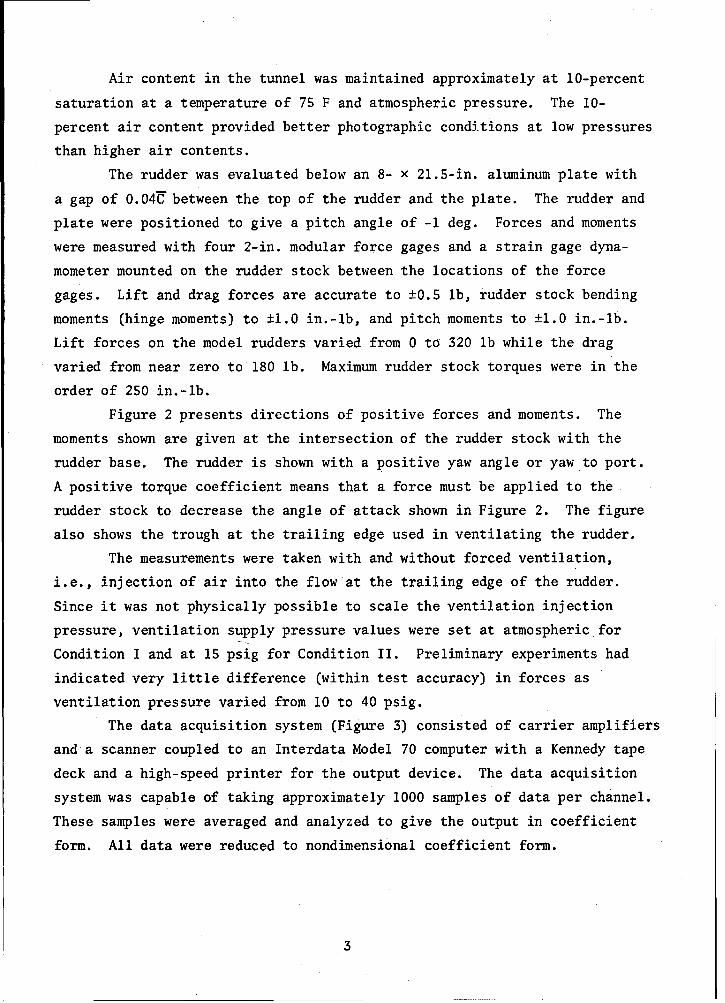
Air content in the tunnel was maintained approximately at 10-percent
saturation at a temperature of 75 F and atmospheric pressure. The 10-
percent air content provided better photographic conditions at low pressures
than higher air contents.
The rudder was evaluated below an 8- x 21.5-in. aluminum plate with
a gap of 0.04C between the top of the rudder and the plate. The rudder and
plate were positioned to give a pitch angle of -1 deg. Forces and moments
were measured with four 2-in. modular force gages and a strain gage dyna-
mometer mounted on the rudder stock between the locations of the force
gages. Lift and drag forces are accurate to ±0.5 lb, rudder stock bending
moments (hinge moments) to ±1.0 in.-lb, and pitch moments to ±1.0 in.-lb.
Lift forces on the model rudders varied from 0 to 320 lb while the drag
varied from near zero to 180 lb. Maximum rudder stock torques were in the
order of 250 in.-lb.
Figure 2 presents directions of positive forces and moments. The
moments shown are given at the intersection of the rudder stock with the
rudder base. The rudder is shown with a positive yaw angle or yaw to port.
A positive torque coefficient means that a force must be applied to the
rudder stock to decrease the angle of attack shown in Figure 2. The figure
also shows the trough at the trailing edge used in ventilating the rudder.
The measurements were taken with and without forced ventilation,
i.e., injection of air into the flow at the trailing edge of the rudder.
Since it was not physically possible to scale the ventilation injection
pressure, ventilation supply pressure values were set at atmospheric for
Condition I and at 15 psig for Condition II. Preliminary experiments had
indicated very little difference (within test accuracy) in forces as
ventilation pressure varied from 10 to 40 psig.
The data acquisition system (Figure 3) consisted of carrier amplifiers
and a scanner coupled to an Interdata Model 70 computer with a Kennedy tape
deck and a high-speed printer for the output device. The data acquisition
system was capable of taking approximately 1000 samples of data per channel.
These samples were averaged and analyzed to give the output in coefficient
form. All data were reduced to nondimensional coefficient form.
3
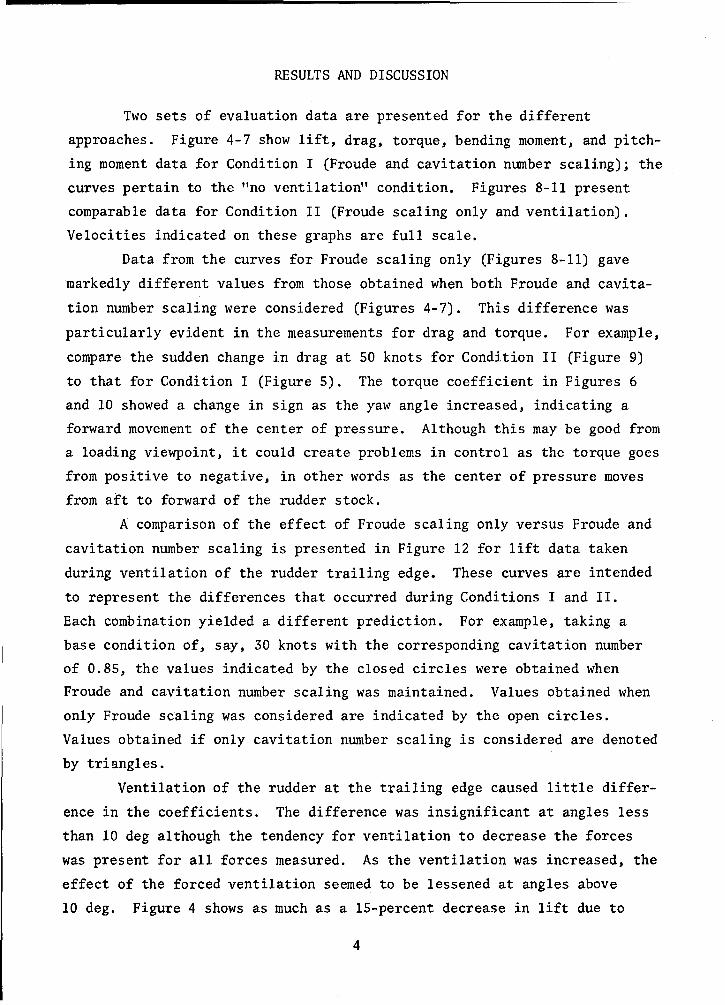
RESULTS AND DISCUSSION
Two sets of evaluation data are presented for the different
approaches. Figure 4-7 show lift, drag, torque, bending moment, and pitch-
ing moment data for Condition I (Froude and cavitation number scaling); the
curves pertain to the "no ventilation' condition. Figures 8-11 present
comparable data for Condition II (Froude scaling only and ventilation).
Velocities indicated on these graphs are full scale.
Data from the curves for Froude scaling only (Figures 8-11) gave
markedly different values from those obtained when both Froude and cavita-
tion number scaling were considered (Figures 4-7). This difference was
particularly evident in the measurements for drag and torque. For example,
compare the sudden change in drag at S0 knots for Condition II (Figure 9)
to that for Condition I (Figure 5). The torque coefficient in Figures 6
and 10 showed a change in sign as the yaw angle increased, indicating a
forward movement of the center of pressure. Although this may be good from
a loading viewpoint, it could create problems in control as the torque goes
from positive to negative, in other words as the center of pressure moves
from aft to forward of the rudder stock.
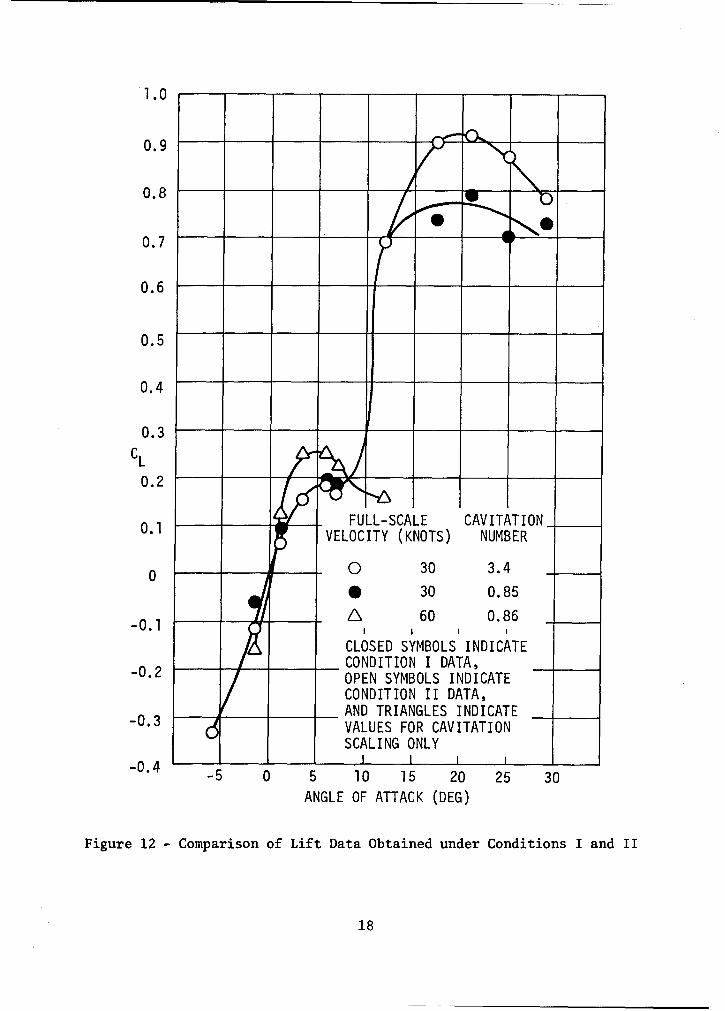
A comparison of the effect of Froude scaling only versus Froude and
cavitation number scaling is presented in Figure 12 for lift data taken
during ventilation of the rudder trailing edge. These curves are intended
to represent the differences that occurred during Conditions I and II.
Each combination yielded a different prediction. For example, taking a
base condition of, say, 30 knots with the corresponding cavitation number
of 0.85, the values indicated by the closed circles were obtained when
Froude and cavitation number scaling was maintained. Values obtained when
only Froude scaling was considered are indicated by the open circles.
Values obtained if only cavitation number scaling is considered are denoted
by triangles.
Ventilation of the rudder at the trailing edge caused little differ-
ence in the coefficients. The difference was insignificant at angles less
than 10 deg although the tendency for ventilation to decrease the forces
was present for all forces measured. As the ventilation was increased, the
effect of the forced ventilation seemed to be lessened at angles above
10 deg. Figure 4 shows as much as a 15-percent decrease in lift due to
4

ventilation at 30 knots, but the decrease amounted to only 6 percent at
40 knots and 2 percent at 50 knots.
Photographs of the model under Condition I are presented in Figures
13-16 for both ventilation and no ventilation at various angles of attack
and simulated full-scale velocities of 30, 40, 50, and 60 and 70 knots.
Photographs of the model under Condition II with ventilation only are
shown in Figures 17-20 at various angles of attack and the same simulated
full-scale velocities.
The photographs give a good indication of the magnitude of cavitation
at various angles of attack. As a general rule, ventilation of the trailing
edge had little effect on the leading edge until cavitation occurred at the
leading edge, at which time the ventilation did extend the size of the
cavity. This was again noted primarily at the lower velocities, e.g.,
Figure 14. As velocity was increased, the effect of ventilation was less
noticeable as indicated in Figures 14-16. Some unsteady flow was noted at
the trailing edge of the rudder, for example, at 7 deg in Figure 17 and at
-5.5 deg in Figure 18.
As expected, the photographs for Condition II showed different cavi-
tation patterns and also a lesser degree of cavitation than that in Condi-
tion I. Compare the various photographs for the ventilation condition only.
One indication of the physical difference in the two approaches to scaling
is the visible presence of the tip vortex in Figures 15 and 16 and the
apparent lack of a tip vortex in the corresponding figures for Froude
scaling only (Figures 19 and 20).
It is generally considered that data obtained by adhering to Froude
and cavitation number scaling give a better indication of full-scale condi-
tions than do data from only Froude scaling at atmospheric pressure. The
present data tend to bear this out.
Drag, torque, lift, and bending moment measurements for Condition I
(Froude and cavitation number scaling) are compared in Figures 21 and 222
to similar data obtained by Gregory and Dobay on high-speed rudders. The
2Gregory, D. L. and G. F. Dobay, "The Performance of High-Speed Ruddersin Cavitating Environment," SNAME Spring Meeting, Lake Buena Vista, Florida(2-4 Apr 1973).
5

comparison data in these figures pertains to a rudder with a geometric
aspect ratio of 1.5 and a thickness to chord ratio of 0.11. Rudder 3 of
the Gregory report is approximately the same as the SES rudder, but the
investigation was conducted in a different facility and at a higher air
content. The SES evaluation required a different facility because of the
low pressures needed to obtain the proper cavitation numbers and because
the required velocities exceeded the limits of the facility used by Gregory.
The Gregory-Dobay data for torque coefficient have been transposed to the
SES rudder stock, and their sign convention2 changed in order to achieve
consistency. There was good agreement for Rudder 3 of the Gregory-Dobay
data2 and Condition I data'of the present investigation.
CONCLUSIONS
1. Both Froude and cavitation number scaling effects must be con-
sidered in order to provide meaningful predictions of full-scale performance
from rudder model data.
2. Ventilation of the rudder had little effect on lift and drag at
velocities greater than 50 knots.
3. Ventilation tended to extend the rudder cavity when cavitation
was present.
4. The movement of the center of pressure of the rudder stock from
aft to forward could present serious problems in control inasmuch as this
causes a reverse in the torque. This movement occurred from 10- to 15-
deg angles of attack at speeds of 30 and 40 knots.
5. There was good agreement between the present data and a previous
evaluation of a similar rudder.
6

8.25"
4.125"1
ROOT CHORD
L.E.R. =0.03411I ~I
Of
C1•00
MIDQCHORD
GEOMETRIC ASPECT RATIO 1.47PROJECTED AREA 57.6 IN.2
TAPER RATIO 0.54SWEEP ANGLE 17.4
i IP CHORD
4.50 r 1 -L.E.R. = o.008"
Figure 1 -Rudder Profile and Section Shapes
7

2I
Figure 2 - Coordinate System Showing Positive
Direction of Forces and Moments
and Angle of Attack
8

................... ..
CARRIER AMPLIFIERS INTERDATA MOD. 70,AND SCANNER KENNEDY TAPE
HIGH-SPEED PRINTER
Figure 3 - Data Acquisition System
9

1.0 I I IVELOCITY (KNOTS)
0.90 30
0. 400.8 - 500.7 A 60 / _A 70
0.6 80 P_
CLOSED SYMBOLS INDICATE0.5 VENTILATION AND OPEN
SYMBOLS NO VENTILATION X0.4 /
CL 0.3LA
0.2
0.1
0
-0.1
-0.2
-0. CL LIFT/ p S)
-0.4-5 0 5 10 15 20 25 30
ANGLE OF ATTACK (DEG)
Figure 4 - Lift Coefficients versus Rudder Angle at Various VelocitiesUsing Cavitation and Froude Scaling (Condition I)
10

I I IVELOCITY (KNOTS)
0.50 30
S40 01
S50
0.4 600.40 e•7070
LI ~80 {II I
CLOSED SYMBOLS INDICATE0.3 VENTILATION AND OPEN ,,
SYMBOLS NO VENTILATION
CD
0.2
0.1 *
CD : DRAG/( ½ p V2 S)
0
-5 0 5 10 15 20 25 30ANGLE OF ATTACK (DEG)
Figure 5 - Drag-Coefficients versus Rudder Angle at Various VelocitiesUsing Cavitation and Froude Scaling (Condition I )
1i

VELOCITY (KNOTS)
0 30
El 40
0 50/A 60
70
80o0.06 i i
CLOSED SYMBOLS INDICATEVENTILATION AND OPEN
0.04 -SYMBOLS NO VENTILATION
0.02 - ----t
CM 0C /2
-0.02
-0.04C TORQUE/( ½ p V S )
-0.06= (CHORDTIP + CHORDROOT)/ 2
_ _ _ _ _ _I III
-5 0 5 10 15 20 25 30ANGLE OF ATTACK(DEG)
Figure 6 - Torque Cavitation Versus Rudder Angle at VariousVelocities Using Cavitation and Froude Scaling (Condition I)
12

0.3 1 1 1VELOCITY (KNOTS)
o 30-40
0.2 ) 50 --
z• 60
Ce 70
0.1
C= PITCHING MOMENT/
0 -CLOSED SYMBOLS INDICATEVENTILATION AND OPEN
-SYMBOLS NO VENTILATION
VELOCITY (KNOTS)0.5 0 30 .
0] 40
0.200.3 70
0.2
-0.1
C= BENDING MOMENT/( ½ p V2 Sb)
-0.2 ---- I-5 0 5 10 15 20 25 30
ANGLE OF ATTACK (DEG)
Figure 7 - Bending and Pitch Moment Coefficients versus Rudder Angle atVarious Velocities Using Cavitation and Froude Scaling (Condition I)
13
ALL DATA FOR VENTILATION CONDITION0.9 I I I . -
VELOCITY (KNOTS)
0.8 - 30 - _i_
* 400.7 -6 50 •-
A 600.6 - 70-
A 80
0.5
0.4
0.3CL L
0.2 A
0.1
0
-0.1
-0.2
-0.3 )- .CL 3 LIFT/( ½ pV2S)
-0.4
-5 0 5 10 15 20 25 30a (DEG)
Figure 8 - Lift Coefficient versus Rudder Angle at Various VelocitiesUsing Froude Scaling Only (Condition IH)
14

I I I ]I
ALL DATA FOR VENTILATION CONDITION
0.5 IVELOCITY (KNOTS)
* 30
* 40
0.4 50o - _/
A 60
4 70
d 80
0.3
CD
0.2
0.1
--icD DRAG/( 2 p V 2 S)
0
-5 0 5 10 15 20 25 30
ANGLE OF ATTACK (DEG)
Figure 9 - Drag Coefficient versus Rudder Angle at Various VelocitiesUsing Froude Scaling Only (Condition IH)
15

VELOCITY (KNOTS)
* 30
* 40
* 50
A 60
4 70 C = (CHORDTIP + CHORDROOT)/2
d 80ALL DATA'FOR CM = TORQUE/( ½ p V SC)VENTILATION I C/2
0.06 CONDITION
0.04
0.02 AC/2M
-0.02
-0.04
-5 0 5 10 15 20 25 30a (DEG)
Figure 10 - Torque Coefficient Versus Rudder Angle at VariousVelocities Using Froude Scaling Only (Condition II)
16

0.3 II IVELOCITY (KNOTS)
* 30
* 40
0.2 50 -
A 60
Ce 4 70
0. .1Ce= PITCHING MOMENT/
(-½ p v2 Sb)
0 ALL DATA FORVENTILATION
IOI iNITIO
VELOCITY (KNOTS)
0.5 •30
* 40
0.3 -- •70 -- "
0.2
0.1
0
-0.12C, BENDING MOMENT/( ½ p V' Sb)
-0.2
-5 0 5 10 15 20 25 30
ANGLE OF ATTACK (DEG)
Figure 11 - Bending and Pitching Moment Coefficients versus Rudder Angleat Various Velocities Using Froude Scaling Only (Condition II)
17
1.0
0.9
0.8
0.7
0.6
0.5
0.4
0.3CL
0.2 e
0.1 FULL-SCALE CAVITATION-0.I VELOCITY (KNOTS) NUMBER
0I0 30 3.4S•30 0.85
-0.1 /k60 0. 86-0.1 I I
CLOSED SYMBOLS INDICATE-0.2 _CONDITION I DATA,
-0.2 OPEN SYMBOLS INDICATECONDITION II DATA,
-0.3 AND TRIANGLES INDICATE-0.•3 VALUES FOR CAVITATION
SCALING ONLY-0.4 1 1 i
-5 0 5 10 15 20 25 30
ANGLE OF ATTACK (DEG)
Figure 12 - Comparison of Lift Data Obtained under Conditions I and II
18

NO VENTILATION VENTILATION
6.00
7.00
17.5
21.0
29.0
Figure 13 - Condition I Corresponding to 30 Knots Full Scale
19

NO VENTILATION VENTILATION
7.00
17.50
21.00
25.00
• •! 29.0°
Figure 14 - Condition I Corresponding to 40 Knots Full Scale
20

NO VENTILATION VENTILATION
6.00
7.00
17.50
21.00
25.00
Figure 15 - Condition I Corresponding to 50 Knots Full Scale
21

NO VENTILATION VENTILATION
60 KNOTS
~~~6.0° 0,:;
70 KNOTS
Figure 16 - Condition I Corresponding to 60 and 70 Knots Full Scale
22

VENTILATION
-5.50 17.50
6.00 21.00
7.00 25.00
12.50 29.00
Figure 17 - Condition II Corresponding to 30 Knots Full Scale
23

VENTILATION
-5.50 17.50
6.00 21.00
7.00 25.00
12.50 29.00
Figure 18 - Condition II Corresponding to 40 Knots Full Scale
24

VENTILATION
12.50
1.50 17.50
6.00 21.00
7.00 25.00
Figure 19 -Condition II Corresponding to 50 Knots Full Scale
25

VENTILATION
1.50
6.00
7.0p
70 KNOTS
LS 12.50
60 KNOTS
Figure 20 - Condition II Corresponding to 60 and 70 Knots Full Scale
26

0.4 -- -=1
O. 21-.\\
0.2a 0. 5
CM/ 2 0 \
-0.2
-0.4 - .
CONDITION I
GREGORY-DOBAY2
0.4
0.3
CD D, 0. 5
0.2 j
0.1
0 -5 0 5 10 15 20 25 30
ANGLE OF ATTACK (DEG)
Figure 21 - Comparison of Torque and Drag Curves for Condition Iand Data from Another Investigation
27

0.5
CONDITION I1• u ,... - ,o 1.0
0.4 --- GREGORY-DOBAY2 E- I
0.3
c 00.2A
0.1 1.0
0 O. 9 00
-0.1 0.8
0.7
CLL0.6
0.5 0.5
0.4
0.3
0.2
0.1 " ,
-0.1
-0.2 €
-0.3
-0.4 -5 0 5 10 15 20 25 30
ANGLE OF ATTACK (DEG)
Figure 22 - Comparison of Bending Moment and Lift Curves forCondition I and Data from Another Investigation
28

INITIAL DISTRIBUTION
SERIAL
1 WES/LIBRARY2 CHONR 4383 ONR BOSTON4 ONR CHICAGO5 ONR PASADENA6 NRL 2627 LIB7 USNA LIB8 NAVPGSCOL LIB9 NROTC & NAVADMINU, MIT
10 NAVWARCOL11 SHIPS 205212 SHIPS 03412/PETERsON13 FAC 032C14 ORD 035/SEIDMAN15 NAVOCEANO 164016 NAVAIRDEVCEN ADL17 NELC LIB18 NAVWPNSCEN19 NAVUSEACEN SAN DIFGO20 NAVUSEACEN PASADENA21 CIVENGRLAB L31 Lip22 NOL23 NWL LIB24 NPTLAB NUSC25 NLONLAB NUSC26 NAVSHIPYD BSN/LIB27 NAVSHIPYD CHASN/LTB28 NAVSHIPYD HUNTERS PT/LIB29 NAVSHIPYD LBEACH/j IB30 NAVSHIPYD MARE/LIR31 NAVSHIPYD MARE 25032 NAVSHIPYD PEARL/LTB33 NAVSHIPYD PHILA 24034 NAVSHIPYD PTSMH/LTB35 NAVSHIPYD BREM/LIR36 SEC 6034B37 SEC 611038 SEC 6114H39 SEC 612040 SEC 613641 SEC 6144G42 SEC 6660.03/BLOUNT NORVA43 AFOSR/NAM44 DDC45 DDC46 DDC47 DDC48 DDC49 DDC50 DDC
29

SERIAL
51 DDC52 DDC53 DDC54 DOC55 DDC56 LC/SCI & TECH DIV57 MMA LIB58 MMA/MARITIME RES cEN59 DOT LIB60 U BRIDGEPORT/URAM61 U CAL BERKELEY/DEpT NAME62 U CAL NAME/PAULLI.G63 U CAL NAME/WEBSTEp64 U CAL NAME/WEHAUSFN65 U CAL SCRIPPS LIB66 CIT AERO LIB67 CIT/ACOSTA68 CIT/WU69 CATHOLIC U/HELLER70 COLORADO STATE U FNGR RES CEN71 CORNELL U/SEARS72 FLORIDA ATLANTIC U OE LIB73 U HAWAII/BRETSCHNEIDER74 U IOWA INST HYDR RES LIB75 U IOWA IHR/KENNELy76 U IOWA IHR/LANDWEpER77 LEHIGH U FRITZ ENGR LAB LIB78 U MICHIGAN NAME/OGILVIE79 MIT OCEAN ENGR LIp80 MIT OCEAN ENGR/ABKOWITZ81 MIT OCEAN ENGR/MANDEL82 MIT OCEAN ENGR/NEwMAN'83 U MICHIGAN NAME LTB84 U MICHIGAN NAME/COUCH85 U MICHIGAN NAME/HAMMITT86 U MICHIGAN NAME/OGILVIE87 U MICHIGAN WILLOW RUN LABS88 U MINNESOTA SAFHL/KILLEN89 U MINNESOTA SAFHL/SCHIEBE90 U MINNESOTA SAFHL/SONG91 U MINNESOTA SAFHL/WETZEL92 NOTRE DAME ENGR LIB93 NOTRE DAME/STRANDHAGEN94 PENN STATE U ARL LIB95 SWRI APPLIED MECH REVIEW96 SWRI/ABRAMSON97 STANFORD U CIV ENGR LIB98 STANFORD U/STREET99 STANFORD RES INST LIB100 SIT DAVIDSON LAB LIB
30

SERIAL
101 SIT DAVIDSON LAB/RRESLIN102 SIT DAVIDSON LAB/TSAKONAS103 U WASHINGTON APL tIB104 WEBB INST/LEWIS105 WEBB INST/WARD106 WHOI OCEAN ENGR DFPT107 SNAME108 BETHLEHEM STEEL NFW YORK/LIB109 BETHLEHEM STEEL SpARROWS110 BOLT BERANEK AND NEWMAN LIB111 EASTERN RES GROUP112 ESSO DES DIV113 GEN DYN ELEC BOAT/BOATWRIGHT114 GIBBS & COX115 HYDRONAUTICS LIB116 HYDRONAUTICS/GERTIER117 LOCKHEED M&S/WAID118 NEWPORT NEWS SHIPpUILDING LIB119 NIELSEN ENGR/SPANGLER120 NAR SPACE/UJIHARA121 OCEANICS/122 SPERRY SYS MGMT LIB123 SUN SHIPBUILDING AERO/HYDRO124 ROBERT TAGGART125 TRACOR
CENTER DISTRIBUTION
SERIAL
126 C 1500 CUMMINS WILLIAM E127 C 1502 STUNTZ GEORGE R JR128 C 1540 MORGAN WILLIAM B129 C 1556 CIESLOWsKI DANIEL S130 C 1556 LAYNE DOUGLAS E
31

UNCLASSIFIEDSecurity Classification
DOCUMENT CONTROL DATA - R & D(Security classification of title, body of abstract and indexing annotation must be entered when the overall report is classified)
1. ORIGINATING ACTIVITY (Corporate author) 20. REPORT SECURITY CLASSIFICATION
Naval Ship Research and Development Center UNCLASSIFIED
Bethesda, Maryland 20034 2b. GROUP
3, REPORT TITLE
FUDDER FORCE AND MOMENT MEASUREMENTS ON A 1/4-SCALE SES 100 RUDDER
4. DESCRIPTIVE NOTES (Type of report and inclusive dates)
5. AUTHOR(S) (First name, middle initial, last name)
Douglas E. Layne
6. REPORT DATE 7a. TOTAL NO. OF PAGES 7b. NO. OF REFS
November 1973 37 28a. CONTRACT OR GRANT NO. 9a. ORIGINATOR'S REPORT NUMBER(S)
b. PROJECT NO. SESPO PM-17 4118
.Task Area S4229 9b. OTHER REPORT NO(S) (Any other numbers that may be assignedthis report)
NSRDC Work Unit 1556-022
10. DISTRIBUTION STATEMENT
APPROVED FOR PUBLIC RELEASE: DISTRIBUTION UNLIMITED
11. SUPPLEMENTARY NOTES 12. SPONSORING MILITARY ACTIVITY
Surface Effect Ship Program Office
13. ABSTRACT
Force and moment measurements were obtained in the NSRDC 36-in.variable-pressure water tunnel on a high-speed rudder with a geometricaspect ratio of 1.47. Data presented adhere to Froude scaling with anattempt to scale appropriate cavitation number. The cavitation indexwas varied from 3.4 to 0.16 for angles of attack of 0 to 29 deg. Lift,drag, and rudder stock torque were all significantly affected by vari-ations in the cavitation number. Additional data are presented forFroude scaling only without considering the effect of cavitation number.The report also indicates a decrease in forces and moments with ventila-tion of the rudder at the trailing edge versus no ventilation.
147R3 (PAGE 1)DP I NOV14 73 PGUNCLASSIFIEDS/N O10l-807.6801 Security Classification

UNCLASSIF lEDSecurity Classification
14. LINK A LINK B LINK CKEY WORDS
ROLE WT ROLE WT ROLE WT
SES 100-Ton Test Craft
1/4-Scale SES Rudder
Froude and Cavitation Scaling
Fround Scaling Only
DDI .1473 (BACK) UNCLASSIFIED(PAGEV 2) Security Classification