i manual. (u) station vicksburg ms geote muuus
TRANSCRIPT
AD10 -A AS 379 COMPARATIVE EVALUATION OF 1 6 POUND SLIDING EIGH ? AND t/ I
SLEEVE-TYPE MANUAL. (U) ARMY ENGINEER NATERNAYSEXPERIMENT STATION VICKSBURG MS GEOTE W N BRABSTON
UNCLASSI1FIED OCT 87 WES/TR/GL-87-25 F/G 8/19 U
MuuuS..ui

dL.! 1.2. 0
1.2
V POCOPY RLSOLUTION TEST CHART
a

O'TIC FILE CGOi"TECHNICAL REPORT GL-87-25
COMPARATIVE EVALUATION OF 10-LB* i SLIDING WEIGHT AND SLEEVE-TYPE
MANUAL COMPACTION RAMMERS FORPAVEMENT DESIGN AND QUALITY
CONTROL APPLICATIONSby
- William N. Brabston00
Geotechnical Laboratory
I .. DEPARTMENT OF THE ARMY
C1 !Waterways Experiment Station, Corps of Engineers>1111111 PO Box 631, Vicksburg, Mississippi 39180-0631
IY-~ADTIC
October 1987Final Report
Approved For Public Release, Distribution Unlimited
87 12 14 064
Prepared for DEPARTMENT OF THE ARMYLABORATORY US Army Corps of Engineers
Washington, DC 20314-1000

Destroy this report when no longer needed. Do not returnit to the originator.
The findings in this report are not to be construed as an official
Department of the Army position unless so designatedby other authorized documents.
The contents of this report are not to be used foradvertising, publication, or promotional purposes.Citation of trade names does not constitute anofficial endorsement or approval of the use of
such commercial products.

tncla,"fified -: °
SECURITY CLASSIFCA'!ON Or T. S PACE
Form ApprovedREPORT DOCUMENTATION PAGE OMNo 0704-0188
!a REPORT SEC,.R.V CLASSP.CATION Ib RESTRICTIVE MARKINGS ,
2a SECuRITY C:A ,i-,CATiON AUTHORIT'? 3 DISTRIBUTIONIAVAILABIL.TY OF REPORT
2D DECLASSI;!CATION DOWNGRADING SCHEDULE Approved for public release;distribution unlimited
4 PERFORMING ORGAN.ZAT'ON REPORT NuMBER(S) 5 MONITORING ORGANIZATION REPORT NuMBER(S)
Technical Report GL-87-2, '
6a NAME OF PERFORMING ORGANIZATION 6b OFFICE SYMBOL 7a NAME OF MONITORING ORGANZATO
I'S A F "I- S (If applicable)
Geoteo.Iulcal Laboratory WESGP-R6c ADDRESS Cty, State, and ZIP Code) 7b ADDRESS (City. State, and ZIP Code)
P0 Bc.x *._ 1, Vicksburg, MS 39180-0631
8a NAME OF K,'NDiNG SPONSORING 8b OFFICE SYMBOL 9 PROCUREMENT ;NSTP,,MENT DENTIFICATION NUMBERGRGA% ZAT ON (If applicable)
US Arm% Corps of Enjineers8c ADDRESS (Cry, State and ZIPCode) TO SOURCE OF FUNDING NUMBERS
PROGRAM PROJECT TASK WORK UNIT
V~dS:i:flbOJ, DC 20314-1000 ELEMENT NO NO NO ACCESSION NO
1! T;TLE (Include Security Classification) %
Ci :%parative Evaluation of 10-lb Sliding Weight and Sleeve-Type Manual Compaction Rammers
fir i1VemtnL Design and uality Control ADlications12 PERSONAL AJTHOR(S)
hrabsto:, t : liam N.13a TYPE OF REPORT 13b TIME COVERED 14 DATE OF REPORT (Year lifonth, Day) 15 PAGE COUNT
tn"ii report FROM TO __L_ b , I16 SUPPLEMENTARY NOTATION
Availible from National Technical Information Service, 5285 Port Royal Road, Springfield,
SA 221bL.17 COSAT CODES 18 SUBJECT TERMS (Continue on reverse if necessary and identify by block number)
F ELD GROuP SUB-GROUP(See reverse)
19 AQSTRAC' (Continue on reverse if necessary and identify by block number)
S tudy was conducted to compare results of laboratory compaction and CBR tests per-
,ornI with I 0-lb sliding weight and sleeve4.)pe compaction rammers on 14 soi ls and onecem<I tsbilized soil. All materials were compacted using the CE-55 compaction effort
ald I-in.-diam molds. Parameters compared were maximum dry density, optimum water con-teiII, ind seaked CBR. Test data were statistically analyzed using linear regression anal-vus ,lnd sigiilicance tests for difference in means with Student's t-distribution.Result:; LI the statistical analyses indicated that there was no significant differencebetwen values of maximum dry density, optimum water content, and CBR obtaiied with either
rammer. 'perator observations did reveal difficulty of soil binding in the sleeve rammerit H ' :ti,e i5 materlals compacted. Recommendations include allowing use of the sleeve-tvpv TIner in lzl(rratory tests on soils for military pavement design. <
20 D0ST 1 BrTON AVArKABtLITY OF ABSTRACT 21 ABSTRACT SECURITY CLASSIFICATION
r-C _;A F E- VtN MED 0 SAME AS RPT 0 DTIC USERS Unclassif led
22a NAME OF RESPONSIBLE INDIVIDUAL 22b TELEPHONE (Include Area Code) 22c OFFICE SYMBOL
DD Form 1473. JUN 86 Previous editons are obsolete SECURITY CLASSIFICATION OF THIS PAGE
Unclassified
, ,,~~~... ... ..... ... ,. ..

ISCCRmtV CLASSIPICATIO 3P FHI P&8SP
18 UJC EMS(otne)

PREFACE
This investigation was sponsored by Headquarters, Office, Chief of Engi-
neers (OCE) under Operation and Maintenance, Army funding. The project was
conducted under the Facilities Investigation and Studies Program. The Techni-
cal Monitor for this investigation was Mr. A. Muller, DAEN-ECE-G.
The study was conducted by personnel of the Geotechnical Laboratory
(GL), US Army Engineer Waterways Experiment Station (WES), under the general
direction of Dr. W. F. Marcuson III, Chief, GL, and Mr. Harry H. Ulery, Chief,
Pavement Systems Division, GL, WES. Principal Investigator was Dr. W. N.
Brabston. Technicians actively involved in the study were Messrs. William J.
Harper (formerly with WES) and Rodgers L. Coffing, Jr., and Mrs. Marie D.
Alexander. This report was prepared by Dr. Brabston and edited by Mrs. Joyce
Walker, Information Products Division, Information Technology Laboratory.
COL Dwayne G. Lee, CE, is the present Commander and Director.
Dr. Robert W. Whalin is Technical Director.
NTIS CRA&!
D' iC TABU .:'r, ::,:rc-
D i l i .' . ; I .......
b V11C
ii l.. . J

CONTENTS
Page
PREFACE...................................................................1I
CONVERSION FACTORS, NON-SI TO SI (METRIC)UNITS OF MEASUREMENT.................................................... 3
2?PART I: INTRODUCTION................................................... 4
Background.......................................................... 4Objective................. ................. ....................... 5Scope................................................ ............... 6Previous Studies ....... o.... ....................................... 6
PART II: EQUIPMENT, SOILS, AND TEST PROCEDURES ........................... 9
Equipment........................................................... 9Soils ...................................................... ..... .... 9Test Procedures.................... .................. .............. 10
PART 11I: TEST RESULTS, PREVIOUS WORK, AND ANALYSES ...........o...... .... 12
Test Results........... ............................................ 12Previous Work................ .......................... ............ 13Statistical Analyses................................................ 14
PART IV: DISCUSSION, CONCLUSIONS, AND RECOMMENDATIONS ................... 17
Discussion.......................................................... 17Conclusions......................................................... 19Recommendations..................................................... 19
REFERENCES................................................................ 20
TABLES: 1-5
FIGURES: 1-21
PHOTO: 1
2

CONVERSION FACTORS, NON-SI TO SI (METRIC)UNITS OF MEASUREMENT
Non-SI units of measurement used in this report can be converted to SI (metric)units as follows:
Multiply By To Obtain
cubic feet 0.02831685 cubic metres
foot-pounds (force) 1.355818 metre-newtons or joules
inches 2.54 centimetres
pounds (force) 4.448222 newtons
pounds (mass) 0.4535924 kilograms
pounds (mass) per cubic foot 16.01846 kilograms per cubic metre
3
COMPARATIVE EVALUATION OF 10-LB SLIDING WEIGHT AND
SLEEVE-TYPE MANUAL COMPACTION RAMMERS FOR PAVEMENT
DESIGN AND QUALITY CONTROL APPLICATIONS
PART I: INTRODUCTION
Background
1. US Army Corps of Engineers' (CE) procedures for development of field
specifications for rigid and flexible road and airfield pavements require
determination of the maximum dry density and optimum water content for base
and subbase course materials and for subgrade soils in fills. For flexible
pavement design, the California Bearing Ratio (CBR) of the various materials
is also required. Laboratory procedures for determining these values are
specified in Military Standard MIL-STD-621A (Headquarters, Department of
Defense 1964). Method 100 of this standard specifies procedures for conduct
of moisture-density tests, and method 101 provides procedures for conducting
the CBR test. Both methods specify that soils be compacted in a 6-in.-diam*
cylinder mold using a 10-lb sliding weight-type compaction rammer (Photo 1a).
2. For pavement design, soils are molded using the CE-55 compaction
effort. rhis effort requires that the soil be compacted in the mold in five
separate layers with each layer receiving 55 blows of the 10-lb rammer falling
18 in. Based on an effective specimen height of 4.6 in. before trimming, the
resulting energy expenditure for five layers is approximately 55,000 ft lb/
cu ft. Soil density and water content are determined directly from the molded
soil specimen. CBR values are determined from CBR tests conducted on the com-
pacted specimen in the mold after a 4-day soaking period. This CBR value is
known as the soaked CBR.
3. The American Society for Testing and Materials (ASTM) and the Ameri-
can Association of State Highway and Transportation Officials (AASHTO) also
have similar test methods. ASTM (1978) test method D-1557 and AASHTO (1982)
test method T-180 have test procedures comparable to MIL-STD-621A, Method 100,
for conducting moisture-density tests. ASTM (1978) test method D-1883 and
* A table of factors for converting non-SI units of measurement to
SI (metric) units is presented on page 3.
4

AASHTO (1982) test method T-193 describe procedures for conducting the CBR
test similar to MIL-STD-621A, method 101. Although the ASTM and AASHTO meth-
ods in general are similar to the MIL-STD-621 methods, one exception is the
use in the ASTM and AASHTO methods of a 10-lb sleeve-type manual compaction
rammer as opposed to the sliding weight rammer specified in MIL-STD-621
(Photo Ib).4. Through general acceptance and use of ASTM, AASHTO, and other agen-
cies' standards throughout the United States, the sleeve-type rammer has
become the predominate type of apparatus used in compaction tests in most com-
mercial and noncommercial soils laboratories. It appears that the primary
agency currently specifying the sliding weight rammer is the CE.
5. This situation gave rise to the question that partially forms the
basis of this investigation; that is, would it be appropriate for the CE to
allow or specify use of the sleeve-type rammer in laboratory compaction tests
involving soils and aggregate materials for pavement design. Current CE pub-
lications for civil works (Department of the Army, Office, Chief of Engineers
1970) specify the sliding weight rammer while military standards for military
pavement design (Headquarters, Department of Defense 1964) specify the slidingweight rammer. In addition the tri-service technical manual for materials
testing specifies in the text that a sliding weight rammer be used for labora-
tory compaction (Departments of the Army, Navy, and Air Force 1971). In view
of the historical involvement of the sliding weight rammer in past studies
pavement test sections from which current military pavement design criteria
were empirically developed, the impact of allowing use of the sleeve-type
apparatus in future laboratory compaction tests must be determined. There-
fore, on that basis, this investigation was undertaken. The scope of this
.;tudy was limited only to parameters involved in pavement design; i.e., maxi-
mum dry density, optimum water content, and soaked CBR.
Objective
6. The objective of this study was to determine whether a significant
difference exists between values of maximum dry density, optimum water con-
tent, and soaked CBR determined from laboratory tests on soils compacted with
10-1b sliding weight and 10-lb sleeve-type manual compaction rammers using the
CE-55 compaction effort and 6-in.-diam compaction molds.
5

Scope
7. The study was conducted as follows:
a. Ten soils representative of materials used in pavement struc-tures or as subgrade soils were selected for the study. Thesoil types ranged from fine-grained subgrade soils to granularbase course materials with emphasis on granular materials.
b. Moisture-density and soaked CBR tests were conducted on eachsoil following procedures indicated in MIL-STD-621-A, Meth-ods 100 and 101, respectively. Two sets of specimens weremolded at comparable water contents using the CE-55 compactioneffort. One set was molded with the 10-lb sliding weight rammerand the second set with the 10-lb sleeve-type rammer.
c. Moisture-density tests were also conducted on one of the granu-lar materialq that had been treated with portland cement toobtain a (.ata point with a stabilized material.
d. Additional moisture-density data obtained from a previouslyunreported Waterways Experiment Station (WES) laboratory studyconducted under similar conditions on four granular soils wereincorporated into the data base prior to analyses of the data.
e. A statistical analysis was conducted on the 15 data sets usinglinear regression techniques and comparison of means for Stu-dent's t-distribution to determine whether there was significantdifference between test results obtained with the two types oframmers.
Previous Studies
8. A number of different studies have been conducted comparing compac-
tion results obtained with different types of manual and mechanical rammers.
Of these, three investigations conducted at WES appear to be most relevant to
this study.
9. Burns (1959) conducted a study to evaluate compaction results
obtained with CE 10-lb sliding weight and ASTM 10-lb sleeve-type manual com-
paction rammers and with several types of mechanical rammers then in use by
various CE division laboratories. The manual rammer comparisons involved
three soils: a fat (plastic) clay (CH)*; a lean (silty) clay (CL); and a
clayey gravel (GC). All soils were compacted using the modified AASHO compac-
tion effort which is similar to CE-55 effort. For the 10-lb rammer and CE-55
effort, a 6-in.-diam mold is normally used. Burns reported, "Compaction
* Classified according to the Unified Soil Classification System (USCS).
6
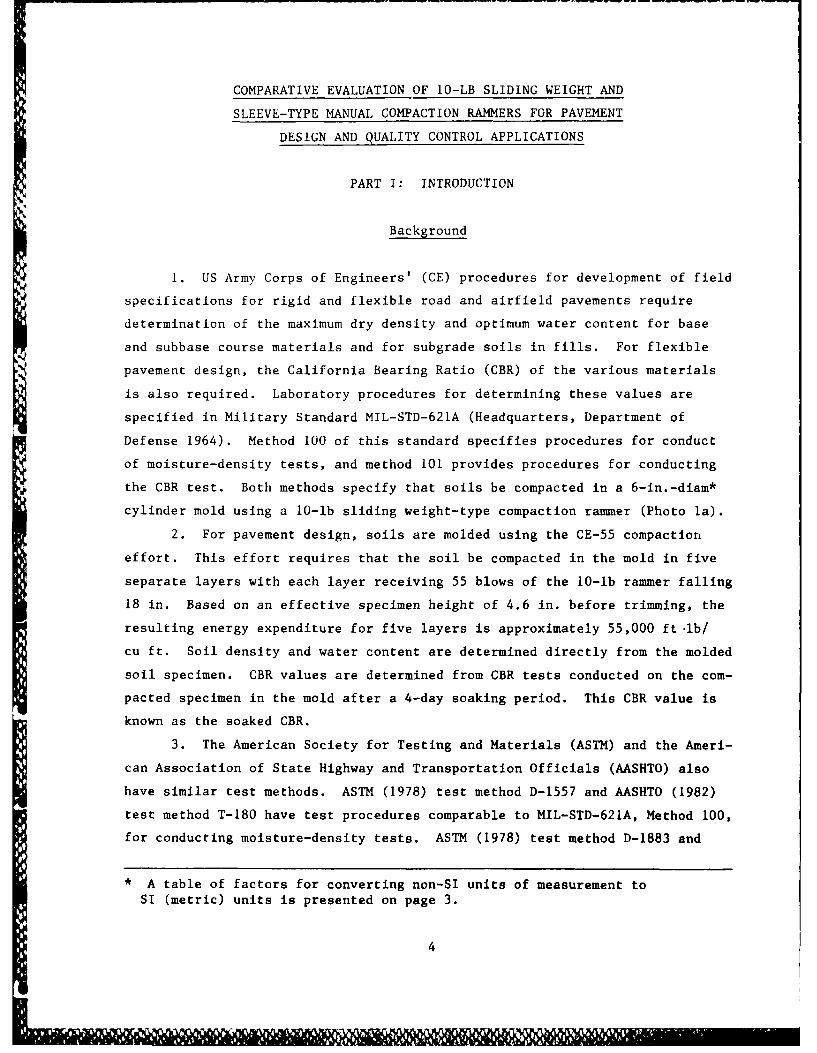
curves developed with the two hammers are identical for the fat clay and clay-
* gravel material, and are in very close agreement for the lean clay soil with
less than 1 lb per cu ft difference in the indicated modified AASHO maximum
density."
10. After establishing an optimum water content for each soil, 10 spec-
imens were molded with each type of rammer as close as possible to the optimum
water content using the same compaction effort to evaluate reproducibility of
results. Test results indicated a difference in mean dry density values
obtained with the two rammers of 0.2, 0.6, and 0.6 lb/cu ft for the CH, CL,
and GC materials, respectively.
11. One interesting observation made in this study concerning use of
the sleeve rammer was that it was necessary to stop application of blows fre-
quently and clean soil from the bottom of the rammer and from inside the
sleeve particularly when compacting specimens on the wet side of optimum. If
this had not been done, the report states, the rammer would have jammed in the
sleeve or a lower density would have been obtained. This operational diffi-
culty with the sleeve-type rammer has historically been one of the primary
reasons for the use of the sliding weight rammer.
12. Durham and Hale (1977) conducted a study which involved comparing
test results obtained with 5.5-lb sliding weight and sleeve-type manual com-
paction rammers using standard compaction effort. The standard effort
involves compaction energy of approximately 12,375 ft-lb/cu ft. A cylindrical
compaction mold 4 in. in diameter and 4.5 in. high was used in the study.
Three soils were tested--two Vicksburg silty clay materials (ML and CL) and
Vicksburg buckshot clay (CH). The former two materials and the latter mate-
rial are similar to the CL and CH soils, respectively, tested in the study by
Burns. One significant conclusion of the study was that test results obtained
with the sleeve-type rammer indicated higher maximum dry density values and
lower optimum water content values than those obtained with the sliding weight
rammer. Differences in mean values of maximum densities and optimum water con-
tents obtained with the two rammers were 2.0 lb/cu ft and 1.0 percent,
respectively.
13. Horz (1983) conducted a study to evaluate results obtained with
various types of manual compaction rammers. Included in the study were evalu-
ations of the 10-lb sliding weight rammer specified in MIL-STD-621A and the
10-lb ASTM sleeve-type rammer. Five soils were evaluated in this portion of
7

the study--a plastic clay (CH), a lean and a silty clay (both CL), a silty
sand (SM), and a gravelly clayey sand (SC). The CH and CL materials were
Vicksburg buckshot and Vicksburg silty clay materials, respectively. All
materials were compacted using a modified compaction effort similar to the
CE-55 effort. All soils except the SC material were compacted in a 4-in.-diam
%. mold. For this procedure, the soil was compacted in five layers with each
layer receiving 25 blows with the 10-lb rammer. The SC material was compacted
in a 6-in. mold in five layers, each receiving 56 blows of the 10-lb rammer.
* A conclusion of the study was that the 10-lb sliding weight-type rammer pro-
*l duced lower maximum dry density and higher optimum water content than the
sleeve-type rammers. Test data indicated that the mean differences in maximum
dry density and optimum water content values were 0.8 lb/cu ft and 0.2 percent,
respectively.
8

PART II: EQUIPMENT, SOILS, AND TEST PROCEDURES
Equipment
Compaction rammers
14. A view of the 10-lb sliding weight rammer is shown in Photo Ia.
This rammer is standard equipment specified in MIL-STD-621A to be used for
laboratory compaction of soils for ptvement design and quality control. The
rammer has a 10-lb sliding weight which is dropped from a height of 18 in.
onto a 2-in.-diam spring-cushioned steel foot which impacts on the soil. Fall
path of the sliding weight is controlled by a 5/8-in.-diam guide rod. A view
of the 10-lb sleeve-type rammer is shown in Photo lb. This rammer conforms to
requirements indicated in ASTM method D-1557 and AASHTO method T-180. The
rammer consists of a 2-in.-diam 10-lb weight attached to a shaft that passes
through the top of a hollow cylindrical guide sleeve. In compaction, the
shaft-rammer unit is raised manually and dropped from a height of 18 in. so
that the foot of the 10-lb weJght impacts directly on the soil.
Mold
15. Soil specimens were compacted in a 6-in.-diam cylinder mold con-
forming to specifications indicated in MIL-STD-621A (Figure 1). The mold is
7 in. high with a collar extension approximately 2 in. high. A metal spacer
disc, 5-15/16 in. in diameter and 2-1/2 in. thick is placed in the bottom of
the mold during compaction. The compacted and trimmed specimen is thus 6 in.
in diameter and 4-1/2 in. high.
Soils
16. Ten soil materials were selected for the study. Of these 10 mate-
rials, it was desired that two should meet gradation requirements for base
courses and three meet gradation requirements for subbase courses, as speci-
*fied in the tri-service manual (Departments of the Navy, the Army, and the
Air Force 1978). The rempining soils were considered to be subgrade materials
with emphasis on granular-type soils. One soil, in addition to being tested
in the unbound state, was tested with 6 percent po:tland cement added prior to
compaction to obtain a data point on stabilized soils. A listing of the vari-
ous materials along with a description of each one is given in Table 1.
9

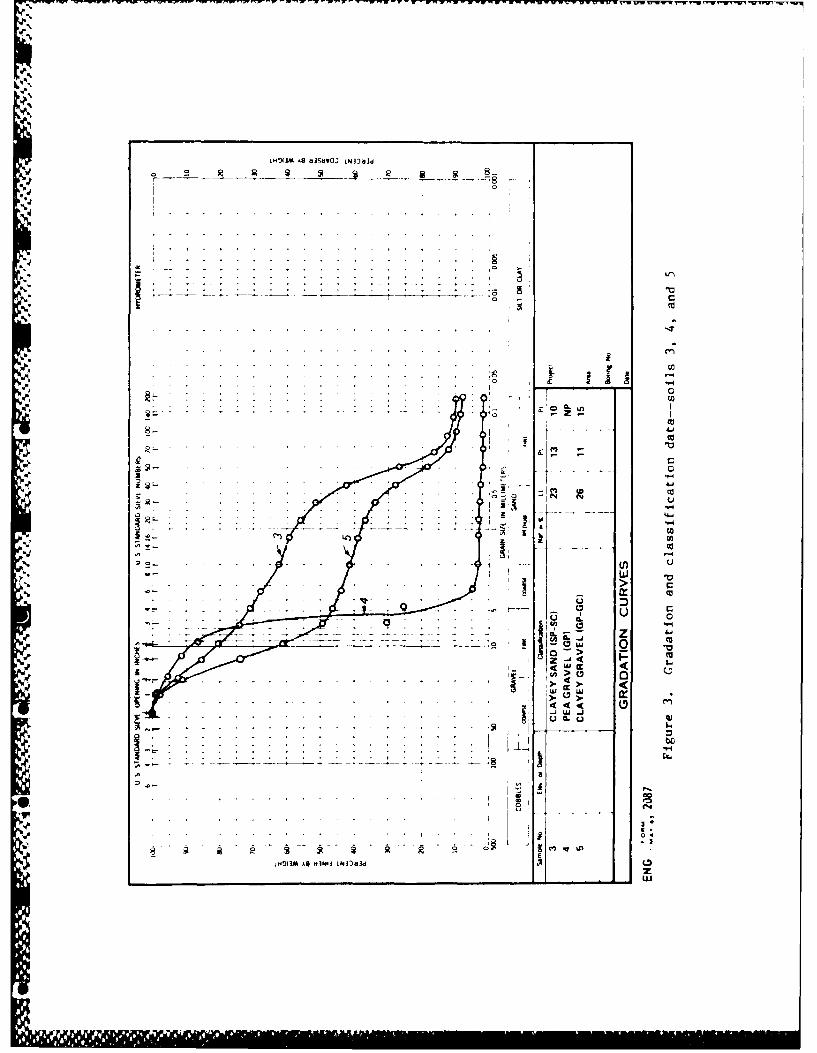
Gradation curves and classification data for these materials are shown in Fig-
ures 2-5. As can be seen from Table i, the wide range of material types
desired for the study was generally achieved. The Florida limerock, however,
did not meet base course gradation requirements.
Test Procedures
Preparation of soils
17. The soil samples were first air-dried and then passed through a
3/4-in. and/or 1/4-in. sieve. For materials having particle size greater than
3/4 in., the +3/4-in. portion was removed and replaced with an equal amount of
material that passed the 3/4-in. sieve but was retained on the 1/4-in. sieve.
Soil and sand aggregations were broken down to pass the 1/4-in. sieve without
degradation of actual aggregate particles. After initial determination of
water content, an amount of water calculated to bring the sample to the
desired water content was added to and thoroughly mixed into the soil, which
was then sealed in a container and allowed to equilibrate for 24 hr. Gener-
ally, five samples were processed, each at a different water content, to pro-
vide a sufficient number of compacted specimens to adequately define the
moisture density relations. If necessary, additional specimens were prepared
to extend the data range to higher or lower water contents.
Compaction procedures
18. Next, one set of soil specimens was compacted in 6-in.-diam molds
with a 10-lb sliding weight rammer following procedures indicated in
MIL-STD-621A. For each molded specimen, the soil was compacted in five layers
with each layer receiving 55 blows of the compaction rammer. As procedures
indicate, the thickness of the soil layers was such that after compaction the
total thickness of the specimen was between 4.6 and 5.1 in. After each speci-
men was compacted, the soil was carefully trimmed flush with the top of the
mold. After compaction tests had been completed with the sliding weight ram-
mer, a second set of soil specimens was compacted with the 10-lb sleeve-type
rammer following similar procedures. To obtain specimens compacted with each
rammer at comparable water contents, the same soil from any one container at a
particular water content was used in both tests. To minimize water loss dur-
ing the time lag between compaction with the two rammers, the container was
maintained tightly sealed. In addition, prior to compaction with the sleeve
10
La l

rammer, soil moisture content was monitored and any necessary adjustments were
0made to ensure that there was no large difference in the water contents of the
specimens compacted with the two rammers using soil from the same container.
One operator compacted all specimens. The operator was requested to note and
record any difficulty encountered with either rammer.
Density and water content measurements
19. Wet density values were calculated directly from known weight of
soil and volume of the mold. Water content values were determined from soil
removed during trimming and from samples from the batched materials. This was
done because the molded specimens were required intact for later determination
of CBR values. Soaked CBR values were determined following procedures indi-
cated in MIL-STD-621A. Prior to conduct of the CBR penetration test, the sam-
ple was immersed in water in the mold for a 4-day soaking period. During
soaking, a 10-lb surcharge plate was positioned on top of the specimen. After
soaking, the CBR penetration test was conducted directly on the specimen in
the mold.
411
.'
.. . .. . . ... . .

PART III: TEST RESULTS, PREVIOUS WORK, ANp ANALYSES
Test Results
% _'). Results of the moisture-density and CBR tests are presented in Fig-
ures 6-16 as plots of dry density versus water content and CBR versus water
content. Values oi maximum dry density, optimum water content, and the asso-
Sciated CBR value are indicated in Table 2. Values of maximum dry density were
determined in the conventional way, i.e. the density value indicated at the
peak of the moisture-density curve. Optimum water content was taken as the
w-ater coutent associated with the maximum dry density. CBR values indicated
in Table 2 are those values associated with the optimum water content as indi-
cated on the CBR-water content plot. Also indicated in Table 2 are mean val-
*ues of dry density, water content, and CBR for all test data and standard
deviation from the mean; differences between the individual values obtained
with the sliding weight rammer and those obtained with the sleeve-type rammer;
. and mean difference and standard deviation from the mean. Operator comments
V$ are also noted.
21. The test data indicate very close agreement between results
obtained with each type of rammer. Difference in density values ranged from
-1.2 to +2.4 lb/cu ft with a mean difference of +0.5 lb/cu ft and a standard
* deviation of 1.0 lb/cu ft. Of 11 pairs of test data, sleeve rammer densities
were higher than sliding weight rammer densities in six cases, lower in two
cases, and there was no difference in density values in three cases. Differ-
ences in optimum water content ranged from -1.1 to +1.4 percent with a mean
difference of 0.2 percent and standard deviation of 0.7 percent. Optimum
water content values obtained with the sleeve rammer were lower than those
obtained with the sliding weight rammer in two cases, higher in seven cases,
and equal in two cases. In two cases, clayey sand (soil No. 3) and buckshot
clay (soil No. 6), sleeve rammer densities were higher and optimum water con-
tents were lower than values obtained with the sliding weight rammer. Values
of CBR indicated differences ranging from -11 to +39 with a mean difference of
7.6 and standard deviation of 15.2. CBR values obtained with the sleeve ram-
mer were higher than those obtained with the sliding weight rammer in seven
cases and lower in three cases.
12

22. Operator comments indicate that the operator encountered difficulty
with soil binding in the sleeve rammer with 6 of the 11 materials; however,
the cement stabilized gravel (soil No. 11) and the clayey gravel (soil No. 5)
were the same basic soils.
Previous Work
23. Data were also available from a similar investigational effort pre-
viously conducted, but not reported, at WES. These tests were conducted by
another operator. The work involved conducting compaction tests on four gran-
ular materials to compare results obtained with the 10-lb sliding weight and
10-1b sleeve-type compaction rammers similar to this study. Procedures fol-
lowed and equipment used were identical to :hose in this study, i.e.
MIL-STD-621A Method 100 and the two rammers, except that no CBR tests were
conducted. The four soils involved in the study are described in Table 3.
Gradation and classification data for these materials are shown in Figure 17.
K-' The materials are indicated as soils 12 through 15 in Table 3 and Figure 17.
. , Test results, presented as plots of dry density versus water content are shown
" in Figures 18-21. Values of maximum dry density and optimum water content are
shown in Table 4 along with mean values, difference in individual values
obtained with each rammer, mean differences, and standard deviations. It
should be noted that the maximum dry density values for the limestone were
estimated since there was no peak in the moisture-density plot for that mate-
rial. Operator comments are also indicated in Table 4.
24. The data in Table 4 indicate that differences between the densities
obtained with the sliding weight rammer and those obtained with the sleeve
rammer ranged from -0.2 to +0.4 lb/cu ft with a mean value of +0.2 lb/cu ft.
Standard deviation was 0.3. Sleeve rammer densities were higher in two cases,
lower in one case, and equal in one case. Differences in optimum water con-
tent ranged from -0.6 to +0.4 percent with a mean value of -0.1 percent.
Standard deviation was 0.4. Optimum water content values were lower for the
sleeve rammer data in three cases and higher in one case. In two cases, clean
sand (soil No. 12) and limestone (soil No. 15), the sleeve rammer density was
higher and the optimum water content was lower than the sliding weight rammer
data.
13
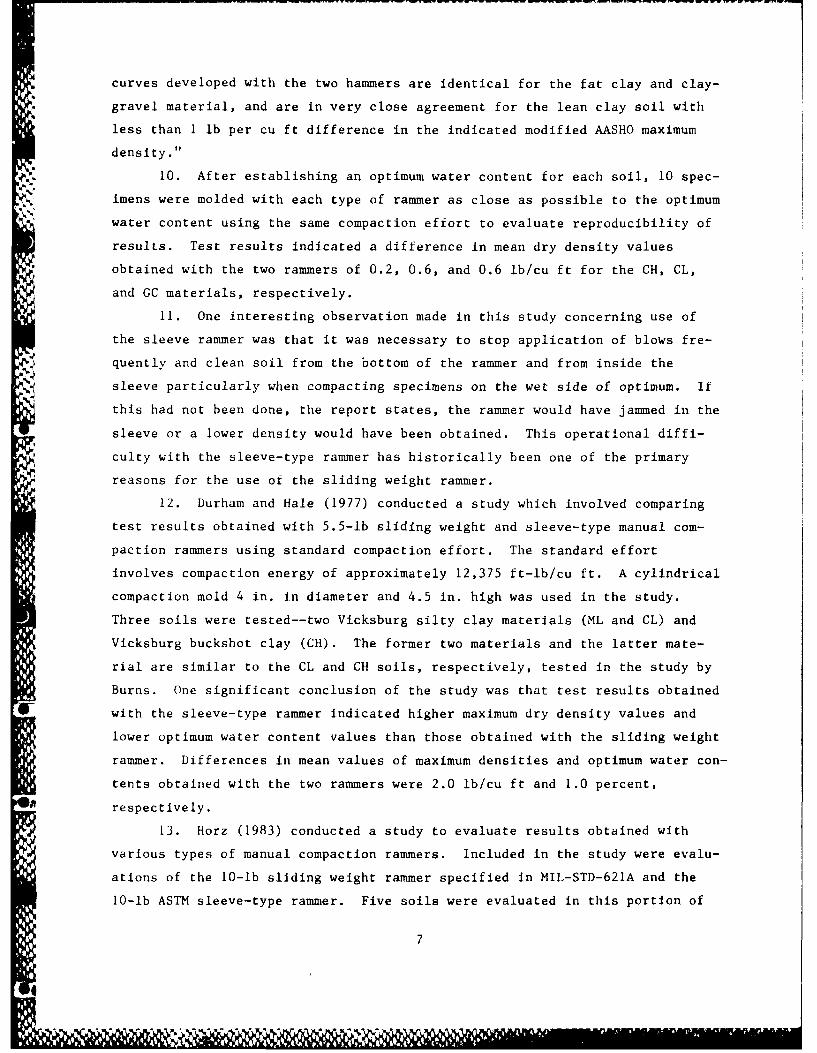
25. Operator comments indicate that there was difficulty with soils
binding in the sleeve rammer for the gravelly sand (soil No. 13) and the
gravelly clayey sand (soil No. 14).
Statistical Analyses
Linear regression
26. All data from both groups of tests are summarized in Table 5.
Least squares linear regression analyses were conducted on the maximum dry
density, optimum water content, and CBR data pairs. The combined data base
yielded 15 data pairs for the density and water content data and 10 data pairs
for the CBR data. In the regression analyses, the sliding weight rammer data
-' were the dependent variables and the sleeve rammer data were the independent
variables. The general linear regression equation Is:
Y = a0 + a I X
where
4. Y = dependent variable
a0 = intercept
a1 = slope
X = independent variable
Results of the linear regression analyses are given in the tabulation below.
Sliding Weight Sleeve-TypeRammer Rammer
Stan- Stan-dard dard
Data Devi- Devi- 2Source Units n Mean ation Mean ation 0 1 R2
Maximum pcf 15 123.0 14.0 123.4 13.7 -3.166 1.023 0.99
drydensity
Optimum percent 15 8.8 4.6 8.9 4.5 -0.207 1.011 0.98
water
content
CBR - 10 67.5 39.1 75.1 40.8 0.743 0.889 0.86
2* R = Correlation coefficient.
Results of the linear regression analyses indicate excellent correlations for
the paired maximum dry density and optimum water content data sets as
14
i'5 6 iili i 1

evidenced by (a) values of the slope coefficient approaching unity, (b) low
values of the intercept coefficient, and (c) very high value of the correla-
tion coefficient. Good correlations were also obtained with the CBR data;
however, for several data pairs, differences between CBR values obtained with
the two rammers were large.
Significance tests
27. An analysis of difference in means for paired samples with Stu-
dent's t-distribution was also conducted. Student's t-distribution was
assumed because of the small number of data pairs involved (n < 30). For this
analysis, the null hypotheses H0 is: there is no difference in the mean
values of the paired data sets, i.e.,
HO: P = P12
where
Pi = means of the data sets
The alternative hypotheses H is: there is a difference in means, i.e.,
~~I: hi
The null hypothesis is rejected if the absolute value of the test statistic t
computed from the experimental data is greater than the t-value determined
from standard t-tables for the desired level of significance a for the
degrees of freedom dictated by the size of the data base, (n-i). The table
t-value is generally designated t . For these data, a significance levelta,n-I•
(risk of erroneously rejecting the null hypothesis) of 0.05 was selected. For
the density and water content data t 4 2.145; for the CBR data,.05,14
t = 2.262..05,9
28. Results of the significance tests are as follows.
Test
Statistic Conclusion onData Source t t, n-IData Source___ a, n-I vs a, n-I Null Hypothesis
Maximum dry density 1.63 2.145 1.63 < 2.145 Cannot reject
Optimum water content 0.70 2.145 0.70 < 2.145 Cannot reject
CBR 1.59 2.262 1.59 < 2.262 Cannot reject
15

These results indicate that for all three data sets the test statistic is less
than the table statistic and, therefore, the null hypotheses cannot be
rejected. Thus, it may be concluded that there is no significant difference
between the mean values of maximum dry density, optimum water content, and CBR
obtained with the two compaction rammers.
16
4

PART IV: DISCUSSION, CONCLUSIONS, AND RECOMENDATIONS
Discussion
=4, 29. A review of the test results and statistical analyses of the data
in this study indicates no significant difference between mean values of maxi-
mum dry density, optimum water content, and CBR data obtained with either the
sliding weight or the sleeve-type compaction rammers. The results agree with
those found in the study by Burns (1959) which involved three soils, two of
which were similar to those used in this investigation, i.e., Buckshot clay
*and Vicksburg lean clay. The procedures and equipment used in the Burns study
were also similar to those used in this investigation, i.e., similar compac-
tion rammers and 6-in.-diam molds. Results of this test did not agree with
the findings by Durham and Hale (1977) reported in a study which also involved
Buckshot clay and two Vicksburg silty clays. However, in their study, stan-
dard compaction effort was applied using 5.5-lb rammers and 4-in.-diam molds.
The results of this study also do not agree with the findings by Horz (1983)
which also involved Buckshot clay and Vicksburg silt clay. In the Horz study
on five soils, modified compaction effort was applied and 10-lb rammers were
used; however, four of the soils were compacted in 4-in.-diam molds and one
soil was compacted in a 6-in.-diam mold. Of the 15 materials analyzed in this
study, there were only four cases (soils 3, 6, 12, and 14, Table 5) in which
the sleeve rammer results indicated both higher maximum density and lower
optimum water content--a combination necessary to demonstrate separate and
listinct compaction curves. A review of the compaction curves for these mate-
riais (Figures 8, 11, 18, and 20) indicates that in only two cases (Figure 11
and Figure 20) are the compaction curves for the sleeve rammer clearly shifted
to the left and above the curves for the sliding weight-type rammer. Respec-
tive soils involved were buckshot clay (CH) and a gravelly clayey
sand (SP-SL). The absence of evidence of significant difference in test
results with the two rammers indicated in this study and the one by Burns
(1959) and the opposing conclusions found in the studies by Durham and Hale
(1977) and by Horz (1983) suggest that the difference in findings might be
because of the use of different equipment, i.e., mold size and rammer configu-
ration even though the calculated energy input values were approximately
equal.
* 17
NO& 'i *1

30. Test results on the Buckshot clay (from this study and from those
by Durham and hale and by Horz) suggest, however, that, for a highly plastic
material, use of different compaction rammers or procedures (i.e., rammer and
mold) might possibly yield distinctly different compaction curves. Certainly,
no conclusion can be reached from the data available, and test results on the
same soil do not concur (Burns 1959). The study reported herein was directed
toward granular materials and did not involve the more plastic soils to any
significant degree. Therefore, it would appear that a similar study involving
a significant number of moderately to highly plastic soils possibly should be
undertaken in the future.
31. As noted, this investigation primarily involved granular soils.
Therefore, test results for the CBR data exhibited more variation and scatter
than did those for the density or water content data. Such variation is com-
mon with granular materials, particularly those with larger particle sizes.
For these materials, reproducibility of CBR test results is often difficult.
It should also be noted that the scope of this study did not permit replica-
tion because of the large number of soils Involved. However, it was recog-
nized that the use of single-point comparisons of random variables,
particularly those that exhibit a wide frequency distribution such as CBR val-
ues for granular soils, could involve some difficulty in data interpretation.
32. One important result of this investigation was the report of diffi-
culties encountered by the two operators with soil binding in the sleeve ram-
mer during compaction. This phenomenon was evident for 8 of the 15 soils
involved (soils 3, 5, 7, 9, 10, 11, 13, and 14, Table 5). This problem was
also noted by Burns in his report. There appears to be no specific correla-
tion between soil characteristics and whether difficulty was encountered. For
the soils with which binding was experienced, an examination of gradation and
classification data (Figures 3, 4, 5, and 17) indicates the plasticity
index (PI) ranged from nonplastic (NP) to 17 and the fines content (percent <
0.074 mm) ranged from 3 to 100 percent. Thus, it is obvious that for any type
soil, the operator must exhibit extreme care when using the sleeve device and
take necessary precautions to ensure that the interior of the sleeve is free
from soil particles that would cause binding and possibly invalidate test
results.
18
4. ... .. ... .. .. . . ..

Conclusions
33. The following conclusions are made based on the work and data anal-
yses conducted under this investigtion and on work by other investigators
reported herein.
a. There is no significant difference between the values of maxi-mum dry density, optimum water content, and CBR obtained onsoils compacted with the 10-lb sliding weight and 10-lb sleeverammers for the CE-55 compaction effort with 6-in.-diam compac-tion molds.
b. There is evidence to indicate that the use of a 4-in.-diam moldfor laboratory soil compaction may yield test results differentfrom those obtained with a 6-in.-diam mold.
c. When using the sleeve-type rammer, there is considerable poten-tial for soil to bind between the interior sleeve wall and theside of the rammer foot which could result in invalid or erro-neous test results.
d. Although there is no conclusive evidence, the test data do sug-gest the possibility that results of compaction tests on highlyplastic soils may differ with rammer type.
Recommendations
34. The following recommendations are made based on the results of this
study.
a. Allow the use of the 10-lb sleeve-type rammer (often referredto as the 10-lb ASTM rammer) in the laboratory compaction ofsoils for military pavement design only; however, when the soilis compacted in a 6-in.-diam mold allow the use of the CE-55compaction effort.
b. hake the operator thoroughly aware, under the conditions indi-cated in a above, of the necessity of maintaining the device insuch a condition as to prevent binding of soil in the sleeve.
C. Undertake a study to investigate the effect of the use of dif-ferent compaction procedures at the same compaction energylevel on test results. The study should include the use of5.5- and 10-lb rammers and 4- and 6-in.-diam molds for theCE-12 (standard) and CE-55 (modified) compaction energy levels.
* Because of the inclusion of the 4-in.-diam mold, only sandy and
fine-grained soils should be investigated.
d. Undertake an adjunct study to the one recommended in c toinclude only highly plastic soils.
19

REFERENCES
American Association of State Highway and Transportation Officials. 1982(July). "Standard Method of Test for Moisture-Density Relations of SoilsUsing a 10-lb (4.54 kg) Rammer and an 18-in. (457 mm) Drop." AASHTO Designa-
- tion T 180-74 Standard Specifications for Transportation Materials and Methods
of Sampling and Testing, Part II, Methods of Sampling and Testing, Washington,
DC.
_ _ 1982 (July). "Standard Method of Test for the California Bearing
Ratio" AASHTO Designation T 193-81. Standard Specifications for Transporta-tion Materials and Methods of Sampling and Testing, Part II, Methods of Sam-pling and Testing Washington, DC.
American Society for Testing and Materials. 1978. "Standard Test Methods forMoisture-Density Relations of Soils and Soil-Aggregate Mixtures Usingiu-lb (4.54 kg) Rammers and 18-in. (45? mm) Drop." Designation D 1557.
___1978. "Standard Test Material for Bearing Ratio of LaboratoryCompacted Soils." Designation D 1883.
Burns, C. 1). 1959. "Comparison of Compaction Data Developed by Various Typesof Mechanical and Hand Compaction Hammers," Miscellaneous Paper No. 4-357,US Army Engineer Waterways Experiment Station, Vicksburg, Miss.
Departments of the Navy, the Army, and the Air Force. 1971. "Materials Test-ing, Army TM 5-530; N~vy NAVFAC MO-330, and Air Force AFM 89-3," Washington,DC.
1978 (Aug). "Flexible Pavement Design for Airfields,"Navy Dm 21.3/Army TM 5-825-2/Air Force AFM 88-6/Chap 2.
Department of the Army, Office, Chief of Engineers. 1970. "Laboratory SoilsTesting," Engineer Manual EM 1110-2-1906, Appendix VI, Washington, DC, 1970.
Durham, Gary N., and Hale, Gene P. 1977. "Evaluation of Mechanical andManual Compactors in Standard Effort Compaction Tests," MiscellaneousPaper S-77-4, US Army Engineer Waterways Experiment Station, Vicksburg, Miss.
Headquarters, Department of Defense. 1964 (Dec). "Test Method for PavementSubgrade, Subbase, and Base Course Materials," MIL-STD-621, Washington, DC.
Horz, Raymond C. 1983 (Sep). "Evaluation of Revised Manual Compaction Rammersand Laboratory Compaction Procedures," Miscellaneous Paper GL-83-20, US ArmyEngineer Waterways Experiment Station, Vicksburg, Miss.
20

Table 1
Description of Soil Types
Soil USCSNo. Nomenclature Classification Description
1 Crushed limestone GW Graded crushed limestone aggregate--met gradation requirements for100 CBR base course except below-specification on the No 10 sieve.
2 Limerock SM Crushed Florida limerock--the sampledid not meet base course require-ments due to poor grading.
3 Clayey sand SP-SC A local pit-run gravel--met gradingrequirements for 40 CBR subbasecourse.
4 Pea gravel GP A local washed aggregate of uniformsize (95 percent 1/4-1/2 in.)--metgrading requirements for 50 CBRsubbase course.
5 Clayey g~avel GP-GC A blend of local pit and washedgravels designed to obtain theindicated gradation--met gradationrequirements for 50 CBR subbasecourse.
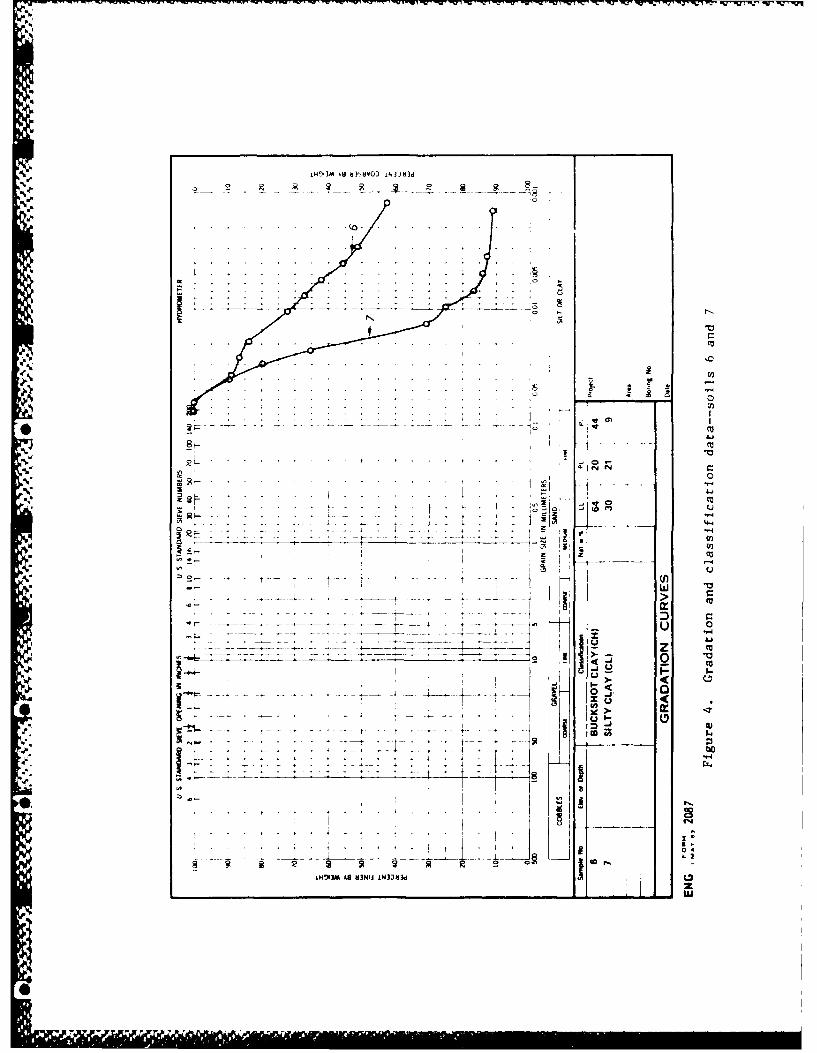
6 Buckshot clay CH A highly plastic local alluvialclay--subgrade material.
7 Silty clay CL Vicksburg loess--subgrade material.
8 Yuma sand SP-SM A nonplastic sand material fromYuma, Arizona--subgrade material.
9 Sand buckshot SM-SC A mixture of silty sand with someblend buckshot clay--subgrade material.
10 River sand blend SM A blend of silty sand and coarse-grained river sand--subgradematerial.
11 Cement stabilized GP-GC Clayey gravel (No 5) stabilized withgravel 6 percent portland cement.
@4

U, C~
> > > >a, a, a, a, a, a,4 U, a, a, 4, a, U,,
C - - - - - -
-- U, U, U, U, U, U,UI U, U U, U, U,U, 41 U, U, U U,C C -v C N VC U, U, U, U, U,
.14 .14 .14 .14.14 14
C C 0 C C C
"I..
V -c 7-i
- 7 ~ N C' I CI'-I' -~- +
~ 7. CI'I S 'U' 7~ I Ut -xx - '-' -
a, 4,1~ U,~L 'U' -
s~ c4,CE C' C- '- -U, C- -~ 7- -7 -s I r-. 0'U, -"2 C- - C -S - 17- 7, 1-- .7- -14 7-a ~O,7 - -
Vt U 'Ut
o a-'C a, ~I' 7- -c N - - -U, - C 71
S U, a- . . . . .41 U, a, - C - C C C C
a, U- + + + + + 4-
* U,U, C Ca, I~,t
U, a-o a, ala-
ua->aUt-.-orrr-~a,,n-.,r-. C 0'--
71 a- I aE 7 ~., -c e. ~ ,~ .~ .14 .14, ~ ~
a, .' 12 11114- 7- I C
3 2'U1- 2 ~14
2 C,-.14a, C 7-~7-. 41 lI ~ - -s ,c C 7-IIN 7- 14 N II' -.7 7- C C 1-' 14 7-
-4,44, - - - -Vt~X
1.''
.4,
U, U,U, a, ~U. - -~ IN C- c-a - 4--I Ut C
a,- I ~ c o - - o -+ C C + I +
a- U, -U, 0a,
U- CC,
U, 41a-> a- >4, U7 COO' "7-0 ~14 14 COa- ~ 4,fl 2
7-7- CCI 7-14 7-U C 7-2 '2 7- - 7- C I" 0 0 7- 7-4 7- IN -U, 11414--------------
ZU,4a-C0~O0'CU7-7-
41 U LU Z U U
4.414, 3 ~ I 2. 14 -1 I I ZLU 11, 2. 0 2. U 0 2. Z
114 0 114 :11 0
I *0 -I U, 41I a, >I - V 2
a. 414'.2 U, a-41 - 11'~ ICI41 41 41 0 A
41 'C U, - .2 .2 U,
- 2 41 a. 41 V .~ U, ~
U 41 0 U 4 U, 44 2o U,. ~ U, .2 2 A 4,1 14a. 41 ~ 41 a, >-, I I- 2M 2 U, 404~~ U, U 2 41
U, - 2 U ~.,U,. U,.M I-' 2 V 41 41 II41241 U-7412'4 - 41 .' U,.UU,41 .4 41.1 4.4 2. U ~ 114 U,. 444 4' LU Va.
41
7- -~ U4UO 0 - 41

Table 3
Description of Soils in Previous Study
Soil USCSNo. Nomenclature Classification Description
12 Clean sand (SP) A local washed concrete sand--metrequirements for 30 CBR subbasecourse.
13 Gravelly sand (SP) Local pit-run gravel material--metrequirements for 40 CBR subbasecourse.
14 Gravelly clayey (SP-SC) Local pit-run gravel material--metsand grading requirements for 40 CBR
subbase course.
15 Limestone (GP) Graded crushed limestone--met gradingrequirements for 100 CBR basecourse.
'.
@4

w 4
-V -a
-C).
0 c
9 C
0C CCC
'21 - -- - -
wIC
w- V)C
uC mC CLCC.I'
V) - - In w 4
aa
a V
CC
IMU MU Cuao

0 a 0t 0 0 0
0t o
-a c f
St c o-
St~ ~~~~~~ o 7' " 0 , N ' I I I ~ 0I en-+I++
u u
a% X: I. . 1,- -4 en 1?- X cw 1 4In Q C' -0 0, o. x- 0, cl 0 W
to -Ooto - >
St 0,m
c r

6'
CYLINDER MOLD ASSEMBLY
Figure 1. Six-in.--dfam compaction mold

iH')IIM AS 83"O) IN33ti3dI
. . . . . .
. .., . . . .
c,
.0 . . ... . .-. . .
.. .
Cv
wXz
S., YW (3 a
bE
040
...'..' i . °
a, , _ _. . . ..__ _ _ _ _ :
V4
PjC -U. . . . . .. to. ,
I
......../ . ... ., . °o
. . . . . . .
. i
" I -
, w
N
LH. ,IIM k9 d)SbVO IN30ld
2 -P
I & -
. . . . . . .[ . .
"".- : I
I:''. . .L .. .. . . . . .. ~ .. .. .' " S ... . . ... . . . . . . . . . .. ~. . .-
,.~~~ ~ . ... . . ... . ... .. .
CO)
l . . . .. . . . .. . . ... ..---.. . . -
r,0',, . .,
.. . . 4.
Na
lHOINA AB 83NIJ INI1U3d
2U

.. J AAM fSftWOJ) .f3) ti d
.i >
Z D c
ft. . . . . .. . . . . . . . . . . . . . . N z
L" :: u
. .. . . .. .~ z-
Ist L G
NC
. .. .w . .g
4 - 4 .-- --.- 1 00 c
-. J IiHO41M ~ ~ ~ A II ID
-u

,.%
30 00
125 50 -
25-
'520 0
0 50 0 5 '0
VVWATEA CONTENT, % WATER CONTENT,%
i' r,:.- [3 SLIDING WEIGHT
0 SLEEVE-TYPE RAMMER
CRUSHED LIMESTONE
.,: .Figure 6. Dry density, water content, and CBR relations--soil 1
'' 010
75
'..110
- lr WATER CONTENT, %WATER CONTENT, '
,.,
J-' -k't rI SLIDING WEIGHT RAMMERI
- - Figure 7. Dry density, water content, and CBR relations--soil 2

N
135 12b
100
130 75
z U
50
125 -
2 "'P"
"I I 0 I
w 5 10 is 0 5 10 15
WATER CONTENT. % WATER CONTENT, %
0 SLIDING WEIGHT RAMMER0 SLEEVE-TYPE RAMMER
CLAYEY SAND
Figure 8. Dry density, water content, and CBR relations--soil 3
-04 125 1 1:,bj 04
100
75
lira
'0' U
50
49 25
02 3 4 5 6 7 0 1 2 3 4 5 6
WATER CONTENT. WATER CONTENT. %
O SLIDING WEIGHT RAMMER
o SLEEVE-TYPE RAMMERPEA GRAVEL
Figure 9. Dry density, water content, and CBR relations--soil 4

35 I250
200
130 ISO
['S.
100
'25 50
* 0 -0 5 10 15 0 5 10 15
WATER CONTENT, % WATER CONTENT. N
0 SLIDING WEIGHT RAMMER0 SLEEVE-TYPE RAMMER
CLAYEY GRAVEL
Figure 10. Dry densitv, water content, and CBR relations--soil 5
1150*1*.
1100
UU
aP,
105
_j 0110 15 20 25 10 15 20 25
WATER CONTENT, % WATER CONTENT, %
C SLIDING WEIGHT RAMMER
O SLEEVE-TYPE RAMMERBUCKSHOT CLAY
Figure 11. Dry density, water content, and CBR relations--soil 6
Itml i i il ~~l II .. .

5 125
100
110 75 -
z 0U 50
105 25
I 0
10 15 20 10 15 20
WATER CONTENT. % WATER CONTENT. %
o SLIDING WEIGHT RAMMERo SLEEVE-TYPE RAMMER
SILTY CLAY
Figure 12. Dry density, water content, and CBR relations--soil 7
105 50
40
00 30
z U
p 20
95 10
- 0 II
'0 16 20 10 15 20
WATER CONTENT, % WATER CONTENT, tlC SLIOING WEIGHT RAMMER
0 SLEEVE-TYPE RAMMER
YUMA SAND
Figure 13. Dry density, water content, and CBR relations--soil 8
Il 1llikH H NilIl mmll DI

'1.0I'%
*, ' 525
.7
130
0
50
125 25
-I I _0L
0 5 10 '5 0 5 10 15
WATER CONTENT. % WATER CONTENT %
0 SLIDING WEIGHT RAMMER
0 SLEEVE-TYPE RAMMERSAND BUCKSHOT BLEND
Figure 14. Dry density, water content, and CBR relations--soil 9
130 125
100
S125 75
z m
50
120 25
I I 0
0 5 1 0 15 0 5 10 15WATER CONTENT, % WATER CONTENT. %
C) SLIDING WEIGHT RAMMER
0 SLEEVE-TYPE RAMMER
RIVER SAND BLEND
Figtre 15. Dry density, water content, and CBR relations--soil 10
-4

-135
125
0l 5 10 1 5
' ' WATER CONTENT, %
, I[3 SLIDING WEIGHT RAMMER
, O SLEEVE-TYPE RAMMER
CEMENT STABILIZED GRAVEL
' Figure 16. Dry density, water content, CBR relations--~no soil cement stabilized gravel
.-
--
"13

- ~ ~ ~ ~ ~ ~ ~ ~ ~ ~ ~ ~ ~~~~H1A AS 63)A0 - IN - . cur - 9 - .- r'7Y t w~r~rY~w. dl~
%
CNC
- U)
- Cj)U)
CL>
'IILL
]r~i )~aa0
I UO(J.-J
Z CJ
z_ _ _ _ _ _ _ _ _ _ _ _ _ _ _ _ _ _ _ _ _ _ _ _ _ _ _ _ _0 I L )

II V, (
> >z
V44
00.-Eo-
0
I-
W 4
z-u
w G
CIDI
'W IIL I

2126
In.'A
- ..
~z124! 26
124
.1
-] 122
I 1 i, 0I i Ii II I I120
2 4 6 8 10 12 14
WATER CONTENT, %
0 SLIDING WEIGHT RAMMER
0 SLEEVE-TYPE RAMMER
GRAVELLY SAND
Figure 19. Dry density-water content relations--soil 13

136 I
134
132
S130
128
126 I2 4 6 8 10 12 14
WATER CONTENT, %
0 SLIDING VE IGHT RAMMER
% 0 SLEEVE-TYPE RAMMERGRAVELLY CLAYEY SAND
Figure 20. Dry density-water content relatibns-soil 14
SMill

h ~150j
148
~146
z
- ~ 144
142 0
01401
0 2 4 6 8 10 12
WATER CONTENT, %
* 0 SLIDING WEIGHT RAMMER
0 SLEEVE-TYPE RAMMER
LIMESTONE
Figure 21. Dry density-water content relations--soil 15
VW1M

SOLI
0 0 1 N
Photo 1. Ten-pound-compaction rammers--(a) sliding weightrammer (left) and (b) sleeve--type rammer (right)

* - 4 -
VY0000'0