i spice macromodels of instrumentation a …ecad.tu-sofia.bg/et/2007/et2007 book1/circuits and...
TRANSCRIPT
ELECTRONICS’ 2007 19 – 21 September, Sozopol, BULGARIA
3
IMPROVED SPICE MACROMODELS OF INSTRUMENTATION AMPLIFIER WITH PSRR EFFECTS
Elena Dikova Shoikova1, Ivailo Milanov Pandiev2
Faculty of Electronic Engineering and Technology, Technical University of Sofia, Kliment Oh-ridski Street No. 8, 1000 Sofia, Bulgaria, phone: + 359 2 965 2140,
e-mail: [email protected], [email protected]
An improved SPICE based macromodels of monolithic instrumentation amplifiers (in-amps) is presented in which the power supply rejection ratio (PSRR) frequency effects are modelled. The simulation models are developed through modifying the existing macromodels employing the mechanism of controlled sources and subcircuits. The macromodels are independent from actual technical realizations and are based upon compromises regarding the representation of exact circuit structures in the models. The equivalent circuits of the models principally contains linear passive RLC elements and controlled voltage and current sources. Model parameters are extracted for the IC AD8221 from Analog Devices and INA114 from Texas Instruments as examples. Simulation results and selected diagrams are compared with the manufacturer’s data.
Keywords: analogue circuits, instrumentation amplifier, macromodel, PSRR effets.
1. INTRODUCTION In the contemporary IC designs, analogue and digital functions are joined together
on the same PCB, and correspondingly an interaction is likely to occur between circuit components. This interaction will consist of spikes that are generated by clocks (in digital components or in switched-capacitor circuits), output drives, etc. Spikes are generated on supply lines, ground, or substrate. Those spikes can easily couple to the analogue circuits. One of the important electrical characteristics of analogue devices is their insensitivity to spikes on supply lines. This feature is expressed by their Power Supply Rejection Ratios (PSRRs). A specific difficulty associated with PSRR is that high values of PSRR can be more easily obtained at low frequencies while it is much harder to do this at high frequencies. However, it is especially at the high frequencies that the high PSRR value is required. Spikes on power supply lines are characterized by short duration, and thus contain a large number of high frequency components. As a consequence, a high PSRR value is required at intermediate and high frequencies only. In most cases the frequency dependence of PSRR is being approximated by using first-order transfer functions determined by real poles or pole-zero pairs.
The majority of published SPICE operational amplifier macromodels are derived from well-known Boyle macromodel [1] and only attempt to simulate dc asymmetry of the supply voltages, usually by a fixed resistors connected across the supply terminals [2, 3]. They therefore cannot be used to simulate dynamic variations in input offset voltage due to changing supply voltage. The nonlinear SPICE macro-

ELECTRONICS’ 2007 19 – 21 September, Sozopol, BULGARIA
4
model of operational amplifier due to Hu, Leach and Chan [4] includes dc power supply rejection ratio but ignores its reduction at higher frequencies. In this simu-lation model the input offset voltage is the sum of two voltages: one is ( ) PSRR/VV SNSP − ( SPV − positive power supply voltage, SNV − negative power supply voltage) and the other is the voltage across temperature dependent resistor 3bR , modelling temperature coefficient. The two voltages are coupled to the positive input terminal by using two voltage-controlled current sources (VCCSs) (Gavs and 10Gb , respectively) and one unit-gain voltage-controlled voltage source (VCVS). The gains of these VCCSs are: PSRR/gavs 1= and 110 =bg . More recently in [5, 6], improved SPICE macromodels of current-feedback amplifier (CFA) are presented. In these models both dc and ac PSRR were included so that the designer can explore the effects of supply bypassing. The PSRR stage of the CFA model consists of two attenuation circuits controlled by positive and negative supply voltages whose gains increase at 20dB per decade. However, the structure of the CFA simulation model not corresponding with existing in-amp SPICE models.
The SPICE-based libraries overview shows that the in-amp macromodels cannot provide fully adequate representation of the dc and ac PSRR effects [7, 8]. In response of this problem in the present paper authors propose improved in-amp SPICE macromodels with dc PSRR and small-signal positive and negative power supply gain versus frequency. Principally, the improved models consist of controlled sources and several passive RLC elements. The macromodels are based on those des-cribed in [5, 6, 9, 10].
2. SPICE MACROMODELS DEVELOPMENT By applying the build-up method, that is a basic tool for incorporating second
order effects, it is possible to develop further the existing amplifier’s macromodels towards adequate simulating of the PSRR versus frequency, noise effects, tempe-rature dependence of parameters, CMRR versus frequency, etc. The power supply rejection ratio is defined as an absolute value of the ratio of the change in input offset voltage to the change in the amplifier supply voltages that has caused that change. Normally, manufacturer’s data contains information regarding the frequency depen-dence of PSRR that could be used in modelling the real in-amps.
Two SPICE macromodels – the IC AD8221 (Analog Devices) and INA114 (Te-xas Instruments) – are chosen as examples in the process of PSRR modelling. These innovative SPICE in-amp macromodels were developed in the early 1990’s and are still in use today.
2.1. One-pole approximation of the PSRR frequency dependence The addition of ac PSRR, to any macromodel of analogue integrated circuit is
similar to the techniques used for modelling CMRR versus frequency [2]. The schematic diagram of the proposed in-amp macromodel improved with PSRR frequency effects approximated by using one-pole transfer function is shown in Fig. 1. It’s based on a previous in-amp macromodel [8] from standard SPICE library. The
ELECTRONICS’ 2007 19 – 21 September, Sozopol, BULGARIA
5
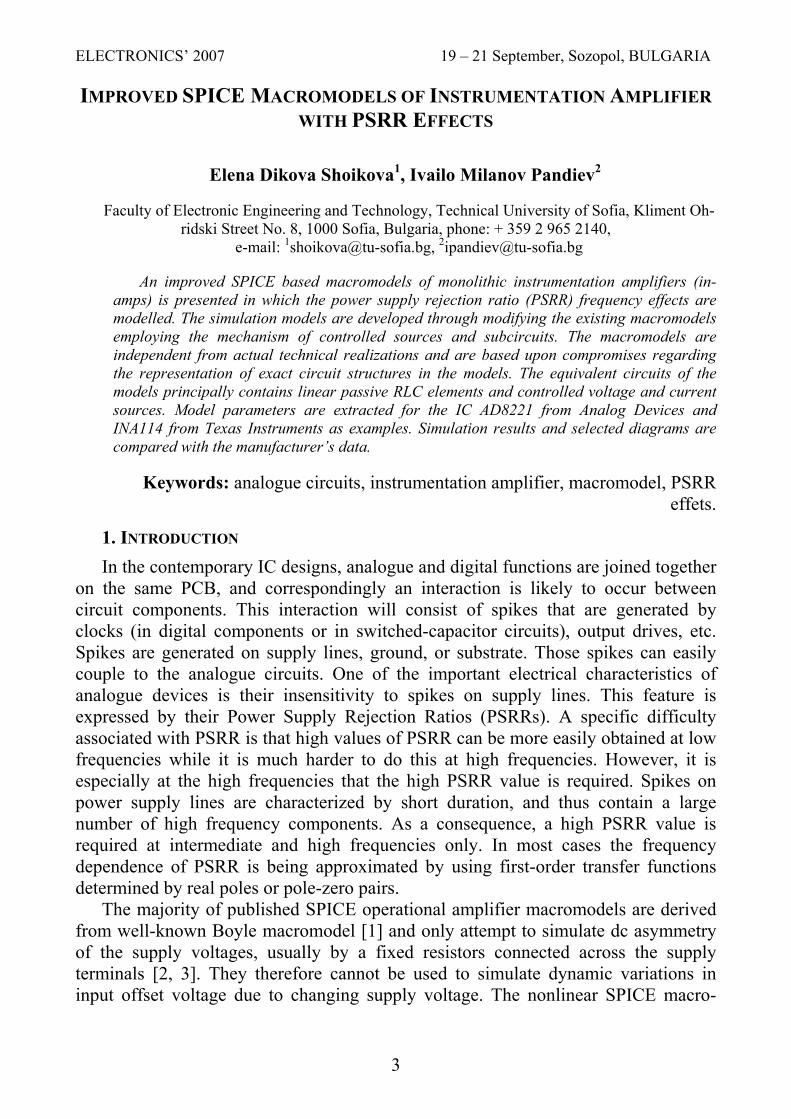
PSRR effects have been modelled by adding new elements into input section of an existing SPICE macromodels as follows.
401
0
4021PSRR
1PSRL1PSRG
403
0
4042PSRR
2PSRL2PSRGV(401,,0)
V(403,,0)
REFIN- IN+
OUT
2012
4699
50
VSP
VSN
3R 4R
1R2R5R 6R
1CC 2CC1E 2E
IOSE
11R
12R
13R
OOSE
1I 2I
OSI
CMC
1Q 2Q
3Q 4Q
7R 8R
14R
3I
98REFE
1G16R 2C
2G17R 3C 3E
18R
19R
5C
1C
4 321
87
9 610512 15
18
1613
19
25 40 36
38
38401 403
9950
2
1
1VR1V
11
11
6
11
5
12
15
RG1 RG2
(V+)
(V-)
PSRR macromodel
99
0
50
0
Figure 1. Improved in-amp model for representing one-pole approximation of the PSRR.
As it shown in Fig. 1, a VCVS oosE from the original equivalent circuit connected between node 19 and 10 is replaced with linear three-port VCVS (marked in grey, see Fig. 1). The state of node 10 will have to follow the change in the input offset voltage, modelling PSRR. The offset voltages which are accurately referred to the voltage-controlled source oosE come from separate frequency shaping stages in the model. The additionally defined stages of the model consisting voltage-controlled current sources (VCCS) 1PSRG and 2PSRG controlled by positive and negative supply voltages, and RL zero stages (marked in grey, see Fig. 1). The VCCS 1PSRG present the voltage at node 401 that depends on the ripples of positive supply voltage ( SPSP VV ∆± ), and the VCCS 2PSRG define the voltage at node 403 being dependent on ripples in the negative supply voltage ( SNSN VV ∆± ). The current sources are chosen linear one-port generators having the following equations:
( )SPSPGPSR,G VVkIPSR
∆±= 111 (1a)
( )SNSNGPSR,G VVkIPSR
∆±= 212 (1b)
The currents thus generated, 1PSRGI and
2PSRGI , will flow through the elements 1PSRR ,
1PSRL and 2PSRR , 2PSRL , towards the internal ground. In such a way the voltages V(401,0) and V(403,0) will depend upon the amplitude and the frequency of the ripples on supply lines, and the transfer functions of the stages will have the form:
( )
+=
∆±=
1
1111 10401
1PSR
PSRPSRGPSR,
SPSPG R
LpRk
VV,V)p(T
PSR (2a)
( )
+=
∆±=
2
2221 10403
1PSR
PSRPSRGPSR,
SNSNG R
LpRk
VV,V)p(T
PSR (2b)
ELECTRONICS’ 2007 19 – 21 September, Sozopol, BULGARIA
6
defining characteristics conditioned by one real zero. The voltages generated at nodes 401 and 403 are used for forming the equation of VCVS oosE as follows:
( ) ( ) ( )040304019838 3210 ,Vk,Vk,VkkV Eoos,Eoos,Eoos,Eoos,Eoos +++= (3) The component Eoos,k0 in Eq. (3) determines the input offset voltage constant ( osV ),
the coefficient Eoos,k1 present the CMRR effect, and the coefficients Eoos,k2 and Eoos,k3 are used for modelling the change in osV as a result of changing the supply voltages ( SPSP VV ∆± or SNSN VV ∆± ). Then positive +PSRR and negative −PSRR will be determi-ned by the following expressions:
( )( ) ( )
( )+
++−
+
+
ω+
ω=
+
=∆±
=∆±
==p
p
PSR
PSR
PSR
PSREoos,
PSRGPSR,
Eoos,
SPSP
SPSPOUT
OUT
PSR pH
LR
pRL
k
Rk,Vk
VVVV/V,V/V
GAINGAINPSRR
1
1
1
12
1111
2 0401010
(4a) ( )
( ) ( )( )
+
++−
−
−
ω+
ω=
+
=∆±
=∆±
==p
p
PSR
PSR
PSR
PSREoos,
PSRGPSR,
Eoos,
SNSN
SNSNOUT
OUT
PSR pH
LR
pRL
k
Rk,Vk
VVVV/V,V/V
GAINGAINPSRR
2
2
2
23
1221
3 0403010
(4b) where ( )SPSPOUTPSR VV/VGAIN ∆±=+ and ( )SNSNOUTPSR VV/VGAIN ∆±=− is the voltage gain of spikes on the positive and negative power supply lines. Comparing the last expre-ssions (4a) and (4b) leads to:
11 / PSRPSRp LR=ω+ (5a) - Pole frequency of positive PSRR at level −3dB,
11121 PSRGPSR,Eoos,DC Rkk/HPSRR == ++ (5b) - Positive dc power supply rejection ratio,
22 / PSRPSRp LR=ω− (6a) - Pole frequency of negative PSRR at level −3dB,
22,1,3/1 PSRGPSREoosDC RkkHPSRR == −− (6b) - Negative dc power supply rejection ratio. These relationships are of basic importance for the methodology of determining
the model parameters of the equivalent circuit. To set component values in PSRR stages, 1PSRR and 2PSRR are arbitrarily chosen to be Ω100 . This value is selected to reduce the thermal noise associated with those resistors and to simplify the calculations for the other components in the stage. If necessary 1PSRR and 2PSRR be represented by current sources controlled by their own voltages, thus conditioning noiseless resistors [5]. The gm’s of the VCCSs 1PSRG and 2PSRG are set so that dc gain of each stage is equal to the reciprocal dc value of the PSRR.
2011,1 10/1
+
=DCPSRR
PSRGPSR Rk (7a)
2021,2 10/1
−
=DCPSRR
PSRGPSR Rk (7b)
ELECTRONICS’ 2007 19 – 21 September, Sozopol, BULGARIA
7
where +DCPSRR and −
DCPSRR is the typical dc rejection ratio in dB. The inductors, 1PSRL and 2PSRL , determine the 3dB frequency of each stage and can be found by
+π= pPSRPSR fRL 2/11 (8a) −π= pPSRPSR fRL 2/22 (8b)
where +pf and −
pf are the −3dB frequency of the poles in Hz. For convenience, the coefficients Eoos,k2 and Eoos,k3 of the VCVS oosE are selected
equal to unity. 2.2. Pole-zero pair approximation of the PSRR frequency dependence
401
0
4021PSRpR
2PSRpR
PSRpG
V401,0
PSRpL
403
0
4041PSRnR
2PSRnR
PSRnG
V403,0
PSRnL
TpITpR
405
0
V405,0
3 4405 406
OOSE111
401 403
А1
А2
А3
1
1FBR
2FBR
1R 2R
3R 4R
2
10
9
11
12
13
14
5
-Vin
VRG1
+Vin
VRG2
Vout
VSP
VSN
3
4
VSP
VSN
3
4
VSP
VSN
3
4
VSP
VSN
3
4
VSP
VSN
3
4
TnITnR
406
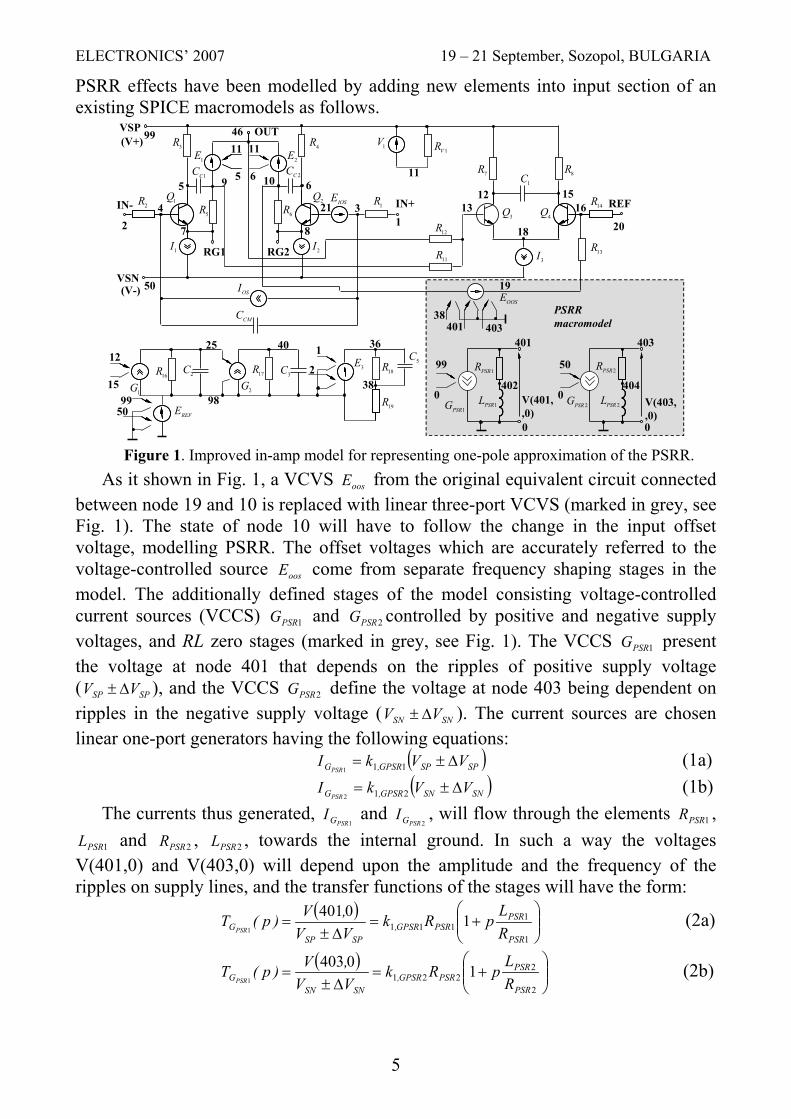
0 Figure 2. Improved in-amp macromodel for representing pole/zero approximation of the PSRR The development of the macromodel is performed by analogy to the previous
consideration where PSRR effects have been approximated by a transfer function with one real pole. As shown in Fig. 2 the existing in-amp model from standard SPICE library is modified. Connecting the two-port VCVS oosE to the non-inverting input node of the simulation model engender a new node 111 the state of which should follow the variation of the input offset voltage modelling dc and ac power supply rejection ratio. The additionally defined PSRR stages simulating transfer function with zero/pole pairs consists two VCCSs PSRpG and PSRnG , and frequency-dependent RL groups ( 1PSRpR , 2PSRpR , 2PSRnR , 2PSRnR , PSRpL and PSRnL ). The temperature dependence of the PSRR is modelled by additionally defined temperature stages consisting two ideal current sources TpI and TnI , and SPICE temperature dependent resistors TpR and TnR which are controlled with equation:
( ) ( ) ( ) ( )[ ]2211 nomnomnomTT TTTCTTTCTRTR −+−+= (9)
ELECTRONICS’ 2007 19 – 21 September, Sozopol, BULGARIA
8
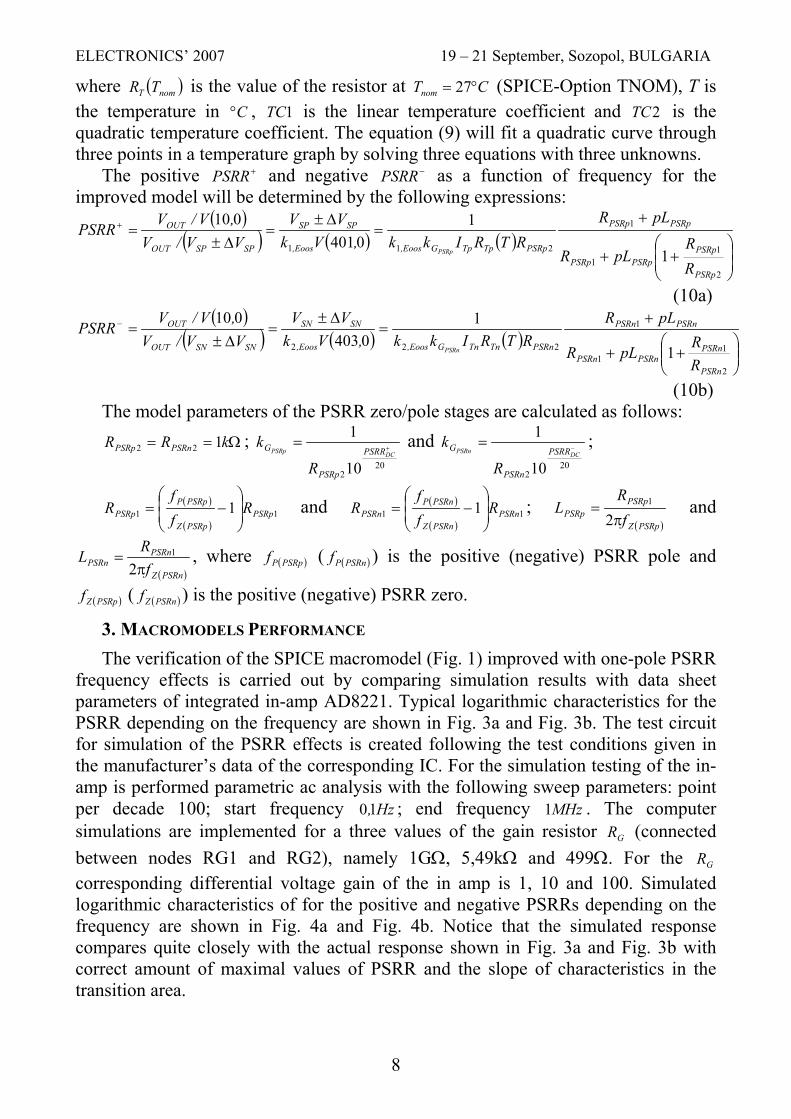
where ( )nomT TR is the value of the resistor at CTnom °= 27 (SPICE-Option TNOM), T is the temperature in C° , 1TC is the linear temperature coefficient and 2TC is the quadratic temperature coefficient. The equation (9) will fit a quadratic curve through three points in a temperature graph by solving three equations with three unknowns.
The positive +PSRR and negative −PSRR as a function of frequency for the improved model will be determined by the following expressions:
( )( ) ( ) ( )
++
+=
∆±=
∆±=+
2
11
1
211 1
10401
010
PSRp
PSRpPSRpPSRp
PSRpPSRp
PSRpTpTpGEoos,Eoos,
SPSP
SPSPOUT
OUT
RR
pLR
pLRRTRIkk,Vk
VVVV/V,V/V
PSRRPSRp
(10a) ( )
( ) ( ) ( )
++
+=
∆±=
∆±=−
2
11
1
222 1
10403
010
PSRn
PSRnPSRnPSRn
PSRnPSRn
PSRnTnTnGEoos,Eoos,
SNSN
SNSNOUT
OUT
RR
pLR
pLRRTRIkk,Vk
VVVV/V,V/V
PSRRPSRn
(10b) The model parameters of the PSRR zero/pole stages are calculated as follows:
Ω== kRR PSRnPSRp 122 ; 20
210
1+=DCPSRp PSRR
PSRp
G
R
k and 20
210
1−=DCPSRn PSRR
PSRn
G
R
k ;
( )
( )11 1 PSRp
PSRpZ
PSRpPPSRp R
ff
R
−= and ( )
( )11 1 PSRn
PSRnZ
PSRnPPSRn R
ff
R
−= ;
( )PSRpZ
PSRpPSRp f
RL
π=
21 and
( )PSRnZ
PSRnPSRn f
RL
π=
21 , where ( )PSRpPf ( ( )PSRnPf ) is the positive (negative) PSRR pole and
( )PSRpZf ( ( )PSRnZf ) is the positive (negative) PSRR zero.
3. MACROMODELS PERFORMANCE The verification of the SPICE macromodel (Fig. 1) improved with one-pole PSRR
frequency effects is carried out by comparing simulation results with data sheet parameters of integrated in-amp AD8221. Typical logarithmic characteristics for the PSRR depending on the frequency are shown in Fig. 3a and Fig. 3b. The test circuit for simulation of the PSRR effects is created following the test conditions given in the manufacturer’s data of the corresponding IC. For the simulation testing of the in-amp is performed parametric ac analysis with the following sweep parameters: point per decade 100; start frequency Hz,10 ; end frequency MHz1 . The computer simulations are implemented for a three values of the gain resistor GR (connected between nodes RG1 and RG2), namely 1GΩ, 5,49kΩ and 499Ω. For the GR corresponding differential voltage gain of the in amp is 1, 10 and 100. Simulated logarithmic characteristics of for the positive and negative PSRRs depending on the frequency are shown in Fig. 4a and Fig. 4b. Notice that the simulated response compares quite closely with the actual response shown in Fig. 3a and Fig. 3b with correct amount of maximal values of PSRR and the slope of characteristics in the transition area.

ELECTRONICS’ 2007 19 – 21 September, Sozopol, BULGARIA
9
Fig. 3a. Positive PSRR versus frequency for a different voltage gain.
Fig. 3b. Negative PSRR versus frequency for a different voltage gain.
Fig. 4a. Simulated ac positive PSRR as a function of frequency at voltage gain 1 - (i), 10 - (ii) and 100 - (iii).
Fig. 4b. Simulated ac negative PSRR as a function of frequency at voltage gain 1 - (i), 10 - (ii) and 100 - (iii).
The verification check of the macromodel (Fig. 2) improved with pole-zero PSRR frequency effects have been performed by using Texas Instruments precision in-amp INA114, for which the small-signal positive power supply gain versus frequency has been approximated as a first-order pole-zero function.
Logarithmic characteristic for the positive PSRR as a function of fre-quency at T=25°C is represented in Fig. 6. The solid line shows the be-haviour of the SPICE macromodel. Notice that the simulated PSRR clo-sely match with the real IC (data
points plotted). The verification check of the PSRR temperature dependence is performed by
comparing simulation output and experimental results of the IC INA114. The
Fig. 6. PSRR as a function of frequency for INA 114.
ELECTRONICS’ 2007 19 – 21 September, Sozopol, BULGARIA
10
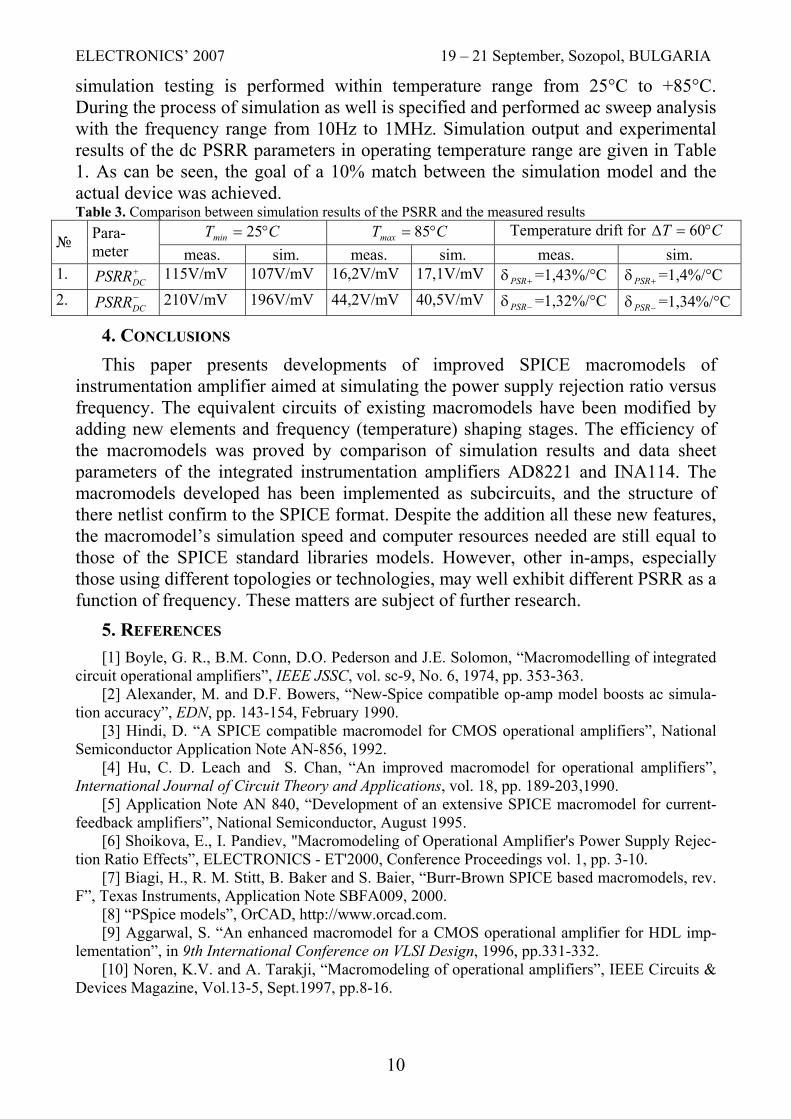
simulation testing is performed within temperature range from 25°C to +85°C. During the process of simulation as well is specified and performed ac sweep analysis with the frequency range from 10Hz to 1MHz. Simulation output and experimental results of the dc PSRR parameters in operating temperature range are given in Table 1. As can be seen, the goal of a 10% match between the simulation model and the actual device was achieved. Table 3. Comparison between simulation results of the PSRR and the measured results
CTmin °= 25 CTmax °= 85 Temperature drift for CT °=∆ 60 Para-
meter meas. sim. meas. sim. meas. sim. 1. +
DCPSRR 115V/mV 107V/mV 16,2V/mV 17,1V/mV +δPSR =1,43%/°C +δPSR =1,4%/°C 2. −
DCPSRR 210V/mV 196V/mV 44,2V/mV 40,5V/mV −δPSR =1,32%/°C −δPSR =1,34%/°C
4. CONCLUSIONS This paper presents developments of improved SPICE macromodels of
instrumentation amplifier aimed at simulating the power supply rejection ratio versus frequency. The equivalent circuits of existing macromodels have been modified by adding new elements and frequency (temperature) shaping stages. The efficiency of the macromodels was proved by comparison of simulation results and data sheet parameters of the integrated instrumentation amplifiers AD8221 and INA114. The macromodels developed has been implemented as subcircuits, and the structure of there netlist confirm to the SPICE format. Despite the addition all these new features, the macromodel’s simulation speed and computer resources needed are still equal to those of the SPICE standard libraries models. However, other in-amps, especially those using different topologies or technologies, may well exhibit different PSRR as a function of frequency. These matters are subject of further research.
5. REFERENCES [1] Boyle, G. R., B.M. Conn, D.O. Pederson and J.E. Solomon, “Macromodelling of integrated
circuit operational amplifiers”, IEEE JSSC, vol. sc-9, No. 6, 1974, pp. 353-363. [2] Alexander, M. and D.F. Bowers, “New-Spice compatible op-amp model boosts ac simula-
tion accuracy”, EDN, pp. 143-154, February 1990. [3] Hindi, D. “A SPICE compatible macromodel for CMOS operational amplifiers”, National
Semiconductor Application Note AN-856, 1992. [4] Hu, C. D. Leach and S. Chan, “An improved macromodel for operational amplifiers”,
International Journal of Circuit Theory and Applications, vol. 18, pp. 189-203,1990. [5] Application Note AN 840, “Development of an extensive SPICE macromodel for current-
feedback amplifiers”, National Semiconductor, August 1995. [6] Shoikova, E., I. Pandiev, "Macromodeling of Operational Amplifier's Power Supply Rejec-
tion Ratio Effects”, ELECTRONICS - ET'2000, Conference Proceedings vol. 1, pp. 3-10. [7] Biagi, H., R. M. Stitt, B. Baker and S. Baier, “Burr-Brown SPICE based macromodels, rev.
F”, Texas Instruments, Application Note SBFA009, 2000. [8] “PSpice models”, OrCAD, http://www.orcad.com. [9] Aggarwal, S. “An enhanced macromodel for a CMOS operational amplifier for HDL imp-
lementation”, in 9th International Conference on VLSI Design, 1996, pp.331-332. [10] Noren, K.V. and A. Tarakji, “Macromodeling of operational amplifiers”, IEEE Circuits &
Devices Magazine, Vol.13-5, Sept.1997, pp.8-16.