iatmi 2005-52 - iatmi | ikatan ahli teknik perminyakan … · · 2013-03-28high temperature...
TRANSCRIPT

1
IATMI 2005-52 PROSIDING, Simposium Nasional Ikatan Ahli Teknik Perminyakan Indonesia (IATMI) 2005 Institut Teknologi Bandung (ITB), Bandung, 16-18 November 2005.
THE MINERALIZATION OCCURS OF LIGHT WEIGHT CEMENT
BY COMPOSITION MODELS ON HTHP CONDITIONS
Suhascaryo Nur; UPN “Veteran” Jogjakarta Siregar Septoratno; TM FIKTM ITB Bandung
Rubiandini Rudi; TM FIKTM ITB Bandung Nawangsidi Doddy; TM FIKTM ITB Bandung
Abstract: Cementing is a very important part in drilling, the recent technology development in oil or geothermal well drilling has led to a more problematic case in cementing. The high temperature cementing is one of those problem, high temperature cementing consist of steam recovery wells, geothermal wells and ultra deep wells. The low density and high strength is the preferable properties of high temperature cementing. Extender has been known for it's density-reducing and prevent shrinkaged by added expanding additive, the anticipated HTHP condition ability while silica has been known for it's compressive strength stabilization in high temperature condition above 1100C . Types of Extender is Microsphere, Expanding is Periclase and Lime, and HTHP condition is Silica Flour by curing time on simulator were 24 hrs, 72 hrs, and 168 hrs. The result of the study presented microsphere as the best density reducing additive, but the strength tends to decline at elevated temperature. While silica cement showed good result in compressive and expanding is good on shear bond strength at high temperature exposure with changes gel C-S-H, alpha dicalcium silicate hydrate to tobermorite (C5S6H5), Clino tobermorite minerals stable on ranges temperature 150-250oC and above temperatures range tobermorite minerals changes into xonolytes (C6S6H) and truscotite (C7S12H3) minerals stable until 400oC ( not proven)..
I. INTRODUCTION Cementing system is an important issue within the drilling process, and as technology in the petroleum industry continues to develop, so is the cementing technology. The main purpose of cementing is to isolate the annulus between
the casing and wellbore in order to prevent communication between the various fomation layers. Besides its function as previously mentioned, cementing in the drilling operation may carry the following objectives : 1. Support the casing against the formation. 2. Protects the casing against underground
environment effects, such as high pressure.
3. Prevent gas or high-pressure formation fluids movement into annulus casing-wellbore that may raise trouble at the surface.
4. Reduce gas-oil ratio, water-oil ratio and water-gas ratio.
5. Minimize casing wear. In order to achieve a good cementing job it requires accurate data obtained from the well bore, good cementing technique, proper cement suspension characteristics and cement quality. This paper will discuss the effect of the addition of microsphere, periclase & lime, silica flour on occurs mineralisation on HTHP conditions after to made modelling compositions of cement slurry. Nearly all cement slurry characteristics will affect the cement quality upon placement. A low cement slurry density will result in a low compressive strength, which may be caused by a high water cement ratio (WCR) used in the preparation of the cement slurry. Cementing at high temperature requires a low cement density, impermeable and high cement strength (Compressive and Shearbond Strength) by occurs formed mineralization, first gel C-S-H, alpha diCa-S-H, Tobermorite etc. This is attained by adding microsphere to lower cement density. Meanwhile in order to increase the cement strength at high temperature can be
2
attained by use of silica flour as special additive, and prevent shrinkaged by pericalse and lime. Results of my research were occurs of impermeable, high strength, and tobermorite and clino tobermorite added microsphere) formed there, after made simulation composition cement slurry on curing time simulator 168 hrs. II. LITERATURE REVIEW Cement and additive if mixed with water results in a cement hydration process followed by a cement setting process. The definition of cement hydration process itself can be described as a chemical reaction between solids and liquids, in which mixtures eventually sets. On cement suspension, the hydration process happens between clinker, calcium sulfate and water, which causes the cement slurry to set. 2.1. The Hydration Process The hydration of Portland cement is a sequence of overlapping chemical reactions between clinker components, calcium sulfate and water, leading to continuous cement slurry thickening time and hardening. Although the hydration of C3S is often used as a model for the hydration of Portland cement, it must be kept in mind that many additional parameters are involved. The hydration of Portland cement is a complex process of crushing/settling. Unlike in the pure single phase, the various multi component hydration reaction works at different rates. It influences between phases for example : the C3A hydration modified by the presence of C3S in which the formation of calcium hydroxide will reduce the C3A by gypsum. The clinker contains certain impurities, this depends on the composition of its raw material in which within each composition contains different oxides. As a consequence of the impurities the hydration also becomes impure, in which C-S-H gel tends to bond with aluminate, iron oxide and sulphur, meanwhile ettringite and monosulpho-aluminate contains silica. Calcium hydroxide in this case also contains certain amount of other ions. Hydration is a chemical reaction between solids and liquids, in which mixtures of both will eventually sets into solid. In the cement slurry used in the cementing job, the hydration taking place is between clinker, calcium sulfate and water, which results in a set cement at the end of the process.
Among the main factors affecting the hydration process of Portland cement is formation temperature. High temperature may accelerate the rate of hydration, but in the other hand it can affects the cement stability and change the cement component morfology. The hydration phenomenon of Portland cement based on temperatures can be classified into two categories, that is : low temperature and high temperature hydration. At low temperature hydration, the components of Portland cement is anhydrous, which means when it comes in contact with water the cement components breaks apart and hydrates in which eventually turns to set cement. Meanwhile at high temperature hydration above 1100C, the process begins with the formation of Alpha Dicalcium Silicate Hydrate (α-C2SH) which changes the cement components composition that can affect the cement strength usually known as Strength Retrogression (introduced by Swayze 1954). Strength retrogression is overcomed by addition of silica flour as special additive into the cement prior of mixing it with water. C-S-H gel is a material with excellent binding characteristics especially at temperatures up to 2300F (1100C). At higher temperature, C-S-H gel is subject to metamorphosis, which usually results in a decreased compressive strength and increase in permeability of the set cement. This process known as Strength Retrogression was first reported by Swayze (1954). C-S-H gel often converts into a phase known as alpha dicalcium silicate hydrate (α-C2SH), which is highly crystalline and much denser than C-S-H gel. As a result, it affects the compressive strength and permeability of set cement at a temperature of 2300F (1100C). The strength retrogression can be prevented by adding silica flour into the cement prior of mixing with water. The main purpose is to approximate a C/S ratio of 1.0. It must be noted that commercial cement has a C/S ratio around 1.5, therefore the amount of silica needed to reach the desired C/S ratio value is 35% (Menzd, Kalousek, Carter and Smith).
3
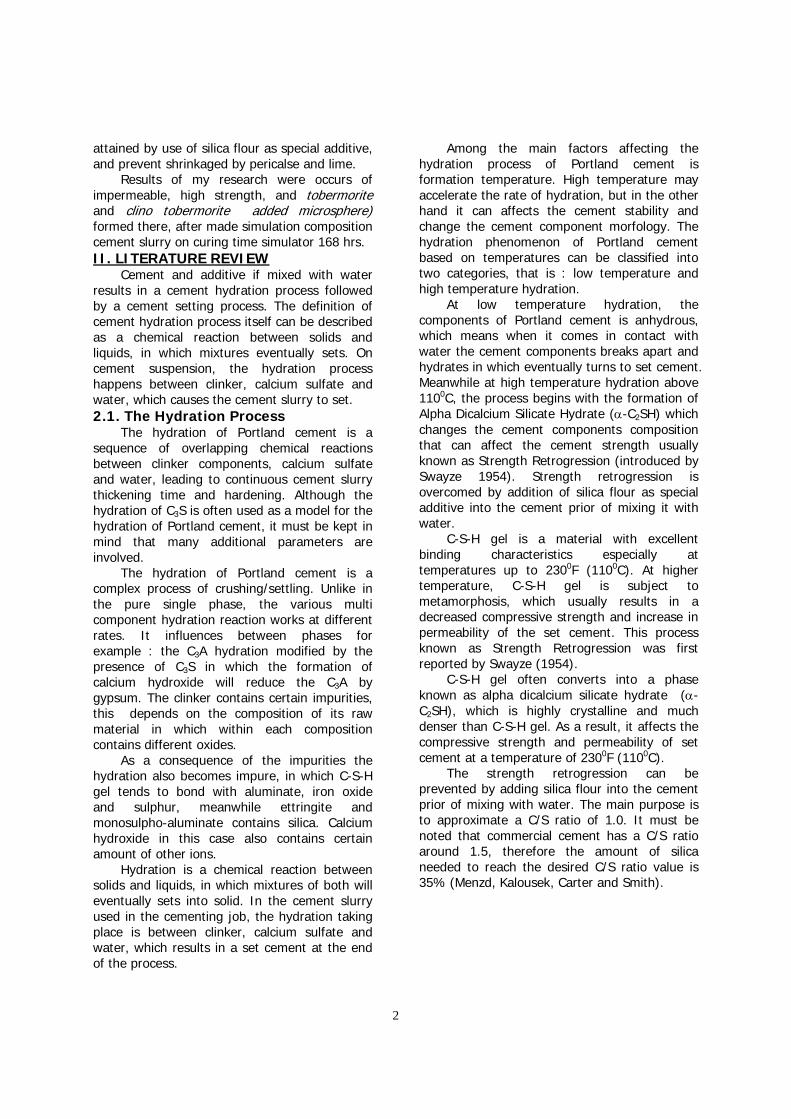
Pengaruh Temperatur pada Terbentuknya Mineral Pencegah SR TerhadapRasio antara CaO/SiO2 pada Oil-well Portland cement
Figure 1. The Mineralization Formed, Nelson 90. 2.2. Additives Extender Additive Extender is an additive used in reducing the density of cement therefore it is applicable in formation that easily collapse. Microsphere is an extender having a specific gravity of 0.4 to 0.6, and as cementing technology adavances, use of microsphere becomes more common. There are two types of microsphere, glass microsphere and ceramic microsphere. This research uses ceramic microsphere (D124). Preparation of cement slurry using microsphere is developed in order to give certain values of cement slurry static pressure having a low density which may influence the strength-density ratio of the cement. Microsphere owes some advantages and disadvantages, the higher the composition of microsphere tends to reduce the density of cement but it reduces the compressive strength and shear bond strength as well.
Pengaruh Aditif MicrospherePada Densitas Semen
0
20
40
60
80
100
120
140
8 10 12 14Densitas (ppg)
% B
WO
S
Figure2. The Effects of % bwos to Density, Nelson 90.
State of The Arts (light weight cement)
0
100
200
300
400
500
600
8,5 9,5 10,5 11,5
Densitas (Ppg)
Com
pres
sive
Str
engt
h (P
si)
2000 psi 800 psi
Figure 3. The Effects of Densitas to CS, Nelson 90. Strength Retreogression Silica flour is classified as a special additivefor strength retrogression harding cement, and it’s having a specific gravity of 2.64. Silica flour usually used 35% bwos, is applied in high temperature wells which functions to maintain the stability of cement strength. Silica flour reacts with calcium hydroxide in order to form dicalcium silica hydrate and the remaining reacts with alpha dicalcium silica hydrate to form minerals known as tobermorite which can maintain the cement strength Expanding Additives. Expanding of cements means that expanding of cement relative volume due to cement bulk expansion (Danjuschewskij, 1983). It is caused by: • Chemical contraction that formed another
hydrated product on liquid phase condition, i.e. crystallizing of dissolved salt at high temperature.
• The presence of expanding materials in cement slurry before hardened condition, i.e. CaO, MgO, CaSO4, etc.
• The presence of electrolyte around the cement bulk after the hardened condition.
The (b) part is merit condition that might bring to increase the shear bond strength, and also the expansion effect could be controlled by arranging the burning temperature and surface area of the expanding materials. During the interim, a number of expanding additives have become available from the service industry; most of these are patented and therefore unknown composition and efficacy.
4
Under borehole conditions, many of the known additives, such as powdered alumunium or ettringite-forming products, present problems with respect to affectivity or controllability, or both, because of the expansion mechanism involved. Even under atmospheric conditions, several cements do not exhibit any expansion at all, but merely a decrease in volumetric shrinkage. Danjuschewskij in 1983 proposed CaO and MgO as expanding additives to create expanding cement. He found the expansion effect more than 1% and up to 25% in specific condition. Several other investigations also had been conducted on the effectivity of expanding cements based on these calcium and magnesium oxide additives. Both materials are characterized by the capability of influencing the reactivity and thus the swelling behavior by way of the manufacturing process. Industrially, CaO and MgO are usually manufactured by calcining of calcium and magnesium carbonates (liberation of CO2, deacidification). In contrast to other expanding additives, CaO and MgO provide two possibilities of influencing the reactivity (hydration activity) by means of the manufacturing process 9: Decreasing the reactivity by increasing the calcining temperature during manufacture of the swelling additive, as well as Increasing the reactivity by augmenting the specific surface area of fineness during grinding of the swelling additive. III. LABORATORY RESEARCH
3.1. Simulator Design To fulfill the specification, it was designed a physical simulator model as a modification of pressure curing chamber that could be operated under 350oC operating temperature and 3000 psi operating pressure. The advantages of the simulator, besides could handle large amount of sample (30 samples), it was designed that could be operated using formation water both from oil-gas field or geothermal field. It was also equipped with CO2 and H2S injection appliance. The main parts of simulator are listed below: • Simulator tubes were equipped with heater
and thermocouple.
• Maximator pump, pressure source that could supply hydraulic pressure up to 6500 psi.
• Safety valves and rupture disc.
• Formation fluid injector.
• Automatic thermo controller.
• Gas injection flow meter.
• Outlet exchanger and reservoir chamber.
• Manometer and in/out simulator liquid gas regulator valves.
The test required 3 types of specimen molds as cement slurry chamber that should be treated during hardening. The specimen molds describe as referred to below: Cubic type, with dimensions 2” x 2” x 2”, to determine the tensile and compressive strength of the cement Cylindrical type, with 1” diameter and 2” height to determine the shear bond strength between cement-casing and also to measure cement casing-permeability. The specimen mold needs chamber caps when it is placed into simulator. Cylindrical type, with 1” diameter and 2.5” height. This specimen mold contains 6 cement chambers. The cement specimens are used to determine both cement permeability and the compressive strength. All those specimen molds are designed that could be run simultaneously in the simulator at given well condition. Compressive strength value is calculated with the following formula:
CS=k.P.(A1/A2) …………………………………(1)
where, CS : compressive strength, psi P : maximum load, psi A1 : hydraulic mortar’s bearing block cross section area, in2
A2 : cement core’s cross section area, in2
k : correction constant, function of height (t) and diameter (d) ratio. Shear bond strength is calculated using the following formula: SBS=P.(A1/π.D.h)…… …………………(2)where,
SBS : shear bond strength, psi P : strain maximum load, psi H : cement core’s cross section area, in2 D : cement core’s height, in
5
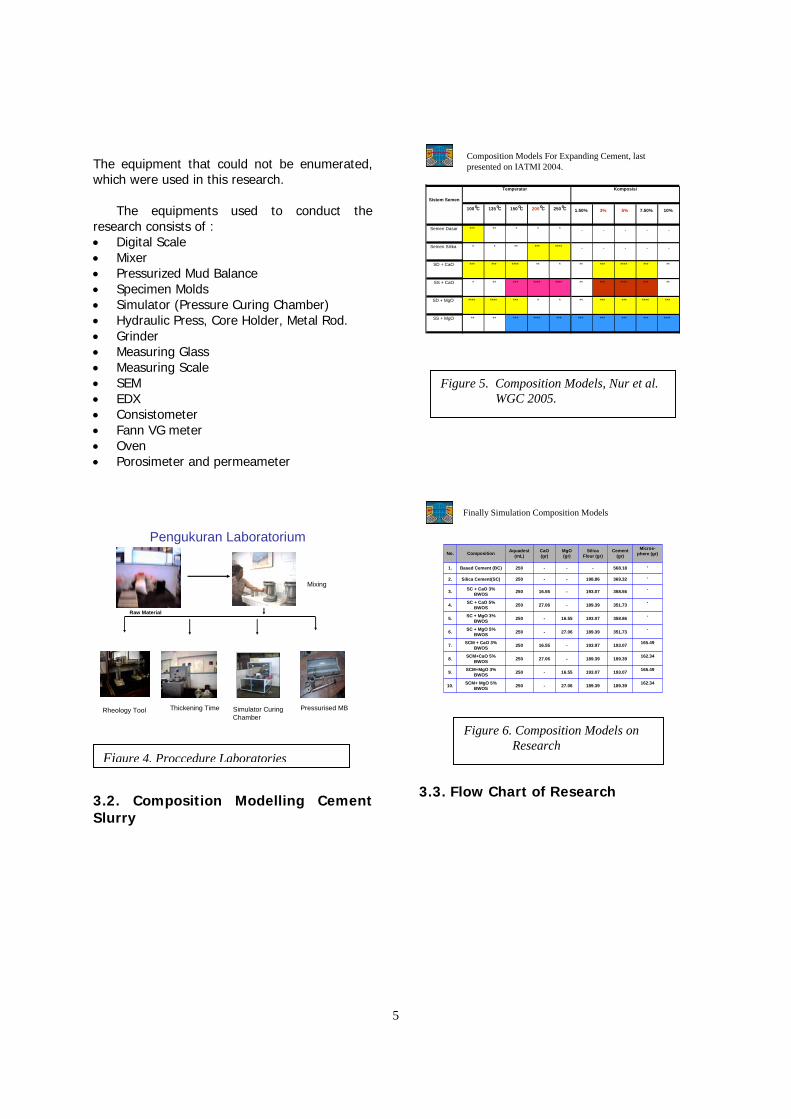
The equipment that could not be enumerated, which were used in this research.
The equipments used to conduct the
research consists of : • Digital Scale • Mixer • Pressurized Mud Balance • Specimen Molds • Simulator (Pressure Curing Chamber) • Hydraulic Press, Core Holder, Metal Rod. • Grinder • Measuring Glass • Measuring Scale • SEM • EDX • Consistometer • Fann VG meter • Oven • Porosimeter and permeameter
Pengukuran Laboratorium
Raw Material
Mixing
Rheology Tool Thickening Time Simulator Curing Chamber
Pressurised MB
3.2. Composition Modelling Cement Slurry
100oC 135oC 150oC 200oC 250oC 1.50% 3% 5% 7.50% 10%
Semen Dasar *** ** * * * - - - - -
Semen Silika * * ** *** **** - - - - -
SD + CaO *** *** **** ** * ** *** **** *** **
SS + CaO * ** *** **** **** ** *** **** *** **
SD + MgO **** **** *** * * ** *** *** **** ***
SS + MgO ** ** *** **** *** *** *** *** *** ****
Sistem Semen
Temperatur Komposisi
Composition Models For Expanding Cement, last presented on IATMI 2004.
Finally Simulation Composition Models
162.34189.39189.3927.06-250SCM+ MgO 5% BWOS10.
165.49193.07193.0716.55-250SCM+MgO 3% BWOS9.
162.34189.39189.39-27.06250SCM+CaO 5% BWOS8.
165.49193.07193.97-16.55250SCM + CaO 3% BWOS7.
-351.73189.3927.06-250SC + MgO 5% BWOS6.
-358.86193.0716.55-250SC + MgO 3% BWOS5.
-351.73189.39-27.06250SC + CaO 5% BWOS4.
-358.56193.07-16.55250SC + CaO 3% BWOS3.
-369.32198.86--250Silica Cement(SC)2.
-568.18---250Based Cement (BC)1.
Micros-phere (gr)Cement
(gr)Silica
Flour (gr)MgO(gr)
CaO(gr)
Aquadest(mL)CompositionNo.
3.3. Flow Chart of Research
Figure 6. Composition Models on Research
Figure 4. Proccedure Laboratories
Figure 5. Composition Models, Nur et al. WGC 2005.
6
Penelitian Akhir KombinasiSemen Ekspanding dan Microsphere
L
3 %
5 %
EXPANDING ADDITIVE JENIS SEMEN
Indocement Kelas-G
ZAT ADDITIVE SR
Silika SSA-1
35% BWOC
pERICLASEi 1400 c
LIME 1400 c
FLUIDA PENGKONDISIAN FLUIDA
PENCAMPUR PENGKONDISIAN
Tekanan 2000 psi
Temperatur
24 jam
72 JAM
168 JAM
200 C
44 %
Aquadest
MICROSPHERE 30% BWOC
AIR FORMASI
WAKTU
Iight weight additive
Uji Kualitas Semen Membatu
CS & SBS Permeabilitas CaO/SiO2Jenis Mineral
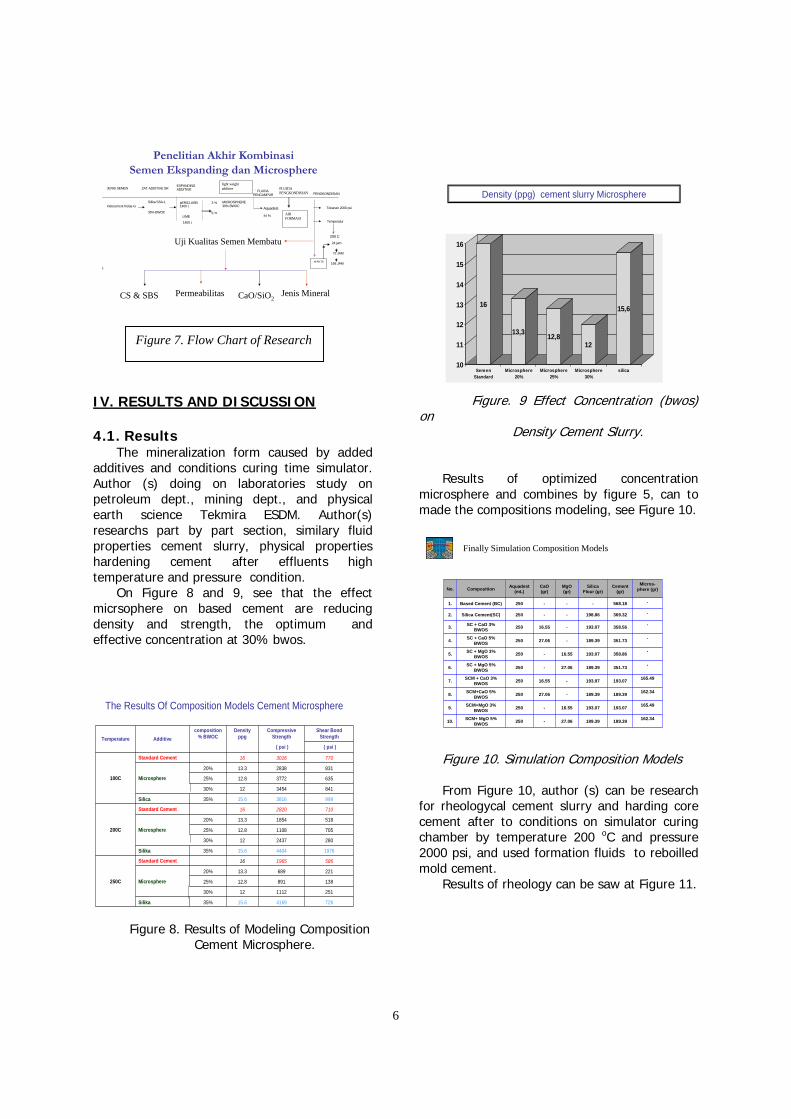
IV. RESULTS AND DISCUSSION 4.1. Results The mineralization form caused by added additives and conditions curing time simulator. Author (s) doing on laboratories study on petroleum dept., mining dept., and physical earth science Tekmira ESDM. Author(s) researchs part by part section, similary fluid properties cement slurry, physical properties hardening cement after effluents high temperature and pressure condition. On Figure 8 and 9, see that the effect micrsophere on based cement are reducing density and strength, the optimum and effective concentration at 30% bwos.
The Results Of Composition Models Cement Microsphere
726416915.635%Silika
25111121230%
13889112.825%
22168913.320%
Microsphere
586196516Standard Cement
250C
1976440415.635%Silika
28024371230%
705110812.825%
518185413.320%
Microsphere
710282016Standard Cement
200C
999381615.635%Silica
84134541230%
635377212.825%
831283813.320%
Microsphere
770301616Standard Cement
100C
( psi )( psi )
Shear Bond Strength
Compressive Strength
Density ppg
composition % BWOCAdditiveTemperature
Figure 8. Results of Modeling Composition Cement Microsphere.
Density (ppg) cement slurry Microsphere
16
13,3 12,812
15,6
10
11
12
13
14
15
16
SemenStandard
Microsphere20%
Microsphere25%
Microsphere30%
silica
Figure. 9 Effect Concentration (bwos) on Density Cement Slurry. Results of optimized concentration microsphere and combines by figure 5, can to made the compositions modeling, see Figure 10.
Finally Simulation Composition Models
162.34189.39189.3927.06-250SCM+ MgO 5% BWOS10.
165.49193.07193.0716.55-250SCM+MgO 3% BWOS9.
162.34189.39189.39-27.06250SCM+CaO 5% BWOS8.
165.49193.07193.97-16.55250SCM + CaO 3% BWOS7.
-351.73189.3927.06-250SC + MgO 5% BWOS6.
-358.86193.0716.55-250SC + MgO 3% BWOS5.
-351.73189.39-27.06250SC + CaO 5% BWOS4.
-358.56193.07-16.55250SC + CaO 3% BWOS3.
-369.32198.86--250Silica Cement(SC)2.
-568.18---250Based Cement (BC)1.
Micros-phere (gr)Cement
(gr)Silica
Flour (gr)MgO(gr)
CaO(gr)
Aquadest(mL)CompositionNo.
Figure 10. Simulation Composition Models From Figure 10, author (s) can be research for rheologycal cement slurry and harding core cement after to conditions on simulator curing chamber by temperature 200 oC and pressure 2000 psi, and used formation fluids to reboilled mold cement. Results of rheology can be saw at Figure 11.
Figure 7. Flow Chart of Research
7
Rheology Slurry Cement
262414511.75SSM + CaO 5%10
241914111.70SSM + CaO 3%9
191413711.75SSM + MgO 5%8
131614311.75SSM + MgO 3%7
44314215.55SS + CaO 5%6
46276315.55SS + CaO 3%5
23154915.61SS + MgO 5%4
31229615.60SS + MgO 3%3
33235115.30Semen Silika 35%2
27193215.90Semen Dasar1
GS10'(lb/100ft sq.)
GS 10'(lb/100ft sq.)
PV (cp)
Density (ppg)
Composition Modelsno
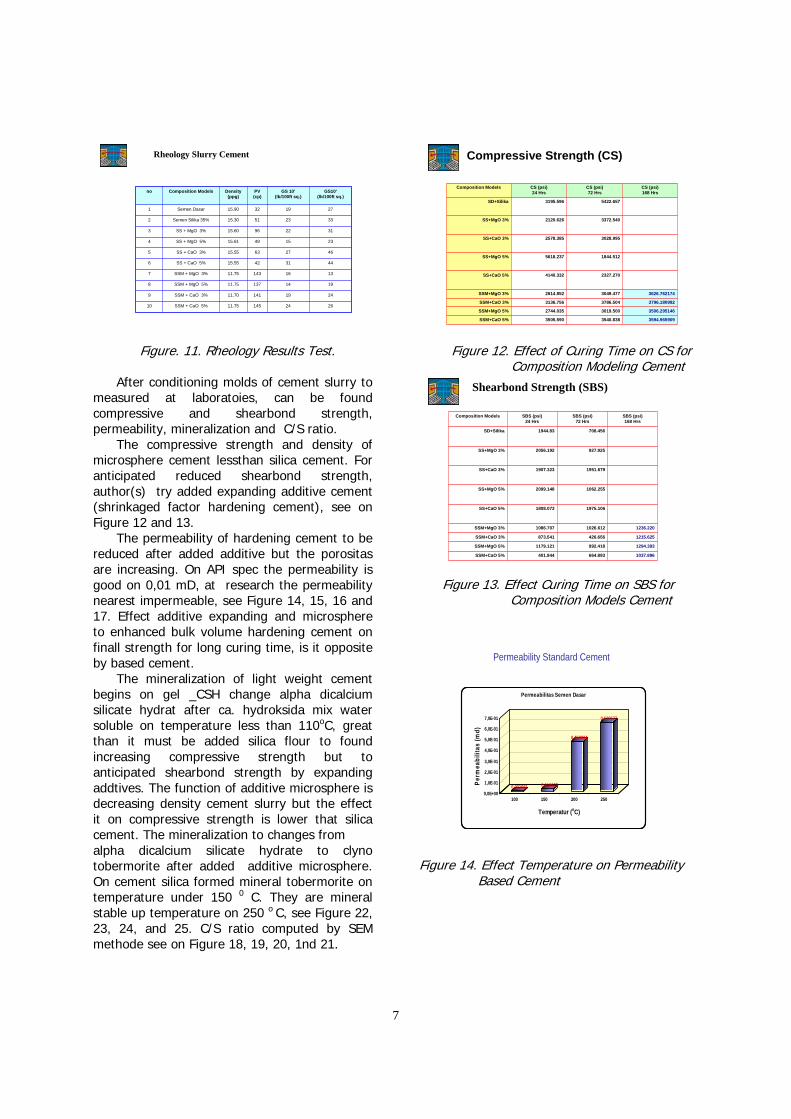
Figure. 11. Rheology Results Test. After conditioning molds of cement slurry to measured at laboratoies, can be found compressive and shearbond strength, permeability, mineralization and C/S ratio. The compressive strength and density of microsphere cement lessthan silica cement. For anticipated reduced shearbond strength, author(s) try added expanding additive cement (shrinkaged factor hardening cement), see on Figure 12 and 13. The permeability of hardening cement to be reduced after added additive but the porositas are increasing. On API spec the permeability is good on 0,01 mD, at research the permeability nearest impermeable, see Figure 14, 15, 16 and 17. Effect additive expanding and microsphere to enhanced bulk volume hardening cement on finall strength for long curing time, is it opposite by based cement. The mineralization of light weight cement begins on gel _CSH change alpha dicalcium silicate hydrat after ca. hydroksida mix water soluble on temperature less than 110oC, great than it must be added silica flour to found increasing compressive strength but to anticipated shearbond strength by expanding addtives. The function of additive microsphere is decreasing density cement slurry but the effect it on compressive strength is lower that silica cement. The mineralization to changes from alpha dicalcium silicate hydrate to clyno tobermorite after added additive microsphere. On cement silica formed mineral tobermorite on temperature under 150 0 C. They are mineral stable up temperature on 250 o C, see Figure 22, 23, 24, and 25. C/S ratio computed by SEM methode see on Figure 18, 19, 20, 1nd 21.
Compressive Strength (CS)
3594.9659093540.8383505.590SSM+CaO 5%
3506.2951463019.5002744.035SSM+MgO 5%
3796.1809923786.5043136.756SSM+CaO 3%
3626.7621743049.4772614.852SSM+MgO 3%
2327.2704140.332SS+CaO 5%
1844.5125618.237SS+MgO 5%
3028.9952578.385SS+CaO 3%
3372.5402120.626SS+MgO 3%
5422.6573195.596SD+Silika
CS (psi)168 Hrs
CS (psi)72 Hrs
CS (psi) 24 Hrs
Composition Models
Figure 12. Effect of Curing Time on CS for Composition Modeling Cement
Shearbond Strength (SBS)
1037.896664.893401.944SSM+CaO 5%
1294.393992.4181179.121SSM+MgO 5%
1215.625426.656873.541SSM+CaO 3%
1236.2201026.6121086.707SSM+MgO 3%
1975.1061808.073SS+CaO 5%
1062.2552099.148SS+MgO 5%
1951.6791907.323SS+CaO 3%
927.9252056.192SS+MgO 3%
708.4561944.83SD+Silika
SBS (psi)168 Hrs
SBS (psi)72 Hrs
SBS (psi) 24 Hrs
Composition Models
Figure 13. Effect Curing Time on SBS for Composition Models Cement
Permeability Standard Cement
0,001661 0,018927
0,460834
0,639577
0,0E+00
1,0E-01
2,0E-01
3,0E-01
4,0E-01
5,0E-01
6,0E-01
7,0E-01
Perm
eabi
litas
(md)
100 150 200 250
Temperatur (oC)
Permeabilitas Semen Dasar
Figure 14. Effect Temperature on Permeability Based Cement

8
D a t a P e r m e a b i l i t y T e s t .
c o r e d ( in c h ) d a v g ( in c h ) h ( in c h ) h a v g ( in c h ) A (1 /4 D ^ 2 * p i ) in c h ^ 2 O P (p s i) F P ( p s i) T im e ( s e c ) F lu id ( m L ) k ( m d )
s il i c a c e m e n t 2 ,3 1 2 ,3 3 3 ,2 4 3 ,2 3 6 6 6 7 4 ,2 6 5 5 6 4 2 8 6 3 5 0 2 0 0 1 1 4 0 0 6 ,3 5 4 ,1 4 2 0 6 E -0 5 ( s c ) 2 ,3 3 3 ,2 3
2 ,3 5 3 ,2 4
s c + C a O 2 ,4 2 2 ,4 0 6 6 6 7 3 ,5 2 3 ,4 6 3 3 3 3 4 ,5 5 0 8 9 2 0 6 3 3 0 0 2 0 0 7 2 0 0 0 0 03 ,0 0 % 2 ,4 3 ,4 5
2 ,4 3 ,4 2
s c + M g O 2 ,5 9 2 ,5 9 3 3 3 3 3 ,2 3 ,2 2 6 6 6 7 5 ,2 8 4 2 2 5 3 9 7 3 0 0 2 0 0 1 8 9 0 0 0 03 % 2 ,5 9 3 ,2 4
2 ,6 3 ,2 4
s c + M g O 2 ,5 5 2 ,4 9 6 6 6 7 3 ,5 5 3 ,5 9 3 3 3 3 4 ,8 9 7 6 2 7 7 7 8 3 0 0 2 0 0 6 8 4 0 0 2 3 ,1 5 3 5 7 E -0 65 % 2 ,5 1 3 ,6
2 ,4 3 3 ,6 3
s c + C a O 2 ,4 9 2 ,4 9 3 ,6 9 3 ,6 9 6 6 6 7 4 ,8 7 1 5 0 7 1 4 3 3 5 0 2 0 0 9 0 0 0 0 2 ,8 2 ,3 1 3 6 E -0 65 % 2 ,4 8 3 ,7
2 ,5 3 ,7
s c + m + M g O 2 ,6 2 ,5 6 6 6 6 7 3 ,6 1 3 ,5 8 3 3 3 3 5 ,1 7 6 1 1 1 1 1 1 3 0 0 2 0 0 8 6 4 0 0 0 03 % 2 ,5 5 3 ,6 2
2 ,5 5 3 ,5 2
s c + m + C a O 2 .5 2 .5 3 3 .9 6 3 .9 6 3 .3 3 3 5 .0 2 9 .2 7 8 .5 7 1 4 0 0 2 0 0 1 3 8 0 0 0 03 % 2 .5 3 3 .9 7
2 .5 6 3 .9 6
S C + m + M g o 2 .5 2 .5 0 3 .3 3 3 3 .4 8 3 .4 8 4 .9 2 3 .8 1 8 .2 5 4 4 0 0 2 0 0 2 6 1 0 0 0 .4 7 .9 6 E - 0 75 % 2 .5 3 .4 2
2 .5 1 3 .5 4
s c + m + C a O 2 .5 2 .5 1 3 .3 3 3 1 .9 8 1 .9 8 3 .3 3 3 4 .9 6 3 .2 3 4 .9 2 1 4 0 0 2 0 0 5 .4 0 0 0 05 % 2 .5 2 1 .9 9
2 .5 2 1 .9 8
p e n g k o n d is ia n 3 h a r i 2 0 0 C
Data of Permeability Cement
Figure 15. Effect Composition Models on Permeability Cement for 72 hrs Simulator Curing time
Permeability Semen
core d(inch) davg(inch)h(inch) havg(inch)A(1/4D^2*pi)inch^2OP(psi) FP(psi) Time(sec)Fluid(mL) k(md)
sc 2,51 2,53 3,24 3,237 5,0293 400 200 25200 0 02,53 3,232,55 3,24
sc+m+MgO 2,5 2,5 3,61 3,61 4,9107 400 200 39600 0 03,00% 2,51 3,6
2,49 3,62
sc+m+CaO 2,59 2,593 3,2 3,227 5,2842 400 200 18900 0 03% 2,59 3,24
2,6 3,24
Sc+m+MgO 2,55 2,497 3,55 3,593 4,8976 400 200 12420 2 8,68375E-065% 2,51 3,6
2,43 3,63
sc+m+CaO 2,49 2,49 3,69 3,696667 4,8715 400 200 86400 9,4 6,06804E-065% 2,48 3,7
2,5 3,7
curing time 178 hours 200C
Figure 16. Effect Composition Model on Permeability Cement for Simulator Curing Time 168 hrs.
The Relationship of Permeability and Porosity for Silica, Expanding, and
Microsphere Cement with C/S ratio Value
0.708.3525.96Microsphere Cement
1.056.3922.25Expanding Cement
1.024.2621.93Silica Cement
C/S RatioPermeability(Nano Darcy)
Porosity(%)
Sample
Figure 17. The Ralationship between Permeability, Porosity Cement and C/S Ratio.
SEM Silica Cement
SiO2
CaO
Figure. 18. SEM Silica Cement
SEM Expanding Cement MgO
CaO
SiO2
MgO
Figure. 19. SEM Expanding Cement MgO
SEM Ekspanding Cement CaO
CaO
SiO2
Figure 20. SEM Expanding Cement CaO

9
SEM Microsphere Cement
MicrosphereCaO
SiO2
Figure 21. SEM Microsphere Cement
EDX-Ray Based Cement
Figure 22. Mineralization of Based Cement
EDX-Ray Expanding Cement
Figure 23. Mineralization of Expanding Cement
EDX-Ray Silica Cement +Expanding
Figure 24. Mineralization of Silica Cement
EDX-Ray Cement Microsphere + Silica + Expanding
Figure 25. Mineralization of Microsphere Cement VI. Conclusions 1. Effect expanding additives on based cement has been strength stable on temperature 150 o C, althought Based Cement on 110 o C. 2. Effect expanding additives on silica cement has been excellent strength on temperature 200 CC, and silica cement up on 250 o C but the density is high. 3. The composition models optimum on concentration expanding 3% bwos, Silica 35 35% bwos, and microsphere 30 % bwos. 4. Mineralization formed cause stabilization strength on C/S ratio 0.70 formed mineral clino tobermorite, and C/S ratio 1.05 occurs mineral tobermorite 11 o A. VII. References

10
1. Dowell Schlumberger "Cementing Technology", Nova Communication Ltd London 1984.
2. Nelson, E.B. "Well Cementing" Schlumberger Education Service, Houston, Texas, 1990.
3. Nur et al. “ The Effect of Expanding Additives to Improve Cement Isolation Strength to 250 o C and 2000 psi Conditions”, Proccedings WGC Antalya, Turkey, 24-29 April 2005.
4. Rudi Rubiandini "Penanggulangan Khusus Penyemenan : Problem Penyemenan dan Penanggulangannya Secara Konvensional (Bag 1), JTMGB, no.1/1993.
5. Rudi Rubiandini "Penanggulangan Khusus Penyemenan : Problem Penyemenan dan Penanggulangannya Secara Konvensional (Bag 2), JTMGB, no.2/1993.
6. ___________:"Specification For Material and Testing For Well Cement",API Standart 10,Washington DC, 1990.
7. Smith, D.K. "Cementing", Monograph series of SPE of AIME Dallas, 1976.
8. Swayze,M.A."Effect of High Temperature and Pressure on Strength of Oil Well Cement", Drill and Production Practice API Dallas, 1954.

11
Figure 1. Materials and Conditions Applied During Research
Table 1. Experiment Results
Compressive Strength
Shear Bond Strength Temperature Additive
Composition % BWOC
Density ppg
( psi ) ( psi ) Standard Cement 16 3016 770
20% 13.3 2838 831 25% 12.8 3772 635 Microsphere 30% 12 3454 841
1000 C
Silica 35% 15.6 3816 999 Standard Cement 16 2820 710
20% 13.3 1854 518 25% 12.8 1108 705 Microsphere 30% 12 2437 280
2000 C
Silica 35% 15.6 4404 1976 Standard Cement 16 1965 586
20% 13.3 689 221 25% 12.8 891 138 Microsphere 30% 12 1112 251
2500 C

12
Figure 2. Density Chart for Microsphere (20%,25%,30%) and Silica 35%.
( at standard temperature )
Figure 3. Compressive Strength vs Microsphere Composition
y = 34,8x + 2517,7
y = 32,8x + 1214,3
y = 35,9x - 47,833
0
1000
2000
3000
4000
15 20 25 30 35Microsphere, % BWOC
Com
pres
sive
Str
engt
h, P
Si
T 100 T 200 T 250

13
Figure 4. Shear Bond Strength vs Microsphere Composition
Figure 5. Microsphere Compressive Strength vs Temperature
500
1500
2500
3500
4500
50 100 150 200 250 300Temperature, 0C
Com
pres
sive
Str
engt
h, P
si
Standard CementMicrosphere 20 % Microshpere 25 %
y = 1,9x + 710,17
y = -22,4x + 1031
y = 3,1x + 112,5
0
200
400
600
800
1000
15 20 25 30 35 Microsphere, % BWOC
Shea
r Bon
d St
reng
th, P
siT 100 T 200 T 250
14
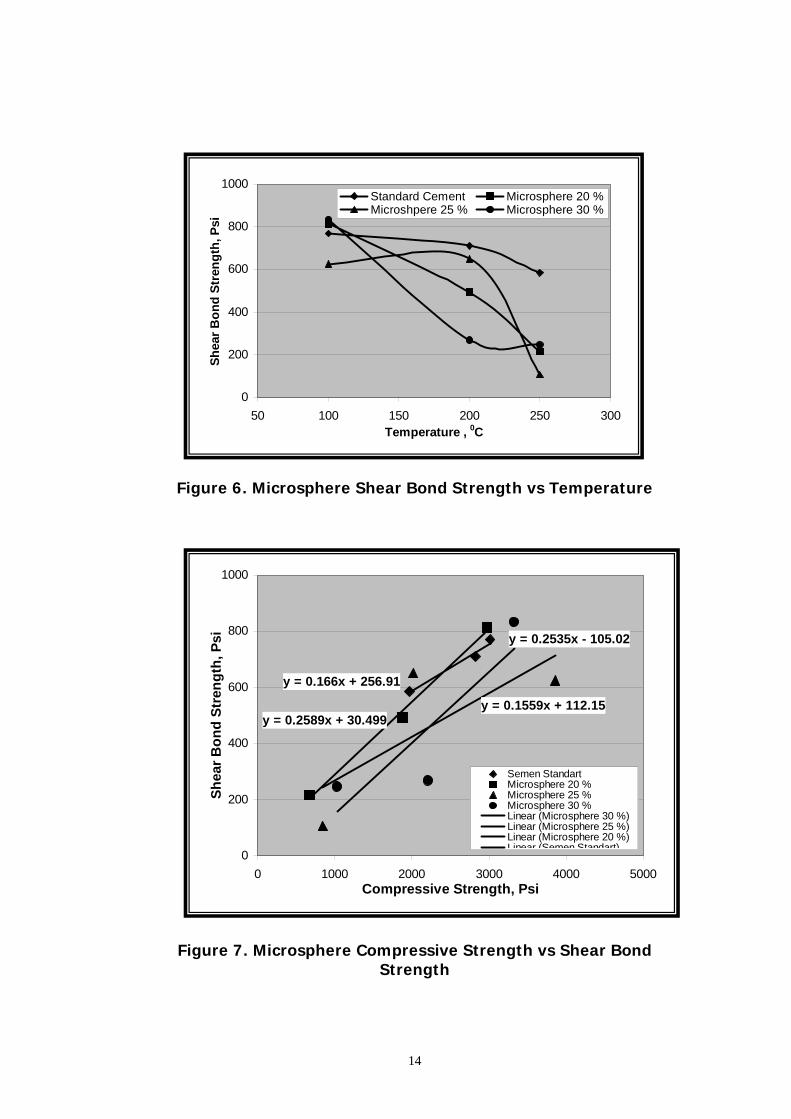
Figure 6. Microsphere Shear Bond Strength vs Temperature
Figure 7. Microsphere Compressive Strength vs Shear Bond Strength
0
200
400
600
800
1000
50 100 150 200 250 300Temperature , 0C
Shea
r Bon
d St
reng
th, P
siStandard Cement Microsphere 20 % Microshpere 25 % Microsphere 30 %
y = 0.2535x - 105.02
y = 0.1559x + 112.15y = 0.2589x + 30.499
y = 0.166x + 256.91
0
200
400
600
800
1000
0 1000 2000 3000 4000 5000Compressive Strength, Psi
Shea
r Bon
d St
reng
th, P
si
Semen StandartMicrosphere 20 %Microsphere 25 %Microsphere 30 %Linear (Microsphere 30 %)Linear (Microsphere 25 %)Linear (Microsphere 20 %)Linear (Semen Standart)

15
Figure 8. Silica Flour Compressive Strength vs Temperature
Figure 9. Silica Flour Shear Bond Strength vs Temperature
0
1000
2000
3000
4000
5000
0 50 100 150 200 250 300
Temperatur, 0C
Com
pres
sive
Str
engt
h,PS
i
Semen Standard silica
0
1000
2000
3000
4000
5000
0 50 100 150 200 250 300
Temperatur, 0C
Com
pres
sive
Str
engt
h,PS
i
Semen Standard Silica
0
1000
2000
3000
4000
5000
0 50 100 150 200 250 300
Temperatur, 0C
Com
pres
sive
Str
engt
h,PS
i
Semen Standard silica
0
1000
2000
3000
4000
5000
0 50 100 150 200 250 300
Temperatur, 0C
Com
pres
sive
Str
engt
h,PS
i
Semen Standard Silica
0
1000
2000
3000
0 50 100 150 200 250 300
Temperatur, 0C
Semen Standard Silica
0
1000
2000
3000
0 50 100 150 200 250 300
Temperatur, 0C
Shea
r Bon
d St
reng
th,P
Si
Semen Standard Silica
0
1000
2000
3000
0 50 100 150 200 250 300
Temperatur, 0C
Semen Standard Silica
0
1000
2000
3000
0 50 100 150 200 250 300
Temperatur, 0C
Shea
r Bon
d St
reng
th,P
Si
Semen Standard Silica
16
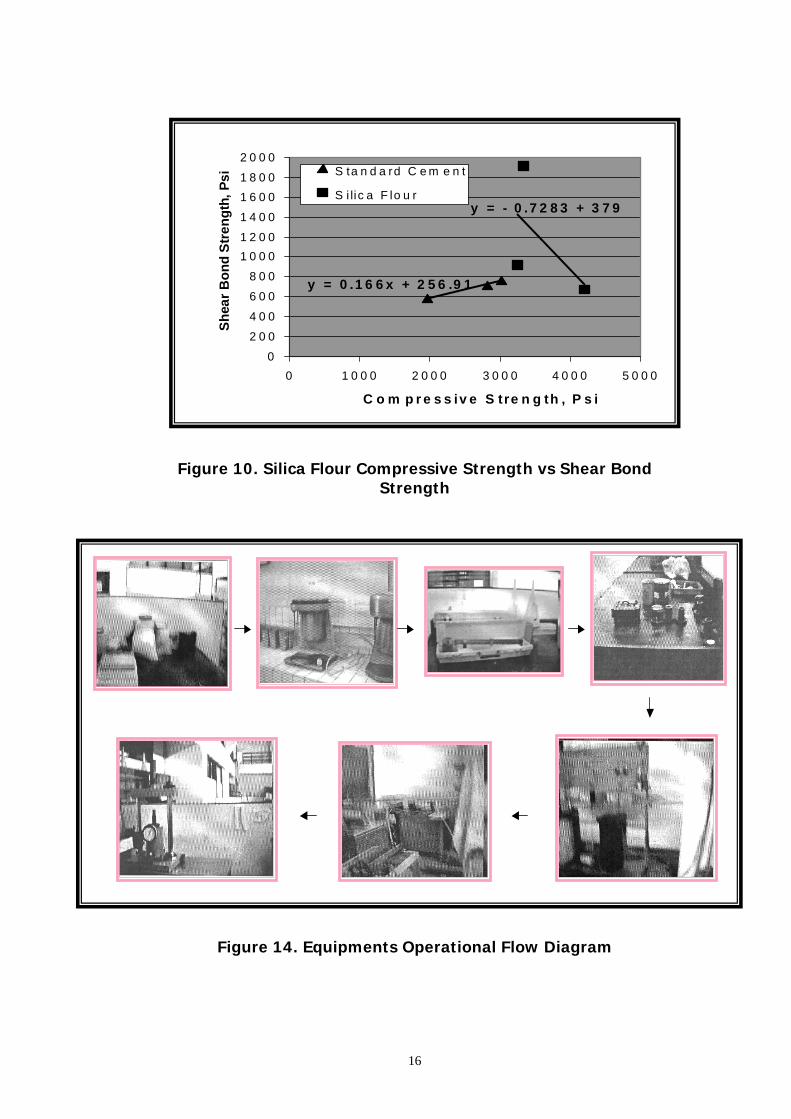
Figure 10. Silica Flour Compressive Strength vs Shear Bond Strength
Figure 14. Equipments Operational Flow Diagram
0
2 0 0
4 0 0
6 0 0
8 0 0
1 0 0 0 1 2 0 0
1 4 0 0
1 6 0 0
1 8 0 0
2 0 0 0
0 1 0 0 0 2 0 0 0 3 0 0 0 4 0 0 0 5 0 0 0
C o m p r e s s iv e S tre n g th , P s i
Shea
r Bon
d St
reng
th, P
si S ta n d a rd C e m e n t
S i lic a F lo u ry = - 0 .7 2 8 3 + 3 7 9
y = 0 .1 6 6 x + 2 5 6 .9 1

17
Figure 15. Research Flow Chart