ibm connections 5.0: custom global metrics reports
TRANSCRIPT
IBM Connections 5.0
Author: Paul GodbyBusiness Development & ISVsLast Updated: June 19, 2015Duration: 45 minutes
IBM Connections
Lab Manual
Creating a custom Metrics
Global report
COPYRIGHT IBM CORPORATION 2015. ALL RIGHTS RESERVED.
1

IBM Connections 5.0
Introduction:The Metrics application in IBM Connections provides a comprehensive set of quantitative and qualitative metrics that help measure the business value of IBM Connections in your organization.
IBM Connections uses IBM Cognos Business Intelligence to collect and maintain metrics, and to generatereports that users can view directly in IBM Connections. Metrics reports can be presented as tables or charts that you refine by selecting options such as the time period to report on, a particular application to focus on, or how to group users in the results.
IBM Connections provides metrics on two levels: Global and Community. A Global metrics report is generated every time that the user clicks it; however, the report data is updated on a daily basis. Refreshes are typically scheduled during off-peak hours to avoid degrading system performance.
Community metrics reports focus on a particular community. For example, the number of people who logged in to the Sales community last week. Community metrics are generated on demand and are then cached until a new report is requested. Requests are place into a queue and are processed in order. Aftercommunity owners submit requests, they can work in other areas of the application until the report is ready for viewing.
The IBM Connections administrator has implicit access to all metrics reports. Community owners can view metrics for their own community, but cannot view global metrics. Other users who require the information can be authorized to view global metrics; for example, managers might require access to metrics for business purposes even if they do not manage a community.
Description:In this lab, you will learn how to build a custom Metrics report for IBM Connections.
Objective:This lab will explain the following tasks:
• How to manage permissions and determine who can see and/or create new reports
• How to use Cognos Report Studio to build a new report
• How to configure IBM Connections to display the report
COPYRIGHT IBM CORPORATION 2015. ALL RIGHTS RESERVED.
2
IBM Connections 5.0
Procedure:BEFORE YOU BEGIN
Step 1 Workshop: This lab exercise was originally created as part of the following workshop. At the end of this document you will find instructions and links for accessing the materials.
IBM Connections 5.0 Customization Workshop
Step 2 Prerequisites: You must complete the following labs before proceeding with this exercise:
There are no prerequisite labs.
Step 3 Prerequisites: You must complete the following additional steps / installation / configuration before proceeding with this exercise:
You must install Cognos as outlined in the Workshop Setup Guide.
Step 4 Solutions Files: This lab may require additional files. If you are asked to write code or configure an XML file, there may be snippets available for you to review or copy/paste text to/from your lab environment. These files are located at:
There are no solutions files for this lab.
Step 5 Important! Review the workshop setup document for instructions on configuring the SoftLayerdevice for this lab. You should also review the information about user accounts and permissions. The lab instructions will assume you are using the proper user account(s)!
COPYRIGHT IBM CORPORATION 2015. ALL RIGHTS RESERVED.
3
IBM Connections 5.0
CREATE SAMPLE DATA
Before we can begin to work with Cognos Reports, you first must have a system with data.Otherwise, your reports wouldn't be very interesting! In this lab environment, you will use acustom command-line utility to populate IBM Connections with some test data.
Step 6 Before performing these steps, make sure your local workstation has an Oracle Java Runtime Environment (1.6+) installed. If necessary:
Download the latest Oracle JRE
Step 7 Visit the following URL and download the utility to your local workstation. If you are external to IBM, you will need a free IBM Greenhouse account.
IBM Internal: IBM Connections Demo Assistant
IBM External: IBM Connections Demo Assistant
Step 8 Extract the archive to a location on your local workstation.
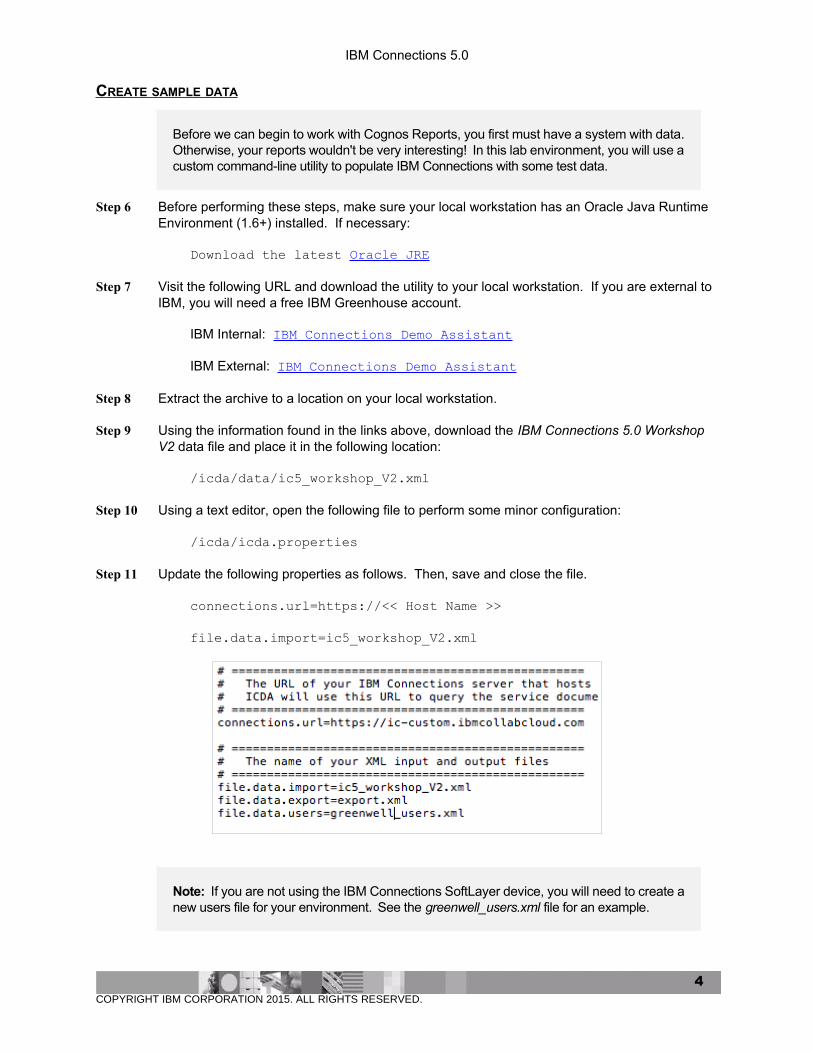
Step 9 Using the information found in the links above, download the IBM Connections 5.0 Workshop V2 data file and place it in the following location:
/icda/data/ic5_workshop_V2.xml
Step 10 Using a text editor, open the following file to perform some minor configuration:
/icda/icda.properties
Step 11 Update the following properties as follows. Then, save and close the file.
connections.url=https://<< Host Name >>
file.data.import=ic5_workshop_V2.xml
Note: If you are not using the IBM Connections SoftLayer device, you will need to create anew users file for your environment. See the greenwell_users.xml file for an example.
COPYRIGHT IBM CORPORATION 2015. ALL RIGHTS RESERVED.
4
IBM Connections 5.0
Step 12 In a terminal/command window, populate IBM Connections with some test data with the following commands:
cd << extracted location >>/icda
java -jar icda.jar import
Step 13 When the application has finished creating content, you will be returned to the command prompt. You should now have some demo content for this exercise!
The following steps assume you are now working on the server through a VNC client.
REFRESH POWERCUBE DATA
By default, IBM Cognos Transformer refreshes each PowerCube with incremental updatesonce each day, and replaces the cube’s data for the current month once a week. These jobsare scheduled by default but you might need to modify the schedules to avoid conflicts withother activities.
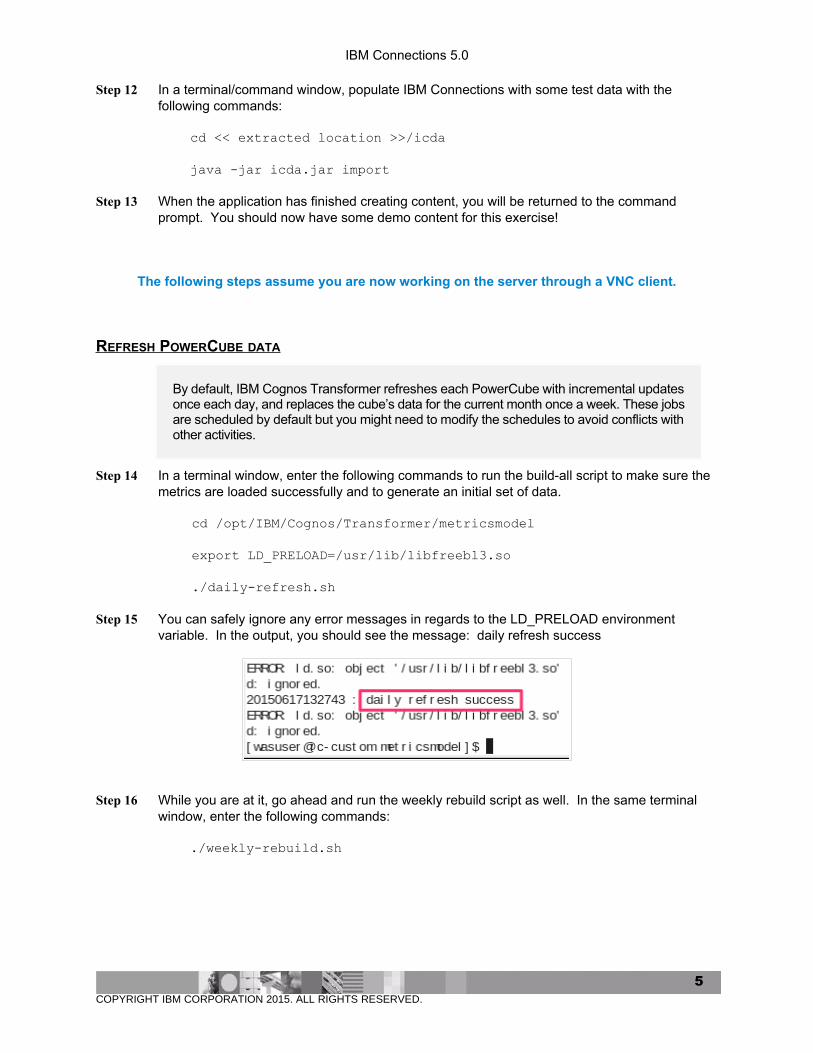
Step 14 In a terminal window, enter the following commands to run the build-all script to make sure the metrics are loaded successfully and to generate an initial set of data.
cd /opt/IBM/Cognos/Transformer/metricsmodel
export LD_PRELOAD=/usr/lib/libfreebl3.so
./daily-refresh.sh
Step 15 You can safely ignore any error messages in regards to the LD_PRELOAD environment variable. In the output, you should see the message: daily refresh success
Step 16 While you are at it, go ahead and run the weekly rebuild script as well. In the same terminal window, enter the following commands:
./weekly-rebuild.sh
COPYRIGHT IBM CORPORATION 2015. ALL RIGHTS RESERVED.
5
IBM Connections 5.0
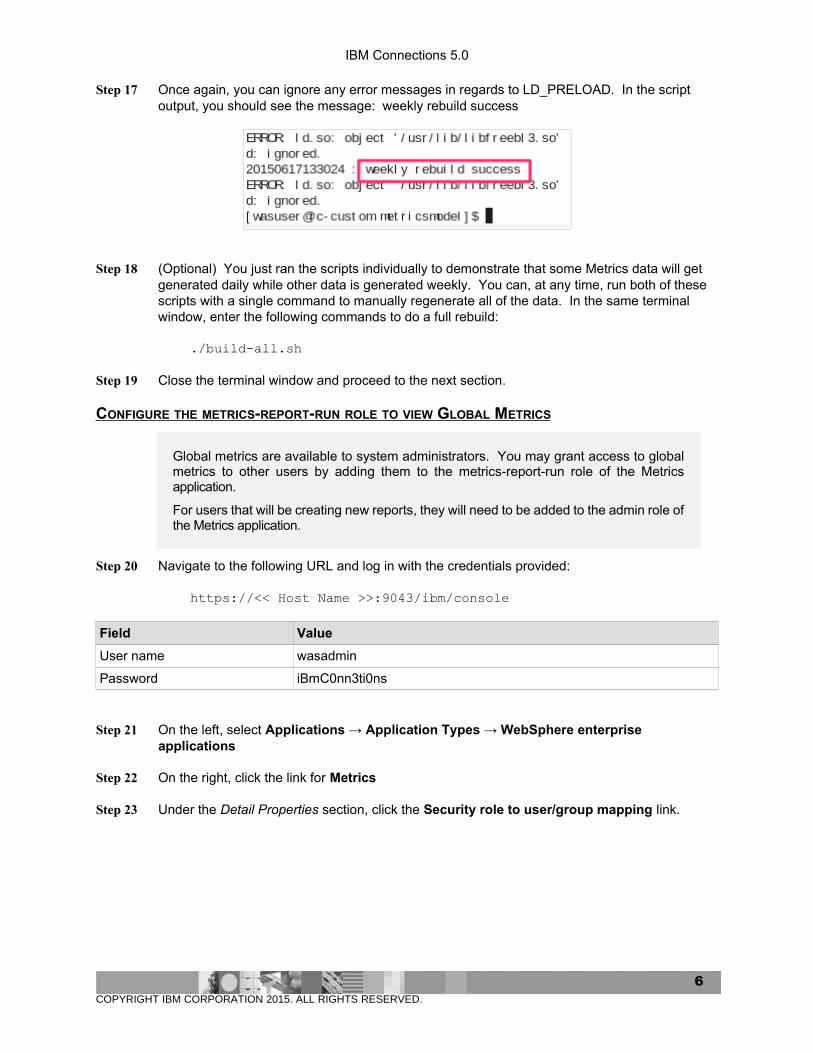
Step 17 Once again, you can ignore any error messages in regards to LD_PRELOAD. In the script output, you should see the message: weekly rebuild success
Step 18 (Optional) You just ran the scripts individually to demonstrate that some Metrics data will get generated daily while other data is generated weekly. You can, at any time, run both of these scripts with a single command to manually regenerate all of the data. In the same terminal window, enter the following commands to do a full rebuild:
./build-all.sh
Step 19 Close the terminal window and proceed to the next section.
CONFIGURE THE METRICS-REPORT-RUN ROLE TO VIEW GLOBAL METRICS
Global metrics are available to system administrators. You may grant access to globalmetrics to other users by adding them to the metrics-report-run role of the Metricsapplication.
For users that will be creating new reports, they will need to be added to the admin role ofthe Metrics application.
Step 20 Navigate to the following URL and log in with the credentials provided:
https://<< Host Name >>:9043/ibm/console
Field Value
User name wasadmin
Password iBmC0nn3ti0ns
Step 21 On the left, select Applications → Application Types → WebSphere enterprise applications
Step 22 On the right, click the link for Metrics
Step 23 Under the Detail Properties section, click the Security role to user/group mapping link.
COPYRIGHT IBM CORPORATION 2015. ALL RIGHTS RESERVED.
6
IBM Connections 5.0
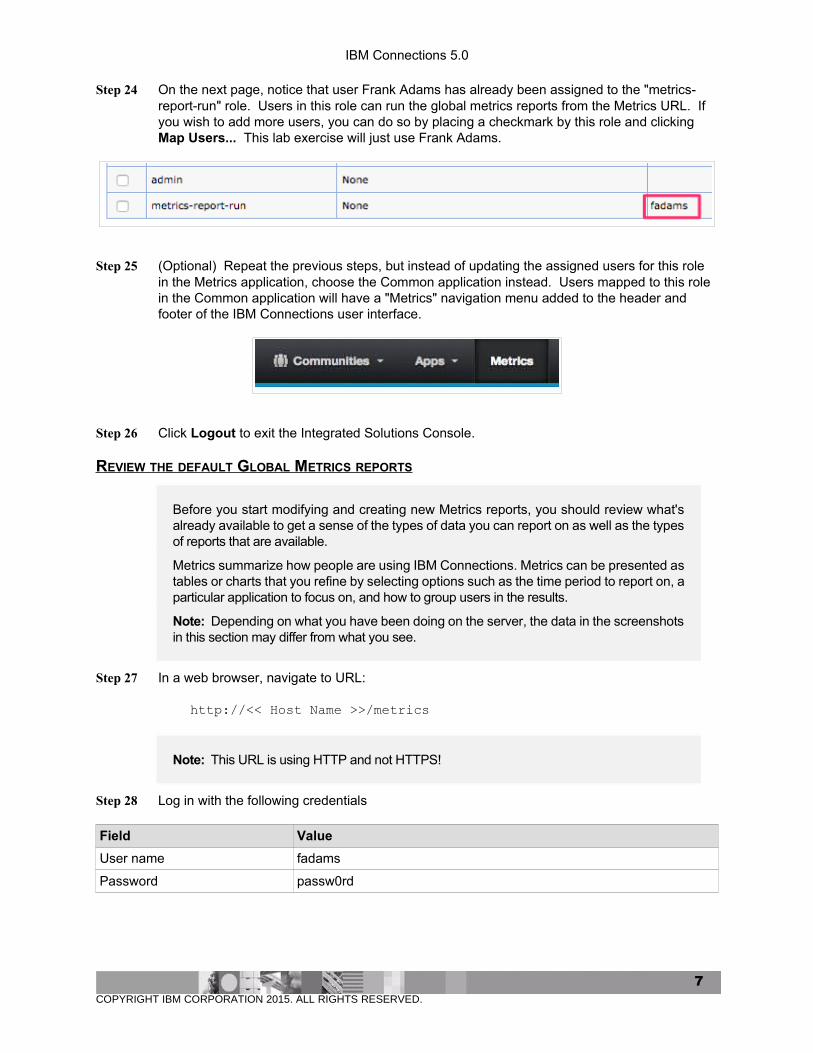
Step 24 On the next page, notice that user Frank Adams has already been assigned to the "metrics-report-run" role. Users in this role can run the global metrics reports from the Metrics URL. If you wish to add more users, you can do so by placing a checkmark by this role and clicking Map Users... This lab exercise will just use Frank Adams.
Step 25 (Optional) Repeat the previous steps, but instead of updating the assigned users for this role in the Metrics application, choose the Common application instead. Users mapped to this role in the Common application will have a "Metrics" navigation menu added to the header and footer of the IBM Connections user interface.
Step 26 Click Logout to exit the Integrated Solutions Console.
REVIEW THE DEFAULT GLOBAL METRICS REPORTS
Before you start modifying and creating new Metrics reports, you should review what'salready available to get a sense of the types of data you can report on as well as the typesof reports that are available.
Metrics summarize how people are using IBM Connections. Metrics can be presented astables or charts that you refine by selecting options such as the time period to report on, aparticular application to focus on, and how to group users in the results.
Note: Depending on what you have been doing on the server, the data in the screenshotsin this section may differ from what you see.
Step 27 In a web browser, navigate to URL:
http://<< Host Name >>/metrics
Note: This URL is using HTTP and not HTTPS!
Step 28 Log in with the following credentials
Field Value
User name fadams
Password passw0rd
COPYRIGHT IBM CORPORATION 2015. ALL RIGHTS RESERVED.
7
IBM Connections 5.0
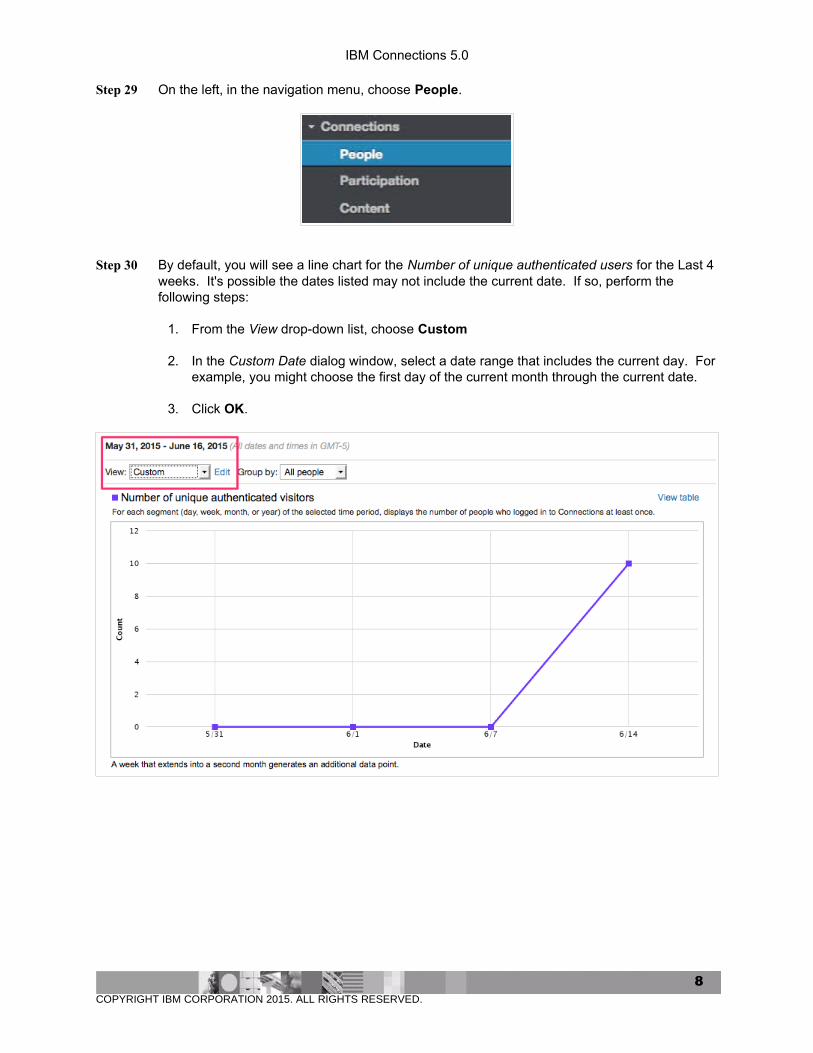
Step 29 On the left, in the navigation menu, choose People.
Step 30 By default, you will see a line chart for the Number of unique authenticated users for the Last 4 weeks. It's possible the dates listed may not include the current date. If so, perform the following steps:
1. From the View drop-down list, choose Custom
2. In the Custom Date dialog window, select a date range that includes the current day. Forexample, you might choose the first day of the current month through the current date.
3. Click OK.
COPYRIGHT IBM CORPORATION 2015. ALL RIGHTS RESERVED.
8
IBM Connections 5.0
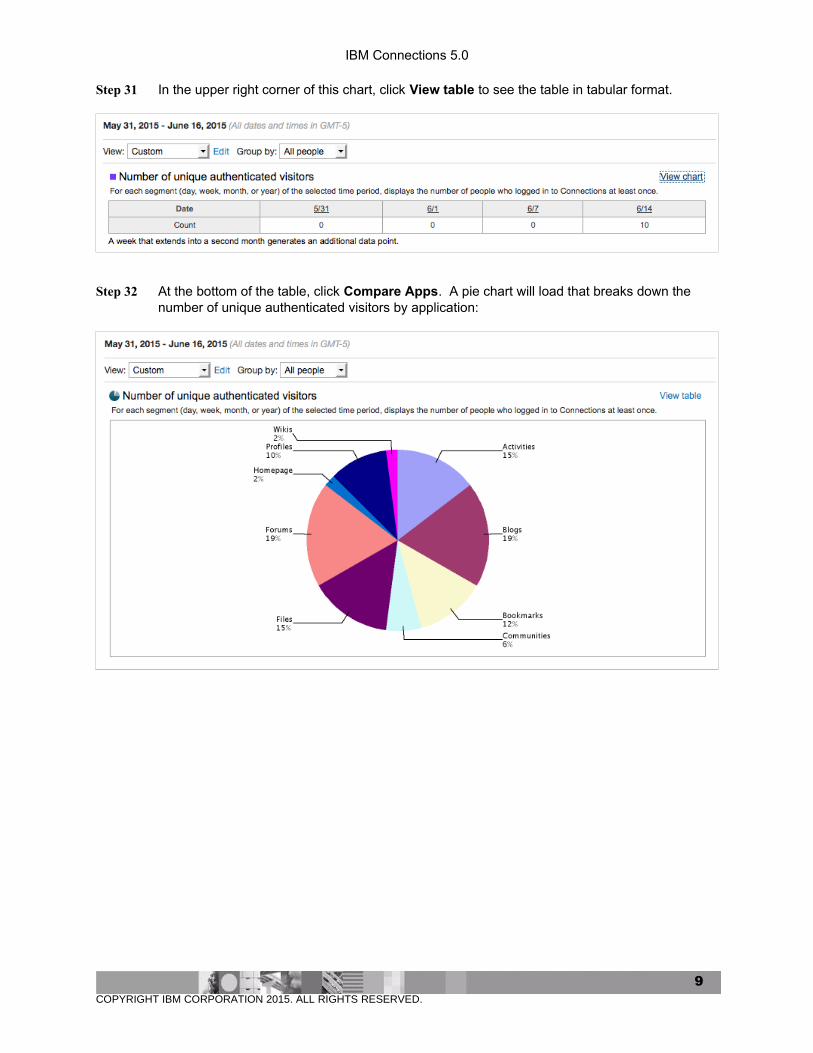
Step 31 In the upper right corner of this chart, click View table to see the table in tabular format.
Step 32 At the bottom of the table, click Compare Apps. A pie chart will load that breaks down the number of unique authenticated visitors by application:
COPYRIGHT IBM CORPORATION 2015. ALL RIGHTS RESERVED.
9
IBM Connections 5.0
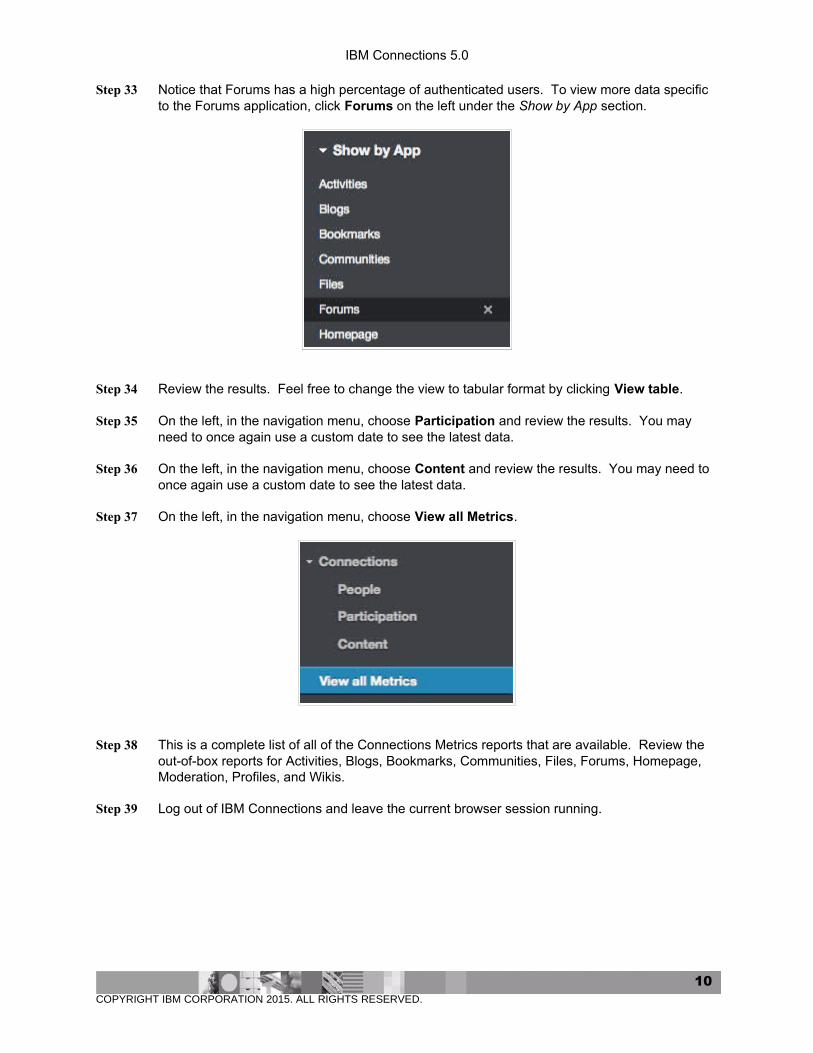
Step 33 Notice that Forums has a high percentage of authenticated users. To view more data specific to the Forums application, click Forums on the left under the Show by App section.
Step 34 Review the results. Feel free to change the view to tabular format by clicking View table.
Step 35 On the left, in the navigation menu, choose Participation and review the results. You may need to once again use a custom date to see the latest data.
Step 36 On the left, in the navigation menu, choose Content and review the results. You may need to once again use a custom date to see the latest data.
Step 37 On the left, in the navigation menu, choose View all Metrics.
Step 38 This is a complete list of all of the Connections Metrics reports that are available. Review the out-of-box reports for Activities, Blogs, Bookmarks, Communities, Files, Forums, Homepage, Moderation, Profiles, and Wikis.
Step 39 Log out of IBM Connections and leave the current browser session running.
COPYRIGHT IBM CORPORATION 2015. ALL RIGHTS RESERVED.
10
IBM Connections 5.0
CREATE A NEW GLOBAL METRICS REPORT
You can use IBM Cognos Report Studio to create new custom reports for Metrics.
Step 40 In a web browser, navigate to URL:
http://<< Host Name >>:9085/cognos/servlet/dispatch/ext
Note: This URL is using HTTP and not HTTPS!
Step 41 Log in with the following credentials
Field Value
User name fadams
Password passw0rd
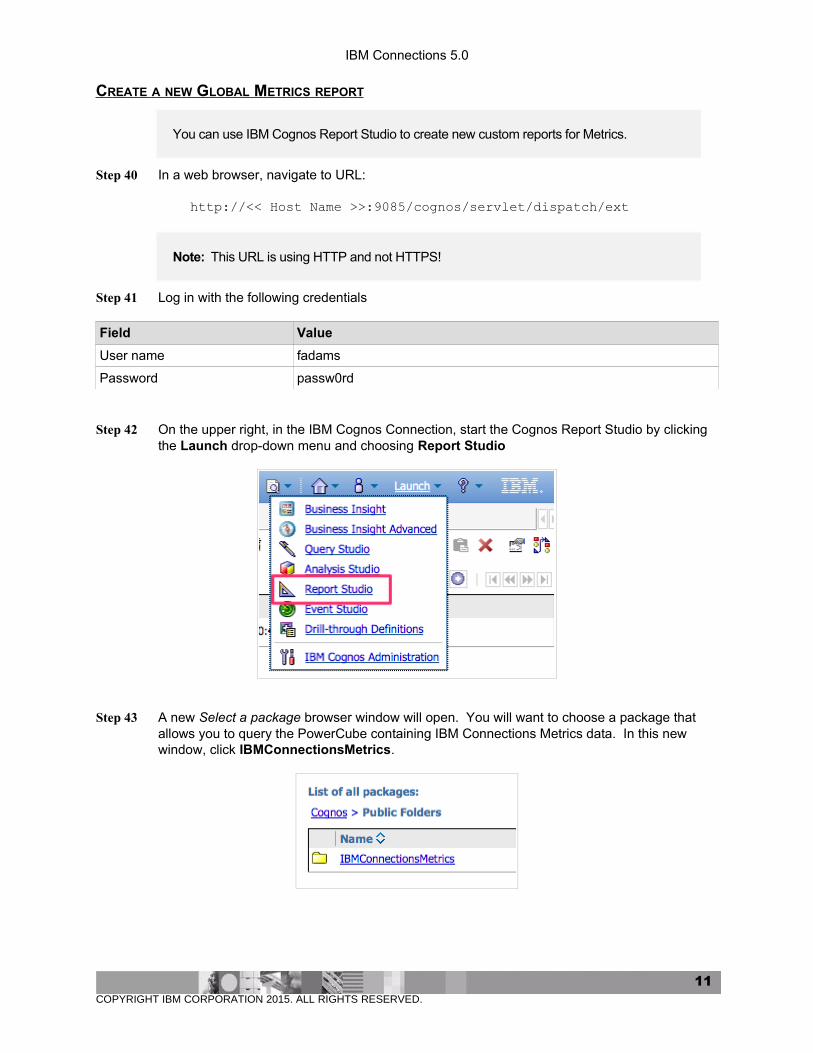
Step 42 On the upper right, in the IBM Cognos Connection, start the Cognos Report Studio by clicking the Launch drop-down menu and choosing Report Studio
Step 43 A new Select a package browser window will open. You will want to choose a package that allows you to query the PowerCube containing IBM Connections Metrics data. In this new window, click IBMConnectionsMetrics.
COPYRIGHT IBM CORPORATION 2015. ALL RIGHTS RESERVED.
11
IBM Connections 5.0
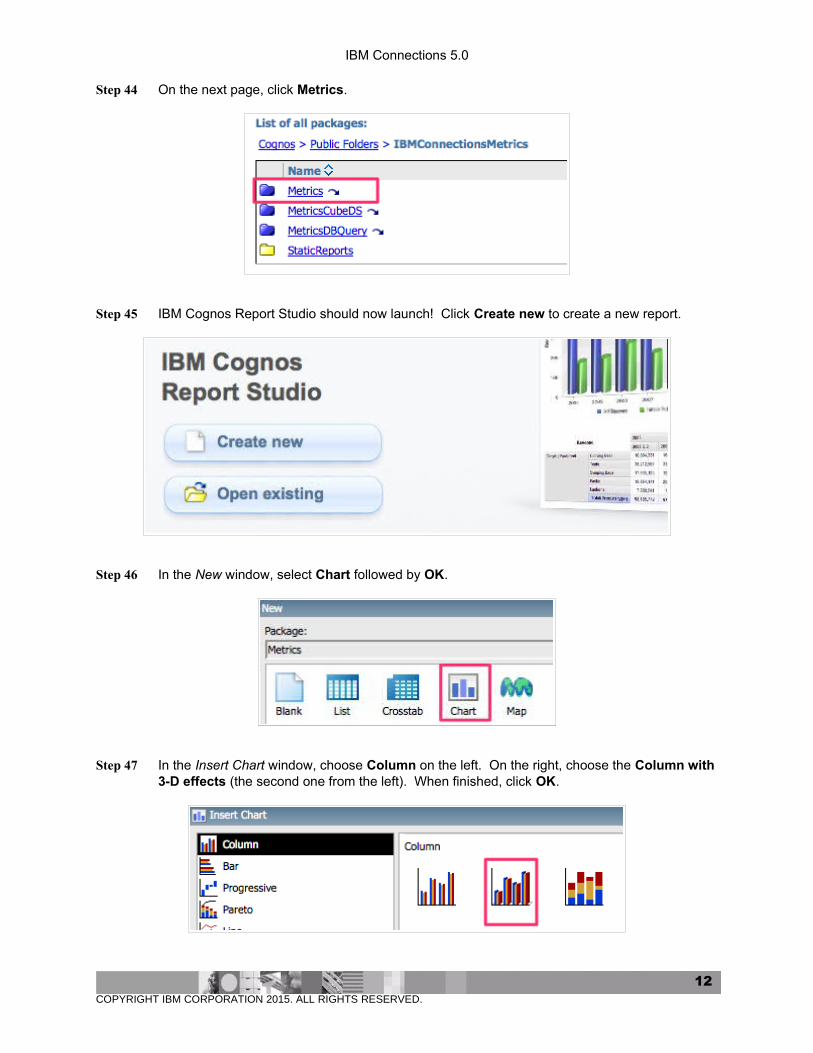
Step 44 On the next page, click Metrics.
Step 45 IBM Cognos Report Studio should now launch! Click Create new to create a new report.
Step 46 In the New window, select Chart followed by OK.
Step 47 In the Insert Chart window, choose Column on the left. On the right, choose the Column with3-D effects (the second one from the left). When finished, click OK.
COPYRIGHT IBM CORPORATION 2015. ALL RIGHTS RESERVED.
12
IBM Connections 5.0
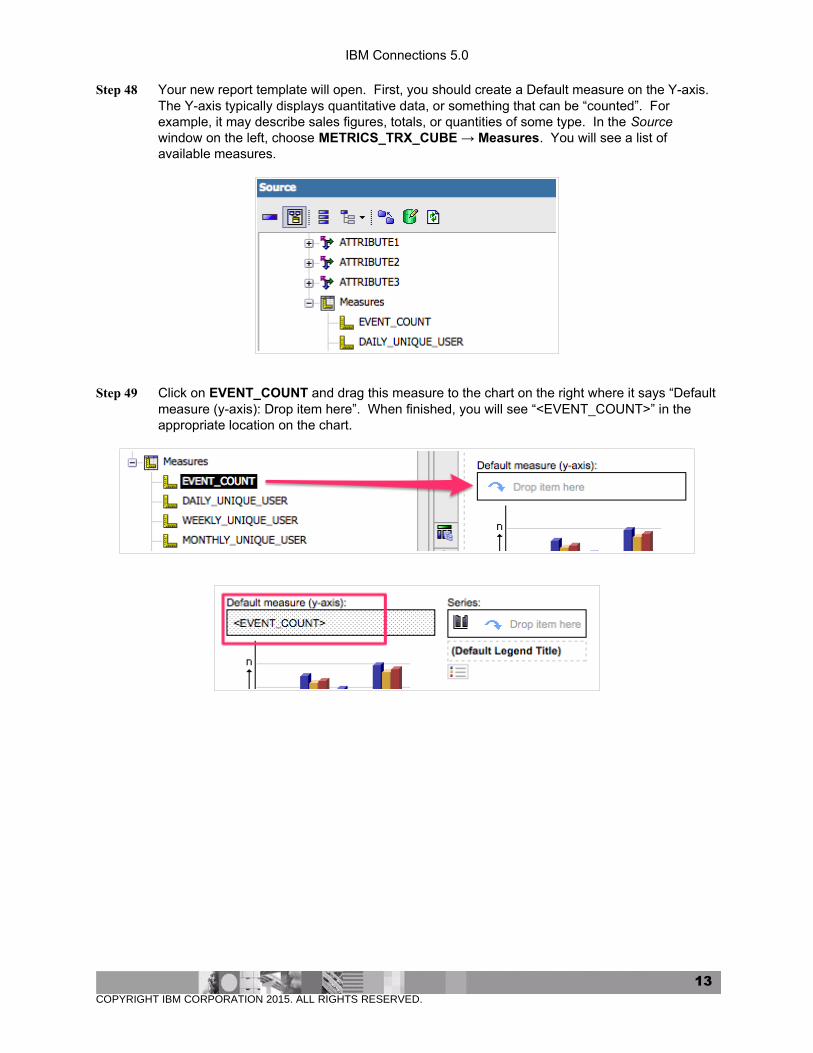
Step 48 Your new report template will open. First, you should create a Default measure on the Y-axis. The Y-axis typically displays quantitative data, or something that can be “counted”. For example, it may describe sales figures, totals, or quantities of some type. In the Source window on the left, choose METRICS_TRX_CUBE → Measures. You will see a list of available measures.
Step 49 Click on EVENT_COUNT and drag this measure to the chart on the right where it says “Defaultmeasure (y-axis): Drop item here”. When finished, you will see “<EVENT_COUNT>” in the appropriate location on the chart.
COPYRIGHT IBM CORPORATION 2015. ALL RIGHTS RESERVED.
13
IBM Connections 5.0
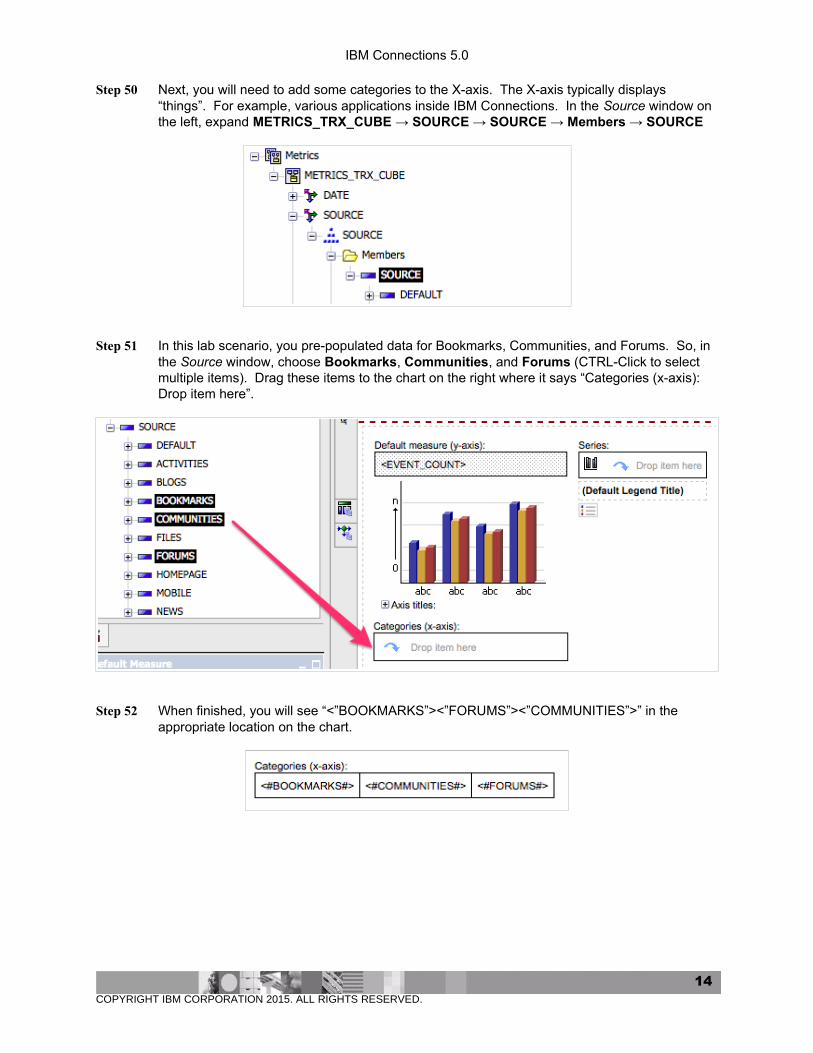
Step 50 Next, you will need to add some categories to the X-axis. The X-axis typically displays “things”. For example, various applications inside IBM Connections. In the Source window on the left, expand METRICS_TRX_CUBE → SOURCE → SOURCE → Members → SOURCE
Step 51 In this lab scenario, you pre-populated data for Bookmarks, Communities, and Forums. So, in the Source window, choose Bookmarks, Communities, and Forums (CTRL-Click to select multiple items). Drag these items to the chart on the right where it says “Categories (x-axis): Drop item here”.
Step 52 When finished, you will see “<”BOOKMARKS”><”FORUMS”><”COMMUNITIES”>” in the appropriate location on the chart.
COPYRIGHT IBM CORPORATION 2015. ALL RIGHTS RESERVED.
14
IBM Connections 5.0
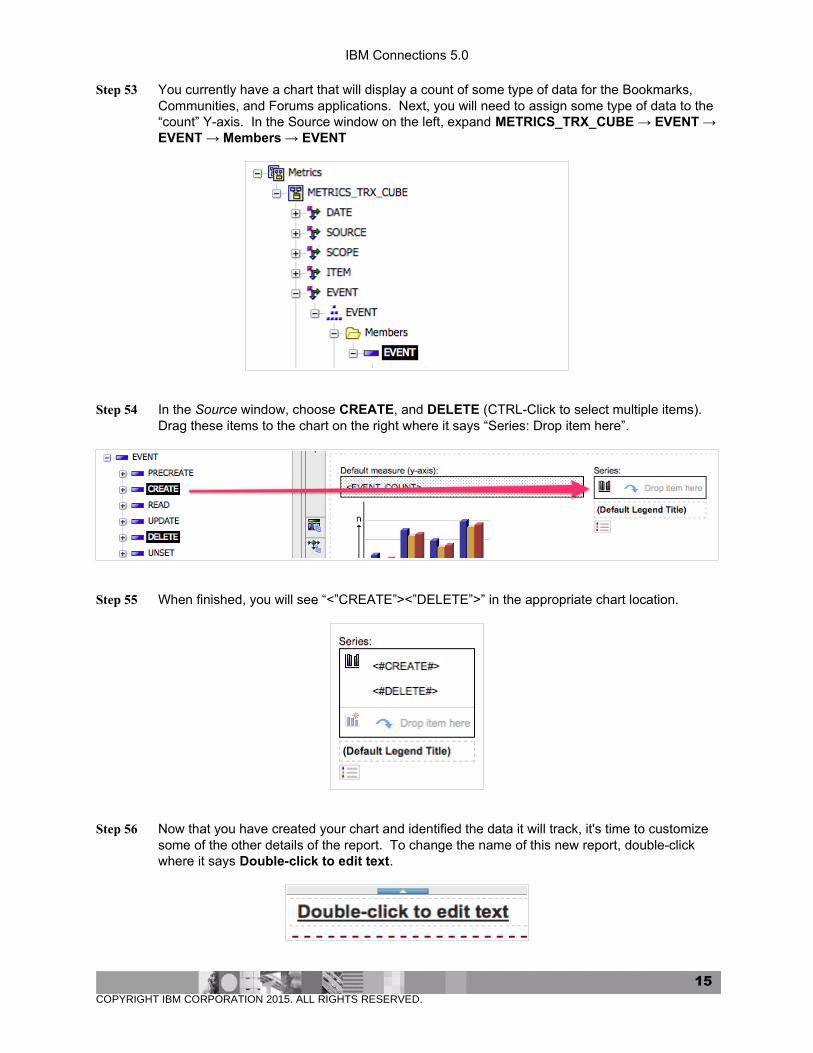
Step 53 You currently have a chart that will display a count of some type of data for the Bookmarks, Communities, and Forums applications. Next, you will need to assign some type of data to the “count” Y-axis. In the Source window on the left, expand METRICS_TRX_CUBE → EVENT →EVENT → Members → EVENT
Step 54 In the Source window, choose CREATE, and DELETE (CTRL-Click to select multiple items). Drag these items to the chart on the right where it says “Series: Drop item here”.
Step 55 When finished, you will see “<”CREATE”><”DELETE”>” in the appropriate chart location.
Step 56 Now that you have created your chart and identified the data it will track, it's time to customize some of the other details of the report. To change the name of this new report, double-click where it says Double-click to edit text.
COPYRIGHT IBM CORPORATION 2015. ALL RIGHTS RESERVED.
15
IBM Connections 5.0
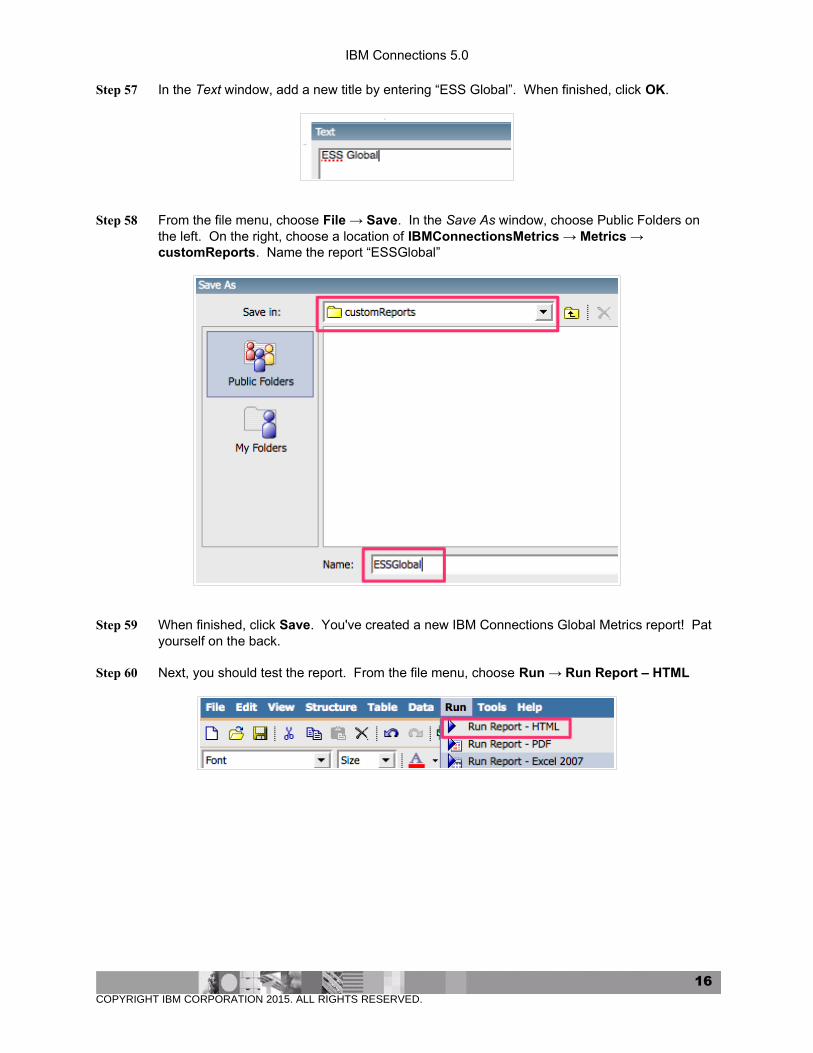
Step 57 In the Text window, add a new title by entering “ESS Global”. When finished, click OK.
Step 58 From the file menu, choose File → Save. In the Save As window, choose Public Folders on the left. On the right, choose a location of IBMConnectionsMetrics → Metrics → customReports. Name the report “ESSGlobal”
Step 59 When finished, click Save. You've created a new IBM Connections Global Metrics report! Pat yourself on the back.
Step 60 Next, you should test the report. From the file menu, choose Run → Run Report – HTML
COPYRIGHT IBM CORPORATION 2015. ALL RIGHTS RESERVED.
16
IBM Connections 5.0
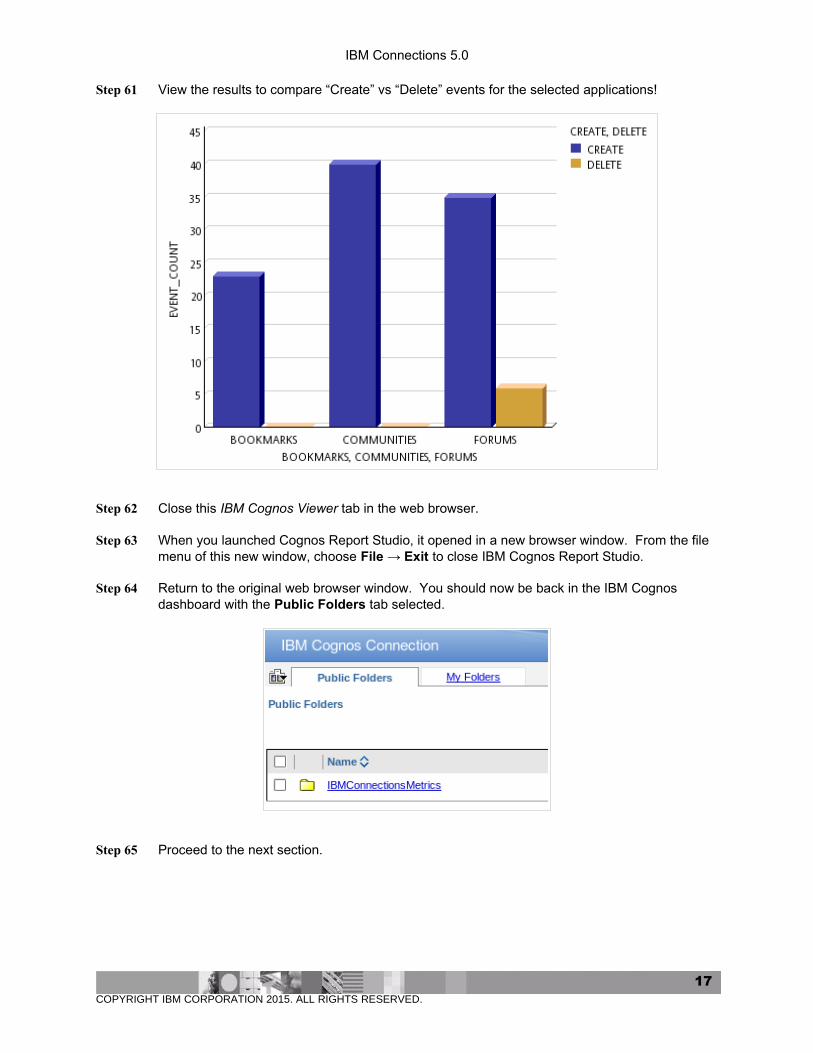
Step 61 View the results to compare “Create” vs “Delete” events for the selected applications!
Step 62 Close this IBM Cognos Viewer tab in the web browser.
Step 63 When you launched Cognos Report Studio, it opened in a new browser window. From the file menu of this new window, choose File → Exit to close IBM Cognos Report Studio.
Step 64 Return to the original web browser window. You should now be back in the IBM Cognos dashboard with the Public Folders tab selected.
Step 65 Proceed to the next section.
COPYRIGHT IBM CORPORATION 2015. ALL RIGHTS RESERVED.
17
IBM Connections 5.0
ADD THE NEW GLOBAL REPORT TO THE IBM CONNECTIONS METRICS USER INTERFACE
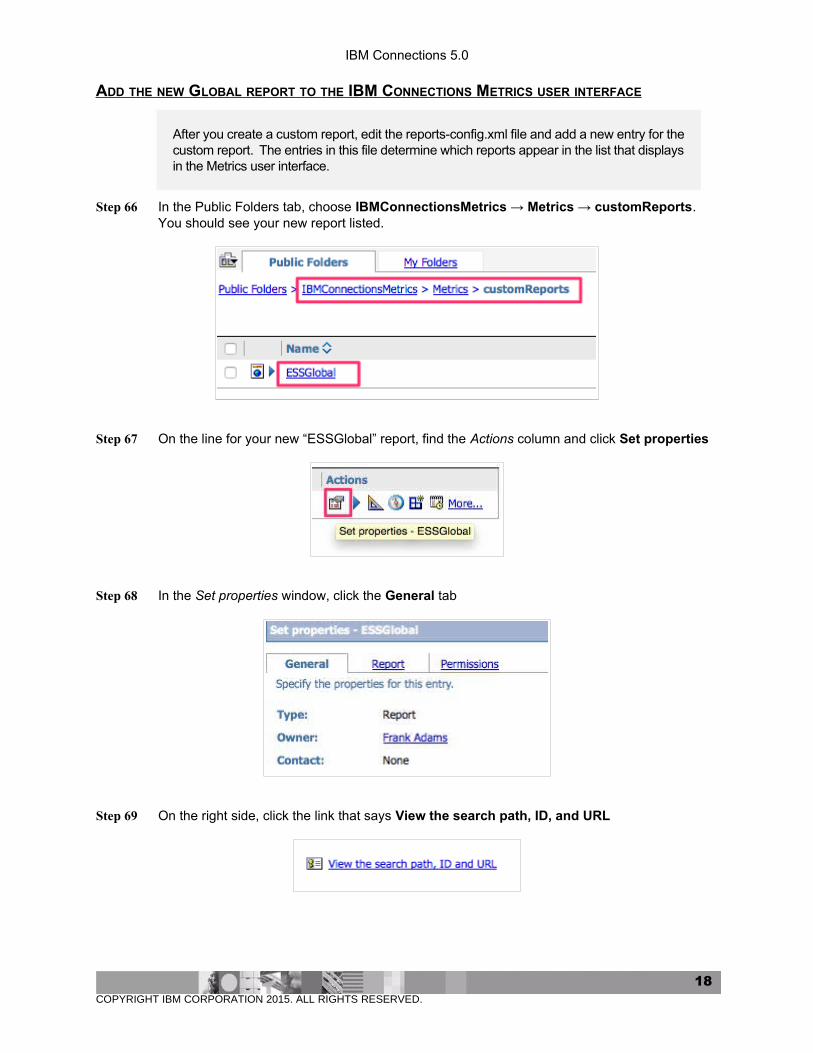
After you create a custom report, edit the reports-config.xml file and add a new entry for thecustom report. The entries in this file determine which reports appear in the list that displaysin the Metrics user interface.
Step 66 In the Public Folders tab, choose IBMConnectionsMetrics → Metrics → customReports. You should see your new report listed.
Step 67 On the line for your new “ESSGlobal” report, find the Actions column and click Set properties
Step 68 In the Set properties window, click the General tab
Step 69 On the right side, click the link that says View the search path, ID, and URL
COPYRIGHT IBM CORPORATION 2015. ALL RIGHTS RESERVED.
18
IBM Connections 5.0
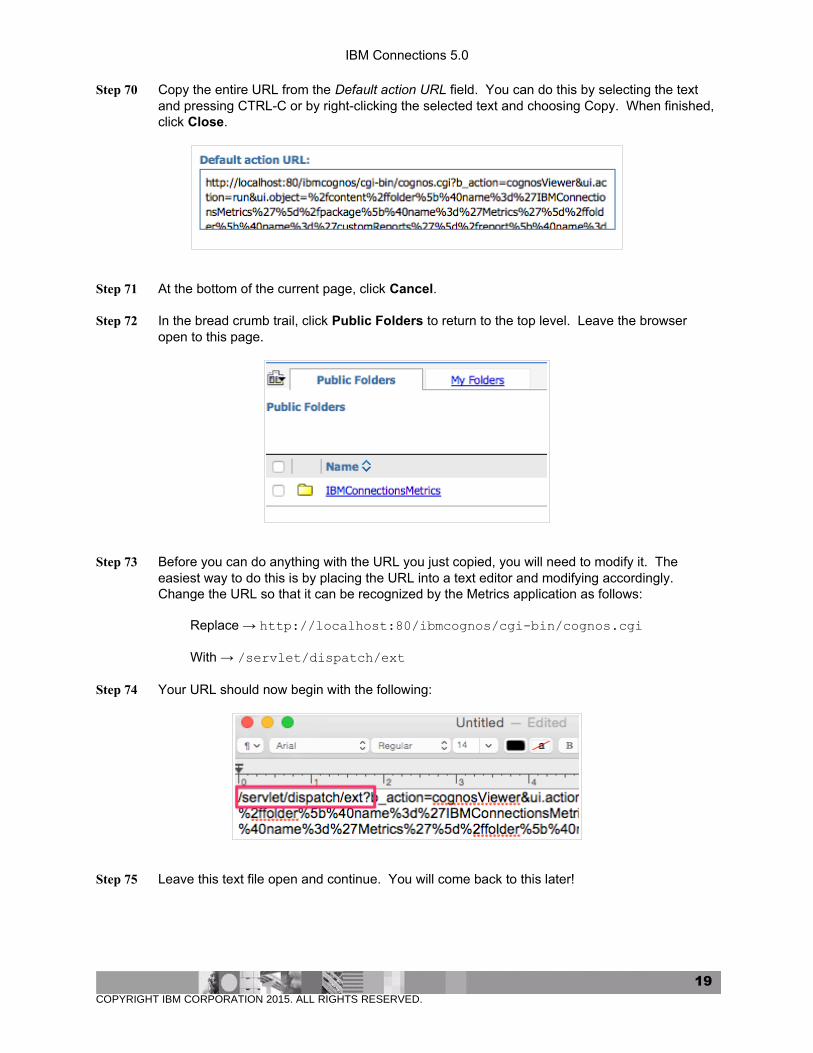
Step 70 Copy the entire URL from the Default action URL field. You can do this by selecting the text and pressing CTRL-C or by right-clicking the selected text and choosing Copy. When finished,click Close.
Step 71 At the bottom of the current page, click Cancel.
Step 72 In the bread crumb trail, click Public Folders to return to the top level. Leave the browser open to this page.
Step 73 Before you can do anything with the URL you just copied, you will need to modify it. The easiest way to do this is by placing the URL into a text editor and modifying accordingly. Change the URL so that it can be recognized by the Metrics application as follows:
Replace → http://localhost:80/ibmcognos/cgi-bin/cognos.cgi
With → /servlet/dispatch/ext
Step 74 Your URL should now begin with the following:
Step 75 Leave this text file open and continue. You will come back to this later!
COPYRIGHT IBM CORPORATION 2015. ALL RIGHTS RESERVED.
19
IBM Connections 5.0
Step 76 Now that you have revised a URL for your custom report, you must add the report to a configuration file to surface it in the IBM Connections Metrics user interface.
Step 77 The wsadmin tool is a command shell for the purpose of performing systems administration on all the artifacts in an IBM WebSphere Application Server (WAS) cell. In a terminal window, enter the following commands to start the wsadmin tool.
mkdir /config
cd /opt/IBM/WebSphere/AppServer/profiles/Dmgr01/bin
./wsadmin.sh -lang jython -user wasadmin -password iBmC0nn3ti0ns
Step 78 Next, store references to your IBM Connections configuration environment in a few variables. By storing these values in variables, you can easily reference them in subsequent wsadmin commands. In the wsadmin session, enter the following commands:
path = "/config"
cell = AdminControl.getCell()
Step 79 Now that your session is configured, check out the Metrics configuration file with the following commands:
execfile("metricsAdmin.py")
MetricsConfigService.checkOutConfig(path, cell)
Step 80 Leave the terminal window with your existing wsadmin session open.
Step 81 Edit the checked out configuration file named:
/config/reports-config.xml
Step 82 In this configuration file, you should see a section for Global reports and another section for Community reports.
Step 83 In the Global section, you can add your own groupings and nest reports as required. You can accomplish this in two different ways:
1. Nest report entries inside each other to achieve the desired layout. Since the top-level entry is also a report, it will display a “default” report when clicked.
2. Create a category entry. Nest your report entries inside this category. In this scenario, the top-level entry will not display a “default” report when clicked.
COPYRIGHT IBM CORPORATION 2015. ALL RIGHTS RESERVED.
20
IBM Connections 5.0
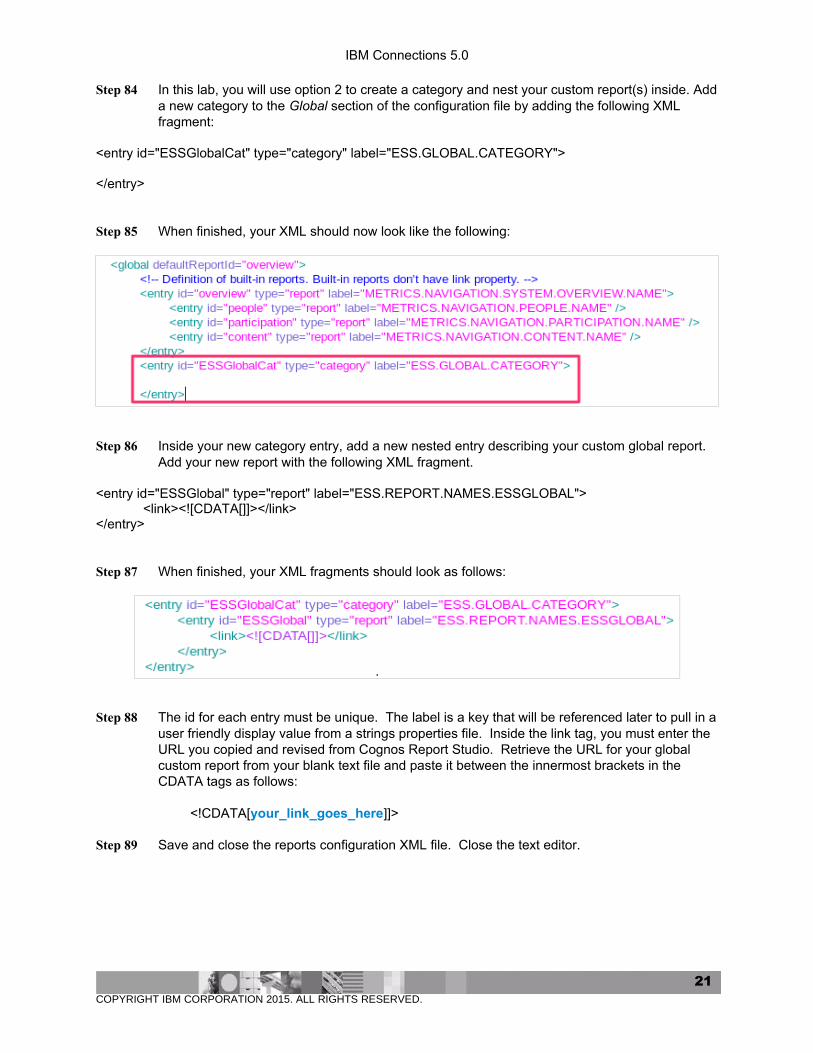
Step 84 In this lab, you will use option 2 to create a category and nest your custom report(s) inside. Adda new category to the Global section of the configuration file by adding the following XML fragment:
<entry id="ESSGlobalCat" type="category" label="ESS.GLOBAL.CATEGORY">
</entry>
Step 85 When finished, your XML should now look like the following:
Step 86 Inside your new category entry, add a new nested entry describing your custom global report. Add your new report with the following XML fragment.
<entry id="ESSGlobal" type="report" label="ESS.REPORT.NAMES.ESSGLOBAL"><link><![CDATA[]]></link>
</entry>
Step 87 When finished, your XML fragments should look as follows:
Step 88 The id for each entry must be unique. The label is a key that will be referenced later to pull in auser friendly display value from a strings properties file. Inside the link tag, you must enter the URL you copied and revised from Cognos Report Studio. Retrieve the URL for your global custom report from your blank text file and paste it between the innermost brackets in the CDATA tags as follows:
<!CDATA[your_link_goes_here]]>
Step 89 Save and close the reports configuration XML file. Close the text editor.
COPYRIGHT IBM CORPORATION 2015. ALL RIGHTS RESERVED.
21
IBM Connections 5.0
Step 90 Return to the terminal window with your existing wsadmin session. Check in your changes with the wsadmin tool using the following command:
MetricsConfigService.checkInConfig(path, cell)
quit
Step 91 Close any terminal windows you opened in this lab. Proceed to the next section.
CREATE A STRINGS RESOURCE BUNDLE
In the previous section, you entered some keys in the reports XML configuration file. In thissection, you will map these keys to more user friendly strings that will appear in the IBMConnections user interface.
Step 92 Create a new properties file named
com.ibm.connections.metrics.ui.strings.ui.properties
in location
/opt/IBM/Connections/data/shared/customization/strings
Step 93 In this new file, enter the following lines.
Step 94 As you can see, you will be providing key-value pairs for each of the entries you created in the report XML configuration file.
ESS.GLOBAL.CATEGORY=ESS ReportsESS.REPORT.NAMES.ESSGLOBAL=ESS Events
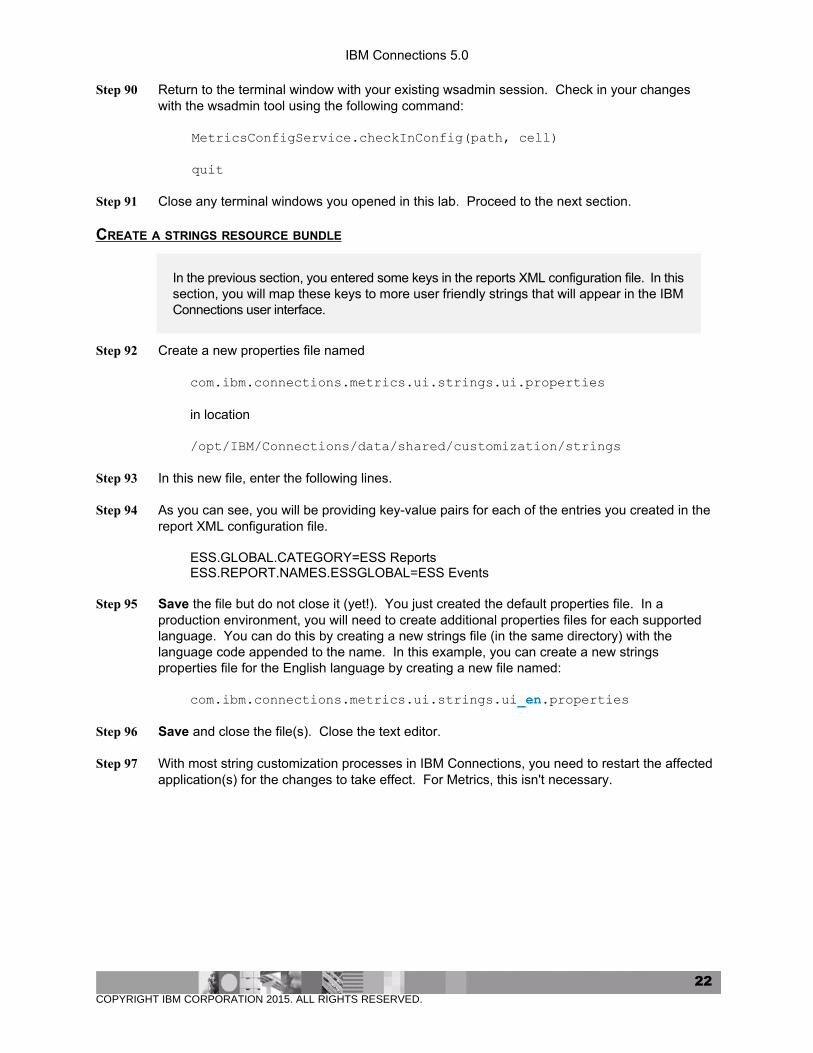
Step 95 Save the file but do not close it (yet!). You just created the default properties file. In a production environment, you will need to create additional properties files for each supported language. You can do this by creating a new strings file (in the same directory) with the language code appended to the name. In this example, you can create a new strings properties file for the English language by creating a new file named:
com.ibm.connections.metrics.ui.strings.ui_en.properties
Step 96 Save and close the file(s). Close the text editor.
Step 97 With most string customization processes in IBM Connections, you need to restart the affected application(s) for the changes to take effect. For Metrics, this isn't necessary.
COPYRIGHT IBM CORPORATION 2015. ALL RIGHTS RESERVED.
22
IBM Connections 5.0
REVIEW YOUR NEW GLOBAL REPORT
Now that your custom report has been built and added to the IBM Connections userinterface, it's time to review the new data that will give you insights into your deployment.
Step 98 In a web browser, open a new tab and navigate to URL:
https://<< Host Name >>/metrics
Step 99 Log in with the following credentials (if necessary)
Field Value
User name fadams
Password passw0rd
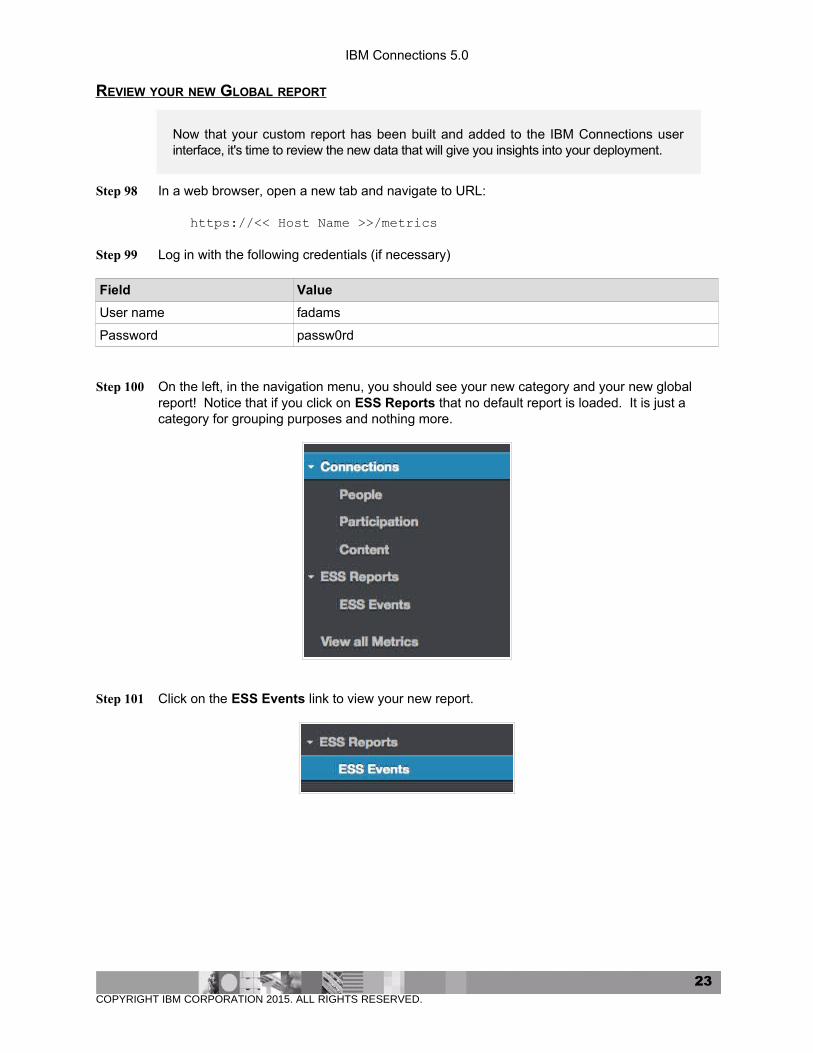
Step 100 On the left, in the navigation menu, you should see your new category and your new global report! Notice that if you click on ESS Reports that no default report is loaded. It is just a category for grouping purposes and nothing more.
Step 101 Click on the ESS Events link to view your new report.
COPYRIGHT IBM CORPORATION 2015. ALL RIGHTS RESERVED.
23
IBM Connections 5.0
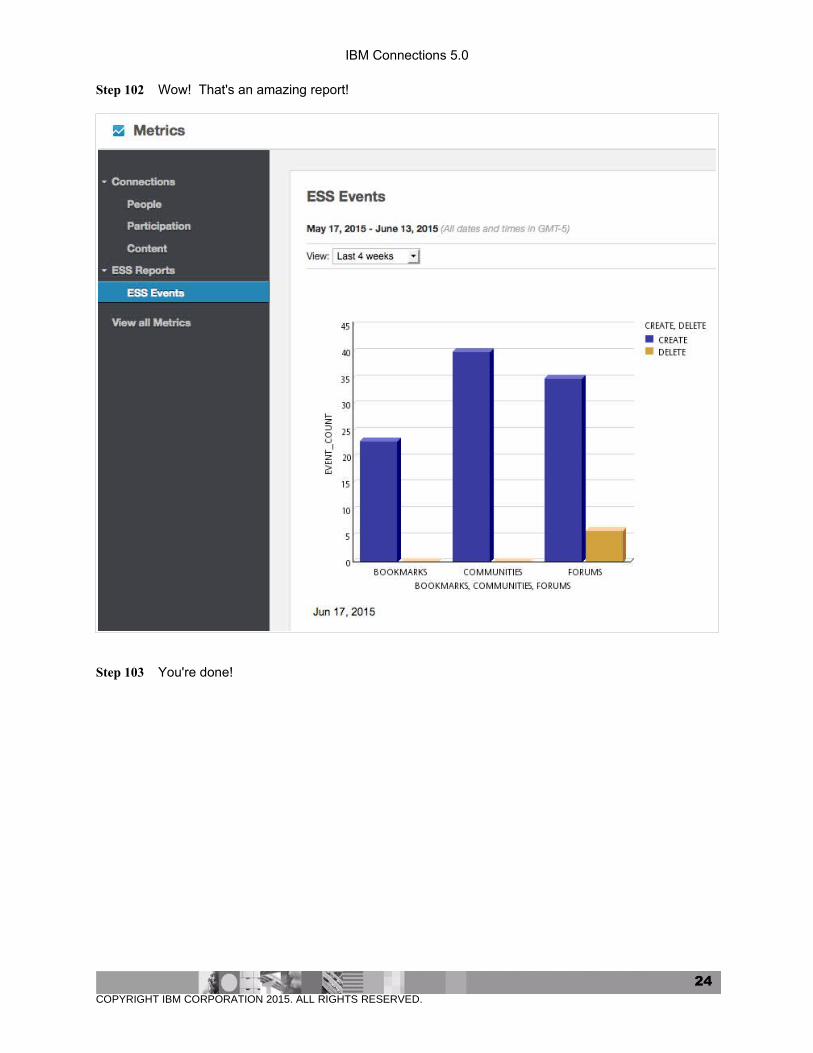
Step 102 Wow! That's an amazing report!
Step 103 You're done!
COPYRIGHT IBM CORPORATION 2015. ALL RIGHTS RESERVED.
24
IBM Connections 5.0
Summary:
In this lab, you learned how to create a new custom report for IBM Connections Metrics.You also learned how to add custom reports to the Global Metrics application. Finally, youlearned how to provide custom strings for you labels for the user interface.
Next Steps:Access FREE education on the IBM Collaboration Solutions portfolio of products today!
1. Visit the IBM Greenhouse and create a free account.
Link → http://greenhouse.lotus.com/
2. Visit the IBM Collaboration Solutions Ecosystem Development Community
Link → https://greenhouse.lotus.com/communities/community/icsecod
3. Learn new skills and share these links with your friends and colleagues!
COPYRIGHT IBM CORPORATION 2015. ALL RIGHTS RESERVED.
25