ibm svc km for patrol 1.2
TRANSCRIPT

IBM SVC KM for PATROL
STORAGE MONITORING
USER DOCUMENTATION
Version 1.2.01
June 2021

Contacting BMC Software
You can access the BMC Software Web site at http://www.bmc.com. From this Web site, you canobtain information about the company, its products, corporate offices, special events, and careeropportunities.
United States and Canada
Address BMC Software, Inc.2101 CityWest Blvd. Houston TX77042-2827
Telephone 1 (713) 918 8800 or 1 (800) 841 2031 (Toll Free)
Copyright 2015 BMC Software, Inc. or licensors, as an unpublished work. All rights reserved.
BMC Software, the BMC Software logos, and all other BMC Software product or service names areregistered trademarks or trademarks of BMC Software, Inc.
All other trademarks belong to their respective companies.
BMC Software considers information included in this documentation to be proprietary andconfidential. Your use of this information is subject to the terms and conditions of the applicableEnd User License Agreement for the product and the proprietary and restricted rights noticesincluded in this documentation.
Restricted Rights Legend
U.S. Government Restricted Rights to Computer Software. UNPUBLISHED -- RIGHTS RESERVEDUNDER THE COPYRIGHT LAWS OF THE UNITED STATES. Use, duplication, or disclosure of any dataand computer software by the U.S. Government is subject to restrictions, as applicable, set forthin FAR Section 52.227-14, DFARS 252.227-7013, DFARS 252.227-7014, DFARS 252.227-7015, andDFARS 252.227-7025, as amended from time to time. Contractor/Manufacturer is BMC Software,Inc., 2101 CityWest Blvd., Houston, TX 77042-2827, USA. Any contract notices should be sent to thisaddress.
2
IBM
SV
C K
M f
or
PA
TRO
L V
ersi
on 1
.2.0
1
Customer Support
You can obtain technical support by using the Support page on the BMC Software Web site or bycontacting Customer Support by telephone or e-mail.
Support Web Site
You can obtain technical support from BMC Software 24 hours a day, 7 days a week at http://www.bmc.com/support_home. From this Web site, you can:
Read overviews about support services and programs that BMC Software offers
Find the most current information about BMC Software products
Search a database for problems similar to yours and possible solutions
Order or download product documentation
Report a problem or ask a question
Subscribe to receive e-mail notices when new product versions are released
Find worldwide BMC Software support center locations and contact information, including e-mail addresses, fax numbers, and telephone numbers
You can also access product documents and search the Knowledge Base for help with an issue at http://www.sentrysoftware.com
Support by Telephone or E-mail
In the United States and Canada, if you need technical support and do not have access to the Web,call 800 537 1813. Outside the United States and Canada, please contact your local support centerfor assistance. To find telephone and email contact information for the BMC Software supportcenter that services your location, refer to the Contact Customer Support section of the Supportpage on the BMC Software Web site at http://www.bmc.com/support_home.
3
IBM
SV
C K
M f
or
PA
TRO
L V
ersi
on 1
.2.0
1

4
IBM
SV
C K
M f
or
PA
TRO
L V
ersi
on 1
.2.0
1
Table of Contents.....................................................................................................................................................................................11Product at a Glance
.....................................................................................................................................................................................12Supported Platforms
.....................................................................................................................................................................................14Prerequisites
.....................................................................................................................................................................................19Getting the BMC Software Installation Utility
.....................................................................................................................................................................................19Packages
.....................................................................................................................................................................................20Extracting the Setup Files
.....................................................................................................................................................................................23Installing IBM SVC KM for PATROL
.....................................................................................................................................................................................34Uninstalling IBM SVC KM for PATROL
.....................................................................................................................................................................................43Integrating with BMC Portal
.....................................................................................................................................................................................44Integrating with BMC ProactiveNet Performance Management
.....................................................................................................................................................................................46Configuring the KM
.......................................................................................................................................................................................46Loading the KM on your Console
.......................................................................................................................................................................................47Configuring Java Settings
.......................................................................................................................................................................................52Configuring the Monitoring of an IBM SVC System
.......................................................................................................................................................................................57Editing Connection Settings
.....................................................................................................................................................................................58Monitoring with the KM
.......................................................................................................................................................................................59Detecting Oversubscription Situation (Thin Provisioning)
.......................................................................................................................................................................................59Detecting High Processor Utilization
.......................................................................................................................................................................................61Diagnosing SAN/Network Contention
.......................................................................................................................................................................................63Diagnosing Slow LUNs
.......................................................................................................................................................................................64Finding the Bottleneck in an IBM SVC
.......................................................................................................................................................................................70Identifying the Busiest LUNs
.......................................................................................................................................................................................72Identifying the Hosts that can Access a LUN
.......................................................................................................................................................................................72Identifying LUNs Preferred Node
.......................................................................................................................................................................................73Identifying a Slow Back-end Storage System
.......................................................................................................................................................................................75Monitoring Volume Copy Synchronization
.......................................................................................................................................................................................78Reclaiming Space of Unmapped LUNs
.......................................................................................................................................................................................82Reporting Disk Space Consumption
.......................................................................................................................................................................................86Searching WWN/IQN
.......................................................................................................................................................................................88Viewing the MDisks Activity
.......................................................................................................................................................................................89Reporting
......................................................................................................................................................................89Nodes Activity Report

5
IBM
SV
C K
M f
or
PA
TRO
L V
ersi
on 1
.2.0
1
......................................................................................................................................................................91Ports Activity Report
......................................................................................................................................................................92Storage Systems Activity Report
......................................................................................................................................................................93MDisks Activity Report
......................................................................................................................................................................94Pools Activity Report
......................................................................................................................................................................96Volumes Activity Report
......................................................................................................................................................................97LUNs Mapping Table
......................................................................................................................................................................98LUNs Preferred Node Table
......................................................................................................................................................................99Per Host Storage Allocation
......................................................................................................................................................................99Per LUN Storage Allocation
......................................................................................................................................................................100Scheduling Reports
.....................................................................................................................................................................................101Administrative Tasks
.......................................................................................................................................................................................101Managing FC Port Parameters
......................................................................................................................................................................102Acknowledging Alerts and Resetting
......................................................................................................................................................................102Setting Automatic Parameter Reset
.......................................................................................................................................................................................103Configuring Java Settings
.......................................................................................................................................................................................107Customizing the Discovery Interval
.......................................................................................................................................................................................107Customizing the Polling Interval
.......................................................................................................................................................................................108Disabling Volumes Monitoring
.......................................................................................................................................................................................110Enabling the Debug Mode
.......................................................................................................................................................................................111Enabling the KM Configuration Menus
.......................................................................................................................................................................................113Pausing/Resuming Monitoring
.......................................................................................................................................................................................113Refreshing Parameters
.......................................................................................................................................................................................113Removing Device Monitoring
.......................................................................................................................................................................................114Restoring Monitoring
.......................................................................................................................................................................................114Reinitializing the KM
.......................................................................................................................................................................................116Triggering a KM Discovery
.....................................................................................................................................................................................116Thresholds, Alerts and Notifications
.......................................................................................................................................................................................117Threshold Mechanism Selection
.......................................................................................................................................................................................118Alert Actions
.......................................................................................................................................................................................119Alert Actions Macros
.......................................................................................................................................................................................120Edit Alert Actions
......................................................................................................................................................................121Trigger a PATROL Event
......................................................................................................................................................................123Annotate the Parameter’s Graph
......................................................................................................................................................................124Execute an OS Command
......................................................................................................................................................................125Execute a PSL Command
......................................................................................................................................................................126Send a Pop-up to the PATROL Consoles

6
IBM
SV
C K
M f
or
PA
TRO
L V
ersi
on 1
.2.0
1
......................................................................................................................................................................127Write a Line to a LOG File
......................................................................................................................................................................128Send a Basic SNMP Trap
......................................................................................................................................................................129Send a custom SNMP Trap (advanced)
......................................................................................................................................................................130Send an email
.....................................................................................................................................................................................133Classes and Parameters
.......................................................................................................................................................................................134SEN_SVC_MAIN
.......................................................................................................................................................................................137SEN_SVC_SVC
.......................................................................................................................................................................................140SEN_SVC_NODE_CONT
.......................................................................................................................................................................................141SEN_SVC_NODE
.......................................................................................................................................................................................144SEN_SVC_PORT_CONT
.......................................................................................................................................................................................145SEN_SVC_ISCSIPORT
.......................................................................................................................................................................................148SEN_SVC_FCPORT
.......................................................................................................................................................................................152SEN_SVC_POOL_CONT
.......................................................................................................................................................................................153SEN_SVC_POOL
.......................................................................................................................................................................................155SEN_SVC_MDISK_CONT
.......................................................................................................................................................................................156SEN_SVC_MDISK
.......................................................................................................................................................................................159SEN_SVC_STORAGESYSTEM_CONT
.......................................................................................................................................................................................160SEN_SVC_STORAGESYSTEM
.......................................................................................................................................................................................162SEN_SVC_VOLUME_CONT
.......................................................................................................................................................................................163SEN_SVC_VOLUME
.......................................................................................................................................................................................166SEN_SVC_VOLUMEMIRROR
.....................................................................................................................................................................................168Managing Baselines and Key Performance Indicators
.....................................................................................................................................................................................170Configuration Variables

Release Notes for v1.2.01

8
IBM
SV
C K
M f
or
PA
TRO
L V
ersi
on 1
.2.0
1
Changes and ImprovementsAlert Actions:
Different types of PATROL events can now be triggered.
Event messages have been improved to provide more meaningful information.
Fixed IssuesIBM SVC KM for PATROL reported an erroneous status on storage systems.
IBM SVC KM for PATROL could not be loaded when using a version of the PATROL Agentlower than v.9.5. This issue is now fixed.
A problem related to the monitoring of Nodes created an abnormal memory usage.

9
IBM
SV
C K
M f
or
PA
TRO
L V
ersi
on 1
.2.0
1

Overview

11
IBM
SV
C K
M f
or
PA
TRO
L V
ersi
on 1
.2.0
1
IBM SVC KM for PATROL monitors all your IBM storage assets within a centralized managementconsole. All the information concerning disk arrays, storage pools, controllers, storage volumes,and ports are directly displayed in your BMC Framework. By monitoring all your IBM storagedevices within a centralized management console, you can respond quickly to performanceproblems, easily determine capacity requirements, and effectively plan for network expansions.
IBM SVC KM for PATROL works in conjunction with Hardware Sentry KM for PATROL. HardwareSentry KM discovers and monitors all the hardware aspects of the IBM disk array: physical disks,temperature sensors,power supplies, LEDs, batteries, enclosure model, etc. IBM SVC KM forPATROL discovers and monitors all the software aspects of the array: overall capacity, spare disks,data traffic, oversubscription, etc.
Product at a GlanceIBM SVC KM for PATROL enables you to monitor their IBM environment from the PATROL consoleavoiding the need to use a separate monitoring solution. The KM collects and brings criticalperformance data and useful metrics into your BMC Framework.
PATROL Console - IBM SVC KM for PATROL

12Supported Platforms
IBM
SV
C K
M f
or
PA
TRO
L V
ersi
on 1
.2.0
1
Supported PlatformsIBM SVC KM for PATROL supports the following versions of the IBM SVC operating system (EOS):
v4.3.x
v5.1.x
v6.1.x
as well as IBM Storwize V7000 systems.

Preparing for Installation

14
IBM
SV
C K
M f
or
PA
TRO
L V
ersi
on 1
.2.0
1
This chapter provides information about the tasks that must be performed before you startinstalling IBM SVC KM for PATROL. Make sure to carefully read the following sectionsrequirements:
Review the Installation and Configuration Requirements
Get the BMC Software Installation Utility
Download the Installation Packages
Extract the Setup Files.
PrerequisitesIntegrated as a native module for BMC ProactiveNet Performance Management, IBM SVC KM forPATROL is designed to monitor the health and performance of your IBM SVC storageenvironment.
PATROL
Prior to install IBM SVC KM for PATROL, make sure that the following elements are installed andproperly configured:
PATROL Agent, version 3.8 or higher (see BMC PATROL documentation)
PATROL Console (see BMC PATROL documentation)
It is strongly recommended to install the PATROL Agent in a machine located close to the IBM SANController and to have good network performance.
JAVA
IBM SVC KM for PATROL requires Java 1.5 or greater to be installed to connect to an IBM SVCcontroller. You will need to install a Java Runtime Environment (JRE) on the same system thatruns the PATROL Agent and the IBM SVC KM. A Java Runtime Environment package is providedwith IBM SVC KM for PATROL.
Apache JRE is not supported.
The Java Settings wizard lets you define the path of the Java environment to be used by the KM.
Nodes Identification Requirements
Monitoring a SAN Volume Controller requires the device to be identified either by its name or itsIP address. This information is needed when you add an IBM SVC System to the PATROL

15 Prerequisites
IBM
SV
C K
M f
or
PA
TRO
L V
ersi
on 1
.2.0
1
monitored environment.
User Authentication Configuration Requirements
Users must provide a Secure Shell (SSH) key. Users are authenticated through the authenticationmethods that are located on the SAN Volume Controller system. To access the command-lineinterface (CLI) through SSH, a valid SSH key file is necessary. Refer to IBM SVC documentation fordetailed information.
The SSH key file format must be OpenSSH.
Generating an SSH key using PuTTY
1. Click Start >All Programs > PUTTY > PuTTYgen to start the PuTTY Key Generator.
Generating a SSH Key pair using PuTTY

16Prerequisites
IBM
SV
C K
M f
or
PA
TRO
L V
ersi
on 1
.2.0
1
2. Click SSH-2 RSA as the type of key to be generated and click Generate
Generating a random number

17 Prerequisites
IBM
SV
C K
M f
or
PA
TRO
L V
ersi
on 1
.2.0
1
3. Move the cursor around the blank area of the Key section to generate a random number.
SSH Key Credentials

18Prerequisites
IBM
SV
C K
M f
or
PA
TRO
L V
ersi
on 1
.2.0
1
4. Enter and confirm the Key passphrase
Generating Private Key
5. Click Save private key
6. Enter the name of the key and click Save.
7. Convert your key into OpenSSH:
Select Conversions > Export OpenSSH key
Enter the name of your key and click Save.
8. Close the PuTTY Key Generator.
Once generated, store this SSH key on the system where the PATROL Agent is running. You willhave to indicate the path to the SSH Key while adding an IBM SVC System to monitor.
Starting Statistics Collections
The collection of cluster statistics must be started to get performance information in the PATROLConsole.
To start the collection of cluster statistics:

19 Prerequisites
IBM
SV
C K
M f
or
PA
TRO
L V
ersi
on 1
.2.0
1
1. Log in to IBM System SAN Volume Controller interface
2. Click Manage Clusters > Start Statistics Collection in the portfolio.
3. Type the length of the interval to collect statistics.
4. Click OK.
You can also use the startstats command: svctask startstats -interval <time_in_minute>
Getting the BMC Software InstallationUtilityIn order to install IBM SVC KM for PATROL, you need the latest version of the BMC SoftwareInstallation Utility. It can be downloaded from the BMC Software EPD (electronic productdownload) from: http://webapps.bmc.com/signon/content/logon.jsp on the BMC SoftwareWebsite.
Choose the appropriate package depending on the platform you plan to install IBM SVC KM forPATROL on:
For UNIX/Linux systems: ins_ALL_<version>.tar
For Windows systems: ins_WINDOWS_<version>.zip
The packages are valid for all the PATROL components: Agent, Console, Console Server, etc.
Place the Installation Utility package in the same folder as the IBM SVC KM for PATROL packages.
PackagesIBM SVC KM for PATROL Packages
The IBM SVC KM for PATROL packages are available on the Sentry Software Web site and on theBMC Software EPD Web site.
There are two packages, each of which can be used to install the KM on every PATROL component(Agent, Console, etc.) according to the platform you are using.

20Packages
IBM
SV
C K
M f
or
PA
TRO
L V
ersi
on 1
.2.0
1
Downloading from Sentry Software Web site
For Windows systems: sensvc_WINDOWS_<version>.zip
For UNIX and Linux systems: sensvc_UNIX_<version>.tar
Java Runtime Environment Package
Java Runtime Environment version 1.5.00 or higher is required in some cases for the KM tooperate properly.A package with a suitable Java Runtime Environment, designed for use with the BMC SoftwareInstallation Utility, is made available to download on the Sentry Software Web site.
The IBM SVC KM for PATROL packages are designed for use with the BMC Software Installation Utility(formerly known as Thorium). They need to be merged with the latest available version of the BMCSoftware Installation Utility. Please see instructions.
Extracting the Setup FilesLike most Knowledge Modules for PATROL, you need to install IBM SVC KM for PATROL on thefollowing components of your PATROL architecture:
Every managed system with a PATROL Agent
Every PATROL Console (Classic) that will show IBM SVC performance-related information andalerts
The Console Server
PATROL Central – Web Edition
On Windows
The packages for Windows are to be extracted in the consecutive order:
1. First, unzip the BMC Installation Utility: ins_Windows_<version>.zip
2. Next, unzip the IBM SVC KM for PATROL package in the same folder: sensvc_WINDOWS_<version>.zip
3. Then, unzip the senjre_<version>_WINDOWS.zip package if you need to install the latestJava Runtime Environment program
The content of the packages merges into a subfolder named bmc_products.
Apache JRE is not supported.

21 Extracting the Setup Files
IBM
SV
C K
M f
or
PA
TRO
L V
ersi
on 1
.2.0
1
Windows may ask for your conf irmation to overwrite f iles and folders. This is normal behavior and you canaccept all overwrite conf irmation requests.
On UNIX/Linux
The packages for UNIX/Linux are to be extracted with the tar utility:
1. First, double-click the BMC Installation Utility: tar xvf ins_ALL_<version>.tar
2. Next, double-click the IBM SVC KM for PATROL package in the same folder: sensvc_UNIX_<version>.tar if downloaded from the Sentry Software Web site.
The files are extracted into a sub-directory named bmc_products.

Installing the KM

23
IBM
SV
C K
M f
or
PA
TRO
L V
ersi
on 1
.2.0
1
Introduction
This chapter describes the installation procedure for IBM SVC KM for PATROL on any PATROLcomponent (Agents, Consoles, Console Server, etc.). As the setup is based on the BMC SoftwareInstallation Utility, this procedure applies to all operating systems supported by IBM SVC KM forPATROL. Although not covered by this section, the installation through the Distribution Server isfully supported. Please refer to the Distribution Server documentation for a detailed descriptionof the deployment procedure.
Installing IBM SVC KM for PATROLInstalling IBM SVC KM for PATROL is an automated process managed by a wizard. The wizard goesthrough the necessary steps to install IBM SVC KM for PATROL and all files associated with it. Youare simply prompt for the product's folder location and the product/components to install.
Browse to the bmc_products folder where the files have been extracted (both IBM SVC KM forPATROL and the Common Installer).
On Windows: Launch the setup.exe program
On UNIX: Launch the setup.sh script
To install IBM SVC KM for PATROL1. Allow the perl.exe program to listen on this port: Click Allow access.

24Installing IBM SVC KM for PATROL
IBM
SV
C K
M f
or
PA
TRO
L V
ersi
on 1
.2.0
1
Installation Wizard - Step 1: Windows Security Alert
2. The welcome screen of the installer appears. Click Next to continue.
Installation Wizard - Step 2: Welcome

25 Installing IBM SVC KM for PATROL
IBM
SV
C K
M f
or
PA
TRO
L V
ersi
on 1
.2.0
1
3. Read the license agreement, click the Accept option and then click Next to continue.
Installation Wizard - Step 3: Reviewing License Agreement

26Installing IBM SVC KM for PATROL
IBM
SV
C K
M f
or
PA
TRO
L V
ersi
on 1
.2.0
1
4. Select Install products on this computer now and click Next to continue.
Installation Wizard - Step 4: Selecting Installation Options

27 Installing IBM SVC KM for PATROL
IBM
SV
C K
M f
or
PA
TRO
L V
ersi
on 1
.2.0
1
5. Specify the BMC Software products folder. See the BMC Software documentation for moreinformation about the BMC Software products folder. Click Next to continue.
Installation Wizard - Step 5: Selecting the Installation Directory

28Installing IBM SVC KM for PATROL
IBM
SV
C K
M f
or
PA
TRO
L V
ersi
on 1
.2.0
1
6. Select Default. Installing IBM SVC KM for PATROL does not require any customization. ClickNext to continue.
Installation Wizard - Step 6: Selecting an Installation Type
7. Select one or several of the following options:
Managed System to install IBM SVC KM for PATROL on a PATROL Agent.
Console Systems to install IBM SVC KM for PATROL on a PATROL Classic Console.
Common services to install IBM SVC KM for PATROL on the Console Server or on PATROLCentral – Web Edition.
Click Next to continue.

29 Installing IBM SVC KM for PATROL
IBM
SV
C K
M f
or
PA
TRO
L V
ersi
on 1
.2.0
1
Installation Wizard - Step 7: Selecting Roles
Select as many options as required.

30Installing IBM SVC KM for PATROL
IBM
SV
C K
M f
or
PA
TRO
L V
ersi
on 1
.2.0
1
8. Check the IBM SVC KM for PATROL box to install the KM (it should be selected by default).Select the Java Runtime Environment program if you want to install it along with the KM (thisoption is only provided when you have previously downloaded the package).Click Next to continue.
Installation Wizard - Step 8: Selecting Products and Components

31 Installing IBM SVC KM for PATROL
IBM
SV
C K
M f
or
PA
TRO
L V
ersi
on 1
.2.0
1
9. Review the installation parameters and click Start Install to launch the installation procedure.
Installation Wizard - Step 9: Reviewing Installation Options

32Installing IBM SVC KM for PATROL
IBM
SV
C K
M f
or
PA
TRO
L V
ersi
on 1
.2.0
1
10. The setup program displays the actions performed and indicates the percentage ofcompletion.Once the installation complete, click Next to view the installation results.
Installation Wizard - Step 10: Installation Status

33 Installing IBM SVC KM for PATROL
IBM
SV
C K
M f
or
PA
TRO
L V
ersi
on 1
.2.0
1
11. The wizard displays the installation results.Click View Log to display a detailed log of the installation procedure. Click Next and thenFinish to exit the setup program.
Installation Wizard - Step 11: Installation Results
12. Click the Finish button to complete and close the installation wizard.

34Installing IBM SVC KM for PATROL
IBM
SV
C K
M f
or
PA
TRO
L V
ersi
on 1
.2.0
1
Installation Wizard - Step 12: Completing and closing the Installation Wizard
A Help button is available at each step of the procedure. Click to display the installation online help. TheExit button allows you to stop the installation procedure.
Uninstalling IBM SVC KM for PATROLUninstalling IBM SVC KM for PATROL is an automated process managed by a wizard. The wizardgoes through the necessary steps to remove IBM SVC KM for PATROL and all files associated withit. You are simply prompt for the product's folder location and the product/components touninstall.
To uninstall IBM SVC KM for PATROL1. Locate the Uninstall folder under the BMC products directory (typically under C:\Program
Files\BMC Software, or /opt/bmc):
On Windows systems, launch uninstall.exe
On UNIX, launch uninstall.sh

35 Uninstalling IBM SVC KM for PATROL
IBM
SV
C K
M f
or
PA
TRO
L V
ersi
on 1
.2.0
1
Un-install Wizard — Welcome Step

36Uninstalling IBM SVC KM for PATROL
IBM
SV
C K
M f
or
PA
TRO
L V
ersi
on 1
.2.0
1
2. Specify the BMC Software products folder. See the BMC Software documentation for moreinformation about the BMC Software products folder.
Un-install Wizard — Specifying folder

37 Uninstalling IBM SVC KM for PATROL
IBM
SV
C K
M f
or
PA
TRO
L V
ersi
on 1
.2.0
1
3. To uninstall the KM, select IBM SVC KM for PATROL and click Next.
Un-install Wizard — Selecting Products and Components Directory

38Uninstalling IBM SVC KM for PATROL
IBM
SV
C K
M f
or
PA
TRO
L V
ersi
on 1
.2.0
1
4. Click Start Uninstall.
Un-install Wizard — Reviewing Selected Products & components and start uninstalling

39 Uninstalling IBM SVC KM for PATROL
IBM
SV
C K
M f
or
PA
TRO
L V
ersi
on 1
.2.0
1
5. A page displays the list of products/components processed and the percentage ofcompletion. Click Next to continue.
Un-install Wizard — Status

40Uninstalling IBM SVC KM for PATROL
IBM
SV
C K
M f
or
PA
TRO
L V
ersi
on 1
.2.0
1
6. A page displaying SUCCESS indicates that IBM SVC KM for PATROL is now uninstalled.
Un-install Wizard — Uninstall Results

41 Uninstalling IBM SVC KM for PATROL
IBM
SV
C K
M f
or
PA
TRO
L V
ersi
on 1
.2.0
1

Integrating the KM

43
IBM
SV
C K
M f
or
PA
TRO
L V
ersi
on 1
.2.0
1
Introduction
This section provides detailed information about the integration of IBM SVC KM for PATROL withBMC ProactiveNet Performance Management.
Integrating with BMC Portal
Integrating with BMC ProactiveNet Performance Management
Integrating with BMC PortalAn integration component for BMC Portal is released along with the Knowledge Module (KM) inthe form of a PAR file: SentrySoftware-PM-PATROL-SENSVC-solution-<version>.par. It enablesvisualization of parameter data of all objects monitored by the KM, in the BMC Portalenvironment.
This integration component is valid on BMC Portal v2.5 upwards.
To integrate IBM SVC KM for PATROL with BMC Portal:
1. Install the KM on top of a PATROL Agent as detailed in the Installation Guide. A PATROLConsole will be required to configure the KM
2. In the PATROL Console, make sure the KM properly discovered the IBM systems and iscollecting data
3. Upload the PAR file in BMC Portal:
Place the SentrySoftware-PM-PATROL-SENSVC-solution-<version>.par file in a knownlocation on your file system.
Login to BMC Portal with the superadmin credentials.
Click on Portal, then under Tasks click Performance Managers.
Click Upload and then click Browse to open a file selection dialog box.
Select BPM-Express-for-IBM-SVC-<version>.par and click Upload.
4. Create a new managed element:
Login to BMC Portal with administrator credentials
Click the Configure tab > Elements > Add
Select Infrastructure Element and click Next
Select an RSM to collect data about the infrastructure element and click Next
Enter the name of the machine on which the PATROL Agent is running, the Host Name andclick Next
Select the group to which your PM will belong and click Next
Select the PATROL category, the Application Classes to add and click Next
Set the Properties and Credentials that the RSM must have to access the specifiedelements and click Next. The list of thresholds is displayed. You can update these settingswithout impacting the values set in PATROL.

44Integrating with BMC Portal
IBM
SV
C K
M f
or
PA
TRO
L V
ersi
on 1
.2.0
1
5. Click Finish.
Thresholds are set in the PATROL console. To get the last conf igurations made, click the Refresh PATROLIntegration button available in the Elements page.
Integrating with BMC ProactiveNetPerformance ManagementDepending on the version of BMC ProactiveNet Performance Management used, integrationsteps may need to be performed.
BMC ProactiveNet Performance Management 8.5 or 8.6To integrate IBM SVC KM for PATROL into BMC ProactiveNet Performance Management 8.5 and8.6, you need create a specific adapter. For more information, please refer to Integrating theSentry Software's KMs into BMC ProactiveNet Performance Management (BPPM).
BMC ProactiveNet Performance Management 9.x
No specific integration steps need to be performed.

Monitoring your StorageEnvironment

46
IBM
SV
C K
M f
or
PA
TRO
L V
ersi
on 1
.2.0
1
Introduction
IBM SVC KM for PATROL monitors all of the performance metrics and traffic statistics of your IBMSAN Volume Controller. It continuously monitors the activity of each cluster and is also able tobuild reports on past utilization statistics.
Configuring the KM
Monitoring with the KM
Reporting
Administrative Tasks
Thresholds, Alerts and Notifications
Configuring the KMTo automatically detect all the various IBM SVC storage features and components and displaythem in the PATROL interface, IBM SVC KM for PATROL accesses the IBM SVC Cluster through SSH.This operation is made possible by storing a valid SSH key on the system where the PATROLAgent is running
Loading the KM on your ConsoleIn order to monitor IBM SVC within your PATROL Console, the corresponding IBM SVC KM forPATROL must be loaded on the appropriate managed system. Loading a Knowledge Module inPATROL Central Operator both loads the Knowledge Module on the managed system and addsthe name of the Knowledge Module to your management profile.
Loading IBM SVC KM for PATROL on PATROL Classic
1. In the Console menu bar, click File > Load KM.
2. In the Files of Type list, select KM Files.
3. Select IBM SVC KM for PATROL.
4. Click Open.
Loading IBM SVC KM for PATROL on PATROL Central

47 Configuring the KM
IBM
SV
C K
M f
or
PA
TRO
L V
ersi
on 1
.2.0
1
1. In the Common Tasks tab of the PATROL Central Operator Taskpad, click the Load KnowledgeModules icon.
2. To start the wizard, click Next.
3. Select the check boxes for the managed systems that you want to load IBM SVC KM forPATROL on. Click Next.
4. In the Knowledge Module Lists, select the check box SEN_SVC.kml
5. Click Finish.
Before you can load a Knowledge Module, it must be installed on a managed system. Loading aKnowledge Module loads it on the managed system, if it was not already loaded, and adds it to yourmanagement profile.
Configuring Java SettingsThe Java Settings wizard enables you to define which Java instance is to be used by IBM SVC KMfor PATROL for managing the email alert action only when using a version lower than 3.6.0.11 ofPATROL agent.
You can either use the automatic detection, select a pre-detected java path or enter manuallythe path leading to the Java executable directory to be used.
IBM SVC KM for PATROL requires Java 1.5 or greater to be installed to connect to an IBM SVC controller. Youwill need to install a Java Runtime Environment (JRE) on the same system that runs the PATROL Agent andthe IBM SVC KM. The Java Settings wizard lets you def ine the path of the Java environment to be used bythe KM.
To access the Java Settings wizard, right-click the main IBM SVC KM icon > KM commands > KMSettings > Java Settings.

48Configuring the KM
IBM
SV
C K
M f
or
PA
TRO
L V
ersi
on 1
.2.0
1
Java Settings Wizard - Method Selection
Select the Java executable detection method:
Automatic: if you wish IBM SVC KM for PATROL to detect the Java executable directory byitself upon each discovery.
User Selection: if you wish to select a Java executable directory within a list of pre-detectedexecutables.
Manual: if you wish to manually enter the Java executable directory path.
Click Next to continue.
Automatic Detection
If you have selected the automatic detection at the previous step of the wizard, IBM SVC KM forPATROL displays the path of the Java executable directory that will be used when performingcommands requiring Java features.

49 Configuring the KM
IBM
SV
C K
M f
or
PA
TRO
L V
ersi
on 1
.2.0
1
Java Settings Wizard — Automatic Detection
Click Finish to save your settings.
User Selection
If you have selected the User Selection option at the previous step of the wizard, IBM SVC KM forPATROL displays a list of all the Java executable directories found on your machine.

50Configuring the KM
IBM
SV
C K
M f
or
PA
TRO
L V
ersi
on 1
.2.0
1
Java Settings Wizard — User Selection
Select the Java executable directory you wish IBM SVC KM for PATROL to use when performingcommands requiring Java features and click Finish to save your settings.
Manual
If you have selected the Manual option at the previous step of the wizard, IBM SVC KM forPATROL let you enter the path to the Java executable directory you wish the application to usewhen performing commands requiring Java features.

51 Configuring the KM
IBM
SV
C K
M f
or
PA
TRO
L V
ersi
on 1
.2.0
1
Java Settings Wizard — Manual Settings
Click Finish to save your settings.
Once you have modified a java setting, you must restart the PATROL in order to make yourchanges.
Java Settings Wizard — Restart the PATROL Agent
Click OK and restart the PATROL Agent.

52Configuring the KM
IBM
SV
C K
M f
or
PA
TRO
L V
ersi
on 1
.2.0
1
Configuring the Monitoring of an IBM SVCSystemTo add an IBM SVC System to your monitored environment:
1. Right-click the KM main icon > KM Commands >Add a Connection to an IBM SVC System...
2. Select the type of system you wish to monitor, SAN Volume Controller or Storwize V7000.
Selecting the type of system to monitor

53 Configuring the KM
IBM
SV
C K
M f
or
PA
TRO
L V
ersi
on 1
.2.0
1
Configuring the monitoring of a SAN Volume ControllerA. Enter the Name for the cluster as it will appear in the PATROL Console.
SAN Volume Controller Display Name
B. Click Next to continue.
IBM SVC SAN Volume Controller Credentials

54Configuring the KM
IBM
SV
C K
M f
or
PA
TRO
L V
ersi
on 1
.2.0
1
C. Enter the Username of a valid account to connect to the cluster
D. Indicate the path to the OpenSSH Private Key File. The SSH Key file must be in OpenSSHformat and be stored on the system where the PATROL Agent is running. Open SSH PrivateKey File is mandatory to connect to a SAN Volume Controller.
E. Enter the Key Passphrase if your SSH key was generated with a passphrase, if any.
F. Click Finish to save your settings.
Configuring the monitoring of a Storwize V7000
A. Enter the Name for the cluster as it will appear in the PATROL Console.
Storwize V7000 Display Name
B. Select the Authentication Type you wish to use to establish the connection with the cluster.

55 Configuring the KM
IBM
SV
C K
M f
or
PA
TRO
L V
ersi
on 1
.2.0
1
Authentication Type Selection
C. Click Next to continue.
D. According to the authentication type you have selected, enter a Username and Password, or
Authentication with Username and Password
enter the following information:
the admin Username may be required to connect to the cluster
the path to the OpenSSH Private Key File. An Open SSH Private Key File might be required

56Configuring the KM
IBM
SV
C K
M f
or
PA
TRO
L V
ersi
on 1
.2.0
1
to connect to a Storwize v7000 system type. The SSH Key file must be in OpenSSH formatand be stored on the system where the PATROL Agent is running.
the Key Passphrase if your SSH key was generated with a passphrase, if any.
Authentication with Username, OpenSSH Private Key File and/or Passphrase
E. Click Finish to save your settings.
Some information may not be displayed immediately in the PATROL Console as the f irst synchronizationcan sometimes take several minutes.

57 Configuring the KM
IBM
SV
C K
M f
or
PA
TRO
L V
ersi
on 1
.2.0
1
Editing Connection SettingsTo edit connection settings:
1. Right-click the IBM SVC System icon > KM Commands >Edit Connection Settings ... 2. Modify the IBM SVC System Identification settings:
Editing Connection Settings

58Configuring the KM
IBM
SV
C K
M f
or
PA
TRO
L V
ersi
on 1
.2.0
1
3. Click Next
4. Modify the IBM SVC Cluster Credentials
Editing IBM SVC Cluster Credentials
5. Click Finish.
Monitoring with the KMMonitoring you IBM SAN Volume Controller with IBM SVC KM for PATROL is very simple. Oncethe KM is properly installed, as per the instructions given in the Installation Guide, IBM SVC KMfor PATROL automatically detects all the various IBM SVC storage features and components anddisplays them in the PATROL interface.This section provides detailed information on how to monitor your IBM SVC environment, how toperform usual administrative tasks, and how to manage thresholds and alert actions with IBM
SVC KM for PATROL.�
For details on which performance metrics and traf f ic statistics are detected on each system, please see theReference Guide.

59 Monitoring with the KM
IBM
SV
C K
M f
or
PA
TRO
L V
ersi
on 1
.2.0
1
Detecting Oversubscription Situation (ThinProvisioning)We call an oversubscription situation when:
1. The storage pool is configured for thin provisioning (“thin storage pool”)
2. The storage pool is oversubscribed, i.e. the total disk space visible to the hosts (subscribers)is greater than its actual capacity (this situation is normal for a thin pool since it is its verypurpose)
3. The storage pool actual consumed capacity is nearing 100%
Such situation is highly critical because the inability to allocate additional space to a LUN whenrequested by the subscriber host will lead to catastrophic data loss and corruption.
By default, the KM sets a warning threshold at 75% on the ConsumedCapacityPercentageparameter of the storage pool instances only if these conditions are met: the storage pool is“thin” and oversubscribed. When such a warning is issued by the KM, it is highly recommendedthat the SAN administrators add capacity to the storage pool as soon as possible.
Detecting High Processor UtilizationThe ProcessorUtilization parameter of the SEN_SVC_NODE application class can be used to detecthigh processor utilization and thus prevent node overloading and unpredictable performancedegradations.
Because optimum performance will be achieved when the processor utilization and the transferrate are similar for both nodes, it is also wise to monitor the transfer rate of each node by usingthe ReceivedByteRate and SentByteRate parameters of the SEN_SVC_NODE application class. Aproper load balancing will indeed prevent a node from being a bottleneck while the other one isalmost idle. If the collected values are really different for both nodes, administrators shouldsearch for the LUNs preferred node and make sure the load balancing is adequate.
If performance degradations are observed, administrators will have to identify the node that hasbecome a bottleneck.

60Monitoring with the KM
IBM
SV
C K
M f
or
PA
TRO
L V
ersi
on 1
.2.0
1
Verifying the ProcessorUtilization Parameter for a Node
1. In the console, double-click the ProcessorUtilization parameter of a node
2. A graph is automatically displayed in the console's graph pane
Viewing the Node's Processor Utilization as a graph
This parameter should not exceed 50% to prevent one node to become overloaded if the otherone fails. By default, a warning and an alert are triggered when the parameter respectivelyreaches 90% and 99%.
Verifying the Transfer Rate of a Node
1. In the console, double-click the ReceivedByteRate parameter of a node
2. Drag and drop the SentByteRate parameter in the graph window

61 Monitoring with the KM
IBM
SV
C K
M f
or
PA
TRO
L V
ersi
on 1
.2.0
1
Comparing Received and Sent Byte Rate
If this value and the overall processor utilization are high, you should then consider:
either adding more nodes to the cluster and move some workload onto the new nodes
or moving volumes to another I/O group.
On the contrary, if this value stays low – while the overall processor utilization is high – itindicates that the node is performing "non productive" tasks. It then may become critical todetermine the source of activity that generates the high processor utilization.
Diagnosing SAN/Network ContentionThe IBM SAN Volume Controller can be considered as a storage proxy. As such, it concentratesthe storage activity from many hosts and many back-end systems. Therefore, its network andfiber connectivity and performance needs to be optimal at all times. The IBM SVC KM monitorsboth the iSCSI and FC ports for the connectivity and the traffic. For the fiber ports, additionalinformation is provided to identify the origin and/or destination of the traffic (internal, othercluster, hosts or storage systems). This allows SAN administrators to precisely understand thecause of any SAN or network contention.
To diagnose SAN / Network Contention:
1. First generate a total activity report on each port:
In the PATROL Console, right-click the Port icon > KM Commands > Port Activity...

62Monitoring with the KM
IBM
SV
C K
M f
or
PA
TRO
L V
ersi
on 1
.2.0
1
Configuring the Ports Activity Report Settings
Build a report of total sent/received bytes for the period of your choice
Click Show Report
Ports Activity Report

63 Monitoring with the KM
IBM
SV
C K
M f
or
PA
TRO
L V
ersi
on 1
.2.0
1
2. If the activity is high, then look at the most specific parameters to identify where the trafficactually comes from and goes to:
Host Activity Report
3. If the activity is low, you can look at the following errors counters to identify the cause of theissue: BadCRC, InvalidTransmissionWords, LinkFailures, LossOfSynch, ProtocolErrors,LossOfSignal
4. Finally make sure the LinkSpeed actually matches with what is expected for the SANinfrastructure
Diagnosing Slow LUNsIf a system administrator complains that his servers are experiencing slow I/Os performance andthat it is caused by the SAN, you may want to verify the actual response time of the LUNs theserver is relying on.
The ReadResponseTime and WriteResponseTime parameters of the SEN_SVC_VOLUME classrepresent the average time it took to complete the read and write operations on the LUN duringthe collection interval. Typically, the average response time is below 10 milliseconds. You mayalso want to compare this value to the response time of the other LUNs to see whether oneserver is really getting worse I/O performance than another.
If the response time is low, you will need to check the amount of data that is written and read onthis LUN. The bad performance may simply be due to an abnormally large amount of data to

64Monitoring with the KM
IBM
SV
C K
M f
or
PA
TRO
L V
ersi
on 1
.2.0
1
process. Otherwise, the problem may lie between the IBM SVC and the server, in the fiber links.
Response time parameters, in general, can show sporadic high values. A high response time value does notequal to performance degradation until the problem lasts for a few consecutive collections. The defaultthresholds for the response time parameters trigger an alert only after a certain amount of time.
Finding the Bottleneck in an IBM SVCStorage virtualization adds great flexibility in the provisioning and management of storage butalso adds a lot of complexity when it comes to identifying and diagnosing a performanceproblem: are the nodes themselves the bottleneck, or the fiber ports or the back-end storagesystems?
The IBM SVC KM provides performance metrics for every layer of the SAN infrastructure based onthe IBM SVC. To easily find the reason for a degraded performance or perceived as degraded, werecommend you to verify in this order the performance of:
the nodes
the ports
the storage systems
the MDisks
Verifying the Performance of the Nodes1. First verify the Nodes' response time:
In the console, double-click the ReceivedResponseTime parameter
Drag and drop the SentResponsetime in the graph window
The average response time should be below 10 milliseconds.
Response time parameters, in general, can show sporadic high values. A high response time value does notequal to performance degradation until the problem lasts for a few consecutive collections. The defaultthresholds for the response time parameters trigger an alert only after a certain amount of time.

65 Monitoring with the KM
IBM
SV
C K
M f
or
PA
TRO
L V
ersi
on 1
.2.0
1
2. Right-click the Node main icon > KM Commands > Reporting > Nodes Activity...
Configuring the Nodes Activity Report Settings
Build a report of total sent/received bytes for the period of your choice
Click Show Report
Viewing the Nodes Activity Report

66Monitoring with the KM
IBM
SV
C K
M f
or
PA
TRO
L V
ersi
on 1
.2.0
1
3. Finally, double-click the ProcessorUtilization parameter to detect possible high processorutilization
Viewing the Node's Processor Utilization as a graph
Verifying the Activity on Ports1. Start looking at the total activity on each port:
In the PATROL Console, right-click the Port icon > KM Commands > Reporting > PortActivity...
Configuring Ports Activity Report Settings

67 Monitoring with the KM
IBM
SV
C K
M f
or
PA
TRO
L V
ersi
on 1
.2.0
1
Build a report of total sent/received bytes for the period of your choice
Click Show Report
Viewing Ports Activity Report
2. Then look at the most specific parameters to identify where the traffic actually comes fromand goes to:
Viewing a Host Activity Report

68Monitoring with the KM
IBM
SV
C K
M f
or
PA
TRO
L V
ersi
on 1
.2.0
1
3. If the activity is low, you can look at the following errors counters: BadCRC,InvalidTransmissionWords, LinkFailures, LossOfSynch, ProtocolErrors, LossOfSignal toidentify the cause of the issue
4. Look at the LinkSpeed parameter and make sure it matches with what is expected for theSAN infrastructure
Verifying the Performance of the Storage Systems1. First verify the Storage Systems' response time:
In the console, double-click the ReceivedResponseTime parameter
Drag and drop the SentResponsetime parameter in the graph window
The average response time should be below 10 milliseconds.
Response time parameters, in general, can show sporadic high values. A high response time value does notequal to performance degradation until the problem lasts for a few consecutive collections. The defaultthresholds for the response time parameters trigger an alert only after a certain amount of time.
2. Right-click the Storage Systems main icon > KM Commands > Reporting > Storage SystemsActivity...
Generating a Storage System Activity Report
Build a report of total read/write bytes for the period of your choice
Click Show Report

69 Monitoring with the KM
IBM
SV
C K
M f
or
PA
TRO
L V
ersi
on 1
.2.0
1
Verifying the Activity on MDisks1. Right-click the Storage Systems main icon > KM Commands > Reporting > MDisks Activity...
Generating an MDisk Activity Report
2. Build a report of total read/write bytes for the period of your choice
3. Click Show Report.
Viewing the MDisk Activity Report

70Monitoring with the KM
IBM
SV
C K
M f
or
PA
TRO
L V
ersi
on 1
.2.0
1
Identifying the Busiest LUNsTo identify the LUNs that generate the most traffic, use the ReadByteRate and WriteByteRateparameters of the Volume class. IBM SVC KM for PATROL offers you two methods to visuallyrepresent a LUN activity.
Create a multi-parameter graph with the ReadByteRate andWriteByteRate of the LUN objects you are suspecting1. In the console, double-click the ReadByteRate parameter of the LUN you are interested in. A
graph is automatically displayed in the graph pane.
2. Then drag and drop the WriteByteRate in the graph window
Viewing the LUN's ReadByteRate and WriteByteRate parameters

71 Monitoring with the KM
IBM
SV
C K
M f
or
PA
TRO
L V
ersi
on 1
.2.0
1
Use the Volume Activity… Command1. Right-click the Volume icon > KM Commands > Reporting > Volumes Activity...
Generating a Volume Activity Report
Build a report of total read/write bytes for the period of your choice
Click Show Report
Viewing the Volume Activity Report
Once you have identified the most busy LUNs, check the infobox of the suspected LUNs to findtheir storage groups and the hosts that generate such activity.

72Monitoring with the KM
IBM
SV
C K
M f
or
PA
TRO
L V
ersi
on 1
.2.0
1
Identifying the Hosts that can Access a LUNIn most SAN configuration, each LUN belongs to a storage group whose host members are theonly ones authorized to access the LUN. This is called LUN masking. For each LUN, the solutiondisplays its WWN, the storage group to which it belongs to as well as the hosts member of thisgroup. In most cases, identifying the storage group of a LUN is sufficient to recognize the serverthat is using it.
To identify the hosts that can Access a LUN, click the IBM SVC icon > KM Commands > Reporting >LUNs Mapping Table...
LUNs Mapping Table
Identifying LUNs Preferred NodesThe preferred node is responsible for I/Os for the volumes and coordinates sending the I/Os tothe alternate node. Because hosts access volumes through the preferred nodes, those nodes canrapidly become overloaded. Identifying the LUNs preferred node will help you ensure theworkload is properly balanced between the nodes and explain some performance issues.
To identify LUNs preferred nodes, click the KM main icon > KM Commands > Reporting > LUNsPreferred Node Table...

73 Monitoring with the KM
IBM
SV
C K
M f
or
PA
TRO
L V
ersi
on 1
.2.0
1
LUNs Preferred Node Table
Identifying a Slow Back-end Storage SystemAs the IBM SVC System relies on other storage systems as back-end, it is important to make surethat the underlying storage infrastructure is responsive. One single slow back-end storagesystem can hamper the overall performance experienced by the host because the IBM SVCcluster virtualizes the storage from several systems as a single pool. The responsiveness of eachback-end storage system is constantly monitored by the IBM SVC KM with the ResponseTimeparameters of the SEN_SVC_STORAGESYSTEM and SEN_SVC_MDisk application classes.
To identify a slow back-end storage system:

74Monitoring with the KM
IBM
SV
C K
M f
or
PA
TRO
L V
ersi
on 1
.2.0
1
1. In the console, double-click the ReadResponseTime parameter of the storage system you areinterested in.
2. Then drag and drop the WriteResponsetime parameter in the graph window
Viewing the Storage System's Response Time
Response times are generally considered acceptable when less than 10ms. By default the KMtriggers a warning and an alarm when response time is respectively greater than 10ms and100ms.
Response time parameters, in general, can show sporadic high values. A high response time value does notequal to performance degradation until the problem lasts for a few consecutive collections. The defaultthresholds for the response time parameters trigger an alert only after a certain amount of time.
If the back-end storage system shows bad response time, it may be interesting to dig further toidentify which MDisk is the cause of the issue.
75 Monitoring with the KM
IBM
SV
C K
M f
or
PA
TRO
L V
ersi
on 1
.2.0
1
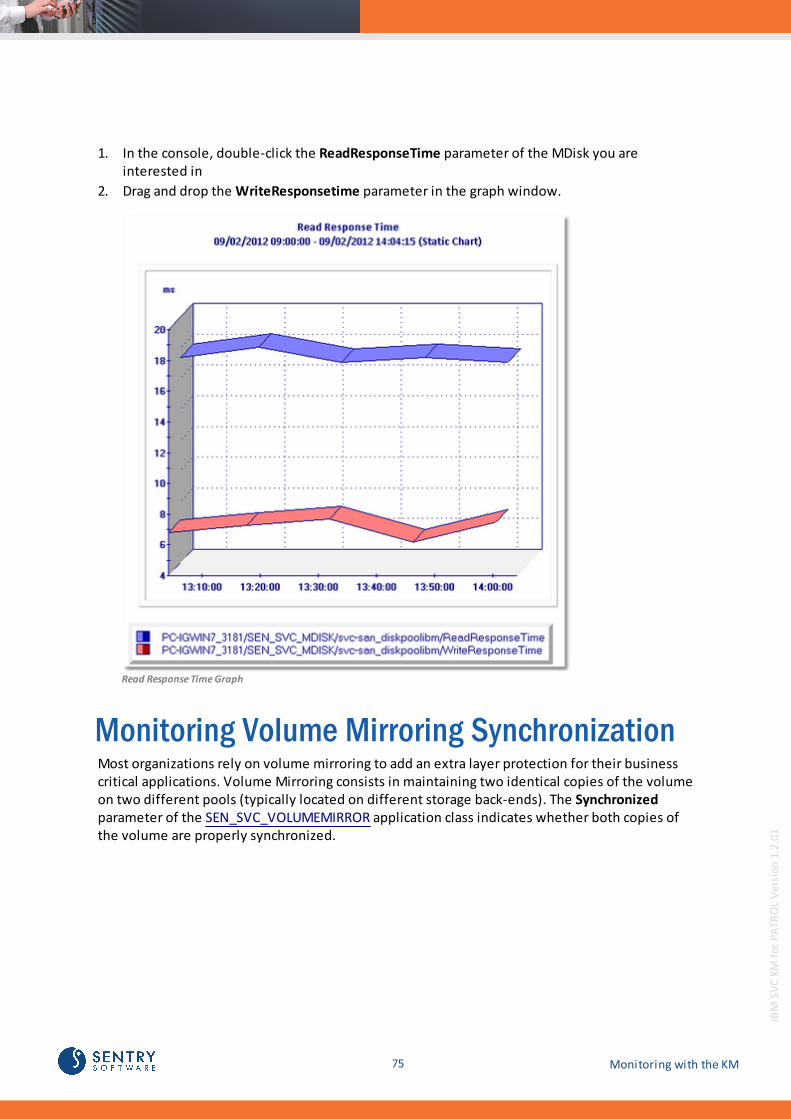
1. In the console, double-click the ReadResponseTime parameter of the MDisk you areinterested in
2. Drag and drop the WriteResponsetime parameter in the graph window.
Read Response Time Graph
Monitoring Volume Mirroring SynchronizationMost organizations rely on volume mirroring to add an extra layer protection for their businesscritical applications. Volume Mirroring consists in maintaining two identical copies of the volumeon two different pools (typically located on different storage back-ends). The Synchronizedparameter of the SEN_SVC_VOLUMEMIRROR application class indicates whether both copies ofthe volume are properly synchronized.

76Monitoring with the KM
IBM
SV
C K
M f
or
PA
TRO
L V
ersi
on 1
.2.0
1
Verifying the Volume Copy is synchronized1. In the main menu bar, click Action > New Query… to create a PATROL Query
PATROL Query - General Tab

77 Monitoring with the KM
IBM
SV
C K
M f
or
PA
TRO
L V
ersi
on 1
.2.0
1
2. Enter the Query name (example: VolumeMirroringSynchronization)
3. Enter the Query description (optional)
4. In the Query Result Filter section, select Show Selected Objects and check the Parametersbox
5. In the Additional Filtering, select the Enable Parameter level filtering option
6. Open the Parameter tab
PATROL Query - Parameter Tab
7. In the Pattern Matching section, select Like and type Synchronized
8. Click OK.
PATROL Query - Results

78Monitoring with the KM
IBM
SV
C K
M f
or
PA
TRO
L V
ersi
on 1
.2.0
1
A warning is also triggered when both copies are no longer synchronized.
Reclaiming Space of Unmapped LUNsOver time, as servers connected to a SAN get decommissioned, administrators find an increasingnumber of unmapped LUNs, or volumes that are no longer used by any server. These LUNs, whileunused, still occupy disk space. Being able to identify such unmapped LUNs and reclaim the diskspace uselessly consumed by these LUNs will help administrators avoid unnecessary upgradesand extensions of your storage systems.
To list the LUNs in a SAN Volume Controller that are not mapped to any server and therefore safeto remove, right-click the KM main icon > KM Commands > Reporting > LUNs Mapping Table... .
LUNs Mapping Table
Identifying Unused LUNs
When a server is decommissioned or reconfigured, its associated LUNs can stay mappedpreventing storage administrator from accurately identifying unused LUNs. Since the KMmonitors permanently the traffic on each LUN, it becomes easy to detect LUNs for which theactivity is null.

79 Monitoring with the KM
IBM
SV
C K
M f
or
PA
TRO
L V
ersi
on 1
.2.0
1
1. Create a PATROL Query in the PATROL Console to show the value of theTimeSinceLastActivity parameter of the SEN_SVC_VOLUME class; In the main menu bar, clickAction > New Query…
PATROL Query – General Tab

80Monitoring with the KM
IBM
SV
C K
M f
or
PA
TRO
L V
ersi
on 1
.2.0
1
2. Enter the Query name (example: Unused LUNs)
3. Enter the Query description (optional)
4. In the Query Results Filter section, select Show Selected Objects and check the Parametersbox
5. In the Additional Filtering, select the Application Class level filtering and the EnableParameter level filtering options
6. Open the Application Class tab
PATROL Query – Application Class Tab
7. In the Pattern Matching section, select Like and type SEN_SVC_VOLUME
8. Open the Parameter tab

81 Monitoring with the KM
IBM
SV
C K
M f
or
PA
TRO
L V
ersi
on 1
.2.0
1
PATROL Query – Parameter Tab
9. In the Pattern Matching section, select Like and type TimeSinceLastActivity
10. Click OK to display a list of the monitored LUNs and their respective number of days sincewhen the KM has not recorded any activity.
PATROL Query – Results

82Monitoring with the KM
IBM
SV
C K
M f
or
PA
TRO
L V
ersi
on 1
.2.0
1
The TimeSinceLastActivity parameter is evaluated from the date the KM was initially started.
Reporting Disk Space ConsumptionMaking sure that an IBM SVC System has enough remaining disk space available is critical forseveral reasons:
SAN administrators want to make sure to be able to provision disk space for new serverswhen requested, as quickly as possible.
The IBM SVC System itself may need additional disk space for specific features to workproperly, like automatic snapshots, mirroring, etc.
If thin provisioning is used, the remaining disk space becomes dramatically critical since theinability to allocate additional space to a LUN when requested by the subscriber host willlead to catastrophic data loss and corruption.
The disk space used is permanently monitored for each pool. The SubscribedCapacity parameterof the SEN_SVC_POOL class represents the amount of disk space that has been made available tothe subscriber hosts, or in other words, the amount of disk space that is seen by the serversconnected to the IBM SVC System.
The ConsumedCapacity parameter of the SEN_SVC_POOL class represents the actual space usagein the pool. For “thin” pools (when thin provisioning is enabled on the IBM SVC System), thisvalue is normally lower than the SubscribedCapacity, as it is the main purpose of thinprovisioning. For traditional pools, the ConsumedCapacity parameter has the same value as theSubscribedCapacity parameter, as the entirety of the subscribed disk space is fully allocated inthe storage pool.
The ConsumedCapacityPercentage parameter is the most critical one as a pool usage nearing100% means that SAN administrators will not be able to create new LUNs. By default, an alarm istriggered if the value of this parameter exceeds 75%.

83 Monitoring with the KM
IBM
SV
C K
M f
or
PA
TRO
L V
ersi
on 1
.2.0
1
Verifying the Available Disk space in Several Pools1. In the main menu bar, click Action > New Query… to create a PATROL Query
PATROL Query - General Tab

84Monitoring with the KM
IBM
SV
C K
M f
or
PA
TRO
L V
ersi
on 1
.2.0
1
2. Enter the Query name (example: DiskSpaceConsumption)
3. Enter the Query description (optional)
4. In the Query Result Filter section, select Show Selected Objects and check the Parametersbox
5. In the Additional Filtering section, select the Enable Application Class level filtering and theEnable Parameter level filtering options
6. Open the Application Class tab
7. In the Pattern Matching section, select Like and type SEN_SVC_POOL
PATROL Query - Application Class Tab
85 Monitoring with the KM
IBM
SV
C K
M f
or
PA
TRO
L V
ersi
on 1
.2.0
1
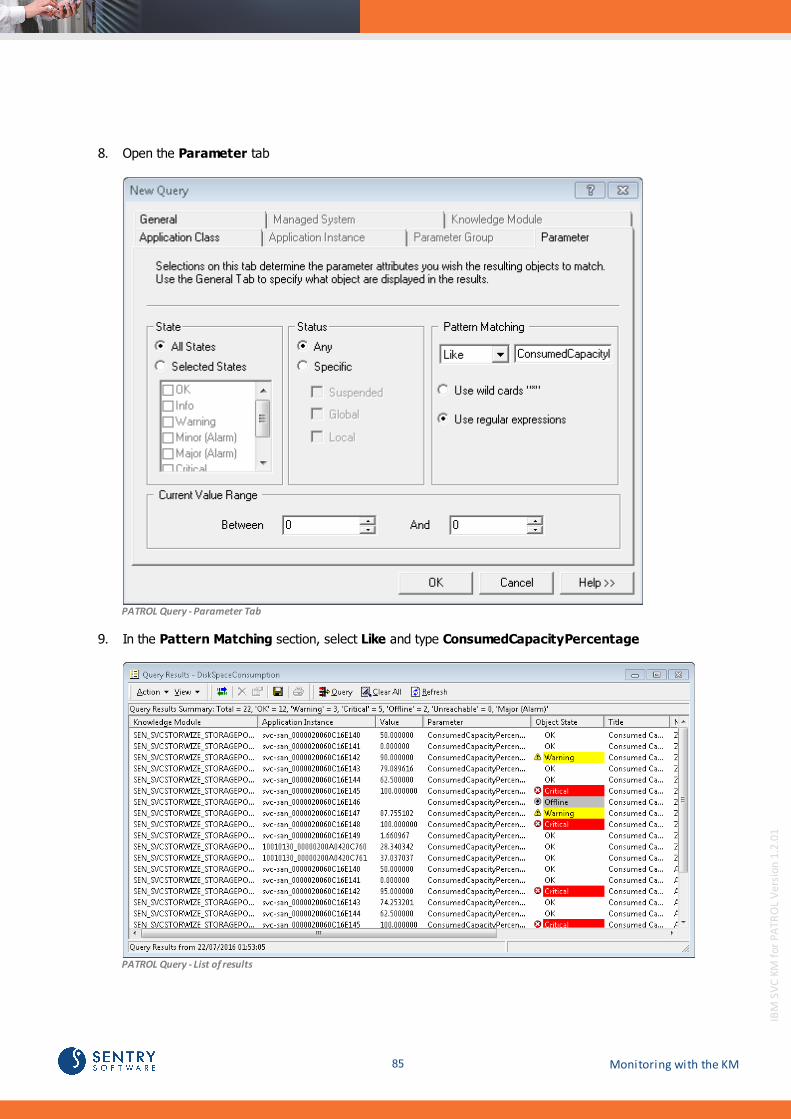
8. Open the Parameter tab
PATROL Query - Parameter Tab
9. In the Pattern Matching section, select Like and type ConsumedCapacityPercentage
PATROL Query - List of results
86Monitoring with the KM
IBM
SV
C K
M f
or
PA
TRO
L V
ersi
on 1
.2.0
1
10. Click OK to display a table with the amount of actually consumed capacity in all of the pools.
An alarm is triggered for the oversubscribed pools, i.e pools for which the oversubscribedcapacity is higher than 99%.
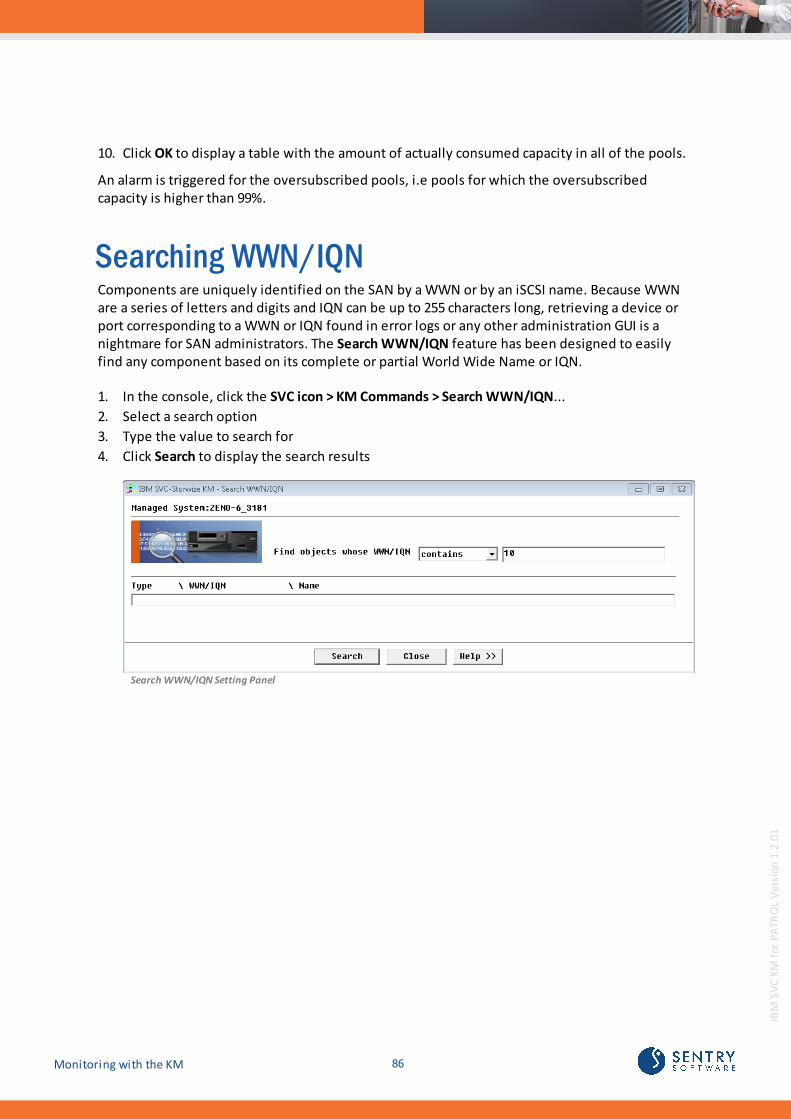
Searching WWN/IQNComponents are uniquely identified on the SAN by a WWN or by an iSCSI name. Because WWNare a series of letters and digits and IQN can be up to 255 characters long, retrieving a device orport corresponding to a WWN or IQN found in error logs or any other administration GUI is anightmare for SAN administrators. The Search WWN/IQN feature has been designed to easilyfind any component based on its complete or partial World Wide Name or IQN.
1. In the console, click the SVC icon > KM Commands > Search WWN/IQN...
2. Select a search option
3. Type the value to search for
4. Click Search to display the search results
Search WWN/IQN Setting Panel

87 Monitoring with the KM
IBM
SV
C K
M f
or
PA
TRO
L V
ersi
on 1
.2.0
1
5. The search results panel lists the WWN/IQN corresponding to the search options you havedefined.
Search WWN/IQN Results

88Monitoring with the KM
IBM
SV
C K
M f
or
PA
TRO
L V
ersi
on 1
.2.0
1
Viewing the MDisks ActivityThe ReadByteRate and WriteByteRate parameters of the SEN_SVC_MDISK class, which representthe overall traffic in megabytes per second for each monitored MDisk, can be used to visualizethe activity of an MDisk.
1. In the console, double-click the ReadByteRate parameter of the MDisk you are interested in.A graph is automatically displayed in the graph pane.
2. Then drag and drop the WriteByteRate parameter in the graph window
Overall Activity of an MDisk

89 Monitoring with the KM
IBM
SV
C K
M f
or
PA
TRO
L V
ersi
on 1
.2.0
1
ReportingThis section deals with the various reports the IBM SVC KM for PATROL enables you to generatefrom the data collected from monitored devices, such as:
Nodes Activity Report
Ports Activity Report
Storage Systems Activity Report
MDisks Activity Report
Pools Activity Report
Volumes Activity Report
LUNs Mapping Table
LUNs Preferred Node Table
Per Host Storage Allocation
Per LUN Storage Allocation
Scheduling Reports
To generate an activity report, right-click the KM icon or the component instance > KMCommands > Reporting and then the report you wish to obtain.
Nodes Activity ReportIBM SVC KM for PATROL enables you to generate a report for your monitored IBM SVC nodes:
1. Click the component instance > KM Commands > Reporting > Nodes Activity...
Generating a Node Activity Report

90Monitoring with the KM
IBM
SV
C K
M f
or
PA
TRO
L V
ersi
on 1
.2.0
1
2. Select the parameter for which you wish to generate a report for:
sent bytes
received bytes
sent / received bytes
3. Select the report range and interval
4. If you triggered the KM command from the IBM SVC main icon:
Click the Nodes Selection button
Select the specific node(s) you wish to include in the report
Click Accept
5. Click Show Report.
Viewing a Node Activity Report

91 Monitoring with the KM
IBM
SV
C K
M f
or
PA
TRO
L V
ersi
on 1
.2.0
1
Ports Activity ReportIBM SVC KM for PATROL enables you to generate a report for your monitored IBM SVC ports:
1. Click the component instance > KM Commands > Reporting > Ports Activity...
Generating a Port Activity Report
2. Select the parameter for which you wish to generate a report
3. Select the report range and interval
4. If you triggered the KM command from the IBM SVC main icon:
Click the Port Selection button
Select the specific port(s) you wish to include in the report
Click Accept

92Monitoring with the KM
IBM
SV
C K
M f
or
PA
TRO
L V
ersi
on 1
.2.0
1
5. Click Show Report.
Viewing a Port Activity Report
Storage Systems Activity ReportIBM SVC KM for PATROL enables you to generate a report for your monitored storage system:
1. Click the component instance > KM Commands > Reporting > Storage Systems Activity...
Generating a Storage System Activity Report
2. Select the parameter for which you wish to generate a report for:
read bytes
write bytes
read / write bytes

93 Monitoring with the KM
IBM
SV
C K
M f
or
PA
TRO
L V
ersi
on 1
.2.0
1
3. Select the report range and interval
4. If you triggered the KM command from the IBM SVC main icon:
Click the Storage Systems Selection button
Select the specific storage system(s) you wish to include in the report
Click Accept
5. Click Show Report.
MDisks Activity ReportIBM SVC KM for PATROL enables you to generate an activity report for your monitored IBM SVCMDisks:
1. Click the component instance > KM Commands > Reporting > MDisks Activity...
Generating a MDisk Activity Report
2. Select the parameter for which you wish to generate a report for:
read bytes
write bytes
read / write bytes
3. Select the report range and interval
4. If you triggered the KM command from the IBM SVC main icon:
Click the MDisk Selections button
Select the specific MDisk(s) you wish to include in the report
Click Accept

94Monitoring with the KM
IBM
SV
C K
M f
or
PA
TRO
L V
ersi
on 1
.2.0
1
5. Click Show Report.
Viewing a MDisk Activity Report
Pools Activity ReportIBM SVC KM for PATROL enables you to generate a report for your monitored IBM SVC pools:
1. Click the component instance > KM Commands > Reporting > Pools Activity...
Generating a Pools Activity Report

95 Monitoring with the KM
IBM
SV
C K
M f
or
PA
TRO
L V
ersi
on 1
.2.0
1
2. Select the parameter for which you wish to generate a report for:
read bytes
write bytes
read / write bytes
3. Select the report range and interval
4. If you triggered the KM command from the IBM SVC main icon:
Click the Pools Selection button
Select the specific Pool(s) you wish to include in the report
Click Accept
5. Click Show Report.
Viewing a Pools Activity Report

96Monitoring with the KM
IBM
SV
C K
M f
or
PA
TRO
L V
ersi
on 1
.2.0
1
Volumes Activity ReportIBM SVC KM for PATROL enables you to generate a report for your monitored IBM SVC volumes:
1. Click the component instance > KM Commands > Reporting > Volumes Activity...
Generating a Volume Activity Report
2. Select the parameter for which you wish to generate a report for:
read bytes
write bytes
read / write bytes
3. Select the report range and interval
4. If you triggered the KM command from the IBM SVC main icon:
Click the Volumes Selection button
Select the specific volume(s) you wish to include in the report
Click Accept

97 Monitoring with the KM
IBM
SV
C K
M f
or
PA
TRO
L V
ersi
on 1
.2.0
1
5. Click Show Report.
Viewing a Volume Activity Report
LUNs Mapping TableIn order to facilitate the servers management, administrators can use the LUNs Mapping Table tolist: mapped and/or not mapped LUNs.
1. In the console, right-click the IBM SVC icon > KM Commands > Reporting > LUNs MappingTable...
Set the list parameters
2. Define the setting of the list you wish to create
Select the type of LUNs you wish the list to display: Not mapped, mapped or all
Select the sorting order: Hostname, LUN or Size
Select the format: Standard or CSV

98Monitoring with the KM
IBM
SV
C K
M f
or
PA
TRO
L V
ersi
on 1
.2.0
1
3. Click Show Report to display a list of LUNs corresponding to your requirements
LUNs Mapping Table
LUNs Preferred Node TableTo list all LUNs preferred nodes, click the KM main icon > KM Commands > Reporting > LUNsPreferred Node Table...
LUNs Preferred Node Table

99 Monitoring with the KM
IBM
SV
C K
M f
or
PA
TRO
L V
ersi
on 1
.2.0
1
Per Host Storage AllocationThe Per Host Storage Allocation reports on the volume of storage allocated to each monitoredhost.
1. In the console, right-click the IBM SVC icon > KM Commands > Reporting > Per Host StorageAllocation...
2. The report show the total amount of consumed and subscribed storage capacity for eachmonitored host.
Per Host Storage Allocation Report
Per LUN Storage AllocationThe Per LUN Storage Allocation reports on the volume of storage allocated to each monitoredLUN.
1. In the console, right-click the IBM SVC icon > KM Commands > Reporting > Per LUN StorageAllocation...
2. The report show the total amount of consumed and subscribed storage capacity for eachmonitored LUN.
Per LUN Storage Allocation Report
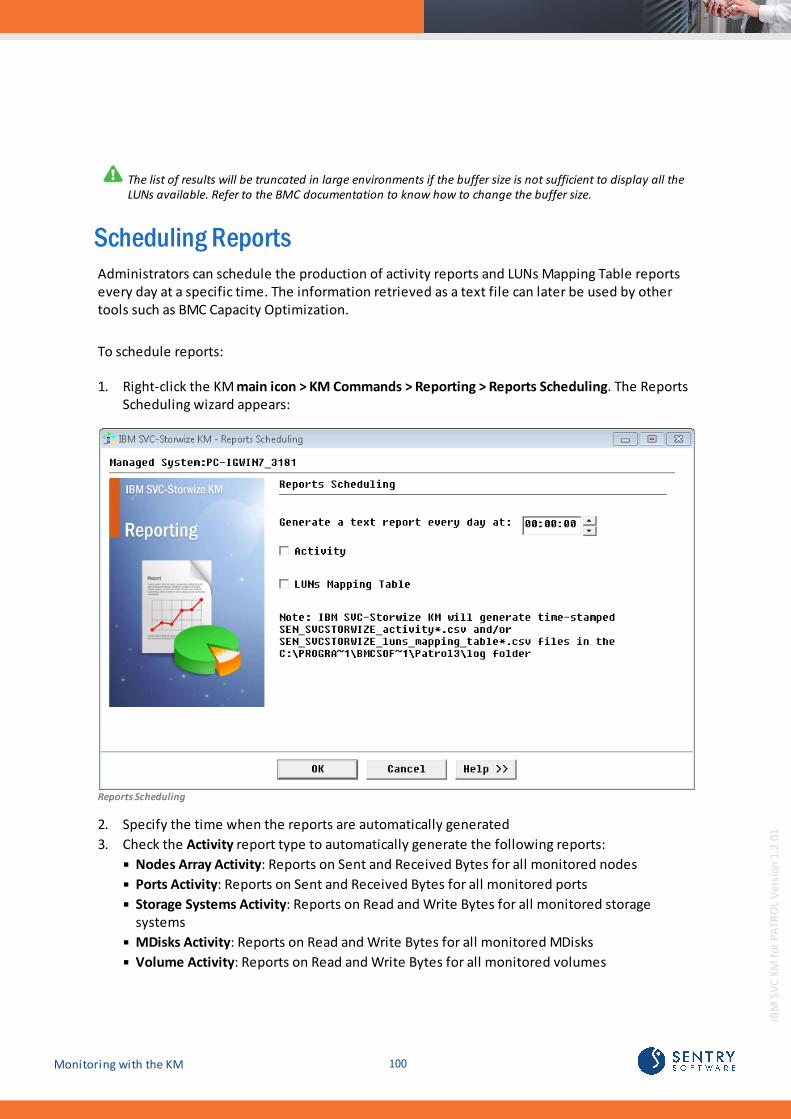
100Monitoring with the KM
IBM
SV
C K
M f
or
PA
TRO
L V
ersi
on 1
.2.0
1
The list of results will be truncated in large environments if the buf fer size is not suf f icient to display all theLUNs available. Refer to the BMC documentation to know how to change the buf fer size.
Scheduling ReportsAdministrators can schedule the production of activity reports and LUNs Mapping Table reportsevery day at a specific time. The information retrieved as a text file can later be used by othertools such as BMC Capacity Optimization.
To schedule reports:
1. Right-click the KM main icon > KM Commands > Reporting > Reports Scheduling. The ReportsScheduling wizard appears:
Reports Scheduling
2. Specify the time when the reports are automatically generated
3. Check the Activity report type to automatically generate the following reports:
Nodes Array Activity: Reports on Sent and Received Bytes for all monitored nodes
Ports Activity: Reports on Sent and Received Bytes for all monitored ports
Storage Systems Activity: Reports on Read and Write Bytes for all monitored storagesystems
MDisks Activity: Reports on Read and Write Bytes for all monitored MDisks
Volume Activity: Reports on Read and Write Bytes for all monitored volumes

101 Monitoring with the KM
IBM
SV
C K
M f
or
PA
TRO
L V
ersi
on 1
.2.0
1
4. Select LUNs Mapping Table to list mapped and unmapped LUNs
5. Click OK.
The generated file(s) are time-stamped and stored in %PATROL_HOME%\log for the specific timeset through the History Retention Period parameter.
The history retention period can be set f rom the PATROL Console or f rom the PATROL Agent using aconf iguration variable. The default collection (retention) period is one day. Whenever a stored parametervalue exceeds its retention period, it is automatically deleted from the parameter history f ile. Refer to BMCdocumentation for details.
Administrative TasksThis section deals with information on basic configuration and administrative tasks such as:
Acknowledging alerts and resetting
Setting automatic parameter reset
Configuring Java settings
Customizing the discovery cycle
Customizing the polling interval
Disabling Volumes Monitoring
Enabling the debug mode
Pausing / Resuming monitoring
Refreshing parameters
Removing device monitoring
Restoring device monitoring
Reinitializing the KM
Triggering a KM discovery.
Managing FC Port ParametersSome parameters of the FC Port instances keep increasing as new errors are encountered. Thecounter starts with the value present at the PATROL Agent start or upon the KM reinitialization.When no error occurs, the parameters remain at zero. Each time an error occurs thecorresponding parameter is increased by 1 (one), and the KM retains this NEW value until it isacknowledged.
The KM provides two KM Commands to acknowledge alerts on a FC Port parameter:
Acknowledge Alerts and Reset
Set Automatic Parameter Reset

102Administrative Tasks
IBM
SV
C K
M f
or
PA
TRO
L V
ersi
on 1
.2.0
1
Acknowledging Alerts and ResettingThis functionality only applies to the parameters of the FC Port instances. It allows administratorsto manually acknowledge alerts and reset the parameters' counters.
To manually acknowledge and reset a FC Port instance parameters, right-click a FC Port instance >KM Commands > Acknowledge Alerts and Reset.
Setting Automatic Parameter ResetSince the manual acknowledgment of each error can rapidly become time consuming, IBM SVCKM for PATROL can be configured to automatically acknowledge an alert on the FC Portparameters and reset it to zero after a specified period of time. Also, since an alert is onlytriggered upon the first breach of a threshold, subsequent issues, that should be notified, may gounnoticed by the SAN administrator. Setting an automatic reset for parameters ensureadministrators to be notified upon each threshold's breach.
To set the automatic parameter reset:
1. Right-click the KM main icon > KM Commands > KM Settings > Automatic Parameters Reset...
2. Select the period of time after which you want the KM to automatically reset the parametersand click OK.
SettingAutomatic Parameter Reset

103 Administrative Tasks
IBM
SV
C K
M f
or
PA
TRO
L V
ersi
on 1
.2.0
1
In many cases, an error that does not reoccur after a certain amount of time can be safely ignored.Automatically resetting parameters after a few hours is often considered as a good practice.
Configuring Java SettingsThe Java Settings wizard enables you to define which Java instance is to be used by IBM SVC KMfor PATROL for managing the email alert action only when using a version lower than 3.6.0.11 ofPATROL agent.
You can either use the automatic detection, select a pre-detected java path or enter manuallythe path leading to the Java executable directory to be used.
IBM SVC KM for PATROL requires Java 1.5 or greater to be installed to connect to an IBM SVC controller. Youwill need to install a Java Runtime Environment (JRE) on the same system that runs the PATROL Agent andthe IBM SVC KM. The Java Settings wizard lets you def ine the path of the Java environment to be used bythe KM.
To access the Java Settings wizard, right-click the main IBM SVC KM icon > KM commands > KMSettings > Java Settings.
Java Settings Wizard - Method Selection
Select the Java executable detection method:

104Administrative Tasks
IBM
SV
C K
M f
or
PA
TRO
L V
ersi
on 1
.2.0
1
Automatic: if you wish IBM SVC KM for PATROL to detect the Java executable directory byitself upon each discovery.
User Selection: if you wish to select a Java executable directory within a list of pre-detectedexecutables.
Manual: if you wish to manually enter the Java executable directory path.
Click Next to continue.
Automatic Detection
If you have selected the automatic detection at the previous step of the wizard, IBM SVC KM forPATROL displays the path of the Java executable directory that will be used when performingcommands requiring Java features.
Java Settings Wizard — Automatic Detection
Click Finish to save your settings.
User Selection
If you have selected the User Selection option at the previous step of the wizard, IBM SVC KM forPATROL displays a list of all the Java executable directories found on your machine.

105 Administrative Tasks
IBM
SV
C K
M f
or
PA
TRO
L V
ersi
on 1
.2.0
1
Java Settings Wizard — User Selection
Select the Java executable directory you wish IBM SVC KM for PATROL to use when performingcommands requiring Java features and click Finish to save your settings.
Manual
If you have selected the Manual option at the previous step of the wizard, IBM SVC KM forPATROL let you enter the path to the Java executable directory you wish the application to usewhen performing commands requiring Java features.

106Administrative Tasks
IBM
SV
C K
M f
or
PA
TRO
L V
ersi
on 1
.2.0
1
Java Settings Wizard — Manual Settings
Click Finish to save your settings.
Once you have modified a java setting, you must restart the PATROL in order to make yourchanges.
Java Settings Wizard — Restart the PATROL Agent
Click OK and restart the PATROL Agent.

107 Administrative Tasks
IBM
SV
C K
M f
or
PA
TRO
L V
ersi
on 1
.2.0
1
Customizing the Discovery IntervalIBM SVC KM for PATROL periodically performs discoveries to detect new components in yourmonitored environment. By default, the KM runs a discovery every hour, but you can customizethis interval by right-clicking the IBM SVC KM icon > KM Commands > KM Settings > DiscoveryInterval...
Customizing Discovery Interval
Customizing the Polling IntervalA polling interval defines how often new data is collected. A new collection can be performedfrom once every second, to once in a day. IBM SVC KM for PATROL polls the managed systems tocollect performance and statistics data. By default, the polling interval for this "data-collect" isset to 2 minutes.
The lower the polling interval, the more time consuming the collection process might be.
To change the polling interval for the managed system, right-click the IBM SVC KM icon > KMCommands > KM Settings > Polling Interval…

108Administrative Tasks
IBM
SV
C K
M f
or
PA
TRO
L V
ersi
on 1
.2.0
1
Customizing the Polling Interval
In addition to the polling interval that is a global setting, i.e. it is applicable to the wholemanaged system, you can also manually trigger a poll at any time on individual instances torefresh parameter values by right-clicking the instance icon > Refresh Parameters.
Disabling Volumes MonitoringDiscovering and collecting volumes metrics are resource-intensive actions that can create extraworkload on the PATROL Agent and the targeted system. To limit the number of instancescreated and therefore reduce the system resource consumption, administrators can disable themonitoring of all the volumes of a system.

109 Administrative Tasks
IBM
SV
C K
M f
or
PA
TRO
L V
ersi
on 1
.2.0
1
To disable volumes monitoring
1. Right-click the Storage Center icon > KM Settings > Disable Volumes Monitoring
Disabling Volumes Monitoring

110Administrative Tasks
IBM
SV
C K
M f
or
PA
TRO
L V
ersi
on 1
.2.0
1
2. Check the Disable Volumes Monitoring option and click OK.
To resume volumes monitoring
1. Right-click the Storage Center icon > KM Settings > Disable Volumes Monitoring
Disabling Volumes Monitoring
3. Uncheck the Disable Volumes Monitoring option and click OK.
Enabling the Debug ModeBy default, IBM SVC KM for PATROL sends only the most critical information, warning and errormessages to the System Output Window of the PATROL Consoles. Most often, this information isaccurate enough to ensure that IBM SVC KM for PATROL is working properly.
If you encounter an issue and wish to report it to Sentry Software, you will be asked to enablethe Debug Mode and provide the debug output to the Sentry Software support team.
To enable the debug mode:

111 Administrative Tasks
IBM
SV
C K
M f
or
PA
TRO
L V
ersi
on 1
.2.0
1
1. Right-click the main IBM SVC KM icon > KM Commands > KM Settings > Debug...
Enabling the Debug Mode
2. Check the Enable Debug Mode option
3. Indicate the date and time at which the system must stop logging debug information.. Therequired format is: YYYY/mm/dd HH:MM:SS
4. Check the Reinitialize IBM SVC KM for PATROL option (optional).
5. Click OK. The debug files will automatically be saved in $PATROL_HOME/log.
Enabling the KM Configuration MenusIBM SVC KM for PATROL can either be used with BMC PATROL (Classic Mode) or BMCProactiveNet Performance Manager (CA Mode). When the KM is used with BMC ProactiveNet, allthe KM configuration menus are disabled in the PATROL Consoles and an error is displayed whenselecting a KM command:

112Administrative Tasks
IBM
SV
C K
M f
or
PA
TRO
L V
ersi
on 1
.2.0
1
Error Message for Disabled KM Configuration Menus
To enable the KM Configuration Menus, you will then have to force the KM to run in ClassicMode.
1. In the PATROL Console, right-click the KM main icon > KM Commands > Reinitialize KM...:
Forcing the KM to run in Classic Mode

113 Administrative Tasks
IBM
SV
C K
M f
or
PA
TRO
L V
ersi
on 1
.2.0
1
2. Check the box Force the KM to run in Classic Mode
3. Click Reinitialize.
This action cannot be undone. Once the KM configuration menus are enabled in BMC PATROL, the KMcan no longer be configured through "Central Administration".
Pausing/Resuming MonitoringIn order to perform certain tasks, such as maintenance for example, it is often useful to pausethe monitoring of an element or a group of elements. To pause the monitoring of a specificelement or group of elements, right-click the element (or element container) icon > KMCommands > Pause Monitoring.
When in paused state, the element/group of elements is displayed with an OFFLINE status in thePATROL Console. Additionally, the mention '(Suspended)' appears beside each relatedparameter.To resume the monitoring of the element/group of elements click Resume Monitoring in themenu.
Refreshing ParametersTo manually refresh parameters of the IBM SVC KM for PATROL, without waiting for an automaticpolling cycle, right-click the instance icon > KM Commands > Refresh Parameters.
Because parameters are either collected every 2 or15 minutes, information will not be immediatelyavailable after refresh. To know which parameters are collected every 2 minutes and which every 15minutes, please refer to the Reference Guide.
Removing Device MonitoringWhenever the supervision of an element/group of elements becomes irrelevant, it is possible toterminate its monitoring by right-clicking the element icon > KM Commands > Remove.
Once removed, the element/group of elements is no longer displayed in the PATROL Console.The Remove KM Command only prevents the display of instances in the PATROL Console. Thediscovery and collect processes are still performed in the background.

114Administrative Tasks
IBM
SV
C K
M f
or
PA
TRO
L V
ersi
on 1
.2.0
1
Restoring MonitoringIt is possible to restore the monitoring of a device with IBM SVC KM for PATROL after it has beenremoved from monitoring environment through the Remove option.
To restore the monitoring of a specific device:
1. Right-click the KM main icon > KM commands > KM Settings > Additional Settings > Restore Monitoring
Restore Monitoring
2. Select:
<All> if you want to restore the monitoring of all the devices that had been previouslyremoved, in the PATROL Console
One or more objects if you only want to restore specific devices (press down the Ctrl-key toallow multiple selection)
3. Click Restore.
Reinitializing the KMIf ever IBM SVC KM for PATROL does not function properly: displays components as missing thatyou know are present, or does not detect several components as it should etc., it is possible toreinitialize the configuration and let IBM SVC KM for PATROL re-start monitoring from scratch.
A backup of the PATROL Agent conf iguration is always performed and saved in the $PATROL_HOME/conf igdirectory before a reinitialization of the KM.
The above cases of malfunction could occur after a configuration change or especially after a

115 Administrative Tasks
IBM
SV
C K
M f
or
PA
TRO
L V
ersi
on 1
.2.0
1
software/hardware upgrade etc.
In such a case, you can reinitialize the KM, and the KM will then run a full discovery and re-startthe monitoring of existing and new components. Thresholds will be set to default so allpreviously manually set thresholds will be lost, unless specified otherwise in the Reinitialize KMwizard shown below.
1. To reinitialize IBM SVC KM for PATROL: Right-click the KM main icon > KM Commands >Reinitialize KM:
Reinitializing IBM SVC KM
2. Select the options as per your specific needs:Alert thresholds and actions
Remove manually customized alert thresholds and polling intervals: Selection removes allcustomized thresholds.
Reset the threshold mechanism mode to default: Selection makes the KM revert to thedefault mode i.e. IBM SVC KM for PATROL selects the mechanism that is best suited to the

116Administrative Tasks
IBM
SV
C K
M f
or
PA
TRO
L V
ersi
on 1
.2.0
1
system.
Reset Alert Actions: Selection removes all manually set Alert Actions and reverts to basicdefault actions i.e. Trigger a PATROL event and Annotate a parameter graph.
Reset other alert and threshold settings: Selection reverts any manually doneconfiguration changes to default IBM SVC KM for PATROL values.
Misc. options
Deactivate the debug mode: Selection deactivates the debug mode if manually enabled.
Restore and resume paused/removed objects: Selection restores all paused or removedobjects.
Remove Java Settings: Selection removes the custom Java Settings (path and credentials).The KM will try to automatically find a suitable JRE.
Save reinitialize settings
Save reinitialize settings: Selection saves the defined settings that will then be consideredas default.
In cases where conf igurations have been manually set in the PATROL Agent, there will be an additionalsection called Internal KM engine options displaying the used conf iguration variables and the optionwhether or not to remove them.
3. Click Reinitialize.
Triggering a KM DiscoveryIBM SVC KM for PATROL automatically executes a discovery every hour of all IBM objects for themonitored system. This enables discovering and then monitoring any new objects added orremoved on the monitored environment.
You can force a discovery manually by right-clicking on the KM main icon > KM Commands >Trigger a Discovery. This forces a discovery for the selected host only.
With a view to optimization, the discovery process is as parallelized as possible. All independent objects areprocessed at the same time.
Thresholds, Alerts and NotificationsDefault alert thresholds are set only once in the agent's configuration the first time the KM runs.These thresholds can be customized using the Event Management KM or PCM (PATROLConfiguration Manager). Administrators can, at any time, revert the configuration changes to thedefault values using the Reinitialize KM command with the Reset other alert and thresholdsettings option enabled or using the Event Management KM or PCM to delete the correspondingconfiguration variables.
The KM also offers you the possibility of selecting the type of notification (Alert actions) to beperformed once an alert is raised.

117 Thresholds, Alerts and Notifications
IBM
SV
C K
M f
or
PA
TRO
L V
ersi
on 1
.2.0
1
Alert Actions
Alert Actions Macros
Threshold Mechanism Selection
Threshold Mechanism SelectionManaging thresholds means selecting/modifying the mechanism by which IBM SVC KM forPATROL sets thresholds for all parameters of the monitored components. By default, IBM SVC KMfor PATROL automatically sets alert thresholds on the monitored parameters.
To modify the threshold mechanism:
1. Right-click the KM main icon > KM Commands > KM Settings > Additional Settings > ThresholdMechanism Selection...
Threshold Mechanism Selection
2. Select one of the following options:
Automatic (default): IBM SVC KM for PATROL determines and uses the thresholdmechanism best suited to the managed system
Tuning: If selected, IBM SVC KM for PATROL will manage its thresholds through thestandard internal PATROL mechanism (Override parameters). Thresholds are stored in thePATROL Agent configuration under the /___tuning___ tree.
Event Management: If this option is selected, IBM SVC KM for PATROL will manage itsthresholds through the Event Management mechanism. Thresholds are stored in thePATROL Agent configuration under the /AS tree. This option requires that you set up thePATROL for Event Management KM on your PATROL Agent. PATROL for Event Management (formerly known as EventSpring) has to be enabled and preloaded.
No Thresholds: IBM SVC KM for PATROL will not set any thresholds on the monitoredobjects. You are required to set them manually.

118Thresholds, Alerts and Notifications
IBM
SV
C K
M f
or
PA
TRO
L V
ersi
on 1
.2.0
1
If you use PATROL for Event Management to manage thresholds in PATROL, it is strongly recommendedthat you use this option in IBM SVC KM for PATROL too.
In order to avoid side effects and unpredictable behavior, if you change the threshold mechanism (from“Event Management” to “Tuning” or the other way around), the KM will automatically recreate thedefault thresholds settings using the new threshold mechanism. Manually customized thresholdshowever are not automatically migrated.
Alert ActionsAlert Actions enable the PATROL administrator to choose specific actions to be executed when ahardware failure is detected. With Alert Actions, it is possible to either:
Customize the way a hardware problem notification is performed, or
Specify a recovery action to be run when a problem occurs.
IBM SVC KM for PATROL can be configured to run one, several, or all types of Alert Actions whenan alert is triggered regarding the monitored hardware.
By default, upon an IBM SVC System failure, the KM triggers a PATROL event and annotates theparameter’s graph with a comprehensive report of the problem, giving details about the failure,the possible consequences and the recommended action to solve the problem.
The Alert Actions that can be performed by IBM SVC KM for PATROL are:
Trigger a PATROL event
Annotate the parameter's graph
Execute an OS command
Execute a PSL command
Send a pop-up to the PATROL consoles
Write a line to a LOG file
Send a basic SNMP trap (using the PATROL MIB)
Send a custom SNMP trap
Send an email
Alert Actions are highly customizable. One can customize the string that is sent through SNMP,set the username/password that is used to execute the OS Command, define the content of thePATROL event sent by IBM SVC KM for PATROL, etc.
Additional information regarding the alert, such as the parameter name or its value, is availablethrough the Alert Actions macros. This information can be used to further customize the AlertAction triggered by IBM SVC KM for PATROL and provide more details about the problem thatoccurs.

119 Thresholds, Alerts and Notifications
IBM
SV
C K
M f
or
PA
TRO
L V
ersi
on 1
.2.0
1
Alert Actions MacrosA macro is a variable whose value is replaced when an Alert Action is triggered. Macros can beused to customize the content of each Alert Action.
For example: %{VALUE} is replaced by the actual current value of the parameter that triggeredthe alert. When used in the text field for a PATROL event Alert Action, the percentage value isreplaced by the actual current value of the parameter that triggered the alert.
Each macro listed in the tables below contains information about what triggered the PATROLalert.
Macros Description
%{/…} Recommended for advanced users only.Provides an internal instance variable name to be inserted. The pathis relative to the object triggering the alert.
%{ALARM_TYPE} Type of the alert triggered (ALARM, WARNING or INFORMATION)
%{ASCTIME:…} Current date and time formatted as specified in the macro
%{DATE} Current date in the YYYY-MM-dd format
%{HOSTNAME} Name of the computer on which the PATROL Agent is running
%{NEWLINE} Linefeed. This is useful to produce multi-line information
%{OBJECT_CLASS} Class of the instance that triggered the alert
%{OBJECT_ID} PATROL internal ID of the instance that triggered the alert
%{OBJECT_LABEL} Display name of the instance that triggered the alert
%{PARAMETER_NAME} Name of the parameter that triggered the alert
%{PARENT_...} Gets the parent's object of a macro
%{PARENT_CLASS} Class of the object that the faulty instance is attached to
%{PARENT_ID} PATROL internal ID of the object that the faulty instance is attachedto
%{PARENT_LABEL} Display name of the object that the faulty instance is attached to
%{SEMICOLON} Semicolon character.
%{SVCHOSTNAME} Name of the computer monitored with the PATROL Agent
%{TIME} Current time in the HH:MM:SS format
%{VALUE} Value of the parameter that triggered the alert.

120Thresholds, Alerts and Notifications
IBM
SV
C K
M f
or
PA
TRO
L V
ersi
on 1
.2.0
1
Edit Alert ActionsTo modify the Alert Actions executed by IBM SVC KM for PATROL upon a hardware failure, right-click on the KM main icon > KM Commands > KM Settings > Alert Actions…
Select the Alert Actions to be executed
By default, IBM SVC KM for PATROL triggers a PATROL event and annotates the parameter thatraises the alert, but there are all the actions that can be triggered:
Editing Alert Actions — Selecting Parameters
After selecting and defining Alert Actions, you need to validate your changes by clicking the Finish button.

121 Thresholds, Alerts and Notifications
IBM
SV
C K
M f
or
PA
TRO
L V
ersi
on 1
.2.0
1
Editing Alert Actions — Validation
Trigger a PATROL EventIf you select Trigger a PATROL Event:
1. Select the type of PATROL event you wish to trigger when a storage problem occurs:
A STD_41 PATROL Event
A Specific PATROL Event
No Event
These events are generated every time a threshold is exceeded. They contain a full Storage Health Reportdetailing the fault that has occurred.

122Thresholds, Alerts and Notifications
IBM
SV
C K
M f
or
PA
TRO
L V
ersi
on 1
.2.0
1
Editing Alert Actions — Alert Action: Trigger a PATROL Event
2. If needed, modify the event message. You can use alert action macros that will be replacedat runtime.
3. Click Next and Finish.
A PATROL Event can be viewed from:
Standard PATROL Consoles (Classic Console, PATROL Central)
PATROL Enterprise Manager
BMC Impact Manager
Other third-party products that interface with PATROL.
The PATROL event that is triggered is the ‘41’ event f rom the standard PATROL catalog. You can use macrosthat will be replaced at runtime. The Alert Actions Macro Variables states the list of available macros.

123 Thresholds, Alerts and Notifications
IBM
SV
C K
M f
or
PA
TRO
L V
ersi
on 1
.2.0
1
Annotate the Parameter’s GraphIf you select the Annotate the parameter’s graph action:
1. Possibly modify the string that will be displayed within the annotation point. You can usealert action macros that will be replaced at runtime.
Editing Alert Actions — Alert Action: Annotate Parameter's Graph
2. Click Next and Finish.
You can use macros that will be replaced at runtime. The Alert Actions Macro Variables states the list ofavailable macros.

124Thresholds, Alerts and Notifications
IBM
SV
C K
M f
or
PA
TRO
L V
ersi
on 1
.2.0
1
Execute an OS CommandIf you select the Execute an OS command action:
Editing Alert Actions — Alert Action: Execute an OS Command
Enter a command line to be executed
Enter the username and password used to run the command.
The command can be a program utility or a script shell, and can have arguments.
The command must be non-interactive (no window, no user input).
You can use macros that will be replaced at runtime. The Alert Actions Macro Variables states the list ofavailable macros.

125 Thresholds, Alerts and Notifications
IBM
SV
C K
M f
or
PA
TRO
L V
ersi
on 1
.2.0
1
Execute a PSL CommandIf you select the Execute a PSL command action, you need to enter the PSL statement to beexecuted by the PATROL Agent. Although only a single line is permitted, it can have several PSLinstructions.
Editing Alert Actions — Alert Action: Execute a PSL Command
The PSL command is recommended for advanced user of PATROL.
You can use macros that will be replaced at runtime. The Alert Actions Macro Variables section states the listof all the available macros.

126Thresholds, Alerts and Notifications
IBM
SV
C K
M f
or
PA
TRO
L V
ersi
on 1
.2.0
1
Send a Pop-up to the PATROL ConsolesIf you select the Send a pop-up to the PATROL Consoles action, you need to enter the messagethat will be displayed in the pop-up as well as in the title of the pop-up window.
Editing Alert Actions — Alert Action: Send a Pop-up to the PATROL Consoles
Too many pop-ups could annoy the operators.
You can use macros that will be replaced at runtime. The Alert Actions Macro Variables states the list ofavailable macros.

127 Thresholds, Alerts and Notifications
IBM
SV
C K
M f
or
PA
TRO
L V
ersi
on 1
.2.0
1
Write a Line to a LOG FileIf you select the Write a line to a LOG file action:
Editing Alert Actions — Alert Action: Write a Line to a LOG File
Enter the LOG file path and the content of the line.
You can use macros that will be replaced at runtime. The Alert Actions Macro Variables states the list ofavailable macros.
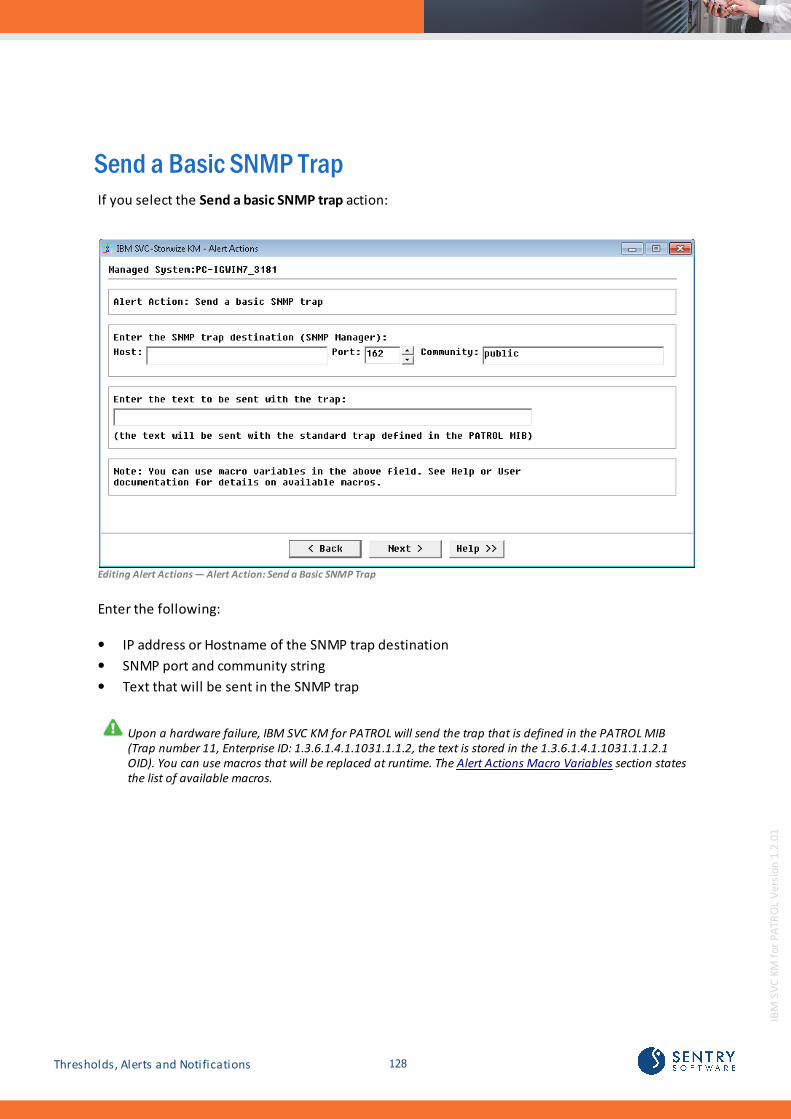
128Thresholds, Alerts and Notifications
IBM
SV
C K
M f
or
PA
TRO
L V
ersi
on 1
.2.0
1
Send a Basic SNMP TrapIf you select the Send a basic SNMP trap action:
Editing Alert Actions — Alert Action: Send a Basic SNMP Trap
Enter the following:
IP address or Hostname of the SNMP trap destination
SNMP port and community string
Text that will be sent in the SNMP trap
Upon a hardware failure, IBM SVC KM for PATROL will send the trap that is def ined in the PATROL MIB(Trap number 11, Enterprise ID: 1.3.6.1.4.1.1031.1.1.2, the text is stored in the 1.3.6.1.4.1.1031.1.1.2.1OID). You can use macros that will be replaced at runtime. The Alert Actions Macro Variables section statesthe list of available macros.

129 Thresholds, Alerts and Notifications
IBM
SV
C K
M f
or
PA
TRO
L V
ersi
on 1
.2.0
1
Send a custom SNMP Trap (advanced)If you select the Send a custom SNMP trap action:
Editing Alert Actions — Alert Action: Send a Custom SNMP Trap
Enter the following:
IP address or Hostname of the SNMP trap destination
SNMP port and community string
All the characteristics of the trap: Enterprise ID, trap number and up to 4 varbinds.

130Thresholds, Alerts and Notifications
IBM
SV
C K
M f
or
PA
TRO
L V
ersi
on 1
.2.0
1
Send an emailIf you select the Send an email action, you need to complete the following panel:
Alert Actions: Send an E-mail
Enter the sender and the recipient email addresses in respectively the From and To fields, andtype the SMTP server name. Finally, enter the email Subject and type the Body of the messageyou wish to send.

131 Thresholds, Alerts and Notifications
IBM
SV
C K
M f
or
PA
TRO
L V
ersi
on 1
.2.0
1

Reference Guide

133
IBM
SV
C K
M f
or
PA
TRO
L V
ersi
on 1
.2.0
1
Introduction
This chapter provides statistical information about resources, operating status, and performancesmanaged by the IBM SVC KM for PATROL. It contains tables describing the parameters used in theKM, grouped by Application Classes, and provides a brief description of each parameters and itsdefault settings.
The collection of cluster statistics must be started on the IBM SVC System to get performanceinformation on the PATROL Console. For more information, please refer to Starting Statistics Collection.
Some parameters are collected every 2 minutes; others every 15 minutes.
Classes and ParametersThis section lists the application classes of IBM SVC KM for PATROL. It gives you details on theicons that represent the class, Infobox, parameters and the menu commands available for eachapplication class. There are 10 main application classes and 6 “container” classes. The containerclasses have no parameters.
SEN_SVC_MAIN
SEN_SVC_SVC
SEN_SVC_NODE
SEN_SVC_NODE_CONT
SEN_SVC_ISCSIPORT
SEN_SVC_FCPORT
SEN_SVC_PORT_CONT
SEN_SVC_POOL
SEN_SVC_POOL_CONT
SEN_SVC_MDISK
SEN_SVC_MDISK_CONT
SEN_SVC_STORAGESYSTEM
SEN_SVC_STORAGESYSTEM_CONT
SEN_SVC_VOLUME
SEN_SVC_VOLUME_CONT
SEN_SVC_VOLUMEMIRROR
Baselines and Key Performance Indicators
Some parameters are identified by default as Key Performance Indicators (KPIs) and thereforeautomatically included in the base lining calculation. To learn more about auto baselining and

134Classes and Parameters
IBM
SV
C K
M f
or
PA
TRO
L V
ersi
on 1
.2.0
1
KPIs, please refer to the Managing Baselines and Key Performance Indicators chapter.
In this guide, parameters flagged as KPIs and included by default in the baseline calculationprocess are respectively identified by the following icons:
Baselining
KPI
SEN_SVC_MAINIcon
Collectors
Name Description
discoveryColl Discovery's collector
Parameters
None.
InfoBox
Name Description
Copyright Provides the name of the company owning the reproduction rights on theproduct.
Product Displays the name of the product.
Release Date Indicates the date on which the product was released.
Support Provides an email address where users can send message to get help on theproduct.
Version Indicates the KM version number.
Website Provides the address of the product's web site

135 Classes and Parameters
IBM
SV
C K
M f
or
PA
TRO
L V
ersi
on 1
.2.0
1
Menu Commands
Function Description
Add a Connection to anIBM SVC System
Enables you to identify the IBM SVC System to be monitored.
Reporting Enables the generation of several activity reports.
Reporting > NodesActivity...
Enables the generation of node activity reports.
Reporting > Ports Activity... Enables the generation of port activity reports.
Reporting > StorageSystems Activity...
Enables the generation of storage system activity reports.
Reporting > MDisksActivity...
Enables the generation of MDisk activity reports.
Reporting > Pools Activity... Enables the generation of pools activity reports.
Reporting > VolumesActivity...
Enables the generation of volume activity reports.
Reporting > LUNs MappingTable...
Lists all mapped and/or not mapped LUNs.
Reporting > LUNs PreferredNode Table
Lists all LUNs preferred nodes.
Reporting > Per HostStorage Allocation
Generates a report on the volume of storage allocated to each monitoredhost.
Reporting > Per LUNStorage Allocation
Generates a report on the volume of storage allocated to each monitored LUN.
Reporting > ReportsScheduling
Generates activity and LUNs Mapping Table reports every day at a specifictime. The information retrieved as a text file can later be used by other toolssuch as BMC Capacity Optimization.
Search WWN/IQN Enables you to find any component based on its complete or partial WorldWide Name or iSCSI Qualified Named.
KM Settings Displays all the command options for different monitoring settings.
KM Settings > Java Settings Enables you to perform additional settings such as restoring devicemonitoring, displaying settings for UNIX Console and enabling/disablingdebug mode
KM Settings > DiscoveryInterval
Enables you to customize the discovery cycle. By default, discovery isperformed every hour.
KM Settings > PollingInterval
Enables you to customize the polling cycle. By default, the polling interval isdone every 2 minutes
KM Settings > Alert Actions Enables you to select the Alert Actions (different methods of notification) tobe executed by the KM when a parameter breaches its threshold.
KM Settings > AutomaticParameter Reset
Allows you to set an automatic reset of the FC Port parameters.

136Classes and Parameters
IBM
SV
C K
M f
or
PA
TRO
L V
ersi
on 1
.2.0
1
KM Settings > AdditionalSettings > ThresholdMechanism Selection
Allows you to select the threshold mechanism:Automatic (by default): the KM determines the mode of thresholdmanagement best suited to the system. The different modes are:
Tuning: the KM uses the internal PATROL mechanism to set thresholdsEvent Management: the KM automatically sets thresholds throughEvent ManagementNo thresholds: the KM does not set any thresholds and lets you specifythem manually.
KM Settings > AdditionalSettings > RestoreMonitoring
Brings up the "Restore Monitoring" wizard to restore one or several objectsafter their monitoring has been stopped.
KM Settings > Debug Activates or deactivates the debug mode. The debug Mode displays debugmessages in the PATROL System Output Window or saves it in a file if youenter the file path
Pause All Pauses the monitoring of all objects discovered by IBM SVC KM for PATROL.
Resume All Resumes the monitoring of all objects after IBM SVC KM for PATROL has beenpaused.
Trigger a KM Discovery Enables you to trigger a forced discovery and rediscover the elements of themonitored system.
Reinitialize KM Triggers a complete re-initialization of IBM SVC KM for PATROL. Customizedsettings are lost unless specified otherwise in the Reinitialize wizard.
About States basic product information and BMC Software support contactinformation

137 Classes and Parameters
IBM
SV
C K
M f
or
PA
TRO
L V
ersi
on 1
.2.0
1
SEN_SVC_SVCIcon
Collectors
Name Description
fcPortColl FC Ports' collector
iSCSIPortColl iSCSI Ports' collector
mDiskColl mDisks' collector
nodeColl Nodes' collector
poolColl Pools' collector
storageSystemColl Storage Systems' collector
svcColl SAN Volume Controller's collector
volumeColl Volume's collector
Parameters
All parameters are refreshed every 2 minutes.
Name Description Units Default Alert Conditions BMCProactiveNetAttribute Type
CollectionStatus* Indicates thestatus of thecollection.
{0= OK; 1 = Degraded;2= Failed}
1 = Warning2 = Alarm
CollectionStatus
CollectionStatusInformation
Providesadditionalinformationabout theCollectionStatusparameter.
n/a None --
PortCount Number ofFC andEthernetports on theStorageSystem.
Ports None Statistics

138Classes and Parameters
IBM
SV
C K
M f
or
PA
TRO
L V
ersi
on 1
.2.0
1
Name Description Units Default Alert Conditions BMCProactiveNetAttribute Type
Note: Thisvalue can beused to knowthe numberof requiredlicenses forthemonitoringsystem.
TimeSinceLastSatisticsUpdate
Displays thenumber ofminutessince a newstatisticsfile wascreated onthe cluster.
minutes Warning when > 30 Statistics
* Parameters marked with an asterisk are used by default when visualizing the corresponding monitor instance inTrueSight Operations Management.
InfoBox
Name Description
PATROL ID Displays PATROL internal identifier.
IP Indicates the IP address of IBM SVC.
Menu Commands
Function Description
Reporting Enables the generation of several reports.
Reporting > NodesActivitiy...
Enables the generation of node activity reports.
Reporting > Ports Activity... Enables the generation of port activity reports.
Reporting > StorageSystems Activity...
Enables the generation of storage system activity reports.
Reporting > MDisksActivitiy...
Enables the generation of MDisk activity reports.
Reporting > VolumesActivity...
Enables the generation of volume activity reports.
Reporting > Pools Activity... Enables the generation of pools activity reports.

139 Classes and Parameters
IBM
SV
C K
M f
or
PA
TRO
L V
ersi
on 1
.2.0
1
Function Description
Reporting > LUNs MappingTable...
Lists all mapped and/or not mapped LUNs.
Reporting > LUNs PreferredNode Table
Lists all LUNs preferred nodes.
Reporting > Per HostStorage Allocation
Generates a report on the volume of storage allocated to each monitoredhost.
Reporting > Per LUN StorageAllocation
Generates a report on the volume of storage allocated to each monitoredLUN.
Edit Connection Settings Enables you to modify the connection settings of an IBM SVC System.
Search WWN/IQN Enables the user to find any component based on its complete or partialWorld Wide Name or IQN
Pause Monitoring Pauses the monitoring of the IBM SVC System.
Resume Monitoring Resumes the monitoring of the IBM SVC System.
Remove Removes the IBM SVC System components from the monitoring environment.
Refresh Parameters Refreshes all parameters of the application class.

140Classes and Parameters
IBM
SV
C K
M f
or
PA
TRO
L V
ersi
on 1
.2.0
1
SEN_SVC_NODE_CONTIcon
Parameters
None.
InfoBox
None.
Menu Commands
Function Description
Reporting Enables the generation of several reports.
Reporting > NodesActivity...
Enables the generation of node activity reports.
Reporting > Ports Activity... Enables the generation of port activity reports.
Pause Monitoring Pauses the monitoring of the IBM SVC System.
Resume Monitoring Resumes the monitoring of the IBM SVC System.
Remove Removes the IBM SVC System components from the monitoring environment.

141 Classes and Parameters
IBM
SV
C K
M f
or
PA
TRO
L V
ersi
on 1
.2.0
1
SEN_SVC_NODEIcon
Collectors
None.
Parameters
Parameters Refreshed Every 2 Minutes
Name Description Units Default Alert Conditions BMCProactiveNetAttribute Type
Status Indicates thestatus of thenode.
{0= OK;1 =Degraded; 2=Failed}
1 = Warning2 = Alarm
Availability
StatusInformation Providesadditionalinformationabout thestatusparameter.
n/a n/a --
Parameters Refreshed Every 15 Minutes
Name Description Units Default Alert Conditions BMCProactiveNetAttribute Type
ProcessorUtilization* Indicates thepercentageof utilizationof theprocessor.
Percentage(%)
Warning whengreater than 90%;Alarm when greaterthan 99%
Statistics
ReceivedByteRate Indicates thenumber ofmegabytesreceived persecond.
Megabytesperseconds (MB/s)
None Statistics

142Classes and Parameters
IBM
SV
C K
M f
or
PA
TRO
L V
ersi
on 1
.2.0
1
Name Description Units Default Alert Conditions BMCProactiveNetAttribute Type
ReceivedOperationRate Indicates thenumber ofoperationsreceived persecond.
Operations/s
None Statistics
ReceivedResponseTime Indicates theaverage timetaken tocompletereceiverequests.
Milliseconds(ms)
Warning whengreater than 10 ms;Alarm when greaterthan 100ms
Response Time
SentByteRate Indicates themegabytessent.
Megabytespersecond(MB/s)
None Statistics
SentOperationRate Indicates thenumber ofoperationssent.
Operations/s
None Statistics
SentResponseTime Indicates theaverage timetaken tocompletesendrequests.
Milliseconds(ms)
Warning whengreater than 10 ms;Alarm when greaterthan 100ms
Response Time
* Parameters marked with an asterisk are used by default when visualizing the corresponding monitor instance inTrueSight Operations Management.
InfoBox
Name Description
PATROL ID The PATROL internal identifier.
Name Name of the node.
WWN World Wide Name address of the device.
IO Group ID Identifier of the input/output group.
IO Group Name Name of the input/ouput group the node belongs to.
Partner ID Identifier of the partner node.
Partner Name Name of the partner node.
Failover Failure status (active/inactive).
Failover Node Identifier of the failover node.
Hardware Model information (CF8, 8F2, 8F4, 8G4, Other.)

143 Classes and Parameters
IBM
SV
C K
M f
or
PA
TRO
L V
ersi
on 1
.2.0
1
Name Description
iSCSI Name Name of the iSCSI port.
Failover iSCSI alias iSCSI alias for failover.
Menu Commands
Function Description
Reporting Enables the generation of several reports.
Reporting > Node Activity... Enables the generation of a node activity report.
Reporting > Ports Activity... Enables the generation of port activity reports.
Pause Monitoring Pauses the monitoring of the IBM SVC System.
Resume Monitoring Resumes the monitoring of the IBM SVC System.
Remove Removes the IBM SVC System components from the monitoring environment..
Refresh Parameters Refreshes all parameters of the application class.

144Classes and Parameters
IBM
SV
C K
M f
or
PA
TRO
L V
ersi
on 1
.2.0
1
SEN_SVC_PORT_CONTIcon
Parameters
None.
InfoBox
None.
Menu Commands
Function Description
Ports Activity... Enables the generation of port activity reports.
Pause Monitoring Pauses the monitoring of the IBM SVC System.
Resume Monitoring Resumes the monitoring of the IBM SVC System.
Remove Removes the IBM SVC System from the monitoring environment.

145 Classes and Parameters
IBM
SV
C K
M f
or
PA
TRO
L V
ersi
on 1
.2.0
1
SEN_SVC_ISCSIPORTIcon
iSCSI port
Collectors
None.
Parameters
Parameters Refreshed Every 2 Minutes
Name Description Units DefaultAlertConditions
BMCProactiveNetAttributeType
LinkSpeed Indicates the iSCSI interfacelink speed.
Megabytesperseconds(MB/s)
None Statistics
Status Indicates the status of theiSCSI port.
{0= OK; 1 =Degraded;2= Failed}
1 =Warning2 =Alarm
Availability
StatusInformation Provides additionalinformation about the statusparameter.
n/a n/a --
Parameters Refreshed Every 15 Minutes
Name Description Units Default AlertConditions
BMCProactiveNetAttributeType
BandwidthUtilization* Percentage used ofthe availablebandwidth.
Percentage(%)
None Statistics

146Classes and Parameters
IBM
SV
C K
M f
or
PA
TRO
L V
ersi
on 1
.2.0
1
Name Description Units Default AlertConditions
BMCProactiveNetAttributeType
ReceivedByteRate Indicates thenumber ofmegabytesreceived persecond.
Megabytesperseconds(MB/s)
None Statistics
ReceivedFromHostsByteRate Indicates thenumber ofmegabytesreceived fromhosts per second.
Megabytesperseconds(MB/s)
None Statistics
ReceivedFromOtherClustByteRate Indicates thenumber ofmegabytesreceived fromother nodes.
Megabytesperseconds(MB/s)
None Statistics
ReceivedFromSameClustByteRate Indicates thenumber ofmegabytesreceived from thesame cluster.
Megabytesperseconds(MB/s)
None Statistics
ReceivedFromStorageByteRate Indicates thenumber ofmegabytesreceived fromstorage.
Megabytesperseconds(MB/s)
None Statistics
SentByteRate Indicates thenumber ofmegabytes sent tohost, diskcontrollers, andother nodes in thesame and otherclusters.
Megabytesperseconds(MB/s)
None Statistics
SentToHostsByteRate Indicates thenumber ofmegabytestransmitted tohost.
Megabytesperseconds(MB/s)
None Statistics
SentToOtherClustByteRate Indicates thenumber ofmegabytestransmitted toother nodes in theother clusters.
Megabytesperseconds(MB/s)
None Statistics

147 Classes and Parameters
IBM
SV
C K
M f
or
PA
TRO
L V
ersi
on 1
.2.0
1
Name Description Units Default AlertConditions
BMCProactiveNetAttributeType
SentToSameClustByteRate Indicates thenumber ofmegabytestransmitted toother nodes in thesame cluster.
Megabytesperseconds(MB/s)
None Statistics
SentToStorageByteRate Indicates thenumber ofmegabytestransmitted tostorage.
Megabytesperseconds(MB/s)
None Statistics
* Parameters marked with an asterisk are used by default when visualizing the corresponding monitor instance inTrueSight Operations Management.
InfoBox
Name Description
PATROL ID The PATROL internal identifier.
IQN iSCSI Qualified Name.
Menu Commands
Function Description
Port Activity... Enables the generation of port activity reports.
Pause Monitoring Pauses the monitoring of the IBM SVC System.
Resume Monitoring Resumes the monitoring of the IBM SVC System.
Remove Removes the IBM SVC System components from the monitoring environment.
Refresh parameters Refreshes all parameters of the application class.

148Classes and Parameters
IBM
SV
C K
M f
or
PA
TRO
L V
ersi
on 1
.2.0
1
SEN_SVC_FCPORTIcon
FC port
Collectors
None
Parameters
Parameters Refreshed Every 2 Minutes
Name Description Units DefaultAlertConditions
BMCProactiveNetAttributeType
LinkSpeed Indicates the FC interface linkspeed.
Megabytesperseconds(MB/s)
None Statistics
Status Indicates the status of the FCport.
{0= OK; 1 =Degraded;2= Failed}
1 =Warning2 =Alarm
Availability
StatusInformation Provides additionalinformation about the statusparameter.
n/a n/a --
Parameters Refreshed Every 15 Minutes
Name Description Units DefaultAlertConditions
BMCProactiveNetAttributeType
BadCRC Indicates the number of CRCthat are not valid.
Errors Warning if≥1
Statistics

149 Classes and Parameters
IBM
SV
C K
M f
or
PA
TRO
L V
ersi
on 1
.2.0
1
Name Description Units DefaultAlertConditions
BMCProactiveNetAttributeType
BandwidthUtilization* Percentage used of theavailable bandwidth.
Percentage(%)
None Statistics
InvalidTransmissionWords Indicates the number oftransmission word countsthat are not valid.
Words Warning if≥1
Statistics
LinkFailures Indicates a link failure count. Failures Warning if≥1
Statistics
LossOfSignal Indicates the loss-of-signalcount.
Losses Warning if≥1
Statistics
LossOfSynch Indicates the loss-of-synchronization count.
Losses Warning if≥1
Statistics
ProtocolErrors Indicates the protocol errorcount.
Errors Warning if≥1
Statistics
ReceivedByteRate Indicates the number of bytessent from host, diskcontrollers, and other nodesin the same and otherclusters.
Megabytesperseconds(MB/s)
None Statistics
ReceivedFromHostsWriteRate Indicates the number ofmegabytes received fromhosts per second.
Megabytesperseconds(MB/s)
None Statistics
ReceivedFromOtherClustByteRate Indicates the number ofmegabytes received fromother nodes.
Megabytesperseconds(MB/s)
None Statistics
ReceivedFromSameClustByteRate Indicates the number ofmegabytes received from thesame cluster.
Megabytesperseconds(MB/s)
None Statistics
ReceivedFromStorageByteRate Indicates the number ofmegabytes received fromstorage.
Megabytesperseconds(MB/s)
None Statistics
SentByteRate Indicates the number ofmegabytes sent to host, diskcontrollers, and other nodesin the same and otherclusters.
Megabytesperseconds(MB/s)
None Statistics

150Classes and Parameters
IBM
SV
C K
M f
or
PA
TRO
L V
ersi
on 1
.2.0
1
Name Description Units DefaultAlertConditions
BMCProactiveNetAttributeType
SentToHostsByteRate Indicates the number ofmegabytes transmitted tohost.
Megabytesperseconds(MB/s)
None Statistics
SentToOtherClustByteRate Indicates the number ofmegabytes transmitted toother nodes in the otherclusters.
Megabytesperseconds(MB/s)
None Statistics
SentToSameClustByteRate Indicates the number ofmegabytes transmitted toother nodes in the samecluster.
Megabytesperseconds(MB/s)
None Statistics
SentToStorageByteRate Indicates the number ofmegabytes transmitted tostorage.
Megabytesperseconds(MB/s)
None Statistics
ZeroBufferTimePercentage Percentage of time where theport was unable to send datadue to lack of buffer credit inthe switch.
Percentage(%)
None Statistics
* Parameters marked with an asterisk are used by default when visualizing the corresponding monitor instance inTrueSight Operations Management.
InfoBox
Name Description
PATROL ID The PATROL internal identifier.
WWN World Wide Name of the Fibre Channel.
Menu Commands
Function Description
Port Activitiy... Enables the generation of port activity reports.
Acknowledge Alerts andReset
Resets error counts.
Pause Monitoring Pauses the monitoring of the IBM SVC System
Resume Monitoring Resumes the monitoring of the IBM SVC System
Remove Removes the IBM SVC System components from the monitoring environment.

151 Classes and Parameters
IBM
SV
C K
M f
or
PA
TRO
L V
ersi
on 1
.2.0
1
Function Description
Refresh Parameters Refreshes all parameters of the application class.

152Classes and Parameters
IBM
SV
C K
M f
or
PA
TRO
L V
ersi
on 1
.2.0
1
SEN_SVC_POOL_CONTIcon
Parameters
None.
InfoBox
None.
Menu Commands
Function Description
Pools Activity... Enables the generation of pools activity reports.
MDisks Activity... Enables the generation of MDisk activity reports.
Pause Monitoring Pauses the monitoring of the IBM SVC System
Resume Monitoring Resumes the monitoring of the IBM SVC System
Remove Removes the IBM SVC System components from the monitoring environment.

153 Classes and Parameters
IBM
SV
C K
M f
or
PA
TRO
L V
ersi
on 1
.2.0
1
SEN_SVC_POOLIcon
Collectors
None.
Parameters
All parameters are refreshed every 2 minutes.
Name Description Units Default AlertConditions
BMCProactiveNetAttributeType
ConsumedCapacity Indicates thetotal size of thespace actuallyallocated orreserved.
Gigabytes(GB)
None Statistics
ConsumedCapacityPercentage* Indicates thepercentage of thepool that isactuallyallocated orreserved.
Percentage(%)
Alarm if ≥ 75% Statistics
Status Indicates thestatus of thepool.
{0=OK; 1 =Degraded; 2= Failed}
1 = Warning2 = Alarm
Availability
StatusInformation Providesadditionalinformationabout the statusparameter.
n/a n/a --
SubscribedCapacity Indicates thetotal host visiblecapacity.
Gigabytes(GB)
None Statistics
SubscribedCapacityPercentage* Indicates thepercentage of thepool that issubscribed.
Percentage(%)
None Statistics

154Classes and Parameters
IBM
SV
C K
M f
or
PA
TRO
L V
ersi
on 1
.2.0
1
Name Description Units Default AlertConditions
BMCProactiveNetAttributeType
ReadByteRate Indicates theamount of dataread from thedisk.
Megabytesper seconds(MB/s)
None Statistics
WriteByteRate Indicates theamount of datawritten persecond.
Megabytesper seconds(MB/s)
None Statistics
* Parameters marked with an asterisk are used by default when visualizing the corresponding monitor instance inTrueSight Operations Management.
InfoBox
Name Description
PATROL ID The PATROL internal identifier.
Capacity Pool capacity.
MDisks Number of managed disks attached to the pool.
Volumes Number of logical disks.
Menu Commands
Function Description
Pools Activity... Enables the generation of pools activity reports
MDisks Activity... Enables the generation of MDisk activity reports
Pause Monitoring Pauses the monitoring of the IBM SVC System
Resume Monitoring Resumes the monitoring of the IBM SVC System
Remove Removes the IBM SVC System components from the monitoring environment.
Refresh Parameters Refreshes all parameters of the application class.

155 Classes and Parameters
IBM
SV
C K
M f
or
PA
TRO
L V
ersi
on 1
.2.0
1
SEN_SVC_MDISK_CONTIcon
Parameters
None.
InfoBox
None.
Menu Commands
Function Description
MDisks Activitiy... Enables the generation of MDisk activity reports.
Pause Monitoring Pauses the monitoring of the IBM SVC System.
Resume Monitoring Resumes the monitoring of the IBM SVC System.
Remove Removes the IBM SVC System components from the monitoring environment.

156Classes and Parameters
IBM
SV
C K
M f
or
PA
TRO
L V
ersi
on 1
.2.0
1
SEN_SVC_MDISKIcon
Collectors
None.
Parameters
Parameters Refreshed Every 2 Minutes
Name Description Units Default AlertConditions
BMCProactiveNetAttributeType
AvailablePathCount Indicates the number ofnodes that have access tothe managed disk.
Paths 0 = Alarm Statistics
Status Indicates the status of themanaged disk.
{0=OK; 1 =Degraded; 2 =Failed}
1 = Warning2 = Alarm
Availability
StatusInformation Provides additionalinformation about the statusparameter.
n/a n/a --
Parameters Refreshed Every 15 Minutes
Name Description Units Default AlertConditions
BMCProactiveNetAttributeType
ReadByteRate* Indicates the amount of dataread from the disk.
Megabytes perseconds (MB/s)
None Statistics
ReadOperationRate Indicates the amount ofoperations read per second
Operations/s None Statistics
ReadResponseTime Indicates the average timefor a disk to complete a readrequest
Milliseconds(ms)
Warning ≥ 10ms Alarm ≥ 100ms
ResponseTime

157 Classes and Parameters
IBM
SV
C K
M f
or
PA
TRO
L V
ersi
on 1
.2.0
1
Name Description Units Default AlertConditions
BMCProactiveNetAttributeType
WriteByteRate* Indicates the amount of datawritten per second.
Megabytes perseconds (MB/s)
None Statistics
WriteOperationRate Indicates the amount ofoperations written persecond.
Operations/s None Statistics
WriteResponseTime Indicates the average timefor a disk to complete awrite request.
Milliseconds(ms)
Warning ≥ 10ms Alarm ≥ 100ms
ResponseTime
* Parameters marked with an asterisk are used by default when visualizing the corresponding monitor instance inTrueSight Operations Management.
InfoBox
Name Description
PATROL ID The PATROL internal identifier.
Mode MDisk access mode (managed, unmanaged, array,image). According to themode of the disk, some infobox information may not be available.
Pool ID Identifier of the pool the MDisk is attached to.
Pool Name Name of the pool the MDisk is attached to.
Capacity Size of the MDisk.
Preferred WWPN Preferred World Wide Port Name for the MDisk.
Active WWPN Active World Wide Port Name for the MDisk.
Tier Underlying disks tier level.
Storage System Information (Section separator)
Name Name of the MDisk.
Vendor Name of the vendor.
Model Model of the MDisk.
WWNN World Wide Name address of the disk.
Menu Commands
Name Description
MDisk Activity... Enables the generation of MDisk activity reports.

158Classes and Parameters
IBM
SV
C K
M f
or
PA
TRO
L V
ersi
on 1
.2.0
1
Name Description
Pause Monitoring Pauses the monitoring of the IBM SVC System.
Resume Monitoring Resumes the monitoring of the IBM SVC System.
Remove Removes the IBM SVC System components from the monitoring environment.
Refresh Parameters Refreshes all parameters of the application class.

159 Classes and Parameters
IBM
SV
C K
M f
or
PA
TRO
L V
ersi
on 1
.2.0
1
SEN_SVC_STORAGESYSTEM_CONTIcon
Parameters
None.
InfoBox
None.
Menu Commands
Function Description
Reporting Enables the generation of several activity reports.
Reporting > StorageSystems Activity...
Enables the generation of storage system activity reports.
Reporting > MDisksActivitiy
Enables the generation of MDisk activity reports.
Pause Monitoring Pauses the monitoring of the IBM SVC System.
Resume Monitoring Resumes the monitoring of the IBM SVC System.
Remove .Removes the IBM SVC System components from the monitoring environment.

160Classes and Parameters
IBM
SV
C K
M f
or
PA
TRO
L V
ersi
on 1
.2.0
1
SEN_SVC_STORAGESYSTEMIcon
Collectors
None.
Parameters
All parameters are refreshed every 2 minutes.
Name Description Units Default AlertConditions
BMCProactiveNetAttributeType
ReadByteRate* Indicates the amount of dataread per second.
Megabytesperseconds(MB/s)
None Statistics
ReadOperationRate Indicates the amount ofoperations read per second
Operations/s
None Statistics
ReadResponseTime Indicates the average time takento complete a read request
Milliseconds (ms)
Warning if > 10msAlarm if > 100ms
Response Time
Status Indicates the status of thestorage system.
{0 = OK ; 1= Degraded; 2 =Failed}
1 = Warning2 = Alarm
Availability
StatusInformation Provides additional informationabout the status parameter.
n/a n/a --
WriteByteRate* Indicates the amount of datawritten per second.
Megabytesperseconds(MB/s)
None Statistics
WriteOperationRate Indicates the amount ofoperations written per second.
Operations/s
None Statistics
WriteResponseTime Indicates the average time takento complete a write request.
Milliseconds (ms)
Warning if > 10msAlarm if > 100ms
Response Time
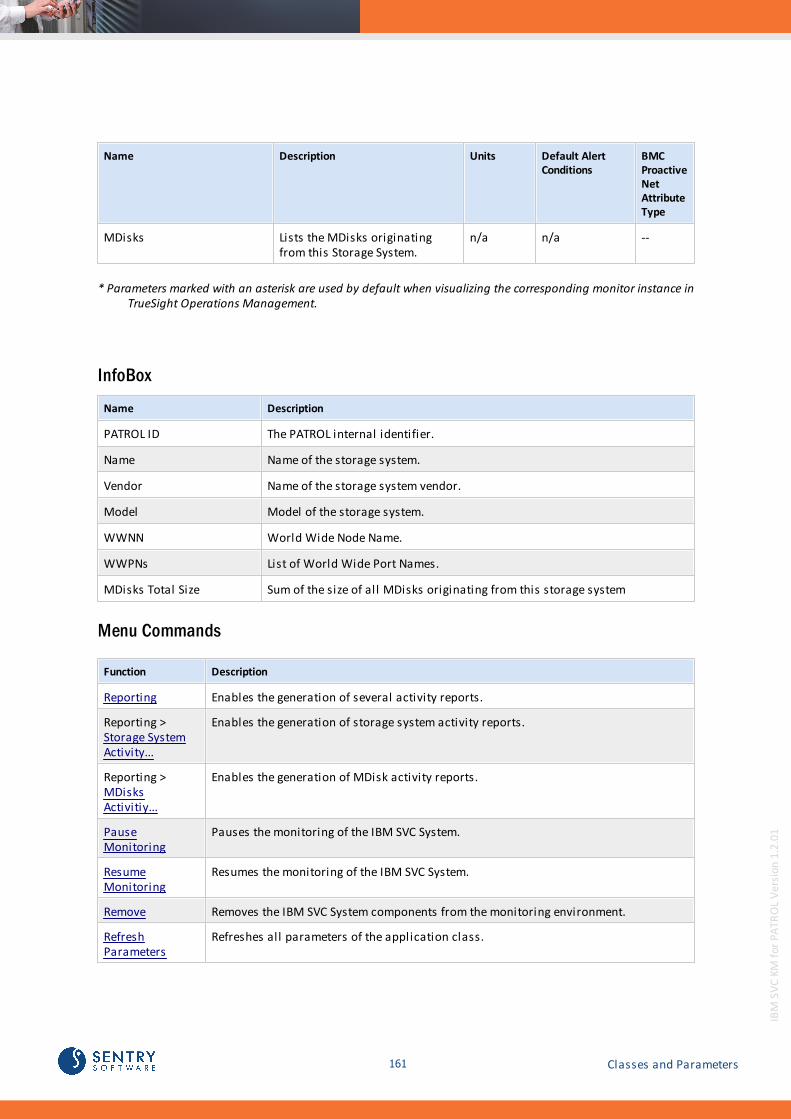
161 Classes and Parameters
IBM
SV
C K
M f
or
PA
TRO
L V
ersi
on 1
.2.0
1
Name Description Units Default AlertConditions
BMCProactiveNetAttributeType
MDisks Lists the MDisks originatingfrom this Storage System.
n/a n/a --
* Parameters marked with an asterisk are used by default when visualizing the corresponding monitor instance inTrueSight Operations Management.
InfoBox
Name Description
PATROL ID The PATROL internal identifier.
Name Name of the storage system.
Vendor Name of the storage system vendor.
Model Model of the storage system.
WWNN World Wide Node Name.
WWPNs List of World Wide Port Names.
MDisks Total Size Sum of the size of all MDisks originating from this storage system
Menu Commands
Function Description
Reporting Enables the generation of several activity reports.
Reporting > Storage SystemActivity...
Enables the generation of storage system activity reports.
Reporting > MDisksActivitiy...
Enables the generation of MDisk activity reports.
PauseMonitoring
Pauses the monitoring of the IBM SVC System.
ResumeMonitoring
Resumes the monitoring of the IBM SVC System.
Remove Removes the IBM SVC System components from the monitoring environment.
RefreshParameters
Refreshes all parameters of the application class.
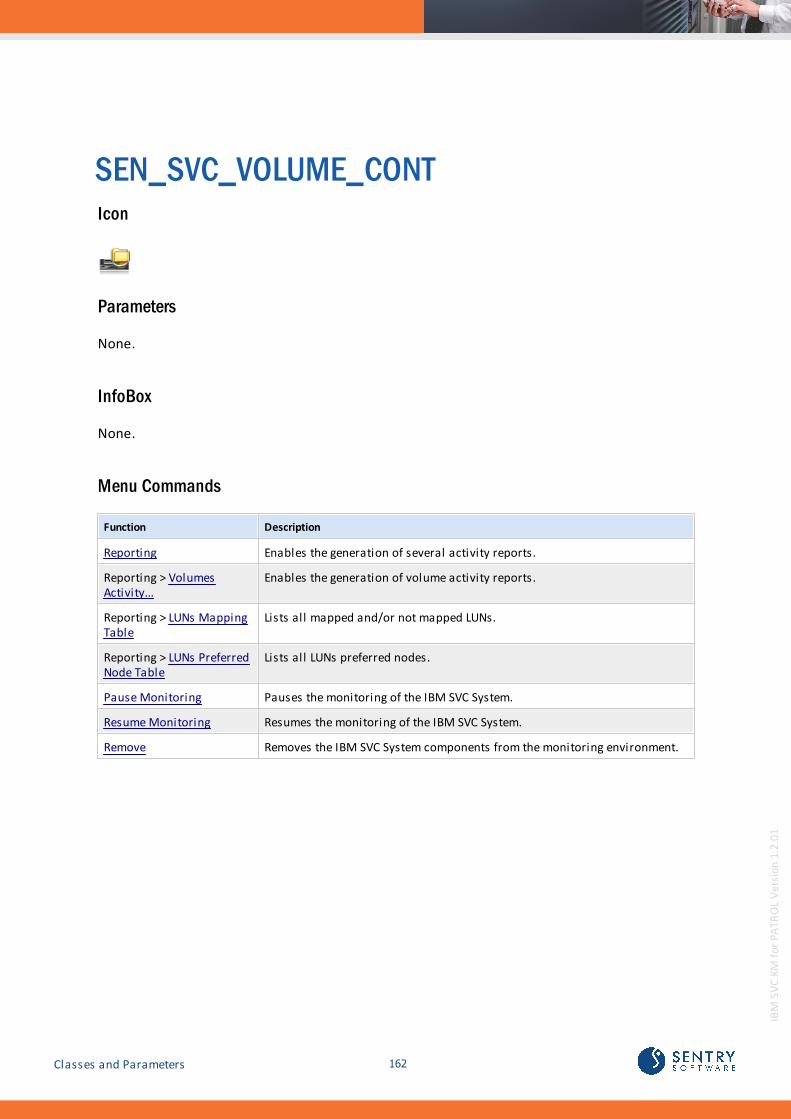
162Classes and Parameters
IBM
SV
C K
M f
or
PA
TRO
L V
ersi
on 1
.2.0
1
SEN_SVC_VOLUME_CONTIcon
Parameters
None.
InfoBox
None.
Menu Commands
Function Description
Reporting Enables the generation of several activity reports.
Reporting > VolumesActivity...
Enables the generation of volume activity reports.
Reporting > LUNs MappingTable
Lists all mapped and/or not mapped LUNs.
Reporting > LUNs PreferredNode Table
Lists all LUNs preferred nodes.
Pause Monitoring Pauses the monitoring of the IBM SVC System.
Resume Monitoring Resumes the monitoring of the IBM SVC System.
Remove Removes the IBM SVC System components from the monitoring environment.

163 Classes and Parameters
IBM
SV
C K
M f
or
PA
TRO
L V
ersi
on 1
.2.0
1
SEN_SVC_VOLUMEIcon
Parameters
Parameters Refreshed Every 2 Minutes
Name Description Units Default AlertConditions
BMCProactiveNetAttributeType
ConsumedCapacity Indicates thetotal size of thespace actuallyallocated orreserved.
Gigabytes (GB)
None Statistics
ConsumedCapacityPercentage Indicates thepercentage ofthe volume thatis actuallyallocated orreserved.
Percentage (%)
None Statistics
Hosts Indicates thehosts thevolume isattached to.
n/a n/a --
HostVisibleCapacity Indicates thereal capacity ofthe volumeprimary copy.
Gigabytes (GB)
None Statistics
Pool Indicates thepool the volumebelongs to.
n/a n/a --
Status Indicates thestatus of thevolume.
{0=OK;1=Degraded;2=Failed}
1 = Warning2 = Alarm
Availability
StatusInformation Providesadditionalinformationabout the statusparameter.
n/a n/a --

164Classes and Parameters
IBM
SV
C K
M f
or
PA
TRO
L V
ersi
on 1
.2.0
1
Name Description Units Default AlertConditions
BMCProactiveNetAttributeType
TimeSinceLastActivity Number of dayssince anyactivityoccurred on theLUN.
Days None Statistics
Parameters Refreshed Every 15 Minutes
Name Description Units Default AlertConditions
BMCProactiveNetAttributeType
ReadByteRate* Indicates theamount of dataread per second.
Megabytes perseconds(MB/s)
None Statistics
ReadOperationRate Indicates theamount ofoperations readper second.
Operations/s
None Statistics
ReadResponseTime Indicates theaverage timetaken tocomplete a readrequest
Milliseconds(ms)
Warning if ≥10msAlarm if ≥100ms
ResponseTime
WriteByteRate* Indicates theamount of datawritten persecond.
Megabytes perseconds(MB/s)
None Statistics
WriteOperationRate Indicates theamount ofoperationswritten persecond.
Operations/s
None Statistics
WriteResponseTime Indicates theaverage timetaken tocomplete a writerequest.
Milliseconds(ms)
Warning if ≥10msAlarm if ≥100ms
ResponseTime
* Parameters marked with an asterisk are used by default when visualizing the corresponding monitor instance inTrueSight Operations Management.

165 Classes and Parameters
IBM
SV
C K
M f
or
PA
TRO
L V
ersi
on 1
.2.0
1
InfoBox
Name Description
PATROL ID The PATROL internal identifier.
ID Identifier of the volume.
Name Name of the volume.
IO Group ID Identifier of the I/O group the volume belongs to.
IO Group Name Name of the I/O group the volume belongs to.
Preferred Node Name of the preferred node.
Pool Name Name of the pool the volume belongs to.
Capacity Volume Capacity.
IO Throttling Status of the I/O throttling (Enable|Disable).
Mirror Sync Rate Percentage of the synchronization for mirrored copies.
Cache Mode Cache mode (ReadWrite, None)
Cache State Indicates if the VDisk has data in the cache. The possible values are: empty,not_empty, corrupt, repairing.
Number of Copies Number of volume copies.
Menu Commands
Function Description
Volume Activity... Enables the generation of volume activity reports.
Pause Monitoring Pauses the monitoring of the IBM SVC System
Resume Monitoring Resumes the monitoring of the IBM SVC System
Remove Removes the IBM SVC System components from the monitoring environment.
Refresh Parameters Refreshes all parameters of the application class.

166Classes and Parameters
IBM
SV
C K
M f
or
PA
TRO
L V
ersi
on 1
.2.0
1
SEN_SVC_VOLUMEMIRRORIcon
Collectors
None.
Parameters
All parameters are refreshed every 2 minutes.
Name Description Units Default AlertConditions
BMCProactiveNetAttributeType
Pool Indicates thepool the volumemirror belongsto.
n/a n/a --
Status Indicates thestatus of thevolume mirror.
{0=OK;1=Degraded;2=Failed}
1 = Warning2 = Alarm
Availability
StatusInformation Providesadditionalinformationabout the statusparameter.
n/a n/a --
Synchronized* Indicateswhether theVolume Mirroris synchronizedwith the volumeit belongs to.
{0 = No;1 = Yes}
0 = Warning Statistics
* Parameters marked with an asterisk are used by default when visualizing the corresponding monitor instance inTrueSight Operations Management.
InfoBox
Name Description
PATROL ID The PATROL internal identifier.

167 Classes and Parameters
IBM
SV
C K
M f
or
PA
TRO
L V
ersi
on 1
.2.0
1
Menu Commands
Function Description
Pause Monitoring Pauses the monitoring of the IBM SVC System
Resume Monitoring Resumes the monitoring of the IBM SVC System
Remove Removes the IBM SVC System components from the monitoring environment.
Refresh Parameters Refreshes all parameters of the application class.

168Classes and Parameters
IBM
SV
C K
M f
or
PA
TRO
L V
ersi
on 1
.2.0
1
Managing Baselines and KeyPerformance IndicatorsIn order to facilitate the detection of abnormalities on your monitored environment, BMCProactiveNet calculates baselines per parameter (metrics or attributes) based on valuescollected over a specified period of time to determine a normal operating range. When thecollected values for these parameters are out of range, an alert is triggered.
Some parameters are identified by default as Key Performance Indicators and thereforeautomatically included in the base lining calculation.
Managing baselines
The baseline is the expected normal operating range for a metric or attribute of a monitor.
The baseline is calculated by collecting the values for a monitor’s attributes and metrics over aspecified time period and establishing a low baseline value (consisting of the 10th percentile ofall the values for a given time period) and a high baseline value (consisting of the 90th percentileof all the values for a given time period), taking a weighted average of these values over time. Ahigher weight is given to the latest data being factored into the baseline average. The accuracy ofthe baseline improves over time.
Requirements for baseline generation
For baselines to be generated for an attribute, that abnormality threshold means that thethreshold exists and is not suppressed. Additionally, if the Key Performance Indicator (KPI) mode is active, only those attributes thathave an active abnormality threshold and are also KPI attributes will have baselines generatedfor them.
Absolute thresholds (with "outside baseline") or signature thresholds do not satisfy these requirements.
Managing Key Performance Indicators
The KPI attribute of a parameter can be activated or deactivated manually through the BMCProactiveNet Administration Console. In this KM, some parameters or attributes have beendesignated as important indicators of performance (KPIs). We do not recommend that thesedefault settings are modified.

169 Managing Baselines and Key PerformanceIndicators
IBM
SV
C K
M f
or
PA
TRO
L V
ersi
on 1
.2.0
1
However, advanced users may activate or deactivate KPIs from the BMC ProactiveNetAdministration Console.
To add or remove Key Performance Indicator (KPI) attributes for a monitor type
1. In the Administration Console, from the menu bar, choose Tools > KPI Administration. TheKPI Administration dialog box is displayed.
2. From the Monitor Type list, choose the monitor type for which you want to add or removeKPI attributes. A list of attributes for the selected monitor type is displayed.
3. In the KPI column for the attributes that you want to add or remove as Key PerformanceIndicators:
select the KPI check box to add the corresponding attribute as a KPI
deselect the KPI check box to remove the corresponding attribute from the KPIs for thatmonitor type
For complete and detailed information on this procedure, please refer to the BMC ProactiveNetdocumentation available f rom BMC Web site.
Parameters for which the system by default calculates baselines as well as parametersconsidered as KPIs are respectively identified by the following icons:
Baselining
KPI

170Managing Baselines and Key PerformanceIndicators
IBM
SV
C K
M f
or
PA
TRO
L V
ersi
on 1
.2.0
1
Configuration VariablesThis section lists the configuration variables used by IBM SVC KM for PATROL. Configurationvariables are stored in the PATROL Agent configuration and can be managed through:
PATROL Configuration Manager (PCM)
wpconfig (Windows)
xpconfig (UNIX/Linux)
The following tables recapitulate the configuration variables used by the KM, i.e that apply to allof the monitored hosts.
These following configuration variables are stored under /SENTRY/SEN_SVC in the PATROLAgent’s configuration.
Variables DefaultValue
Description
AlertActions n/a List of alert actions to be executed by IBM SVC KM forPATROL upon a problem with the managed SVC systems.
collectionHubHeapSizeMax n/a Maximum heap size in megabytes allocated to the JavaCollection Hub.Default: Not set
collectionHubHeapSizeMin n/a Minimum heap size in megabytes allocated to JavaCollection Hub.Default: Not set
collectionHubOverrideJavaCommandLine
n/a Command line used by the KM to launch the JavaCollection Hub. Default: Not setThis variable should only be set if instructed by SentrySupport.
debugEndTime None Specifies when the debug mode will be disabled. Format required: YYYY/MM/DD HH:MM:SS
debugMode 0 = disabled When set to '1', enables the debug mode of the KM.Default: Not set
defaultReinitializationOptions None List of default options to be executed by IBM SVC KM forPATROL on reinitialization. The default values are:0=unchecked; 1=checked
resetThresholds
resetThresholdManagementMode
resetAlertActions
resetOtherAlertSettings
resetDebugMode
resetRemovedPausedObjectList
resetReport
resetSecuritySettings

171 Configuration Variables
IBM
SV
C K
M f
or
PA
TRO
L V
ersi
on 1
.2.0
1
resetJavaSettings
Insert a colon “;” between the variable and its value:“resetThresholds;1”. If you enter multiple variables, they needto be separated by a carriage return.Example: “resetThresholds;1” will display the remove thresholdsoption selected by default in the Reinitialize KM wizard.
disableJavaInformationMessage
0 = activated When set to ‘1’, disables the pop-up information messagedisplayed when the java settings are modified.Default: Not set
disableJRECheck 0 When set to ‘1’, disables the validation tests of the JREused by the KM to run Java code and therefore force theKM to use a non-Sun or non-Oracle JRE
disablePslExecuteBugWorkaround
0 = activated When set to ‘1’, deactivates the workaround in the KMfor a bug in the PslExecute() PSL function. If the KM detects that the version of the PATROL Agent isaffected by the PslExecute() bug, it uses an alternatetechnique to create asynchronous threads with theevent_trigger() function and the RemPsl standard event.The disablePslExecuteBugWorkaround variable disablesthis workaround.
disableVolumeMonitoring 0 = disabled Disable the volumes monitoring, the discovery andcollection of metrics for all volumes.
exportActivityReports None When set to 1, the SEN_SVC_activity*.csv report isautomatically generated and stored in the %PATROL_HOME%\log folder.
exportLUNsMappingTable None When set to 1, the SEN_SVC_LUNS_mapping_table*.csvreport is automatically generated and stored in the %PATROL_HOME%\log folder.
exportScheduling None Time when the activity and/or LUNs Mapping Tablereports will be generated. Format required: HH:MM:SS
forceClassicConfigMode 0 = disabled When the KM is used with BMC ProactiveNet, all the KMconfiguration menus are disabled in the PATROLConsoles. To enable them, set theforceClassicConfigMode variable to 1.
javaPassword None Password associated to the javaUsername variable.
javaPath None Path to the folder containing the Java executable usedby the Collection Hub.Default: Not set (The KM will search for a suitable JREautomatically).
javaUsername None Username used to launch the Java Collection Hub.Default: Not set. variable.
parametersAutoResetTimeout None Indicate the time in seconds after which the incrementalparameters should be automatically reset when an erroris detected.
pausedObjectList n/a List of the PATROL object path of the paused objects. (i.e. forwhich no collection will be performed).
pemMessages All How much internal information should be sent as PATROLevents.

172Configuration Variables
IBM
SV
C K
M f
or
PA
TRO
L V
ersi
on 1
.2.0
1
When set to ‘all’, all internal KM messages (problems andinformational messages).
When set to ‘problems’, only errors and problems.
When set to ‘none’, no internal message at all.
This doesn’t affect the reporting of actual hardware problems.
pollingInterval 120 Interval in seconds at which the KM gathers thestatistics files from the IBM SVC nodes.
removedObjectList n/a List of instances that have been removed from the monitoringenvironment through the Remove KM Command.
sowMessages All How much internal information should be displayed in the SystemOutput Window in the PATROL Console.
When set to ‘all’, all internal KM messages (problems andinformational messages).
When set to ‘problems’, only errors and problems.
When set to ‘none’, no internal message at all.
This doesn’t affect the reporting of actual hardware problems.
staticThresholdsParameterList None List of parameters for which custom thresholds have been setthrough the Modify Thresholds KM command.
temporaryFolder None Path to the folder where temporary files used by the KM tocompute statistics will be stored.Default: Not set (assumed PATROL Agent’s own temporaryfolder)
ThresholdsManagementMode Retrievedfrom the KMconfiguration
Specifies how the KM should manage the alert thresholds onparameters. Please read carefully the User Guide chapter formore information on this topic.Possible values:
'empty' (automatic detection of the suitable thresholdmanagement)
‘as’ (through PATROL for Event Management)
‘tuning’ (through the standard "Override parameter"mechanism)
‘none’ (No threshold is set by the KM)
Default: Not set (automatic)
unexpectedStatusInternalIssueNotification
0 =deactivated
When set to 1, the KM will inform you of any internalproblems or of any special operations it may perform.
unexpectedStatusManagement None Specifies the action to be performed when the product is unableto interpret a status value.Format: <alarm type>;<internal issue notification>
Possible alarm type values:
ALARM
OK
WARN
Default: OK
Possible internal issue notification values:
1: trigger an internal issue notification
0: do not trigger an internal issue notification
Default: 0

173 Configuration Variables
IBM
SV
C K
M f
or
PA
TRO
L V
ersi
on 1
.2.0
1
Configuration variables specific to each IBM SVC Cluster are listed in the table below. Theseconfiguration variables are stored under /SENTRY/SEN_SVC/<SVC Cluster ID> in the PATROLAgent’s configuration.
Variable Description
<SVC ID>/IP IP address or hostname of the IBM SVC Cluster.
<SVC ID>/keyFile Path to the SSH key file used to connect to the IBM SVC Cluster SSH interface.
<SVC ID>/keyPassphrase
Passphrase used to connect to the IBM SVC Cluster SSH interface.
<SVC ID>/name Display name of the IBM SVC Cluster as shown in the console interface.
<SVC ID>/password
Passphrase used to connect to the IBM SVC Cluster SSH interface.
<SVC ID>/username
Username associated to the passphrase (and optionally the key file) to connect to the IBM SVCCluster SSH interface.

174
IBM
SV
C K
M f
or
PA
TRO
L V
ersi
on 1
.2.0
1
Index
- A -Abnormalities 168
Acknowledge
Alerts 101, 102Activity
MDisks 88
View 88Activity Reports 89
Add
IBM SVC System 52Administrative
Tasks 101Alert Actions 116, 118, 119, 121, 123, 124,125, 126, 127, 128, 129, 130
Annotate the Parameter’s Graph 123
Edit 120
Execute a PSL Command 125
Execute an OS Command 124
Send a Basic SNMP Trap 128
Send a Custom SNMP Trap 129
Send a Pop-up to the PATROL Consoles 126
Send an email 130
Trigger a PATROL Event 121
Write a Line to a LOG File 127Alerts 116
Acknowledge 101, 102
Reset 101, 102Allocation
Per Host Storage 99
Per LUN Storage 99Application Classes
SEN_SVC_MDisk 73
SEN_SVC_NODE 59
SEN_SVC_POOL 82
SEN_SVC_STORAGESYSTEM 73
SEN_SVC_VOLUME 63
- B -Baselines
BMC ProactiveNet Performance Management 168
Generation 168
Manage 168
Requirements 168BMC ProactiveNet Performance Management
Abnormalities 168
Baselines 168
Key Performance Indicators 168
KPI 168Bottleneck
Find 64
- C -CA
Mode 111Classes 133
Classic
Mode 111Collector
discoveryColl 134
fcPortColl 137
iSCSIPortColl 137
mDiskColl 137
nodeColl 137
poolColl 137
storageSystemColl 137
svcColl 137
volumeColl 137Commands
Edit Connection Settings 137
LUNs Mapping Table 137
LUNs Preferred Node Table 137
MDisks Activitiy 137
Nodes Activitiy 137
Pause Monitoring 137
Per Host Storage Allocation 137
Per LUN Storage Allocation 137
Ports Activity 137
Refresh Parameters 137
Remove 137
Reporting 137
Resume Monitoring 137
Search WWN/IQN 137
Storage Systems Activity 137
Volumes Activity 137Configuration

175
IBM
SV
C K
M f
or
PA
TRO
L V
ersi
on 1
.2.0
1
Configuration
Automatic 47, 103
Manual 47, 103
Selection 47, 103Configuration Variables
<SVC ID>/IP 170
<SVC ID>/keyFile 170
<SVC ID>/keyPassphrase 170
<SVC ID>/name 170
<SVC ID>/username 170
AlertActions 170
collectionHubHeapSizeMin 170
collectionHubOverrideJavaCommandLine 170
debugEndTime 170
debugMode 170
defaultReinitializationOptions 170
disableJavaInformationMessage 170
disableJRECheck 170
disablePslExecuteBugWorkaround 170
exportActivityReports 170
exportLUNsMappingTable 170
exportScheduling 170
forceClassicConfigMode 170
javaPassword 170
javaPath 170
javaUsername 170
parametersAutoResetTimeout 170
pausedObjectList 170
pemMessages 170
pollingInterval 170
removedObjectList 170
sowMessages 170
staticThresholdsParameterList 170
temporaryFolder 170
ThresholdsManagementMode 170
unexpectedStatusInternalIssueNotification 170
unexpectedStatusManagement 170Configure
Java Settings 47, 103Configuring
KM 46Connection Settings
Edit 57Console Administration 111
Contention
Diagnose 61Customize
Discovery Interval 107
Polling Interval 107
- D -Deactivate
Debug Mode 114Debug
Enable 110Debug Mode
Deactivate 114Detect
High Processor Utilization 59Device
All 114
Restore monitoring 114
Specific 114Device Monitoring
Remove 113Diagnose
SAN/Network Contention 61
Slow LUNs 63Discovery
Interval 107
Trigger 116Discovery Interval
Customize 107Disk Space
Consumption 82
Report 82
- E -Edit
Connection Settings 57Email
Send 130Enable
Debug 110
KM Configuration Menus 111
KM debug mode 110Execute
OS Command 124
PSL Command 125

176
IBM
SV
C K
M f
or
PA
TRO
L V
ersi
on 1
.2.0
1
- F -Files 19
ins_ALL_<version>.tar 19
ins_WINDOWS_<version>.exe 19
Setup 20
setup.exe 23
setup.sh 23
uninstall.exe 34
uninstall.sh 34Fixed Issues 8
Force
Classic Mode 111Force Classic Mode 114
- G -Generate
Baselines 168
SSH Key 14
- H -Hosts
LUNs 72
- I -IBM SVC System
Add 52IBM SVC Systems
Monitor 58Identify
LUNs Preferred Node 72InfoBox 141, 145, 148, 153, 156, 160, 163,166
Active WWPN 156
Cache Mode 163
Cache State 163
Capacity 153, 156, 163
Copyright 134
Failover 141
Failover iSCSI alias 141
Failover Node 141
Hardware 141
ID 163
IO Group ID 141, 163
IO Group Name 141, 163
IO Throttling 163
IP 137
IQN 145
iSCSI Name 141
MDisks 153
MDisks Total Size 160
Mirror Sync Rate 163
Mode 156
Model 156, 160
Name 141, 156, 160, 163
Number of Copies 163
Partner ID 141
Partner Name 141
PATROL ID 137, 141, 145, 148, 153, 156,160, 163
Pool ID 156
Pool Name 156, 163
Preferred Node 163
Preferred WWPN 156
Product 134
Release Date 134
Support 134
Tier 156
Vendor 156, 160
Version 134
Volumes 153
Website 134
WWN 141, 148
WWNN 156, 160
WWPNs 160Install
Introduction 23Install / Un-install 34
BMC Software Installation Utility 19
Log 23
Packages 19
Procedure 23
Setup Files 20Installation
Preparing 14Integrating with BMC ProactiveNet PerformanceManagement 44
Integration
BMC Portal 43
BMC ProactiveNet Performance Management 43
IQN

177
IBM
SV
C K
M f
or
PA
TRO
L V
ersi
on 1
.2.0
1
IQN
Search 86
- J -JAVA
Requirements 14Java Settings
Configure 47, 103
- K -Key Performance Indicators
BMC ProactiveNet Performance Management 168
Manage 168KM
Debug Mode 110
Reinitialize 114KM Configuration Menus
Enable 111KPI
BMC ProactiveNet Performance Management 168
Manage 168
- L -Loading
KM 46LOG File 127
LUN
Not mapped 78
Unmapped 78
Unused 78LUNs
Busiest 70
Hosts 72
Identify 70
Mapping Table 97
Preferred Node 72
Preferred Node Table 98
Slow 63LUNs Preferred Node
Identity 72
- M -Macros
%{/…} 119
%{ALARM_TYPE} 119
%{ASCTIME:…} 119
%{DATE} 119
%{NEWLINE} 119
%{OBJECT_CLASS} 119
%{OBJECT_ID} 119
%{OBJECT_LABEL} 119
%{PARAMETER_NAME} 119
%{PARENT_...} 119
%{PARENT_CLASS} 119
%{PARENT_ID} 119
%{PARENT_LABEL} 119
%{SVCHOSTNAME} 119
%{TIME} 119
%{VALUE} 119Manage
Baselines 168
Key Performance Indicators 168
KPI 168
Port Status Parameters 101, 102MDisk
Activitiy Report 93MDisks
Activity 88Menu Commands 140, 141, 145, 148, 152,153, 155, 156, 159, 160, 162, 163, 166
About 134
Acknowledge Alerts and Reset 148
Add a Connection to an IBM SVC System 134
Alert Actions 134
Automatic Parameter Reset 134
Debug 134
Discovery Interval 134
Java Settings 134
KM Settings 134
LUNs Mapping Table 134, 162
LUNs Preferred Node Table 134, 162
MDisk Activity 156
MDisks Activity 134, 152, 153, 155, 159,160
Nodes Activity 134, 140, 141
Pause All 134

178
IBM
SV
C K
M f
or
PA
TRO
L V
ersi
on 1
.2.0
1
Menu Commands 140, 141, 145, 148, 152,153, 155, 156, 159, 160, 162, 163, 166
Pause Monitoring 140, 141, 144, 145, 148,152, 153, 155, 156, 159, 160, 162, 163, 166
Per Host Storage Allocation 134
Per LUN Storage Allocation 134
Polling Interval 134
Port Activity 145, 148
Ports Activity 134, 140, 141, 144
Refresh Parameters 141, 148, 153, 156,160, 163, 166
Reinitialize KM 134
Remove 140, 141, 144, 145, 148, 152, 153,155, 156, 159, 160, 162, 163, 166
Reporting 134, 140, 141, 159, 162
Reports Scheduling 134
Restore Monitoring 134
Resume All 134
Resume Monitoring 140, 141, 144, 145,148, 152, 153, 155, 156, 159, 160, 162, 163,166
Search WWN/IQN 134
Storage System Activity 160
Storage System Traffic Report 159
Storage Systems Activity 134
Threshold Mechanism Selection 134
Trigger a KM Discovery 134
Volume Activity 163
Volumes Activity 134Mode
CA 111
Classic 111Monitor
IBM SVC Systems 58Monitoring
Pause 113
Remove 113
Restore 114
Resume 113
Volume Mirroring Synchronization 75
- N -Network
Contention 61Node
Activity Report 89Nodes
Performance 64
Nodes Identification
Requirements 14Notifications 116
- O -Operating Systems
Linux 19, 23, 34
Unix 19, 34
Windows 19, 23, 34Options
Common services 23
Console Systems role 23
Managed System 23
View Log 23OS Command
Execute 124Oversubscription 59
- P -Parameter
Reset 102Parameter’s Graph
Annotate 123Parameters 133
AvailablePathCount 156
BadCRC 148
BandwidthUtilization 145, 148
CollectionStatus 137
CollectionStatusInformation 137
ConsumedCapacity 82, 153, 163
ConsumedCapacityPercentage 59, 82, 153,163
Hosts 163
HostVisibleCapacity 163
InvalidTransmissionWords 148
LinkFailures 148
LinkSpeed 145, 148
LossOfSignal 148
LossOfSynch 148
MDisks 160
Pool 163, 166
PortCount 137
ProcessorUtilization 59, 141
ProtocolErrors 148
ReadByteRate 70, 156, 160, 163
ReadOperationRate 156, 160, 163

179
IBM
SV
C K
M f
or
PA
TRO
L V
ersi
on 1
.2.0
1
Parameters 133
ReadResponseTime 63, 156, 160, 163
ReceivedByteRate 59, 141, 145, 148
ReceivedFromHostsByteRate 145
ReceivedFromHostsWriteRate 148
ReceivedFromOtherClustByteRate 145, 148
ReceivedFromSameClustByteRate 145, 148
ReceivedFromStorageByteRate 145, 148
ReceivedOperationRate 141
ReceivedResponseTime 64, 141
Reset 101
ResponseTime 73
SentByteRate 59, 141, 145, 148
SentOperationRate 141
SentResponseTime 64, 141
SentToHostsByteRate 145, 148
SentToOtherClustByteRate 145, 148
SentToSameClustByteRate 145, 148
SentToStorageByteRate 145, 148
Status 141, 145, 148, 153, 156, 160, 163,166
StatusInformation 141, 145, 148, 153, 156,160, 163, 166
SubscribedCapacity 82, 153
SubscribedCapacityPercentage 153
Synchronized 166
TimeSinceLastActivity 163
TimeSinceLastSatisticsUpdate 137
WriteByteRate 70, 156, 160, 163
WriteOperationRate 156, 160, 163
WriteResponseTime 63, 156, 160, 163
ZeroBufferTimePercentage 148PATROL
Agent 43
Console 43
Event 121
Requirements 14PATROL Consoles
Pop-up 126PATROL Event
Specific 121
Standard 121
STD_41 121Pause
Monitoring 113Performance
MDisks 64
Nodes 64
Ports 64
Storage System 64Platforms
IBM SVC 12
Supported 12Polling Interval
Customize 107Pools
Activitiy Report 94Pop-up 126
Port
Activity Report 91Port Status
Manage 101, 102
Parameters 101, 102Prerequisites
JAVA 14
Nodes Identification 14
PATROL 14
SSH key 14
User Authentication 14Processor
High utilization 59Product at a glance 11
PSL Command
Execute 125PuTTY
Generate 14
SSH Key 14
- R -Reinitialize
KM 114Release Notes 8
Remove
Device Monitoring 113Reporting 64
Disk space consumption 82
LUNs Mapping Table 89, 97
LUNs Preferred Node 72, 98
LUNs Preferred Node Table 89
MDisks Activitiy Report 89
MDisks Activity Report 93
Nodes Activity Report 89
Pools Activity Report 94
Ports Activity Report 89, 91
Storage Systems Activity Report 89, 92
Volume Activity Report 96

180
IBM
SV
C K
M f
or
PA
TRO
L V
ersi
on 1
.2.0
1
Reporting 64
Volumes Activity Report 89Reports
Scheduling 100Reset
Alerts 101, 102
Automatic 101, 102Restore
All 114
Monitoring 114
Specific device 114Resume
Monitoring 113
- S -Scheduling
Reports 100Search
IQN 86
WWN 86Set
Automatic Parameter Reset 101
Automatic Parameters Reset 102SNMP Trap
Basic 128
Custom 129
Send 128, 129SSH Key
Generate 14
PuTTY 14Storage pool 59
Storage System
Acitivity Report 92
Back-end 73
Slow 73Supported
IBM SVC 12
Platforms 12
- T -Tasks
Administrative 101Thin Provisioning 59
Threshold Mechanism Selection
Automatic 117
Event Management 117
Tuning 117Thresholds 116
Mechanism Selection 117
Remove 114
Reset 114Trigger
KM Discovery 116
PATROL Event 121
- U -User Authentication
Requirements 14User Guide 46
- V -Verify
Processor utilization 59
Transfer rate 59View
MDisks Activity 88Volume
Activity Report 96Volume Mirroring
Monitoring 75
Synchronization 75
- W -What's New 8
WWN
Search 86

About Sentry Software™Sentry Software, a strategic Technology Alliance Partner of BMC Software, providescomprehensive multi-platform monitoring solutions that enable management of thehardware and software aspects of all servers and SANs and covering up to 100 % ofcustom applications within the BMC TrueSight environment. Sentry Software alsodevelops adapters for BMC Atrium Orchestrator that enables IT administrators toautomate the execution of common requests and tasks that occur in the daily course ofIT operations. Combined with BMC’s servers and network automation tools, theadapters allow IT administrators to implement provisioning and decommissioningworkflows that cover all layers of their IT infrastructure. Finally, Sentry Software designsconnectors that bring storage capacity metrics into BMC TrueSight Capacity Optimizationto ensure IT administrators that their storage infrastructure is properly sized for theircurrent and future needs.
Like us on Facebook:facebook.com/sentrysoftware
Follow us on Twitter:
twitter.com/sentrysoftware
LEARN MORE
To learn more about our solutions, please visit :www.sentrysoftware.com/solutions
© BMC Software, Inc. All rights reserved.
ABOUT MARKETZONE DIRECT PRODUCTS
The BMC MarketZone Directprogram sells and supportsthird-party products thatcomplement and/or augment BMCsolutions. MarketZone Directproducts are available under BMClicense and support terms.
About BMC Software™BMC Software helps leading companies around the world put technology at the forefrontof business transformation, improving the delivery and consumption of digital services.From mainframe to cloud to mobile, BMC delivers innovative IT management solutionsthat have enabled more than 20,000 customers to leverage complex technology intoextraordinary business performance—increasing their agility and exceeding anythingthey previously thought possible. For more information about BMC Software, visit
www.bmc.com.
Bus ines s thrives when IT runs s marter,fas ter and s tronger. That’s why the mos tdemanding IT organizations in the worldrely on BMC Software acros s dis tributed,mainframe, virtual and cloudenvironments . Recognized as the leader inBus ines s Service Management, BMC offersa comprehens ive approach and unifiedplatform that helps IT organizations cutcos t , reduce ris k and drive bus ines sprofit . For the four fis cal quarters endedSeptember 30,2011, BMC revenue wasapproximately $2.2 billion.
BUSINESS RUNS ON I.T .
I.T . RUNS ON BMC SOFT WARE